Article

High-Resolution Mapping and Biomass Estimation of Suaeda salsa in Coastal Wetlands Using UAV Visible-Light Imagery and Hue Angle Inversion

1
National Marine Environmental Monitoring Center, Dalian 116023, China
2
College of Environmental Science and Engineering, Dalian Maritime University, Dalian 116026, China
*
Author to whom correspondence should be addressed.
Appl. Sci. 2025, 15(13), 7423; https://doi.org/10.3390/app15137423
Submission received: 15 May 2025 / Revised: 27 June 2025 / Accepted: 30 June 2025 / Published: 2 July 2025
(This article belongs to the Section Environmental Sciences)

Abstract

Unmanned Aerial Vehicles (UAVs) have become powerful tools for high-resolution, quantitative remote sensing in ecological and environmental studies. In this study, we present a novel approach to accurately mapping and estimating the biomass of Suaeda salsa using UAV-based visible-light imagery combined with hue angle inversion modeling. By integrating diffuse reflectance standard plates into the flight protocol, we converted RGB pixel values into reflectance and derived hue angle metrics with enhanced radiometric accuracy. A hue angle cutoff threshold of 249.01° was identified as the optimal cutoff to distinguish Suaeda salsa from the surrounding land cover types with high confidence. To estimate biomass, we developed an exponential inversion model based on hue angle data calibrated through extensive field measurements. The resulting model—Biomass = 3.57639 × 10⁻¹⁵ × e0.12201×α—achieved exceptional performance (R2 = 0.99696; MAPE = 3.616%; RMSE = 0.02183 kg/m2), indicating strong predictive accuracy and robustness. This study highlights a cost-effective, non-destructive, and scalable method for the real-time monitoring of coastal vegetation, offering a significant advancement in remote sensing applications for wetland ecosystem management.

1. Introduction

Suaeda salsa is a crucial coastal wetland species that plays a vital role in soil improvement [1], carbon sequestration [2], and ecosystem maintenance [3]. It is widely distributed in coastal and inland saline areas, including northern China, Central Asia, and Europe [4].
Coastal wetlands are vast and complex ecosystems, often difficult to access. Traditional monitoring methods, such as visual estimation, probability, and grid methods, are insufficient for comprehensive monitoring. Remote sensing technology, with its extensive coverage and continuous observation capabilities, offers a promising solution to address these challenges [5]. Mature Suaeda salsa exhibits a distinctive reddish-brown coloration in visible-light imagery, which aids in its visual identification. However, despite this visual cue, the precise extraction of its distribution from such imagery remains challenging. Beyond its visible appearance, Suaeda salsa, typical of salt-marsh vegetation, also exhibits a prominent red-edge phenomenon in its multispectral reflectance spectrum, which is crucial for detailed spectral analysis. Traditional vegetation indices, such as the NDVI, RVI, SVI, EVI, PVI, SAVI, MSAVI, and TSAVI [6,7,8,9,10,11,12], have been proposed to extract Suaeda salsa information from remote sensing data. However, accurate cutoff thresholding is crucial, as an overlap in index values between Suaeda salsa and other vegetation, particularly green vegetation, can lead to misclassification [13]. Recently, object-based classification methods have also been applied to identify Suaeda salsa and other ground features [14], but their practical applications remain relatively limited. Additionally, the low spatial resolution of satellite imagery limits the accurate assessment of areas with low-cover, edge, and mixed-pixel areas.
To enable a quantitative representation of color, the International Commission on Illumination (Commission Internationale de l’Éclairage, CIE) developed the CIE 1931 XYZ standard color system [15], which has become the foundation of modern colorimetry. This system is widely applied in diverse fields such as color measurement, color management, image processing, and printing. However, its application in ecological and environmental monitoring began relatively late. Early studies primarily relied on satellite multispectral sensors or field-measured spectral data to derive the X, Y, and Z tristimulus values of the CIE system through various processing methods. These values were then used to calculate chromaticity parameters and assess water quality status [16,17,18]. In recent years, CIE-based color parameters—such as hue angle, chromaticity coordinates, and water color indices—have been increasingly employed in remote sensing analyses of aquatic ecosystems. These include investigations of lake eutrophication [19,20], water color constituents (e.g., chlorophyll-a, suspended matter, and colored dissolved organic matter) [21,22], nearshore algal blooms [23,24,25], and green tides [26,27]. Notably, Suaeda salsa exhibits a distinct reddish-brown hue during its mature stage, which contrasts sharply with the surrounding land cover [4]. This pronounced color difference makes hue angle-derived metrics from remote sensing imagery particularly effective for its identification. Despite the clear potential and broad applicability of this approach, to our knowledge, no prior studies have reported the use of hue angle to detect and quantify Suaeda salsa.
Recent advancements in UAV remote sensing technology have enabled high-resolution (centimeter-level) imagery, making it a powerful tool for ecological and environmental monitoring [8,28,29,30,31]. Previous studies [32] have placed high performance requirements on UAV imaging payloads, typically necessitating the use of multispectral or hyperspectral sensors for aerial photography and subsequent information extraction. This has partially limited the broader application and scalability of UAV-based remote sensing techniques for Suaeda salsa. Moreover, most extraction methods have relied primarily on vegetation indices, which still exhibit certain limitations in accurately distinguishing Suaeda salsa from other vegetation types. This study aims to leverage UAV-based visible-light imagery and hue angle analysis to (1) accurately extract Suaeda salsa from complex backgrounds, which include various land cover types such as reeds and bare land in the target area, and (2) develop a robust remote sensing inversion model to estimate Suaeda salsa biomass.

2. Materials and Methods

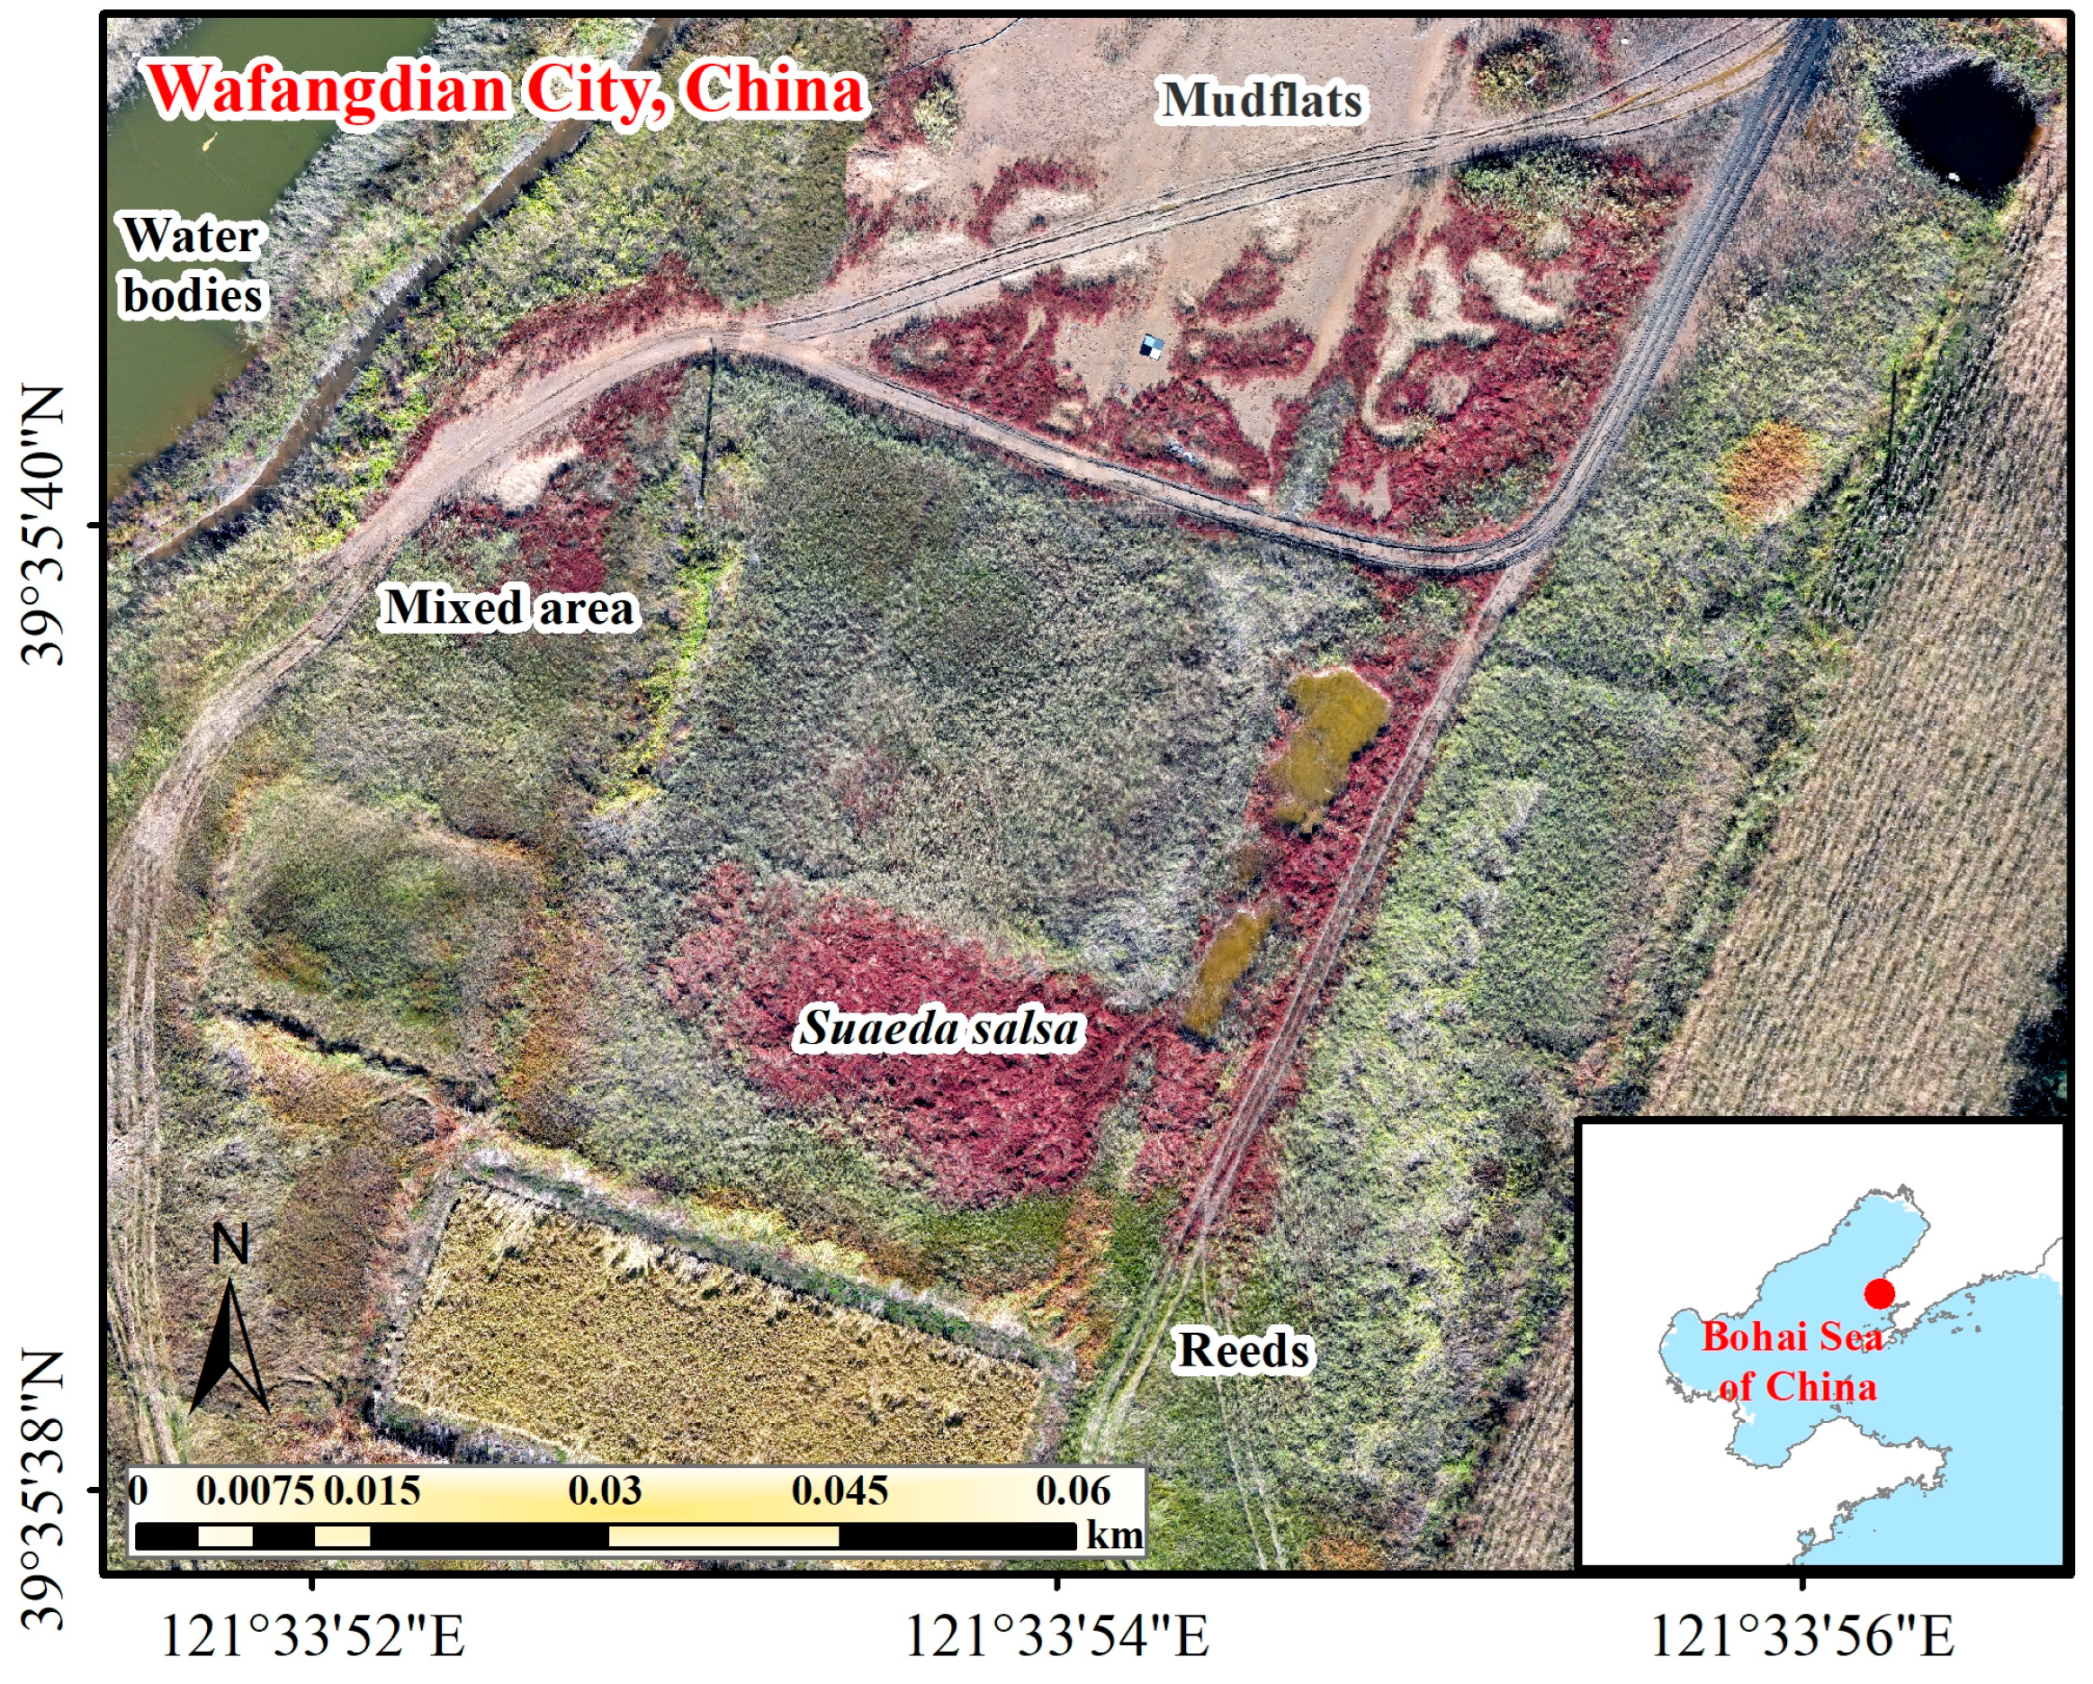
2.1. The Experimental Area

A coastal wetland in Wafangdian City, northern China, was selected as the experimental area (Figure 1). This approximately 12,400 m2 site was characterized by the presence of Suaeda salsa, reeds, mudflats, and water bodies, as well as a mixed area of Suaeda salsa and reeds.

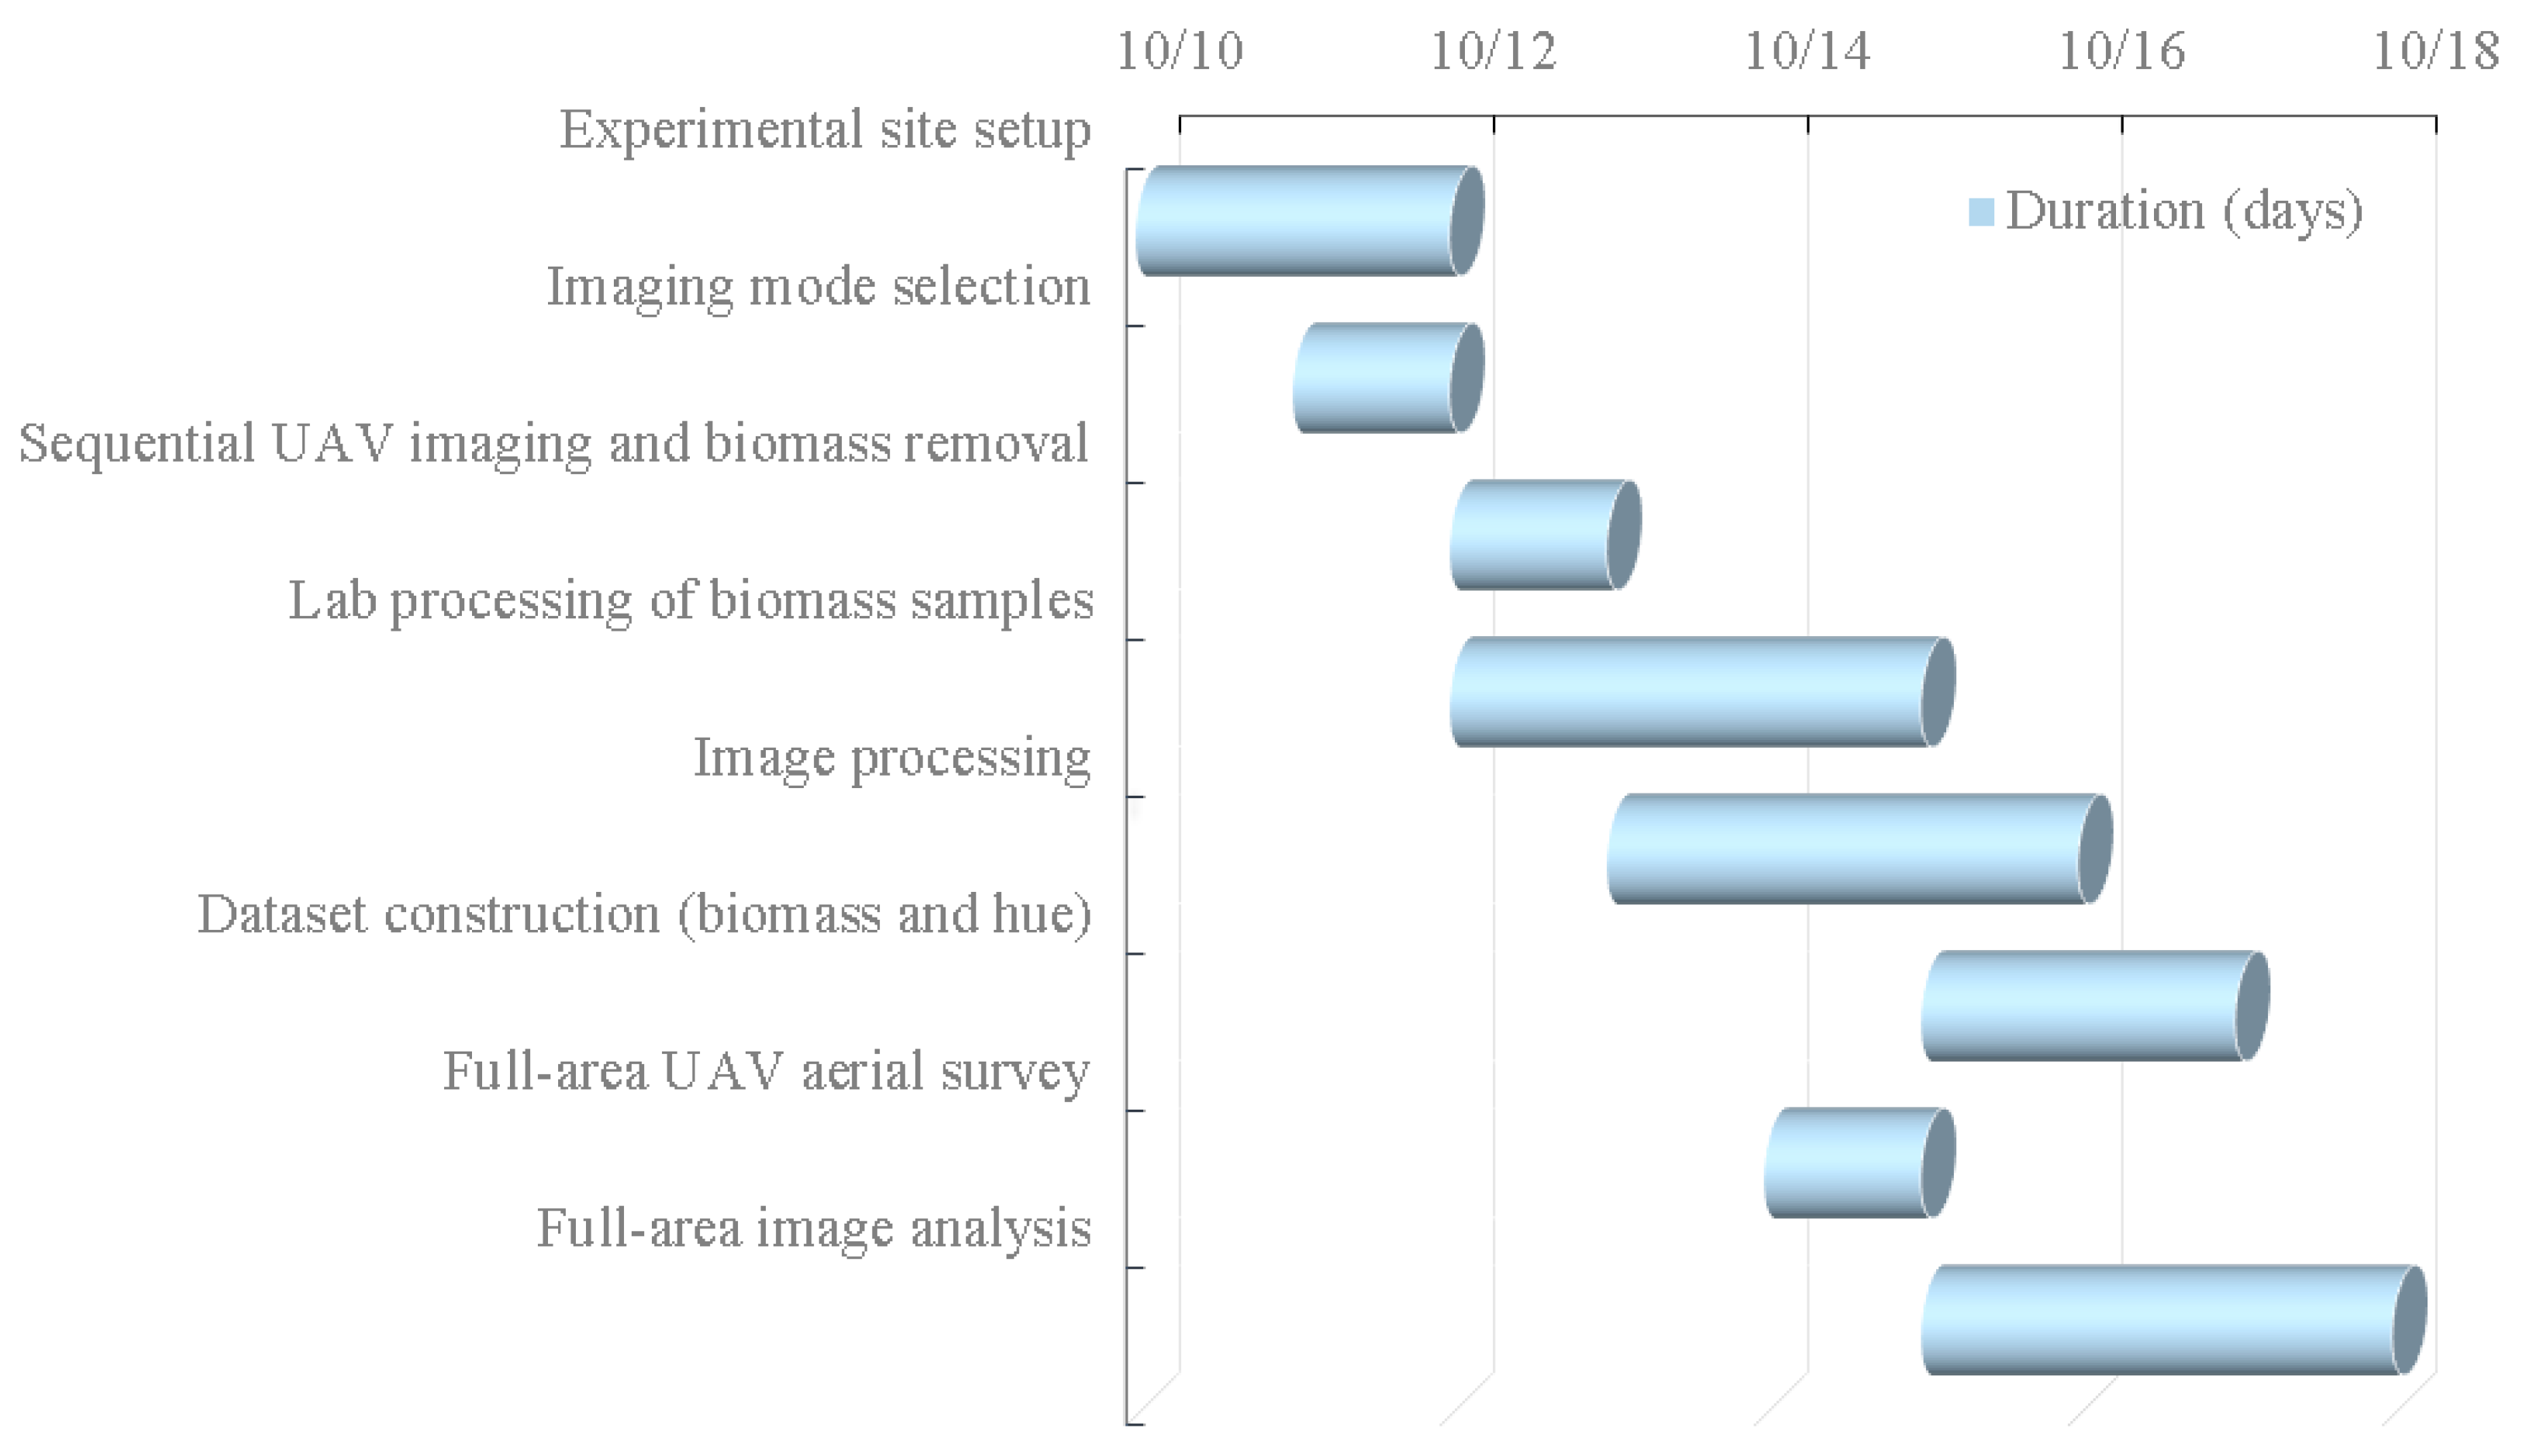
2.2. Design of Experiments

Figure 2 outlines the experimental procedure. A DJI (Da-Jiang Innovations, Shenzhen, China) Mavic 3M multispectral UAV, equipped with a visible-light camera and a multispectral sensor (capturing green, red, red-edge, and near-infrared bands), was employed for data acquisition. Four diffuse reflectance standard plates (DRSPs) with known reflectance values (1.2%, 5%, 10%, and 25%) were used for radiometric calibration.
On 12 October 2024, a synchronous measurement experiment was conducted to acquire UAV imagery and Suaeda salsa biomass data using square quadrats (0.6 m × 0.6 m). The experimental procedure comprised the following steps:
(a)
Experimental Site Setup (Figure 3a): Prior to measurements, the area with the highest density of Suaeda salsa was identified and designated as the initial quadrat, representing the maximum biomass. The quadrat was then secured, and DRSPs were positioned in an adjacent open area for calibration purposes.
(b)
UAV Camera Parameter Configuration and Initial Imaging: To ensure consistent illumination throughout data collection, the visible-light camera’s exposure settings—including aperture, shutter speed, and ISO—were fixed before flight. A single-frame shooting mode was employed to capture high-resolution imagery of the Suaeda salsa quadrat.
(c)
Sequential UAV Imaging and Biomass Removal (Figure 3b): The UAV ascended to a fixed altitude of approximately 25 m to capture an initial image of the quadrat at its maximum Suaeda salsa biomass. Subsequently, portions of Suaeda salsa within the quadrat were evenly removed to incrementally reduce biomass. After each removal, another UAV image was captured, and the removed plant material was sealed in labeled bags for subsequent biomass analysis. This iterative process of incremental Suaeda salsa removal, UAV image acquisition, and sample storage continued until the quadrat was completely cleared.
(d)
Laboratory Processing of Biomass Samples: Upon the completion of UAV imaging, all plant samples were promptly transported to the laboratory. Roots were thoroughly rinsed with clean water to remove soil residues. Each sample was then wrapped in aluminum foil and oven-dried to a constant weight, and its dry biomass was meticulously recorded according to the sample labels.
(e)
Image Processing: For each UAV image, the quadrat-corresponding area was accurately extracted. The hue angle was subsequently calculated for this region, and the average hue angle was determined for further analysis.
(f)
Model Dataset Construction: Based on the sequential biomass removal, the Suaeda salsa biomass within the quadrat (expressed in kg/m2) was calculated for each UAV capture. This yielded a robust modeling dataset linking varying biomass levels with their corresponding mean hue angles.
Following the quadrat-based Suaeda salsa biomass experiment, a comprehensive UAV aerial survey of the entire study area was conducted on October 14, 2024. Similarly to the previous setup, DRSPs were deployed, and the camera’s exposure settings were fixed to ensure consistent lighting conditions. The acquired UAV imagery served two primary purposes: (1) to determine the optimal hue angle threshold for Suaeda salsa identification and (2) to extract Suaeda salsa biomass information across the entire study area.

2.3. Data Preprocessing

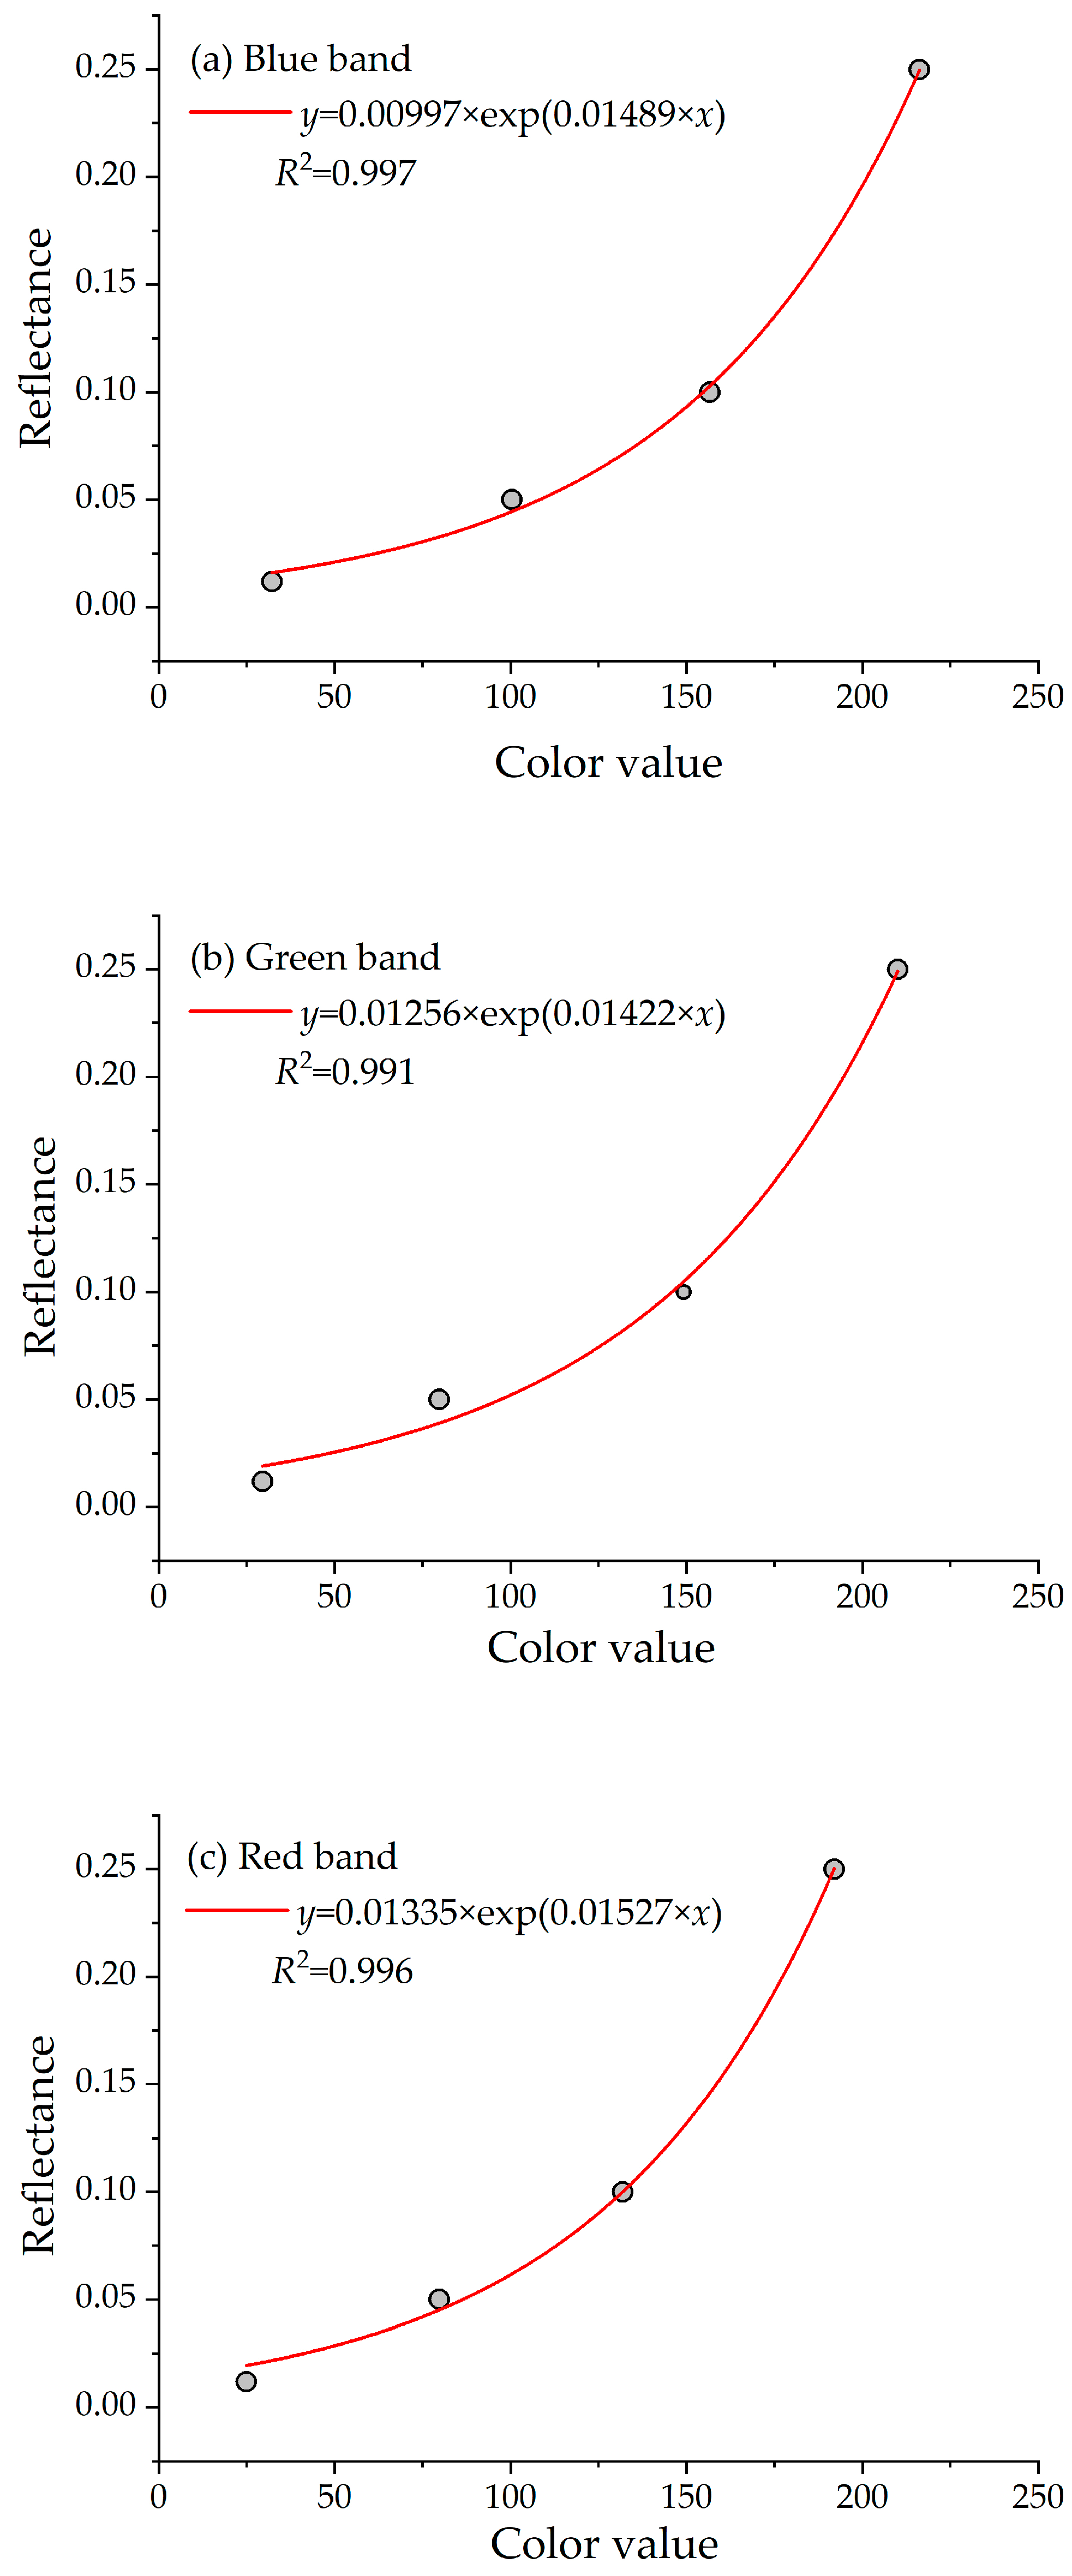
2.3.1. Reflectance Conversion Method

The color values of four DRSPs were extracted from the UAV visible-light imagery for the red, green, and blue bands. These values were plotted against their known reflectance values, which were determined in the laboratory, and fitted to a suitable model. This model, which can vary depending on lighting conditions, is used to convert pixel color values to reflectance values. It is important to note that this conversion process must be performed individually for each image.

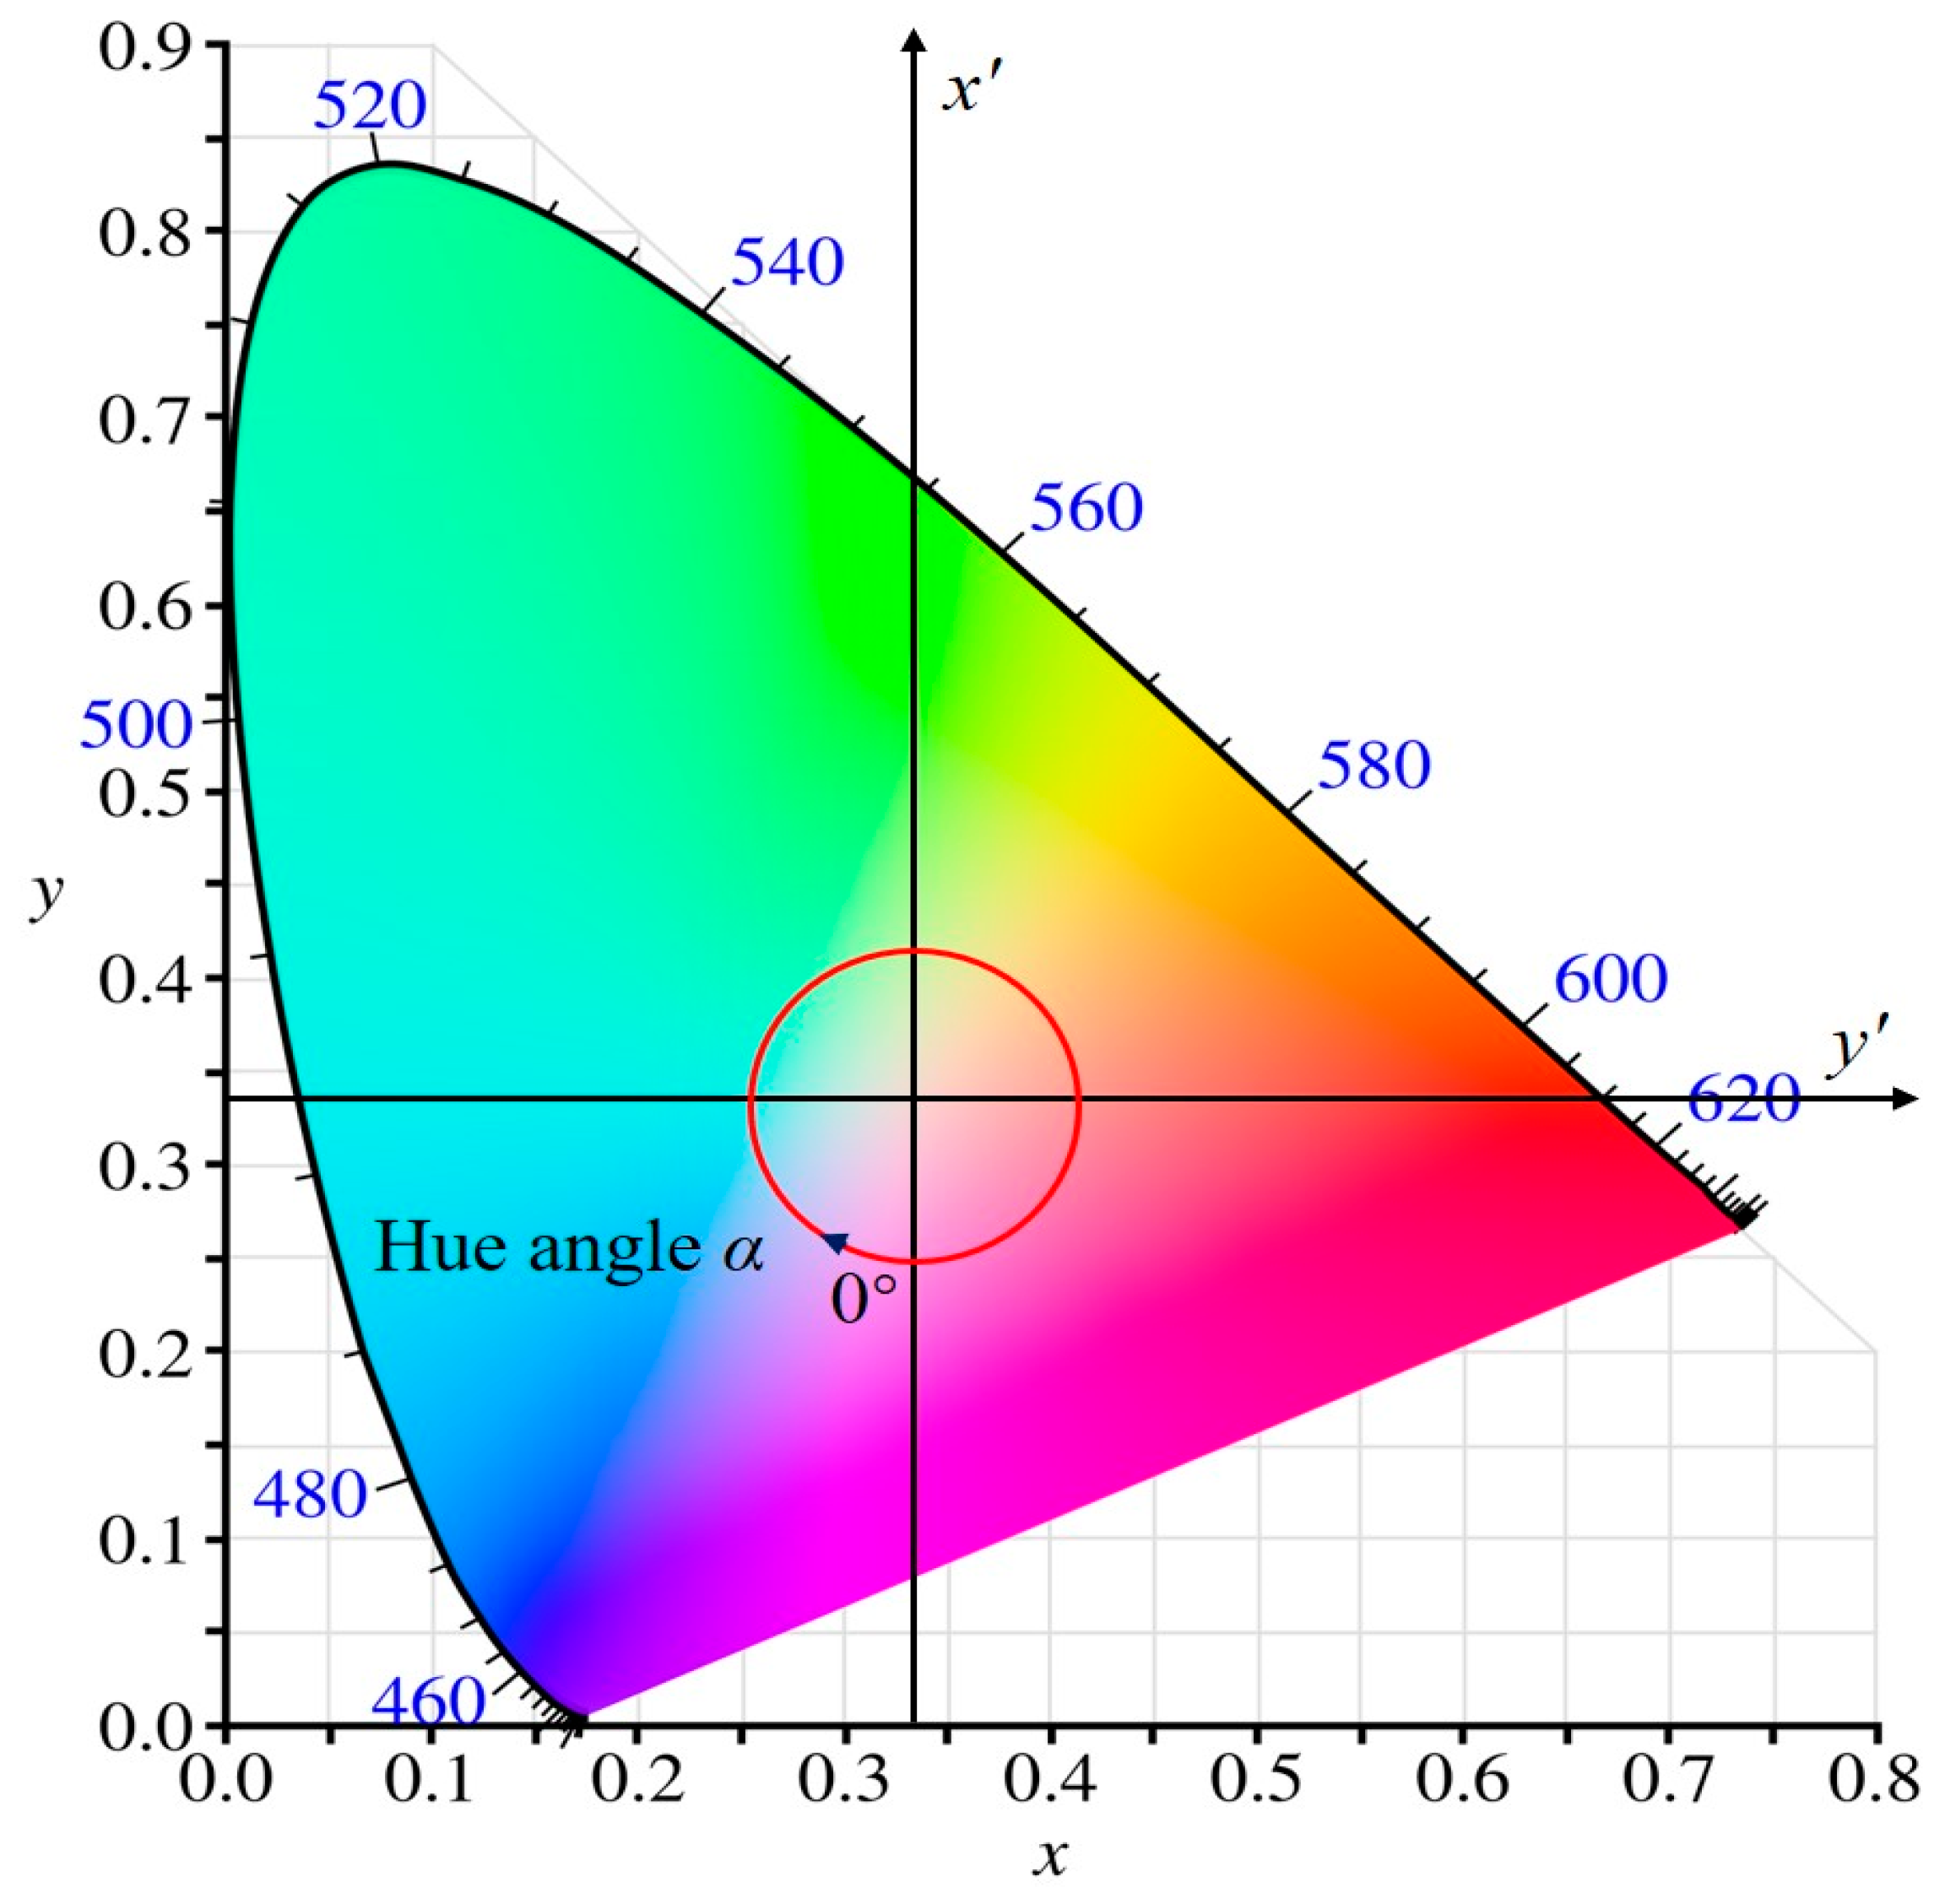
2.3.2. Methods for Calculating Hue Angle

The CIE 1931 XYZ color system, developed by the International Commission on Illumination (CIE), quantifies color through three spectral tristimulus values: X, Y, and Z. However, these values are not readily interpretable or visually intuitive. To overcome this limitation, the CIE introduced the CIE 1931 xy chromaticity diagram (Figure 4)—a two-dimensional representation that employs chromaticity coordinates, hue angle, and other derived parameters to visually characterize color.
Firstly, the UAV imagery for RGB bands was transformed to the Commission Internationale de l’Eclairage (CIE) tristimulus values X, Y, and Z as follows [19,33]:
X = 1.1302 R B l u e + 1.7517 R G r e e n + 2.7689 R ( R e d )
Y = 0.0601 R B l u e + 4.5907 R G r e e n + 1.0000 R ( R e d )
Z = 5.5934 R B l u e + 0.0565 R G r e e n + 0.0000 R ( R e d )
where R(Blue), R(Green), and R(Red) are the reflectance of the blue, green, and red bands, respectively.
And secondly, the normalized chromaticity coordinates x and y were calculated from CIE tristimulus values X, Y, and Z as follows:
x = X / X + Y + Z
y = Y / X + Y + Z
Finally, the hue angle α can be found from the chromaticity coordinates (x, y) by using the bivariate arctangent function (arctan2) and the following equation:
α = arctan 2 ( x     1 / 3 , y     1 / 3 ) · 180 π + 180

2.4. Evaluation Method

To evaluate the fitted model, three key performance metrics were considered: the coefficient of determination (R2), the mean absolute percentage error (MAPE), and the root mean square error (RMSE).
R 2 = i = 1 n Biomass estimated , i Biomass measured ¯ 2 i = 1 n Biomass measured , i Biomass measured ¯ 2
MAPE = i = 1 n Biomass measured , i Biomass estimated , i Biomass measured , i n × 100 %
RMSE = i = 1 n Biomass measured , i - Biomass estimated , i 2 n
where Biomassmeasured,i indicates the i-th measured value; Biomass measured ¯ denotes the mean of the measured values; Biomassestimated,i is the i-th model-estimated value; n is the number of samples.

3. Results

3.1. Reflectance Conversion

The mean color values of the blue, green, and red bands were calculated for DRSPs with 1.2%, 5%, 10%, and 25% reflectance. Figure 5 shows a strong positive correlation between these mean color values and their corresponding standard reflectance values, with an R2 value exceeding 0.99 for an exponential fit.
However, the ratio of the mean color values corresponding to the four DRSPs deviated from the theoretical reflectance ratio of 1.2:5:10:25, indicating a non-linear relationship between color values and surface reflectance. This observation aligns with prior research findings [34]. This deviation is likely due to the camera’s sensitivity to light intensity, highlighting the inherent limitations of consumer-grade cameras compared to high-performance spectral measurement instruments. Nevertheless, this limitation can be partially addressed by calibrating the imagery using DRSPs with known and varying reflectance levels. These results emphasize the importance of employing DRSPs with a range of reflectance values to enable a more accurate conversion of pixel-level color values to reflectance, thereby improving the reliability of image-based quantitative analyses.

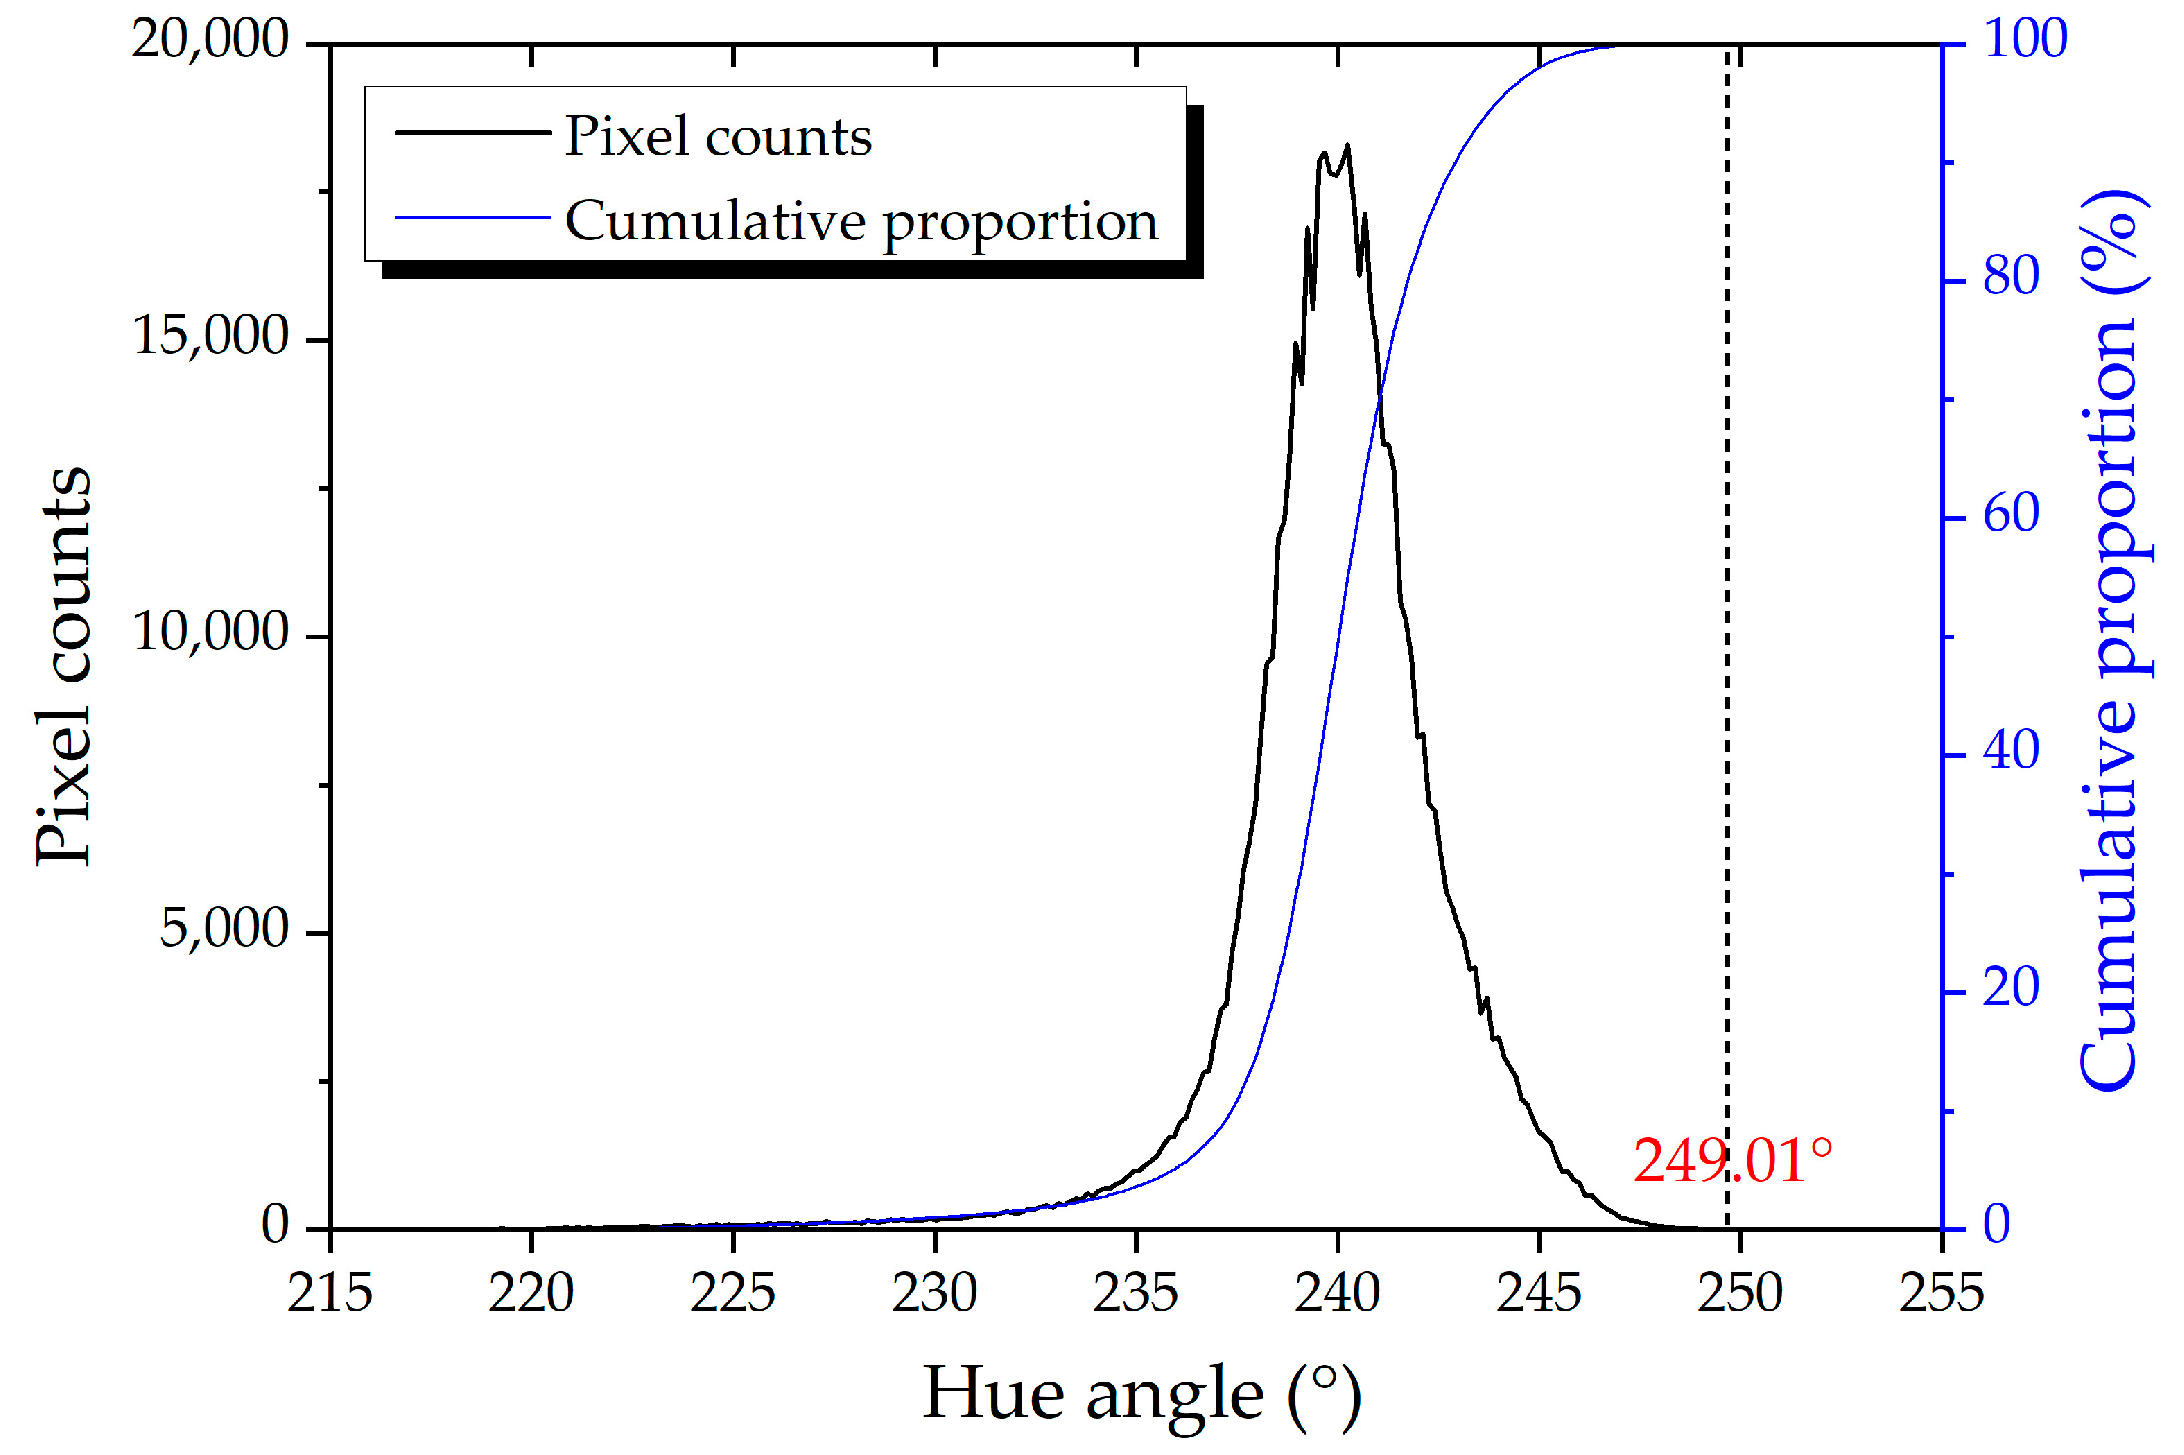
3.2. Hue Angle Cutoff Threshold

The hue angles of different land cover types, including Suaeda salsa, mudflats, water bodies, and green vegetation (e.g., reeds), exhibit significant differences. Suaeda salsa generally has the highest hue angle, followed by mudflats, with green vegetation and water bodies displaying lower values.
To extract Suaeda salsa pixels from UAV visible-light imagery, a hue angle cutoff threshold can be established. While Suaeda salsa typically has a higher hue angle than mudflats, low-coverage Suaeda salsa pixels may have similar values to mudflat pixels. This suggests that the lowest hue angle of low-coverage Suaeda salsa or the highest hue angle of pure mudflat pixels could serve as potential cutoff thresholds. However, accurately identifying low-coverage Suaeda salsa pixels may be challenging. Therefore, using the highest hue angle of pure mudflat pixels as a cutoff threshold may provide a more reliable approach to extracting Suaeda salsa pixel information.
To determine a suitable cutoff threshold, we randomly selected pure mudflat areas from the UAV visible imagery and analyzed the distribution of pixel hue angles (Figure 6). The cumulative proportion of pixels with a hue angle of 249.01 exceeded 99.99%. Consequently, 249.01 was adopted as the minimum cutoff threshold for Suaeda salsa pixel extraction. Pixels with a hue angle greater than this cutoff threshold were classified as Suaeda salsa.
A cutoff threshold value of 249.01 was applied to extract Suaeda salsa information from the UAV visible imagery. The resulting extraction accurately reflected the actual distribution of Suaeda salsa (Figure 7a). Notably, this method demonstrated exceptional performance in both low-density (Figure 7b) and mixed areas with reeds (Figure 7c), highlighting its robustness and versatility.

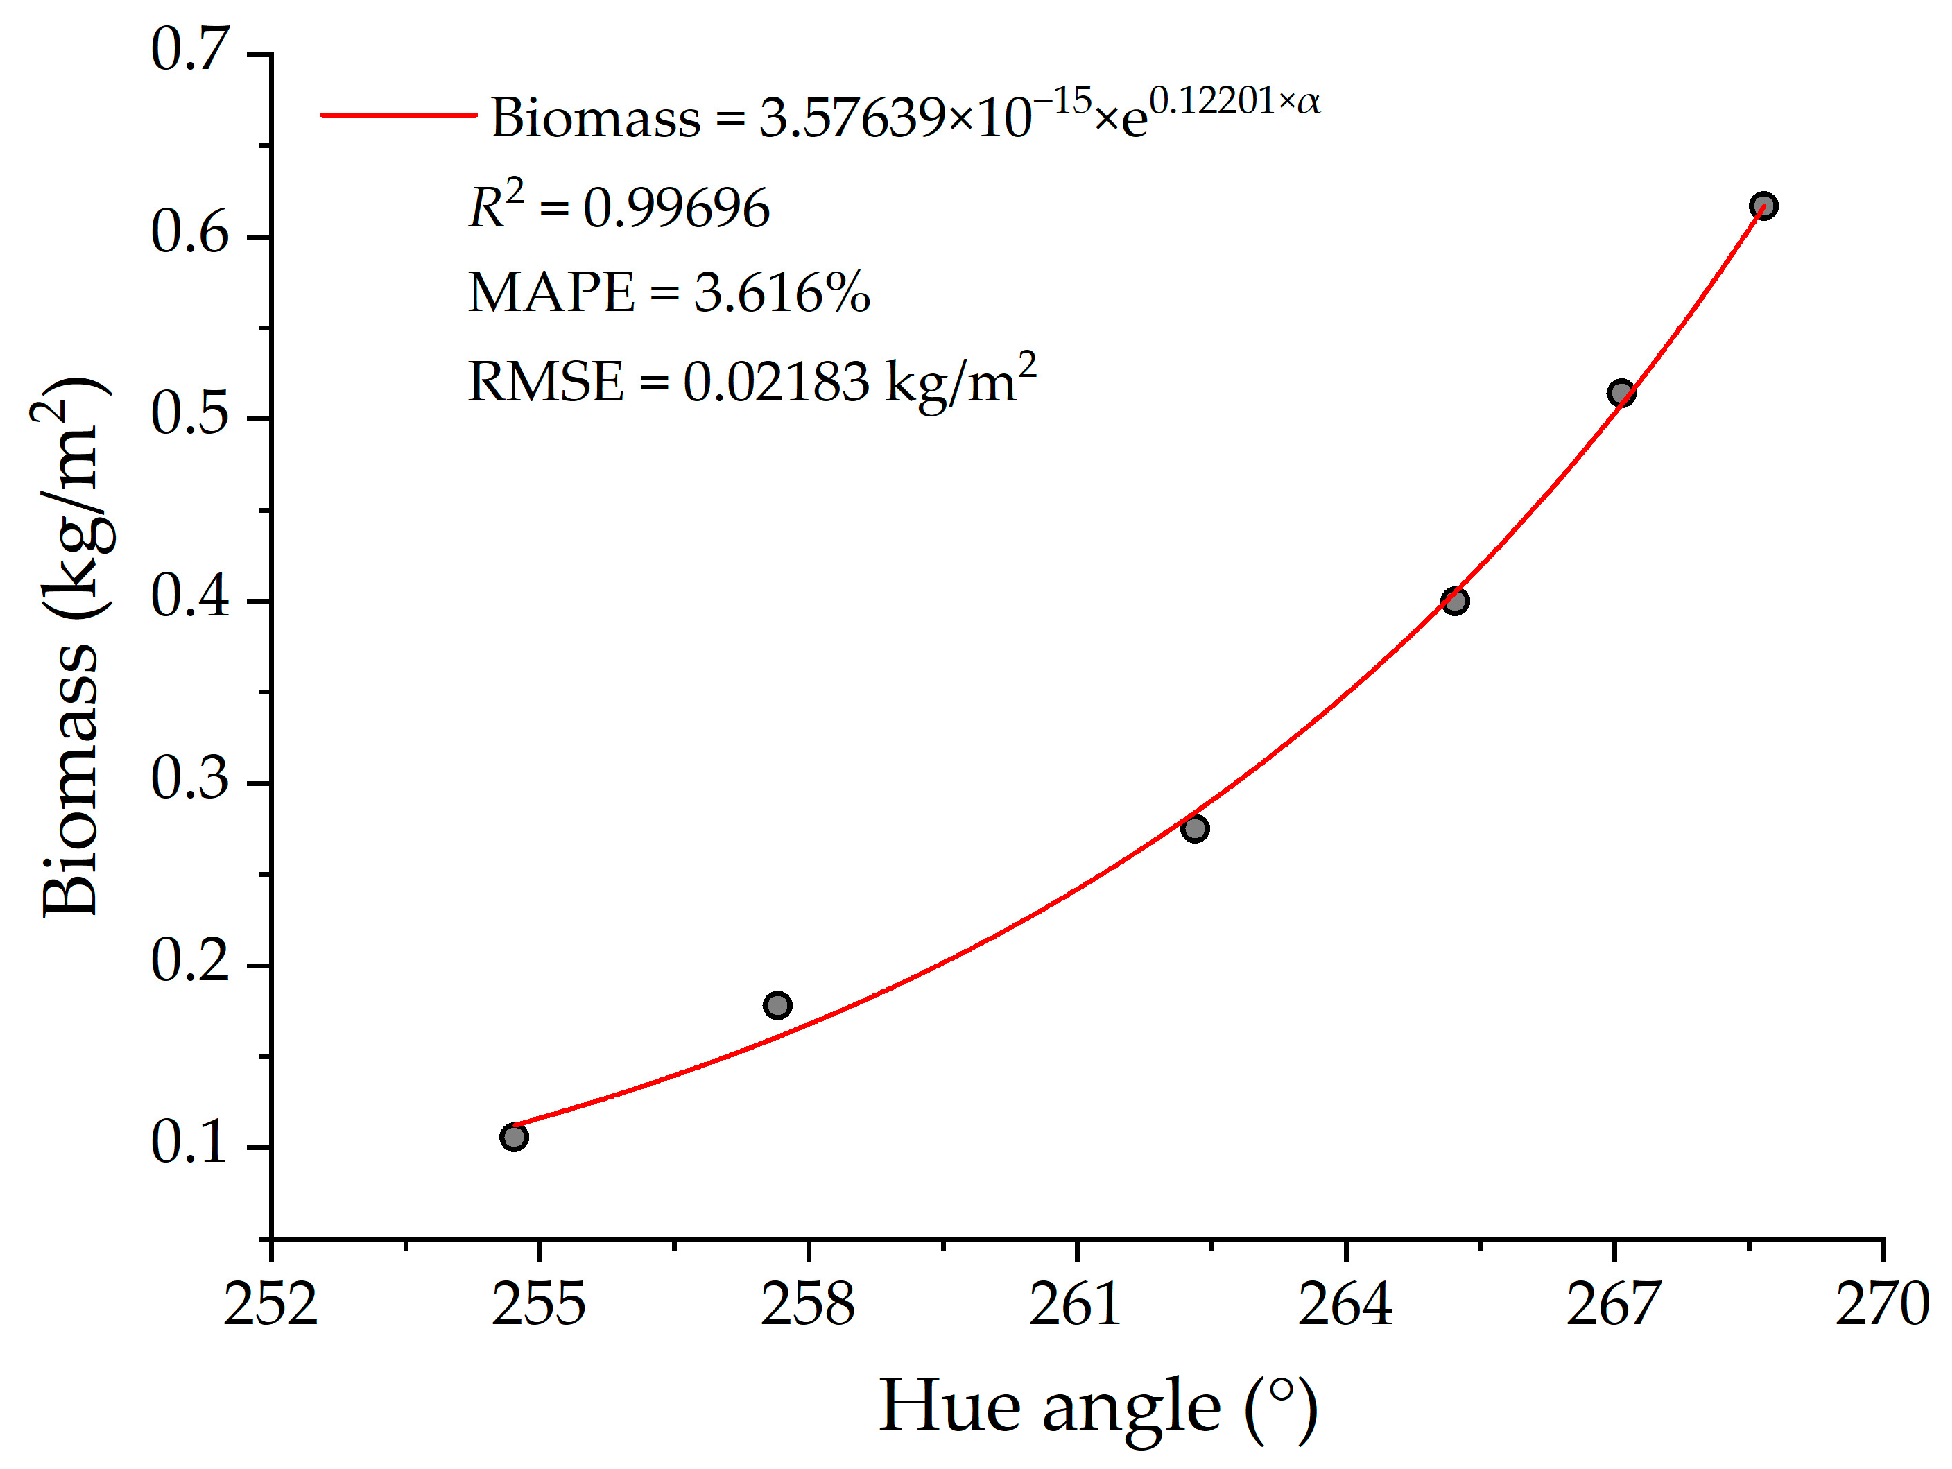
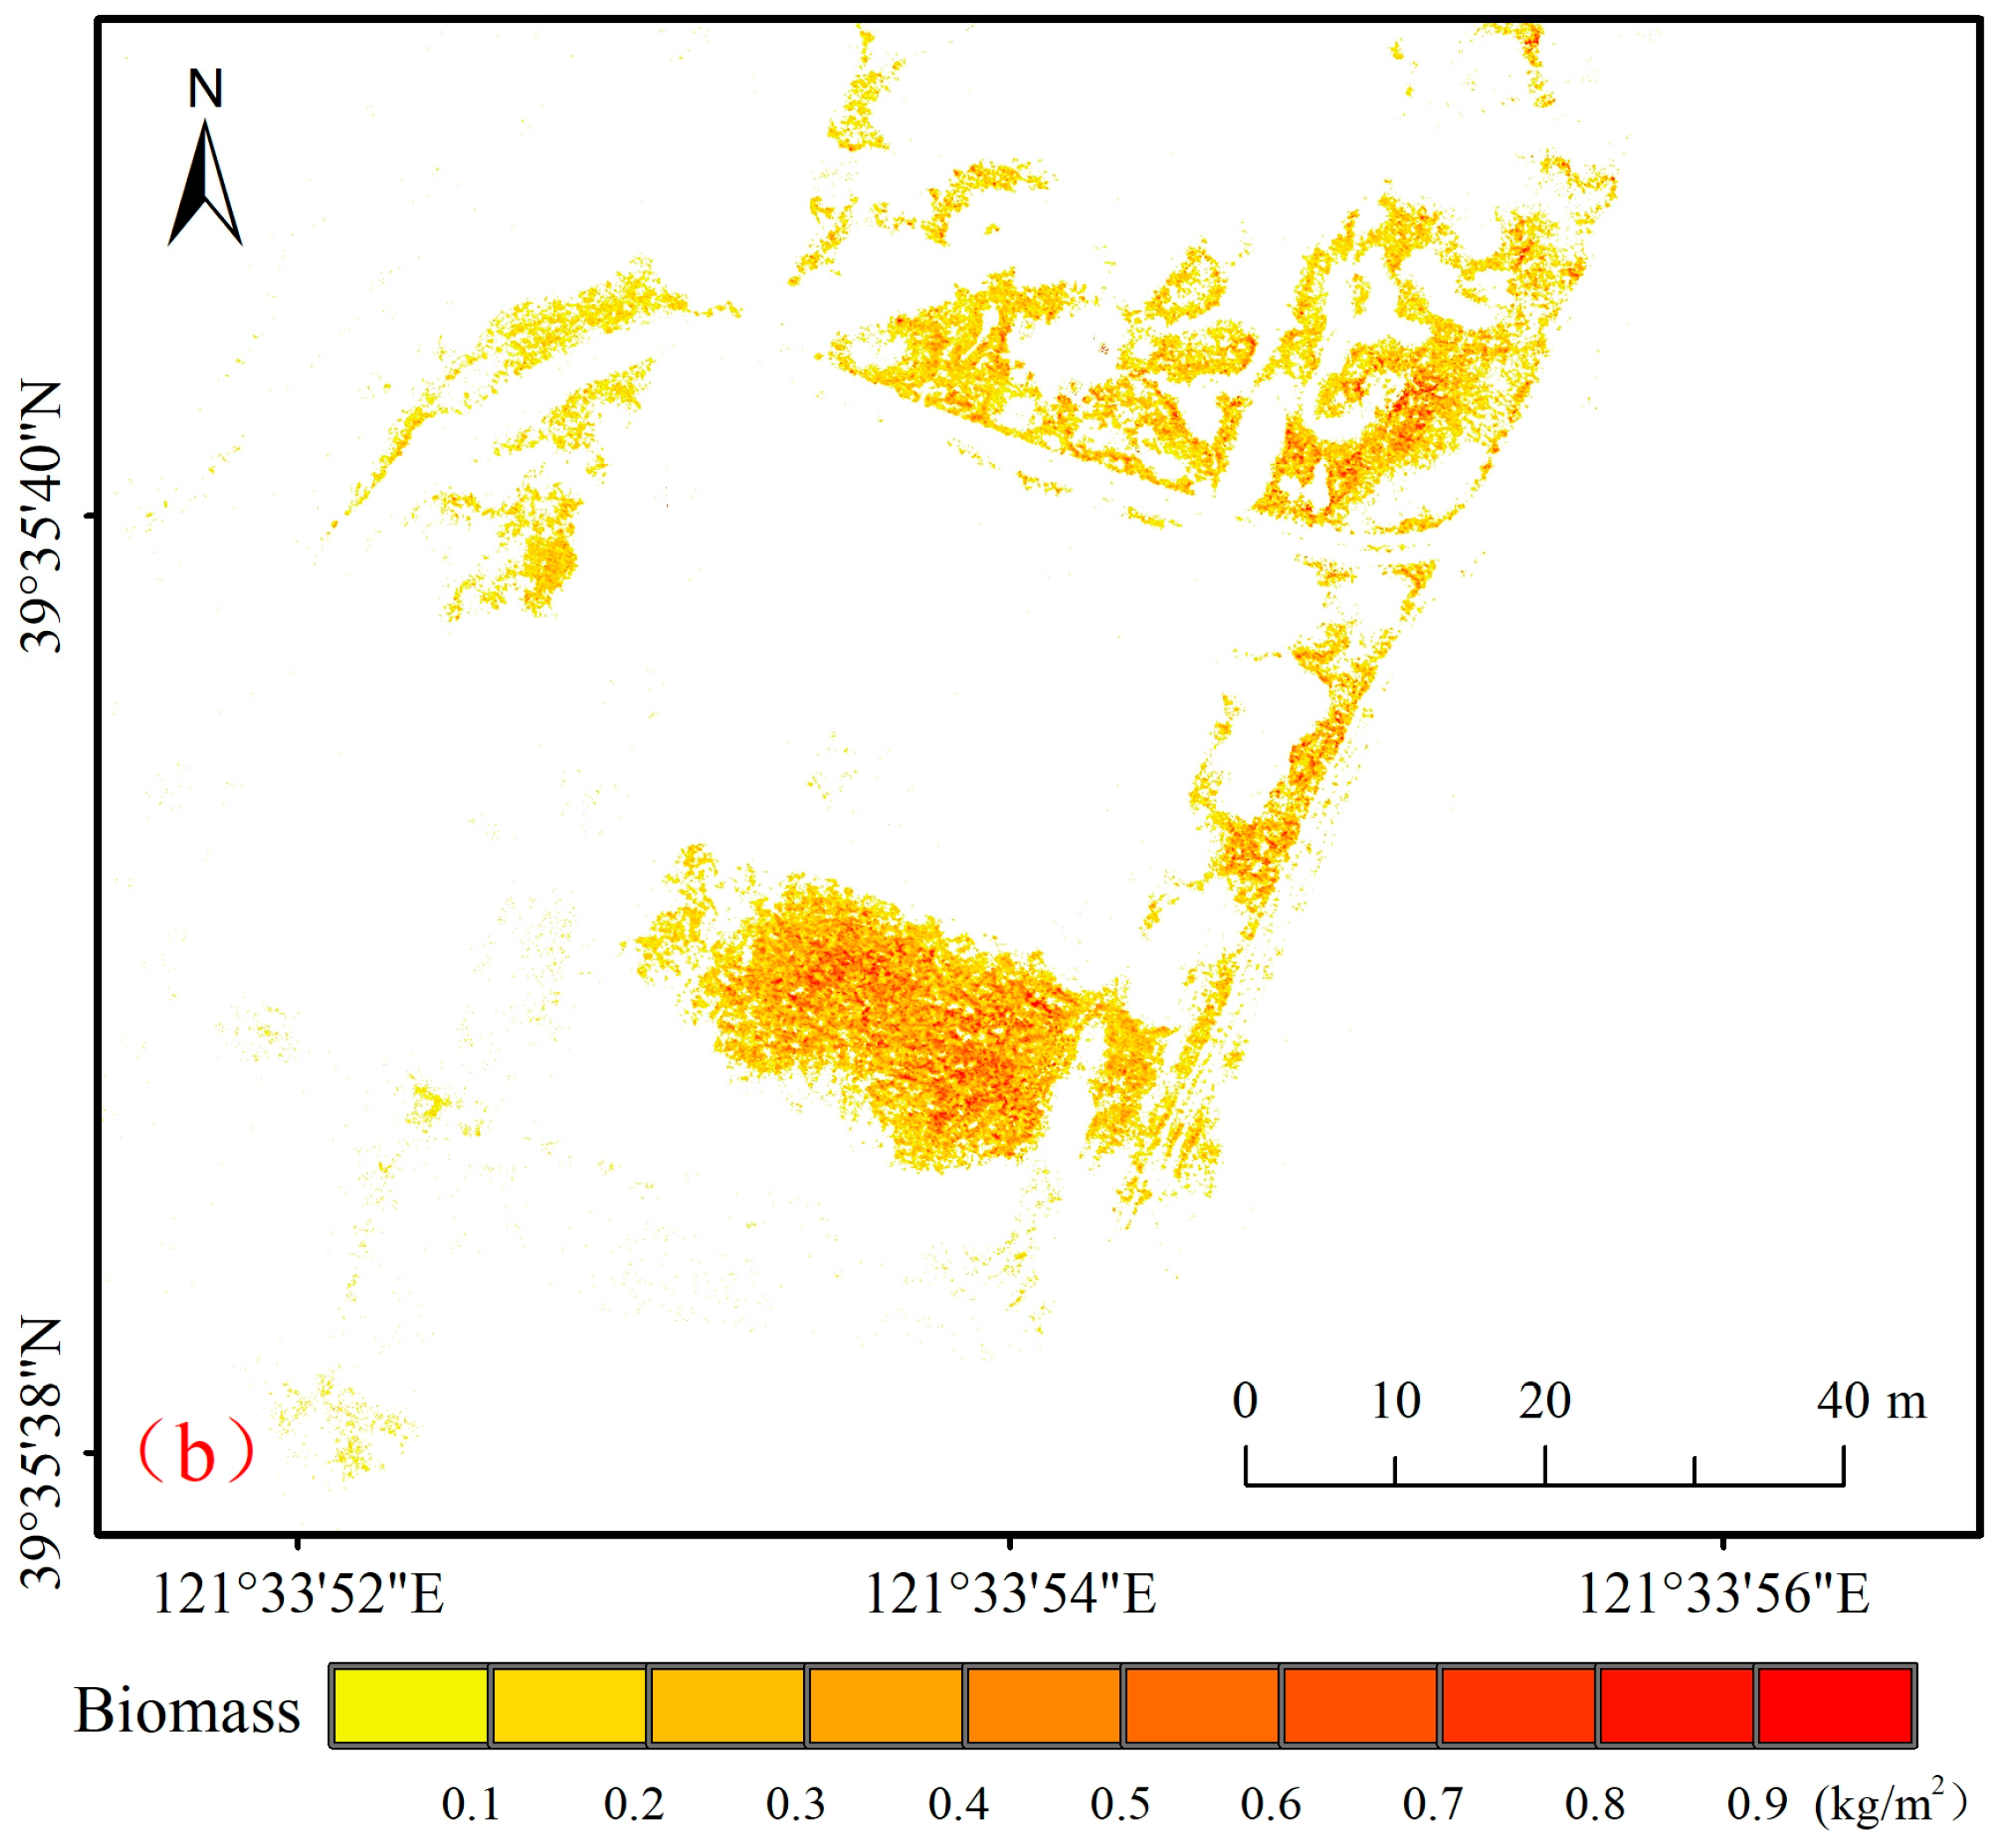
3.3. Inversion Model Construction

A strong positive correlation was observed between Suaeda salsa biomass and hue angle. To model this relationship, various functions (linear, quadratic polynomial, exponential, and power) were evaluated. The exponential and power functions demonstrated superior performance, with the latter being selected as the optimal remote sensing inversion model for Suaeda salsa biomass in the experimental area (Table 1, Figure 8).
Using the hue angle threshold for Suaeda salsa identification (α > 249.01), the above model was subsequently applied to estimate Suaeda salsa biomass across the experimental area (Figure 9). The resulting biomass maps accurately captured the spatial distribution of Suaeda salsa, effectively reflecting both sparse and dense stands, and showed strong agreement with field observations. Therefore, the proposed method demonstrates high accuracy in both identifying Suaeda salsa and estimating its biomass.

4. Discussion

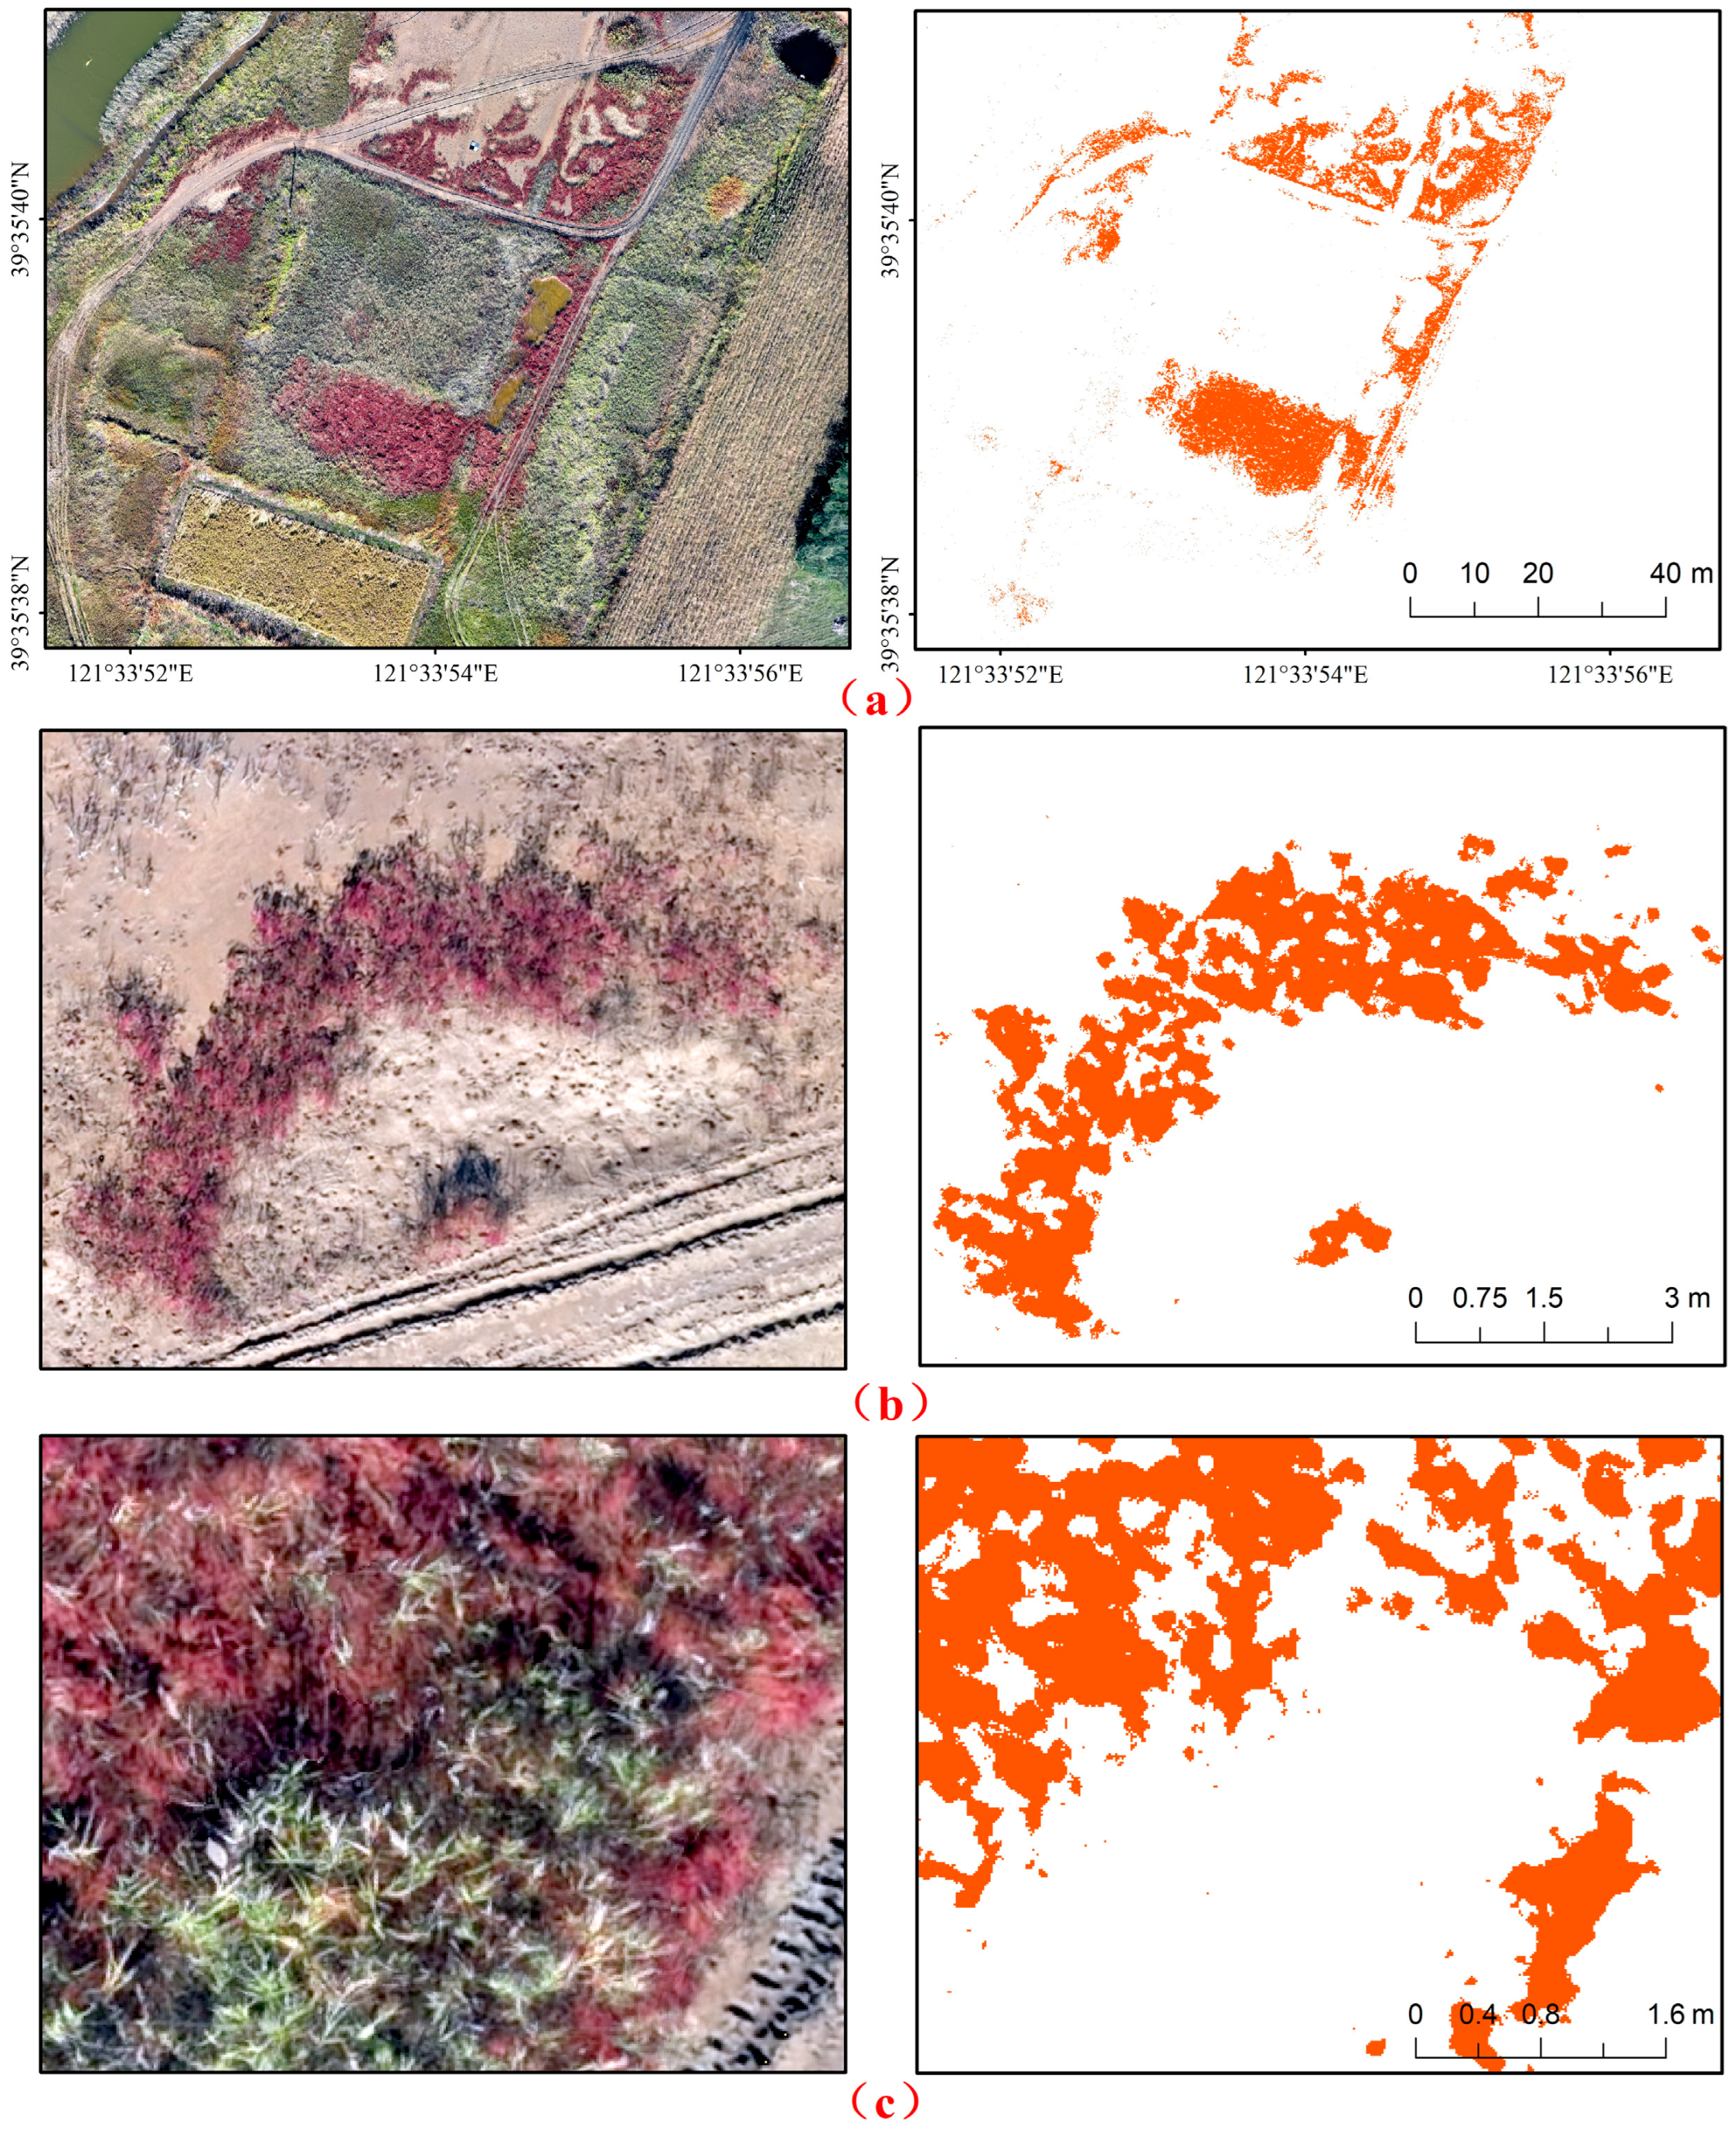
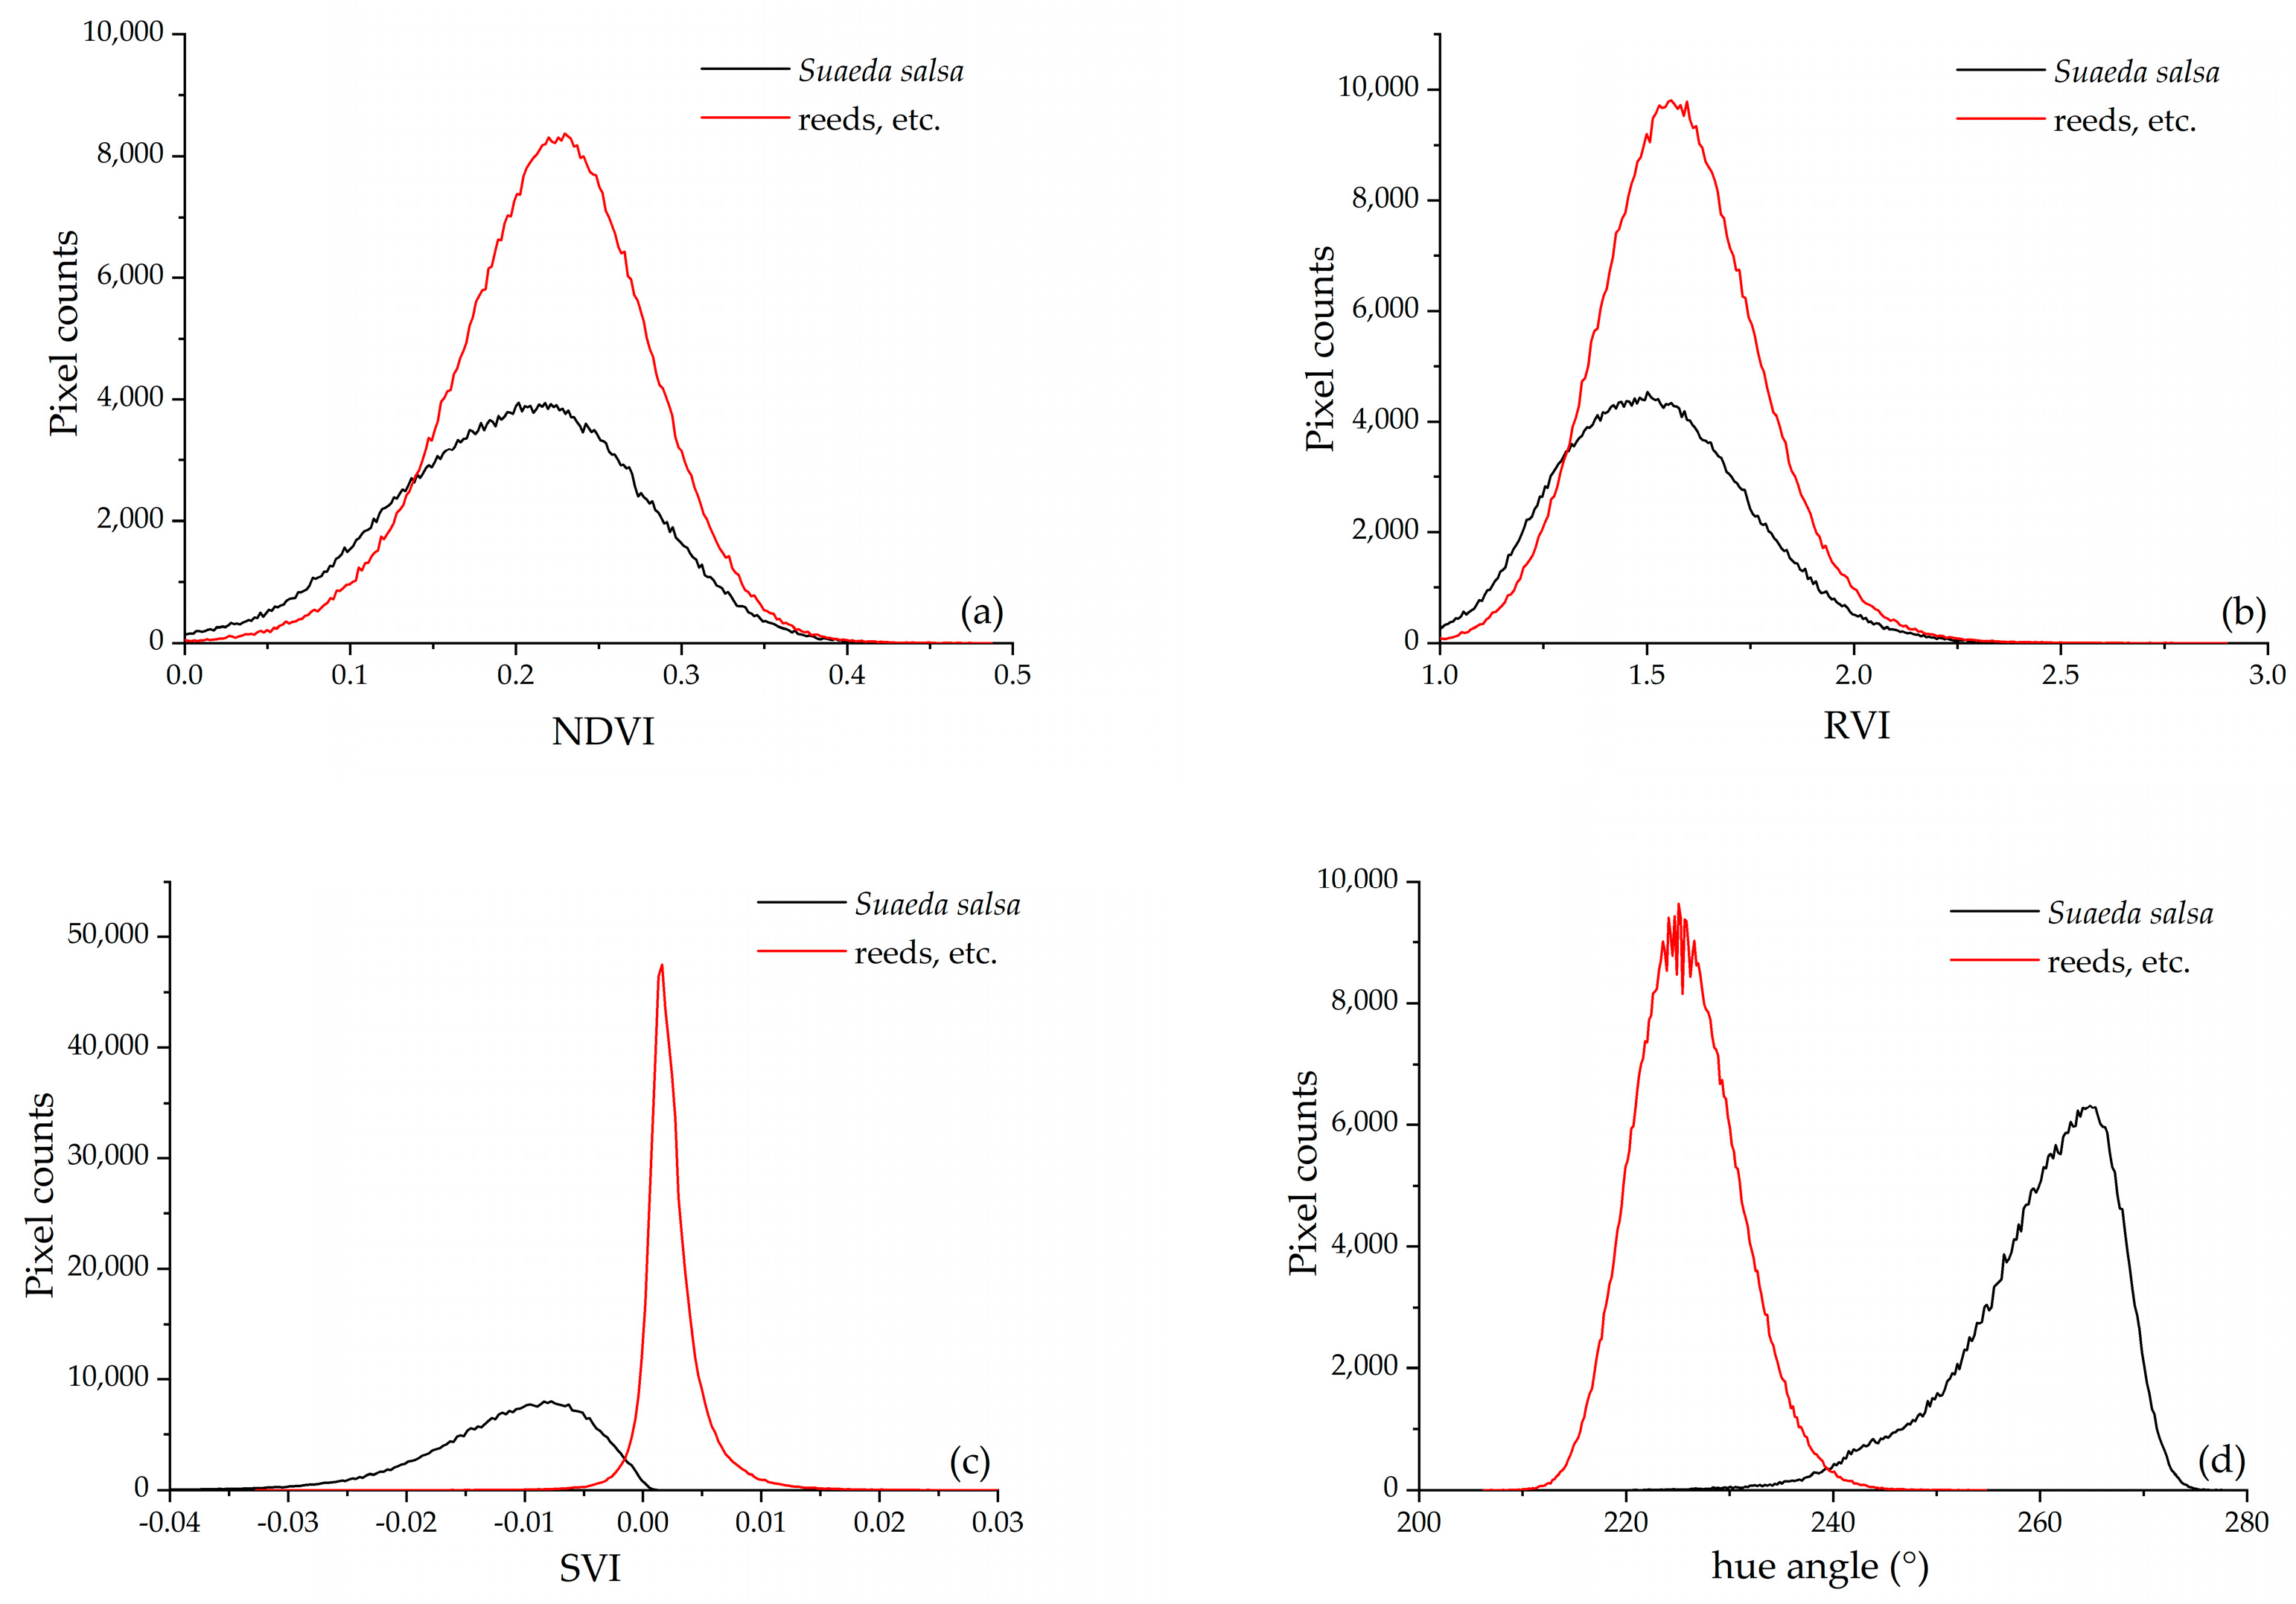
4.1. Applying Vegetation Indices to Extract Suaeda salsa from UAV Imagery

To assess the spectral separability between Suaeda salsa and background vegetation dominated by Phragmites australis (reeds), NDVI and RVI values were calculated from red and near-infrared bands acquired by a UAV-mounted multispectral sensor, while the SVI (Suaeda salsa Vegetation Index, defined as SVI = green − (blue + red)/2) was derived from RGB imagery captured by a visible-light camera. Approximately 400,000 pixels of Suaeda salsa and 600,000 pixels of reeds were randomly sampled from their respective distribution areas for spectral analysis.
As shown in Figure 10a, the NDVI values of both Suaeda salsa and reeds exhibited a clear normal distribution. However, the value ranges largely overlapped, making it difficult to reliably differentiate the two species using the NDVI alone. Specifically, NDVI values for Suaeda salsa ranged from 0.00002 to 0.44736 (mean = 0.22369), while those for reeds ranged from 0.00006 to 0.48732 (mean = 0.24369). A similar pattern was observed in the RVI results (Figure 10b), with Suaeda salsa values ranging from 1.00005 to 2.61901 (mean = 1.80953) and those for reeds ranging from 1.00013 to 2.90110 (mean = 1.95061). These results indicate that the NDVI and RVI alone are insufficient for reliably distinguishing Suaeda salsa from reeds.
The SVI, as a vegetation index specifically designed for identifying Suaeda salsa, is typically used after the NDVI has been applied to extract all vegetation pixels and serves to further separate Suaeda salsa from other vegetation such as reeds [8]. In this study, SVI values for Suaeda salsa ranged from −0.07115 to 0.00404 (mean = −0.03356), whereas those for reeds ranged from −0.03273 to 0.03903 (mean = 0.00315), clearly higher than those of Suaeda salsa (Figure 10c). While the SVI offers some ability to distinguish between the two vegetation types, the presence of overlapping regions and the proximity of peak values reduce classification accuracy.
In contrast, hue angle values exhibited a more distinct separation between Suaeda salsa and reeds (Figure 10d). The peaks were well separated, with minimal overlap, suggesting superior classification performance. The hue angle values for Suaeda salsa ranged from 217.4529 to 278.181 (mean = 247.817), while those for reeds ranged from 206.2238 to 254.7813 (mean = 230.5025). Further analysis suggests that although the selected regions had high vegetation coverage, small gaps of exposed soil were inevitable. The minor overlap observed in Figure 10d is likely due to soil pixels within both sampling regions, which can be effectively excluded during hue angle-based classification through thresholding. In contrast, the overlap observed in Figure 10c may be partially due to soil pixels but primarily results from the spectral similarity between Suaeda salsa and reeds.
In summary, the NDVI and RVI fail to provide effective differentiation between Suaeda salsa and reeds. Although the SVI demonstrates improved performance, it still suffers from overlapping distributions and close peak values. Hue angle offers the most distinct separation, with the widest gap between distribution peaks and the smallest overlapping region, making it the most effective indicator for distinguishing Suaeda salsa from reeds in this study.

4.2. Factors Influencing Quantitative Inversion Using UAV Visible Imagery

Quantitative UAV remote sensing has become increasingly prevalent in ecology and environmental studies. While hyperspectral and multispectral sensors are commonly employed, visible-light cameras, though limited in spectral range, offer unique advantages, particularly for identifying red Suaeda salsa. Given their widespread availability as standard components of UAVs, visible-light cameras represent a promising tool for quantitative inversion studies.
To ensure standardized spectral results, exposure parameters (aperture, shutter speed, and ISO) were fixed during data acquisition. Additionally, DRSPs were used to convert raw pixel values into reflectance values. However, variations in camera sensitivity among different UAVs can lead to discrepancies in reflectance and hue angle measurements. Furthermore, weak light conditions can significantly reduce the signal-to-noise ratio of visible-light imagery, increasing the error in reflectance and chromaticity angle calculations.
To mitigate these issues, it is recommended to use the same UAV and camera model for consistent data acquisition within a specific monitoring area. Optimal imaging conditions should be selected to ensure sufficient light. When monitoring areas or periods change, adjustments may be necessary to the hue angle cutoff thresholds for Suaeda salsa identification or biomass inversion models to maintain accurate results.

5. Conclusions

In this study, we propose a novel method for the remote sensing inversion of Suaeda salsa biomass based on the hue angle derived from UAV-acquired visible imagery. Owing to its distinct chromatic characteristics, Suaeda salsa can be effectively distinguished from mudflats, water bodies, and other green vegetation such as reeds, resulting in a significant spectral separation in hue angle.
To establish a quantitative relationship between hue angle and Suaeda salsa biomass, drone-based reflectance standard panels (DRSPs) were employed to convert raw pixel values into reflectance and hue angle values. A hue angle threshold of 249.01 was identified for reliably extracting Suaeda salsa pixels, demonstrating robust performance even in heterogeneous environments where the species is interspersed with reeds or present at low density.
A strong exponential relationship was established between hue angle and Suaeda salsa biomass, described by the model Biomass = 3.57639 × 10⁻¹⁵ × e0.12201×α, with a coefficient of determination (R2) of 0.99696, a mean absolute percentage error (MAPE) of 3.616%, and a root mean square error (RMSE) of 0.02183 kg/m2. The resulting biomass inversion maps exhibited a high degree of agreement with field measurements, accurately reflecting the spatial heterogeneity of biomass distribution.
As a foundational species in coastal salt marshes, Suaeda salsa plays a critical role in maintaining ecosystem stability and biodiversity. This study demonstrates the utility of low-cost UAV visible imagery in overcoming the spatial resolution and atmospheric constraints associated with satellite-based remote sensing, significantly improving the timeliness and precision of wetland monitoring. In addressing the limitations of conventional vegetation indices such as the NDVI and RVI for species-level classification, we developed and validated a hue angle-based identification method with superior discrimination capability and quantitative accuracy. This approach offers key technical support for the development of high-resolution, intelligent monitoring systems.
Future research will focus on expanding the application of UAV-based visible imagery in ecological monitoring and advancing toward a standardized and scalable framework for supporting ecosystem assessment, management, and conservation.

Author Contributions

Conceptualization, L.W. and X.W. (Xiang Wang); Methodology, L.W.; Investigation, X.W. (Xiang Wang) and L.W.; Data Curation, X.S. and S.W.; Validation, X.W. (Xinxin Wang); Formal Analysis, Q.M.; Writing—Original Draft Preparation, L.W. and Q.M.; Writing—Review and Editing, X.W. (Xiang Wang), X.S., X.W. (Xinxin Wang) and S.W.; Supervision, L.J. All authors have read and agreed to the published version of the manuscript.

Funding

This research was funded by the State Environmental Protection Key Laboratory of Coastal Ecosystem (20220202), the National Key Research and Development Program of China (2019YFC1407904, 2018YFC1407605), and the National Natural Science Foundation of China (42076186).

Institutional Review Board Statement

Not applicable.

Informed Consent Statement

Not applicable.

Data Availability Statement

The data presented in this study are available on request from the corresponding author. The data are not publicly available due to privacy.

Acknowledgments

We would like to thank our colleagues from National Marine Environmental Monitoring Center for their help in field spectral measurements, the results of which were used in this work.

Conflicts of Interest

The authors declare no conflicts of interest.

References

  1. Feng, Y.; Xu, X.; Liu, J.; Han, J.; Lu, H. Planting Suaeda salsa improved the soil properties and bacterial community diversity in a coastal mudflat. Land Degrad. Dev. 2023, 34, 3262–3271. [Google Scholar] [CrossRef]
  2. Wang, F.; Tang, J.; Ye, S.; Lliu, J. Blue carbon sink function of Chinese coastal wetlands and carbon neutrality strategy. Bull. Chin. Acad. Sci. (Chin. Version) 2021, 36, 241–251. [Google Scholar]
  3. Fu, X.; Liu, G.; Huang, C.; Liu, Q. Remote sensing estimation models of Suaeda salsa biomass in the coastal wetland. Shengtai Xuebao/Acta Ecol. Sinica 2012, 32, 5355–5362. [Google Scholar]
  4. Song, Z.; Sun, Y.; Chen, P.; Jia, M. Assessing the ecosystem health of coastal wetland vegetation (Suaeda salsa) using the pressure state response model, a case of the Liao River estuary in China. Int. J. Environ. Res. Public Health 2022, 19, 546. [Google Scholar] [CrossRef] [PubMed]
  5. Lü, J.; Jiang, W.; Wang, W.; Chen, K.; Deng, Y.; Chen, Z.; Li, Z. Wetland landscape pattern change and its driving forces in Beijing-Tianjin-Hebei region in recent 30 years. Acta Ecol. Sinica 2018, 38, 4492–4503. [Google Scholar]
  6. Wu, T.; Zhao, D.; Kang, J.; Zhang, F.; Cheng, L. Suaeda salsa dynamic remote monitoring and biomass remote sensing inversion in Shuangtaizi River estuary. Ecol. Environ. 2011, 20, 24. [Google Scholar]
  7. Li, W.; Mu, M.; Chen, G.; Liu, W.; Liu, Y.; Liu, C. Research on Remote Sensing Inversion of Suaeda Salsa’s Biomass Based on TSAVI for OLI Band Simulation. Spectrosc. Spectr. Anal. 2016, 36, 1418–1422. [Google Scholar]
  8. Gao, T. Research on Community Information Extraction of Suaeda salsa Based on UAV Multispectral Data. Master’s Thesis, Dalian Ocean University, Dalian, China, June 2024. [Google Scholar]
  9. Li, W.; Wang, W.; Zhang, X. Carbon storage assessment of sea grass Suaeda salsa community in Liaohe Estuary wetland based on HY-1C CZI data. J. Dalian Ocean Univ. 2022, 37, 574–583. [Google Scholar]
  10. Han, M.; Pan, B.; Liu, Y.B.; Yu, H.Z.; Liu, Y.R. Wetland biomass inversion and space differentiation: A case study of the Yellow River Delta Nature Reserve. PLoS ONE 2019, 14, e0210774. [Google Scholar] [CrossRef]
  11. Dou, Z.; Li, Y.; Cui, L.; Pan, X.; Ma, Q.; Huang, Y.; Lei, Y.; Li, J.; Zhao, X.; Li, W. Hyperspectral inversion of Suaeda salsa biomass under different types of human activity in Liaohe Estuary wetland in north-eastern China. Mar. Freshw. Res. 2019, 71, 482–492. [Google Scholar] [CrossRef]
  12. Su, X.; Li, Y.; Jing, X.; Song, D.; Liu, G.; Xu, J.; Wang, X. Quantitative remote sensing inversion of Suaeda salsa growth density based on GF-6. Mar. Environ. Sci. 2023, 42, 151–159. [Google Scholar]
  13. Li, Y.; Chen, Y.; Chen, H.; Wang, C. Construction of Suaeda Salsa Vegetation Index Based on GF-1 WFV Images. Geomat. Inf. Sci. Wuhan Univ. 2019, 44, 1823–1831. [Google Scholar]
  14. Lin, Y.; Guo, J. Fuzzy Geospatial Object-Based Membership Function Downscaling. Remote Sens. 2023, 15, 1911. [Google Scholar] [CrossRef]
  15. CIE. Commission Internationale de l‘Eclairage Proceedings 1931; Cambridge Univ. Press: Cambridge, UK, 1932; pp. 19–29. [Google Scholar]
  16. Alföldi, T.T.; Munday, J.C., Jr. Water Quality Analysis by Digital Chromaticity Mapping of Landsat Data. Can. J. Remote Sens. 1978, 4, 108–126. [Google Scholar] [CrossRef]
  17. Bukata, R.P.; Bruton, J.E.; Jerome, J.H. Use of chromaticity in remote measurements of water quality. Remote Sens. Environ. 1983, 13, 161–177. [Google Scholar] [CrossRef]
  18. Bukata, R.P.; Pozdnyakov, D.V.; Jerome, J.H.; Tanis, F.J. Validation of a radiometric color model applicable to optically complex water bodies. Remote Sens. Environ. 2001, 77, 165–172. [Google Scholar] [CrossRef]
  19. Wang, S.; Li, J.; Zhang, B.; Spyrakos, E.; Tyler, A.N.; Shen, Q.; Zhang, F.; Kuster, T.; Lehmann, M.K.; Wu, Y. Trophic state assessment of global inland waters using a MODIS-derived Forel-Ule index. Remote Sens. Environ. 2018, 217, 444–460. [Google Scholar] [CrossRef]
  20. Li, M.; Sun, Y.; Li, X.; Cui, M.; Huang, C. An Improved Eutrophication Assessment Algorithm of Estuaries and Coastal Waters in Liaodong Bay. Remote Sens. 2021, 13, 3867. [Google Scholar] [CrossRef]
  21. Burket, M.O.; Olmanson, L.G.; Brezonik, P.L. Comparison of Two Water Color Algorithms: Implications for the Remote Sensing of Water Bodies with Moderate to High CDOM or Chlorophyll Levels. Sensors 2023, 23, 1071. [Google Scholar] [CrossRef]
  22. Wang, L.; Wang, X.; Meng, Q.; Chen, Y.; Wang, X.; Jiang, L.; Shang, Y. Retrieval and spatiotemporal variation of total suspended matter concentration using a MODIS-derived hue angle in the coastal waters of Qinhuangdao, China. Front. Mar. Sci. 2024, 11, 1434225. [Google Scholar] [CrossRef]
  23. Liu, R.; Xiao, Y.; Ma, Y.; Cui, T.; An, J. Red tide detection based on high spatial resolution broad band optical satellite data. ISPRS J. Photogramm. Remote Sens. 2022, 184, 131–147. [Google Scholar] [CrossRef]
  24. Dai, Y.; Yang, S.; Zhao, D.; Hu, C.; Xu, W.; Anderson, D.M.; Li, Y.; Song, X.-P.; Boyce, D.G.; Gibson, L. Coastal phytoplankton blooms expand and intensify in the 21st century. Nature 2023, 615, 280–284. [Google Scholar] [CrossRef]
  25. Zhao, D.; Luo, Q.; Qiu, Z. Chromaticity-Based Discrimination of Algal Bloom from Inland and Coastal Waters Using In Situ Hyperspectral Remote Sensing Reffectance. Water 2024, 16, 2276. [Google Scholar] [CrossRef]
  26. Shang, Y.; Jiang, L.; Wang, L.; Ye, Z.; Gao, S.; Tang, X. Methods for detecting green tide in the Yellow Sea using Google Earth Engine platform. Reg. Stud. Mar. Sci. 2024, 77, 103666. [Google Scholar] [CrossRef]
  27. Wang, L.; Meng, Q.; Wang, X.; Chen, Y.; Wang, X.; Han, J.; Wang, B. Identification of Floating Green Tide in High-Turbidity Water from Sentinel-2 MSI Images Employing NDVI and CIE Hue Angle Thresholds. J. Mar. Sci. Eng. 2024, 12, 1640. [Google Scholar] [CrossRef]
  28. He, S.; Zhang, S.; Tian, J.; Lu, X. UAV hyperspectral inversion of Suaeda Salsa leaf area index in coastal wetlands combined with multimodal data. Natl. Remote Sens. Bull. 2023, 27, 1441–1453. [Google Scholar] [CrossRef]
  29. Zhou, Z.; Yang, Y.; Chen, B. Estimating Spartina alterniflora fractional vegetation cover and aboveground biomass in a coastal wetland using SPOT6 satellite and UAV data. Aquat. Bot. 2018, 144, 38–45. [Google Scholar] [CrossRef]
  30. Bazzo, C.O.G.; Kamali, B.; Hütt, C.; Bareth, G.; Gaiser, T. A review of estimation methods for aboveground biomass in grasslands using UAV. Remote Sens. 2023, 15, 639. [Google Scholar] [CrossRef]
  31. Marcial-Pablo, M.d.J.; Gonzalez-Sanchez, A.; Jimenez-Jimenez, S.I.; Ontiveros-Capurata, R.E.; Ojeda-Bustamante, W. Estimation of vegetation fraction using RGB and multispectral images from UAV. Int. J. Remote Sens. 2019, 40, 420–438. [Google Scholar] [CrossRef]
  32. Adão, T.; Hruška, J.; Pádua, L.; Bessa, J.; Peres, E.; Morais, R.; Sousa, J.J. Hyperspectral imaging: A review on UAV-based sensors, data processing and applications for agriculture and forestry. Remote Sens. 2017, 9, 1110. [Google Scholar] [CrossRef]
  33. Wang, S.; Li, J.; Shen, Q.; Zhang, B.; Zhang, F.; Lu, Z. MODIS-based radiometric color extraction and classification of inland water with the Forel-Ule scale: A case study of Lake Taihu. IEEE J. Sel. Top. Appl. Earth Obs. Remote Sens. 2014, 8, 907–918. [Google Scholar] [CrossRef]
  34. Yang, C.; Fritz, B.K.; Suh, C.P.C. Practical methods for aerial image acquisition and reflectance conversion using consumer-grade cameras on manned and unmanned aircraft. Precis. Agric. 2024, 25, 2831–2852. [Google Scholar] [CrossRef]
Figure 1. UAV imagery of the experimental area in Wafangdian City, northern China.
Applsci 15 07423 g001
Figure 2. Experimental procedure and timeline for biomass estimation.
Applsci 15 07423 g002
Figure 3. Suaeda salsa biomass experiment: (a) experimental unit, (b) spatial layout of experimental plots. S1–S6 represent measurement samples 1–6.
Applsci 15 07423 g003
Figure 4. A CIE-xy two-dimensional chromaticity diagram. Angle α is the angle between the vector to a point and the negative x′-axis (at y = 1/3) [19].
Applsci 15 07423 g004
Figure 5. Relationship between color value and reflectance for different spectral bands.
Applsci 15 07423 g005
Figure 6. Distribution of mudflat hue angle: pixel count and cumulative proportion.
Applsci 15 07423 g006
Figure 7. Suaeda salsa extraction results: (a) overview of entire study area, and detailed views of (b) low-density area and (c) mixed vegetation area.
Applsci 15 07423 g007
Figure 8. Exponential relationship between Suaeda salsa biomass and hue angle α.
Applsci 15 07423 g008
Figure 9. Visualizing spatial biomass distribution of Suaeda salsa. (a) Raw imagery. (b) Biomass.
Applsci 15 07423 g009aApplsci 15 07423 g009b
Figure 10. Pixel counts for Suaeda salsa and reeds using (a) NDVI, (b) RVI, (c) SVI, and (d) hue angle.
Applsci 15 07423 g010
Table 1. Accuracy evaluation of remote sensing inversion models of Suaeda salsa biomass.
Model TypeModel ExpressionR2MAPE (%)RMSE (kg/m2)
Linear functionBiomass = −8.87436 + 0.03512 × α0.9365012.9850.09966
Quadratic polynomial functionBiomass = 136.68861 − 1.07788 × α + 0.00213 × α20.9912491.3460.55293
Exponential functionBiomass = 3.57639 × 10⁻¹⁵ × e0.12201×α0.996963.6160.02183
Power functionBiomass = 4.51642 × 10−79 × α32.164470.996743.5540.02258
Disclaimer/Publisher’s Note: The statements, opinions and data contained in all publications are solely those of the individual author(s) and contributor(s) and not of MDPI and/or the editor(s). MDPI and/or the editor(s) disclaim responsibility for any injury to people or property resulting from any ideas, methods, instructions or products referred to in the content.

