Article

Formation Kinetics and Morphology Characteristics of Natural Gas Hydrates in Sandstone Fractures

1
State Key Laboratory of Intelligent Construction and Healthy Operation & Maintenance of Deep Underground Engineering, School of Mechanics and Civil Engineering, China University of Mining and Technology, Xuzhou 221116, China
2
Xinwen Mining Group Co., Ltd., Tai’an 271233, China
3
Key Laboratory of Coalbed Methane Resources and Reservoir Formation Process of the Ministry of Education, School of Resources and Geosciences, China University of Mining and Technology, Xuzhou 221116, China
*
Author to whom correspondence should be addressed.
Appl. Sci. 2025, 15(13), 7399; https://doi.org/10.3390/app15137399
Submission received: 29 May 2025 / Revised: 25 June 2025 / Accepted: 27 June 2025 / Published: 1 July 2025

Abstract

Fractures in marine sediments are critical zones for hydrate formation. The kinetics and morphological characteristics of hydrates within sandstone fractures are comprehensively investigated in this study by employing a high-pressure visualization reaction vessel to examine their formation, dissociation, and reformation processes. The results are presented below: (1) In 3 mm Type I fractures, the induction time is longer than that observed in the other two fracture widths. Hydrates predominantly form on the fracture walls and gradually expand toward both sides of the fracture. (2) Gas enters the fracture from multiple directions, causing the hydrate in Type X fractures to expand toward the center from all sides, which shortens the induction time and increases the quantity of hydrate formation. (3) An increase in fracture roughness promotes nucleation of the hydrate at surface protrusions but inhibits the total quantity of hydrate formation. (4) Hydrate dissociation typically propagates from the fracture wall into the interior, exhibiting a wavy surface morphology. Gas production is influenced by the fracture width, with the highest gas production observed in a 3 mm fracture. (5) Due to the memory effect, the hydrate induction time for reformation is significantly shorter, though the quantity of hydrate formed is lower than that of the first formation. This study aims to provide micro-level insights into the distribution of hydrates in sandstone fractures, thereby facilitating more efficient and safe extraction of hydrates from fractures.

1. Introduction

Natural gas hydrate is a metastable substance formed by the interaction of water molecules with guest molecules [1,2], primarily methane (CH4), under low-temperature and high-pressure conditions, resulting in a cage-like, solid crystalline compound [3,4]. It is widely distributed across offshore areas and permafrost regions [5,6]. As an unconventional energy source, the carbon reserves of natural gas hydrates are more than double those of conventional energy sources, and they release only small amounts of water and carbon dioxide (CO2) upon complete combustion [7,8]. Based on these advantages, natural gas hydrates are expected to become one of the most promising alternative energy sources as conventional energy gradually depletes [9,10]. Therefore, the large-scale commercial exploitation of natural gas hydrates is of considerable importance in addressing the issues of insufficient conventional energy reserves and environmental pollution [11,12].
The extraction of a gas hydrate is a complex process involving multiple factors, such as kinetics, thermodynamics, fluid flow, and reservoir mechanics [13]. Among these factors, the study of the formation/dissociation kinetics and morphological characteristics of hydrates forms a crucial foundation for improving the efficiency and stability of hydrate development [14,15]. The primary factors influencing hydrate formation include temperature, pressure, disturbances, and additives [16]. Research has demonstrated that temperature and pressure conditions play a crucial role in hydrate kinetics [17]. Physical methods, such as disturbances, spraying, and bubbling, effectively increase the contact area between gas and liquid-phase water, thereby significantly enhancing the rate of hydrate formation [18]. Chemical additives, including kinetic additives like sodium dodecyl sulfate (SDS) [19], amino acid compounds [20,21,22], and nanoparticles [23,24] have been shown to promote the kinetics of hydrate formation. These promoting techniques provide significant theoretical support for a deeper understanding of the dynamic characteristics of hydrates.
Natural gas hydrates are typically found in porous sedimentary media, and the properties of these media significantly influence their formation, dissociation kinetics, and morphology. Water-saturated sandy sediments with high permeability are generally regarded as the most economically viable and feasible category for hydrate extraction [25]. Babu et al. [26] observed the formation of hydrates in the pores of silica sand and activated carbon particles, emphasizing that the pore space and connectivity of the porous media play a crucial role in hydrate formation. Ji et al. [27] used nuclear magnetic resonance (NMR) technology to observe that hydrate typically forms at the center of pores in sandstone, with the formation mechanisms in smaller pores differing significantly from those in larger pores. Cheng et al. [28] conducted hydrate formation experiments in glass beads and similarly observed that the water conversion rate in large pores was significantly higher than in small pores. Li et al. [29] propose that the formation mechanism of hydrates in sandstone pores is closely linked to the specific pore volume. Xie et al. [30] similarly support this viewpoint and highlight that the rate of hydrate formation is determined by the effective gas–liquid contact area rather than the particle size of quartz sand. Chen et al. [31], employing X-ray radiation imaging and 3D computed tomography (CT) technology, investigated the dissociation process of hydrates in sandstone and concluded that the dissociation rate of hydrates does not exhibit a linear relationship with their surface area. Additionally, they observed that the dissociation rate of hydrates in larger pores is significantly slower than in smaller pores. Li et al. [32] investigated the dissociation rate of hydrates in quartz sand with varying particle sizes, concluding that the dissociation rate was governed by the sediment’s heat transfer rate, while the influence of capillarity and hydrate distribution on dissociation was relatively minor. Wu et al. [33] studied the dissociation process of hydrates in stacked quartz sand, finding that hydrate predominantly exists in the form of pore filling. Li et al. [34] employed a low-field nuclear magnetic resonance (LF-NMR) system to quantitatively study the heterogeneity of hydrate dissociation in quartz sand during geothermal intrusion, stressing that the dissociation rate was closely related to fluid resistance and heat replenishment. In conclusion, both domestic and international scholars have conducted extensive laboratory experiments and provided a comprehensive analysis of the kinetic characteristics of hydrates within the pores of porous media.
In addition to hydrates within pores, hydrates found in fractures have been identified in several regions worldwide, including the hydrate ridge off the coast of Oregon, the Gulf of Mexico, the Uljin Basin in South Korea, the Krishna-Godavari Basin in India, and the South China Sea [35,36,37,38,39]. These fractures vary in shape, with some extending several meters, and the fracture widths range from submillimeter to millimeter scales [40], as shown in Figure 1. Hydrates within fractures are primarily formed in submarine sediments or permafrost regions. Sufficient spatial and flow pathways are afforded by fractures, enabling gas and water to react under appropriate thermobaric conditions. The formation and accumulation of hydrates within fractures are governed by various factors, including fracture connectivity, width, and type [41]. Hydrates are more commonly found in sediment fractures than in pores [41]. Furthermore, research has shown that once hydrates form in the pores and fractures, physical signals—such as electrical resistance and acoustic waves—of the sediments exhibit significant differences [42,43,44]. This indicates variations in the distribution and morphology of hydrates within the pores and fractures. The two differ significantly in terms of geometric properties, capillary action, their effects on gas–liquid flow, and the gas–liquid interface area [16]. Moreover, the Joule–Thomson effect caused by gas release and the endothermic effect of hydrate dissociation in sediments lead to a significant reduction in the local temperature of hydrate reservoirs. When the heat provided by the surrounding environment of the reservoir is insufficient, hydrate dissociation will cease. Under these conditions, hydrate reformation and freezing of water within the reservoir are likely to occur [45,46]. Studies have shown that hydrate reformation is inevitable under all hydrate dissociation conditions [47]. Gas flow effectively facilitates hydrate reformation, primarily due to the hydrate’s memory effect [48]. Liao et al. [49,50] simulated the memory effect of a hydrate in the presence of silica particles, indicating that the residual structure of the hydrate, the gas driving force, the particles in the porous medium, and the dissolved gas all influence hydrate reformation. The hydrate reformation affects their occurrence, thereby influencing production rates. Therefore, it is essential to study the formation and dissociation kinetics, morphological characteristics, and hydrate reformation phenomena in fractures.
Existing research predominantly focuses on the formation and dissociation of hydrates in pore spaces, while relatively less attention is given to the behavior of hydrates in fractures. Specifically, there is a dearth of systematic studies examining the influence of fracture width, type, and roughness on the formation, dissociation, and reformation of hydrates. Current research on the dissociation and reformation mechanisms of hydrates in fractures remains limited, lacking quantitative kinetic analysis and a systematic exploration of morphological characteristics. The formation, dissociation, and reformation processes of hydrates under fracture conditions are systematically investigated through the pre-creation of sandstone fractures with varying morphologies and widths. The morphological characteristics of hydrates are also explored. By obtaining kinetic parameters such as induction time, gas consumption, and gas production, along with morphological parameters such as growth shape and direction, the distribution of hydrates in fractures can be predicted, offering new theoretical insights for the exploitation of marine natural gas hydrates.

2. Methodology

2.1. Experimental Apparatuses

Figure 2 illustrates a self-assembled high-pressure visualization reaction system, encompassing the in situ hydrate formation system, the visualization monitoring system, and the data acquisition system.
The in situ hydrate formation system comprises a visualization reaction vessel, a CH4 gas cylinder, an SPVC plunger pump, a magnetic stirrer, a water bath temperature control system, sensors, and piping. The reaction vessel is custom-manufactured from 316 stainless steel and has a maximum pressure tolerance of 20 MPa. The SPVC plunger pump is connected to the CH4 gas cylinder, precisely controlling the gas volume and pressure. Additionally, a pressure sensor is installed to continuously monitor the pressure within the vessel and its fluctuations. A back-pressure valve at the outlet facilitates the control of internal pressure through the venting of gas. A custom magnetic stirrer is installed at the bottom of the kettle to create an agitated environment, with the stirring speed adjustable between 5 rpm and 450 rpm. The vessel is enclosed by a circulation jacket, with a DC-1006 water bath (using ethylene glycol as the coolant) to maintain precise temperature control within ±0.05 °C, meeting the temperature requirements for CH4 hydrate formation. A temperature sensor inside the kettle monitors real-time variations in internal temperature.
The visualization monitoring system consists of sapphire windows, a high-definition camera, an HR lens, and a dehumidifier. The side wall of the reaction vessel is fitted with two 25 mm-diameter sapphire windows. Images are captured by an HR lens (Moritex Co., Ltd., Tokyo, Japan) with a focal length of 25 mm and a magnification range of 0.1–0.4×, which are then recorded by a high-definition camera (acA4024-8gc GigE, Basler Co., Ltd., Ahrensburg, Germany). The camera is equipped with a 12.2-megapixel resolution sensor and operates at a frame rate of 8.7 frames per second, enabling precise automatic photography at the second level. To prevent condensation around the sapphire windows caused by the cooling liquid, which could result in blurred images, a dehumidifier is employed during the experiment to maintain the dryness of the windows.
All experimental data, including pressure, temperature, and images, are transmitted in real time to a computer via a data acquisition system, facilitating subsequent data processing and analysis.

2.2. Experimental Material

The materials required for this study primarily consist of CH4 gas, N2 gas, de-aerated water, L-tryptophan solution, and artificial sandstone fracture molds. The purity of the CH4 and N2 gases is 99.99%, and these are supplied by Xuzhou Luyou Co., Ltd., Xuzhou, China. The laboratory-produced de-aerated water is employed to eliminate potential interference from dissolved impurities during the formation of CH4 hydrate. To accelerate the rate of hydrate formation, a 0.2 wt% L-tryptophan solution is selected as the kinetic promoter [51]. The L-tryptophan solution is prepared in-house by dissolving high-purity L-tryptophan powder in de-aerated water to precisely control the concentration and ensure the effective control of the kinetic promoter. Additionally, based on prior research, a disturbance rate of 500 rpm is selected to facilitate the formation of the hydrate. The main components of the artificial sandstone are quartz sand (50.6%), low-sodium feldspar (21.2%), kaolinite (14.3%), and biotite (13.9%), with a density of 2.38 g/cm3. The specific artificial sandstone fracture model is shown in Figure 3.

2.3. Experimental Procedures

The steps for hydrate formation and observation are outlined as follows in this study. (1) Pre-treatment of the reaction vessel: To minimize the impact of impurities during the experiment, de-aerated water is injected into the reaction vessel 3 times prior to the start of the experiment, for cleaning and drying. (2) Determination of shooting conditions: Through multiple pre-experiments, it was found that a liquid phase volume of 45 mL is the optimal condition. (3) Fracture pre-fabrication and filling: The pre-fabricated fractures are positioned within the vessel to ensure their bottoms are in full contact with the liquid surface. A high-definition camera is adjusted accordingly. The liquid is slowly directed into the fractures using a glass rod to prevent bubble formation, which could interfere with the camera’s recording. (4) Sealing integrity testing and the preparation of experimental conditions: After sealing the reaction vessel, N2 gas is introduced for a sealing integrity test to confirm that no gas leakage occurs during the experiment. After the test, the N2 is discharged through the back pressure valve, and the vessel is treated under vacuum using a vacuum pump. Subsequently, the pressure inside the reaction vessel is maintained at 0.1 MPa by adjusting the SPVC piston pump, and the dehumidifier and water bath are set to the required temperature and humidity. (5) Experiment starts: Pre-cooled CH4 gas is slowly injected into the reaction vessel, and the internal pressure is controlled to reach the desired testing pressure. The moment when both the temperature and pressure conditions are met is designated as the zero-time point of the experiment. (6) Observation and recording: The CH4 gas consumption curve is recorded using the SPVC piston pump, while the formation of CH4 hydrate within the fractures is observed using the high-definition camera. The experiment ends when gas consumption ceases. The quantity of hydrate formation is calculated using Equation (1). (7) Hydrate dissociation and yield calculation: After closing the reaction vessel’s adjustment valve and discharging the remaining gas from the SPVC piston pump, the back-pressure valve is opened, and the pressure is rapidly reduced until the internal pressure of the vessel reaches 2 MPa. Once the volume of the SPVC piston pump remains stable for 30 min, it is confirmed that the hydrate has completely dissociated, and the experiment is concluded. The gas production is calculated using Equation (1). (8) Hydrate reformation: The pressure is adjusted above the hydrate phase equilibrium, promoting hydrate reformation until gas consumption ceases, marking the end of the experiment.
n = ( P 0 Z 0 P t Z t ) × V g R T
where n denotes the gas consumption; P0 and Pt representst the initial system pressure and the system pressure at time t, respectively; Z0 and Zt correspond to the gas compressibility factors at P0 and Pt, respectively, computed in accordance with the national standard GB/T 17747.3-2011 [52], utilizing a Matlab programming model; T denotes the experimental temperature; R represents the molar gas constant (8.314 J/(mol·K)); and Vg denotes the gas volume within the reaction vessel, which is 6.98 × 10⁻⁵ m3.
In the experiment, the primary factors considered are the fracture width, fracture shape, and roughness. The fracture widths employed are 3 mm, 6 mm, and 10 mm. The fracture shapes are Type I and Type X. The pore pressure is set at 5 MPa, and the fracture roughness is controlled by attaching glass beads to the fracture walls, with roughness values of 2.5 mm and 3.5 mm employed. The temperature gradient during formation and the CH4 hydrate phase equilibrium conditions are considered (as shown in Figure 4). The experimental temperature is kept at 4 °C. The specific experimental conditions are presented in Table 1.
The induction time for CH4 hydrate formation, gas consumption, hydrate formation quantity, and images of CH4 hydrate formation within the fractures can be obtained from the gas consumption curves and observation images during the experiment. During the process, the moment when stirring begins is considered the start of the induction period, while the moment of significant gas consumption in the piston pump marks the end of the induction period. The time interval between these two moments is the induction time. Additionally, the duration from the start of gas consumption to the complete cessation of gas consumption is defined as the total hydrate duration, reflecting the time interval from the beginning of hydrate formation to its complete growth.

3. Results and Discussion

3.1. Hydrate Formation

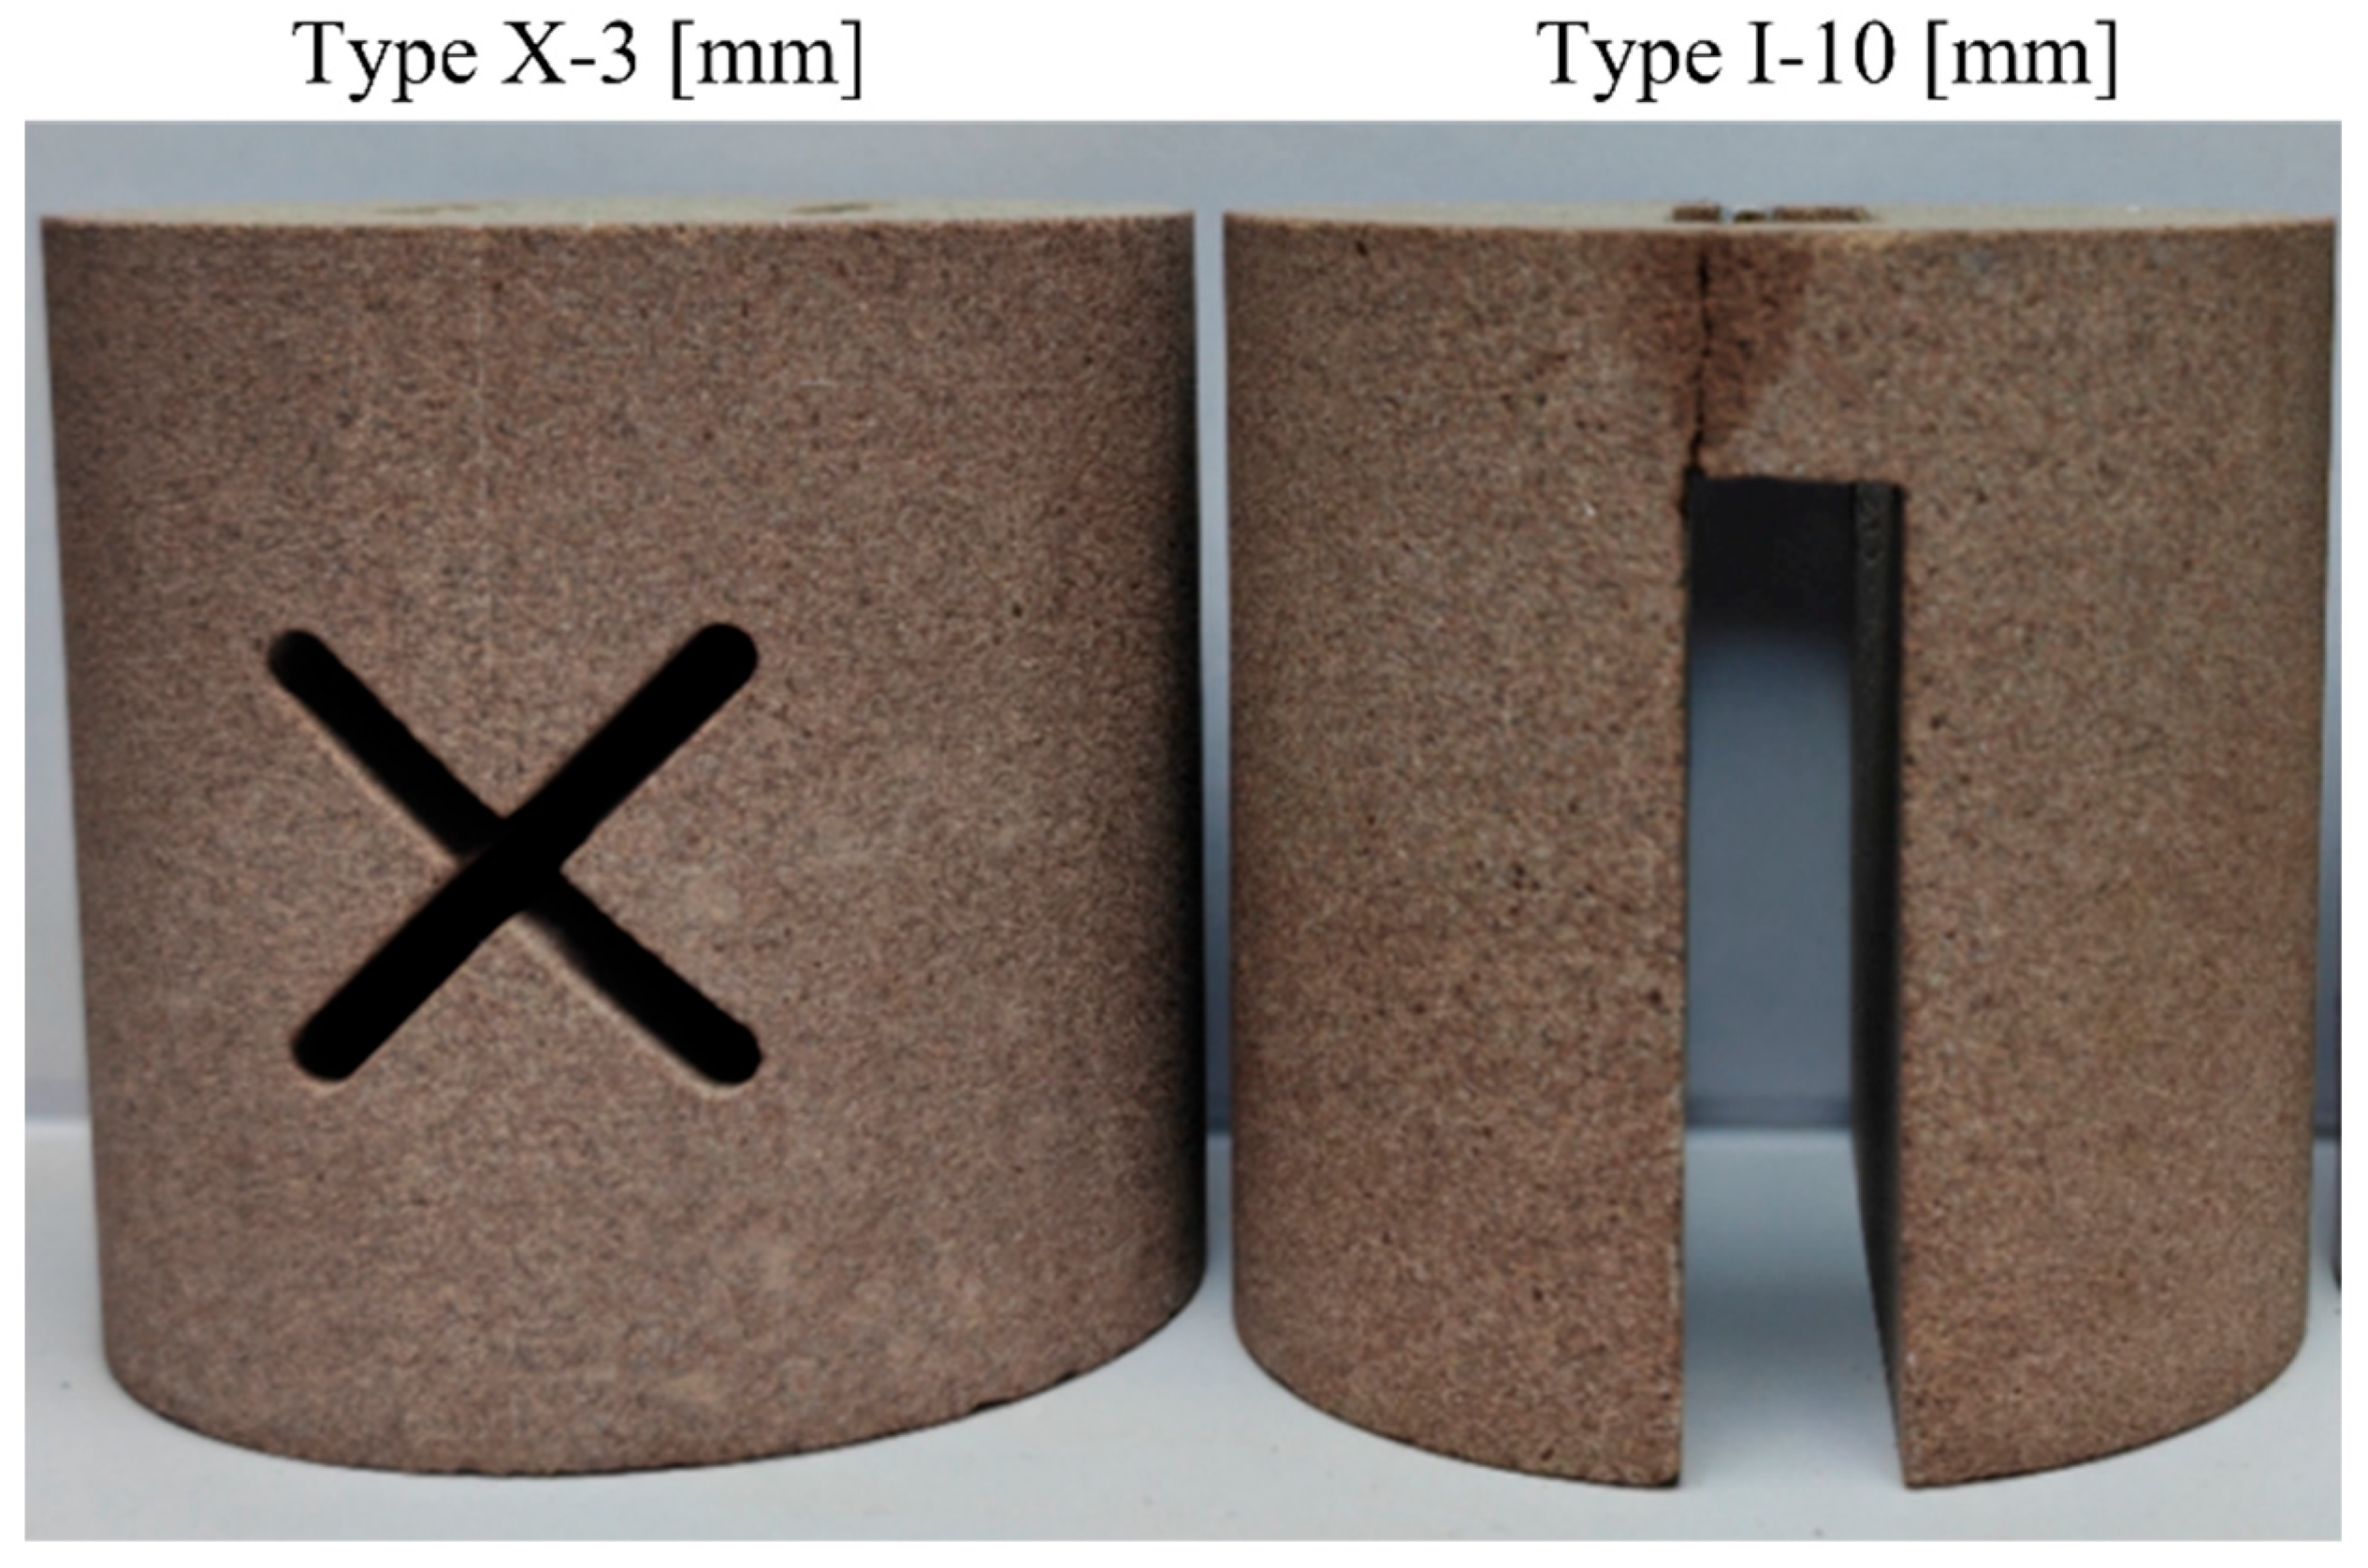
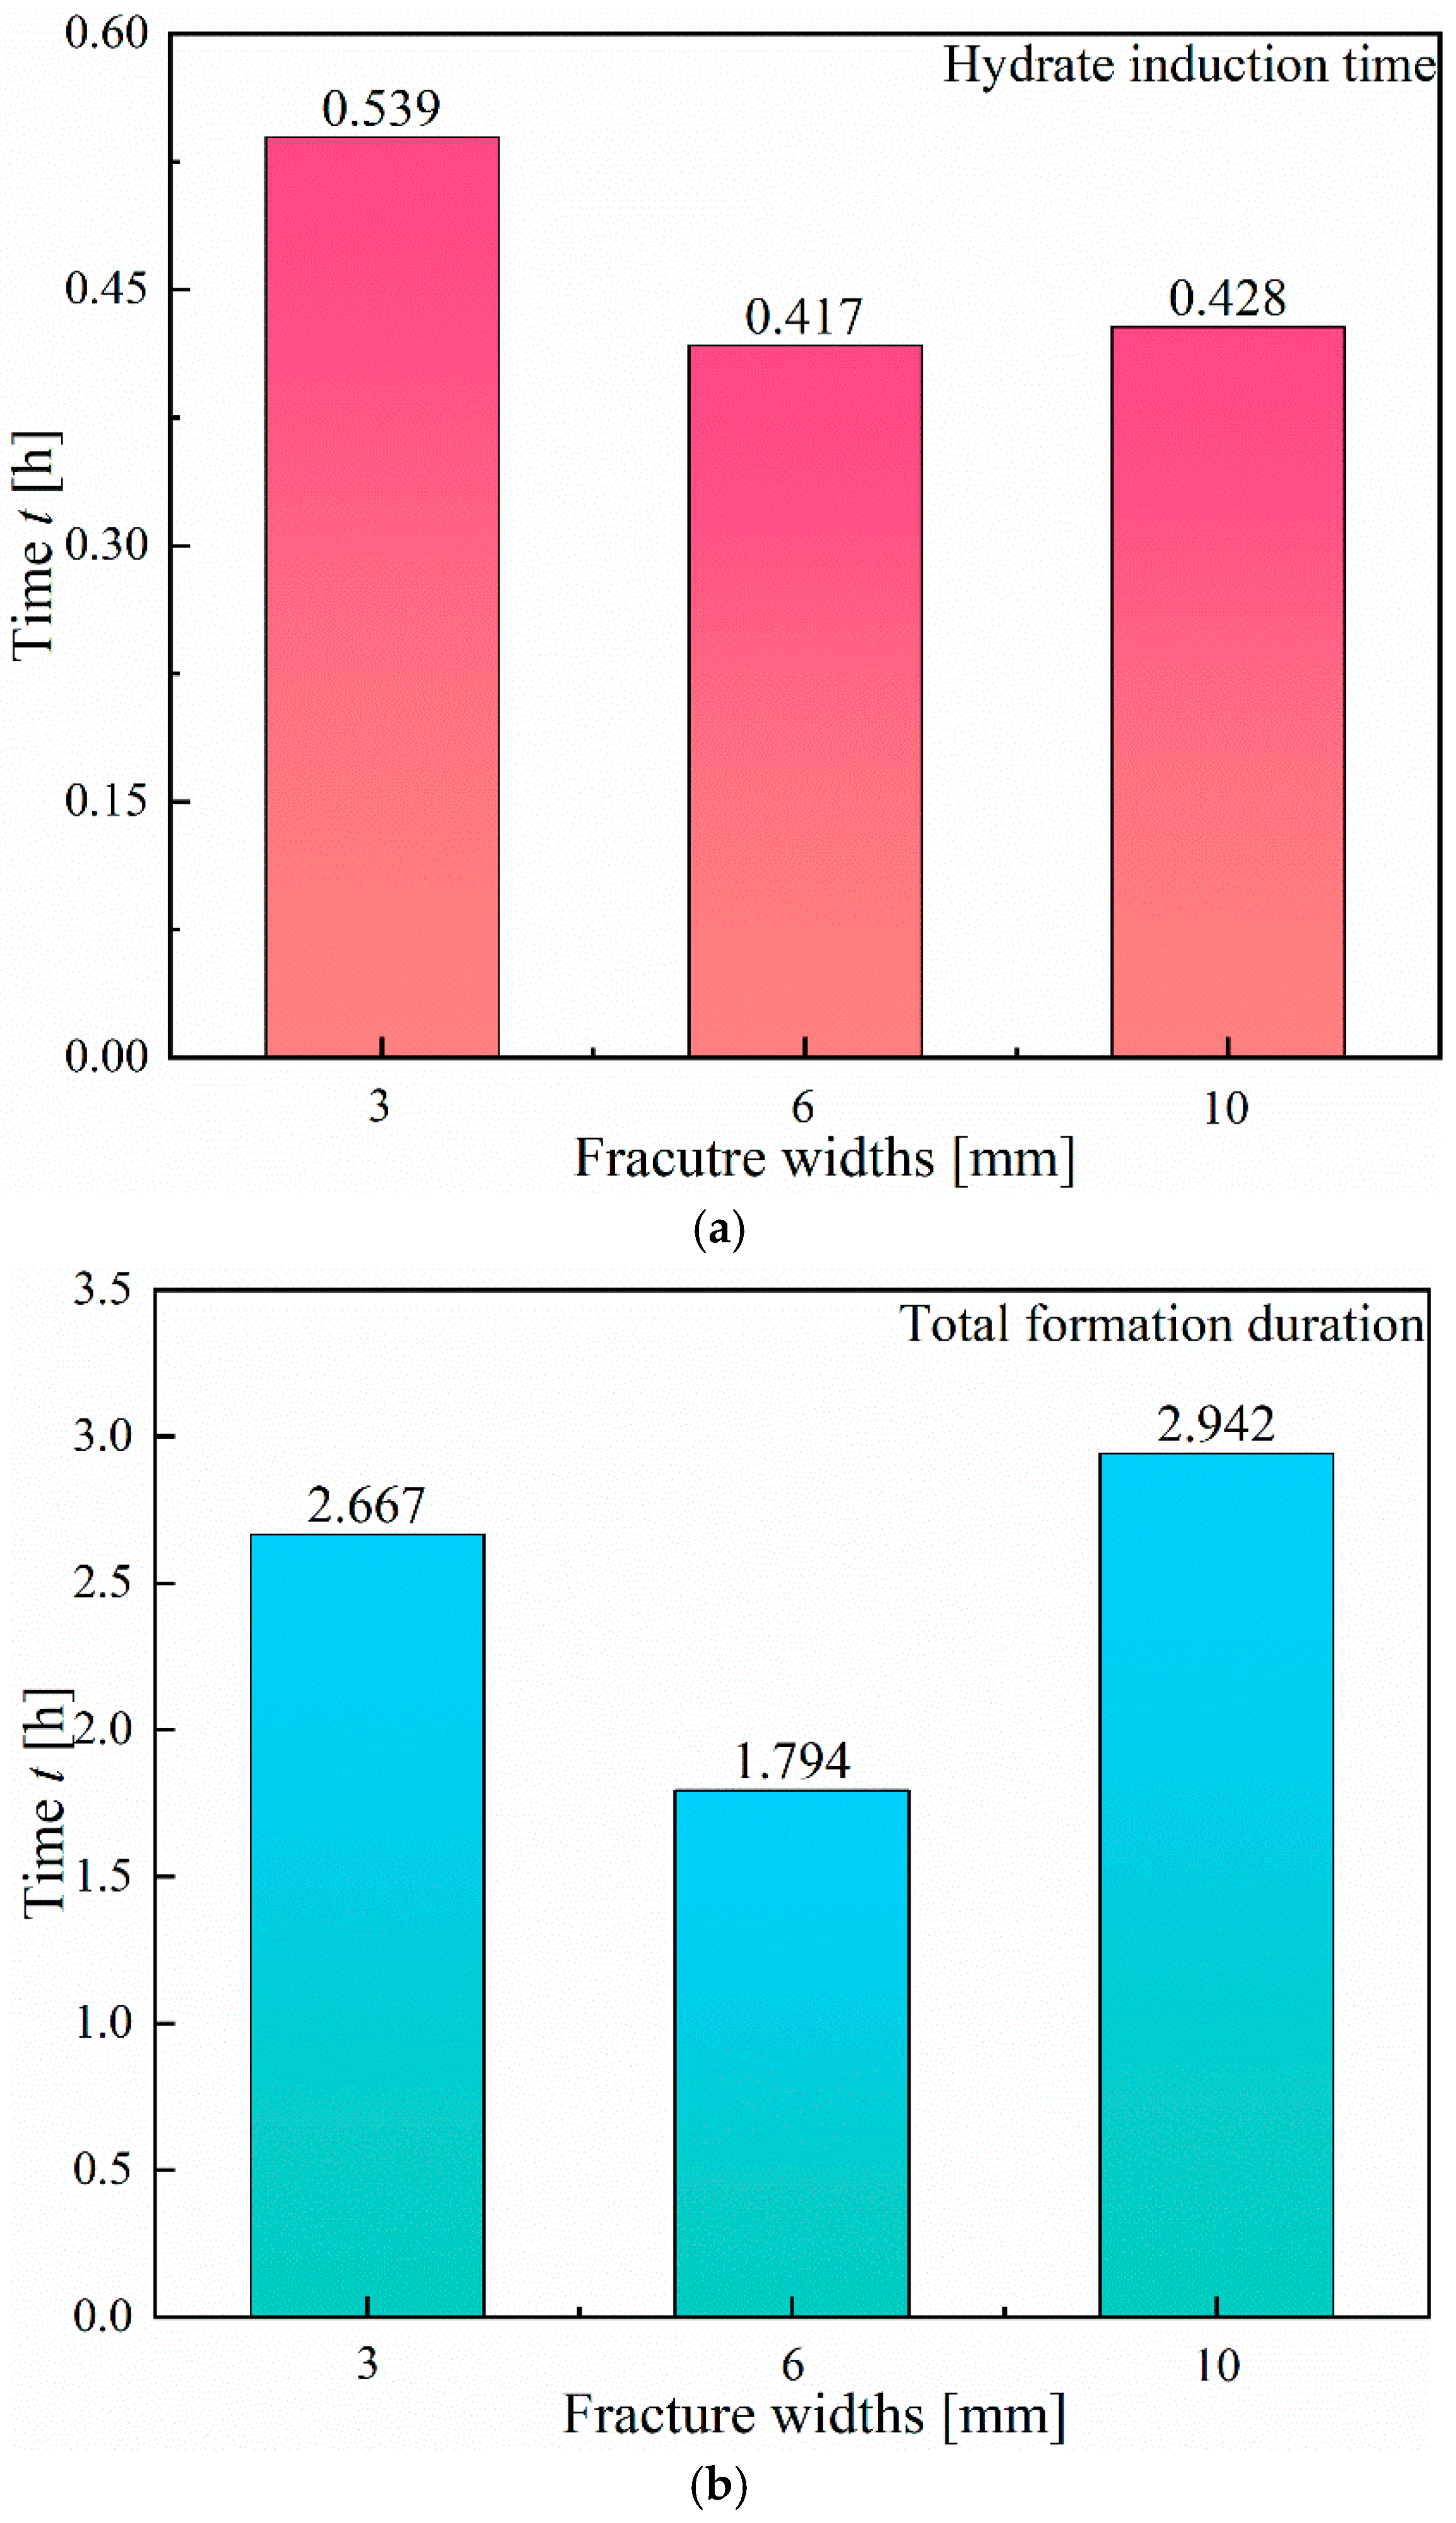
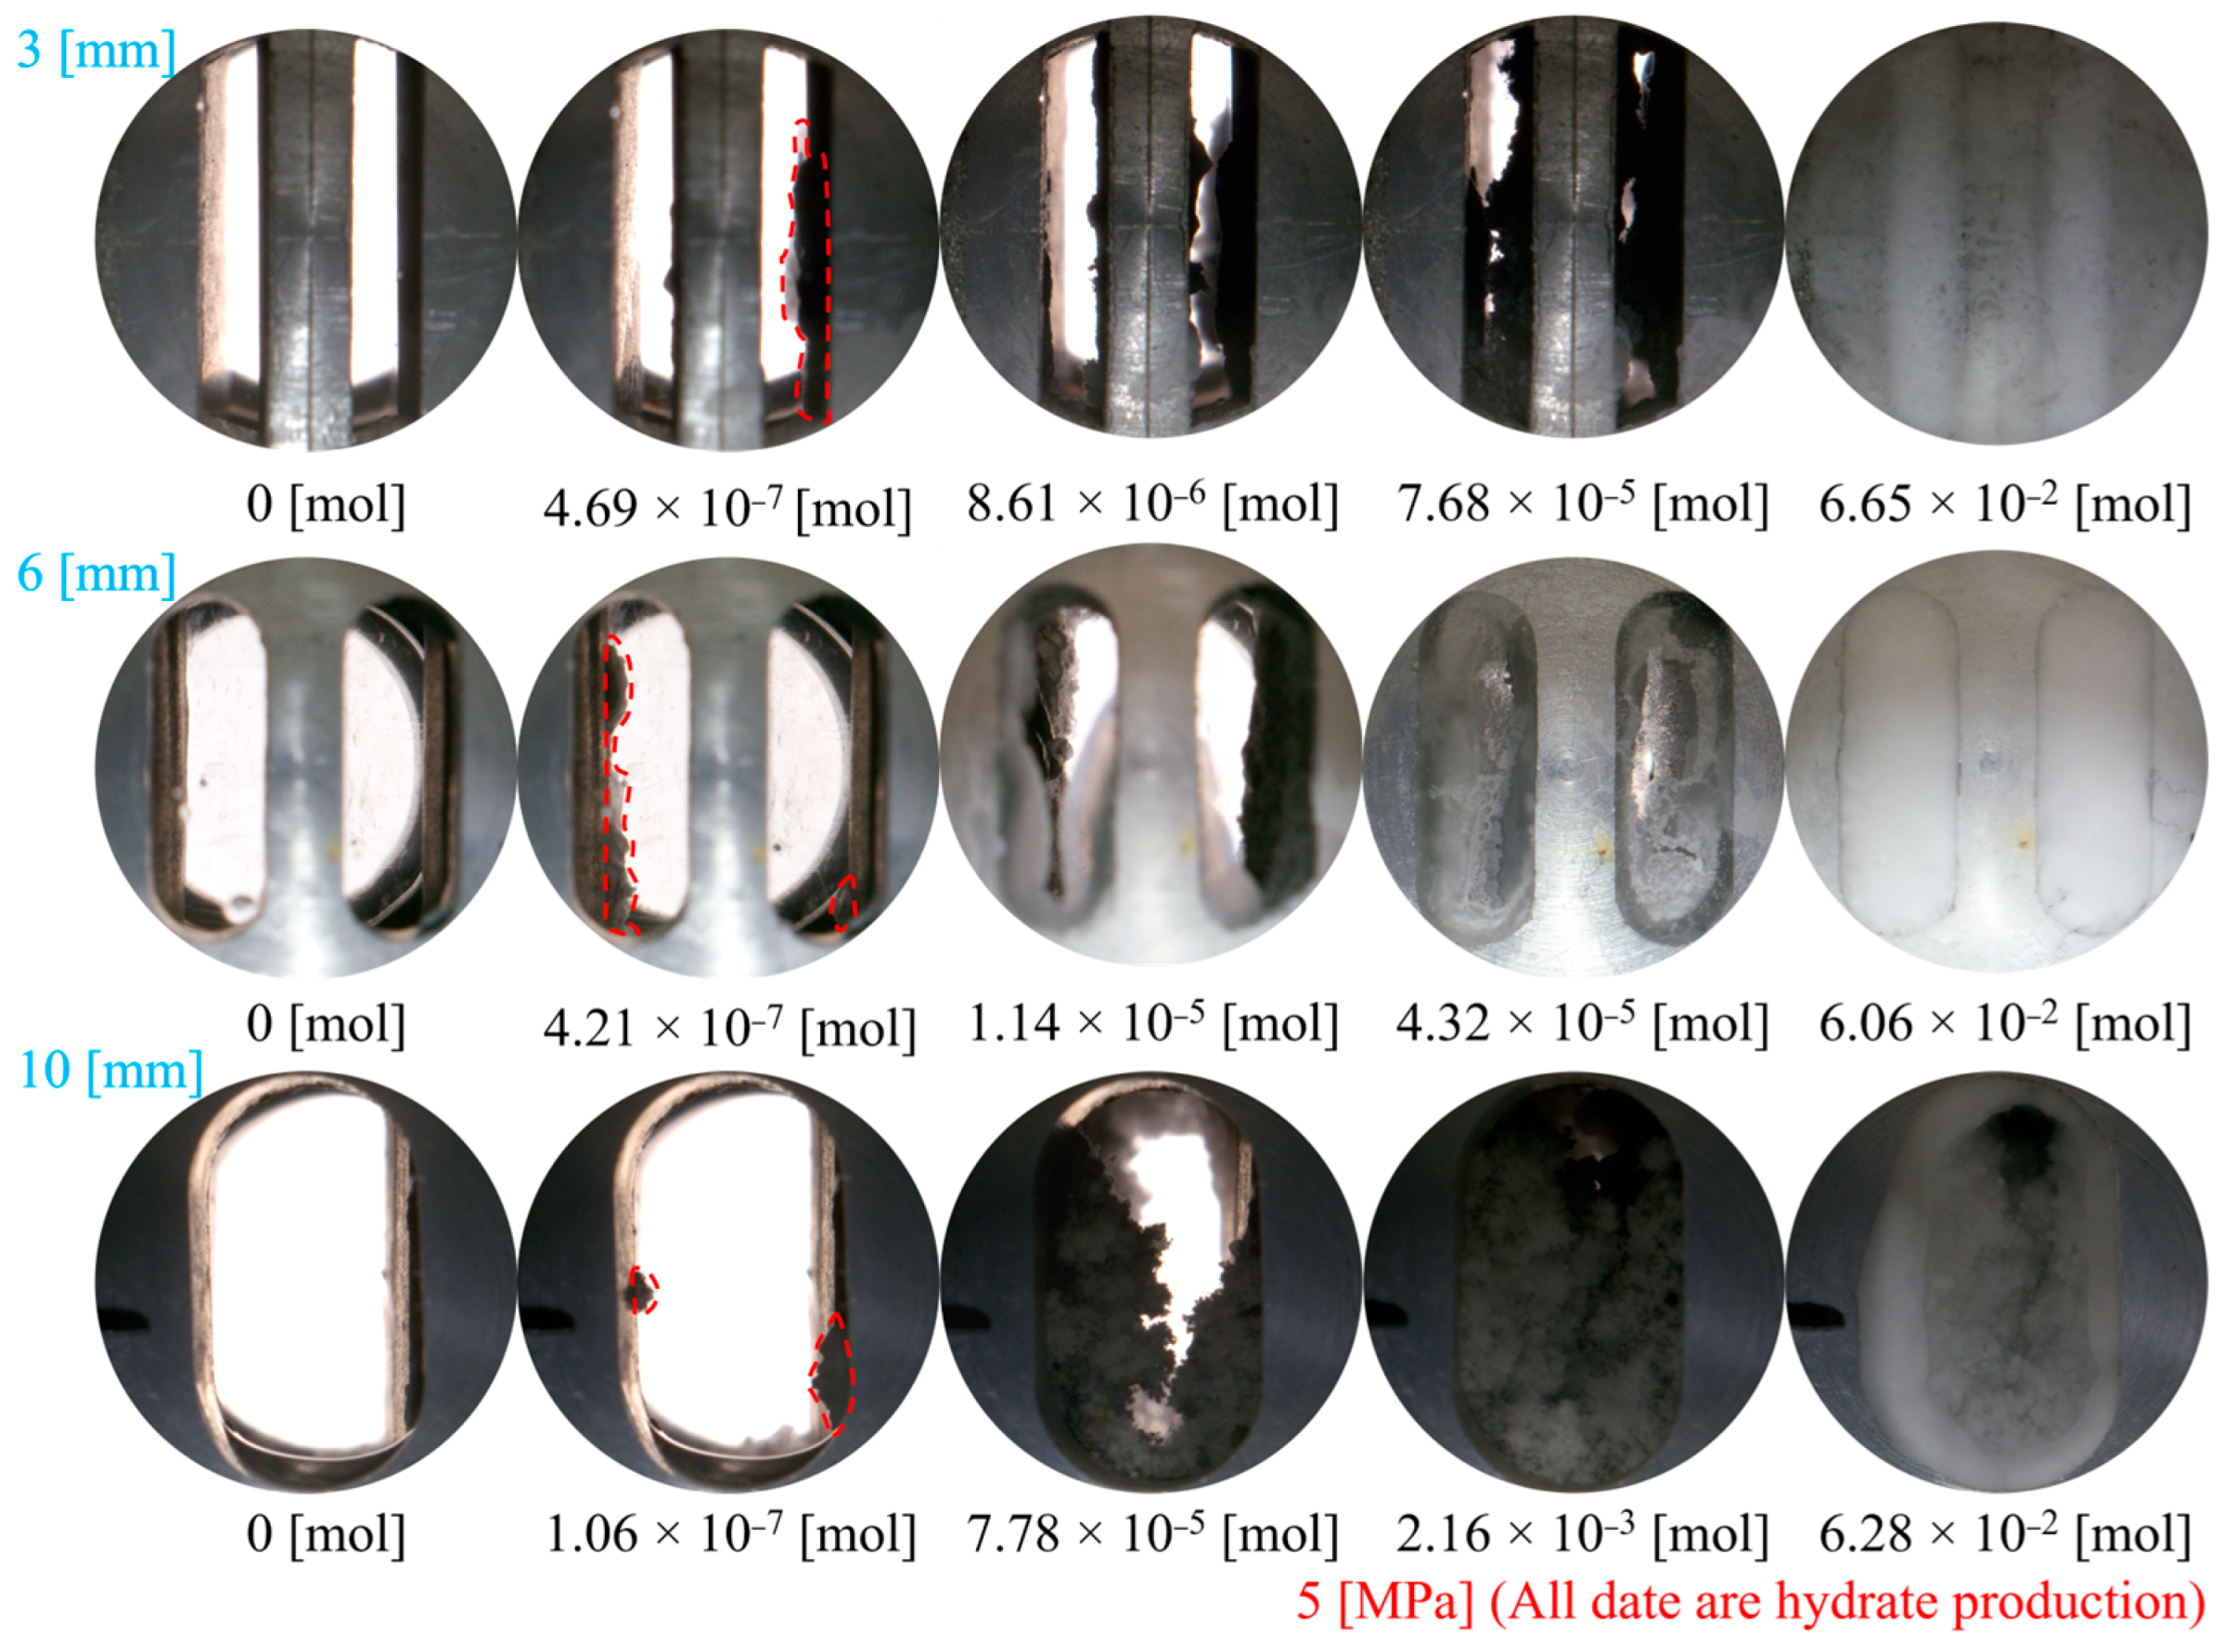
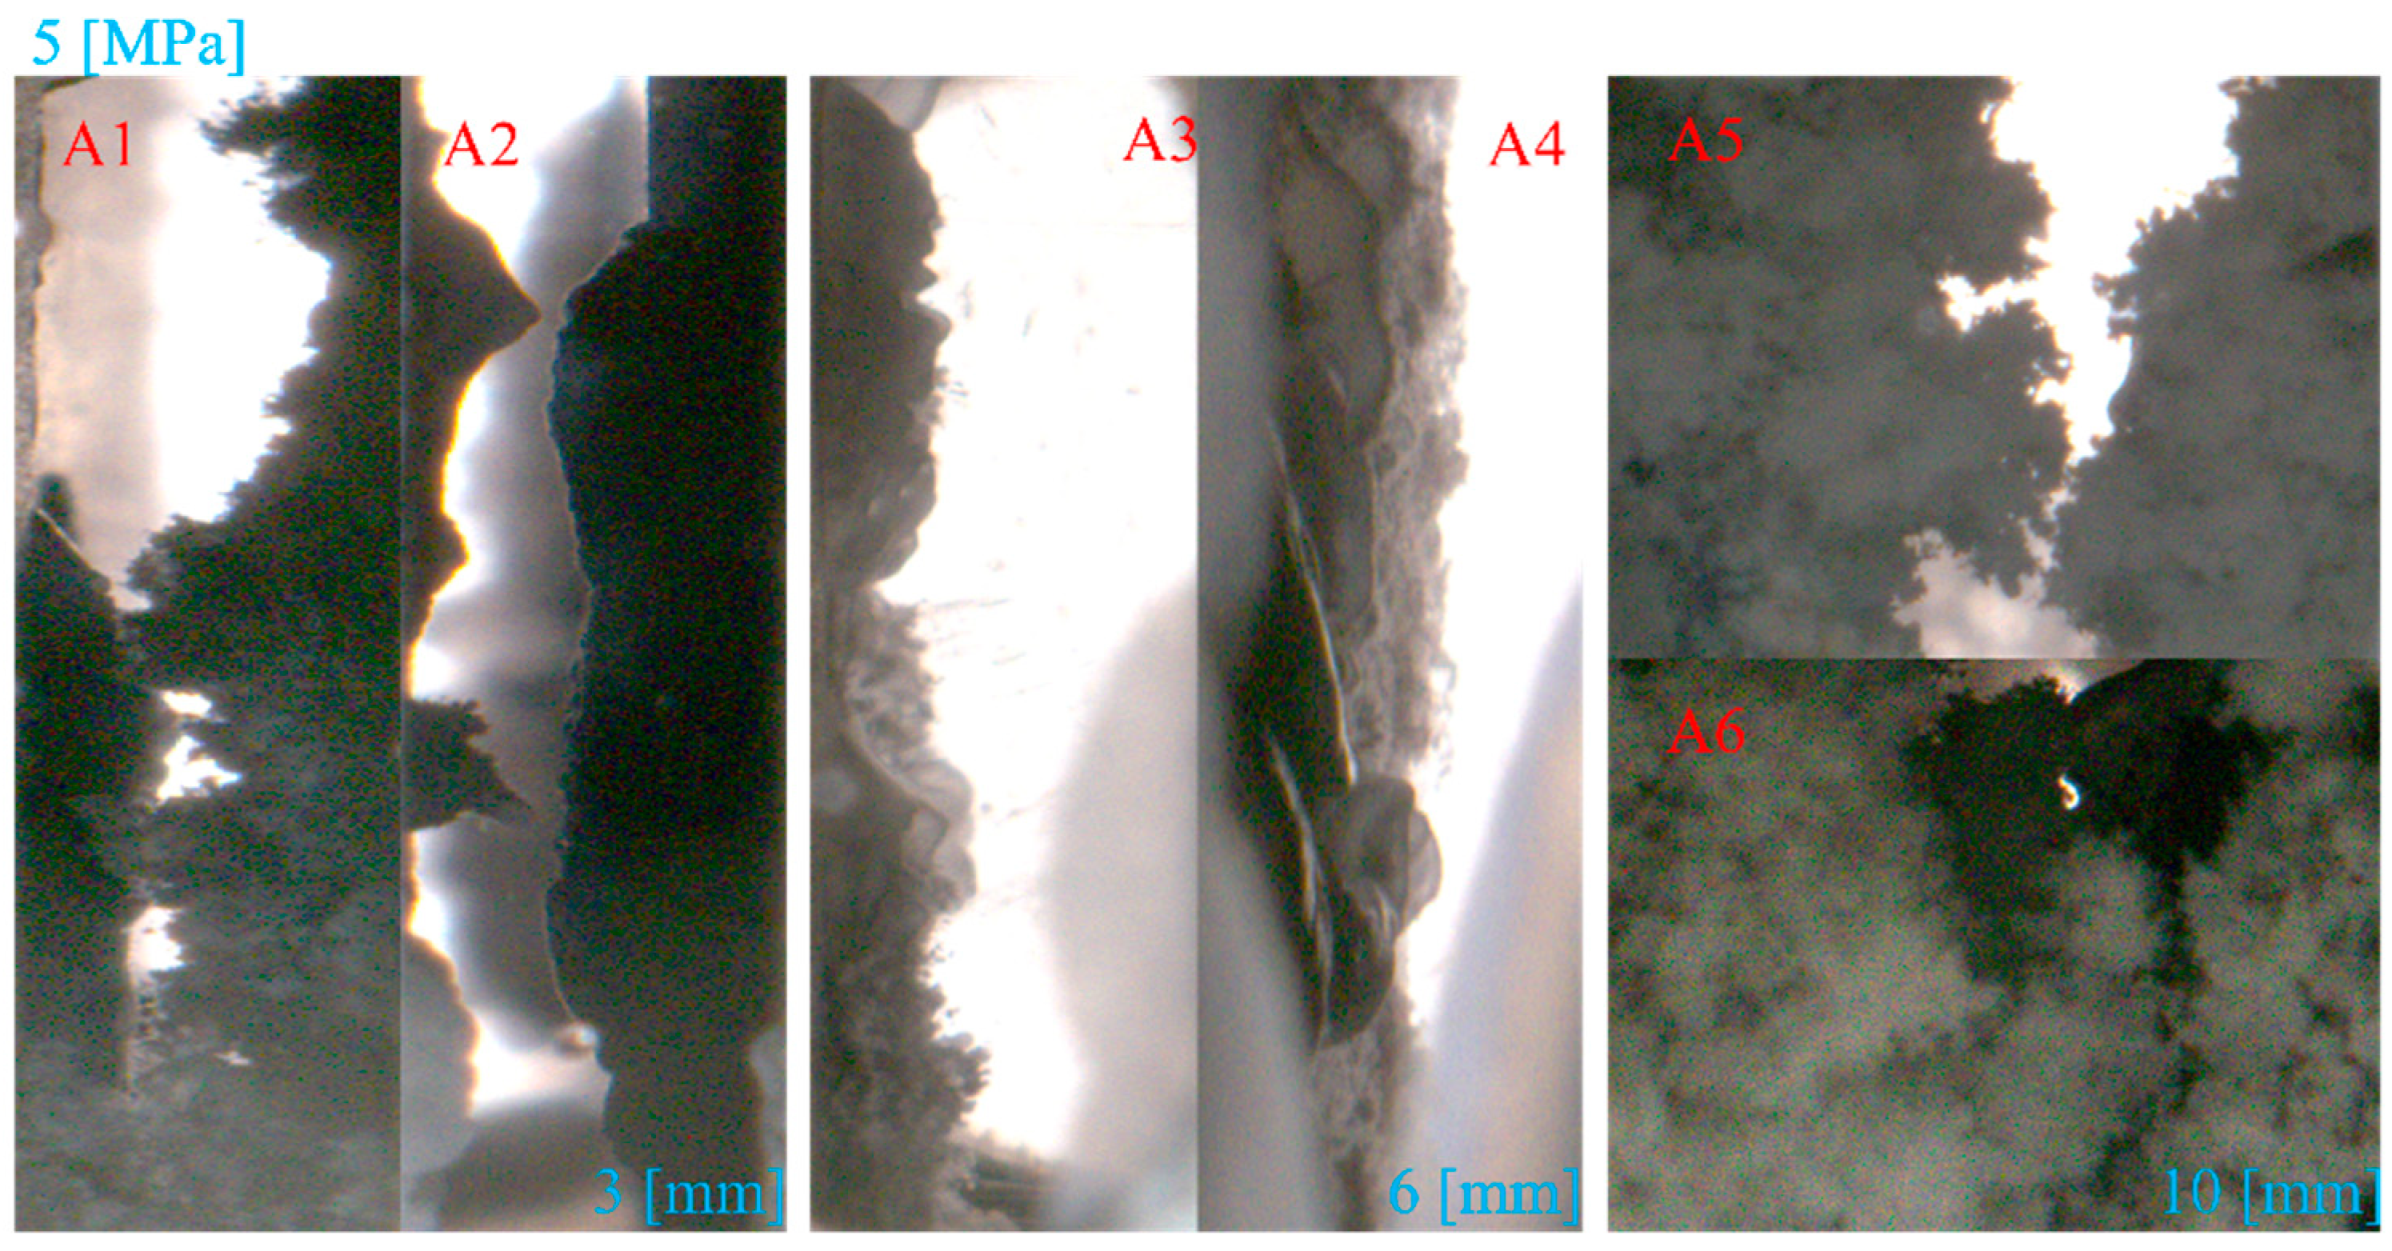
3.1.1. Effect of Fracture Width

Figure 5a presents a comparison of hydrate induction times under varying fracture width conditions. As shown in the figure, under identical pressure conditions, the hydrate induction time for Type I fractures with a 3 mm width is longer than for the other two widths. The hydrate induction time for the 3 mm fracture width is 0.539 h, whereas for the 10 mm fracture width, the induction time decreases to 0.428 h, reflecting a 20.59% reduction. This phenomenon may be attributed to the fact that the fracture width affects the gas diffusion rate and fluid flow within the fracture. In smaller widths, both gas diffusion and fluid flow are restricted, impeding the gas mass transfer process, which consequently affects the hydrate induction time. Furthermore, the crystal growth of the hydrate is restricted, resulting in smaller crystal volumes and higher specific surface areas. Under constant liquid surface tension, the more pronounced the interface interactions, the less stable the formed hydrate. However, under identical pressure conditions, the hydrate induction times for fractures with 6 mm and 10 mm widths are almost identical. This suggests that as the fracture width increases, the space required for hydrate crystal nucleation is sufficiently provided. At this point, gas diffusion is more likely to reach a balanced state, resulting in a more uniform distribution of gas and liquid within the fracture, thereby minimizing the effect of fracture width on the hydrate induction time once the threshold (6 mm) is surpassed. Furthermore, fluctuations in induction times for the 6 mm and 10 mm widths may primarily be due to the randomness of hydrate nucleation and the effect of pressure on gas solubility.
Figure 5b illustrates the total formation duration for different fracture widths. It demonstrates a trend of initially increasing, followed by a decrease as the fracture width increases. This phenomenon may be attributed to the fact that under lower pressures, the hydrate phase equilibrium is only reached, and the formation rate is inherently slower. In fractures with smaller widths (3 mm), capillary forces are more pronounced, leading to a larger gas–liquid contact area, which facilitates the gas mass transfer process, thereby promoting hydrate formation. In contrast, in fractures with larger widths, the increased fracture radius diminishes the capillary force. In this case, the total formation duration is primarily governed by gas diffusion. This hypothesis can be validated by Figure 6, where, under lower pressures, the gas consumption in the 3 mm width fracture is the highest among the three fractures, at 3.82 × 10⁻¹ mol, whereas the gas consumption in the 6 mm width fracture is the lowest, at 3.48 × 10⁻¹ mol. However, the difference in gas consumption among the three widths is relatively small.
As illustrated in Figure 7, the hydrate growth process in fractures with varying widths is quite similar. Hydrates initially form at the fracture wall and subsequently expand toward the left and right sidewalls. The hydrates come into contact, collide, and aggregate, ultimately filling the entire fracture. This occurs because, within the fissures, hydrate growth is significantly influenced by capillary effects. Capillary action draws water molecules toward the fissure surfaces, where hydrates preferentially nucleate. Notably, various morphological characteristics of the hydrate were observed under varying fracture widths, as shown in Figure 8. Furthermore, in fractures with a 3 mm width, the hydrate predominantly adopts a dense, strip-like morphology (Figure 8(A1,A2)). This is due to the narrow fracture space, which limits the development of the hydrate’s morphology, causing it to grow primarily along the fracture sidewalls, thereby forming a dense, strip-like structure. In fissures with a width of 6 mm, the increased fissure space promotes additional reactions and expansion of hydrates at the gas–liquid interface, with the morphology transitioning from a strip-like to a plate-like structure (Figure 8(A3,A4)). This transformation can be attributed to changes in the flow conditions within the fissure, which increase the contact surface between the gas and liquid. The expansion of the hydrates within the fissure is influenced by fluid dynamics, thereby facilitating the formation of plate-like hydrates. An additional increase in fissure width (10 mm) encourages a looser morphology of the hydrates, leading to the formation of a flocculent structure (Figure 8(A5,A6)). This is because, in larger fissure spaces, the diffusion of gas and water molecules becomes freer, and the formation of hydrates is no longer constrained by narrow spaces, thereby forming a more loosely structured, flocculent morphology.

3.1.2. Effect of Fracture Shape

Figure 9 illustrates a comparison of the hydrate induction time and total formation duration in Type I and Type X fractures. As shown in Figure 9a, under identical conditions, the hydrate induction time in Type X fractures is typically shorter than that in Type I fractures. This may be attributed to the relatively simple gas and liquid phase flow in Type I fractures, where the flow direction remains constant. In contrast, Type X fractures, with their relatively unique geometric structure and a greater number of gas flow pathways, exhibit more complex fluid dynamics. This may involve potential vortices or changes in the direction of the flow. These irregular variations facilitate the mixing of gas and liquid molecules, thereby increasing the gas–liquid contact area and ultimately promoting the hydrate induction process. Furthermore, as shown in Figure 9b, the duration of hydrate growth in Type X fractures exceeds that in Type I fractures. When calculating the final quantity of hydrate formation, as shown in Figure 10, it is evident that as the hydrate formation time increases, the final quantity of hydrate formation typically increases. This further highlights the role of the complex flow patterns within Type X fractures in promoting hydrate growth.
Interestingly, the growth trajectory and morphological changes of hydrates in Type X fractures also differ from those in Type I fractures. As shown in Figure 11, in Type I fractures, hydrate formation typically spreads progressively from the bottom to the top. In contrast, hydrates in Type X fractures diffuse toward the center from multiple directions. This is because, in Type I fractures, the regular fracture geometry results in a unidirectional flow of fluid, causing the gas–liquid interface to expand in a relatively linear manner. Consequently, hydrates extend from the bottom upward, forming a layered hydrate structure. Conversely, in Type X fractures, the relatively complex geometric structure and the presence of intersecting regions in the middle result in gas entering the fracture from various directions. The complex fluid motion and water molecule diffusion patterns cause the gas–liquid contact interface to expand in multiple directions, leading to a more intricate hydrate growth trajectory.

3.1.3. Effect of Roughness

This section primarily modifies the specific surface area of fractures by adhering glass sand with varying particle sizes to the fracture walls. By analyzing the hydrate induction time, total formation duration, and gas consumption curves during hydrate formation, as depicted in Figure 12, it was observed that in Type I fractures, compared to smooth fractures, an increase in the specific surface area of the fractures leads to a decrease in both the hydrate induction time and total formation duration. Furthermore, as the specific surface area decreases, both the hydrate induction time and total formation duration further decrease when the particle size of the glass sand increases from 2.5 mm to 3.5 mm. Based on Figure 13, this may be because, in smooth fractures, hydrate growth primarily depends on the infiltration of water molecules, which gradually extend upward. However, the addition of glass sand creates more irregular structures on the fracture walls, increasing the storage sites for liquid and altering the distribution of surface energy. In areas with protrusions, surface energy is higher, making these sites active locations for heterogeneous nucleation, thus promoting the induction of hydrate nucleation. However, the complex geometric structure of the rough surface also limits the diffusion of gas molecules. As a result, it was observed that as the specific surface area decreases, both the induction time and the duration of hydrate formation begin to decrease as well.
By analyzing the gas consumption curve during the hydrate formation process, as shown in Figure 12c, it was observed that, compared to smooth surfaces, an increase in the fracture surface’s specific surface area does enhance the rate of hydrate formation. Interestingly, although increasing the specific surface area promotes hydrate formation, an analysis of the final hydrate formation quantity reveals that hydrate formation on smooth surfaces reaches approximately 0.383 mol, while fractures with increased roughness show a final hydrate formation quantity in the range of 0.323–0.331 mol. Moreover, the variation in roughness does not have a significant impact on the final hydrate formation quantity. This may be due to the difficulty of heat dissipation on rough surfaces, where the continuous release of heat during hydrate formation causes local temperature increases that suppress further formation of hydrates. Additionally, the rough surface limits the mass transfer of gas, and the combined effects of these factors result in the inhibition of hydrate formation at later stages, despite the increase in the fracture’s roughness. Although the particle size of the glass sand increased from 2.5 mm to 3.5 mm, this change had little effect on local heat transfer and mass transfer processes, so the final hydrate formation quantity did not exhibit any significant changes.
Further investigation of the hydrate formation process in type X fractures with varying roughness reveals that hydrate formation is more pronounced in the raised regions. Additionally, multiple data points from the Type X fractures exhibit patterns similar to those of the Type I fractures, as shown in Figure 14. The duration of hydrate formation decreases as smooth fractures are replaced by rough fractures, and increasing the fracture’s specific surface area leads to a reduction in the final quantity of hydrate formation. However, unlike the Type I fractures, the hydrate induction time in Type X fractures is significantly prolonged after increasing the roughness. The cause of this phenomenon can be attributed to the inherent instability of gas flow within the Type X fractures. When the fracture’s specific surface area increases, this instability is amplified, causing the gas flow and its interaction with water molecules to become increasingly disordered. This may even lead to localized gas accumulation or the formation of flow dead zones, which, in turn, extend the hydrate induction time.

3.2. Hydrate Dissociation

As shown in Figure 15, during the early stages of hydrate dissociation in fractures with varying widths, dissociation initiates at the surface in contact with the fracture and gradually propagates inward. This may result from the higher thermal conductivity of the solid, which preferentially triggers hydrate dissociation. As dissociation progresses, the morphology of the hydrate becomes irregular, especially as the fracture width increases. This phenomenon is more pronounced in wider fractures, which may be attributed to the more uniform heat transfer in narrower fractures, where heat diffuses from the fracture walls toward the interior. This leads to the formation of residual hydrate distributions that resemble the shape of the fracture cavity. In contrast, in wider fractures, due to the larger cavity volume, heat diffusion is uneven, and the hydrate dissociates more in the hotspot areas, resulting in irregular residual hydrate formations. Upon examining the microscopic morphology of the residual hydrate, a wave-like undulating surface is observed, as shown in Figure 16. This may result from the uneven pressure gradient changes inside the fracture, where hydrate dissociation occurs more slowly in areas of higher pressure and more quickly in areas of lower pressure. Additionally, temperature gradient variations induced by hydrate dissociation further accelerate the development of this phenomenon.
Furthermore, hydrate dissociation is more significantly influenced by the fracture width. In narrower fractures, the hydrate possesses a larger specific surface area, and its thermal conductivity is more effective. In this case, thermal transfer efficiency dominates, which explains why the gas production rate is the highest in fractures with a 3 mm width, resulting in the production of 0.34 mol of gas. Additionally, when the gas production region gradually reaches equilibrium, residual hydrates continue to be observed in the fracture beneath the window (as shown in Figure 15(D1–D3,E1–E3)). This suggests that, during the dissociation process, hydrates exhibit a self-protective effect, which is consistent with previous studies [53].
The changes in environmental temperature during hydrate dissociation are analyzed, as shown in Figure 17. It was observed that the temperature initially increased briefly and then decreased rapidly. This phenomenon may be attributed to the endothermic process during the early stage of hydrate dissociation, in which the released water rapidly freezes at low temperatures, releasing heat and forming concentrated thermal energy. Additionally, the gas produced during hydrate dissociation may expand and contract, potentially causing localized temperature increases. As the dissociation process progresses, the released methane and water molecules transport heat away from the surrounding environment. Meanwhile, heat exchange between the system and its local environment further reduces the overall temperature. Therefore, the temperature rapidly decreases after a brief increase.

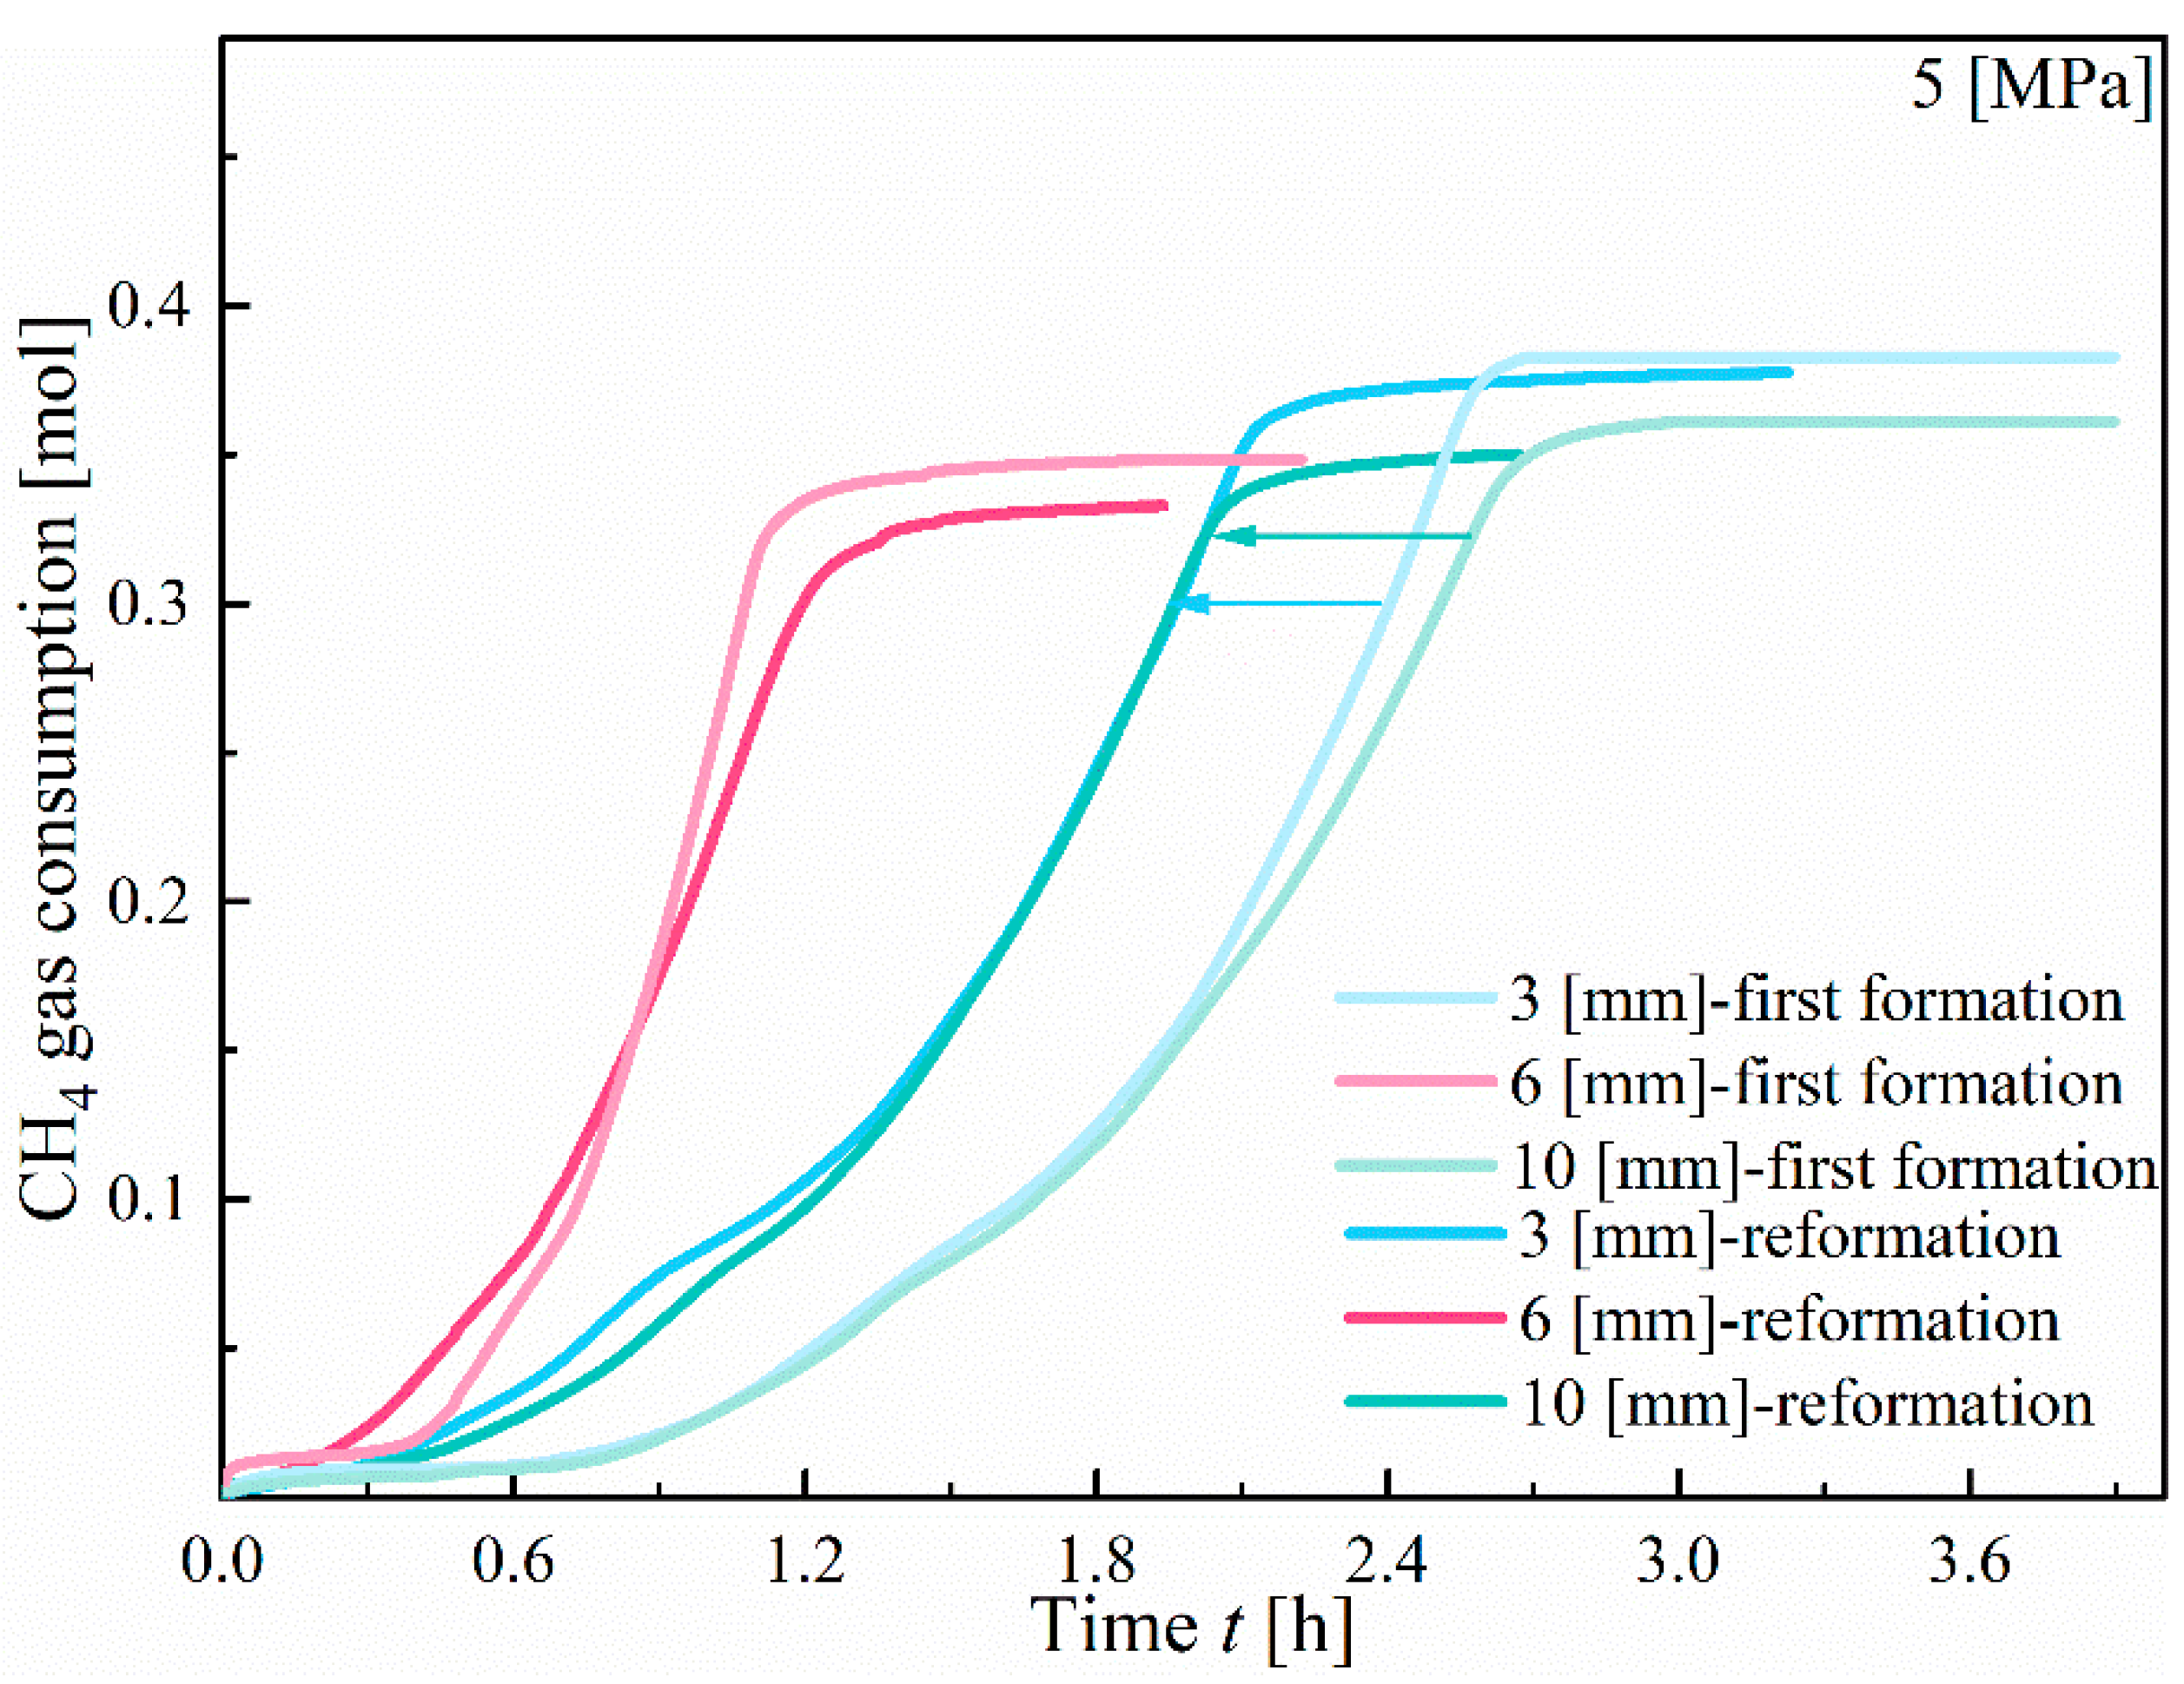
3.3. Hydrate Reformation

As shown in Figure 18, comparing hydrate induction times during hydrate first formation and reformation stages reveals that the induction time for the hydrate first formation is significantly longer than that for hydrate reformation under all conditions. This is consistent with previous research findings [48]. This difference may be attributed to the persistence of crystal nuclei structures at their original locations following hydrate dissociation. During the hydrate reformation stage, these residual nuclei are reactivated, promoting the rapid formation of hydrates. Figure 19 also demonstrates that hydrates preferentially form in the original hydrate region, illustrating the “memory effect” described in earlier studies [54]. Furthermore, hydrate induction times for CH4 under varying fracture widths continue to follow the trend observed during the initial formation stage. Specifically, the induction time is the longest at a fracture width of 3 mm, followed by 10 mm, and the shortest at 6 mm, further confirming the consistency of earlier findings. This suggests that hydrate formation is most favorable at a fracture width of 6 mm.
Simultaneously, an observation of the gas consumption curves in Figure 20 reveals that the hydrate formation rate during the reformation process is faster than during the first formation stage under all conditions. This phenomenon can be attributed to two primary factors. On the one hand, it could be attributed to the previously mentioned “memory effect.” On the other hand, this may be due to a greater quantity of dissolved gas remaining in the liquid phase following depressurization and dissociation. When the temperature is increased to reformation, the hydrate, gas, and liquid molecules combine more thoroughly, leading to a faster formation rate. Additionally, the dissociation of the hydrate may alter the surface tension and free energy of the liquid in the system, thereby facilitating the formation of stable hydrate structures through their combination with gas molecules. A further comparison of the gas consumption curves for hydrate first formation and reformation reveals that the final quantity of hydrate formed during the first formation, across different fracture widths, is higher than that formed during the reformation under identical conditions. This may be attributed to the inherent limitation of CH4 hydrate solubility. Consequently, at lower pressures, it cannot efficiently combine with the liquid phase. Moreover, the faster formation rate during reformation could cause clogging in the gas mass transfer process, thereby affecting the overall hydrate formation.

4. Conclusions

This study conducted in situ experiments on the formation, dissociation, and secondary formation of CH4 hydrates in sandstone fractures. It analyzed the effects of fracture width, shape, roughness, and other factors on the hydrate induction time, total formation duration, gas consumption, as well as on kinetic and morphological characteristics of hydrate formation, and explored the influence of factors related to dissociation and hydrate reformation. The specific conclusions are as follows:
(1)
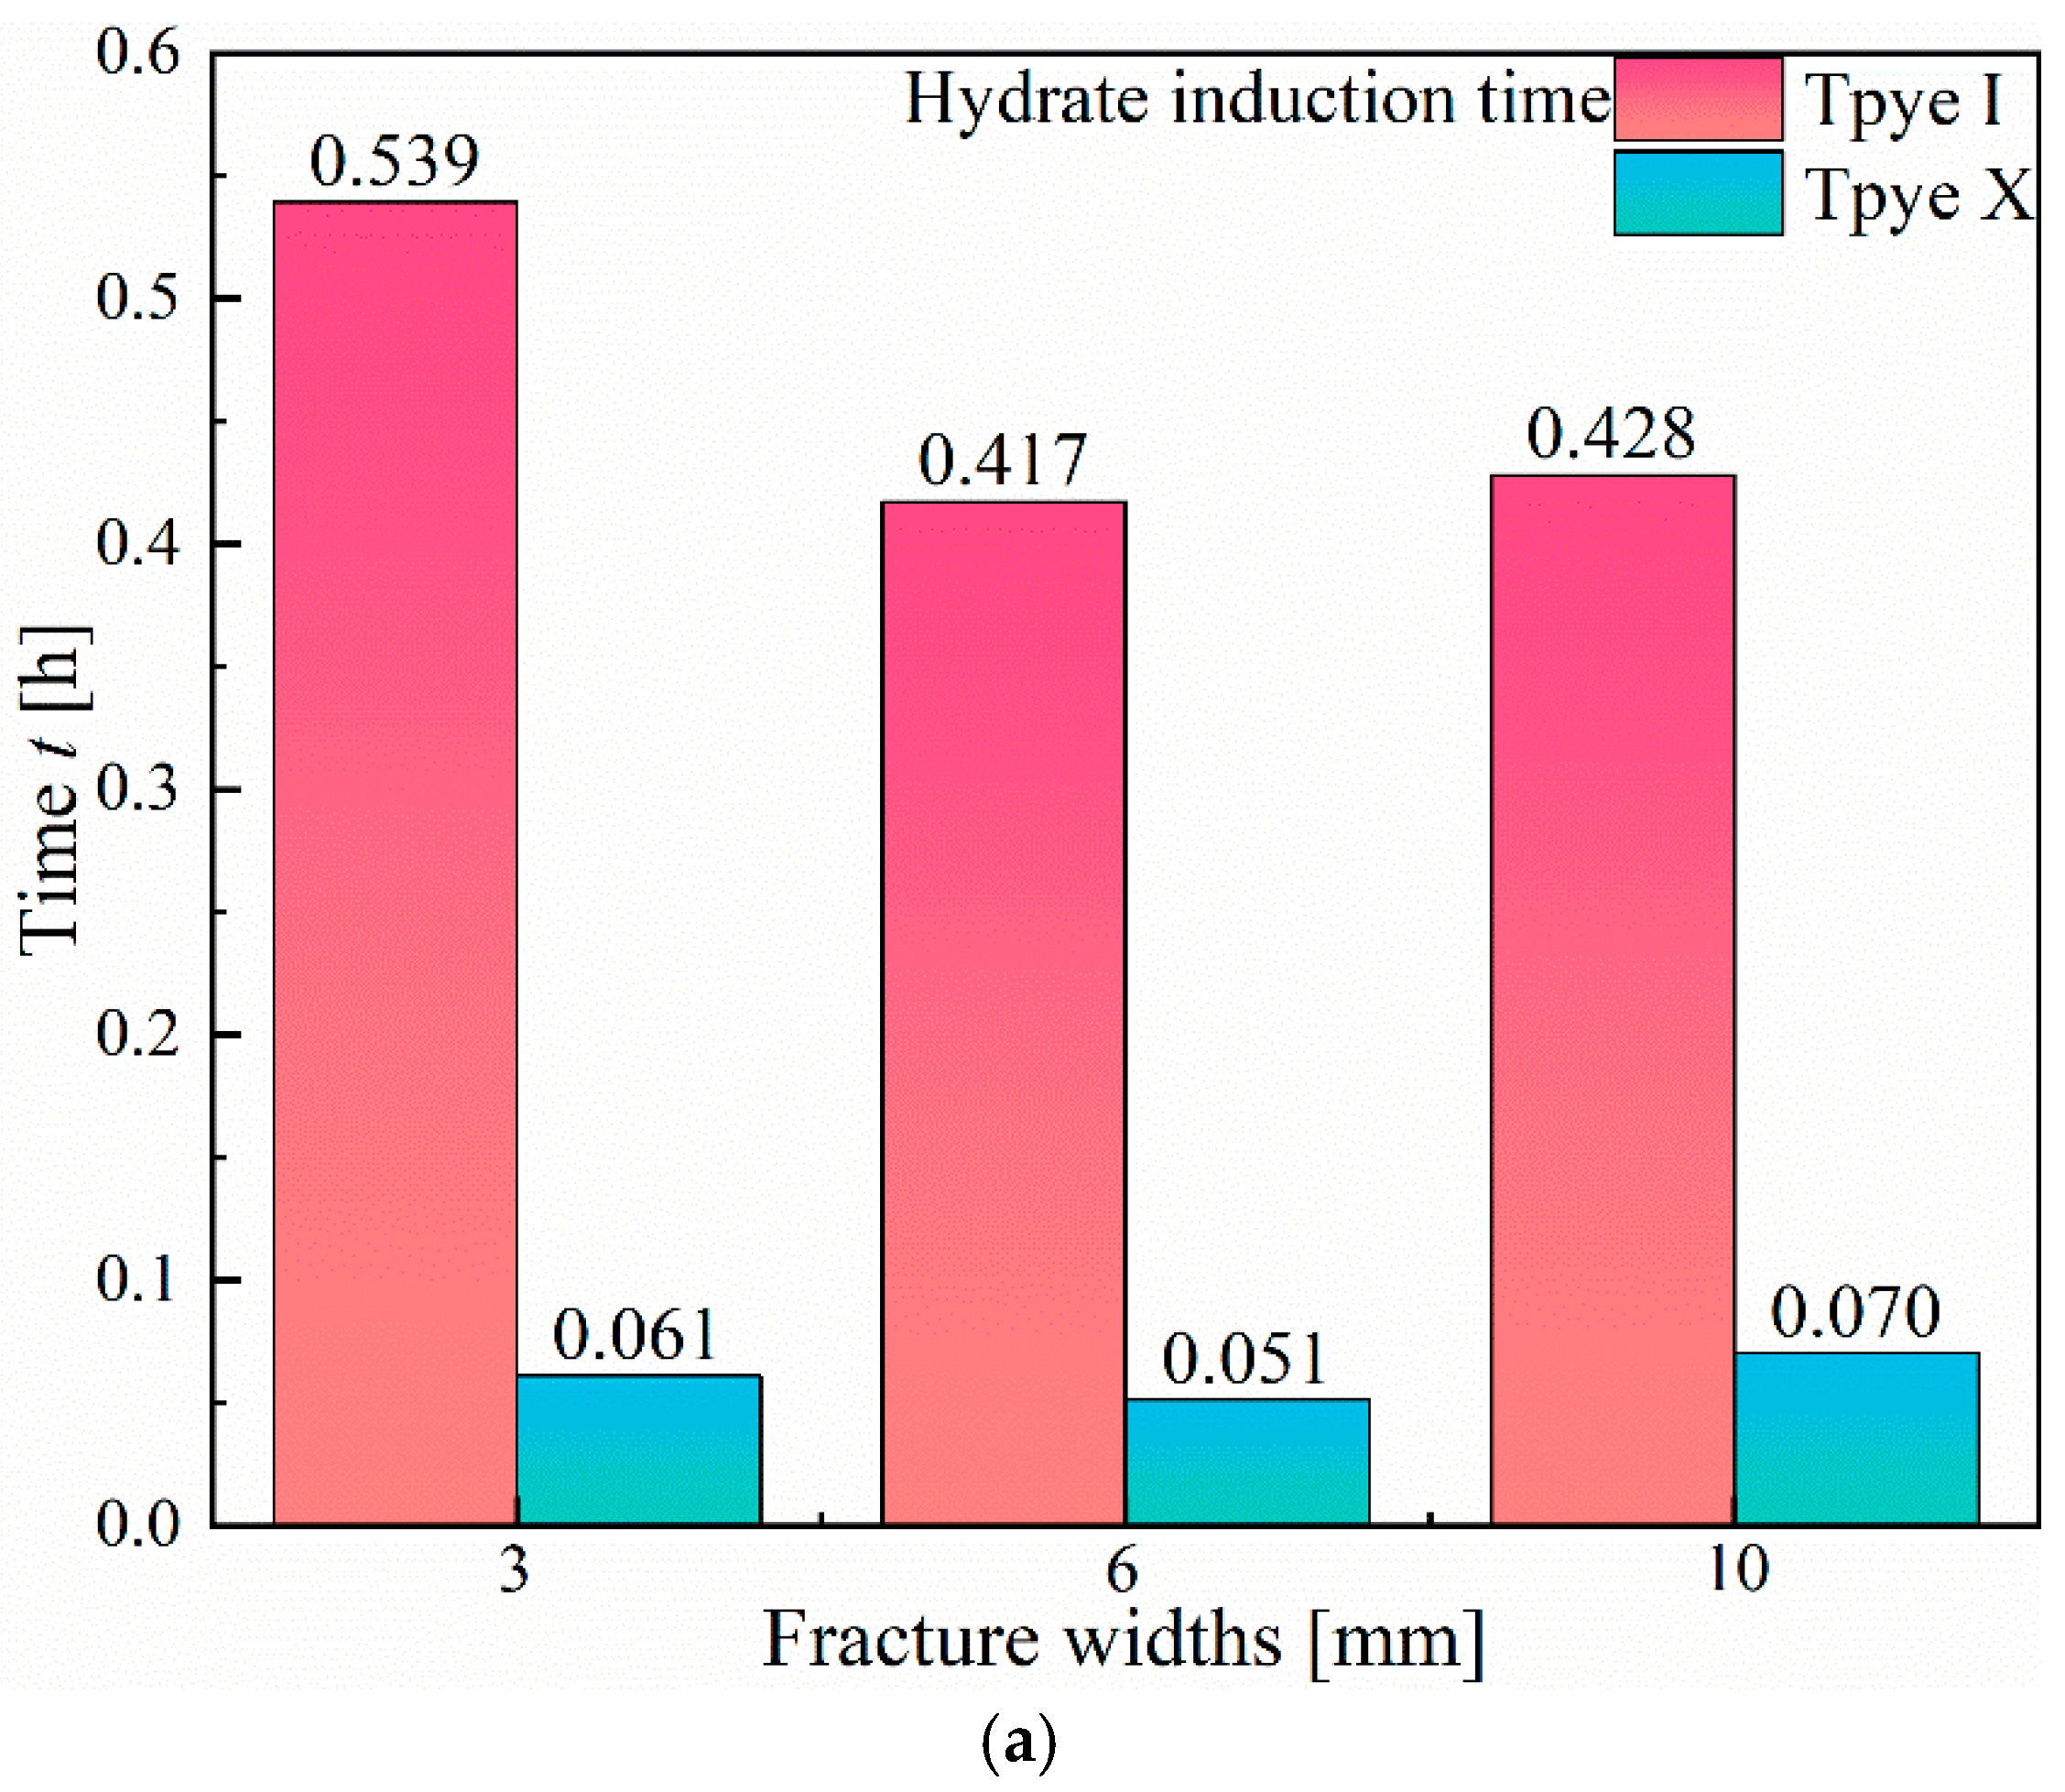
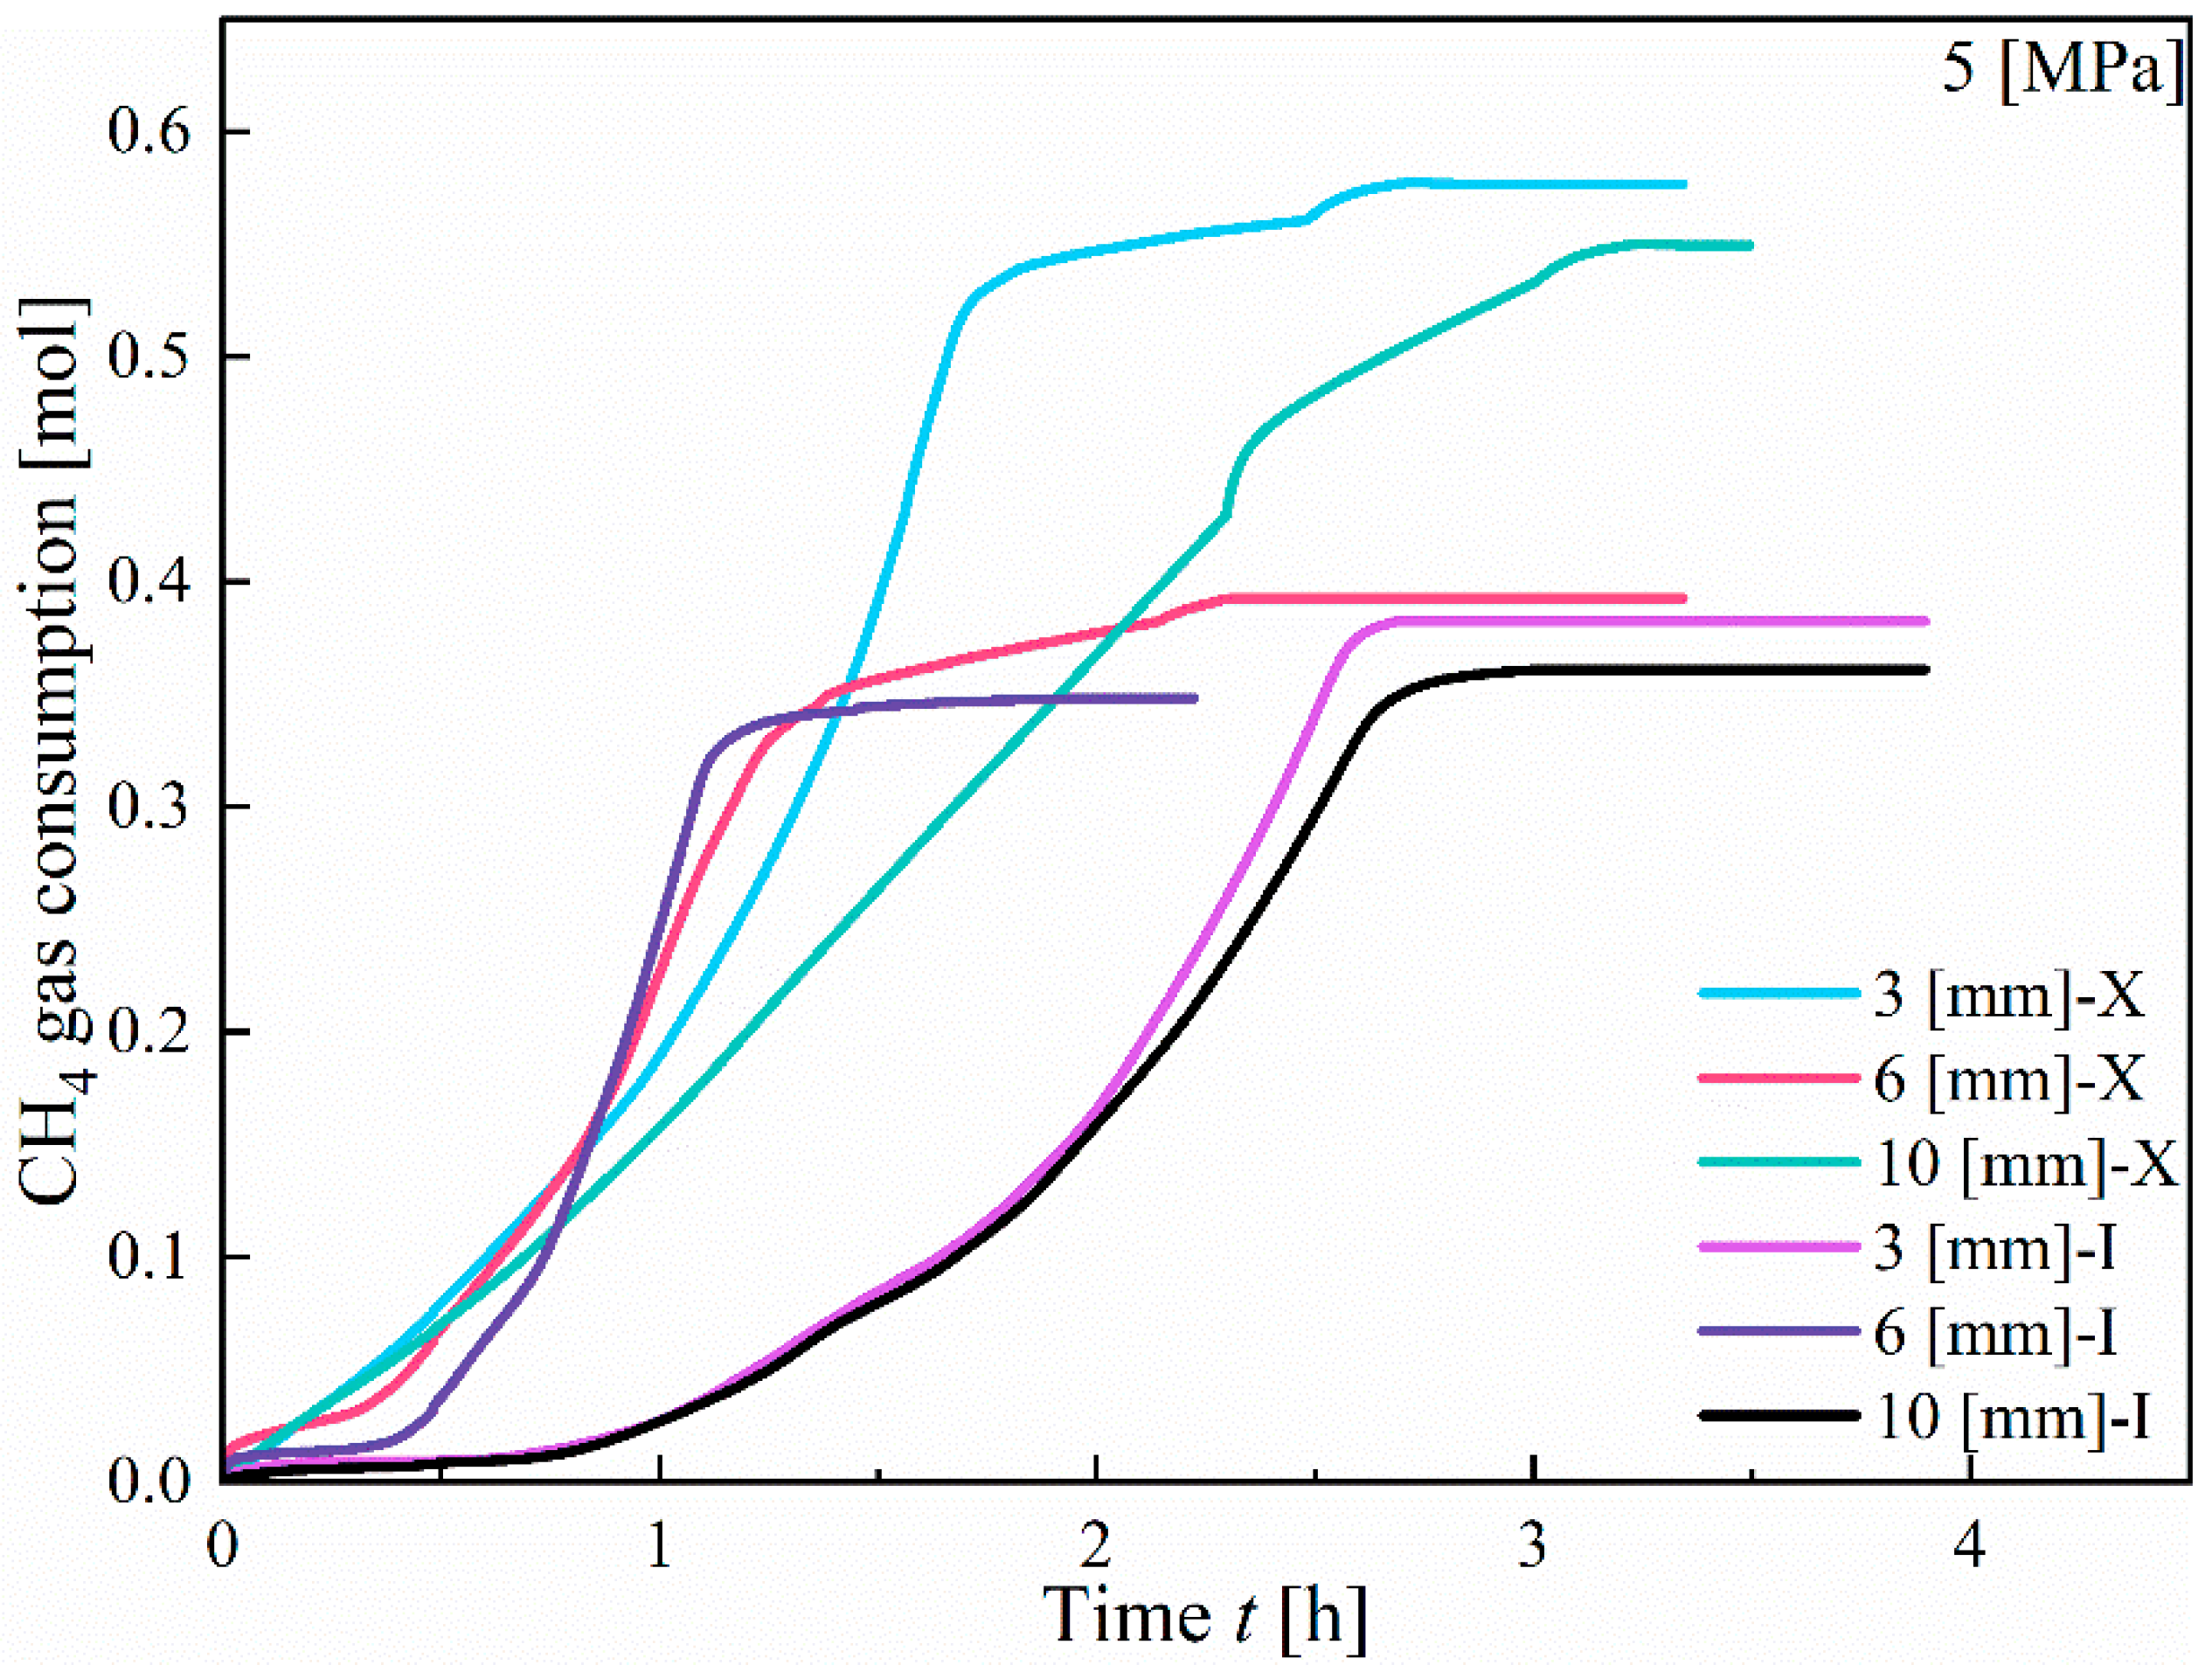
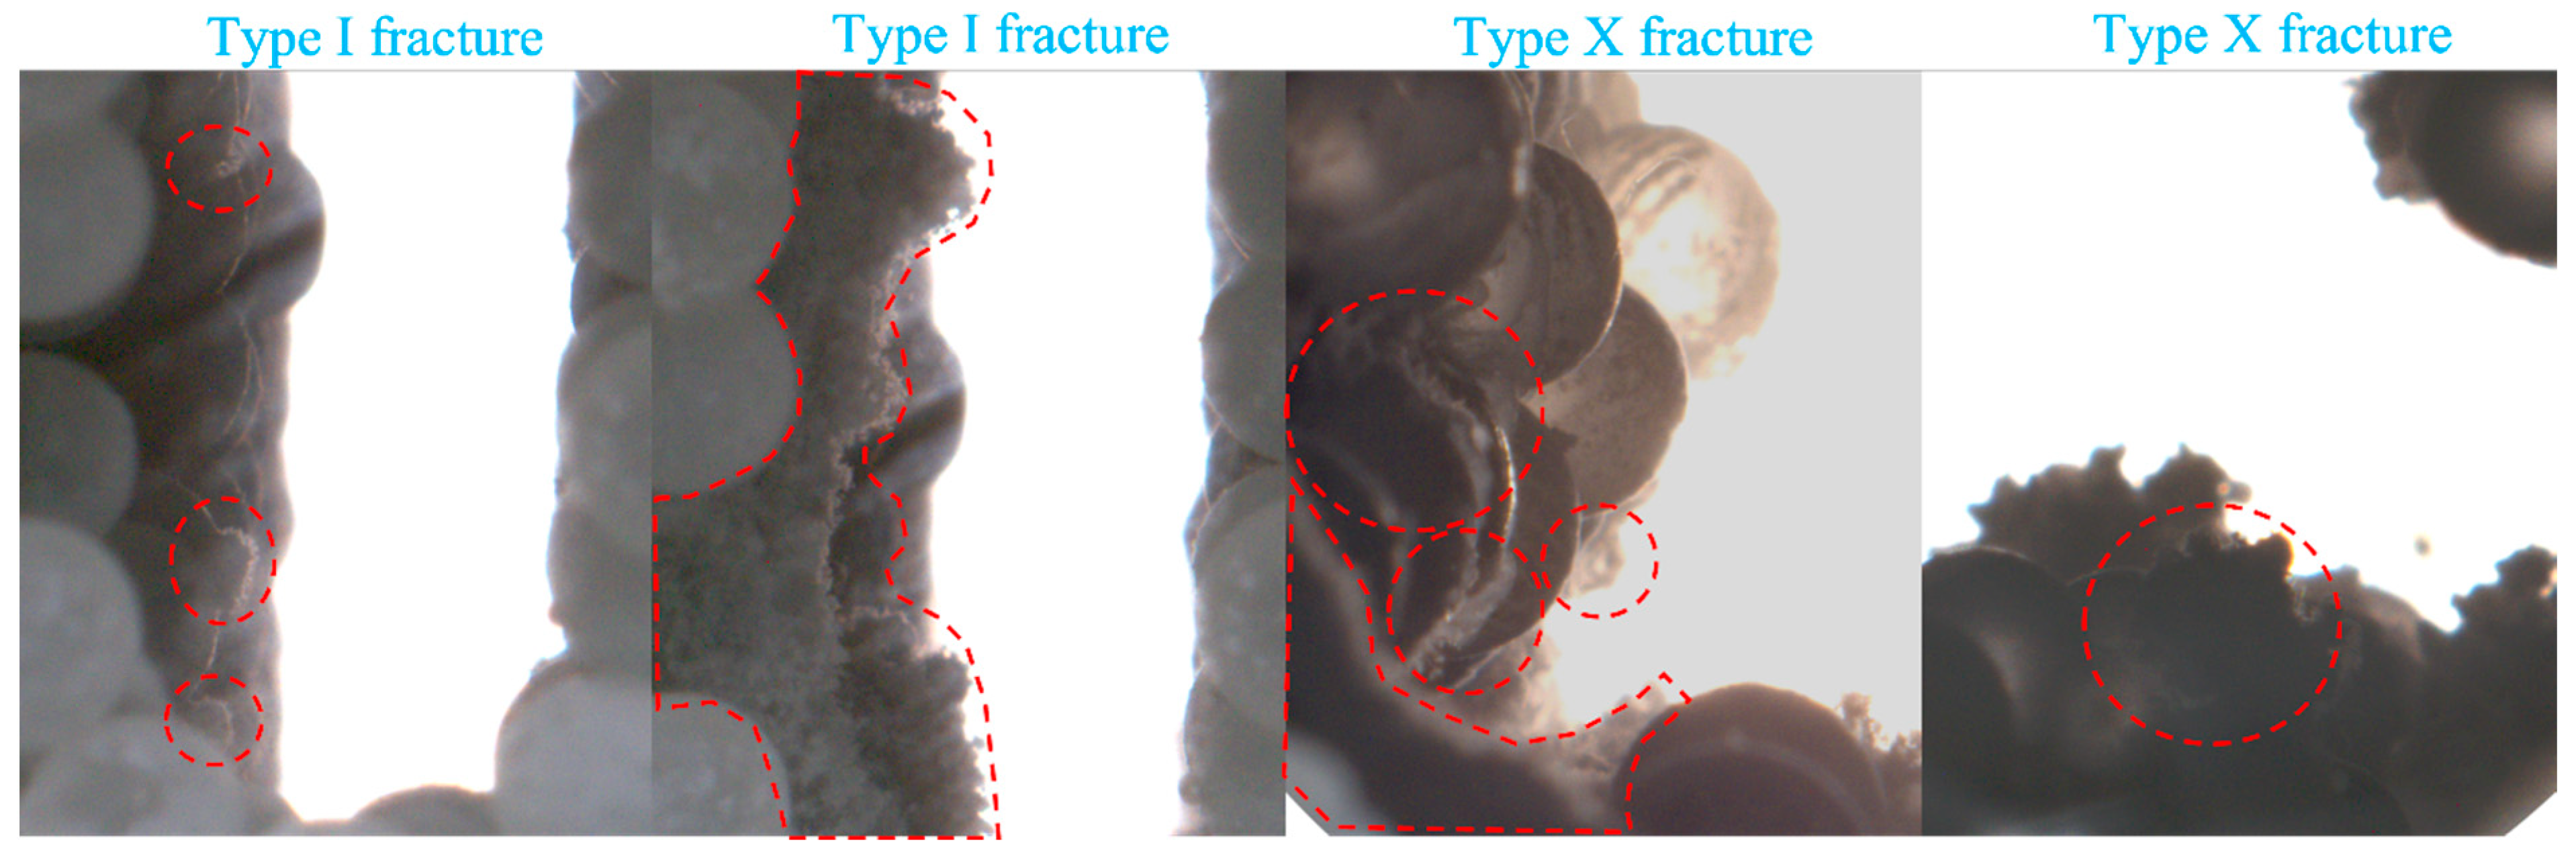
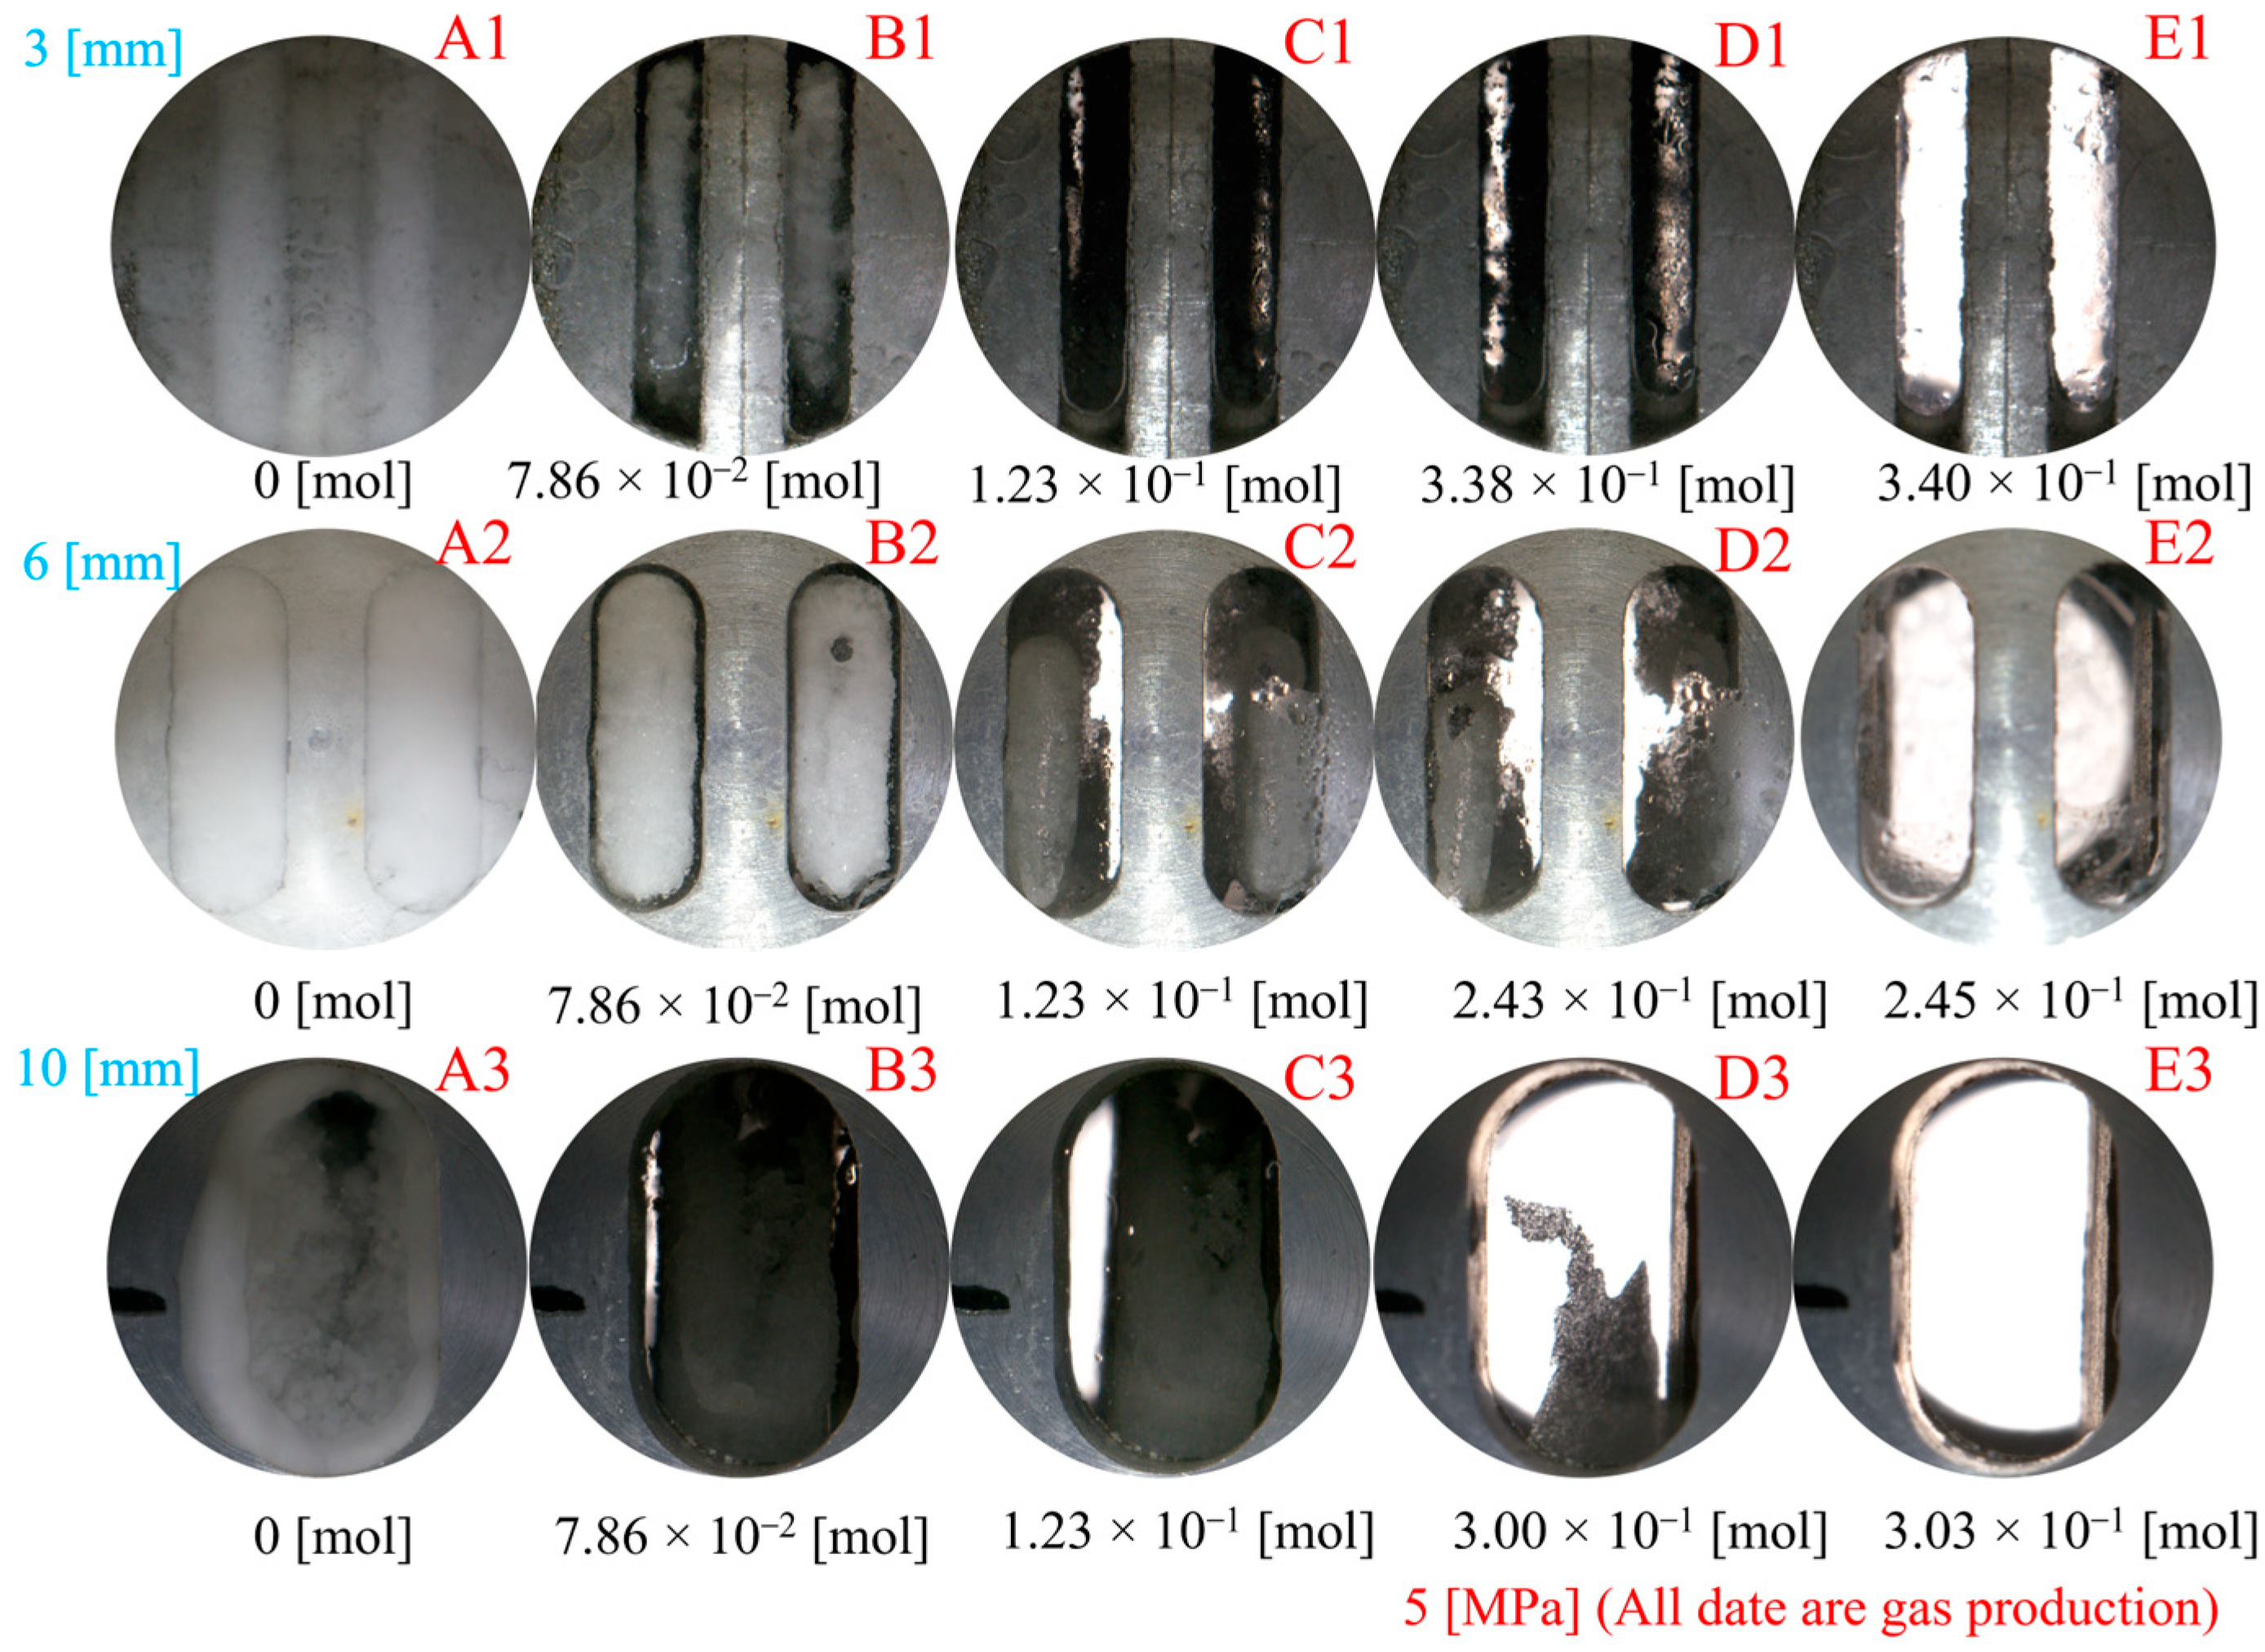
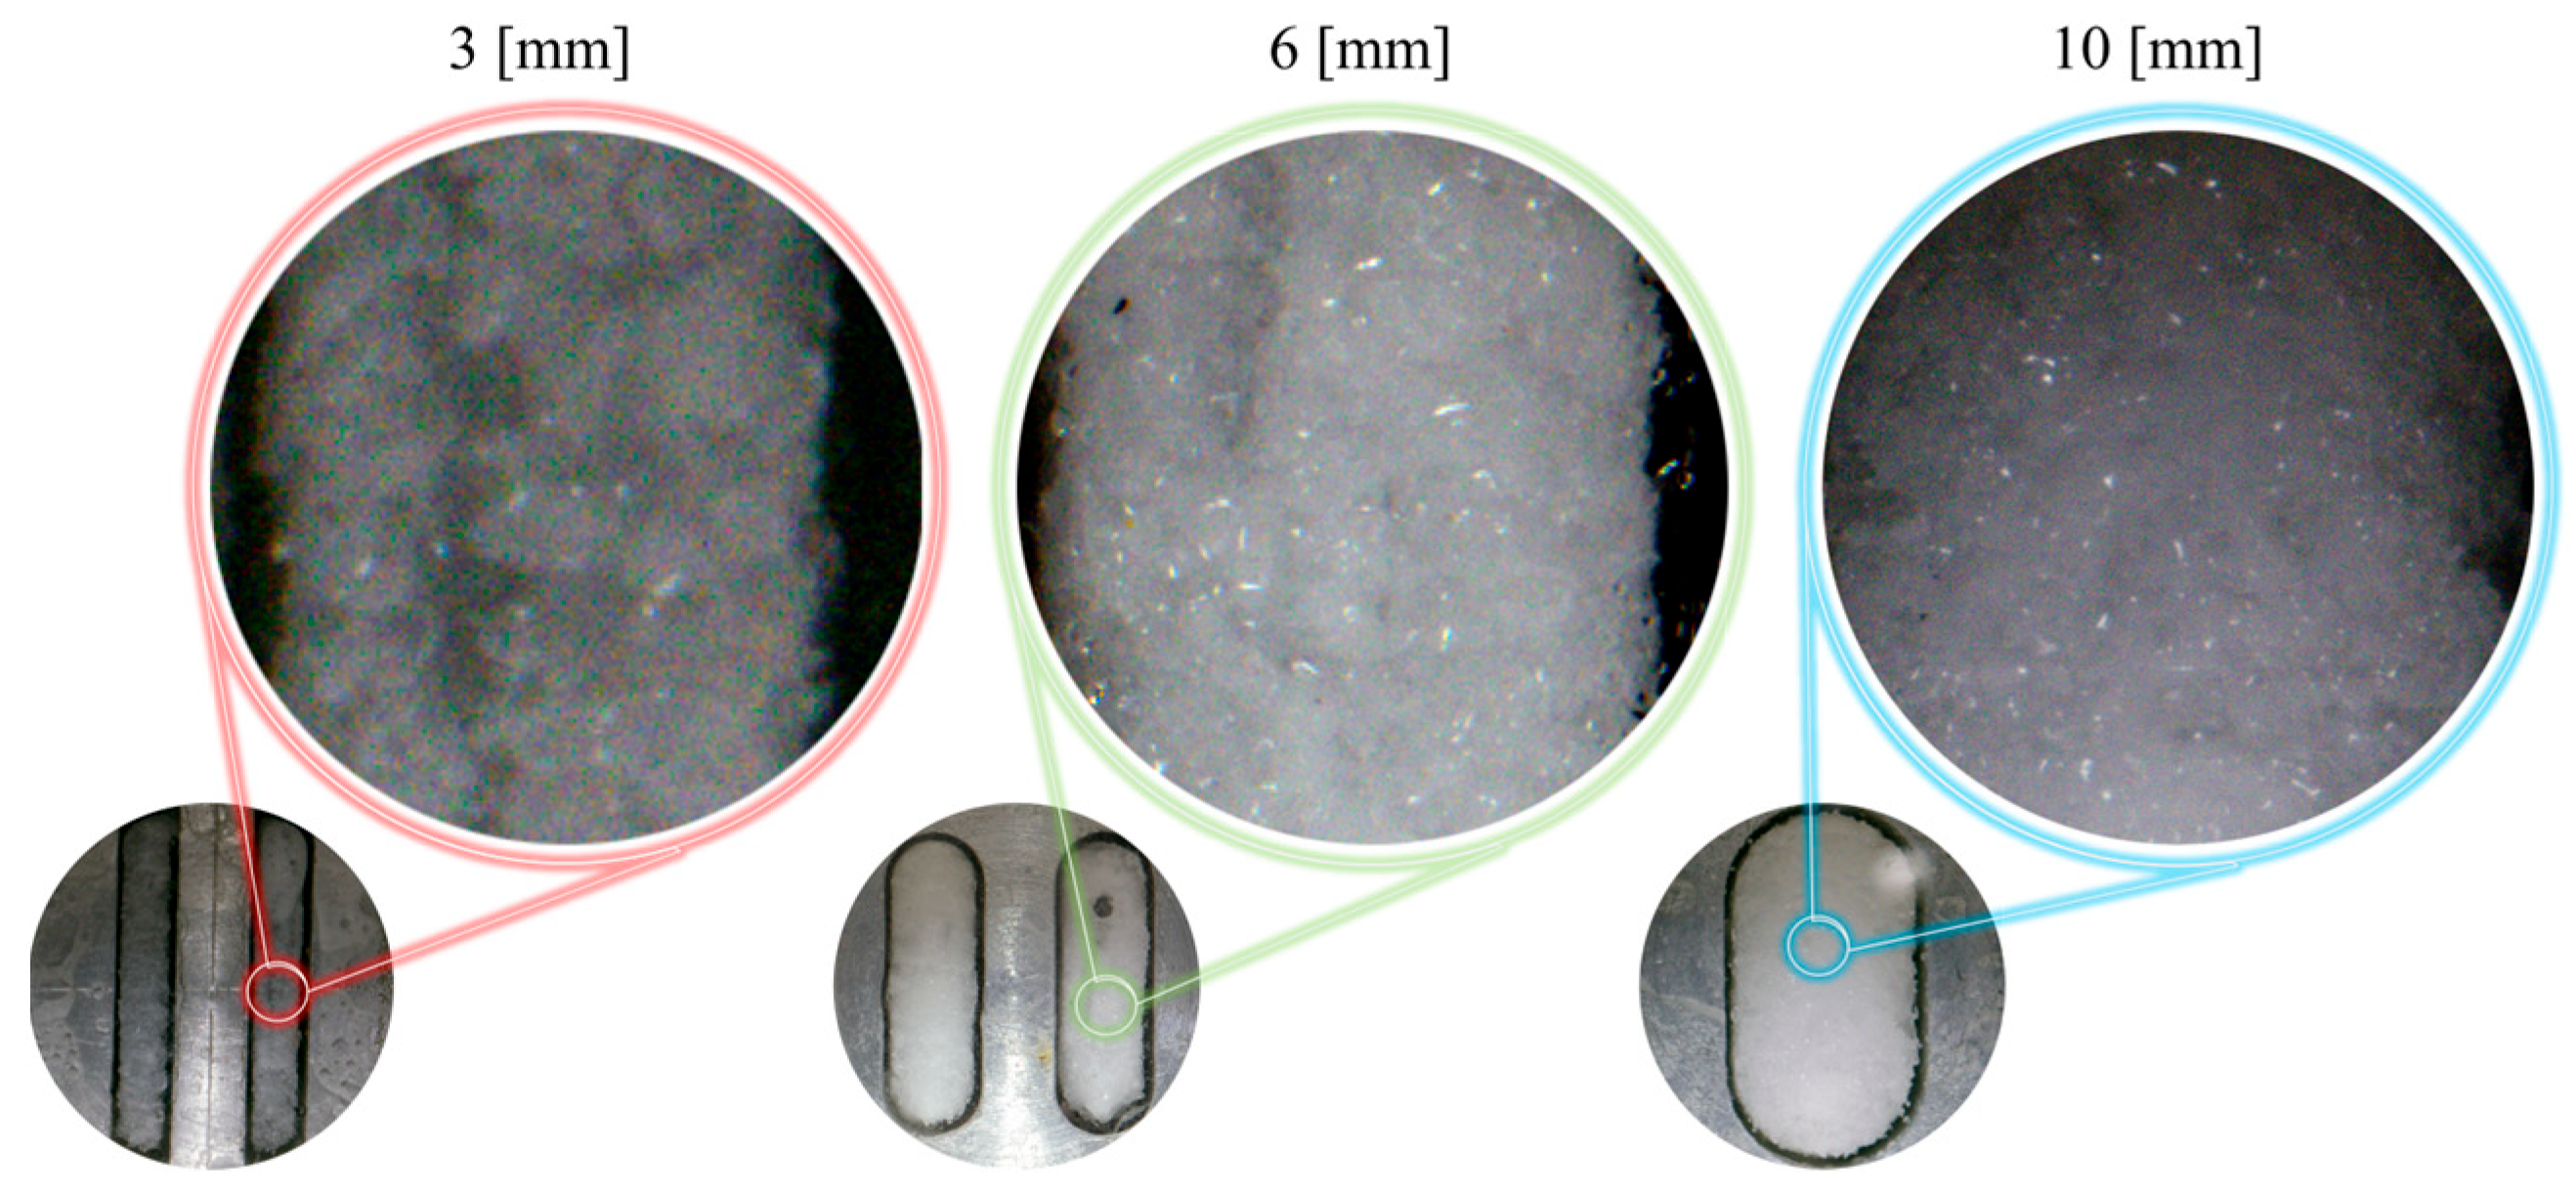
In Type I fractures, under 3 mm fracture width conditions, the hydrate induction time is longer than those under the other two fracture width conditions, with a larger gas consumption of 3.82 × 10⁻¹ mol. However, the differences in gas consumption among the three types of fractures are not significant. Hydrates preferentially form on the fracture wall and gradually expand to both the left and right side walls of the fracture.
(2)
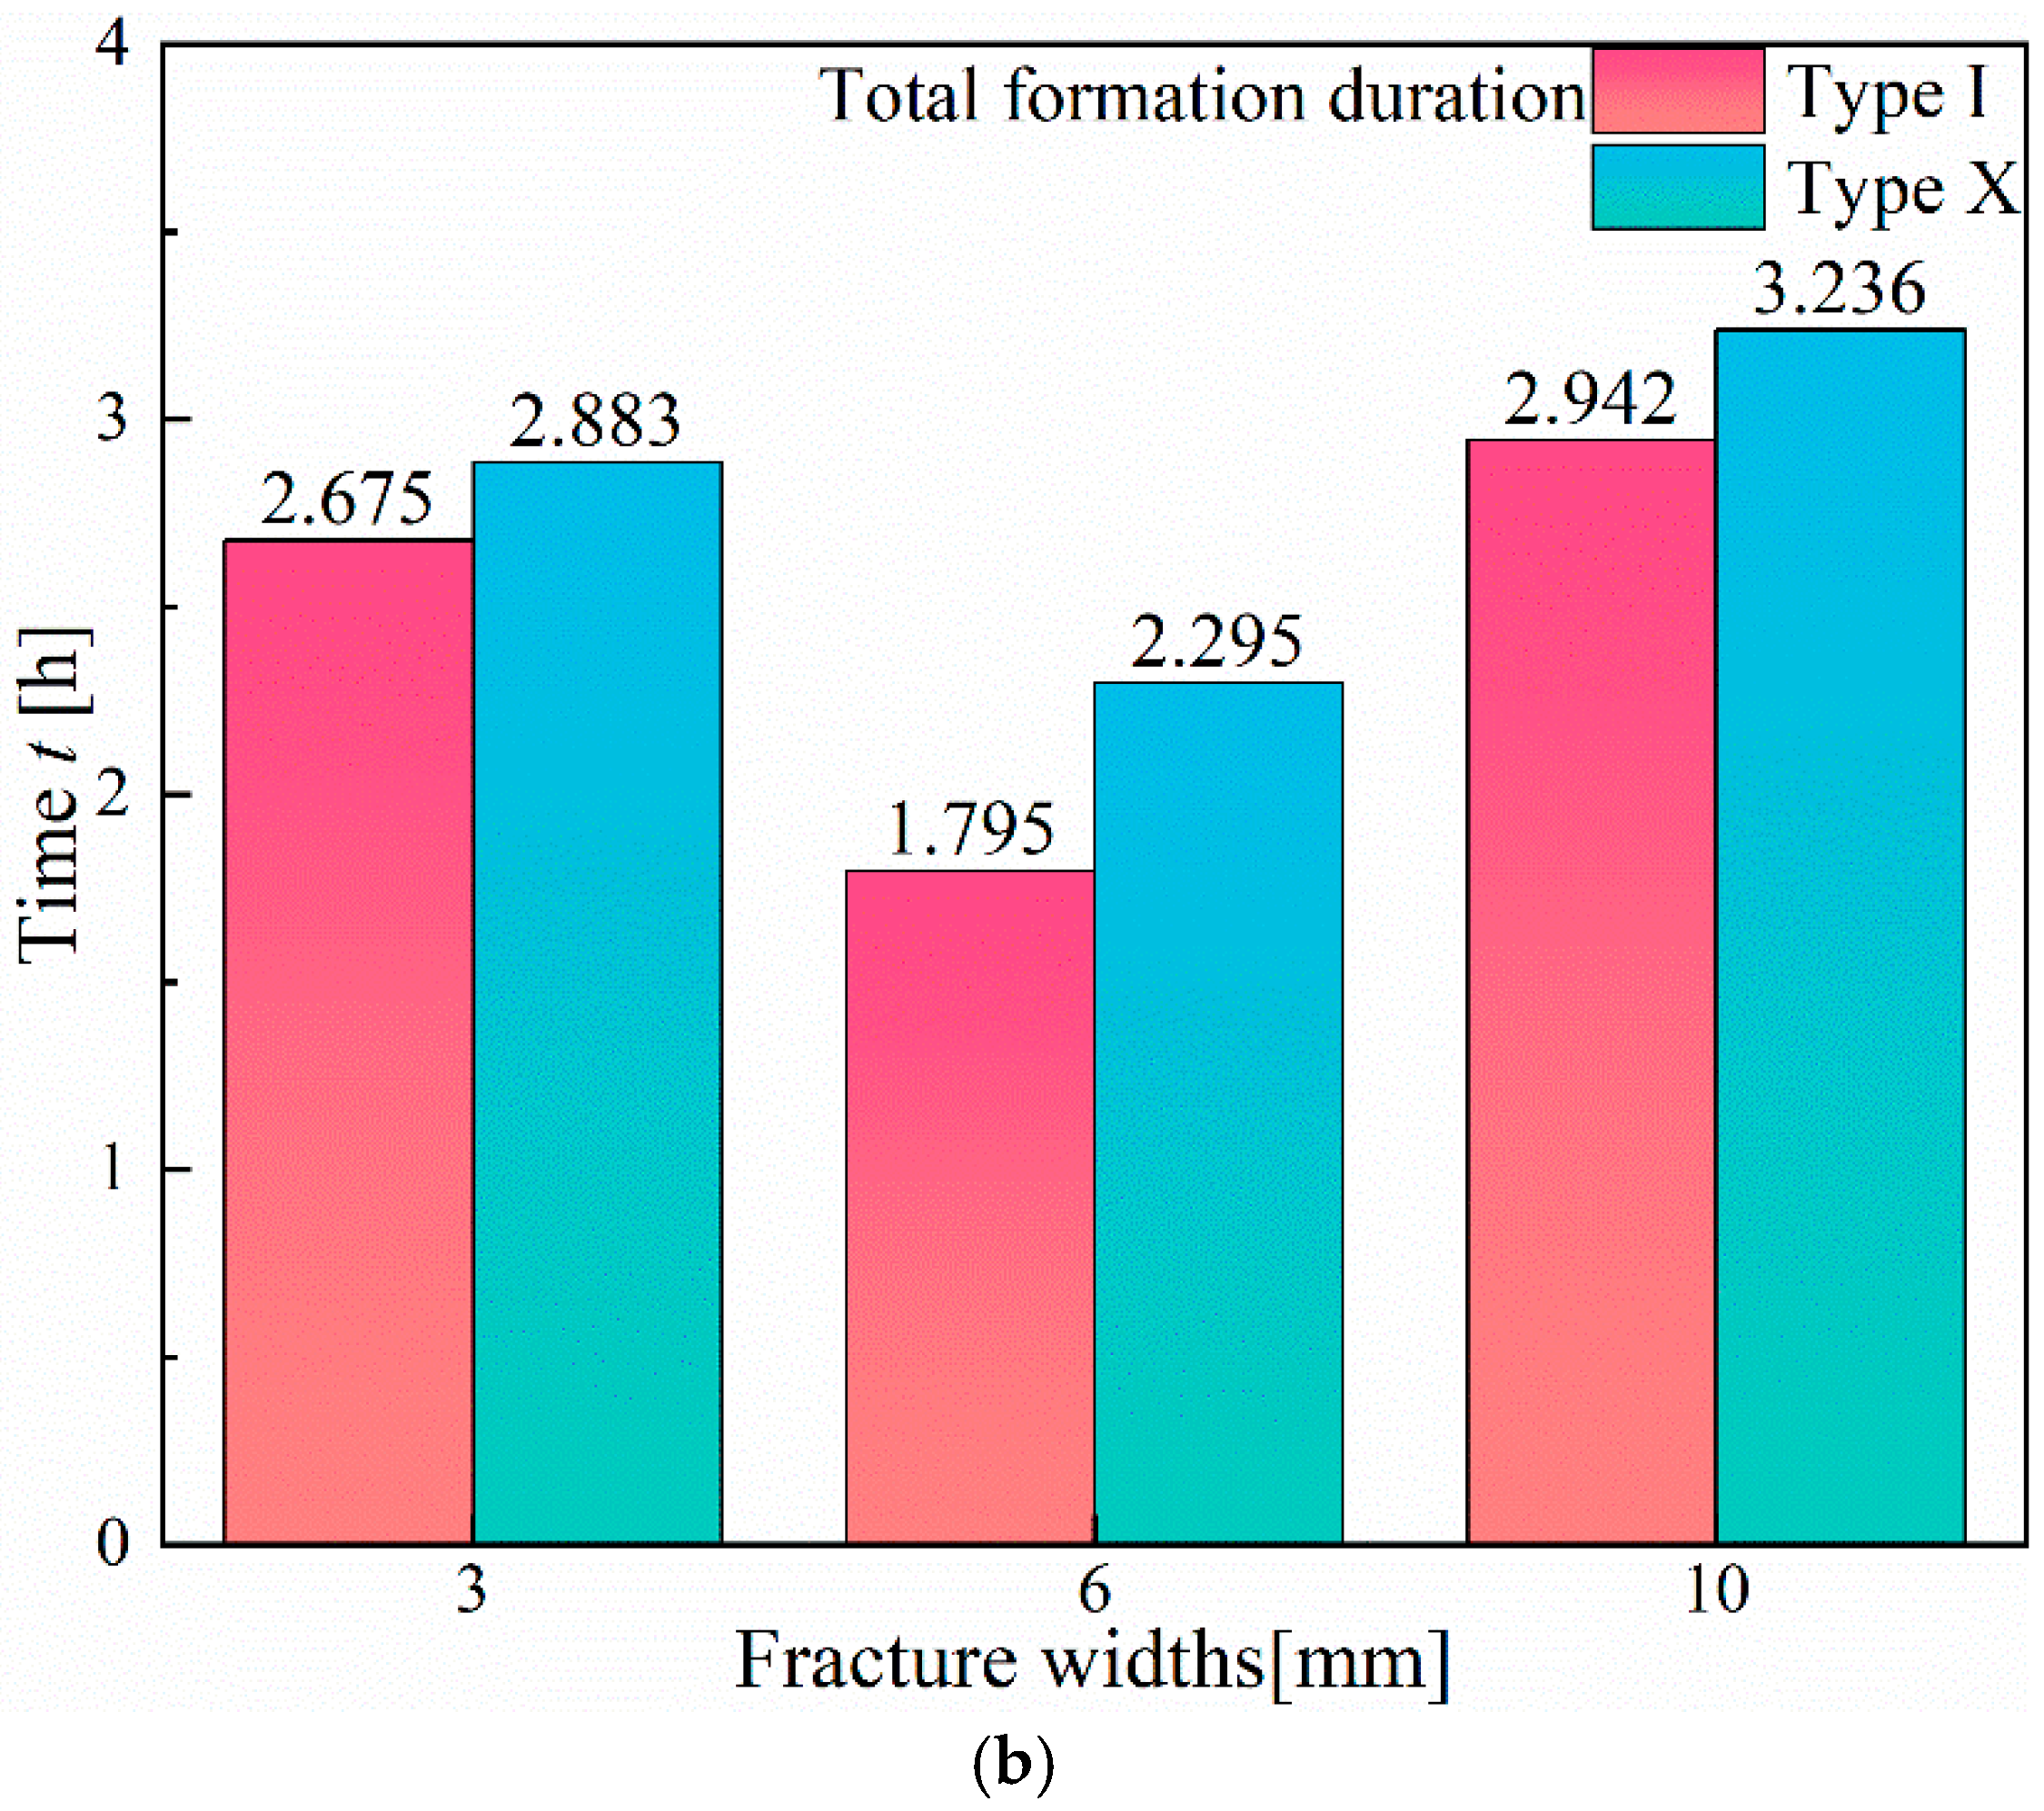
Compared to Type I fractures, in Type X fractures, the hydrate induction time is shorter, and the final formation quantity is larger. Under the condition of a 3 mm fracture width, the induction time decreases by 88.68%. Gas diffuses into the fracture from multiple directions, leading to a multidirectional centripetal expansion of hydrates in the Type X fractures.
(3)
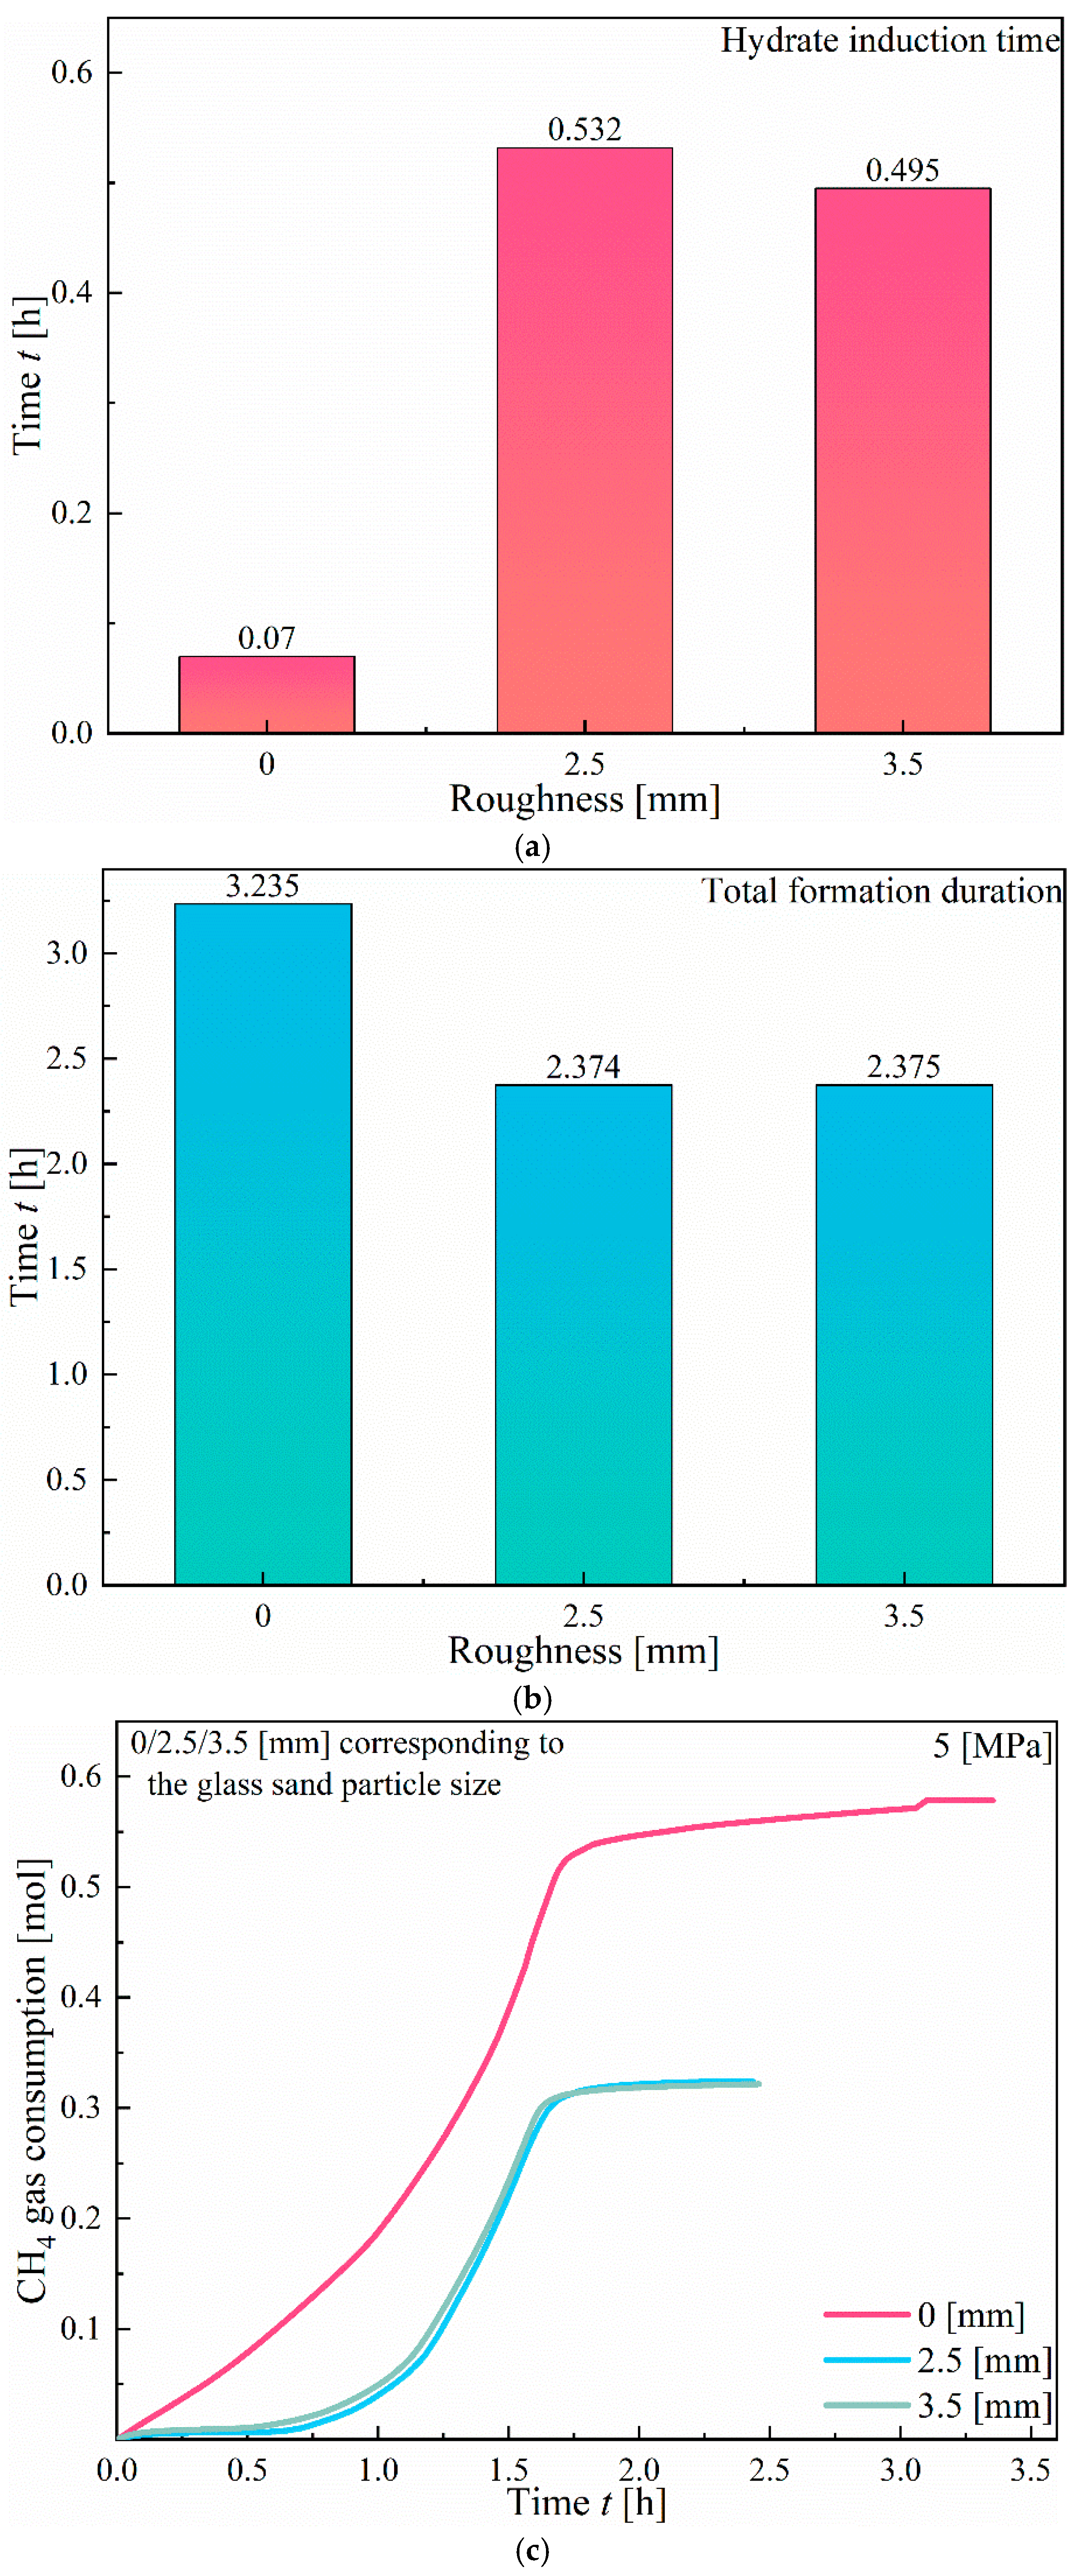
An increase in fracture roughness promotes hydrate nucleation at surface protrusions but inhibits the final quantity of hydrates. In Type I fractures, rough walls significantly shorten the induction time, whereas in Type X fractures, rough walls extend the induction period.
(4)
The dissociation of hydrates typically expands from the fracture wall inward, accompanied by a wavy surface topography. Gas production is affected by the fracture width, with the highest observed in the 3 mm fractures, reaching 0.34 mol.
(5)
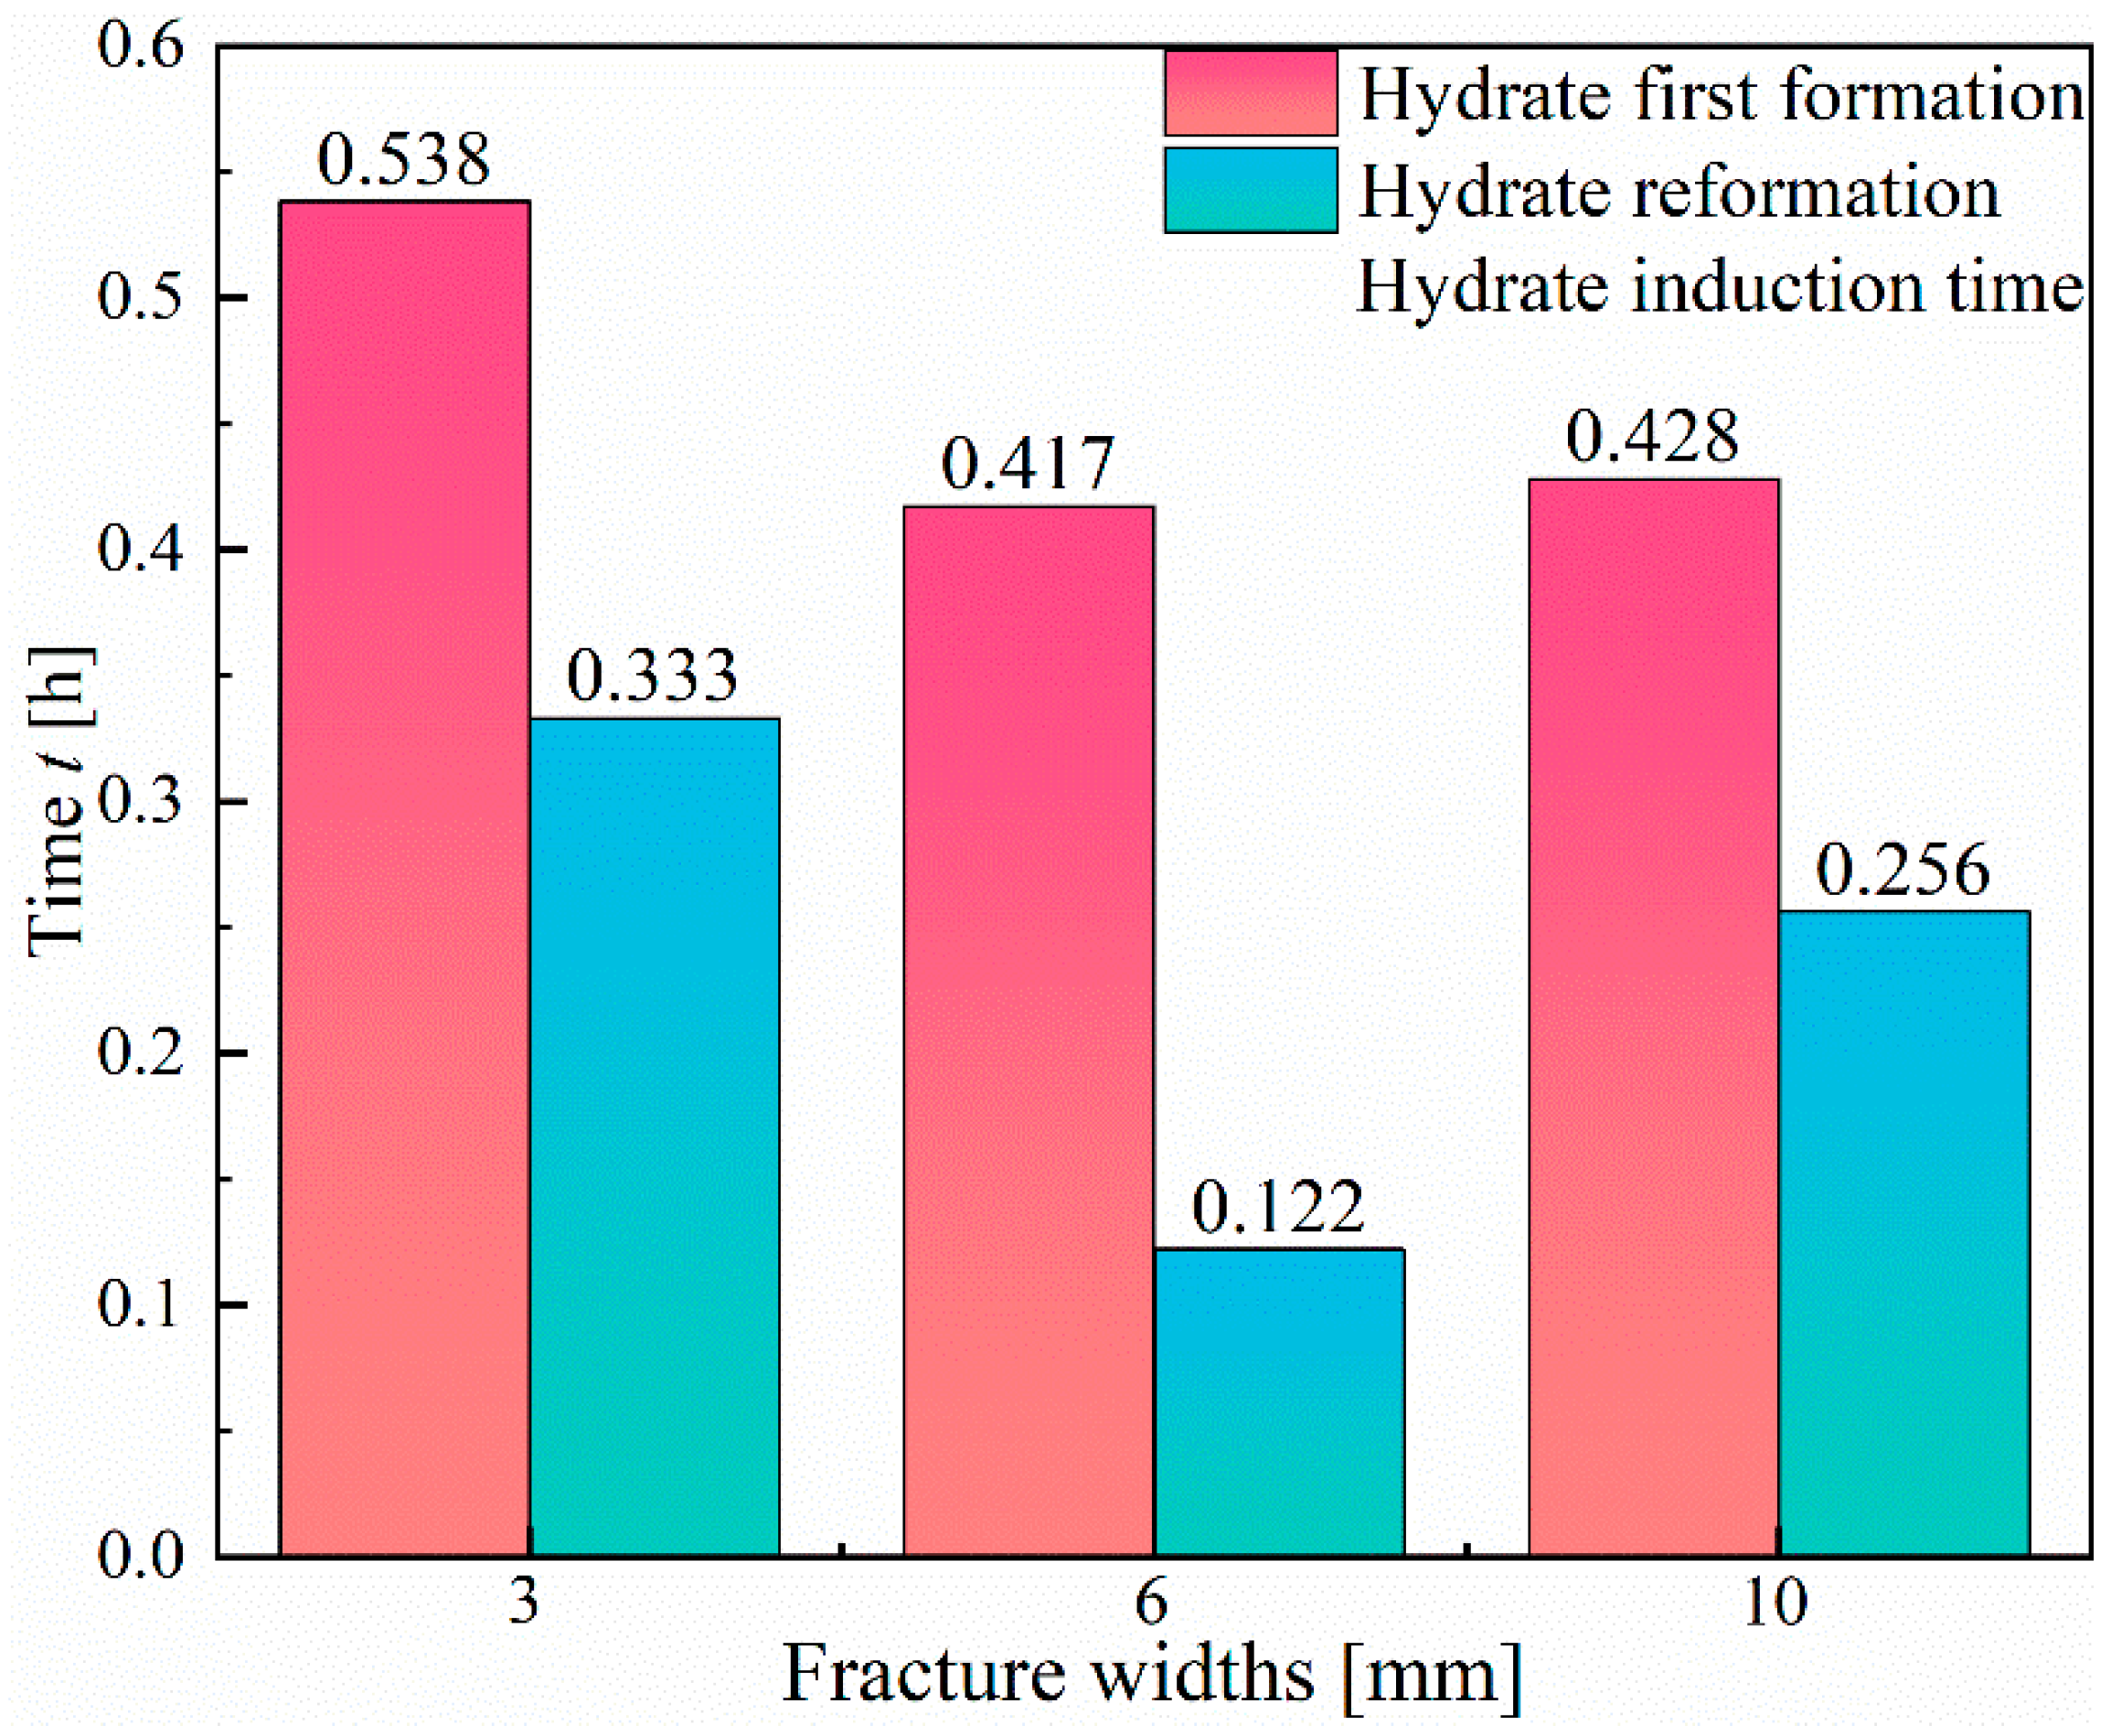
Due to the memory effect, the induction time for hydrate reformation is significantly shorter than that for primary formation, and the formation rate is faster. However, the volume of hydrate reformation is lower than that of primary formation. Therefore, during hydrate extraction, it is crucial to carefully control the temperature and pressure conditions, as well as the dissociation rate, to avoid a rapid decrease in pressure, which may lead to hydrate reformation.
In addition to sandy sediments, silty-clayey deposits in submarine fault zones also commonly contain natural gas hydrates. The hydrophilicity, expansibility, and charge properties of silty-clayey zones may influence the growth process and morphology of hydrates in fractures, which could differ from those in sandstone fractures. Future research on the growth of hydrates in silty-clayey fracture zones will be carried out. Furthermore, the diffusion characteristics, solubility, and formation rates of various gases may have distinct effects on the formation and dissociation of hydrates. Future research should further explore other gases, such as CO2 and hydrogen (H2), to advance progress in fields like CO2 sequestration and H2 energy development. Similarly, the examination of the impact of fracture orientation on the growth dynamics and morphology of hydrates warrants further investigation [55,56].

Author Contributions

Conceptualization, T.L.; Methodology, C.M., J.W. and T.L.; Formal analysis, J.P., T.H. and A.W.; Writing—original draft, C.M. and X.H.; Writing—review & editing, H.S., J.W. and T.L.; Supervision, X.H., H.S. and T.H.; Funding acquisition, X.H. and H.S. All authors have read and agreed to the published version of the manuscript.

Funding

This study was supported by the Graduate Innovation Program of China University of Mining and Technology (Grant No. 2025WLJCRCZL057) and the Postgraduate Research & Practice Innovation Program of Jiangsu Province (Grant No. SJCX25_1377).

Institutional Review Board Statement

Not applicable.

Informed Consent Statement

Not applicable.

Data Availability Statement

The original contributions presented in this study are included in the article. Further inquiries can be directed to the corresponding author.

Conflicts of Interest

Authors Xiaoxu Hu, Hongxiang Si were employed by Xinwen Mining Group Co., Ltd. The remaining authors declare that the research was conducted in the absence of any commercial or financial relationships that could be construed as a potential conflict of interest.

Nomenclature

n:Gas consumptionP0:Initial system pressure
Pt:System pressure at time tZ0:Gas compressibility factors at P0
Zt:Gas compressibility factors at PtVg:Gas volume with the reaction vessel
T:Experimental temperatureR:Molar gas constant
t:TimeP:Pressure

References

  1. Fang, X.; He, Y.; Li, Z.; Wang, G.; Qiu, S. Design and Performance Analysis of a Composite Separator with Enhanced De-Bonding Efficiency of Gas Hydrate-Bearing Sediments. Appl. Sci. 2025, 15, 5323. [Google Scholar] [CrossRef]
  2. Mukhsaf, M.H.; Li, W.; Jani, G.H. Optimizing Methanol Injection Quantity for Gas Hydrate Inhibition Using Machine Learning Models. Appl. Sci. 2025, 15, 3229. [Google Scholar] [CrossRef]
  3. Wang, L.; Shen, S.; Wu, Z.; Wu, D.; Li, Y. Strength and creep characteristics of methane hydrate-bearing clayey silts of the South China Sea. Energy 2024, 294, 130789. [Google Scholar] [CrossRef]
  4. Liu, Z.; Dai, S.; Ning, F.; Li, P.; Wei, H.; Wei, C. Strength estimation for hydrate-bearing sediments from direct shear tests of hydrate-bearing sand and silt. Geophys. Res. Lett. 2018, 45, 715–723. [Google Scholar] [CrossRef]
  5. Yan, R.; Lu, D.; Song, Y.; Yu, H.; Zhang, Q.; Zhou, J. Modeling the mechanical behavior of methane hydrate-bearing soil considering the influences of temperature and pore pressure. Energy Fuels 2022, 36, 12510–12523. [Google Scholar] [CrossRef]
  6. You, Z.; Hao, Y.; Hu, W.; Shen, S.; Wu, P.; Li, Y. Strength analysis of hydrate-bearing sandy sediments in excess gas and excess water based on drained triaxial compression tests. Eng. Geol. 2023, 325, 107292. [Google Scholar] [CrossRef]
  7. Chong, Z.R.; Yang, S.H.B.; Babu, P.; Linga, P.; Li, X. Review of natural gas hydrates as an energy resource: Prospects and challenges. Appl. Energy 2016, 162, 1633–1652. [Google Scholar] [CrossRef]
  8. Ma, C.; Zhang, C.; Luo, T.; Wang, A.; Ma, C.; Song, Y.; Yang, W. Triaxial Shearing Characteristics of Hydrate-Bearing Silty-Clayey Sediments under Deviatoric Consolidation. Energy Fuels 2025, 39, 6865–6880. [Google Scholar] [CrossRef]
  9. He, Y.; Tang, Y.; Zhou, Y.; Xie, N.; Wang, G. Experimental Study on Sand Removal by a Downhole in Situ Spiral-Swirl Natural Gas Hydrate Coupling Separator. Appl. Sci. 2025, 15, 2833. [Google Scholar] [CrossRef]
  10. Luo, T.; Ma, C.; Chen, Y.; Song, J.; Wang, Z.; Yan, H.; Kang, H.; Li, Z.; Sun, X.; Song, Y.; et al. Numerical Study of Long-Term Natural Gas Production of Hydrate Composite Reservoirs in the South China Sea by Depressurization Using Horizontal Wells. Energy Fuels 2025, 39, 2568–2583. [Google Scholar] [CrossRef]
  11. Ma, H.; Liu, J.; Zhang, Y.; Li, J.; Kan, J.; Li, N. Prediction of phase equilibrium conditions and thermodynamic stability of CO2-CH4 gas hydrate. Appl. Sci. 2024, 14, 2320. [Google Scholar] [CrossRef]
  12. Yu, J.; Cheng, C.; Yang, J. Evolution Characteristics of the Strength and Dilation Parameters of Gas Hydrate-Bearing Sediments and a Modeling Study. Appl. Sci. 2024, 14, 2517. [Google Scholar] [CrossRef]
  13. Song, Y.; Yang, L.; Zhao, J.; Liu, W.; Yang, M.; Li, Y.; Liu, Y.; Li, Q. The status of natural gas hydrate research in China: A review. Renew. Sust. Energy Rev. 2014, 31, 778–791. [Google Scholar] [CrossRef]
  14. Zheng, J.; Bhatnagar, K.; Khurana, M.; Zhang, P.; Zhang, B.; Linga, P. Semiclathrate based CO2 capture from fuel gas mixture at ambient temperature: Effect of concentrations of tetra-n-butylammonium fluoride (TBAF) and kinetic additives. Appl. Energy 2018, 217, 377–389. [Google Scholar] [CrossRef]
  15. Ghaani, M.R.; Takeya, S.; English, N.J. Hydrogen storage in propane-hydrate: Theoretical and experimental study. Appl. Sci. 2020, 10, 8962. [Google Scholar] [CrossRef]
  16. Song, J.; Luo, T.; Chen, Y.; Wang, A.; Ma, C.; Ma, C.; Han, T.; Zhang, Y.; Wang, T.; Yang, W. Formation Kinetics and Morphology Characteristics of Fracture-Filling Natural Gas Hydrate under the Influence of Multiple Parameters. Energy Fuels 2024, 38, 17619–17633. [Google Scholar] [CrossRef]
  17. Teng, Y.; Li, Y.; Huang, T.; Chen, Y.; Wang, P.; Wang, B.; An, S.; Li, Y.; Han, S.; Zhu, J.; et al. Hydrogen purification via hydrate-based methods: Insights into H2-CO2-CO hydrate structures, thermodynamics, and kinetics. Gas Sci. Eng. 2024, 131, 205484. [Google Scholar] [CrossRef]
  18. Du, J.; Li, H.; Wang, L. Cooperative effect of surfactant addition and gas-inducing agitation on methane hydrate formation rate. Fuel 2018, 230, 134–137. [Google Scholar] [CrossRef]
  19. Keshavarz, M.; Ghaffarkhah, A.; Sadeghi, A. Effect of three representative surfactants on methane hydrate formation rate and induction time. Egypt. J. Pet. 2017, 26, 331–339. [Google Scholar] [CrossRef]
  20. Qin, Y.; Bao, R.; Zhou, L.; Yang, X.; Liu, C.; Wan, W.; Chen, Y.; Guo, Y. Enhanced formation kinetics of hydrates using 1, 3-dioxolane, l-leucine, and β-cyclodextrin. Fuel 2023, 332, 126165. [Google Scholar] [CrossRef]
  21. Shen, X.; Li, Y.; Li, Y.; Shen, L.; Maeda, N.; Zhang, Y.; Wang, H.; Wang, X. Ultrarapid formation and direct observation of methane hydrate in the presence of L-tryptophan. ACS Sustain. Chem. Eng. 2023, 11, 8774–8785. [Google Scholar] [CrossRef]
  22. Lee, W.; Kim, K.; Kang, D.W.; Ahn, Y.; Lee, J. Enhanced Hydrate Growth Kinetics with Hydrate Seeds and Promoter under a Static Reaction System. Energy Fuels 2025, 39, 2508–2520. [Google Scholar] [CrossRef]
  23. Govindaraj, V.; Mech, D.; Pandey, G.; Nagarajan, R.; Sangwai, J. Kinetics of methane hydrate formation in the presence of activated carbon and nano-silica suspensions in pure water. J. Nat. Gas Sci. Eng. 2015, 26, 810–818. [Google Scholar] [CrossRef]
  24. Qin, Y.; Shang, L.; Zhou, L.; Zhu, J.; Yuan, S.; Zang, C.; Ao, D.; Li, Z. Application of nanofluids in rapid methane hydrate formation: A review. Energy Fuels 2022, 36, 8995–9013. [Google Scholar] [CrossRef]
  25. Liu, Z.; Zheng, J.; Wang, Z.; Gao, Y.; Sun, B.; Liao, Y.; Linga, P. Effect of clay on methane hydrate formation and dissociation in sediment: Implications for energy recovery from clayey-sandy hydrate reservoirs. Appl. Energy 2023, 341, 121064. [Google Scholar] [CrossRef]
  26. Babu, P.; Yee, D.; Linga, P.; Palmer, A.; Khoo, B.; Tan, T.; Rangsunvigit, P. Morphology of methane hydrate formation in porous media. Energy Fuels 2013, 27, 3364–3372. [Google Scholar] [CrossRef]
  27. Ji, Y.; Hou, J.; Cui, G.; Lu, N.; Zhao, E.; Liu, Y.; Du, Q. Experimental study on methane hydrate formation in a partially saturated sandstone using low-field NMR technique. Fuel 2019, 251, 82–90. [Google Scholar] [CrossRef]
  28. Cheng, Z.; Wang, S.; Xu, N.; Liu, W.; Zhao, Y.; Zhao, J.; Jiang, L.; Zheng, J.-N. Quantitative analysis of methane hydrate formation in size-varied porous media for gas storage and transportation application. Fuel 2021, 301, 121021. [Google Scholar] [CrossRef]
  29. Li, B.; Meng, X.Z.; Cheng, T.; Wan, Q. Affecting mechanism of natural sandstone porous media on the formation and phase equilibrium of methane hydrate. Energy Fuels 2024, 38, 4091–4101. [Google Scholar] [CrossRef]
  30. Xie, Y.; Cheng, L.; Feng, J.; Zheng, T.; Zhu, Y.; Zeng, X.; Sun, C.; Chen, G. Kinetics behaviors of CH4 hydrate formation in porous sediments: Non-unidirectional influence of sediment particle size on hydrate formation. Energy 2024, 289, 130021. [Google Scholar] [CrossRef]
  31. Chen, X.; Espinoza, D.N. Surface area controls gas hydrate dissociation kinetics in porous media. Fuel 2018, 234, 358–363. [Google Scholar] [CrossRef]
  32. Li, X.; Li, X.; Wang, Y.; Li, G.; Zhang, Y.; Hu, H.; Wan, K.; Zeng, H.-P. Influence of particle size on the heat and mass transfer characteristics of methane hydrate formation and decomposition in porous media. Energy Fuels 2021, 35, 2153–2164. [Google Scholar] [CrossRef]
  33. Wu, C.; Fan, S.; Wang, Y.; Lang, X. Morphology observation on formation and dissociation cycles of methane hydrate in stacked quartz sandy sediments. J. Nat. Gas Sci. Eng. 2022, 98, 104382. [Google Scholar] [CrossRef]
  34. Li, X.; Huang, W.; Sun, J.; Wang, Z.; Wang, J.; Liu, Y. NMR Investigation of Methane Hydrate Formation and Dissociation Behavior Induced by Heat Flow in Sandy Porous Media. Energy Fuels 2024, 38, 5834–5846. [Google Scholar] [CrossRef]
  35. Weinberger, J.L.; Brown, K.M. Fracture networks and hydrate distribution at Hydrate Ridge, Oregon. Earth Planet. Sci. Lett. 2006, 245, 123–136. [Google Scholar] [CrossRef]
  36. Cook, A.E.; Goldberg, D.; Kleinberg, R.L. Fracture-controlled gas hydrate systems in the northern Gulf of Mexico. Mar. Pet. Geol. 2008, 25, 932–941. [Google Scholar] [CrossRef]
  37. Lee, M.W.; Collett, T.S. Characteristics and interpretation of fracture-filled gas hydrate–An example from the Ulleung Basin, East Sea of Korea. Mar. Pet. Geol. 2013, 47, 168–181. [Google Scholar] [CrossRef]
  38. Holland, M.; Schultheiss, P. Comparison of methane mass balance and X-ray computed tomographic methods for calculation of gas hydrate content of pressure cores. Mar. Pet. Geol. 2014, 58, 168–177. [Google Scholar] [CrossRef]
  39. Pan, H.; Li, H.; Chen, J.; Zhang, Y.; Cai, S.; Huang, Y.; Hao, Y.; Deng, J. A unified contact cementation theory for gas hydrate morphology detection and saturation estimation from elastic-wave velocities. Mar. Pet. Geol. 2020, 113, 104146. [Google Scholar] [CrossRef]
  40. Jin, Z.H.; Johnson, S.E.; Cook, A.E. Crack extension induced by dissociation of fracture-hosted methane gas hydrate. Geophys. Res. Lett. 2015, 42, 8522–8529. [Google Scholar] [CrossRef]
  41. Hu, G.; Zhang, Z.; Zhao, Y.; Bu, Q.; Li, A.; Zhao, W.; Wang, Z.; Qiu, X.; Liu, T.; Liu, S.; et al. Formation mechanism and geophysical properties of fracture-filling gas hydrate in the host sediments: A comprehensive review. Earth Sci. Rev. 2024, 258, 104917. [Google Scholar] [CrossRef]
  42. Yang, H.; Xue, X.; Chen, X.; Xie, J.; Zheng, Q. A study on the electrical characteristics of eractured gas hydrate reservoirs based on digital rock technology. Lithosphere 2021, 2021, 1365284. [Google Scholar] [CrossRef]
  43. Liu, S.; Hu, G.; Bu, Q.; Zhao, Y.; Sun, Z. Frequency-dependent anisotropic electromagnetic responses of fractured reservoirs with various hydrate distributions based on numerical simulation. J. Mar. Sci. Eng. 2025, 13, 48. [Google Scholar] [CrossRef]
  44. Han, T.; Liu, S.; Fu, L. Effects of hydrate distribution on the anisotropic electrical properties of fractured reservoirs through effective medium modeling. Geophysics 2025, 90, 1–49. [Google Scholar] [CrossRef]
  45. Yang, M.; Zhao, J.; Zheng, J.; Song, Y. Hydrate reformation characteristics in natural gas hydrate dissociation process: A review. Appl. Energy 2019, 256, 113878. [Google Scholar] [CrossRef]
  46. Li, B.; Sun, Y.; Jiang, S.; Shen, Y.; Qi, Y.; Zhang, G. Investigating the influence of Joule-Thomson cooling on hydrate reformation near the wellbore. Gas Sci. Eng. 2024, 124, 205288. [Google Scholar] [CrossRef]
  47. Kou, X.; Zhang, H.; Li, X.; Chen, Z.; Wang, Y. Interfacial heat and mass transfer effects on secondary hydrate formation under different dissociation conditions. Langmuir 2024, 40, 3617–3627. [Google Scholar] [CrossRef]
  48. Wen, Z.; Yao, Y.; Sun, X.; Lei, X.; Cui, C. The Impact of Gas Flow on Hydrate Reformation and Reservoir Seepage Characteristics in Clayey Silt Sediments. Energy Fuels 2024, 38, 5149–5158. [Google Scholar] [CrossRef]
  49. Shi, B.; Liao, Q.; Song, S.; Zhu, Y.; Gong, J.; Chen, G. Microscopic study on the memory effect of methane hydrate in the presence of silica nanoparticles: I. Dissociation mechanism & guest supersaturated hypothesis. Sep. Purif. Technol. 2025, 357, 130100. [Google Scholar] [CrossRef]
  50. Liao, Q.; Shi, B.; Song, S.; Zhu, Y.; Gong, J.; Chen, G. Microscopic study on the memory effect of methane hydrate in the presence of silica nanoparticles: II. Residual structure hypothesis & impurity imprinting hypothesis. Sep. Purif. Technol. 2025, 357, 130101. [Google Scholar] [CrossRef]
  51. Cai, Y.; Chen, Y.; Li, Q.; Li, L.; Huang, H.; Wang, S.; Wang, W. CO2 hydrate formation promoted by a natural amino acid l-methionine for possible application to CO2 capture and storage. Energy Technol. 2017, 5, 1195–1199. [Google Scholar] [CrossRef]
  52. GB/T 17747.3-2011; Natural gas-Calculation of compression factor-Part 3: Calculation using physical properties. Standards Press of China: Beijing, China, 2011.
  53. Lei, L.; Park, T.; Jarvis, K.; Pan, L.; Tepecik, I.; Zhao, Y.; Ge, Z.; Choi, J.-H.; Gai, X.; Galindo-Torres, S.A.; et al. Pore-scale observations of natural hydrate-bearing sediments via pressure core sub-coring and micro-CT scanning. Sci. Rep. 2022, 12, 3471. [Google Scholar] [CrossRef]
  54. Wang, S.; Yang, M.; Liu, W.; Zhao, J.; Song, Y. Investigation on the induction time of methane hydrate formation in porous media under quiescent conditions. J. Pet. Sci. Eng. 2016, 145, 565–572. [Google Scholar] [CrossRef]
  55. Liu, T.; Liu, X. Identification of morphologies of gas hydrate distribution based on amplitude variation with angle analysis. Geophysics 2018, 83, B143–B154. [Google Scholar] [CrossRef]
  56. Mu, Z.; Yan, Z.; Qiu, Z.; Zhang, P.; Zhang, Y.; Tian, S.; Zhang, B. Impact of fracture orientation on gas hydrate extraction using horizontal well depressurization and hydraulic fracturing. Energy 2025, 315, 134367. [Google Scholar] [CrossRef]
Figure 1. A schematic diagram of natural gas hydrate occurrence in fractures.
Applsci 15 07399 g001
Figure 2. A schematic diagram of the high-pressure visualization system.
Applsci 15 07399 g002
Figure 3. Artificial sandstone fracture molds.
Applsci 15 07399 g003
Figure 4. Selection of temperature and pressure.
Applsci 15 07399 g004
Figure 5. Type I fracture under different widths: (a) hydrate induction time; (b) total formation duration.
Applsci 15 07399 g005
Figure 6. CH4 gas consumption curves during the hydrate formation process under different fracture widths.
Applsci 15 07399 g006
Figure 7. Observation images of hydrate growth under different fracture widths.
Applsci 15 07399 g007
Figure 8. Micrographs of CH4 hydrate morphology within Type I fractures: (A1,A2): 3 mm; (A3,A4): 6 mm; (A5,A6): 10 mm.
Applsci 15 07399 g008
Figure 9. Different fracture shape: (a) hydrate induction time; (b) total formation duration.
Applsci 15 07399 g009aApplsci 15 07399 g009b
Figure 10. CH4 gas consumption curves during the hydrate formation process under different fracture shapes.
Applsci 15 07399 g010
Figure 11. An observation diagram of the fracture hydrate growth under different fracture shapes.
Applsci 15 07399 g011
Figure 12. Type I fracture under different roughness: (a) hydrate induction time; (b) total formation duration; (c) gas consumption curve.
Applsci 15 07399 g012
Figure 13. Micrographs of CH4 hydrate morphology in rough fractures.
Applsci 15 07399 g013
Figure 14. Type X fracture under different roughness: (a) hydrate induction time; (b) total formation duration; (c) gas consumption curve.
Applsci 15 07399 g014
Figure 15. Observation images of hydrate dissociation under different fracture widths: (A1E1): 3 mm; (A2E2): 6 mm; (A3E3): 10 mm.
Applsci 15 07399 g015
Figure 16. A morphology diagram of the residual hydrate in fractures during the dissociation process.
Applsci 15 07399 g016
Figure 17. Temperature variations during hydrate decomposition under different pressures.
Applsci 15 07399 g017
Figure 18. Hydrate induction time for hydrate first formation and reformation.
Applsci 15 07399 g018
Figure 19. Nucleation area distribution of hydrate formation in rough fractures.
Applsci 15 07399 g019
Figure 20. CH4 consumption curves during hydrate formation in fractures of different widths.
Applsci 15 07399 g020
Table 1. Experimental parameters and conditions of CH4 hydrate under sandstone fracture environments.
NumberPressure [MPa]Fracture ShapeFracture Width [mm]Roughness [mm]Note
15I3/6/10/3 groups
2X3/6/10/3 groups
3I102.5/3.52 groups
4X102.5/3.52 groups
Disclaimer/Publisher’s Note: The statements, opinions and data contained in all publications are solely those of the individual author(s) and contributor(s) and not of MDPI and/or the editor(s). MDPI and/or the editor(s) disclaim responsibility for any injury to people or property resulting from any ideas, methods, instructions or products referred to in the content.

