Article

Evolution of the Seismic Forecast System Implemented for the Vrancea Area (Romania)

by
Victorin-Emilian Toader
1,*,
Constantin Ionescu
1,
Iren-Adelina Moldovan
1,
Alexandru Marmureanu
1,
Iosif Lıngvay
2 and
Andrei Mihai
1
1
National Institute for Earth Physics, Calugareni 12, 077125 Măgurele, Romania
2
S.C. Electrovâlcea SRL Râmnicu Vâlcea, Str. Ferdinand 19, 240571 Râmnicu Vâlcea, Romania
*
Author to whom correspondence should be addressed.
Appl. Sci. 2025, 15(13), 7396; https://doi.org/10.3390/app15137396
Submission received: 31 March 2025 / Revised: 27 May 2025 / Accepted: 2 June 2025 / Published: 1 July 2025
(This article belongs to the Special Issue Earthquake Detection, Forecasting and Data Analysis)

Abstract

The National Institute of Earth Physics (NIEP) in Romania has upgraded its seismic monitoring stations into multifunctional platforms equipped with advanced devices for measuring gas emissions, magnetic fields, telluric fields, solar radiation, and more. This enhancement enabled the integration of a seismic forecasting system designed to extend the alert time of the existing warning system, which previously relied solely on seismic data. The implementation of an Operational Earthquake Forecast (OEF) aims to expand NIEP’s existing Rapid Earthquake Early Warning System (REWS) which currently provides a warning time of 25–30 s before an earthquake originating in the Vrancea region reaches Bucharest. The AFROS project (PCE119/4.01.2021) introduced fundamental research essential to the development of the OEF system. As a result, real-time analyses of radon and CO2 emissions are now publicly available at afros.infp.ro, dategeofizice. The primary monitored area is Vrancea, known for producing the most destructive earthquakes in Romania, with impacts extending to neighboring countries such as Bulgaria, Ukraine, and Moldova. The structure and methodology of the monitoring network are adaptable to other seismic regions, depending on their specific characteristics. All collected data are stored in an open-access database available in real time, geobs.infp.ro. The monitoring methods include threshold-based event detection and seismic data analysis. Each method involves specific technical nuances that distinguish this monitoring network as a novel approach in the field. In conclusion, experimental results indicate that the Gutenberg-Richter law, combined with gas emission measurements (radon and CO2), can be used for real-time earthquake forecasting. This approach provides warning times ranging from several hours to a few days, with results made publicly accessible. Another key finding from several years of real-time monitoring is that the value of fundamental research lies in its practical application through cost-effective and easily implementable solutions—including equipment, maintenance, monitoring, and data analysis software.

1. Introduction

The primary goal of developing an Operational Earthquake Forecasting (OEF) system in Romania is to expand the existing Rapid Earthquake Warning System (REWS) by introducing a complementary service. This new system aims to inform authorities of the possible occurrence of seismic events with a lead time of several hours, while ensuring an optimal cost–benefit ratio. The Vrancea region, which has the highest seismic potential in Romania, is the focus of this effort, primarily to protect Bucharest—the country’s largest and most vulnerable city. This article outlines the evolution of the OEF system developed by the National Institute for Earth Physics (NIEP), with an emphasis on its decision-making methodology, which is based on the weighted analysis of anomalies (events) detected during earthquake forecasting. Although the theoretical foundations of the system were established several years ago, its development has largely depended on the availability of funding. The most significant recent project supporting this development was AFROS (Analysis and Forecasting of Romanian Seismicity, 2021–2023), which focused on fundamental research and improving seismicity assessment methods for the Vrancea region (http://afros.infp.ro/proiect_en.php, accessed on 2 March 2025). Previous studies have detailed the network’s structure, instrumentation, and evolution [1,2,3,4]. In the AFROS project, the monitoring network was expanded with a broader range of instruments and included applications related to climatic influences. Many existing OEF systems rely solely on current earthquake activity and are based on statistical models such as ETAS (Epidemic Type Aftershock Sequence), ETES (Epidemic-Type Earthquake Sequence), EEPAS (Every Earthquake a Precursor According to Scale), STEP (Short-Term Earthquake Probability), Omori-Utsu, and Gutenberg-Richter laws [5,6,7,8]. However, these models have not been validated for the Vrancea region, which is characterized by both crustal and intermediate-depth earthquakes that do not necessarily produce aftershocks. For example, Omi et al. [5] described a real-time aftershock forecasting system in Japan using only seismicity data, despite the availability of radon monitoring for earthquake prediction [9]. In that study, event detection was based on singular spectrum transformation (SST), applied directly to raw observational data without removing seasonal variations. The same study also explored the use of Random Forest (RF) algorithms, a form of ensemble machine learning. Although NIEP’s OEF does not currently employ machine learning techniques, it collects the necessary data and does incorporate seasonal variation analysis in anomaly detection. A key advantage of the NIEP monitoring network is its integration of both seismic and geophysical data, including various precursors such as radon, CO2, telluric fields, very low frequency (VLF) radio signals, and others. The development of New Zealand’s OEF system, as described by Christophersen et al. [6], involves hybrid models combining short-term and medium-term, time-invariant forecasts based on seismic catalog data. These methods rely on the accuracy and real-time updating of catalogs, as well as the conversion between different magnitude scales. For example, local magnitude (ML) is commonly used in earthquake catalogs, while seismic hazard models are based on moment magnitude (Mw). This discrepancy also presents challenges for NIEP’s OEF, particularly in estimating the ‘a’ and ‘b’ coefficients in the Gutenberg-Richter law. Real-time seismic bulletins from NIEP include arrival times and magnitudes from contributing stations, but only event locations are typically retained in the public catalog.
Leila Mizrahi et al. (2024) [7] analyzed the global status of OEF systems in Italy, New Zealand, and the United States, highlighting significant heterogeneity in methodology. Even the application of ETAS models varies across these countries, and analyses typically rely solely on seismic catalog data. The interpretation of the Gutenberg-Richter ‘b’ value is particularly contentious, as its variability depends heavily on a region’s specific seismic and geological characteristics [10]. For example, in Vrancea, a region prone to deep earthquakes, the ‘b’ value tends to decrease before a major event [4], whereas in regions like New Zealand, it may initially increase before normalizing [11]. Thomas H. et al. [12] described multidisciplinary monitoring networks in China, Greece, Italy, Japan, Russia, and the USA as part of OEF systems focused on short-term earthquake forecasting. Using the 2009 L’Aquila earthquake as an example, the study underscored that while earthquakes may be predictable in hindsight, real-time forecasting remains complex. Douglas Zechar J. et al. [13] pose the question: Is an operational earthquake forecast (OEF) feasible at the European level? Their conclusion: “Our thesis here is straightforward: unified European operational earthquake forecasting is, for the foreseeable future, unlikely. But progress is being made at the national level, and the advances made in each nation can, with some modification, apply elsewhere”. NIEP’s OEF system incorporates a wide range of precursor parameters including radon (in air, water, and in soil), CO2, electromagnetic anomalies, thermal changes, infrasound, acoustic noise, and ground deformation. To gain international recognition and be featured in global analyses like those in [7,12,13], the system requires visibility through peer-reviewed publications and international conference presentations. The AFROS platform is already operational and publicly accessible.
The TURNkey project (Towards more Earthquake-resilient Urban Societies through a Multi-sensor-based Information System enabling Earthquake Forecasting, Early Warning, and Rapid Response Actions, https://earthquake-turnkey.eu/the-project/, accessed on 2 March 2025) incorporated an OEF system alongside traditional seismic methods based only on seismicity, an Earthquake Early Warning (EEW), and a Rapid Response to Earthquakes (RRE). This complex project, in which NIEP was a partner, included a cost–benefit analysis to evaluate the feasibility of an OEF system before seismic events in Europe [14]. One aspect of this analysis, presented in [14], examined whether it would be cost-effective to evacuate populations in high seismic-risk scenarios. There are no real-time data or results on the project website (https://earthquake-turnkey.eu/the-project/, accessed on 2 March 2025). One reason is the complexity of the system and the implemented solutions involving numerous partners and resources (i.e., what was mentioned in [14]). By contrast, the AFROS project developed a fully functional platform using real-time data for Vrancea. Given the high seismic potential of the region, where earthquakes up to magnitude 7.5 (Richter scale) can occur, protocols are in place to prevent public panic during high-alert periods. NIEP’s REWS system currently delivers real-time information to emergency authorities, while earthquake forecast data are graphically displayed on the AFROS website.
In conclusion, based on extensive experimental data and long-term analysis, the NIEP’s OEF system can provide a warning time of several hours before a major seismic event in the Vrancea region. This is achieved through real-time analysis of gas emissions (radon, CO2) and seismic activity based on the Gutenberg-Richter law. The system offers a viable cost–benefit ratio, accepted by funding agencies, and has been implemented using cost-effective and straightforward solutions in terms of equipment, maintenance, monitoring, and analysis software.

2. Explanation of Relevant Data Analysis Methods

This article builds upon the analysis methods described by the same authors in [2,3,4], incorporating data gathered over one year of monitoring. As outlined in [2], “The logical tree of the forecast parameters of the Vrancea area”, the decision matrix and comparative results of the anomaly detection methods used are presented in this section. The method applied in our Operational Earthquake Forecasting (OEF) system involves five key steps, as detailed in [2].
In the first step, the seismic zone is selected based on geological data and the location of installed equipment. This is a crucial phase because gas emissions are typically concentrated in fault zones. All monitoring stations are placed in these areas, although some sensors have been relocated occasionally due to interference from local activities.
In the second phase, data on the daily and seasonal evolution of forecast parameters are collected. During this step, trigger levels and interactions between parameters are defined. It is optimal to use long-term data, particularly given that annual variations are increasingly influenced by global warming. The NIEP seismic network includes over 150 stations, providing robust seismicity data. Additionally, all stations are equipped with meteorological instruments to assess the influence of weather conditions.
Phase three involves offline data analysis to determine the optimal detection parameters, thresholds, and methods—typically using the STA/LTA algorithm or standard deviation-based techniques. The outcomes depend on sensor type, sampling rate, and local environmental conditions.
In the fourth phase, the events recorded by each piece of equipment are processed through a decision matrix that employs a logically weighted voting system.
In the final phase, it is important to remember that these methods are empirical. Therefore, decision-making often involves accountability, especially when specialized intervention departments are engaged. A false alarm can cause panic and undermine the credibility of the entire monitoring system. The main conclusion is that only a multidisciplinary network enables the comprehensive analysis required to minimize false alarms and increase the likelihood of accurate decision-making.

3. Data Collection and Calculation Results, a Case Study

The case study refers to the earthquake of 16 September 2024, with a local magnitude of 5.4 (Figure 1). This was the first earthquake with a local magnitude greater than 5 since 2022. In Figure 1, the faults, the position of the epicenter, and distances to the PLOR, PANC, BISRR, LOPR, and NEHR monitoring stations used in Table 1 are marked.
The decision matrix is based on the number of detected events. In this example, the detection is based on exceeding predefined thresholds (trigger levels), and the method is analyzed and compared to the Allen-type STA/LTA (Short-Term Averages/Long-Term Averages) detection algorithm ([15,16,17]) applied to integrated signals. Figure 2 refers to the level-based detection (time series) compared to the STA/LTA method in Figure 3, which uses large time series processed on the NIEP servers.
The first graphic in Figure 3, “Integral Bisoca radon STA/LTA”, is the first time series of Figure 2, “Bisoca radon Bq/m3”, after the integration and application of the STA/LTA method. The red dots were generated by STA/LTA and represent the detection events. The number of events was introduced in the decision matrix every day after a weighting (Table 1).
The detection of events coud be done on time series applying a trigger method (Figure 2) but the results were better using STA/LTA algorithm (Figure 3).
The results of the decision matrix (Table 1), referred to as the OEF AFROS signal, indicate an increase 3.6 days before the earthquake, as shown in Figure 2. A similar analysis conducted over a longer time interval—two months prior to the earthquake with a local magnitude of 5.4—suggested that a one-month time window is sufficient for the decision matrix. This confirms that the method, which is based on threshold exceedance, is effective.
For gas emissions (radon and CO2), a threshold-based trigger method was applied. This method involves detecting when the emission level exceeds a predefined threshold and then drops back below 99.96%. The outcome is a series of real-time detections transmitted as ‘Event’ files from the monitoring stations to the analysis server. Each station is assigned a weight in the logical decision tree, determined experimentally through an offline analysis. The maximum number of exceedances (events) per station was set at 4, a value established specifically for the Vrancea region.
It was also experimentally determined that for earthquakes of local magnitude greater than 4 with epicenters in Vrancea, a four-day window captured the detection groupings from all stations. These findings are summarized in Table 1. Figure 4 illustrates the results for the earthquake of magnitude 5.4 that occurred on 16 September 2024, based on the monitoring stations listed in Table 2.
In this example, the channel weights (Channel Weights) in the logical decision tree are equal. With eight stations, each was assigned a weight of 0.125, resulting in a total weight sum of 1 (8 × 0.125). The algorithm allows for flexible adjustments, including:
Differentiating radon and CO2 weights;
Modifying weights based on a station’s distance from the hypocenter;
Changing the number of stations;
Altering the maximum number of daily detections per station (set to 4 in this example);
Adjusting the four-day grouping period for detections.
Table 1 also includes seismic activity in the Vrancea region. These data are available at http://afros.infp.ro/AFROS.php?link=dategeofizice (accessed on 2 March 2025) and are represented in terms of magnitude. For a comprehensive analysis, cumulative daily energy (EnergyE) and four-day average energy (mean Energy/4 days) are used in Figure 1 to account for all earthquakes occurring on a given day. Table S1 and Figure S4 are provided in the Supplementary Files in Excel format. Data flow in updating the decision matrix is presented in Figure 5.
The decision matrix is based on relationships (1)–(4).
  Mean Day = SUM (Channel Weight0 × evens0/maxim evens, …
Channel Weightn−1 × eventsn−1/maxim events)/n stations
The maxim of ‘Mean Day’ is 1 when in all stations ‘events’ = ‘maxim events’
Mean m Daysn = SUM (Mean Dayn−m: Mean Dayn)/m
“m” is the window of days that captures detections. The maxim of ‘Mean m Daysn’ is 1 when in all stations ‘Mean Day’ = 1.
Seismic energy is calculated with the Richter and Båth formula [18,19,20]:
EnergyE = 10(11.8+1.5×M)
The coefficients 11.8 and 1.5 are empirical and depend on the type of magnitude and location. Their values do not affect the method used. The measurement unit of seismic energy is Erg (ergi), 1 Erg = 10−7 Joule.
1 = SUM (Channel Weights)
Also, Figure 4 shows that ‘EnergyE’ is more intuitive than its mean over four days.
So, in detail (Figure 5):
-
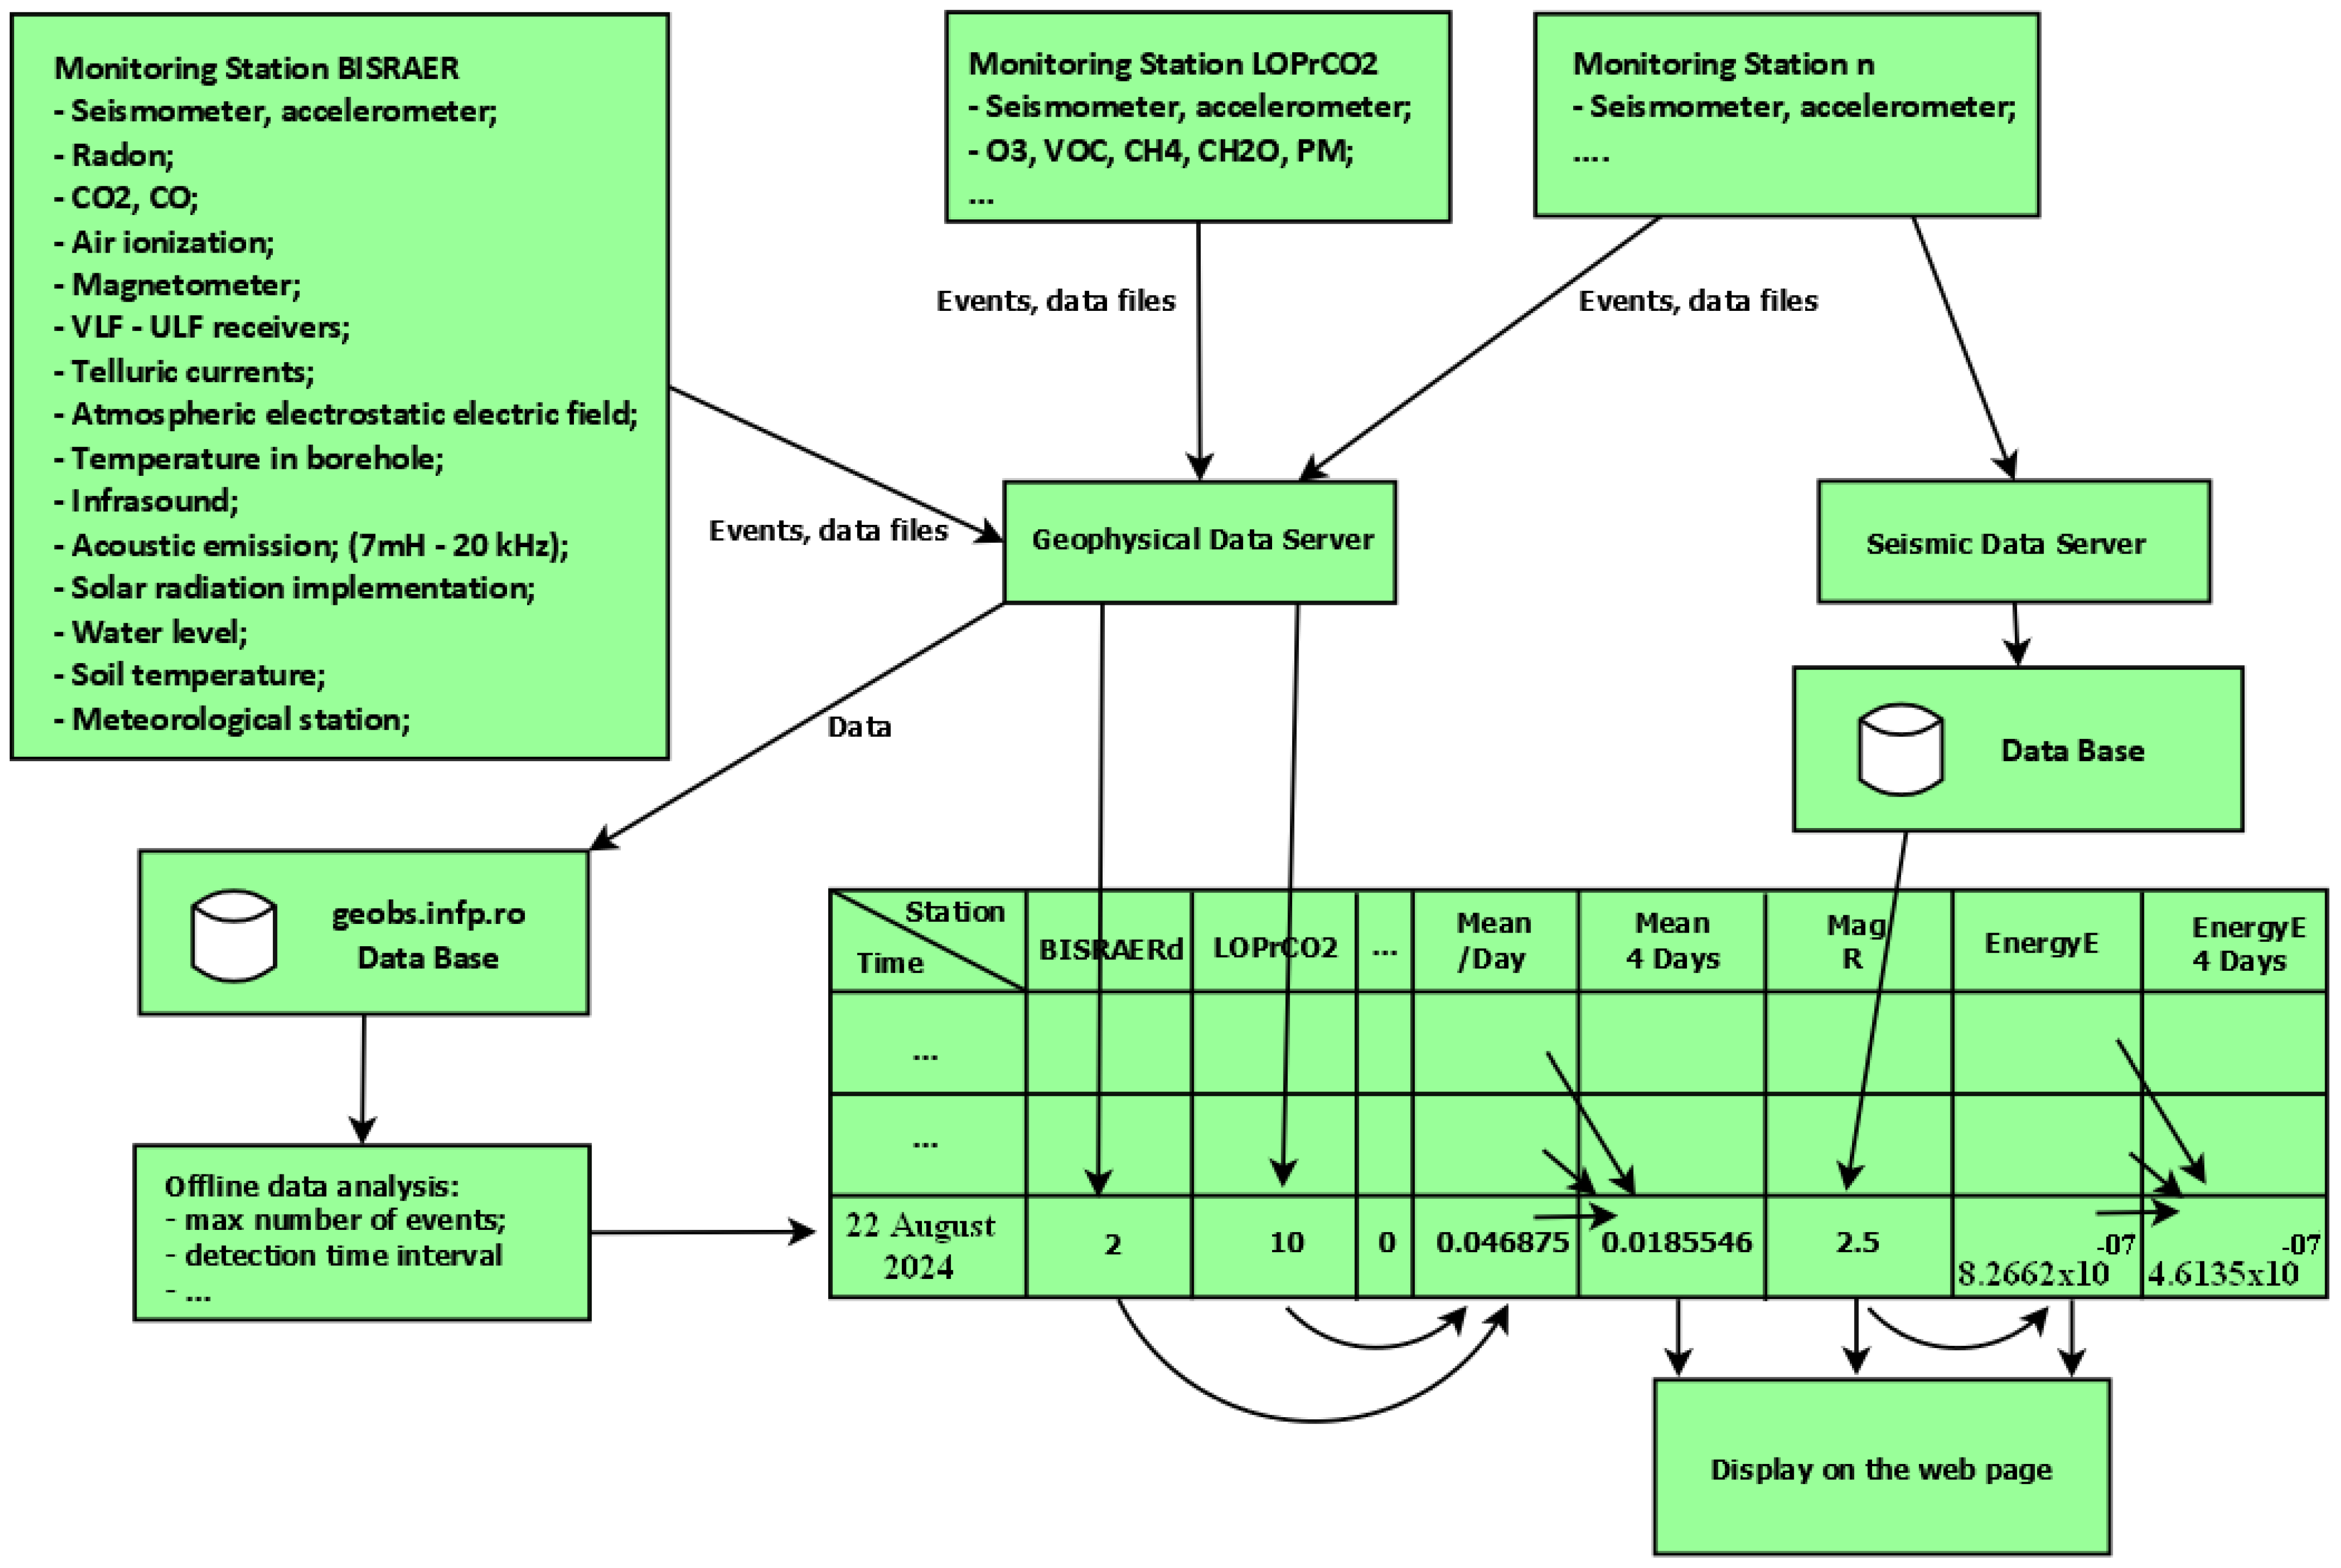
The columns represent the Date/Time, BISRAERd, DLMdd, LOPRdd, NEHRdd, PANCdd are radon, and BISRCO2, DLMCO2, LOPrCO2 represent CO2;
-
Every day the number of Events for every station is recorded;
-
MeanDay for 22 August 2024: 2 Evens for BISRAERd, and 10 for LOPrCO2, relation (1) (0.125 × 2/4 + 0.125 × 0/4 + 0.125 × 0/4 + 0.125 × 0/4 + 0.125 × 10/4 + 0.125 × 10/4 + 0.125 × 10/4 + 0.125 × 10/4)/8 = 0.046875;
-
MEAN 4 DAYS = (0.0078125 + 0.0078125 + 0.01171875 + 0.046875)/4 = 0.018554688;
-
EnergyE (relation 3) = POWER((1.5 × 2.5 + 11.8),10)/10+18 = 8.26616 × 10−07;
-
EnergyE 4 Days = (0 + 6.80297 × 10−07 + 3.38486 × 10−07 + 8.26616 × 10−07)/4 = 4.6135 × 10−07;
Figure 5 shows the data flow: data acquisition, event detection in stations, event file transmission, daily counting, weighted daily average calculation (MeanDay), and four-day average calculation (Mean 4 Day). Verification is done by calculating the cumulative seismic energy daily (EnergyE).
So, starting from the seismic Events file sent from monitoring stations, the probability of having a seismic event is evaluated. This is the simplest method to implement in our case because we made the data acquisition software and we can implement the detection algorithm.
An Event file example for radon in Bisoca station:
BISRAerd-Events_240911_091400.log  -> 24/09/11 09:14:00  ROI1 5.920 < 9.995
where BISRAerd-Events_240911_091400.log is the name of the file, date (year/month/day) 24/09/11, and time (HH:MM:SS) 09:14:00
New equipment for monitoring radon and thoron with high precision was installed in Plostina and Vrancioaia, RTM 1688. The evolution of radon in Plostina did not show significant variations before the earthquake with 5.4 local magnitude that occurred on 16 September 2024, unlike radon in Vrancioaia, which indicated high values, especially after the earthquake. Meanwhile, thoron in Plostina did not indicate a seismic event, but that in Vrancioaia exceeded the trigger threshold and several red dots appeared in the STA/LTA graph (Figure 6).
The differences in the number of detections (Table 1, Figure 6) can be attributed to the distance from the epicenter (Table 3). The epicentral area should not be considered a direct source of radon for the other monitoring stations; rather, tectonic stress causes soil deformations that influence gas emissions.
Table 1 indicates that the highest exceedances were observed in CO2 emissions from Lopatari, radon and CO2 from Bisoca, and radon from Panciu, consistent with their distances from the epicenter. The monitoring stations referenced in Table 1 are part of the AFROS platform.
The Dalma and Nehoiu stations were not operational during the monitoring period. Replacing them with alternative stations would have required updates to the platform’s website, which was not feasible, as the project had already concluded.
Figure 7 presents time series data of radon levels and meteorological conditions. Atmospheric pressure remained constant across the locations, and temperature showed similar variations. Humidity differed between sites; however, according to SARAD, their equipment was not affected by these variations. Precipitation trends are illustrated for both Bisoca and Plostina. Despite similar meteorological conditions, radon levels behaved differently at the two sites. No radon anomalies were observed in Plostina, while clear anomalies were evident in Bisoca prior to the earthquake. This suggests that there were factors beyond weather conditions that influenced the behavior of radon. Tectonic stress leads to crustal deformation through compression and expansion, which can create or alter fractures in rocks, facilitating the release of radon and CO2 [21]. Ground deformation measurements were obtained using accelerometers installed at seismic stations. These accelerometers function as inclinometers at low frequencies. In areas equipped with triaxial magnetometers, these instruments are also utilized for deformation monitoring, as their offset is influenced by ground movement. Figure 8 illustrates the correlation between soil deformation and radon emissions. The increase in radon levels observed in Bisoca can be attributed to soil deformation, with atmospheric pressure also contributing (as shown in Figure 7). At the Plostina station, both an accelerometer and an inclinometer were available, but no correlation between radon levels and ground deformation was observed at that site. At the Vrancioaia station (VRI), radon emissions increased following an earthquake with a local magnitude of 5.4. Atmospheric pressure remained consistent throughout the area, and its influence was often minimized by installing sensors in boreholes [21]. Tectonic stress can generate radon and CO2 anomalies over considerable distances, depending on the earthquake’s epicenter location and magnitude and the geological structure of the monitoring area [21].
The OEF of NIEP also included a seismic component that was not incorporated into the decision matrix in Table 1, although it was mentioned in References [2,4]. Seismicity from the analyzed period in Table 1 is detailed in Table 4. There were days with a higher number of earthquakes—up to five 05 September 2024—which could serve as seismic precursors, even if their magnitudes were low.
The Vrancea region is known for both shallow and deep earthquakes, as shown in Table 4. Although the relationship between these types of earthquakes is not yet clearly defined, the short half-lives of radon (3.8 days) and thoron (55.6 s), both of which decay via alpha emission, suggest that the source of these gases must be near the surface.
Figure 9 illustrates a decrease in the “b” parameter (from relationship 5 of the Gutenberg-Richter law) 34 days before an earthquake with a local magnitude of 4.4 (Richter) on 01 August 2024, and another decrease 42 days prior to an earthquake with a local magnitude of 5.4 on 16 September 2024. This phenomenon has been observed in other instances as well [4] but appears to be specific to the Vrancea area.
A more noticeable decrease in the magnitude of completeness (Mc) was observed for the 5.4 magnitude earthquake. Mc is determined using relationship (5) [22].
Log10N(m) = a − b × m
where N(m) is the number of earthquakes with magnitude larger or equal to m, b is a scaling parameter, and a is a constant in conformity with the Gutenberg-Richter law [8]. The least squares regression method determines the coefficients “a” and “b”. The magnitude of completeness, Mc, was determined by applying a regression algorithm until the error starts to increase. These parameters are part of the offline analysis (Figure 9). A similar analysis of the evolution of ‘b’ was carried out in [23]. The results were a variation of the b-value before a major earthquake. In our case, the ‘b’ values decreased before an earthquake.
PZone is the preparation zone from Dobrovolsky empirical formula [24]:
PZone = 100.43×M
The decision matrix can be extended, but this requires an effort that must be seen through the prism of costs and benefits [14]. Only the parameters from the AFROS page http://afros.infp.ro/AFROS.php?link=dategeofizice (accessed on 25 March 2025) are public in the OEF analysis, but offline studies also involve other parameters and more stations.

4. Discussion

In [2], “Monitoring Gas Emissions in Light of an OEF Application” (DOI: 10.3390/atmos12010026), we conducted a statistical analysis that encompassed more parameters than just gas emissions. However, in this paper, we focus specifically on radon and CO2, as these were the gases requested and implemented within the AFROS project.
Our findings for the Vrancea area indicate that gas emissions (radon and CO2) are more strongly influenced by soil deformation than by meteorological conditions. Soil deformation alters the permeability of the ground by opening or closing the pores and cracks through which gases escape to the atmosphere. Meteorological factors contribute indirectly; for example, air temperature influences the soil surface and thereby affects gas emissions.
Once gases reach the soil surface, they are transported by atmospheric currents. Therefore, the sensor enclosures are designed to be closed at the ground level to capture emissions directly from the soil, but not sealed entirely, allowing for detection of gases transported by wind. Consequently, wind direction and speed data from weather stations are important in our analysis.
In our event detection analysis (using level and STA/LTA methods), deviations from baseline measurements are crucial, as they indicate soil deformation due to tectonic stress, which, in turn, affects gas emissions. Fluctuations in gas emissions are determined by a combination of factors, including soil deformation, air temperature, solar radiation, humidity, and geological conditions ([21,25,26,27]).
To monitor these influences, a detector (Vaisala DST111) was installed in Vrancioaia to measure air and ground temperature, alongside a pyranometer. In Plostina, a net radiometer was used to measure both direct and reflected solar radiation, as well as ground temperature.
Atmospheric pressure influences the soil by opening and closing cracks through which gases, including radon, escape into the atmosphere. According to [28], radon (Rn) emanation increases during earthquakes due to the formation of new fractures and fissures associated with seismic activity. Studies such as [21] present a case involving high indoor radon levels and examine the influence of meteorological parameters. However, they concluded that “no clear correlations were found between indoor radon concentrations and other meteorological parameters, such as outdoor humidity and precipitation”.
Articles [29,30] analyzed the relationship between radon emissions and atmospheric conditions in northern Pakistan. These studies, which involved soil measurements, showed a positive correlation between radon levels, air pressure, and relative humidity. In [30], it was noted that “the topsoil was covered with a polythene sheet in order to minimize the atmospheric effect”.
While such methods can help isolate radon emissions from meteorological influences, they may also distort the signal, potentially filtering out valuable precursor data—especially in areas like Vrancea, where such parameters may vary only hours before a seismic event. Radon emission is sensitive to the way atmospheric pressure affects the opening and closing of soil pores [28], which, in turn, is influenced by the specific characteristics of the monitored area.
A multidisciplinary approach is recommended, as it enables the cross-validation of data using multiple parameters. The use of a decision matrix can also be refined. Relationships (1–4), which are based on experimental data, should be adapted to the local conditions of the monitored region. For the OEF-NIEP, the most effective method to minimize the influence of meteorological factors on radon and CO2 measurements is to install the sensors in the wells already used for seismic monitoring equipment.
A moving time window is used to calculate the “b” value and “Mc” (magnitude of completeness) from the Gutenberg-Richter law. In practice, this window can vary and typically includes a predefined number of earthquakes to ensure accurate determination of these parameters. In Figure 9, a fixed time window of 7 days is used, based on the analysis of seismicity in the Vrancea Zone. Errors may occur when the number of earthquakes is too small or absent; such anomalies may indicate a deviation from the normal seismic rhythm and can act as precursors to changes in seismicity.
Figure 9 highlights a distinctive feature of the Vrancea region: the clustering of earthquakes interspersed with periods of “seismic silence”. When using a fixed time window, the focus shifts from absolute values to tracking the variations of “b” and “Mc” over time. Article [2] examines the seismicity in the Vrancea region and the frequency–magnitude distribution of earthquakes at different depths. The time windows used for analyzing temporal variations of the “b” value are defined by a fixed number of events to ensure stable calculations.
Incorporating geophysical data (e.g., radon, CO2) into Operational Earthquake Forecasting (OEF) requires additional methods. However, this integration enhances the reliability of seismic forecasts and enables exploration of broader topics, such as the impacts of global warming, thereby justifying the added complexity. Table 3 in the article “Monitoring of Gas Emissions in Light of an OEF Application” [2] presents a comparative analysis between seismic parameters (magnitude, depth, epicentral distance) derived from the Gutenberg-Richter law (GR a-b) and various geophysical indicators (radon, CO2, ions, etc.). Table 2 of the same article reports a 50% probability for GR a-b, comparable to other geophysical metrics.
A key difference between an OEF based solely on seismicity and one that also integrates geophysical data lies in real-time anomaly detection. The latter allows for near-instantaneous forecasting, as seen with Rapid Earthquake Warning Systems (REWS). The proposed solution is to combine seismic and geophysical analyses for cross-validation, as demonstrated in the TURNkey project.
Another limitation of relying exclusively on seismic data is the delay inherent to time-windowed analysis (7 days in this case), as well as the infrequency of significant local earthquakes (magnitude > 6). The case study presented—a magnitude 5.4 event on 16 September 2024—is the first such earthquake exceeding magnitude 5 since 2022. This underscores the need for a robust geophysical monitoring network, which also contributes to understanding climate change effects.
In general, the statistical analyses discussed in the articles are retrospective and not conducted in real time. This limitation further motivates the inclusion of geophysical data in our analyses to enhance forecasting accuracy and relevance. An earthquake forecast must determine the location, magnitude, and time of an earthquake. In the case of NIEP OEF, the target area is Vrancea, where a single threshold value for the magnitude is used (>4.5 R). A more precise localization can be achieved based on the number of events per station (Table 3).
A real-time seismic prediction system based on artificial intelligence and data from a network of electromagnetic and geoacoustic sensors was implemented in [31] for the seismogenic area in southwest China. The results provide predictions for the location and magnitude of potential earthquakes occurring within the following week, based on data from the current week. This approach uses historical data from 2016 to 2020 and assumes the existence of repeating patterns. However, this assumption is uncertain, as the effects of global warming may influence seismic activity. Moreover, in the case of [31], we did not find any web platform displaying real-time seismic forecasts.
Although NIEP’s electromagnetic and acoustic sensors are capable of supporting earthquake localization, they are not yet integrated into the OEF system.
Decision matrix analysis predicts seismic activity 3 to 6 days in advance. Similar results are reported in [29,30], in the context of radon monitoring in a region of Pakistan characterized by deep seismicity and a distinct geological structure. Although the equipment and methods differ, the monitoring and data analysis were conducted over a limited period: “Real-time measurements of radon/thoron and soil meteorological parameters (temperature, pressure, and relative humidity) were recorded every 15 min” [30]. As in our case, one condition mentioned in the article for the potential detection of precursors is a ratio of RE/PZone > 1.5 (see Table 3 and Table 4). For the Vrancea area and deep earthquakes, this corresponds to a minimum local magnitude of ML = 4.3, equivalent to Mw = 4.
Using a geophysical data network within the context of OEF involves various limitations and challenges. Interruptions in the data flow can result in missed seismic events. Such interruptions may be caused by climatic conditions (e.g., strong winds, lightning, or flooding affecting the power supply to telecommunications relays). While protection systems exist, they also have limitations. One solution is to use multiple monitoring stations.
Another challenge involves sensor placement. Sometimes sensors cannot be installed under optimal conditions due to a lack of infrastructure, which restricts site selection and may dictate the type of sensor used. For seismic stations, environmental noise or vibrations from geophysical equipment must be avoided. For example, the RTM 1688 radon monitoring device includes an air pump that generates noise and vibration, potentially affecting the reliability of continuous operation.
Data interpretation also presents challenges and requires a computing infrastructure capable of supporting the demands of the software and methodologies employed—such as memory capacity, storage, processing speed, high-speed internet, and access to various databases. These requirements are all met by the NIEP OEF, but they come with significant costs, including for equipment, software updates, and trained personnel.
The biggest challenge remains ensuring the system’s continuous operation and convincing decision-makers of its importance. Data analysis algorithms and methodological approaches can be implemented and adapted easily—provided the necessary resources are available. Understanding the interaction between monitored environmental factors and their correlation with seismicity is an ongoing scientific challenge.

5. Conclusions

This article contributes to the advancement of methods for implementing an Operational Earthquake Forecasting (OEF) system by presenting a novel solution. Several key conclusions can be drawn from the development of the OEF-NIEP system:
  • The structure of the OEF-NIEP system is innovative compared to existing approaches. We found no other solutions that utilize real-time event detection—such as threshold exceedance adapted to seasonal variations in gas emissions—directly at monitoring stations within a network and integrate these into a decision-making matrix.
  • Experimental results confirmed that the Gutenberg-Richter law (Equation (5)) and gas emissions (radon, CO2) can be used for real-time earthquake forecasting. This enables the possibility of a service where authorities can receive warning information within a time window ranging from several hours to a few days.
  • The RTM 1688 radon and thoron monitoring equipment installed at Plostina and Vrancioaia did not improve earthquake forecasting performance compared to the existing Radon Scout Plus equipment. The role of thoron as a precursor at these monitored locations remains unproven, though seismic activity in the area has not exceeded magnitude 4.5.
  • Years of experience with real-time monitoring suggest that simple, flexible, and cost-effective solutions (including equipment, maintenance, and analysis software) significantly support the advancement of fundamental research through applied research. However, increasing system complexity presents challenges in terms of implementation, maintenance, and funding. More accurate analyses, such as those based on artificial intelligence algorithms, can be developed and applied offline.
  • When developing the OEF system, it is essential to include additional factors beyond radon and CO2, and to increase the number of monitoring stations to allow for more accurate localization of future earthquakes.
  • Environmental factors (air pressure, temperature, humidity) can influence gas emissions and may trigger false alarms. Therefore, to mitigate this, sensors should be installed at greater depths.
  • Another important conclusion is the need to incorporate the findings of the AFROS project’s fundamental research into the real-time decision matrix, including advanced statistical and machine-learning tools for quantifying spatial and temporal features.
  • The article emphasizes decision-making based on real-time data. Anomaly detection was performed using thresholds determined by offline analyses; these thresholds should be further developed and integrated into the OEF system.
  • The monitored area should be expanded to include other seismic zones (e.g., Târgu Jiu, Izvoarele-Galați). Some of these regions are characterized by oil and gas extraction, necessitating the analysis of induced seismicity.
  • Only a multidisciplinary approach can yield significant results in earthquake prediction. The existence of a platform like AFROS, which presents and analyzes multidisciplinary data in real time, is unprecedented (no comparable systems were identified during our research) and demonstrates the feasibility of implementing an OEF system and providing a complementary service of REWS.
Fundamental research in the field of earthquake prediction is supported by numerous articles. The literature review in this paper shows that the implementation of theories in applied research takes place over short periods of time, as long as project funding is available. In conclusion, this article presents a method for earthquake prediction based on real-time radon and CO2 data that can be visualized using the AFROS platform (we have not encountered such platforms before) and requires further development. Artificial intelligence (AI) can generate numerous analytical methods, but without practical implementation, they remain purely theoretical.

Supplementary Materials

The following supporting information can be downloaded at: https://www.mdpi.com/article/10.3390/app15137396/s1.

Author Contributions

Conceptualization, V.-E.T.; methodology, V.-E.T. and I.-A.M.; software, V.-E.T.; validation, A.M. (Alexandru Marmureanu) and C.I.; formal analysis, I.-A.M. and A.M. (Andrei Mihai); investigation, V.-E.T. and I.-A.M.; writing—original draft preparation, V.-E.T.; correspondent, V.-E.T.; supervision, I.L. All authors have read and agreed to the published version of the manuscript.

Funding

This work was carried out within the Program Nucleu SOL4RISC (projects no PN23360101 and PN23360201) funded by the Romanian Ministry of Research, Innovation and Digitization, AFROS Project PN-III-P4-ID-PCE-2020-1361 supported by UEFISCDI, 101188365—TRANSFORM2—HORIZON-INFRA-2024-DEV-01 and PNRR-DTEClimate 760008/30.12.2022.

Institutional Review Board Statement

Not applicable.

Informed Consent Statement

Not applicable.

Data Availability Statement

http://geobs.infp.ro, accessed on 25 March 2025, example of the data is archived at https://data.mendeley.com/datasets/28kv3gsgcz, Published: 27 September 2022|Version 2|https://doi.org/10.17632/28kv3gsgcz.2.

Acknowledgments

The authors would like to thank Constantin Ionescu for the help and support throughout the project through the program Reactive PNRR-DTEClimate 760008/30.12.2022.

Conflicts of Interest

Author Iosif Lıngvay was employed by the company S.C. Electrovâlcea SRL Râmnicu Vâlcea. The remaining authors declare that the research was conducted in the absence of any commercial or financial relationships that could be construed as a potential conflict of interest.

References

  1. Toader, V.E.; Moldovan, I.-A.; Marmureanu, A.; Dutta, P.K.R.; Partheniu, R.; Nastase, E. Monitoring of radon and air ionization in a seismic area. Rom. Rep. Phys. 2017, 69, 842013. [Google Scholar]
  2. Toader, V.-E.; Nicolae, V.; Moldovan, I.-A.; Ionescu, C.; Marmureanu, A. Monitoring of Gas Emissions in Light of an OEF Application. Atmosphere 2020, 12, 26. [Google Scholar] [CrossRef]
  3. Toader, V.-E.; Nicolae, V.; Moldovan, I.-A.; Ionescu, C.; Marmureanu, A.; Lingvay, I. Implementation of a Radon Monitoring Network in a Seismic Area. Atmosphere 2021, 12, 1041. [Google Scholar] [CrossRef]
  4. Toader, V.-E.; Nicolae, V.; Moldovan, I.-A.; Ionescu, C.; Marmureanu, A. The Results and Developments of the Radon Monitoring Network in Seismic Areas. Atmosphere 2023, 14, 1061. [Google Scholar] [CrossRef]
  5. Omi, T.; Ogata, Y.; Shiomi, K.; Enescu, B.; Sawazaki, K.; Aihara, K. Implementation of a Real-Time System for Automatic Aftershock Forecasting in Japan. Seismol. Res. Lett. 2019, 90, 242–250. [Google Scholar] [CrossRef]
  6. Christophersen, A.; Rhoades, D.A.; Gerstenberger, M.C.; Bannister, S.; Becker, J.; Potter, S.H.; McBride, S. Progress and challenges in operational earthquake forecasting in New Zealand. In Proceedings of the 2017 NZSEE Conference, Wellington, New Zealand, 27–29 April 2017; GNS Science: Lower Hutt, New Zealand, 2017; pp. 1–6. [Google Scholar]
  7. Mizrahi, L.; Dallo, I.; van der Elst, N.J.; Christophersen, A.; Spassiani, I.; Werner, M.J.; Werner, M.J.; Iturrieta, P.; Bayona, J.A.; Iervolino, I.; et al. Developing, Testing, and Communicating Earthquake Forecasts: Current Practices and Future Directions. Rev. Geophys. 2024, 62, e2023RG000823. [Google Scholar] [CrossRef]
  8. Leet, L.D.; Gutenberg, B.; Richter, C.F. Seismicity of the Earth and Associated Phenomena. Geogr. Rev. 1950, 40, 346. [Google Scholar] [CrossRef]
  9. Tsuchiya, M.; Nagahama, H.; Muto, J.; Hirano, M.; Yasuoka, Y. Detection of atmospheric radon concentration anomalies and their potential for earthquake prediction using Random Forest analysis. Sci. Rep. 2024, 14, 11626. [Google Scholar] [CrossRef]
  10. El-Isa, Z.H.; Eaton, D.W. Spatiotemporal variations in the b-value of earthquake magnitude–frequency distributions: Classification and causes. Tectonophysics 2014, 615–616, 1–11. [Google Scholar] [CrossRef]
  11. Smith, W.D. The b-value as an earthquake precursor. Nature 1981, 289, 136–139. [Google Scholar] [CrossRef]
  12. Jordan, T.H.; Chen, Y.T.; Gasparini, P.; Madariaga, R.; Main, I.; Marzocchi, W.; Papadopoulos, G.; Sobolev, G.; Yamaoka KZschau, J. Operational Earthquake Forecasting. State of Knowledge and Guidelines for Utilization. Ann. Geophys. 2011, 54, 319–391. [Google Scholar] [CrossRef]
  13. Zechar, J.D.; Marzocchi, W.; Wiemer, S. Operational earthquake forecasting in Europe: Progress, despite challenges. Bull. Earthq. Eng. 2016, 14, 2459–2469. [Google Scholar] [CrossRef]
  14. Douglas, J.; Azarbakht, A. Cost–benefit analyses to assess the potential of Operational Earthquake Forecasting prior to a mainshock in Europe. Nat. Hazards 2021, 105, 293–311. [Google Scholar] [CrossRef]
  15. Vrex, A. Automatic Earthquake Recognition and Timing from Single Traces. Bull. Seismol. Soc. Am. 1978, 68, 1521–1532. [Google Scholar]
  16. Allen, R. Automatic phase pickers: Their present use and future prospects. Bull. Seismol. Soc. Am. 1982, 72, S225–S242. Available online: https://pubs.geoscienceworld.org/ssa/bssa/article-abstract/72/6B/S225/102172/Automatic-phase-pickers-Their-present-use-and?redirectedFrom=fulltext (accessed on 28 April 2020). [CrossRef]
  17. Jones, J.P.; van der Baan, M. Adaptive STA–LTA with Outlier Statistics. Bull. Seismol. Soc. Am. 2015, 105, 1606–1618. [Google Scholar] [CrossRef]
  18. Richter, C.F. Elementary seismology. Geol. J. 1958, 2, 768. [Google Scholar] [CrossRef]
  19. Båth, M. Earthquake seismology. Earth-Sci. Rev. 1966, 1, 69–86. [Google Scholar] [CrossRef]
  20. Båth, M. Seismic energy mapping applied to Turkey. Tectonophysics 1982, 82, 69–87. [Google Scholar] [CrossRef]
  21. Ambrosino, F.; Thinová, L.; Briestenský, M.; Giudicepietro, F.; Roca, V.; Sabbarese, C. Analysis of geophysical and meteorological parameters influencing 222Rn activity concentration in Mladeč caves (Czech Republic) and in soils of Phlegrean Fields caldera (Italy). Appl. Radiat. Isot. 2020, 160, 109140. [Google Scholar] [CrossRef]
  22. Chasanah, U.; Handoyo, E. Determination the Magnitude of Completeness, b-Value and a-Value for Seismicity Analysis in East Java, Indonesia. J. Phys. Conf. Ser. 2021, 1805, 012009. [Google Scholar] [CrossRef]
  23. Montiel-López, D.; Molina, S.; Galiana-Merino, J.J.; Gómez, I. On the calculation of smoothing kernels for seismic parameter spatial mapping: Methodology and examples. Nat. Hazards Earth Syst. Sci. 2023, 23, 91–106. [Google Scholar] [CrossRef]
  24. Dobrovolsky, I.P.; Zubkov, S.I.; Miachkin, V.I. Estimation of the size of earthquake preparation zones. Pure Appl. Geophys. 1979, 117, 1025–1044. [Google Scholar] [CrossRef]
  25. Tuccimei, P.; Mollo, S.; Soligo, M.; Scarlato, P.; Castelluccio, M. Real-time setup to measure radon emission during rock deformation: Implications for geochemical surveillance. Geosci. Instrum. Methods Data Syst. Discuss. 2015, 4, 111–119. [Google Scholar] [CrossRef]
  26. Bauer, S.J.; Gardner, W.P.; Lee, H. Real Time Degassing of Rock during Deformation. In Proceedings of the 50th US Rock Mechanics/Geomechanics Symposium, Houston, TX, USA, 26–29 June 2016; pp. 1–7. [Google Scholar]
  27. Morales-Simfors, N.; Wyss, R.A.; Bundschuh, J. Recent progress in radon-based monitoring as seismic and volcanic precursor: A critical review. Crit. Rev. Environ. Sci. Technol. 2020, 50, 979–1012. [Google Scholar] [CrossRef]
  28. Reddy, D.V.; Nagabhushanam, P.; Sukhija, B.S.; Reddy, G.R. Continuous radon monitoring in soil gas towards earthquake precursory studies in basaltic region. Radiat. Meas. 2010, 45, 935–942. [Google Scholar] [CrossRef]
  29. Jilani, Z.; Mehmood, T.; Alam, A.; Awais, M.; Iqbal, T. Monitoring and descriptive analysis of radon in relation to seismic activity of Northern Pakistan. J. Environ. Radioact. 2017, 172, 43–51. [Google Scholar] [CrossRef]
  30. Barkat, A.; Ali, A.; Hayat, U.; Crowley, Q.G.; Rehman, K.; Siddique, N.; Haidar, T.; Iqbal, T. Time series analysis of soil radon in Northern Pakistan: Implications for earthquake forecasting. Appl. Geochem. 2018, 97, 197–208. [Google Scholar] [CrossRef]
  31. Saad, O.M.; Chen, Y.; Savvaidis, A.; Fomel, S.; Jiang, X.; Huang, D.; Oboué, Y.A.S.I.; Yong, S.; Wang, X.; Zhang, X.; et al. Earthquake Forecasting Using Big Data and Artificial Intelligence: A 30-Week Real-Time Case Study in China. Bull. Seismol. Soc. Am. 2023, 113, 2461–2478. [Google Scholar] [CrossRef]
Figure 1. Case study, location of the earthquake of 16 September 2024, with a local magnitude of 5.4. The crustal faults, distances from monitoring stations LOPR, BISRR, PANC, PLOR, Google Earth picture.
Applsci 15 07396 g001
Figure 2. Time series of radon and CO2 before the local magnitude 5.4 (Richter scale) earthquake at the Bisoca, Lopatari, and Panciu monitoring stations; Magnitude, Depth, and the OEF AFROS signal resulted from the decision matrix.
Applsci 15 07396 g002
Figure 3. Detecting events with the STA/LTA method was applied to the integrated time series of radon and CO2 (Figure 2) before the 5.4 local magnitude earthquake, compared with the OEF AFROS signal resulting from the decision matrix.
Applsci 15 07396 g003
Figure 4. The result of the decision matrix based on level detections. Columns in Table 1: Mean 4 Days (OEF AFROS), Mag R (loacal magnitude, ML), EnergyE, and EnergyE 4 Days.
Applsci 15 07396 g004
Figure 5. Data flow in updating the decision matrix.
Applsci 15 07396 g005
Figure 6. Analysis of radon and thoron as seismic precursors in Plostina and Vrancioaia.
Applsci 15 07396 g006
Figure 7. Radon dependence on meteorological conditions, case study earthquake with local magnitude 5.4, the red vertical bar marks the moment of the 5.4 magnitude earthquake.
Applsci 15 07396 g007
Figure 8. Radon dependence on soil deformation, case study earthquake with local magnitude 5.4, the red vertical bar marks the moment of the 5.4 magnitude earthquake.
Applsci 15 07396 g008
Figure 9. The seismicity of the Vrancea area, the “b” value (relationship 5) from the Gutenberg-Richter law (GR_b), and the Magnitude of completeness (Mc); R means Richter scale for magnitude, Mw is the moment magnitude.
Applsci 15 07396 g009
Table 1. Decision matrix.
Channel Weights0.1250.1250.1250.1250.1250.1250.1250.1251
StationBISRAERdBISRCO2DLMCO2DLMddLOPrCO2LOPRddNEHRddPANCddMean
Day
Mean
4 Days
OEF
AFROS
Mag
R
EnergyE × 1018 ErgEnergyE
4 Days × 1018 Erg
17 August 20242000140020.0703120.01757811.2; 0.63.2562 × 10−078.14048 × 10−08
18 August 2024000000030.0117180.0205078 08.14048 × 10−08
19 August 2024000000020.0078120.0224609 08.14048 × 10−08
20 August 2024000000020.0078120.02441402.36.803 × 10−072.51479 × 10−07
21 August 2024200000010.0117180.00976560.5; 1.33.3849 × 10−072.54696 × 10−07
22 August 20242000100000.0468750.01855462.58.2662 × 10−074.6135 × 10−07
23 August 20240000130000.0507810.0292968 04.6135 × 10−07
24 August 20240000210000.0820310.04785153.41.9005 × 10−067.664 × 10−07
25 August 20240000130000.0507810.0576171 06.81778 × 10−07
26 August 2024000030000.0117180.04882811.84.1085 × 10−075.77836 × 10−07
27 August 2024300000020.0195310.04101561.5; 1.66.3309 × 10−077.36108 × 10−07
28 August 2024200020000.0156250.02441403.4; 1.7; 2.63.1807 × 10−061.05615 × 10−06
29 August 2024100000000.0039060.01269532.69.0991 × 10−071.28363 × 10−06
30 August 2024100000000.0039060.01074213.62.2661 × 10−061.74745 × 10−06
31 August 20240000180000.0703120.0234375 01.58918 × 10−06
01 September 2024120000000.0117180.02246091.22.1647 × 10−078.48125 × 10−07
02 September 20242000160000.0703120.0390625 06.20648 × 10−07
03 September 20243000220000.0976560.06253.11.451 × 10−064.16859 × 10−07
04 September 20240000000000.04492180.904.16859 × 10−07
05 September 20240000000000.04199211.6; 1.7; 1.8; 2.9; 1.12.5152 × 10−069.91554 × 10−07
06 September 20240000000000.02441401.73.7027 × 10−071.08412 × 10−06
07 September 2024100000000.0039060.00097652.26.1627 × 10−078.75446 × 10−07
08 September 2024100000000.00390620.0019531 08.75446 × 10−07
09 September 2024200020010.0195310.00683591.5; 1.55.9951 × 10−073.96511 × 10−07
10 September 2024200000020.0156250.01074212; 1.4; 1.19.672 × 10−075.45744 × 10−07
11 September 2024100030010.0195310.0146484 03.91677 × 10−07
12 September 2024240090010.06250.0292968 03.91677 × 10−07
13 September 202412400400020.2617180.0898437 02.41801 × 10−07
14 September 2024000020020.0156250.08984371.63.3334 × 10−078.33342 × 10−08
15 September 20241000280020.1210930.11523431.73.7027 × 10−071.75902 × 10−07
16 September 2024200020010.0195310.10449215.4; 1;9.9126 × 10−062.65404 × 10−06
17 September 20240000000000.03906251.5; 0.84.3761 × 10−072.76344 × 10−06
Total3230002180024
Table 2. The monitoring stations used in the decision matrix.
StationLocationEquipmentNorthEastDescriptionStartEnd
BISRAERdBisocaAERC45.548126.7099Biscoca, radon25 February 2025to date
BISRCO2BisocaDL30345.548126.7099Bisoca CO2/CO09 July 2019to date
DLMCO2DalmaDL30345.362926.5965Dalma CO2/CO04 July 2022to date
DLMddDalmaRADONSCOUTp45.362926.5965Dalma, radon04 July 2022to date
LOPrCO2LopatariDL30345.473826.5680Mocearu, CO + CO226 June 2019to date
LOPRddLopatariRADONSCOUTp45.473826.5680Mocearu, radon06 August 2015to date
NEHRddNehoiuRADONSCOUTp45.427226.2952NEHR, radon06 August 2015to date
PANCddPanciuRADONSCOUTp45.872327.1477PANC, radon29 September 2021to date
Table 3. Distance from the epicenter to the monitoring stations, RE.
Earthquake 5.4 R, 16 September 2024, 45.527600°, 26.352500°
StationLatitude, LongitudeRE (Km)
BISRAERd, BISRCO2, Bisoca45.548300°, 26.709740°28.30
LOPrdd, LOPRCO2, Lopatari45.473715°, 26.568721°17.84
PANCdd, Panciu45.872272°, 27.147726°72.76
PLORCdd, Plostina45.851396°, 26.649772°34.10
VRICdd, VRI2dd, Vrancioia45.865695°, 26.727679°39.59
Table 4. Vrancea seismicity for earthquakes 17 August 2024–17 September 2024.
NTimeMLDepthLongitudeLatitudeMwPZone
RichterKmDegreesDegrees Km
117 August 2024 11:03:541.13.427.83345.5061.675.2
217 August 2024 19:01:290.623.326.596245.63521.434.1
320 August 2024 01:12:212.371.626.966245.74722.5112
421 August 2024 08:02:420.5525.111845.30591.383.9
521 August 2024 09:46:061.317.625.332345.27511.775.8
622 August 2024 17:15:512.575.726.63645.62112.6613.9
724 August 2024 17:12:463.4144.626.536445.65923.3126.5
826 August 2024 22:43:371.822.326.913745.39752.037.4
927 August 2024 08:42:291.56.925.751346.12021.876.4
1027 August 2024 21:25:541.629.427.17745.86241.926.7
1128 August 2024 02:29:023.4138.226.540745.66083.3126.5
1228 August 2024 09:16:361.7525.778546.06381.977.1
1328 August 2024 21:22:122.689.326.799145.8672.7314.9
1429 August 2024 15:33:222.6131.626.559245.65292.7314.9
1530 August 2024 19:12:553.673.426.659745.78763.4530.6
1601 September 2024 11:43:251.223.326.66345.61641.725.5
1703 September 2024 16:50:433.1120.526.431845.49363.0921.3
1804 September 2024 21:39:130.9327.796745.50731.574.7
1905 September 2024 02:43:441.613.327.312545.70811.926.7
2005 September 2024 02:46:091.724.127.235445.68581.977.1
2105 September 2024 10:32:281.87.525.300445.30162.037.4
2205 September 2024 12:11:122.9126.226.777845.76782.9518.5
2305 September 2024 15:16:041.16.327.809145.52811.675.2
2406 September 2024 09:55:211.78.925.729546.07221.977.1
2507 September 2024 21:57:432.2135.526.632245.76382.4411.2
2607 September 2024 21:57:432.213526.616745.75852.4411.2
2709 September 2024 09:21:331.514.225.642246.1651.876.4
2809 September 2024 13:25:321.530.927.308145.87531.876.4
2910 September 2024 06:58:56226.527.294845.78962.138.2
3010 September 2024 10:52:161.414.925.335545.2731.826.1
3110 September 2024 23:36:401.11826.534545.48521.675.2
3214 September 2024 15:06:501.6114.326.302645.48523.2424.6
3315 September 2024 17:27:591.717.927.823545.70481.977.1
3416 September 2024 14:40:225.4126.826.352545.52765.02144.1
3516 September 2024 16:08:22112.227.805345.52031.625
3617 September 2024 11:33:181.5825.286445.2921.876.4
3717 September 2024 18:15:350.8525.346945.36461.524.5
Disclaimer/Publisher’s Note: The statements, opinions and data contained in all publications are solely those of the individual author(s) and contributor(s) and not of MDPI and/or the editor(s). MDPI and/or the editor(s) disclaim responsibility for any injury to people or property resulting from any ideas, methods, instructions or products referred to in the content.

