Article

The Influence of Mixed Filter Materials on the Performance of Biological Slow Filtration in Rainwater Treatment

School of Civil Engineering and Architecture, Hainan University, Haikou 570228, China
*
Author to whom correspondence should be addressed.
Appl. Sci. 2025, 15(13), 7394; https://doi.org/10.3390/app15137394
Submission received: 13 May 2025 / Revised: 21 June 2025 / Accepted: 28 June 2025 / Published: 1 July 2025

Abstract

Freshwater resources are scarce in tropical island areas. Treating rainwater to produce drinking water through biological slow filtration (BSF) technology can significantly alleviate the problem of freshwater shortages. The characteristics of the filter material are the key factors determining the decontamination performance of BSF technology. However, most existing studies focus on a single filter material. This study was conducted using volcanic rock and coconut shell activated carbon to compare their pollutant removal characteristics in slightly polluted rainwater during the early stage of BSF operation (from the start of operation to day 6, with the first sampling time being 48 h after operation) and during the stable stage (26 days later) and further explore the influence of their mixing ratio. The results show that in the early stages of operation, the pollutant removal performance of volcanic rock and coconut shell activated carbon is better than that of quartz sand. Among them, coconut shell activated carbon showed average removal rates for NH3-N, TOC, and Cr(VI) that were 6.72, 8.46, and 19.01 percentage points higher than those of volcanic rock, respectively, but its average turbidity removal rate decreased by 5.00%. The removal effect of the mixed filter material was enhanced through the synergistic adsorption mechanism, but most of the improvements were within the standard deviation range and did not exceed the removal range of the single filter material. When the mixing ratio was 1:3, the average total organic carbon removal rate of the filter material was 71.51 ± 0.64%, approximately 0.96 percentage points higher than that of coconut shell activated carbon (70.55 ± 0.42%). While coconut shell activated carbon showed the best removal effect among all single filter materials, this improvement was still within the standard deviation range.

1. Introduction

With the continuous expansion of human activities and the growth of industrial and agricultural production, the problem of freshwater scarcity has become increasingly prominent [1]. The United Nations 2030 Agenda identifies the shortage of freshwater resources as a key factor restricting global sustainable development in the 21st century [2]. While central cities can efficiently address freshwater issues through collective water supply systems, remote rural or island areas often suffer from severe water supply challenges due to inadequate infrastructure. To tackle this challenge, researchers have begun focusing on the collection and utilization of rainwater as a vital means of replenishing water resources. Rainwater collection and utilization have been successfully implemented in various regions; for example, in rural areas of India, rainwater is collected by installing troughs on rooftops, saving 25% of non-potable water usage [3]. In Jordan, the rainwater collected from residential rooftops can meet 5.6% of the total annual domestic water consumption [4]. However, in most areas, collected rainwater is limited to non-potable uses, representing a significant waste of resources in tropical island regions where freshwater resources are already scarce. These areas, constrained by their unique geographical structures, face particularly acute freshwater shortages. Existing freshwater resources often fail to meet the production and living needs of island residents. However, the region experiences abundant rainfall; if collected rainwater can be effectively treated and converted into drinking water, it would significantly alleviate the water shortage for island residents.
Rainwater is influenced by both human and natural factors and often contains a substantial amount of pollutants. Common pollutants include suspended particulate matter (turbidity), nitrogen and phosphorus nutrients (such as ammonia nitrogen (NH3-N) and total phosphorus (TP)), organic pollutants (such as total organic carbon (TOC) and humic acid), heavy metals (such as Pb2+ and Cu2+), and pathogenic microorganisms [5]. If these pollutants are consumed directly without treatment, they may threaten human health. Biological slow filtration (BSF) technology, initially developed by Jhon Gibb from the United Kingdom, offers advantages such as a simple process flow, low water production costs, convenient management and maintenance, and the ability to remove pollutants without the need for additional purification and disinfection agents. This technology has gradually been promoted and applied in resource-scarce areas [6]. BSF is a complex physical, chemical, and biological process that integrates filter media filtration, biological adsorption/degradation, electrostatic adsorption, and chemical precipitation, resulting in the joint removal of pollutants by filter media and microorganisms [7,8]. This technology has unique advantages in rainwater treatment: its slow filtration rate (0.1–0.3 m/h) provides sufficient time for microbial metabolism and is suitable for treating rainwater with a low pollutant load but complex composition. Additionally, the feature of not requiring chemical agents mitigates the risk of secondary pollution, making it particularly suitable for remote islands with limited resources [6]. Existing studies have demonstrated that BSF can effectively remove pollutants such as turbidity, NH3-N, and organic matter from rainwater. For instance, Li Jimin et al. treated slightly polluted cellar water using a BSF system with volcanic rock filter media, achieving a turbidity removal rate exceeding 97% during the stable period [9]. Rahmadyanti et al. utilized Moringa seeds, coconut shells, and lava as filter media in the BSF system to treat rainwater, successfully removing significant amounts of Escherichia coli, total dissolved solids (TDS), Fe, Pb2+, Cd2+, and NH3-N [10].
The factors influencing the decontamination effect of the BSF reactor include filter material type, hydraulic load, temperature, oxygen levels, filtration rate, and filter layer thickness. Among these, the characteristics of the filter material are crucial for determining the decontamination effect of the BSF reactor [11]. Researchers have extensively investigated filter material characteristics to enhance pollutant removal efficiency, including modifying existing filter materials, developing new types, and layering different filter materials. Wang Wenxi et al. selected quartz sand and activated carbon as filter materials to treat turbidity, NH3-N, chemical oxygen demand of manganese (CODMn), UV absorbance measurements at 254 nm (UV254), and TOC in slightly polluted lake water. Their results indicated that after biofilm formation, the pollutant removal rates of activated carbon surpassed those of quartz sand, reaching 92.18%, 65.53%, over 70%, and 60.99%, respectively [12]. Liu et al. used quartz sand of varying particle sizes as filter materials to remove turbidity, NH3-N, and dissolved organic carbon (DOC) from drinking water, achieving, after biofilm formation was completed, average pollutant removal rates of up to 93.42%, 97.25%, and 53.7%, respectively [8]. Qian et al. employed fine sand, fine gravel, and coarse gravel as filter materials. By layering different filter materials, they achieved efficient Escherichia coli removal at a rate of 95% through layered configurations [13]. Azis designed a sand filter and an activated carbon filter device, connecting the outlet of the sand filter to the inlet of the activated carbon filter to operate in series, achieving a chemical oxygen demand (COD) removal rate of 89.5% [14]. Ma Jinye et al. improved zeolite to enhance turbidity, UV254, CODMn, NH3-N, and TP removal effects. Zhou et al. [15] modified natural zeolite (Z-Na-Fe) with polymeric ferric sulfate activated by sodium chloride to improve the removal effects of NH3-N and phosphorus in cellar water, achieving removal rates of 82.81% and 77.30%, respectively [16].
Most of the aforementioned research has concentrated on the removal performance of single filter materials, while studies on the decontamination performance of mixed filter materials remain relatively scarce. This study employs volcanic rock and coconut shell activated carbon with the same particle size range as filter materials to investigate the performance of a BSF reactor in removing slightly polluted rainwater under both single and mixed filter material conditions.

2. Materials and Methods
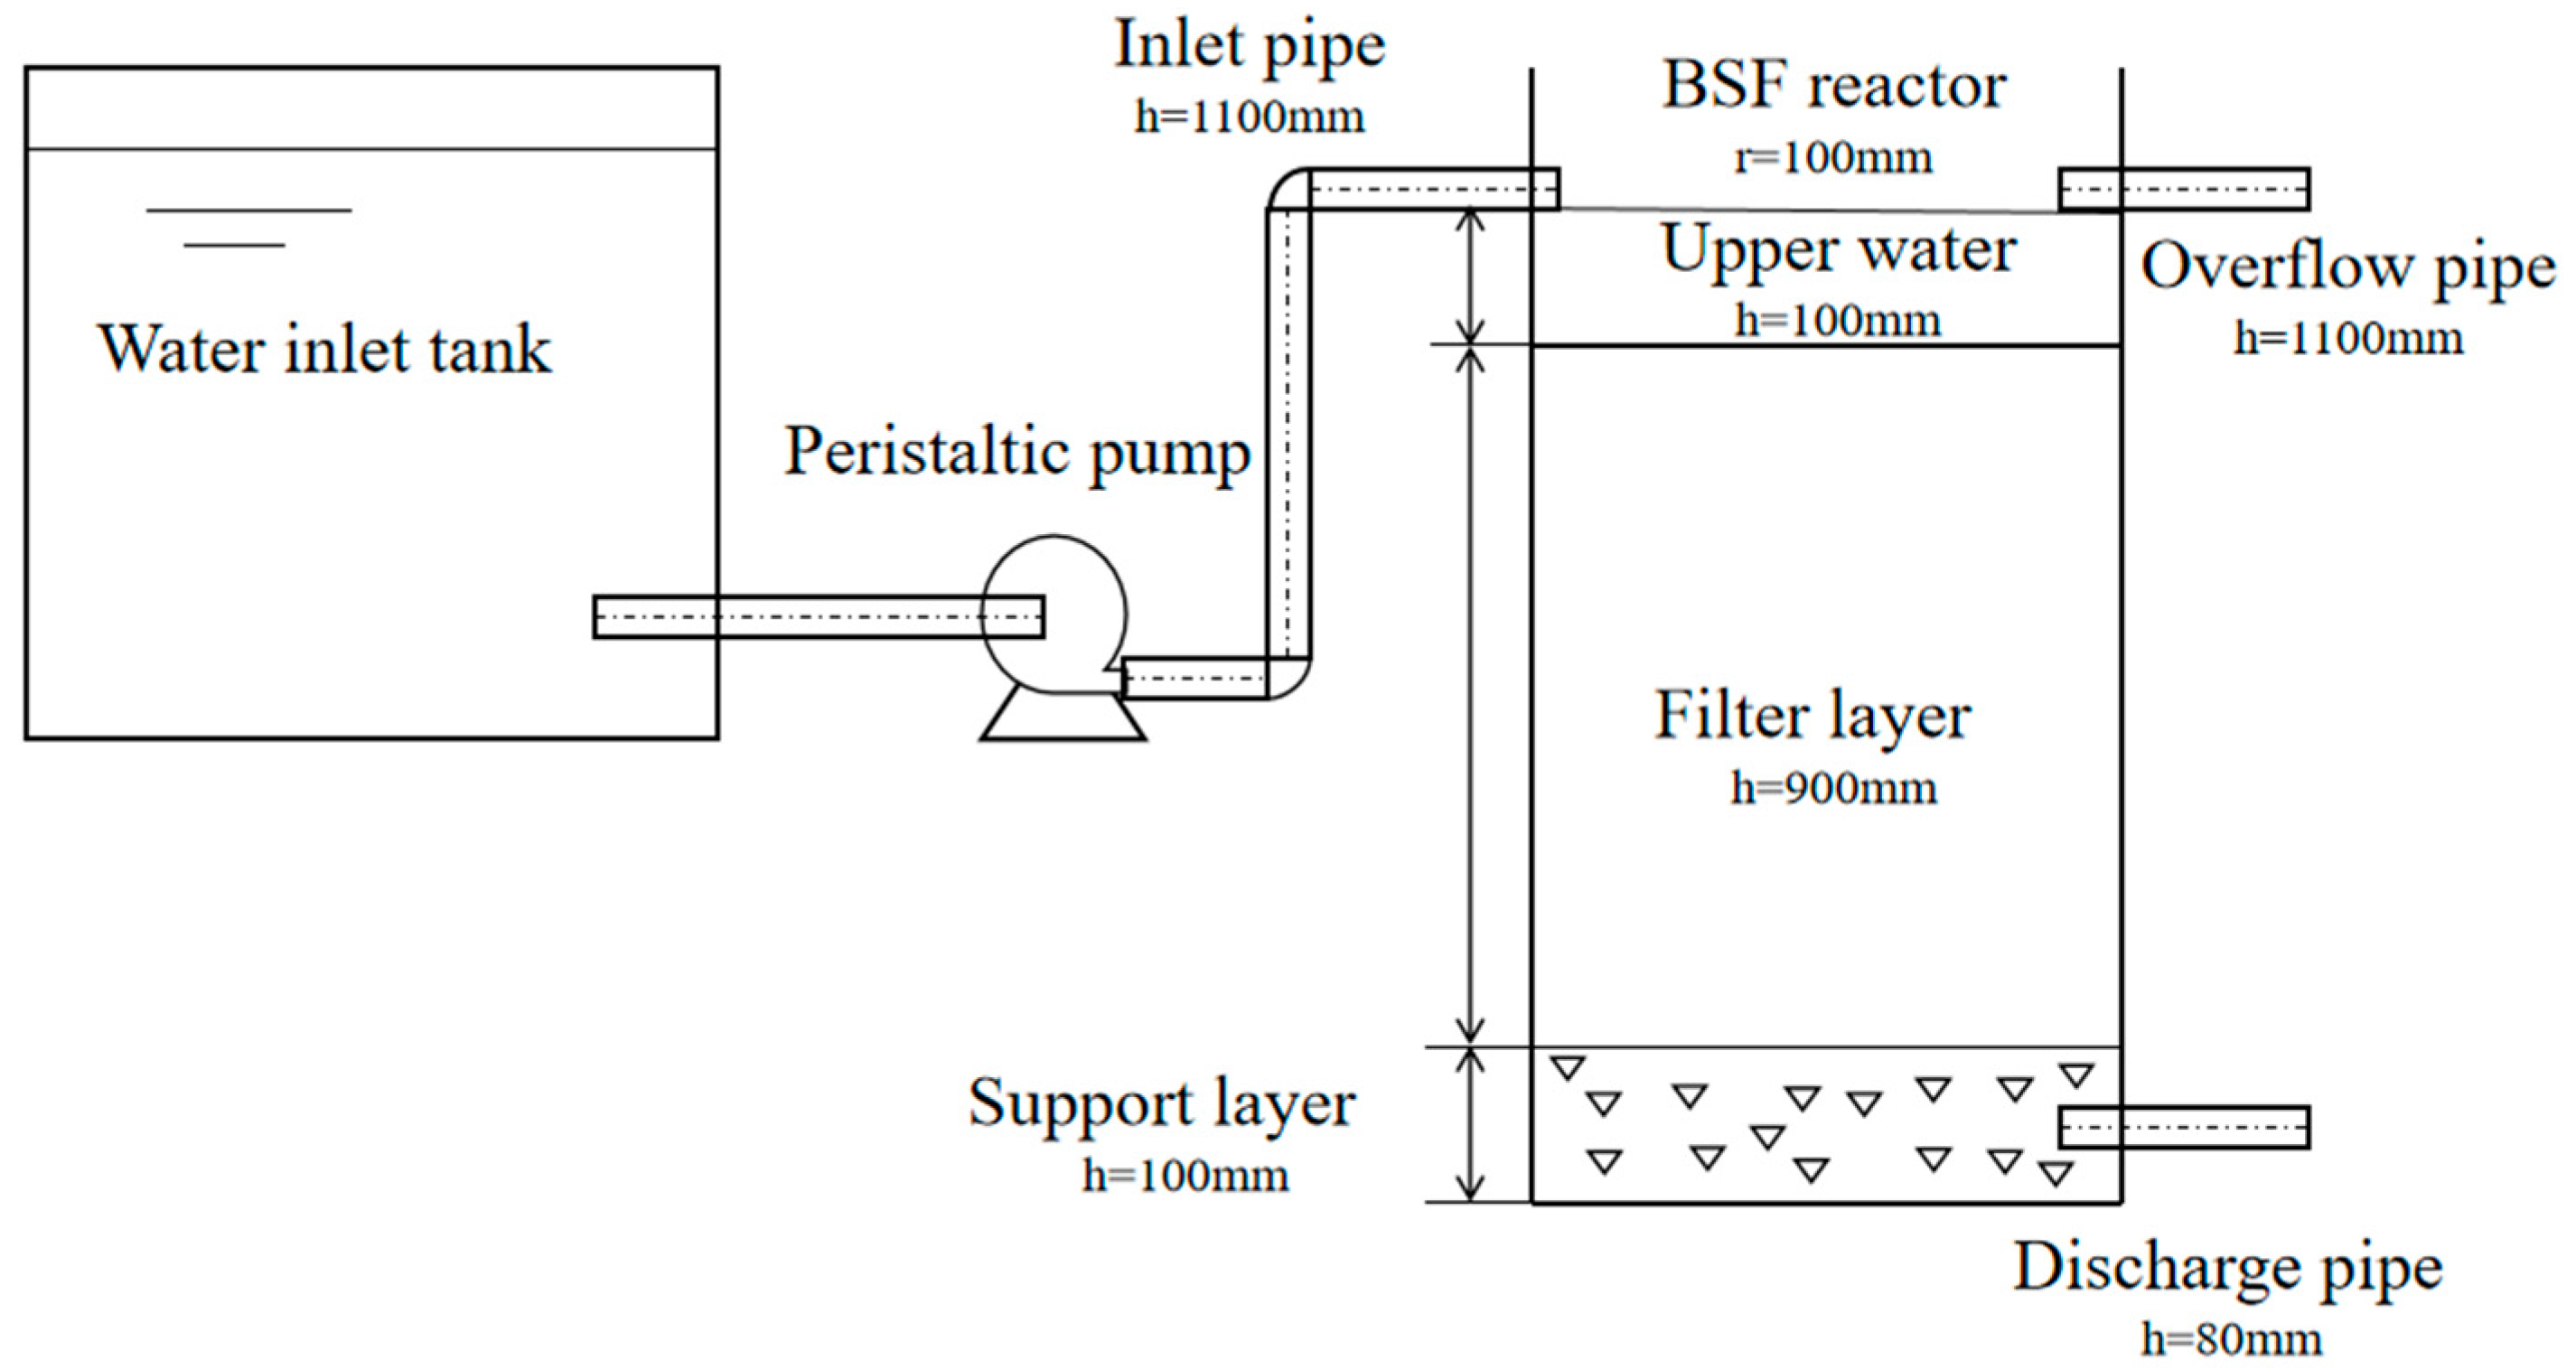
2.1. Test Device

A schematic diagram of the BSF system is shown in Figure 1. This device consists of an inlet water tank, a peristaltic pump, and a biological slow filtration reactor (referred to as the BSF reactor). The BSF reactor, the core component of this test, was custom-made by Shanghai Jingxi Acrylic Products Co., Ltd. (Shanghai, China). It is constructed from polyvinyl chloride material, with an inner diameter of 0.1 m and a height of 1.2 m. Each BSF reactor is equipped with outlet, supply, and overflow pipes arranged on its side. The height of the outlet pipe is 0.08 m, while the heights of both the supply and overflow pipes are 1.1 m.
The BSF reactor is divided into two parts: the upper part, which contains the filter material layer responsible for adsorbing and filtering pollutants from the water and cultivating microorganisms, has a designed height of 0.9 m. The lower part serves as a supporting layer, primarily preventing the loss of filter media from the filter material layer, with a designed height of 0.1 m. The flow rate of the water supply pipe is set higher than the filtration rate of the BSF reactor (0.2 m/h), with excess water returned to the inlet water tank through the overflow pipe.

2.2. Test Filter Material

In this study, volcanic rock filter media, coconut shell activated carbon filter media, and quartz sand filter media—widely used and abundantly available locally—were selected. These three types of filter materials were purchased from local manufacturers (Haikou and Hainan). The manufacturer of coconut shell activated carbon is Xinghongxing Environmental Protection Materials Co., Ltd. (Linyi, China), and the production method is physical. Quartz sand was categorized into three particle sizes: fine sand (0.5–1 mm), medium sand (2–4 mm), and coarse sand (4–8 mm). The medium and coarse sand served as the supporting layer filter media for the BSF reactor, filled from top to bottom in sequence, while fine sand was used as the test control filter media for the filter material layer of the BSF reactor. The particle size selection for volcanic rock and coconut shell activated carbon matched that of fine quartz sand.
The characteristics of volcanic rock and coconut shell activated carbon were analyzed using a fully automatic specific surface area and porosity analyzer (ASAP 2460, Micromeritics, Norcross, GA, USA). The specific test conditions are as follows: the sample is vacuum-degassed at 300 °C for 4 h, the sample volume is approximately 1.0 g, the specific surface area is calculated using the multi-point BET method, and the relative pressure range is 0.05–0.30 P/P0 [17]. The iodine adsorption value of coconut shell activated carbon was determined to be 700 mg/g according to GB/T 12496.8-2015 “Test Methods for Wood Activated Carbon—Determination of Iodine Adsorption Value” [18,19]. The characteristics of the filter material and the main elemental composition are shown in Table 1 and Table 2, respectively.

2.3. Test Water

Rainwater was collected from the roof of a building in Hainan Province, which was divided into accessible and non-accessible sections. It was collected and analyzed multiple times, with the collection time being the first hour after each rainfall. Water quality analysis was conducted in accordance with the “Hygienic Standard for Drinking Water” of China (GB 5749-2022) [20]. The collected rainwater quality parameters are shown in Table 3.
Analysis revealed that the indicators for turbidity, NH3-N, TOC, and Cr(VI) levels in the water exceeded standard limits. Theoretically, due to the influence of both human and natural factors, the total number of colonies and Escherichia coli in rainwater should have exceeded standard levels. However, possibly due to frequent rainfall at the test site, good air quality, and sampling within one hour after the rain began, the accumulation of pollutants on the roof surface was relatively minimal. Additionally, test results for heavy metals and toxic metals indicated that all indicators, except Cr(VI), met the standards for domestic drinking water. This may be due to excessive Cr(VI) in the water caused by the penetration of roof waterproofing materials.
To ensure the stability of the daily test water and the accuracy of the test data, synthetic water was used as the test water. The concentration of the test water is shown in Table 4. Using tap water that had been exposed to sunlight for a day as the base, we added the following reagents in the stated proportions:
(1)
analytical-grade pure ammonium chloride (NH4Cl) to achieve an NH3-N concentration of 1.2–1.4 mg/L (calculated as N);
(2)
sieved (<0.1 mm) air-dried soil to achieve a turbidity of 14–15 NTU;
(3)
analytical-grade potassium dichromate (K2Cr2O7) solution to achieve a Cr(VI) concentration of 0.05–0.06 mg/L;
(4)
analytical-grade humic acid to achieve a TOC concentration of 15.0–16.0 mg/L.
A magnetic stirrer was used to stir the mixture for 10 min every 2 h, taking the supernatant as the test water.

2.4. Water Sample Collection and Analysis

Water samples from the outlet and inlet tanks were collected every two days, with three samples taken each time for analysis. The pollutants in the water were measured according to (GB/T 5750-2023) “Standard Test Methods for Drinking Water” [21], and the pollutant removal performance of the BSF reactor was analyzed. The detection methods and instruments used to determine each pollutant index are shown in Table 5.
The determination methods used to determine each pollutant index are as follows:
(1)
Turbidity: The scattering intensity of light by suspended particles in water was measured using spectrophotometry (680 nm) with a turbidity meter.
(2)
NH3-N: Nessler’s reagent spectrophotometric method was employed, wherein the reagent reacts with ammonia to form a yellow-brown complex, and colorimetric quantification was performed at 420 nm.
(3)
TOC: The spectral water quality detection method decomposes organic matter through high-temperature catalytic oxidation, detecting the generated CO2 concentration and converting it into the TOC value.
(4)
Cr(VI): The diphenylcarbazide spectrophotometric method was utilized, in which Cr(VI) reacts with diphenylcarbazide under acidic conditions to form a purple-red complex, with absorbance measured at 540 nm.

2.5. Test Scheme

During the early operation stage of the BSF reactor, there is less biological growth on the surface of the filter material. The pollutants in the water are mainly removed through the physical adsorption and chemical reactions of the filter material itself [9]. As pollutants are continuously adsorbed, a substantial amount of nutrients is provided for microorganisms, leading to the gradual formation of a biofilm on the filter material’s surface. The efficiency of pollutant removal is enhanced through the adsorption and degradation of pollutants by microorganisms in the biofilm [10]. As the operation time of the BSF reactor increases, the bioadsorption and degradation effects of microorganisms gradually dominate [12]. This paper analyzes the decontamination performance of the filter material in two stages: the early operation stage of the BSF reactor (0–6 days, with the first sampling time being 48 h) and the stable removal rate (after 26 days).
The factors influencing the decontamination effect of the BSF reactor mainly include filter material type, hydraulic load, temperature, oxygen, filtration rate, and filter layer thickness [11]. This paper primarily discusses the influence of filter material types and mixed filter materials on the decontamination effect, aiming to eliminate the interference of other factors on the test results. Under conditions of the same influent water quality, a constant temperature of 24 °C, and a filtration rate of 0.2 m/h, the decontamination effect of the BSF reactor was tested simultaneously. The pollutant indicators detected included turbidity, NH3-N, TOC, and Cr(VI).
In this study, the height of the filter-media layer in the BSF reactor was 0.9 m, and the filtration rate was 0.2 m/h. Therefore, the hydraulic retention time (HRT) was calculated as follows: HRT = Height of the filter-media layer/Filtration rate = 0.9 m ÷ 0.2 m/h = 4.5 h.
The pollutant loading rate was calculated based on the concentration of the test water and the filtration rate, as follows:
(1)
Turbidity loading rate: 14–15 NTU × 0.2 m/h = 2.8–3.0 NTU·m/h
(2)
NH3-N loading rate: 1.2–1.4 mg/L × 0.2 m/h = 0.24–0.28 mg/(L·h)
(3)
TOC loading rate: 15.0–16.0 mg/L × 0.2 m/h = 3.0–3.2 mg/(L·h)
(4)
Cr(VI) loading rate: 0.05–0.06 mg/L × 0.2 m/h = 0.01–0.012 mg/(L·h)
The mixed filter material was prepared using the uniform mixing method: volcanic rock and coconut shell activated carbon were thoroughly stirred in a container in a mass ratio (e.g., 1:3) and then filled layer by layer into the filter material layer of the BSF reactor to ensure uniform particle distribution. Among them, 1# served as the control group with quartz sand as the filter material; 2#, 3#, 4#, 5#, and 6# were the experimental groups, employing single and mixed filter media. The parameters of the filter media are shown in Table 6. The single filter media reactor is depicted in Figure 2a, with coconut shell activated carbon, volcanic rock, and quartz sand arranged from left to right. The mixed filter media reactor is shown in Figure 2b, with the mixing ratios from left to right being 1:3, 1:1, and 3:1, respectively. Prior to testing, all the filter materials were cleaned, dried in the sun, and sieved.

3. Results and Discussion

3.1. The Removal Effect of a Single Filter Material

3.1.1. The Turbidity Removal Effect

Figure 3 illustrates the turbidity removal effect of a single filter material over 36 days. In the early stage of operation, biological growth in the system is minimal, and turbidity removal primarily relies on the filtration and retention capabilities of the filter material [22]. The removal effects of volcanic rock (91.46 ± 0.99%) and coconut shell activated carbon (86.47 ± 0.36%) on turbidity were much higher than those of quartz sand (83.87 ± 1.11%). The removal rate was analyzed using a one-way analysis of variance (ANOVA) and Dunnett’s multiple comparison test. The results showed that p < 0.05. This indicates that in the initial stage of operation, the characteristics of the filter material are crucial for achieving the turbidity removal effect. Meanwhile, the average removal rate of volcanic rock is 4.99 percentage points higher than that of coconut shell activated carbon. The porous structure of volcanic rock enables it to retain suspended particles more effectively, thereby enhancing removal efficiency. In contrast, the microporous structure of coconut shell activated carbon can lead to clogging when retaining larger suspended particles, negatively impacting its removal rate [23]. Consequently, during the early stage of operation, volcanic rock outperformed coconut shell activated carbon in turbidity removal.
As the system’s operation time increases, the growth of microorganisms on the surface of the filter material gradually increases, and a dense biofilm is gradually formed on the surface layer of the filter material. Through the flocculation and adsorption effect of the biofilm, suspended particles are efficiently removed, and the removal rate is continuously improved [22]. After 26 days of system operation, it was observed that the turbidity removal rates of the three filter materials all reached a stable state. Among them, the turbidity removal rates of volcanic rock (97.36 ± 0.08%) and coconut shell activated carbon (94.93 ± 0.26%) were significantly (p < 0.05) higher than that of quartz sand (93.28 ± 0.25%). Among them, the average removal rate of volcanic rock was the highest, 2.43 percentage points higher than that of coconut shell activated carbon. Previous studies have indicated that the presence of calcium can enhance the coagulation effect of microorganisms, significantly increasing biofilm density and improving the retention capacity for suspended particles [24]. Elemental analysis of the filter materials revealed that volcanic rock contains a much greater amount of Ca than coconut shell activated carbon. Therefore, during the stable period, the removal effect of volcanic rock on turbidity is better than that of coconut shell activated carbon.

3.1.2. The NH3-N Removal Effect

Figure 4 presents the NH3-N removal effect of a single filter material over 36 days. In the early stage of operation, biological growth in the system is limited, and the removal of NH3-N mainly relies on the adsorption and interception capabilities of the filter material [22]. The removal effects of volcanic stone (80.10 ± 2.63%) and coconut shell activated carbon (86.82 ± 2.53%) on NH3-N were significantly better than those of quartz sand (69.07 ± 1.43%) (p < 0.05), indicating that in the initial stage of operation, the characteristics of the filter material are crucial for the removal of NH3-N. In addition, the average removal rate of coconut shell activated carbon is 6.72 percentage points higher than that of volcanic rock. The adsorption and retention of NH3-N by filter materials depend mainly on physical adsorption, supplemented by ion exchange [25]. Coconut shell activated carbon’s superior adsorption and retention of NH3-N can be attributed to its high specific surface area and the abundance of oxygen-containing functional groups on its surface. Although volcanic rock has a smaller specific surface area, its high concentrations of iron, magnesium, and calcium enable it to engage in ion exchange reactions with NH4+ in solution, resulting in slightly weaker adsorption and retention compared to coconut shell activated carbon.
As the system’s operation time increased, the bioadsorption and degradation effects of the biofilm intensified. NH3-N removal occurred through the nitrification reactions of nitrifying bacteria, leading to an upward trend in removal rates [26]. On the 26th day of operation, the NH3-N removal rates for all three single filter materials stabilized. Coconut shell activated carbon maintained the highest NH3-N removal rate (98.90 ± 0.42%), followed closely by volcanic rock (98.77 ± 0.99%) and quartz sand (97.55 ± 1.25%). Previous studies have indicated that elements such as iron and Mg can promote the growth and reproduction of microorganisms, accelerating the synthesis of enzymes related to autotrophic bacteria and thereby enhancing the removal capacity of nitrifying bacteria [27,28]. Elemental analysis of the filter materials revealed that volcanic rock contains significantly higher levels of calcium than coconut shell activated carbon. Theoretically, volcanic rock should perform better in removing NH3-N. However, the lower concentration of NH3-N in the water may account for the similar removal rates of both materials, each approaching 100%.

3.1.3. The TOC Removal Effect

Figure 5 illustrates the removal effect of a single filter material on TOC over 36 days. In the initial operation stage, due to limited biological growth, TOC removal primarily relies on the adsorption and retention capabilities of the filter material [22]. The TOC removal rates of coconut shell activated carbon (51.80 ± 0.21%) and volcanic rock (43.34 ± 1.25%) were both significantly (p < 0.05) higher than those of quartz sand (29.60 ± 0.32%). Among them, the average removal rate of coconut shell activated carbon was the highest, 8.46 percentage points higher than that of volcanic rock. The adsorption and retention of TOC by filter materials are primarily achieved through electrostatic and non-electrostatic effects [28]. Coconut shell activated carbon’s superior adsorption and retention capabilities stem from its high specific surface area. In contrast, volcanic rock’s smaller specific surface area results in a relatively weaker adsorption and retention of TOC.
With the extension of the system operation time, the bioadsorption of the biofilm and the degradation of microorganisms gradually increase, and the TOC removal rate continues to rise. After 26 days of operation, the TOC removal rates of all three filter materials stabilized. At this time, the TOC removal rates of volcanic rock (70.55 ± 0.42%) and coconut shell activated carbon (68.60 ± 0.42%) were both significantly (p < 0.05) higher than that of quartz sand (49.62 ± 0.70%). Among them, the average removal rate of volcanic rock was the highest, 1.95 percentage points higher than that of coconut shell activated carbon. Previous studies have indicated that elements such as calcium, iron, and magnesium can enhance biofilm density, promote microorganism growth and reproduction, and accelerate the synthesis of related enzymes, thereby improving the adsorption and degradation capacity of biofilms [24,27,29]. Elemental analysis of the filter materials revealed that volcanic rock contains significantly higher levels of calcium, iron, and magnesium than does coconut shell activated carbon. Consequently, after the system reached a stable period, volcanic rock demonstrated superior TOC removal compared to coconut shell activated carbon.

3.1.4. The Cr(VI) Removal Effect

Figure 6 presents the Cr(VI) removal effect of a single filter material over 36 days. In the initial operation stage, due to limited biological growth, Cr(VI) removal primarily relies on the physical and chemical effects of the filter material, including electrostatic adsorption and the chemical reduction of Cr(VI) to Cr(III) through the interactions of metal cations on the surface of volcanic rock, functional groups on the surface of coconut shell activated carbon, and reducing substances. Subsequently, a chromium hydroxide precipitate is formed [30,31]. Among them, the Cr(VI) removal rates of coconut shell activated carbon (61.30 ± 5.37%) and volcanic rock (42.29 ± 5.00%) were significantly better than that of quartz sand (14.56 ± 6.09%) (p < 0.05). Meanwhile, it was observed that coconut shell activated carbon had the best removal effect on Cr(VI), with an average removal rate of 19.01 percentage points higher than that of volcanic rock. This shows that in the initial stage of operation, coconut shell activated carbon had the best removal effect on Cr(VI) because of its high specific surface area and surface reducing substances, followed by volcanic rock.
As the system’s operation time increased, the degradation effect of microorganisms intensified. Some facultative anaerobic microorganisms (such as Bacillus and Pseudomonas) participate in the reduction process of Cr(VI) through enzymatic reactions. Under anaerobic conditions, these microorganisms can use Cr(VI) as an electron acceptor, further enhancing the removal rate [32]. Studies have shown that this type of microorganism can secrete reductase, which is highly active in neutral to warm environments with a pH of 6–8 and a temperature of 20–30 °C, which aligns with the constant temperature of 24 °C in this experiment [31]. After 26 days of operation of the BSF reactor, the Cr(VI) removal rates of all three filter materials reached a stable state. Among them, the removal rates of volcanic stone (93.39 ± 1.69%) and coconut shell activated carbon (90.60 ± 2.08%) were significantly (p < 0.05) higher than that of quartz sand (68.46 ± 2.89%). Among them, the average removal rate of volcanic stone was the highest, 2.79 percentage points higher than that of coconut shell activated carbon. When the system reached a stable stage, volcanic rock outperformed coconut shell activated carbon in Cr(VI) removal. This might be attributed to the abundance of Ca, Fe, and magnesium in volcanic rock, which can promote the biological activity of anaerobic microorganisms (such as Bacillus and Pseudomonas), thereby enhancing Cr(VI) removal. Further exploration of volcanic rock properties revealed that its unique pore structure and rich mineral composition play a key role in the Cr(VI) removal process. These characteristics not only provide more attachment sites for microorganisms but also facilitate interactions between microorganisms and Cr(VI), accelerating the reduction and immobilization process of Cr(VI).

3.2. The Removal Effect of the Mixed Filter Material

The decontamination performance of the mixed filter material comprising volcanic rock and coconut shell activated carbon was investigated. By proportionally mixing volcanic rock and coconut shell activated carbon, we examined their removal effects on turbidity, NH3-N, TOC, and Cr(VI) in water bodies.

3.2.1. The Turbidity Removal Effect

Figure 7 shows the turbidity removal effect of single volcanic rock and coconut shell activated carbon filter media and their mixed filter media over 36 days. In the initial stage of operation, the mixed filter material with a mixing ratio of 3:1 (Reactor 6#) had the best turbidity removal effect compared with other mixed filter materials (Reactors 4# and 5#), with a removal rate of 92.71 ± 0.42%. Previous studies have found that among single filter media, Reactor 2# has the best turbidity removal effect. Through comparison, it was found that the average removal rate of Reactor 6# was 1.25 percentage points higher than that of Reactor 2#. Although the mixture of volcanic rock and coconut shell activated carbon filter material forms a multi-level pore structure, which enhances the filtration and retention effect of the filter material and improves its removal effect, this difference is masked by the standard deviation of the two, indicating that the performance boundary of a single filter material has not been significantly broken through. This is due to the fact that the porous structure of volcanic rock and the high specific surface area of activated carbon do not produce an effective complementary effect. After 26 days of operation of the BSF reactor, the turbidity removal rate reached a stable state. Reactor 6# has the best turbidity removal effect, which is 0.09 percentage points higher than that of Reactor 2#. Similarly, this difference is covered by the standard deviations of the two, indicating that it does not significantly exceed the performance boundary of a single filter material. This is due to the fact that the porous structure of volcanic rocks and the high specific surface area of activated carbon do not effectively complement each other, and also to the influence of the uniformity of microbial community distribution.

3.2.2. The NH3-N Removal Effect

Figure 8 shows the NH3-N removal effect of single volcanic rock and coconut shell activated carbon filter media and their mixed filter media over 36 days. In the initial stage of operation, the mixed filter material with a mixing ratio of 1:3 (Reactor 5#) had the best NH3-N removal rate compared with other mixed filter materials (Reactors 4# and 6#), and the removal rate reached 88.97 ± 1.11%. It was found in a previous study that among single filter materials, Reactor 3# had the best removal effect on NH3-N. Through comparison, it was found that the average removal rate of Reactor 5# was 2.15 percentage points higher than that of Reactor 3#. Although the mixture of volcanic rock and coconut shell activated carbon filter material formed a multi-level pore structure, which enhanced the adsorption and retention effect and improved the removal efficiency of the filter material, this difference was masked by the standard deviation of the two. This indicates that the performance boundary of the single filter medium was not significantly broken through. This is due to the fact that the porous structure of volcanic rock and the high specific surface area of activated carbon do not produce an effective complementary effect. After 26 days of operation of the BSF reactor, the NH3-N removal rate reached a stable state. Reactor 5# has the best removal effect on NH3-N, which is 0.37 percentage points higher than that of Reactor 3#. Similarly, this difference is covered by the standard deviations of the two, indicating that it does not significantly exceed the performance boundary of a single filter material. This is due to the fact that the porous structure of volcanic rocks and the high specific surface area of activated carbon do not effectively complement each other, and also to the influence of the uniformity of microbial community distribution.

3.2.3. The TOC Removal Effect

Figure 9 shows the TOC removal effect of single volcanic rock and coconut shell activated carbon filter media and their mixed filter media over 36 days. In the initial stage of operation, the mixed filter media with a mixing ratio of 1:3 (Reactor 5#) had the best TOC removal rate compared with other mixed filter media (Reactors 4# and 6#), with a removal rate of 54.97 ± 1.08%. In previous studies, it was found that among single filter media, Reactor 3# had the best removal effect on TOC. Through comparison, it was found that the average removal rate of Reactor 5# was 2.15 percentage points higher than that of Reactor 3#. By mixing volcanic rock with coconut shell activated carbon filter material, a multi-level pore structure is formed, which enhances the filtration and retention effect of the filter material and improves its removal effect. After 26 days of operation of the BSF reactor, the TOC removal rate reached a stable state. Reactor 5# has the best removal effect on TOC, which is 0.96 percentage points higher than that of Reactor 3#. This difference is masked by the standard deviations of the two, indicating that it does not significantly exceed the performance boundary of a single filter material. This is related to the influence of the uniformity of the distribution of microbial communities.

3.2.4. The Cr(VI) Removal Effect

Figure 10 shows the Cr(VI) removal effect of single volcanic rock and coconut shell activated carbon filter media and their mixed filter media over 36 days. In the early stage of operation, the mixed filter material with a mixing ratio of 1:3 (Reactors 5#) performed the best in the removal of Cr(VI) compared with other mixed filter materials (Reactors 4# and 6#), with a removal rate of 72.19 ± 4.93%. Previous studies have found that among single filter media, Reactors 3# has the best removal effect on Cr(VI). Through comparison, it was found that the average removal rate of Reactors 5# was 10.89 percentage points higher than that of Reactors 3#. By mixing volcanic rock with coconut shell activated carbon filter material, a multi-level pore structure is formed, enhancing the electrostatic adsorption capacity of the filter material. In addition, the metal cations in volcanic rock interact with the functional groups and reducing substances on the surface of coconut shell activated carbon, forming an efficient mixed reduction reaction system, which further enhances the Cr(VI) removal effect. After 26 days of operation of the BSF reactor, the Cr(VI) removal rate reached a stable state. Reactors 5# had the best removal effect on Cr(VI), which was 0.24 percentage points higher than that of Reactors 3#. This difference was masked by the standard deviations of the two, indicating that it did not significantly exceed the performance boundary of a single filter material, which is related to the influence of the uniformity of microbial community distribution.
In this experiment, under the conditions where the rough surface of volcanic rock and the microporous structure of coconut shell activated carbon provided different attachment spaces for microorganisms, the spatial distribution and metabolic mechanism of the microbial community in the mixed filter material were unclear due to the lack of high-throughput sequencing or electron microscopy characterization of the biofilm. The existing results indicate that the improvement in the pollutant removal rate of the mixed filter material is limited. Perhaps due to the insufficient microbial co-metabolism on the surface of the filter material, it is necessary in the future to further explore the association between the structure and function of the microbial community by combining biofilm characterization techniques such as qPCR and FISH.
Table 7 presents the average pollutant removal rates of BSF Reactors 1#, 2#, 3#, 4#, 5#, and 6# during the early operation and stable removal periods. The filter media of BSF Reactors 1#, 2#, and 3# consist of quartz sand, volcanic rock, and coconut shell activated carbon, respectively. In contrast, the filter media of Reactors 4#, 5#, and 6# are composed of mixed volcanic rock and coconut shell activated carbon, with mixing ratios of (1:1), (1:3), and (3:1), respectively.

4. Conclusions

In this study, volcanic rock and coconut shell activated carbon were used as the test filter materials, with quartz sand serving as the control filter material, to investigate the pollutant removal performance of both single and mixed filter materials. Through multiple tests of rainwater quality at the test site during the early stages of the experiment, the results indicated that turbidity, NH3-N, TOC, and Cr(VI) in the rainwater exceeded the standard levels. The test water with corresponding pollutant concentrations was configured to simulate local rainwater. The pollutants in the rainwater were removed using BSF technology, and the influence of different filter materials on pollutant removal was analyzed. The conclusions are as follows:
(1) As single filter materials, volcanic rock and coconut shell activated carbon significantly outperform traditional quartz sand in terms of turbidity, ammonia nitrogen (NH3-N), TOC, and hexavalent chromium (Cr(VI)) removal efficiency. Specifically, volcanic rock demonstrates superior turbidity retention, efficiently intercepting suspended particles in water to ensure clear water quality. Coconut shell activated carbon exhibits stronger adsorption performance for ammonia nitrogen, total organic carbon, and hexavalent chromium, significantly enhancing the removal of these pollutants and effectively improving water quality conditions. Comparative analysis of the experimental data shows that both volcanic rock and coconut shell activated carbon significantly surpass the treatment effects of quartz sand filter media in their respective areas of expertise, highlighting their unique advantages in water treatment.
(2) Mixed filter materials show a significant improvement in removing pollutants compared to single filter materials. For instance, when the mixing ratio was 1:3 (71.51 ± 0.64%), the average efficiency of this material in removing total organic carbon was approximately 0.96 percentage points higher than that of coconut shell activated carbon (70.55 ± 0.42%), and coconut shell activated carbon demonstrated the best removal effect among single filtering materials. This increase is still within the standard deviation range, indicating that under the conditions of this experiment, the synergistic effect of the mixed filter material does not significantly exceed the performance limit of the single filter material.

Author Contributions

Conceptualization, X.M., H.Z. and D.M.; methodology, H.Z.; validation, Z.L.; investigation, X.M.; resources, D.M. and H.Z.; data curation, X.M.; writing—original draft preparation, D.M. and X.M.; writing—review and editing, X.M., Z.L. and H.Z.; project administration, Z.L.; funding acquisition, D.M. All authors have read and agreed to the published version of the manuscript.

Funding

The research was funded by the Key Research and Development Project, Hainan Province (No. ZDYF2022SHFZ353), and the National Natural Science Foundation of China (No. 52068017).

Institutional Review Board Statement

Not applicable.

Informed Consent Statement

Not applicable.

Data Availability Statement

The original contributions presented in the study are included in the article; further inquiries can be directed to the corresponding author.

Conflicts of Interest

The authors declare no conflicts of interest.

References

  1. Hu, Q.; Zhang, G.; Fang, Q.; Qiu, D.; Zhou, T.; Su, X. Review of the United Nations World Water Development Report. Hydro-Sci. Eng. 2025, 1, 13. [Google Scholar]
  2. Raimondi, A.; Quinn, R.; Abhijith, G.R.; Becciu, G.; Ostfeld, A. Rainwater harvesting and treatment: State of the art and perspectives. Water 2023, 15, 1518. [Google Scholar] [CrossRef]
  3. Richards, S.; Rao, L.; Connelly, S.; Raj, A.; Raveendran, L.; Shirin, S.; Jamwal, P.; Helliwell, R. Sustainable water resources through harvesting rainwater and the effectiveness of a low-cost water treatment. J. Environ. Manag. 2021, 286, 112223. [Google Scholar] [CrossRef] [PubMed]
  4. Abdulla, F.A.; Al-Shareef, A.W. Roof rainwater harvesting systems for household water supply in Jordan. Desalination 2009, 243, 195–207. [Google Scholar] [CrossRef]
  5. Deng, Y. Pollution in rainwater harvesting: A challenge for sustainability and resilience of urban agriculture. J. Hazard. Mater. Lett. 2021, 2, 100037. [Google Scholar] [CrossRef]
  6. Abdiyev, K.; Azat, S.; Kuldeyev, E.; Ybyraiymkul, D.; Kabdrakhmanova, S.; Berndtsson, R.; Khalkhabai, B.; Kabdrakhmanova, A.; Sultakhan, S. Review of slow sand filtration for raw water treatment with potential application in less-developed countries. Water 2023, 15, 2007. [Google Scholar] [CrossRef]
  7. Maiyo, J.K.; Dasika, S.; Jafvert, C.T. Slow sand filters for the 21st century: A review. Int. J. Environ. Res. Public Health 2023, 20, 1019. [Google Scholar] [CrossRef]
  8. Liu, H.; Li, X.; Li, N. Application of bio-slow sand filters for drinking water production: Linking purification performance to bacterial community and metabolic functions. J. Water Process Eng. 2023, 53, 103622. [Google Scholar] [CrossRef]
  9. Zhang, G.; Li, J.; Wu, F. Comparison experiment of biofilm formation with different filter materials in the process of bio-slow sand filtration treating micro-polluted cellar water. Technol. Water Treat. 2018, 44, 84–88, 109. [Google Scholar] [CrossRef]
  10. Rahmadyanti, E.; Palupi, A.E. Rainwater treatment with bio-slow sand filtration for sustainable water supply. J. Ecol. Eng. 2025, 26, 190–200. [Google Scholar] [CrossRef]
  11. Huang, Z. Research on the Application of Improved Biological Slow Filtration Technology in Drinking Northwest Cellar Water. Master’s Thesis, Beijing Jianzhu University, Beijing, China, 2019. [Google Scholar]
  12. Wang, W.; Xiong, N.; Yang, X.; He, J. Experimental study on bio-slow filtration system for treating micro-polluted water: A comparison of two fillers. J. Fudan Univ. 2024, 63, 276–290. [Google Scholar]
  13. Qian, S.; Hou, R.; Yuan, R.; Zhou, B.; Chen, Z.; Chen, H. Removal of Escherichia coli from domestic sewage using biological sand filters: Reduction effect and microbial community analysis. Environ. Res. 2022, 209, 112908. [Google Scholar] [CrossRef]
  14. Azis, K.; Mavriou, Z.; Karpouzas, D.G.; Ntougias, S.; Melidis, P. Evaluation of sand filtration and activated carbon adsorption for the post-treatment of a secondary biologically-treated fungicide-containing wastewater from fruit-packing industries. Processes 2021, 9, 1223. [Google Scholar] [CrossRef]
  15. Ma, J. Study on Zeolite Modification and Its Application in Treating Micro Polluted Cellar Water in Biological Slow Filtration. Master’s Thesis, Lanzhou Jiaotong University, Lanzhou, China, 2022. [Google Scholar]
  16. Zhou, T.; Zhai, T.; Ma, J.; Wu, F.; Zhang, G. Sodium chloride-activated polymeric ferric sulfate-modified natural zeolite (Z-Na-Fe): Application of bio-slow filtration for the removal of ammonia and phosphorus from micro-polluted cellar water. J. Water Process Eng. 2024, 61, 105367. [Google Scholar] [CrossRef]
  17. Widanarto, W.; Budianti, S.I.; Ghoshal, S.K.; Kurniawan, C.; Handoko, E.; Alaydrus, M. Improved microwave absorption traits of coconut shells-derived activated carbon. Diam. Relat. Mater. 2022, 126, 109059. [Google Scholar] [CrossRef]
  18. Pan, M.H. Analysis of Rapid Detection Methods of Iodine Adsorption Value of Wood Activated Carbon. Chem. Eng. Manag. 2021, 32, 68–69. [Google Scholar]
  19. GB/T 12496.8-2015; Test Methods of Wooden Activated Carbon—Determination of Iodine Number (TEXT OF DOCUMENT IS IN CHINESE). Available online: https://webstore.ansi.org/standards/spc/gb124962015?srsltid=AfmBOoqlEhb4Y_U418TAUJY4-QiPWEA1oAIkJO7a78vR8mxqPl4eWdYM (accessed on 27 June 2025).
  20. GB 5749-2022; Sanitary Standards for Drinking Water. Standards Press of China: Beijing, China, 2022.
  21. GB/T 5750.2-2023; Standard Test Methods for Drinking Water Part 2: Collection and Preservation of Water Samples. Standards Press of China: Beijing, China, 2023.
  22. Li, J. Research on the Treatment of Micro Polluted Cellar Water by Biological Slow Filtration Columns with Different Filter Media. Master’s Thesis, Lanzhou Jiaotong University, Lanzhou, China, 2018. [Google Scholar]
  23. He, G. Research on Slow Biological Sand Filtration Technology and Its Application in Ensuring Rural Drinking Water Safety. Master’s Thesis, Chang’an University, Xi’an, China, 2016. [Google Scholar]
  24. Xiao, B.; Wang, R.; Jia, S. Effect of divalent metal ion on UASB granular sludge. China Water Wastewater 2002, 18, 26–28. [Google Scholar]
  25. Rožić, M.; Cerjan-Stefanović, Š.; Kurajica, S.; Vančina, V.; Hodžić, E. Ammoniacal nitrogen removal from water by treatment with clays and zeolites. Water Res. 2000, 34, 3675–3681. [Google Scholar] [CrossRef]
  26. Sun, S.P.; Nàcher, C.P.I.; Merkey, B.; Zhou, Q.; Xia, S.Q.; Yang, D.H.; Sun, J.H.; Smets, B.F. Effective biological nitrogen removal treatment processes for domestic wastewaters with low C/N ratios: A review. Environ. Eng. Sci. 2010, 27, 111–126. [Google Scholar] [CrossRef]
  27. Xiao, P.; Cao, D.; Li, H.; Wu, J.; Zheng, Z. Effects of three heavy metals on formation of aerobic granular sludge and related population control. J. Sichuan Agric. Univ. 2012, 30, 342–347. [Google Scholar]
  28. Dos Santos, P.R.; Daniel, L.A. A review: Organic matter and ammonia removal by biological activated carbon filtration for water and wastewater treatment. Int. J. Environ. Sci. Technol. 2020, 17, 591–606. [Google Scholar] [CrossRef]
  29. Jiang, H.; Ma, Y.; Liu, X.; Wang, H. The influence of Fe on microorganisms and process performance in sewage and sludge treatment processes. Environ. Eng. 2016, 34, 54. [Google Scholar]
  30. Tripathi, S.M.; Chaurasia, S.R. Detection, of Chromium in surface and groundwater and its bio-absorption using bio-wastes and vermiculite. Eng. Sci. Technol. Int. J. 2020, 23, 1153–1161. [Google Scholar] [CrossRef]
  31. Liu, L. Study on the Removal of Heavy Metals in Water by Functional Microbial Agents and Their Interaction Mechanisms. Ph.D. Thesis, Hunan University, Changsha, China, 2017. [Google Scholar]
  32. Zhang, G.; Zhao, K.; Wu, F.; Zhou, T.; Yang, G. The effect of hexavalent chromium ions on the treatment of slightly polluted raw water by biological slow filtration technology. China Water Wastewater 2023, 39, 60–65. [Google Scholar]
Figure 1. Schematic diagram of the biological slow filtration system.
Applsci 15 07394 g001
Figure 2. Diagram of the biological slow filtration reactor device.
Applsci 15 07394 g002
Figure 3. The turbidity removal effect of single filter material.
Applsci 15 07394 g003
Figure 4. The removal effect of a single filter material on NH3-N.
Applsci 15 07394 g004
Figure 5. The removal effect of a single filter material on TOC.
Applsci 15 07394 g005
Figure 6. The removal effect of a single filter material on Cr(VI).
Applsci 15 07394 g006
Figure 7. The turbidity removal effect of mixed filter media.
Applsci 15 07394 g007
Figure 8. The removal effect of the mixed filter material on NH3-N.
Applsci 15 07394 g008
Figure 9. The removal effect of mixed filter media on TOC.
Applsci 15 07394 g009
Figure 10. The removal effect of mixed filter media on Cr(VI).
Applsci 15 07394 g010
Table 1. Characteristics of filter media.
Filter Media CharacteristicsQuartz SandVolcanic RockCoconut Shell Activated Carbon
Particle size0.5–1 mm0.5–1 mm0.5–1 mm
Specific surface area-7.0 m2/g712.1 m2/g
Average aperture-6.06 nm3.45 nm
Iodine adsorption value--700 mg/g
Table 2. The main elements of the filter material.
Element wt%OSiCCaFeMg
Quartz sand23.0676.94----
Volcanic rock36.6821.81-9.3427.284.89
Coconut shell activated carbon7.520.0585.34.411.11.62
Table 3. Collected rainwater quality indicators.
Water Quality IndicatorUnitRainwater ConcentrationDrinking Water Standards [20]Detection Method
TurbidityNTU9.79–15.091Spectrophotometry
pH-6.98–7.616.5–8.5Acid–base indicator method
TDSmg/L63–1091000Electrical conductivity method
NH3-Nmg/L0.8–1.460.5Nessler’s reagent spectrophotometry
Cumg/L<0.051Diacetyl dioxime spectrophotometry
Femg/L<0.10.3Phenanthroline spectrophotometry
Nimg/L<0.020.02Dimethylglyoxime spectrophotometry
Mnmg/L<0.020.1Formaldehyde oxime spectrophotometry
TOCmg/L3.11–16.045Spectroscopic water quality detection method
Asmg/L<0.010.01Atomic fluorescence spectrometry
Pbmg/L<0.010.01Atomic absorption spectrophotometer flame method
NO3mg/L0.021–0.09110Phenol–disulfonic acid spectrophotometry
Cr(VI)mg/L0.021–0.0670.05Diphenylcarbazide spectrophotometry
Total Colony CountCFU/mL64–77100Luciferase luminescence assay
Escherichia coliCFU/100 mLNot detectedNot detectedMultiple-tube fermentation method
Table 4. Quality indicators of the collected rainwater and experimental water.
Water Quality
Indicator
UnitRainwater
Concentration
Test Water
Concentration
TurbidityNTU9.79–15.0914–15
NH3-Nmg/L0.8–1.461.2–1.4
TOCmg/L15.21–16.0415.0–16.0
Cr(VI)mg/L0.052–0.0670.05–0.06
Table 5. Detection methods and instruments.
Water Quality
Indicators
Detection MethodDetection InstrumentManufacturer
TurbiditySpectrophotometryAE86065
turbidity meter
Dongguan Frank Technology Co., Ltd. (Guangdong, China)
TOCSpectral water quality detectionWater Detective Type 3Shenzhen Bit Atom Technology Co., Ltd. (Shenzhen, China)
NH3-NNessler’s reagent spectrophotometryPT-001B multi-parameter water quality detectorXiamen Pantian Biotechnology Co., Ltd. (Xiamen, China)
Cr(VI)Diphenylcarbazide spectrophotometric method
Table 6. Basic parameters of filter media.
Slow Filtration Reactor NumberFilter MaterialMixing Ratio
1#Single filter material: Quartz sand-
2#Single filter material: Volcanic rock-
3#Single filter material: coconut shell activated carbon-
4#Mixed filter material: volcanic rock–coconut shell activated carbon1:1
5#Mixed filter material: volcanic rock–coconut shell activated carbon1:3
6#Mixed filter material: volcanic rock–coconut shell activated carbon3:1
Table 7. The average pollutant removal rate (mean ± standard deviation) of BSF Reactors 1# to 6#.
Early Stages of OperationRemove the Stable Period
TurbidityNH3-NTOCCr(VI)TurbidityNH3-NTOCCr(VI)
183.87 ± 1.11%69.07 ± 1.43%29.81 ± 0.32%14.56 ± 6.09%93.28 ± 0.25%97.55 ± 1.25%49.62 ± 0.70%68.46 ± 2.89%
291.46 ± 0.99%80.10 ± 2.63%43.34 ± 1.25%42.29 ± 5.00%97.36 ± 0.08%98.77 ± 0.99%70.55 ± 0.42%93.39 ± 1.69%
386.47 ± 0.36%86.82 ± 2.53%51.80 ± 0.21%61.30 ± 5.37%94.93 ± 0.26%98.90 ± 0.42%68.60 ± 0.42%90.60 ± 2.08%
488.19 ± 0.65%86.81 ± 1.10%53.49 ± 0.65%68.40 ± 3.99%94.50 ± 0.25%99.15 ± 0.59%70.97 ± 1.00%91.42 ± 1.26%
587.94 ± 0.61%88.97 ± 1.11%54.97 ± 1.08%72.19 ± 4.93%94.37 ± 0.33%99.27 ± 0.03%71.51 ± 0.64%93.63 ± 1.83%
692.71 ± 0.42%88.25 ± 1.11%52.86 ± 0.64%63.99 ± 6.36%97.45 ± 0.12%99.14 ± 0.62%70.87 ± 0.67%90.86 ± 1.33%
Disclaimer/Publisher’s Note: The statements, opinions and data contained in all publications are solely those of the individual author(s) and contributor(s) and not of MDPI and/or the editor(s). MDPI and/or the editor(s) disclaim responsibility for any injury to people or property resulting from any ideas, methods, instructions or products referred to in the content.

