Abstract
Traditional coal quality assessment methods rely exclusively on the laboratory testing of physical samples, which impedes detailed stratigraphic evaluation and limits the integration of intelligent precision mining technologies. To resolve this challenge, this study investigates geophysical logging as an innovative method for coal quality prediction. By integrating scanning electron microscopy (SEM), X-ray analysis, and optical microscopy with interdisciplinary methodologies spanning mathematics, mineralogy, and applied geophysics, this research analyzes the coal quality and mineral composition of the Shanxi Formation coal seams in northern Jiangsu, China. A predictive model linking geophysical logging responses to coal quality parameters was established to delineate relationships between subsurface geophysical data and material properties. The results demonstrate that the Shanxi Formation coals are gas coal (a medium-metamorphic bituminous subclass) characterized by low sulfur content, low ash yield, low fixed carbon, high volatile matter, and high calorific value. Mineralogical analysis identifies calcite, pyrite, and clay minerals as the dominant constituents. Pyrite occurs in diverse microscopic forms, including euhedral and semi-euhedral fine grains, fissure-filling aggregates, irregular blocky structures, framboidal clusters, and disseminated particles. Systematic relationships were observed between logging parameters and coal quality: moisture, ash content, and volatile matter exhibit an initial decrease, followed by an increase with rising apparent resistivity (LLD) and bulk density (DEN). Conversely, fixed carbon and calorific value display an inverse trend, peaking at intermediate LLD/DEN values before declining. Total sulfur increases with density up to a threshold before decreasing, while showing a concave upward relationship with resistivity. Negative correlations exist between moisture, fixed carbon, calorific value lateral resistivity (LLS), natural gamma (GR), short-spaced gamma-gamma (SSGG), and acoustic transit time (AC). In contrast, ash yield, volatile matter, and total sulfur correlate positively with these logging parameters. These trends are governed by coalification processes, lithotype composition, reservoir physical properties, and the types and mass fractions of minerals. Validation through independent two-sample t-tests confirms the feasibility of the neural network model for predicting coal quality parameters from geophysical logging data. The predictive model provides technical and theoretical support for advancing intelligent coal mining practices and optimizing efficiency in coal chemical industries, enabling real-time subsurface characterization to facilitate precision resource extraction.
1. Introduction
China’s resource endowment ensures coal will remain its primary energy source for the foreseeable future [1,2,3]. Coal quality indicators critically influence the economic viability of mining operations and coal chemical industries. Traditional methods for assessing these indicators depend on laboratory tests of physical samples, which are time-intensive, costly, and constrained by limited core availability [4,5,6]. This results in fragmented, discontinuous data that inadequately characterizes coal quality vertically and lacks horizontal quantitative resolution. These limitations hinder coal resource evaluation, development, and utilization, particularly in enabling precise stratification assessment or efficient, targeted mining. Geophysical logging methods offer a promising alternative to address these challenges.
Prior studies demonstrate that bulk density logging effectively identifies coal quality parameters, while natural gamma, compensated neutron, and resistivity logging sensitively detect clay mineral content, moisture, and ash-related mineral types [7,8,9,10,11,12,13,14,15,16,17]. Conventional approaches to interpreting coal quality from logging data involve constructing predictive models tailored to specific coal seams using multiple logging parameters [8]. For example, coal rank is often determined via density-neutron cross plots [9,10], while oil-rich coal is identified by integrating true density with natural gamma [11]. Industrial composition has been predicted using volumetric and probabilistic models based on geophysical logging parameters [12,13,14,15,16,17]. Notably, ash yield correlates positively with density and natural gamma [9,18,19,20], whereas volatile matter and fixed carbon exhibit negative correlations with density and acoustic transit time [12,21,22]. Ghosh et al. applied intersection plots, regression analysis, and machine learning to predict industrial composition using natural gamma, resistivity, and density [13,23]. O’Brien et al. employed neural networks to evaluate moisture, ash, and volatile matter via density, acoustic, and natural gamma data [24]. Shao and Meng utilized multivariate linear fitting and volumetric models, respectively, to predict industrial composition [14,16], while Wu et al. classified sulfur content (>3% vs. <3%) using natural gamma, spontaneous potential, resistivity, density, and acoustic data, establishing multivariate linear models for sulfur prediction in North China’s Shanxi and Taiyuan Formation coals [25].
Despite these advances, existing models predominantly target isolated parameters such as industrial composition, coal rank, or sulfur content [10,21,24,25,26]. A systematic approach to invert geophysical logging responses for comprehensive coal quality indicators such as moisture, ash, volatile matter, fixed carbon, total sulfur, and calorific value remains underdeveloped, This critical knowledge gap severely impedes the establishment of robust petrophysical inversion models capable of meeting the operational demands for efficient, high-resolution identification of deep coal seam quality and data-driven optimization of intelligent coal mining systems. The absence of such methodologies constrains our ability to leverage logging data for predictive quality assessment across heterogeneous coal reservoirs, ultimately limiting the implementation of closed-loop, precision mining strategies essential for resource efficiency and automation in complex subsurface environments. To address this gap, this study analyzes the No. 7 and No. 8 coal seams of the Shanxi Formation in the Xuzhuang and Kongzhuang mines of northern Jiangsu, China. Integrating scanning electron microscopy, X-ray analysis, and optical microscopy with interdisciplinary methodologies spanning mathematics, mineralogy, and applied geophysics, we investigate the coal quality and mineral composition of these seams. The intrinsic relationships between geophysical logging responses and coal quality parameters are rigorously analyzed to establish a predictive model, which is subsequently validated through feasibility assessments and error analysis.
This work provides a technical and theoretical foundation for advancing intelligent mining practices and optimizing efficiency in coal chemical industries. By bridging subsurface geophysical data with material properties, the model supports real-time coal quality characterization, enabling precision resource management and utilization.
2. Geological Background
The study area features flat terrain with extensive surface deposits of sandy clay derived from historical Yellow River flooding. The region slopes from higher elevations in the west to lower elevations in the east, reflecting the influence of regional tectonic activity. Structural features are dominated by faults, predominantly northeast-trending tensional-torsional normal faults, with folds being underdeveloped. Early northeast-oriented stress shaped the structural framework, resulting in a monocline structure dipping northwest. Strata dip angles typically range between 14° and 21°. The Datun and Xuzhuang faults divide the area into the Xuzhuang and Kongzhuang coal mines (Figure 1).
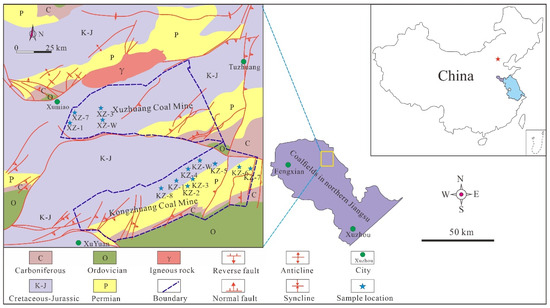
Figure 1.
Sampling point location and structural outline map in northern Jiangsu.
The Late Paleozoic Shanxi coal-bearing strata in North China is developed in a transitional environment between oceanic and continental conditions, with high hydrocarbon generation potential [27]. During the Late Carboniferous-Early Permian period, the North China Platform experienced continuous degradation from marine to continental environments [28]. Coal-bearing strata are mainly composed of shale, coal, sandstone, and interbedded sandstone rich in organic matter. These strata were formed in the coastal plains and swamps of northern China [29]. The Shanxi Formation was deposited from bottom to top in three environments: tidal flats, delta front, and delta plains, indicating an overall regression process from nearshore marine to river systems [27,30,31].
The Shanxi Formation comprises coal-bearing strata deposited in nearshore fluvial-lacustrine and peat swamp environments, with thicknesses ranging from 70.00 to 149.32 m (average: 116.40 m). Lithologies include gray to dark-gray sandy mudstone, mudstone, and sandstone, containing three to four coal-bearing layers [32]. In the Kongzhuang Mine, the No. 7 coal seam varies in thickness from 1.40 to 6.52 m (average: 4.41 m), while the No. 8 seam ranges from 0.29 to 4.96 m (average: 2.90 m). In the Xuzhuang Mine, the No. 7 seam measures 1.19–5.45 m (average: 3.89 m), though it is absent in several localities. The Shanxi Formation hosts few but thick, minable coal seams characterized by stable sedimentation, abundant plant fossils, and conformable contact with overlying strata.
3. Materials and Methods
3.1. Sample Collection
Coal samples were collected from the Xuzhuang and Kongzhuang coal mines in northern Jiangsu, comprising underground channel samples and drill core samples (Figure 1). Channel sampling adhered to the Chinese national standard (GB/T 482-2008) with coal seams profiled vertically from top to bottom at intervals of 10 cm and a sampling depth of 5 cm [33]. Samples were wrapped in plastic film, sealed in labeled bags, and transported to the laboratory for preparation and subsequent analysis.
3.2. Logging Data Processing
Geophysical logging responses for coal quality were collected from 1:20-scale coal seam logging curves at 0.2 m intervals. Digital logging data included apparent resistivity (ρs), lateral resistivity (LLD), bulk density (DEN), natural gamma (GR), short-spaced gamma-gamma (CGS), and acoustic transit time (AC). Data processing involved three stages: depth correction, logging data extraction, and standardization. Depth correction was applied using logging curve responses from thick sandstone, limestone, and coal seams to align depth references. Logging data extraction calculated weighted averages for ρs, DEN, AC, GR, LLD, and CGS curves.
Standardization normalized ρs, DEN, AC, and GR values using Formula (1) [14], and CGS and LLD values via Formula (2) [25].
In these formulas, N and M denote raw logging data; Nn and Mn represent normalized data; Nmax/Mmax and Nmin/Mmin correspond to the maximum and minimum values of each parameter, respectively.
3.3. Analytical Methods
Approximate analysis, involving the quantification of total sulfur, ash yield, and volatile matter, moisture of the samples, was measured with reference to the ASTM Standard D2492-02 (2012), D3174-12 (2018), D3175-20 (2020), and D3173-17a (2017) [34,35,36,37]. The maximum vitrinite reflectance (Ro,max),= and calorific value (Qgr,ad) were tested following the ASTM standards D2798-21 (2021) and Chinese standards GB/T 213-2008 [38,39]. Meanwhile, optical microscopes with ultraviolet light and white light reflections, X-ray analyzers, and scanning electron microscopes were used to observe the mineral morphology in coal samples.
3.4. Neural Network Model
The backpropagation (BP) neural network model integrates principles from mathematics, neuroscience, and computer science to emulate aspects of human brain functionality [38]. It establishes nonlinear mappings between input and output layers, enabling machine learning and the approximation of complex continuous functions [39]. For the coal quality geophysical logging prediction model, the BP network comprises three core layers: input, hidden, and output. The hidden layer, positioned between input and output layers, processes data without relying on predefined functional relationships to describe input-output mappings (Figure 2). Input variables (X: x1, x2, …, xn) include lateral resistivity (LLD), natural gamma (GR), density (DEN), apparent resistivity (ρs), short-spaced gamma-gamma (CGS), and acoustic transit time (AC). Output variables (Y: y1, y2, …, yj) predict coal quality parameters: moisture (Mad), ash yield (Ad), volatile matter (Vdaf), fixed carbon (FC), total sulfur (St,d), and calorific value (Qgr,ad).
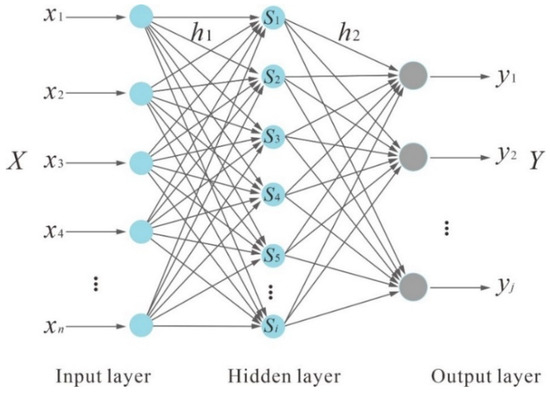
Figure 2.
Structure diagram of neural network model.
The hidden layer (S) mediates information transfer to the output layer (Y). The neural network’s output is mathematically expressed as [40]
The functions g and f represent activation functions within the BP neural network model. To enhance the algorithm’s capacity for nonlinear learning, tanh and sigmoid are typically selected for g and f, respectively [40].
A two-sample independent t-test evaluates whether the difference between the mean measured and predicted values of coal quality parameters is statistically significant relative to their populations. The t-test statistic is calculated as [40]
In the formula, Y1 and Y2, S12 and S22, n1 and n2 are the average values, variances, and sample sizes of measured and predicted coal quality parameters, respectively.
4. Results and Discussion
4.1. Characteristics of Coal Quality
The No. 7 coal seam in the study area exhibits a vitrinite maximum reflectance (Ro,max) averaging 0.69%, classifying it as medium-metamorphic bituminous coal. Key coal quality parameters include an average moisture content (Mad) of 1.28%, ash yield (Ad) of 12.49% (low ash), volatile matter (Vdaf) of 38.48% (high volatile), fixed carbon (FC) of 53.59% (low fixed carbon), total sulfur (St,d) of 0.70% (low sulfur), and an air-dried high calorific value (Qgr,ad) of 30.13 MJ/kg (high calorific value) (Table 1).

Table 1.
Statistical table of coal quality indicators of Shanxi Formation in Northern Jiangsu region.
Similarly, the No. 8 coal seam records a vitrinite Ro,max of 0.72%, also indicative of medium-metamorphic bituminous coal. Its average Mad, Ad, Vdaf, FC, St,d, and Qgr,ad values are 1.13%, 11.06%, 37.93%, 54.98%, 0.93%, and 30.44 MJ/kg, respectively, categorizing it as low ash, low fixed carbon, high volatile, low sulfur, and high calorific value coal (Table 1).
In summary, both the No. 7 and No. 8 coal seams of the Shanxi Formation are characterized as medium-metamorphic bituminous coals with low sulfur, low ash, low fixed carbon, high volatile matter, and high calorific value.
Correlation analysis of moisture, ash content, volatile matter, fixed carbon, total sulfur, and calorific value in the Shanxi Formation coals from the Kongzhuang and Xuzhuang mines of northern Jiangsu reveals distinct relationships. Ash yield demonstrates a significant negative correlation with fixed carbon content and calorific value. Fixed carbon content, in turn, shows strong correlations with volatile matter yield and calorific value. Total sulfur content exhibits a significant positive correlation with volatile matter yield but only weak associations with ash yield and volatile matter (Figure 3). Meanwhile, the fixed carbon, calorific value, and volatile matter in coal quality can further predict coal grades [41].
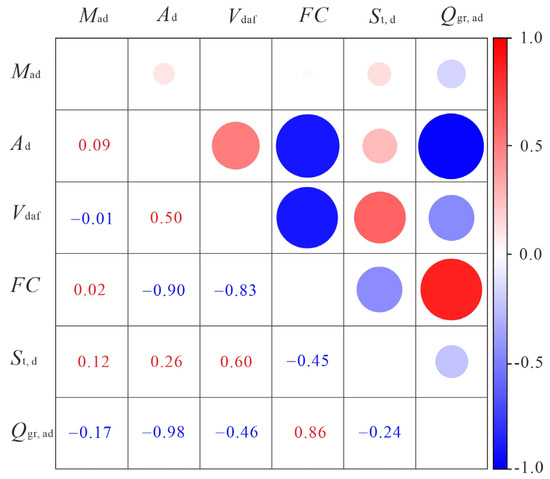
Figure 3.
Correlation diagram of coal quality parameters.
4.2. Mineralogical Characteristics
The coal mineral composition in the study area is dominated by calcite, pyrite, and clay minerals. Optical microscopy reveals diverse pyrite morphologies, including euhedral and subhedral fine-grained crystals, framboidal aggregates, fracture infillings, irregular blocky forms, and disseminated particles. Euhedral and subhedral pyrite grains (1–20 μm) occur alongside calcite within fractures (Figure 4a). Fracture-filling pyrite, forming strips 0.1–2.0 μm wide, lines coarse-grained mineral surfaces (Figure 4b), while oxidized filamentous and semi-filamentous pyrite infills fractures (Figure 4c,d), a morphology linked to late-stage coalification processes [42]. Irregular blocky pyrite (2–30 μm), characterized by smooth surfaces with minor pitting, commonly infills pores and fractures in association with calcite (Figure 4e). Disseminated pyrite (1–5 μm) is predominantly hosted within calcite (Figure 4f), with localized nodular clusters observed in matrix vitrinite (Figure 4g), reflecting the selective affinity between gel components and pyrite [43,44].
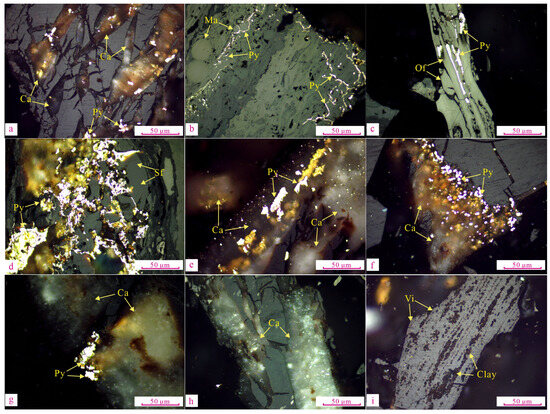
Figure 4.
Microscopic photograph of minerals in coal. (a) Kongzhuang Coal Mine (KZ-W), No. 7 coal seam; (b) Kongzhuang Coal Mine (KZ-W), No. 7 coal seam; (c) Kongzhuang Coal Mine (KZ-W), No. 7 coal seam; (d) Xuzhuang Coal Mine (XZ-W), No. 8 coal seam; (e) Xuzhuang Coal Mine (XZ-W), No. 7 coal seam; (f) Xuzhuang Coal Mine (XZ-W), No. 7 coal seam; (g) Xuzhuang Coal Mine (XZ-W), No. 7 coal seam; (h) Xuzhuang Coal Mine (XZ-W), No. 7 coal seam; (i) Xuzhuang Coal Mine (XZ-W), No. 7 coal seam; ID, Iron dolomite; Ca, Dolomite; Gy, Gypsum; Py, Pyrite; Ka, Kaolinite; Do, Dolomite; Ma, Macrinite; Of, Oxyfusinite; Vi, Vitrinite.
Calcite occurs as veins or blocky masses (5–60 μm wide), infilling homogeneous and matrix vitrinite (Figure 4a,e–h). Clay minerals appear as granular or striated inclusions within vitrinite, with some exhibiting a roe-like texture (1–6 μm) embedded in vitrinite matrices (Figure 4i). Meanwhile, coal quality parameters are closely related to mineralogy; for example, the thermal decomposition of calcite will lead to an increase in the yield of volatile matter in coal quality [45].
Scanning electron microscopy with energy-dispersive spectroscopy reveals stacking and infilling of 3 μm-diameter pores within massive iron dolomite (Figure 5a). Fractures in the coal seam are occupied by band-like and irregular blocky calcite (Figure 5b,f), while cylindrical calcite fills pores measuring 3–15 μm in diameter (Figure 5h). Long columnar gypsum is observed within organic matter (Figure 5c). Granular pyrite (2–20 μm) is embedded within vitrinite, exhibiting octahedral, tetrahedral, and transitional crystal habits (Figure 5d,g). Fine-grained aggregated pyrite (1–10 μm) is hosted in kaolinite, with irregular blocky pyrite infilling coal fractures (Figure 5e). Agglomerated and disseminated kaolinite occur within vitrinite or pore spaces (Figure 5d,f,g,i), while columnar dolomite occupies 10–20 μm pores (Figure 5i).
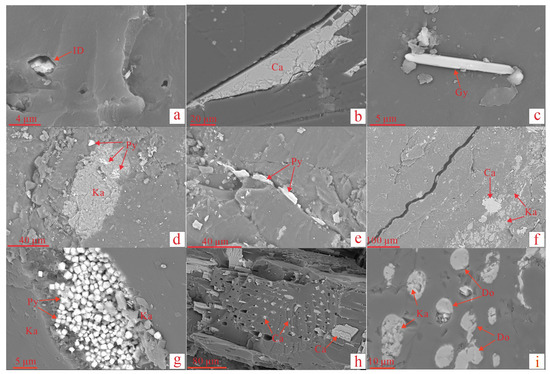
Figure 5.
Scanning electron microscopy image of minerals in coal. Note: (a) Kongzhuang Coal Mine (KZ-W), No. 7 coal seam; (b) Kongzhuang Coal Mine (KZ-W), No. 8 coal seam; (c) Kongzhuang Coal Mine (KZ-W), No. 7 coal seam; (d) Xuzhuang Coal Mine (XZ-W), No. 7 coal seam; (e) Xuzhuang Coal Mine (XZ-W), No. 7 coal seam; (f) Xuzhuang Coal Mine (XZ-W), No. 7 coal seam; (g) Xuzhuang Coal Mine (XZ-W), No. 8 coal seam; (h) Xuzhuang Coal Mine (XZ-W), No. 7 coal seam; (i) Xuzhuang Coal Mine (XZ-W), No. 8 coal seam; ID, Iron dolomite; Ca, Calcite; Gy, Gypsum; Py, Pyrite, Ka, Kaolinite; Do, Dolomite.
Banded pyrite, formed during alkaline peat swamp evolution, reflects gel-enhanced pyrite infilling processes [46]. Sulfide mineralization is linked to seawater-derived sulfur sources, promoting framboidal pyrite development [47,48]. Irregular blocky pyrite forms under iron-deficient aqueous conditions [49]. Post-depositional seawater alteration triggers calcite dolomitization via Ca2+-Mg2+ ion exchange [50].
4.3. Geophysical Logging Response Characteristics of Coal Quality
4.3.1. Logging Response Characteristics of Moisture Content
Moisture in coal exists as both free water, which readily evaporates, and endogenous moisture adsorbed onto clay particle surfaces. The moisture content exhibits an initial decrease followed by an increase with rising apparent resistivity and density (Figure 6a,c), a trend governed by moisture occurrence states and coal reservoir physical properties [25]. In the study area, deep burial depths promote water molecule adsorption onto inorganic mineral surfaces, enhancing ion conductivity and reducing apparent resistivity [51,52]. However, in middle-to-low rank coals, increasing moisture and humic acid content, combined with active tectonic activity fostering pore-fracture systems, elevate apparent resistivity [14]. Density logging values correlate with coal rank, mineral content, lithotype composition, and reservoir properties [53]. For low-rank bituminous coals, advancing metamorphism reduces moisture, humic acid, and inorganic minerals, lowering seam density. Conversely, higher vitrinite content enhances water molecule adsorption capacity, increasing density [54,55].
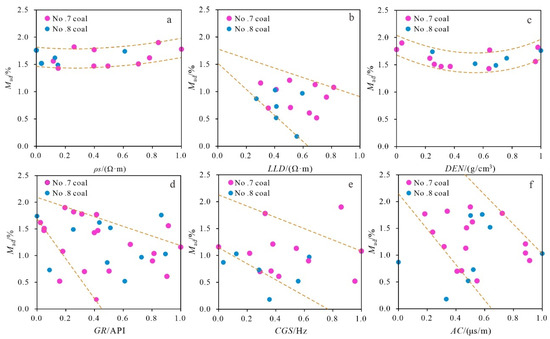
Figure 6.
Relation between moisture content in coal and logging parameters. (a) The relationship between moisture content and apparent resistivity; (b) The relationship between moisture content and lateral resistivity; (c) The relationship between moisture content and bulk density; (d) The relationship between moisture content and natural gamma; (e) The relationship between moisture content and short-spaced gamma-gamma; (f) The relationship between moisture content and acoustic transit time.
Moisture content negatively correlates with lateral resistivity, natural gamma (GR), short-spaced gamma-gamma (CGS), and acoustic transit time (AC) (Figure 6b,d–f). Water molecules enhance coal conductivity, reducing lateral resistivity [14]. Pore and fracture development in coal slows longitudinal acoustic wave propagation, increasing AC. As moisture rises, wave velocity accelerates, decreasing AC [56,57,58]. Radioactive elements concentrate in inorganic minerals; however, clustered or striated mineral infillings in pores/fractures reduce water retention, causing moisture to decline with increasing GR [59,60].
4.3.2. Logging Response Characteristics of Ash Yield
The sedimentary environment exerts a controlling influence on coal ash yield, which reflects the degree of mineral development [61,62]. Ash yield exhibits an initial decrease followed by an increase with rising apparent resistivity (Figure 7a,c). Elevated ash yield and inorganic mineral content enhance coal conductivity, reducing seam resistivity [63,64]. In the study area, blocky and banded calcite, pyrite, and clay minerals infill pores, fractures, or organic matter, further lowering apparent resistivity [25,65,66]. Minerals such as pyrite within ash enhance coal rock conductivity [67], increasing brittleness and promoting cleavage, pores, and fractures that amplify conductivity variations [47,51,68].
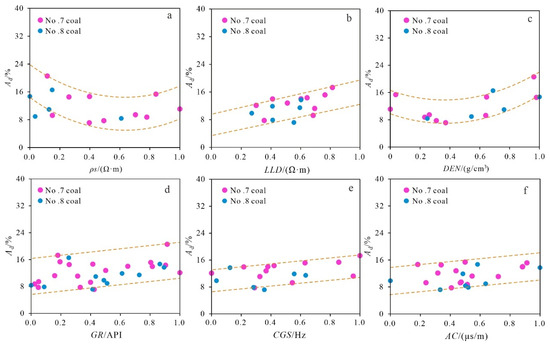
Figure 7.
Relation between ash yield and logging parameters in coal. (a) The relationship between ash yield and apparent resistivity; (b) The relationship between ash yield and lateral resistivity; (c) The relationship between ash yield and bulk density; (d) The relationship between ash yield and natural gamma; (e) The relationship between ash yield and short-spaced gamma-gamma; (f) The relationship between ash yield and acoustic transit time.
Ash yield similarly trends with density, decreasing initially before rising (Figure 7c). This relationship is governed by material composition, coal rank, clay mineral content, and drilling-induced factors such as borehole diameter changes and mud invasion [69]. Syngenetic minerals predominantly influence coal seam pore structure through density, composition, and deformation, with density being the most critical factor [70]. Sulfide minerals, denser and more conductive than silicates, increase seam density and reduce resistivity when enriched [71].
Ash yield correlates positively with lateral resistivity, natural gamma (GR), short-spaced gamma-gamma (CGS), and acoustic transit time (AC) (Figure 7b,d–f). This arises because organic matter in coal has higher resistivity than hydrated minerals, and GR intensity increases with ash yield [14]. Clay minerals, with their high surface area, strongly adsorb radioactive elements and magmatic minerals during diagenesis, leading to higher GR values in ash-rich coals [14]. Late-stage sedimentation fills coal reservoir pores and fractures with banded minerals, yet pervasive pore-fracture systems elevate ash yield and AC [47,72,73].
4.3.3. Logging Response Characteristics of Volatile Matter
Volatile matter in coal represents the fraction released as gases during high-temperature heating. Its yield displays a parabolic relationship with apparent resistivity and density (Figure 8a,c), a pattern influenced by the content, properties, and structure of organic and inorganic components, as well as coalification processes [14,74]. Increased sulfide mineral content reduces coal seam apparent resistivity [75], while advancing coalification decreases inorganic mineral content, elevating resistivity [64,76]. Density logging values correlate with coal lithotype, rank, ash composition, and external factors such as borehole diameter variations and fracture development [72].
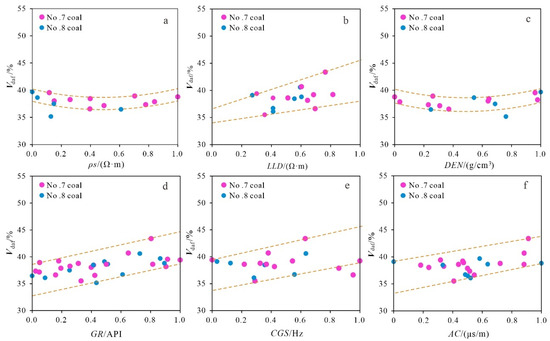
Figure 8.
Relation between volatile matter yield in coal and logging parameters. (a) The relationship between volatile matter yield and apparent resistivity; (b) The relationship between volatile matter yield and lateral resistivity; (c) The relationship between volatile matter yield and bulk density; (d) The relationship between volatile matter yield and natural gamma; (e) The relationship between volatile matter yield and short-spaced gamma-gamma; (f) The relationship between volatile matter yield and acoustic transit time.
Volatile matter yield positively correlates with lateral resistivity, natural gamma (GR), short-spaced gamma-gamma (CGS), and acoustic transit time (AC) (Figure 8b,d–f). This relationship stems from reduced mineral content and higher organic matter resistivity in bituminous coals with increasing metamorphism [14,77]. GR intensity rises proportionally with radioactive particle abundance in coal [14], predominantly hosted in pyrite and sulfur-rich organic matter [78,79,80]. Consequently, volatile matter correlates positively with lateral resistivity and GR. Concurrently, pore-fracture systems in medium- to low-rank bituminous coals elevate CGS and AC values [73].
4.3.4. Logging Response Characteristics of Fixed Carbon
Fixed carbon content in coal initially increases before decreasing with rising apparent resistivity (Figure 9a), a trend governed by coal metamorphism. Advancing coalification in mid- to low-rank coals reduces inorganic minerals, moisture, and humic acid, sharply lowering ion conductivity and increasing fixed carbon content alongside resistivity [51,77]. However, further coalification enhances electronic conductivity in higher-rank coals, reducing resistivity [75].
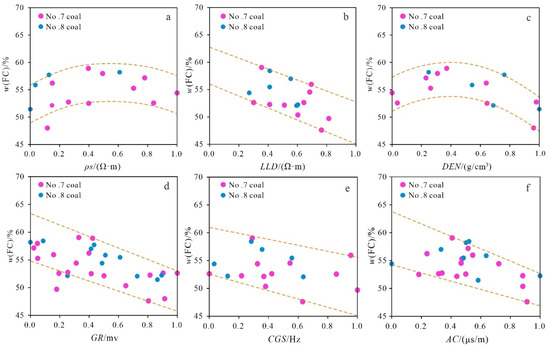
Figure 9.
Relation between fixed carbon content in coal and logging parameters. (a) The relationship between fixed carbon content and apparent resistivity; (b) The relationship between fixed carbon content and lateral resistivity; (c) The relationship between fixed carbon content and bulk density; (d) The relationship between fixed carbon content and natural gamma; (e) The relationship between fixed carbon content and short-spaced gamma-gamma; (f) The relationship between fixed carbon content and acoustic transit time.
Fixed carbon and density similarly exhibit an initial rise followed by decline (Figure 9c), influenced by coal rank, mineral content, lithotype composition, and reservoir properties [47,53]. Increasing metamorphism in mid- to low-rank coals reduces moisture, elevating seam density, while continued coalification decreases inorganic minerals, lowering density [55,81].
Fixed carbon content negatively correlates with lateral resistivity, natural gamma (GR), short-spaced gamma-gamma (CGS), and acoustic transit time (AC) (Figure 9b,d–f). Progressive coalification diminishes inorganic minerals and adsorbed radioactive elements, reducing GR [25]. Medium- to low-rank bituminous coals, with loose structures and developed pore-fracture systems, exhibit elevated lateral resistivity and AC [14,68,82]. As metamorphism advances, denser coal structures and enhanced electronic conductivity reduce lateral resistivity and AC [81,83].
4.3.5. Logging Response Characteristics of Total Sulfur
Total sulfur content in coal exhibits an initial decrease followed by an increase with rising apparent resistivity (Figure 10a), a trend linked to coal’s micro-pore structure and the type and abundance of conductive mineral elements [83]. Pyrite’s polarizability and thermoelectric properties induce pronounced resistivity anomalies in coal seams [68,71,82,84]. In the study area, deep burial depths and active tectonics amplify crystal defects like pores and fractures, extending ion and electron migration distances while reducing micro-pore proportions and ion-conductive pathways, thereby elevating resistivity [4,70,82]. Total sulfur and density similarly show an initial increase before declining (Figure 10c), reflecting the dominance of lower-density organic sulfur in medium- to high-sulfur coals compared to pyritic sulfur in low-sulfur varieties [17].
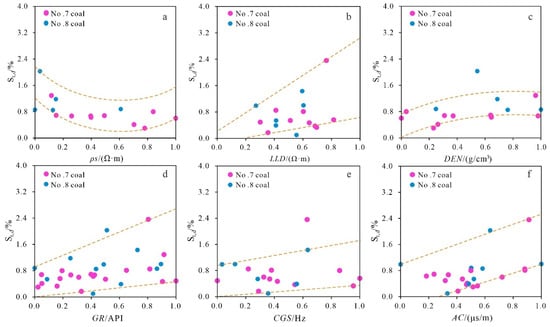
Figure 10.
Relation between total sulfur content in coal and logging parameters. (a) The relationship between total sulfur content and apparent resistivity; (b) The relationship between total sulfur content and lateral resistivity; (c) The relationship between total sulfur content and bulk density; (d) The relationship between total sulfur content and natural gamma; (e) The relationship between total sulfur content and short-spaced gamma-gamma; (f) The relationship between total sulfur content and acoustic transit time.
Total sulfur content correlates positively with lateral resistivity, short-spaced gamma-gamma (CGS), and acoustic transit time (AC) (Figure 10b,e,f). CGS values directly reflect inorganic mineral content [14,85], with sulfide-rich seams exhibiting lower resistivity than organic sulfur-dominated coals [4]. Increased inorganic minerals reduce micro-pore abundance [70], prolonging free electron presence in fractures and elevating lateral resistivity and AC [81,83].
A positive correlation between total sulfur and natural gamma (GR) (Figure 10d) arises from Th and U enrichment during peat accumulation or early diagenesis [86,87]. Carboniferous-Permian coal seams, formed in alkaline oxidation-reduction transition environments, further promote U, K, and Th migration alongside pyrite and kaolinite formation [78,79,80,88,89].
4.3.6. Logging Response Characteristics of Calorific Value
The calorific value exhibits a non-monotonic relationship with apparent resistivity, initially increasing before reaching a peak and subsequently decreasing. A similar unimodal response pattern is observed with bulk density, where calorific value rises to an optimum before declining. Conversely, calorific value demonstrates significant negative correlations with laterolog resistivity, short-spaced density log (gamma-gamma) readings, natural gamma ray intensity, and sonic transit time.
Coal calorific value declines with increasing ash and moisture content, where ash exerts a growing influence as metamorphism advances, while moisture’s impact diminishes [90]. Calorific value initially rises before decreasing with apparent resistivity (Figure 11a). In low- to medium-rank bituminous coals, reduced inorganic minerals and moisture elevate resistivity [63,91], compounded by deep burial depths and well-developed pore-fracture systems in the study area, further increasing resistivity [47,51,68].
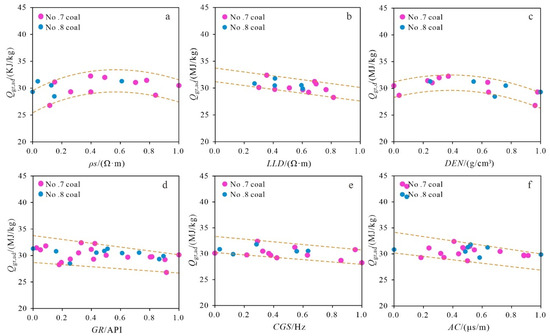
Figure 11.
Relation between calorific value of coal and logging parameters. (a) The relationship between calorific value and apparent resistivity; (b) The relationship between calorific value and lateral resistivity; (c) The relationship between calorific value and bulk density; (d) The relationship between calorific value and natural gamma; (e) The relationship between calorific value and short-spaced gamma-gamma; (f) The relationship between calorific value and acoustic transit time.
Calorific value similarly peaks and then declines with density (Figure 11c), influenced by coal rank, mineral content, lithotype, and reservoir properties [53,74]. Progressive coalification reduces moisture, enhancing calorific value alongside density in bituminous coals [14,64]. However, as bituminous coal transitions to higher ranks, density rises while calorific value decreases [91,92].
Calorific value negatively correlates with lateral resistivity, short-spaced gamma-gamma (CGS), natural gamma (GR), and acoustic transit time (AC) (Figure 11b,d–f). Heat distribution across macerals follows liptinite > vitrinite > inertinite, driven by liptinite’s higher oxygen content [55]. Resistivity decreases as coal lithotype transitions from dull to bright coal. Concurrently, declining inorganic minerals and adsorbed radioactive elements reduce calorific value as GR increases [14,25]. Coal conductivity arises from ionic conduction in mineralized water and electronic conduction via free radicals [93]. Advancing metamorphism in mid- to low-rank coals reduces moisture, densifies coal structures, and lowers lateral resistivity and AC [77,94].
4.4. Prediction Model for Geophysical Logging Response of Coal Quality
Based on the correlation coefficient between coal quality parameters and geophysical logging response values, the geophysical logging response parameters of each coal quality parameter are optimized. Among them, the correlation of Mad logging parameters from high to low is ρs, GR, LLD, and DEN. Ad has a good correlation with LLD, DEN, GR, CGS, and AC. Vdaf is LLD from high to low AC, DEN, GR; FC from high to low is GR, LLD, ρs, AC, St,d from high to low is ρs, GR, AC, and DEN; Qgr,ad have good correlations with LLD, DEN, GR, and CGS (Figure 12). We first constructed a neural network model for coal quality indicators, and then evaluated and verified the effectiveness of the prediction model.
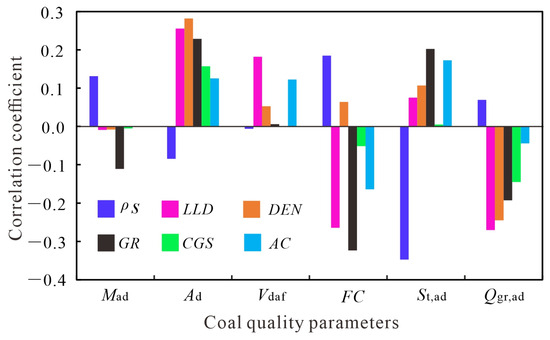
Figure 12.
Correlation coefficient between coal quality indicators and logging parameters.
4.4.1. Evaluation of Prediction Model for Coal Quality Logging Response
Two-sample independent t-tests comparing predicted and measured values for moisture content yielded a p-value of 0.430 and a two-tailed significance value (Sig) of 0.901, both exceeding the 0.050 threshold. Similar tests for ash yield, volatile matter yield, fixed carbon content, and total sulfur content produced p-values of 0.870, 0.098, 0.354, and 0.888, respectively, with corresponding two-tailed Sig values of 0.685, 0.336, 0.878, and 0.905, all above 0.050. For calorific value, the p-value (0.014) fell below 0.050, but the two-tailed Sig value (0.501) remained nonsignificant, indicating no statistically meaningful variance between predicted and measured values. These results confirm statistically insignificant differences across all coal quality parameters, validating the feasibility of the neural network model for predicting coal quality indicators using geophysical logging responses (Table 2).

Table 2.
Two-sample independent t-test table for predicted and measured coal quality parameters.
4.4.2. Validation of Coal Quality Logging Response Prediction Model
The neural network model’s reliability in predicting coal quality parameters was further validated through application to the No. 7 and No. 8 coal seams of the Shanxi Formation in the Xuzhuang and Kongzhuang mines, northern Jiangsu.
For moisture content (Mad), processed ρs, GR, and DEN logging values served as input layers. The absolute error between predicted and measured values ranged from −0.48% to 0.47% (average: 0.03%), with relative errors between −21.05% and 35.88% (average: 6.41%) (Table 3). Ash yield (Ad), modeled using DEN, AC, and GR inputs, showed absolute errors of −5.12% to 1.23% (average: −1.64%) and relative errors of −37.65% to 8.77% (average: −10.88%) (Table 4). Volatile matter (Vdaf), predicted via LLD, GR, and AC inputs, exhibited absolute errors of −8.65% to 7.16% (average: −0.64%) and relative errors of −18.33% to 22.75% (average: −0.10%) (Table 5).

Table 3.
Error analysis of predicted moisture content in coal.

Table 4.
Error analysis of ash yield in coal.

Table 5.
Error analysis of volatile matter yield in coal.
Fixed carbon (FC), optimized with LLD, GR, and AC inputs, yielded absolute errors of −1.67% to 2.52% (average: 0.78%) and relative errors of −3.07% to 5.29% (average: 1.63%) (Table 6). For total sulfur (St,d), ρs, AC, and GR inputs produced absolute errors of −0.14% to 0.04% (average: 0.03%) and relative errors of −15.12% to 6.78% (average: −2.82%) (Table 7). Calorific value (Qgr,ad), modeled with LLD, GR, and CGS inputs, showed absolute errors of −6.18% to 0.91% (average: −1.66%) and relative errors of −16.9% to 3.14% (average: −4.72%) (Table 8).

Table 6.
Error analysis of fixed carbon content in coal.

Table 7.
Error analysis of total sulfur content in coal.

Table 8.
Error analysis of calorific value in coal.
Analysis of absolute and relative errors confirms the neural network model’s accuracy, with minimal deviations supporting its utility for precise coal quality stratification and intelligent mining operations.
5. Conclusions
An approximate analysis of No. 7 and No. 8 coal samples from the Shanxi Formation within the study area indicates these are gas coals characterized by low sulfur, low ash, low fixed-carbon, high volatile matter, and high calorific value. Coal quality correlation analysis reveals a significant negative correlation between ash yield and both fixed-carbon content and calorific value. Significant correlations exist between fixed-carbon and volatile matter yield, and between fixed-carbon and calorific value. A significant positive correlation is observed between total sulfur content and volatile matter yield.
Analysis of the response relationship between coal quality parameters (moisture, ash, volatile matter, fixed carbon, total sulfur, calorific value) and geophysical logging parameters indicates that a quantifiable relationship exists. The geophysical logging response characteristics of coal quality parameters are controlled by factors including coalification degree, maceral composition, reservoir properties, and mineral types and mass fractions. Furthermore, it has been demonstrated that BP neural network models can effectively establish predictive models for the geophysical logging response of coal quality parameters. This modeling approach provides technical and theoretical support for the accurate identification of deep coal seam quality and intelligent mine mining.
Identifying coal quality indicators through logging parameters exhibits a degree of innovation. However, the complexity and diversity inherent in coal seam mineral composition, sedimentary environment, and coalification processes necessitate systematic exploration of the logging response mechanism for coal quality parameters. Concurrently, the availability of high-resolution logging parameters requires further investigation, as this will determine the feasibility of establishing accurate coal quality prediction models via geophysical logging.
Author Contributions
Conceptualization, Y.Y.; Methodology, N.Z.; Software, Y.Y.; Validation, Y.Y.; Formal analysis, Y.Y. and Y.R.; Investigation, X.S., N.Z. and Y.R.; Resources, M.W. and Y.R.; Writing—original draft, X.S., M.W. and H.M.; Writing—review & editing, M.W. and H.M.; Visualization, Y.Q.; Supervision, Y.Q.; Project administration, N.Z., Y.Q. and Y.R.; Funding acquisition, X.S. All authors have read and agreed to the published version of the manuscript.
Funding
Xuejuan Song and Yong Qin were supported by the National Natural Science Foundation of China, under research project no 42002193 and 42130802. Meanwhile, Xuejuan Song was supported by the Qing Lan Project of Jiangsu Province. Meng Wu was supported by the Open Fund of Key Laboratory of Coalbed Methane Resources and Reservoir Formation Process of the Ministry of Education (China University of Mining and Technology) (no 2022–006) and Science and Technology fund of Geological Society of Jiangsu Province (no JSDZXH-P2024-03).
Institutional Review Board Statement
Not applicable.
Informed Consent Statement
Not applicable.
Data Availability Statement
The original contributions presented in this study are included in the article. Further inquiries can be directed to the corresponding authors.
Conflicts of Interest
Author Hao Ma was employed by the company BGRIMM Technology Group. The remaining authors declare that the research was conducted in the absence of any commercial or financial relationships that could be construed as a potential conflict of interest.
References
- Teng, J.; Qiao, Y.; Song, P. Analysis of exploration, potential reserves and high efficient utilization of coal in China. Chin. J. Geophys. 2016, 59, 4633–4653. [Google Scholar]
- Wang, S.; Shen, Y.; Song, S.; Liu, L.; Gu, L.; Wei, J. Change of coal energy status and green and low-carbon development under the “dual carbon” goal. J. China Coal Soc. 2023, 48, 2599–2612. [Google Scholar]
- Xie, H.; Ren, S.; Xie, Y.; Jiao, X. Development opportunities of the coal industry towards the goal of carbon neutrality. J. China Coal Soc. 2021, 46, 2197–2211. [Google Scholar]
- Fu, X.; Qin, Y.; Wang, G.; Rudolph, V. Evaluation of gas content of coalbed methane reservoirs with the aid of geophysical logging technology. Fuel 2009, 88, 2269–2277. [Google Scholar] [CrossRef]
- Roslin, A.; Esterle, J.S. Electrofacies analysis using high-resolution wireline geophysical data as a proxy for inertinite-rich coal distribution in late permian coal Seams, bowen Basin. Int. J. Coal Geol. 2015, 152, 10–18. [Google Scholar] [CrossRef]
- Wang, Y.; Liu, D.; Cai, Y.; Yao, Y.; Zhou, Y. Evaluation of structured coal evolution and distribution by geophysical logging methods in the Gujiao Block, northwest Qinshui basin, China. J. Nat. Gas Sci. Eng. 2018, 51, 210–222. [Google Scholar] [CrossRef]
- Huang, Z.; Zou, C.; Yang, Y.; Zhang, G.; Wang, W. Coalbed methane reservoir evaluation from wireline logs in TS district, southern Qinshui Basin. Geoscience 2012, 26, 1275–1282. [Google Scholar]
- Quirein, J.; Galfohd, J.; Witkowsky, J. Formation evaluation and characterization of shale-gas reservoirs by means of core and wireline date integration. TLE 2013, 32, 1486–1492. [Google Scholar]
- Mao, Z.; Zhao, Y.; Sun, W.; Cai, W.; Luo, A.; Zhao, Y. Identification on the type of coal rank by using geophysical well logging data. J. China Coal Soc. 2011, 36, 766–771. [Google Scholar]
- Jin, Z.; Xue, H.; Gao, H.; Zhao, X.; Bai, G. Technology for evaluation of CBM reservoir logging and its application. Coal Geol. Explor. 2013, 41, 42–45. [Google Scholar]
- Shi, Q.; Geng, X.; Wang, S.; Cai, Y.; Han, B.; Wang, S.; Zhang, Z.; He, Y. Identification of tar-rich coal based on the true density and natural gamma ray response of coals. Coal Geol. Explor. 2024, 52, 85–96. [Google Scholar]
- Kayal, J.R.; Christoffel, D.A. Coal quality from geophysical logs: Southland lignite region, New Zealand. Log Anal. 1989, 30, 343–352. [Google Scholar]
- Ghosh, S.; Chatterjee, R.; Paul, S.; Shanker, P. Designing of plug-in for estimation of coal proximate parameters using statistical analysis and coal seam correlation. Fuel 2014, 134, 63–73. [Google Scholar] [CrossRef]
- Meng, Z.; Zhu, S.; Jia, L.; Shen, H. Relationship between approximate analysis of coal and log parameters and its models. Coal Geol. Explor. 2011, 39, 1–6. [Google Scholar]
- Liang, M.; Sun, W.J. Application of geophysical logging in parameters’integrated interpretation of coal reservoir—Taking the well-a in PS mining area as an example. Sci. Technol. Eng. 2013, 13, 5121–5126+5140. [Google Scholar]
- Shao, X.; Sun, Y.; Sun, J.; Tang, D.; Xu, H.; Dong, X.; Lv, Y. Logging interpretation of coal petrologic parameters: A case study of Hancheng mining area. Pet. Explor. Dev. 2013, 40, 559–565. [Google Scholar] [CrossRef]
- Wu, M.; Shen, J.; Qin, Y.; Qin, Y.; Wang, X.; Zhu, S. Method of identifying total sulfur content in coal: Geochemical and geophysical logging data from the Upper Paleozoic in North China. ACS Omega 2022, 49, 45045–45056. [Google Scholar] [CrossRef]
- Mullen, M.J. Coalbed methane resource evaluation from wireline logs in the Northeastern San Juan Basin: A case study. In The Rocky Mountain Regional Meeting and Low-Permeability Reservoirs Symposium and Exhibition; SPE, Ed.; SPE: Denver, CO, USA, 1989; pp. 180–192. [Google Scholar]
- Charbucinski, J.; Nichols, W. Application of spectrometric nuclear borehole logging for reserves estimation and mine planning at Callide coalfields open-cut mine. Appl. Energy 2003, 74, 313–322. [Google Scholar] [CrossRef]
- Zhou, B.; Esterle, J. Toward improved coal density estimation from geophysical logs. Explor. Geophys. 2008, 39, 124–132. [Google Scholar] [CrossRef]
- Pan, H.; Liu, G. Applying back-propagation artificial neural networks to predict coal quality parameters and coalbed gas content. Earth Sci. 1998, 22, 45–49. [Google Scholar]
- Tercan, A.E.; Sohrabian, B. Multivariate geostatistical simulation of coal quality data by independent components. Int. J. Coal Geol. 2013, 112, 53–66. [Google Scholar] [CrossRef]
- Zhang, Z.Q. On coalbed methane industrial components and gas content calculation model in Heshun area. Well Logging Technol. 2013, 37, 99–102. [Google Scholar]
- Zhou, B.; O’Brien, G. Improving coal quality estimation through multiple geophysical log analysis. Int. J. Coal Geol. 2016, 167, 75–92. [Google Scholar] [CrossRef]
- Wu, M.; Qin, Y.; Wang, X.; Yang, L.; Zhu, S.; Zhang, Z.; Mao, L.; Zhang, J.; Li, G. Log response of coal quality and its prediction model in Renjiazhuang coal mine. J. Jilin U Earth Sci. Ed. 2022, 52, 633–643. [Google Scholar]
- Brach, I.; Giuntini, J.C.; Zanchetta, J.V. Real part of the permittivity of coals and their rank. Fuel 1994, 73, 738–741. [Google Scholar] [CrossRef]
- Chen, Q.; Li, P.; Wei, X.L.; Chen, C.S.; Dang, W.; Nie, H.K.; Zhang, J.C. Mineralogy and geochemistry of shale from Shanxi Formation, Southern North China Basin: Implication for organic matter accumulation. Unconv. Resour. 2025, 6, 100151. [Google Scholar] [CrossRef]
- Shao, Y.W.; Zhao, F.H.; Mu, F.H.; Sun, B.; Liang, K.H.; Wang, D.D.; Lu, J.; Ma, S.M.; Shao, L.Y. Sequence-paleogeography and coal accumulation of the Late Carboniferous—Early Permian paralic successions in western Shandong Province, northern China. Mar. Petrol. Geol. 2023, 151, 106184. [Google Scholar] [CrossRef]
- Lu, J.; Shao, L.Y.; Sun, B.; Yang, M.F.; Dong, D.X.; Tian, W.G.; Li, M.P. Sequence-paleogeography and coal accumulation of Carboniferous-Permian coal measures in the Eastern Ordos Basin. J. China Coal Soc. 2012, 37, 747–754. [Google Scholar]
- Zhang, Z.L.; Sun, K.Q.; Yin, J. Sedimentology and sequence stratigraphy of the Shanxi Formation (Lower Permian) in the northwestern Ordos Basin, China: An alternative sequence model for fluvial strata. Sediment. Geol. 1997, 112, 123–136. [Google Scholar] [CrossRef]
- Wu, J.; Wang, H.Y.; Shi, Z.S.; Wang, Q.; Zhao, Q.; Dong, D.Z.; Li, S.X.; Liu, D.X.; Sun, S.S.; Qiu, Z. Favorable lithofacies types and genesis of marine-continental transitional black shale: A case study of Permian Shanxi Formation in the eastern margin of Ordos Basin, NW China. Petrol. Explor. Dev. 2021, 48, 1315–1328. [Google Scholar] [CrossRef]
- Chu, F.; Yue, T.; Yu, M.; Zhang, Y.; Zhang, X.; Hu, S. Analysis on water inrush geological condition in Sanhejian Coal Mine of Xuzhou Mine Area. Coal Sci. Technol. 2014, 42, 223–225. [Google Scholar]
- Chinese Standard GB/T 482-2008; Sampling of Coal Seams. The Standardization Administration of China: Beijing, China, 2008.
- ASTM D2492-02; Standard Test Method For Forms of Sulfur in Coal. ASTM International: West Conshohocken, PA, USA, 2012.
- ASTM D3174-12; Standard Test Method for Ash in the Analysis Sample of Coal and Coke from Coal. ASTM International: West Conshohocken, PA, USA, 2018.
- ASTM D3175-20; Standard Test Method for Volatile Matter in the Analysis Sample of Coal and Coke. ASTM International: West Conshohocken, PA, USA, 2020.
- ASTM D3173M-17a; Standard Test Method for Moisture in the Analysis Sample of Coal and Coke. ASTM International: West Conshohocken, PA, USA, 2017.
- ASTM D2798-21; Standard Test Method for Microscopical Determination of the Vitrinite Reflectance of Coal. ASTM International: West Conshohocken, PA, USA, 2021.
- Chinese Standard GB/T 213-2008; Determination of Calorific Value of Coal. General Administration of Quality Supervision: Beijing, China; Inspection and Quarantine of the People’s Republic of China: Beijing, China; Stand-ardization Administration of China: Beijing, China, 2008.
- Zhang, Q.; Shi, R.; Gou, R.; Yang, G.; Tuo, X.G. Genetic algorithm optimized BP neural network for fast reconstruction of three-dimensional radiation field. Appl. Radiat. Isotopes 2025, 217, 111668. [Google Scholar] [CrossRef]
- Abiodun, O.I.; Jantan, A.; Omolara, A.E.; Dada, K.V.; Umar, A.M.; Linus, O.U. Comprehensive review of artificial neural network applications to pattern recognition. IEEE Access 2019, 7, 158820–158846. [Google Scholar] [CrossRef]
- Xue, S.; Zheng, X.; Yuan, L.; Lai, W.; Zhang, Y. A review on coal and gas outburst prediction based on machine learning. J. China Coal Soc. 2024, 49, 664–694. [Google Scholar]
- Iordanidis, A.; Asvesta, A.; Kapageridis, I.; Vasileiadou, A.; Koios, K.; Oikonomidis, S.; Kantiranis, N. A comprehensive analytical characterization of Greek lignite bottom ash samples. Therm. Sci. 2021, 25, 1879–1889. [Google Scholar] [CrossRef]
- Gayer, R.A.; Rose, M.; Dehmer, J.; Shao, L. Impact of sulphur and trace element geochemistry on the utilization of a marine-influenced coal—Case study from the South Wales Variscan foreland basin. Int. J. Coal Geol. 1999, 40, 151–174. [Google Scholar] [CrossRef]
- Liu, B.; Huang, W.; Ao, W.; Zhang, S.; Wu, J.; Xu, Q.; Teng, J. Geochemistry characteristics of sulfur and its effect on hazardous elements in the Late Paleozoic coal from the Qinshui Basin. Front. Earth Sci. 2016, 23, 59–67. [Google Scholar]
- Zhang, H.; Li, X.Y.; Hao, Q. Scanning Electron Microscopy Study of Chinese Coal; Geological Publishing House: Beijing, China, 2003; pp. 49–52. [Google Scholar]
- Idarwati, I.; Maulia, D. Neogene coal characteristics and depositional environments in the Kikim Area of South Sumatra Basin; Insights from logging, proximate test, sulphur test and electrofacies. Berita Sedimentol. 2024, 50, 75–92. [Google Scholar]
- Ruppert, L.F.; Hower, J.C.; Eble, C.F. Arsenic-bearing pyrite and marcasite in the Fire Clay coal bed, Middle Pennsylvanian Formation, eastern Kentucky. Int. J. Coal Geol. 2005, 63, 27–35. [Google Scholar] [CrossRef]
- Liu, B.; Huang, W.; Ao, W.; Yan, D.; Xu, Q.; Teng, J. Occurrence characteristics of minerals and their influences on physical properties of coal reservoirs in Southern Qinshui Basin. Geoscience 2014, 28, 645–652. [Google Scholar]
- Liu, D.; Yang, Q.; Zhou, C.; Tang, D.; Kang, X. Occurrence and geological genesis of pyrites in Late Paleozoic coals in North China. Geochimica 1999, 28, 340–350. [Google Scholar]
- Raiswell, R. Kinetic controls on depth variations in localised pyrite formation. Chem. Geol. 1993, 107, 467–469. [Google Scholar] [CrossRef]
- Yang, Z.; Ji, H.; Bao, Z.; Shi, Y.; Zhao, Y.; Xiang, P. Dolomite crystal structure and geochemical characteristics in response to depositional environment: An example of dolomite from the Late Ediacaran Dengying Formation of the Yangzi Plateau. Front. Earth Sci. 2024, 31, 68–79. [Google Scholar]
- Yang, Y.; Peeters, M.; Kirk, C.W.V.; Cloud, T.A. Gas productivity related to cleat volumes derived from focused resistivity tools in coalbed methane (CBM) Fields. Petrophysics 2006, 47, 250–257. [Google Scholar]
- Zhao, J.; Chil, J. Review and prospect of influencing factors and prediction methods of coal bed gas reservoir physical properties. Prog. Geophys. 2020, 35, 272–280. [Google Scholar]
- Xie, R.H. Log interpretation method of oil & gas formation with low resistivity. Well Logging Technol. 2001, 25, 199–203+241. [Google Scholar]
- Zhang, S.; Tang, S.; Tang, D.; Pan, Z.; Yang, F. The characteristics of coal reservoir pores and coal facies in Liulin district, Hedong coal field of China. Int. J. Coal Geol. 2009, 80, 113–123. [Google Scholar] [CrossRef]
- Liu, D.; Jia, Q.; Cai, Y. Research progress on coalbed methane reservoir geology and characterization technology in China. Coal Sci. Technol. 2022, 50, 196–203. [Google Scholar]
- Tong, M.; Hu, J.; Tang, S.; Dai, X. Study of acoustic emission signal characteristic of water-containing coal and rock under different stress rates. J. Min. Saf. Eng. 2009, 26, 97–100. [Google Scholar]
- Meng, Z.; Liu, S.; Wang, B.; Yu, Z. Study on feature of coal body structure and logging response in Jincheng Mining area. Coal Sci. Technol. 2015, 43, 58–63+67. [Google Scholar]
- Yao, J.; Sima, L.; Zhang, Y. Quantitative identification of deformed coals by geophysical logging. J. China Coal Soc. 2011, 36, 94–98. [Google Scholar]
- Qin, Y.; Fu, X.; Wu, C.; Shen, J.; Yang, Z. Introduction to Fossil Energy Geology; China University of Mining and Technology Press: Xuzhou, China, 2017. [Google Scholar]
- Huang, Y.; Sun, D.; Wang, P.; Qu, L. Characteristics of well-logging response to lava flow units of the Lower Cretaceous basalts in Songliao Basin. Chin. J. Geophys. 2011, 54, 524–533. [Google Scholar]
- Dziok, T.; Strugala, A.; Rozwadowski, A.; Macherzyński, M. Studies of the correlation between mercury content and the content of various forms of sulfur in polish hard coals. Fuel 2015, 159, 206–213. [Google Scholar] [CrossRef]
- Tang, D.; Wang, S. Mechanism of Controlling Physical Properties of Coal Reservoirs and Methods for Predicting Favorable Reservoirs; Science Press: Beijing, China, 2010; pp. 100–123. [Google Scholar]
- Liu, J.; Lu, G. Digital Processing of Coalfield Logging Data; Coal Industry Press: Beijing, China, 1991. [Google Scholar]
- Zhao, Y.; Mao, Z.; Sun, W.; Cai, W.; Luo, A.; Zhao, Y. Evaluation method for unconventional log data of CBM reservoir. Well Logging Technol. 2011, 35, 441–446. [Google Scholar]
- Herron, M. Mineralogy from geochemical well logging. Clays Clay Miner. 1986, 34, 204–213. [Google Scholar] [CrossRef]
- Ma, Z. Utilization of the combination of log shapes for explanation of the sedimentary encironment. Oil Gas Geol. 1982, 3, 25–40. [Google Scholar]
- Jiang, S.F.; Du, Z.G.; Liu, Z.Y. Typomorphies of crystal form and pyroelectric property of pyrite and their practical significances. J. Northeast. U Nat. Sci. 1995, 16, 458–462. [Google Scholar]
- Dou, C.; Tang, X.; Xiang, K.; Sun, B.; Yan, L. Elastic and electrical properties of shales from Qiongzhusi and Longmaxi Formation. Lithol. Reserv. 2016, 28, 111–116. [Google Scholar]
- Gao, X. The responses of density and neutron loggings on the coalbed methane content and the logging interpretation. Coal Geol. Explor. 1999, 27, 25–28. [Google Scholar]
- Li, M.; Jiang, B.; Qin, Y.; Liu, J. Analysis of mineral effect on coal pore structure of tectonically deformed coal. J. China Coal Soc. 2017, 42, 726–731. [Google Scholar]
- Zhang, Z. Physical and chemical properties of mantle sulfide and its geological implications. Acta Petrol. Sin. 2023, 39, 83–92. [Google Scholar] [CrossRef]
- Xu, Q.; Huang, W.; Yang, Y.; Liu, B.; Yan, D.; Lu, X. Analysis on factors affected to low permeability of No.15 seam in Shizhuang area. Coal Sci. Technol. 2016, 44, 141–146. [Google Scholar]
- Chen, J.; Huang, W.; Lu, X.; Yan, D.; Zhang, Q. Quantitative analysis on tectonically deformed coal and its physical properties in Shizhuang area of Qinshui Basin. J. China Coal Soc. 2017, 42, 732–737. [Google Scholar]
- Chen, J.; Jiang, L.; Zhang, Y.; Zhang, T. Study on coal conductive properties of different coal structure. Coal Sci. Technol. 2011, 39, 90–92+101. [Google Scholar]
- Meng, Z.; Tian, Y.; Li, G. Geological Theory and Methods of Coalbed Methane Development; Science Press: Beijing, China, 2010. [Google Scholar]
- Wang, Q.; Mao, N.; Yang, Y.; Zhang, J.; Bai, H. Molecular structures and comparative analysis of macerals of vitrinite and inertinite for Qinghua coal, Ningxia. Chem. Ind. Eng. Prog. 2020, 39, 142–151. [Google Scholar]
- Yuan, C.; Li, C.; Zhou, C.; Xiao, Q.; Li, X.; Fan, Y.; Yu, J.; Wang, L.; Xing, T. Forward simulation of array laterolog resistivity in anisotropic formation and its application. Petrol. Explor. Dev. 2020, 47, 77–85. [Google Scholar] [CrossRef]
- Wang, W.; Qin, Y.; Sang, S.; Jiang, B.; Zhu, Y.; Guo, Y. Sulfur variability and element geochemistry of the No. 11 coal seam from the Antaibao Mining District, China. Fuel 2007, 86, 777–784. [Google Scholar] [CrossRef]
- Wang, W.; Wang, W.; Liu, S.; Bai, H.; Wang, Y.; Duan, P.; Qin, K.; Chen, Y. Distribution and occurrence of uranium in coal and its migration behavior during the coal utilization. Coal Geol. Explor. 2021, 49, 65–80. [Google Scholar]
- Wang, X.; Feng, Q.; Fang, T.; Liu, J.; Liu, G. Geochemical characteristics of uranium in medium to high sulfur coals from Eastern Yunnan, China. J. China Coal Soc. 2015, 40, 2451–2457. [Google Scholar]
- Zheng, X.; Wu, P.; Zhang, D.; Tong, X.; Li, T. Effects of microcrystalline structure and mineral elements on coal resistivity. Sci. Technol. Eng. 2021, 21, 14523–14527. [Google Scholar]
- Xu, H.W. Measurement and test of seam electric parameter and study on relationship between seam electric parameter and coal petrology characteristics. Coal Sci. Technol. 2005, 33, 42–46. [Google Scholar]
- Xiang, J.; Zeng, F.; Liang, H.; Li, M.; Song, X.; Zhao, Y. Carbon structure characteristics and evolution mechanism of different rank coals. J. China Coal Soc. 2016, 41, 1498–1506. [Google Scholar]
- Tang, Y.; Ren, D.; Zheng, J.; Guo, M.; Rong, X.; Ni, Y. Magnetic properties and mechanism of pyrite in coal. Sci. Bull. 1995, 40, 1483–1486. [Google Scholar]
- Zhang, F.; Li, Y.; Xin, Y.; Su, B.; Wu, H.; Zhang, Q.; Liu, J. Numerical simulation of density logging based on X-ray and gamma ray sources. J. China Univ. Pet. Ed. Nat. Sci. 2018, 42, 60–66. [Google Scholar]
- Yang, Z. Occurrence and abundance of V, Cr, Mo, and U in the Late Permian Coals from Yanshan, Yunnan, China. Bull. Mineral. Petrol. Geochem. 2009, 28, 268–271. [Google Scholar]
- Wu, Y.; Qin, Y.; Yi, T. Enrichment of rare earth elements in high sulfur coal of Liangshan Formation from Kaili, Guizhou, China and geological origin. Acta Geol. Sin. 2010, 84, 280–285. [Google Scholar]
- Bucker, C.J.; Delius, H.; Wohlenberg, J. Physical signature of basaltic volcanics drilled on the northeast Atlantic volcanic rifted margins. Geo. Soc. London Special Pub. 1998, 136, 363–374. [Google Scholar] [CrossRef]
- Dai, S.; Ren, D.; Tang, Y. Modes of occurrence of major elements in coal and their study significance. Coal Geol. Explor. 2005, 33, 1–5. [Google Scholar]
- Zhang, B.; Xue, Y.; Huang, C. Multivariable linear regression of the correlation between calorific value and moisture and ash content of coal. Coal Geol. Explor. 2014, 42, 8–10+15. [Google Scholar]
- Sun, W. Analysis and Evaluation Technology of Logging Response Mechanism in Different Coal Seam Stages; China University of Petroleum: Beijing, China, 2012. [Google Scholar]
- Inculet, I.I.; Bergougnou, M.A.; Brown, J.D. Electrostatic beneficiation of coal. In Physical Cleaning of Coal—Present and Developing Methods; Liu, Y.A., Ed.; Marcel Dekker: New York, NY, USA, 1982; pp. 87–131. [Google Scholar]
Disclaimer/Publisher’s Note: The statements, opinions and data contained in all publications are solely those of the individual author(s) and contributor(s) and not of MDPI and/or the editor(s). MDPI and/or the editor(s) disclaim responsibility for any injury to people or property resulting from any ideas, methods, instructions or products referred to in the content. |
© 2025 by the authors. Licensee MDPI, Basel, Switzerland. This article is an open access article distributed under the terms and conditions of the Creative Commons Attribution (CC BY) license (https://creativecommons.org/licenses/by/4.0/).