Article

MSFNet: A Multi-Source Fusion-Based Method with Enhanced Hierarchical Spectral Semantic Perception for Wheat Disease Region Classification

1
College of Information Engineering, Northwest A&F University, Xianyang 712100, China
2
Key Laboratory of Agricultural Internet of Things, Ministry of Agriculture and Rural Affairs, Xianyang 712100, China
3
Shaanxi Key Laboratory of Agricultural Information Perception and Intelligent Service, Xianyang 712100, China
*
Author to whom correspondence should be addressed.
Appl. Sci. 2025, 15(13), 7317; https://doi.org/10.3390/app15137317
Submission received: 14 April 2025 / Revised: 23 June 2025 / Accepted: 28 June 2025 / Published: 29 June 2025

Abstract

Wheat diseases threaten yield and food security, highlighting the need for rapid, accurate diagnosis in precision agriculture. However, current remote sensing methods often lack hierarchical spectral semantic perception or rely on single-source data and simple fusion, limiting diagnostic performance. To address these challenges, this study proposed MSFNet, a novel multi-source fusion network with enhanced hierarchical spectral semantic perception, to achieve the precise regional classification of wheat diseases. Specifically, a multi-source fusion module (MSFM) was developed, employing a dual-branch architecture to simultaneously enhance spatial–spectral semantics and comprehensively explore complementary cross-modal features, thereby enabling the effective integration of critical information from both modalities. Furthermore, a hierarchical spectral semantic fusion module (HSSFM) was developed, which employs a pyramid architecture integrated with attention mechanisms to fuse hierarchical spectral semantics, thereby significantly enhancing the model’s hierarchical feature representation capacity. To support this research, we constructed a new multispectral remote sensing dataset, MSWDD2024, tailored for wheat disease region diagnosis. Experimental evaluations on MSWDD2024 demonstrated that MSFNet achieved 95.4% accuracy, 95.6% precision, and 95.6% recall, surpassing ResNet18 by 6.0%, 6.0%, and 5.8%, respectively, and outperforming RGB-only models by over 12% across all metrics. Moreover, MSFNet consistently exceeded the performance of existing state-of-the-art methods. These results confirm the superior effectiveness of MSFNet in remote sensing-based wheat disease diagnosis, offering a promising solution for robust and accurate monitoring in precision agriculture.

1. Introduction

Wheat is one of the most widely cultivated cereal crops globally due to its strong adaptability and high yield potential. As a fundamental dietary staple, it plays a vital role in ensuring global food security. Approximately 20% of the world’s wheat is produced in China, where wheat production plays a crucial role in ensuring national food security [1]. However, the frequent occurrence of wheat diseases has become a significant issue affecting wheat production [1]. In particular, the spread of wheat yellow dwarf disease and wheat rust poses a severe threat, as these diseases are highly contagious and can cause significant damage to wheat leaves and roots, weakening photosynthesis and disrupting growth and development [2]. As a result, wheat yield and quality are significantly reduced. To address this challenge, developing a cost-effective and timely method for the large-scale, coarse-grained identification of wheat disease-affected areas is of paramount importance for enhancing disease control efficiency, safeguarding wheat yields, and ensuring national food security.
Conventional plant disease detection predominantly depends on visual assessments conducted by farmers or experts, which are inherently subjective, highly reliant on individual experience, time-consuming, labor-intensive, and economically inefficient. With the advancement of deep learning, an increasing number of deep learning approaches have been applied to computer vision [3,4,5,6,7], thus advancing the development of smart agriculture [8]. Goyal et al. introduced an enhanced deep convolutional model for wheat disease classification, achieving an accuracy of 97.88% across 10 disease classes [9]. Nachtigall et al. developed a CNN-based model for the automatic detection and classification of apple tree disorders, achieving 97.3% accuracy [10]. Furthermore, the development of object detection techniques in deep learning has further propelled research into fine-grained plant disease detection [11]. For instance, Sun et al. proposed MEAN-SSD, a lightweight CNN model for real-time apple leaf disease detection on mobile devices, achieving 83.12% mAP and 12.53 FPS [12]. Qi et al. improved the SE-YOLOv5 model for tomato virus disease recognition, achieving an accuracy of 91.07% and a mean average precision of 94.10%, outperforming other models [13]. However, existing studies predominantly rely on RGB single-source images captured by ground-based handheld devices. While these methods perform well in fine-grained detection at the leaf or lesion level, they are often unsuitable for large-scale field scenarios, particularly when it comes to detecting disease-affected areas.
The development of UAV-based low-altitude remote sensing technology has provided significant opportunities for precision agriculture [14,15]. Due to its advantages, including minimal meteorological and landing site constraints, wide application range, low operational costs, and ability to capture high-resolution imagery, UAV remote sensing has been widely applied in crop yield estimation [16,17,18], disease diagnosis [19,20,21], and crop growth monitoring [22,23,24]. When crops are affected by diseases, their spectral responses at specific wavelengths exhibit marked alterations. By effectively capturing these spectral variations, accurate disease diagnosis can be achieved. For example, the red band can be used to detect potato late blight [25], the red-edge band is suitable for detecting oil palm orange spot disease [26], and infrared bands have also been widely applied in crop disease detection [27]. The above studies mainly focus on using a single band or detecting a single disease, neglecting the comprehensive use of multi-band information. UAVs equipped with multispectral cameras can capture images across various bands when crop diseases occur, enabling the extraction of spectral features for different diseases at different bands. Recently, an increasing number of studies have employed multispectral remote sensing technology for plant disease detection [28,29]. For instance, Li et al. applied multi-source image fusion using RGB and multispectral UAV images for apple disease and pest classification, achieving a subset accuracy of 92.92% [30]. Hao et al. developed DBFormer, a dual-branch multiscale model for detecting wheat yellow dwarf disease from UAV multispectral images, achieving a mean intersection over union of 88.51% and a mean pixel accuracy of 93.73% [31]. Silva et al. combined convolutional neural networks and Vision Transformers for multispectral plant disease detection, achieving a precision of 90.1% and an accuracy of 83.3% [32]. These studies highlight the promising potential of multispectral remote sensing technology for plant disease detection.
Despite the considerable body of research applying remote sensing technologies for plant disease detection, most studies have focused on image segmentation and object detection, with insufficient attention given to disease area classification. Additionally, existing multi-source image fusion methods for disease regional classification tend to be simplistic and struggle to effectively integrate information from different data sources. Moreover, due to the low spectral resolution of multispectral images and the use of relatively simple image classification models in current studies, spectral semantic information is often underutilized and poorly fused. To address the above challenges, a novel MSFNet was proposed in this paper, which effectively integrates multi-source data and leverages the concept of a visual pyramid to enhance the extraction and fusion of spectral semantic information at different levels, thereby improving the accuracy and performance of disease regional classification. The main contributions of this paper are as follows:
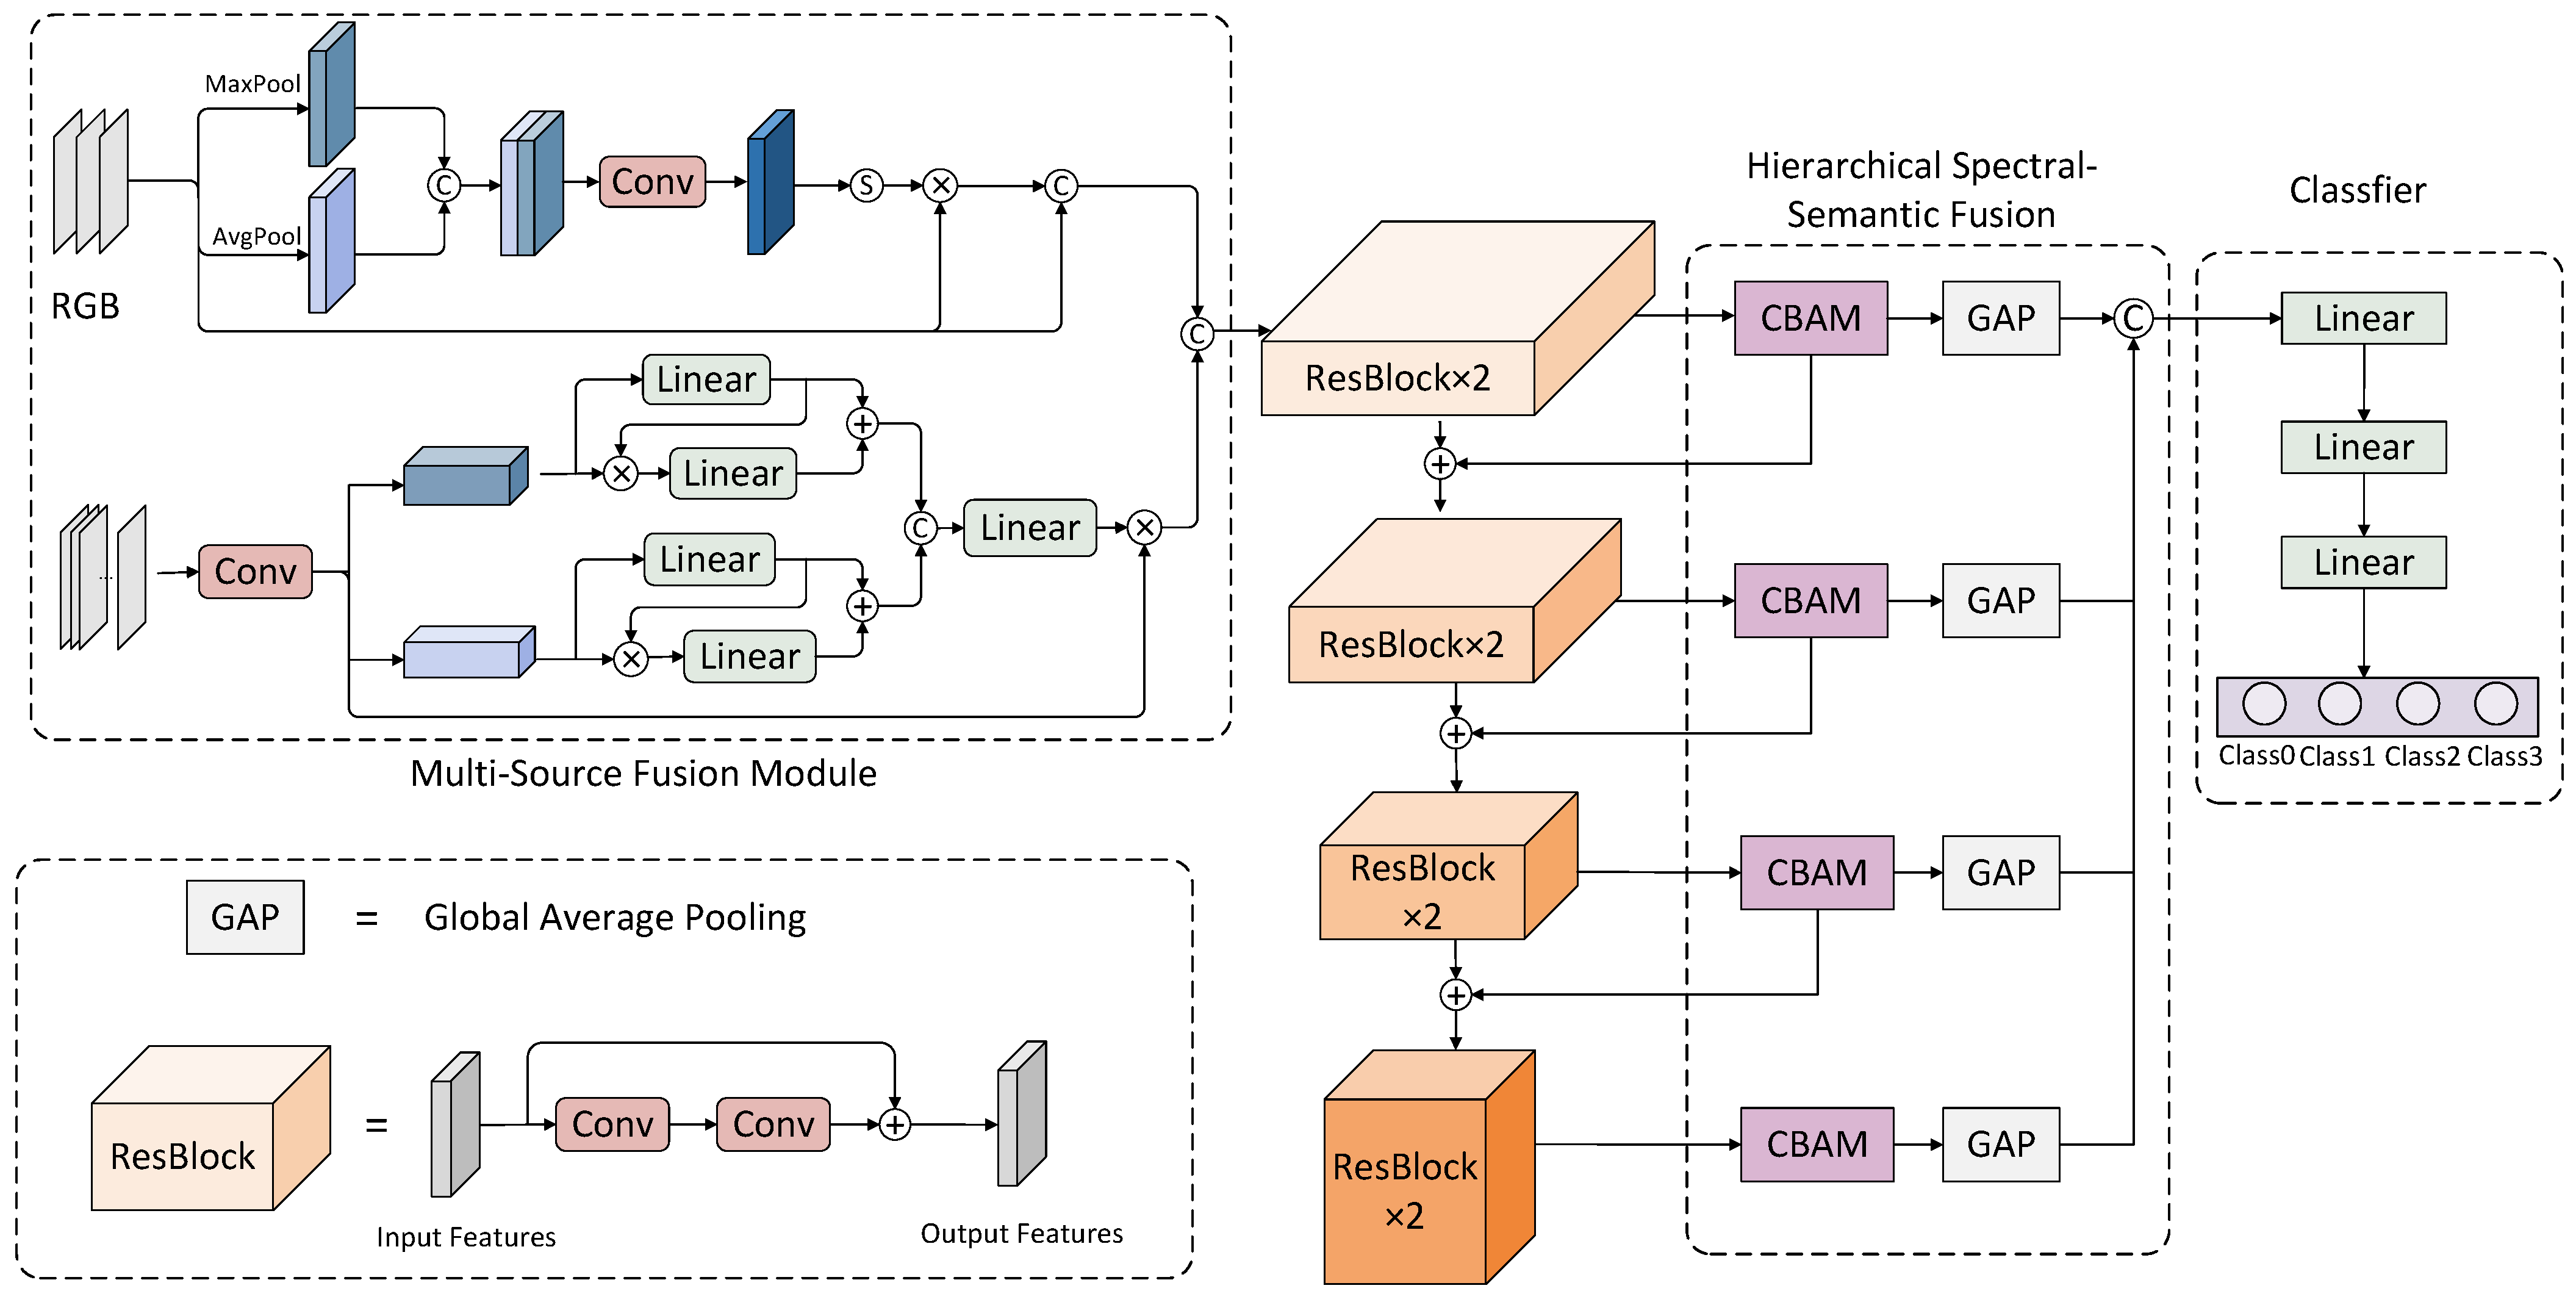
  • A novel MSFNet was proposed for the identification of wheat disease-affected regions from multispectral UAV images, which integrates multi-source features via a multi-source fusion module and enhances spectral variation perception through a hierarchical spectral semantic fusion module.
  • A novel multi-source fusion module (MSFM) was proposed, utilizing a dual-branch structure to separately process RGB and multispectral vegetation index images, thereby enhancing spatial–spectral semantics and effectively integrating the complementary features of multi-source data.
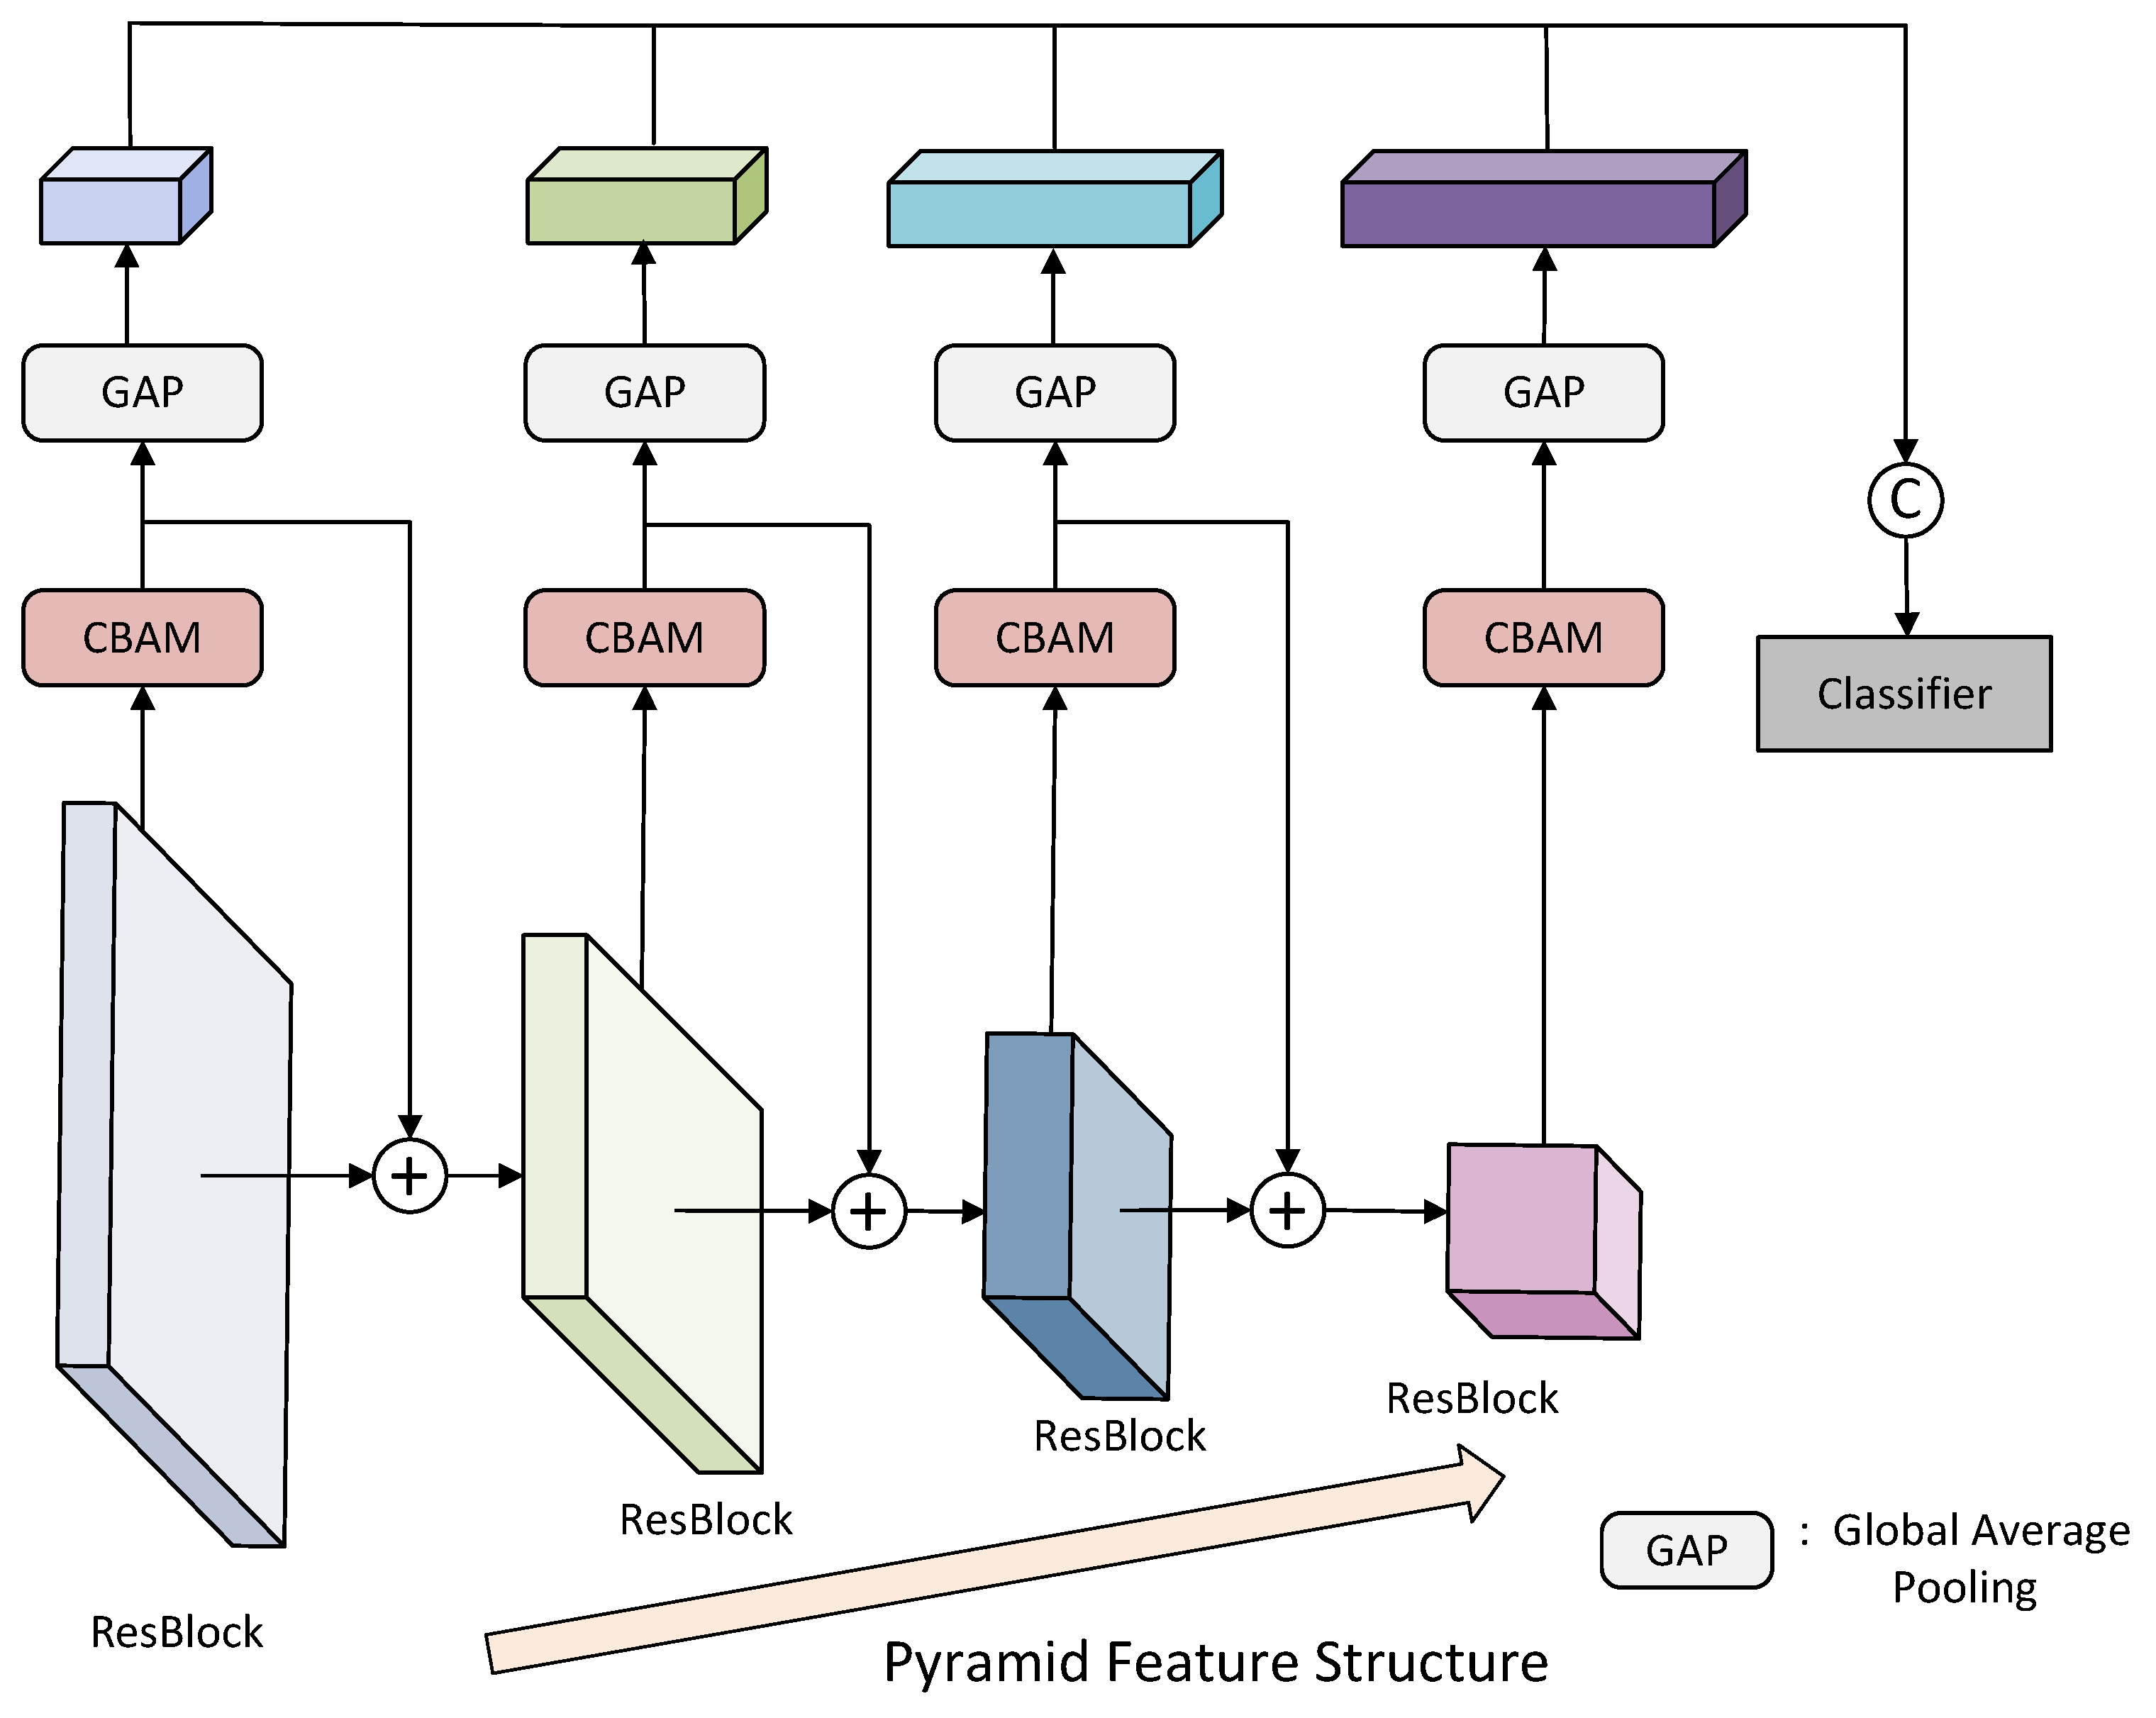
  • A novel hierarchical spectral semantic fusion module (HSSFM) was presented, which adopts a pyramid architecture and incorporates an attention mechanism to fuse hierarchical spectral semantics, thereby expanding the model’s receptive field for spectral variations.

2. Materials and Methods

2.1. The Construction of MSWDD2024

Due to the limited availability of multispectral remote sensing images for regional wheat disease classification, a multispectral wheat disease dataset, MSWDD2024, was constructed. Details of the data acquisition process are provided in Section 2.1.1, whereas the preprocessing steps and annotation methodology are described in Section 2.1.2.

2.1.1. The Acquisition of Data

As shown in Figure 1, the multispectral remote sensing imagery used in this study was captured from wheat experimental fields at the North Campus of Northwest A&F University and the Cao Xinzhuang Wheat Experimental Base in Yangling, Xianyang, Shaanxi Province, China. Data acquisition was conducted on 17 April and 23 April 2024. To ensure high image quality and minimize the impact of illumination variation, data collection was performed at midday (11:30–13:30) under stable lighting conditions and low wind speeds. The imaging system utilized a DJI Phantom 4 Pro multispectral UAV, which is equipped with an RGB camera and five multispectral sensors covering five spectral bands: the blue, red, near-infrared (NIR), red-edge, and green bands. During data acquisition, the UAV was operated at a flight altitude of 45 feet, with a fixed nadir camera angle of −90°, yielding a ground sampling distance (GSD) of 0.896 cm/pixel. To maintain spatial consistency and ensure sufficient image overlap, both longitudinal and lateral overlap rates were set to 80%, and the UAV followed a predefined flight path for autonomous image capture. Additionally, under expert guidance, field surveys were conducted to document the spatial distribution of healthy and diseased wheat regions, providing precise reference information for subsequent data annotation.

2.1.2. The Processing of Data

The preprocessing of the experimental data was performed using Pix4D software to stitch multiple drone-captured images into orthophotos. The software effectively corrects geometric distortions caused by camera angles and flight heights through automated image registration and geometric correction. It also performs radiometric calibration to compensate for lighting intensity, solar angle, and sensor orientation, ensuring spatial alignment and spectral consistency across the dataset. Subsequently, the generated RGB and multispectral images were concatenated along the channel dimension, resulting in an 8-channel composite image.
After data preprocessing, a sliding window approach was applied to extract 64 × 64 pixel image patches from the orthomosaic (as shown in Figure 2). The 64 × 64 patch size was empirically selected to balance classification accuracy and spatial context. Given the ground resolution, each patch covered approximately 57.3 cm × 57.3 cm on the field, which corresponds well with the typical size of disease-affected wheat regions. This size provides a sufficient spatial context for identifying the spectral and textural patterns of disease while minimizing the risk of mixed labels or information dilution. Each patch was annotated based on the field survey data, categorizing it into one of four classes: healthy, stripe rust, yellow dwarf, and others. The “others” class was specifically introduced to account for non-crop regions in the imagery, such as soil, weeds, roads, and artificial structures. Including these complex background samples in the classification process enabled the model to better distinguish disease-affected crop areas from irrelevant background patterns, thereby improving robustness under heterogeneous field conditions.
Finally, the dataset was divided into training, validation, and testing sets in an 8:1:1 ratio, with the data distribution summarized in Table 1. No data augmentation techniques were applied, as the dataset contained a sufficient number of high-quality samples per class.

2.2. Vegetation Index Selection

Vegetation indices are quantitative indicators derived from remote sensing imagery, widely utilized to characterize the growth status and physiological attributes of surface vegetation. These indices are typically computed by linearly or non-linearly combining reflectance values from multiple spectral bands, serving as a compact semantic representation of spectral information [33]. In disease identification tasks, vegetation indices provide an effective means of assessing crop health and capturing the physiological changes induced by disease stress [34].
The spectral characteristics of plants are influenced by the chlorophyll content, cellular structure, and water status [35]. Red and blue light absorption is primarily controlled by chlorophyll, while near-infrared (NIR) reflectance depends on the integrity of the cellular structure. Disease infection can induce symptoms such as leaf yellowing, necrosis, spotting, or wilting, leading to a diminished chlorophyll content, cellular damage, and water loss. Consequently, diseased plants exhibit increased red and blue light reflectance, decreased NIR reflectance, and altered spectral features in the green and red-edge bands [36]. These spectral changes can be quantitatively characterized by vegetation indices, which serve as critical features for identifying wheat disease areas. By computing appropriate vegetation indices from multispectral data, the detection accuracy of disease stress signals can be significantly enhanced [37].
Based on these principles, 20 vegetation indices with high sensitivity to wheat health and disease variations were selected and incorporated into the model as features derived from multispectral remote sensing data. Table 2 presents the calculation formulas of various vegetation indices and outlines their relevance in disease monitoring, providing essential feature support for subsequent classification tasks.

2.3. The Proposed MSFNet

To effectively integrate RGB and multispectral features and enhance hierarchical spectral semantic perception, a novel MSFNet is proposed and tailored for wheat disease regional classification. As illustrated in Figure 3, the input image is divided into two branches, namely, RGB and multispectral vegetation indices (VIs), which are processed by the multi-source fusion module (MSFM) (as detailed in Section 2.3.1). The fused features are then passed into a feature extraction network, which is constructed by stacking residual blocks. Subsequently, inspired by the pyramid structure, the feature layers at different levels of the extraction network are independently fed into the hierarchical spectral semantic fusion module (HSSFM) (as detailed in Section 2.3.2) to integrate spectral semantic information from different hierarchical levels during the feature extraction process. Finally, the fused spectral semantic information is then used as classification features and fed into a classifier for the identification of wheat disease regions.

2.3.1. Multi-Source Fusion Module

In the task of the regional classification of wheat diseases, reliance solely on RGB imagery fails to capture sufficiently discriminative features. Traditional multi-source data fusion methods in regional classification predominantly employ direct data concatenation or statistical feature selection strategies, which lack the deep modeling of multi-source features and fail to fully exploit the inherent advantages of multi-source data. To overcome these limitations, a novel feature fusion module—the multi-source fusion module (MSFM)—was proposed. The MSFM separates RGB data and multispectral vegetation indices (MS-VIs) into two parallel branches, aiming to enhance the spatial semantics and spectral semantics independently. The enhanced deep features from both branches are then fused to more effectively capture the complementary information of multi-source data, thereby improving the accuracy of disease regional classification.
As shown in Figure 4, the MSFM consists of a spatial semantic enhancement module and a spectral semantic enhancement module. In the spatial branch, the input RGB image is processed using a spatial attention mechanism (SAM) that adaptively highlights features corresponding to disease-affected regions. Specifically, the branch applies max pooling and average pooling along the channel dimension to capture key spatial features. The pooled features are concatenated and passed through a convolutional block with a kernel size of 7, which expands the receptive field and enhances local feature extraction. Subsequently, the output undergoes a sigmoid activation function to generate a spatial attention weight map W r , representing the relative importance of different regions in the input image, as shown in Equation (1). Finally, W r is element-wise multiplied with the original RGB features to generate a spatially enhanced feature map. This enhanced map effectively accentuates disease-induced color variations (e.g., leaf yellowing) and texture changes (e.g., necrosis and tissue degradation), thereby improving the model’s focus on affected regions and enhancing the robustness of disease region classification.
The multispectral vegetation index (MS-VI) images are processed by the spectral semantic enhancement module, designed to refine the representation of spectral response variations induced by disease stress. Initially, the input MS-VI images undergo a 1 × 1 convolution to extract intricate feature relationships between spectral bands and vegetation indices. The resulting feature maps are then subjected to global max pooling and global average pooling. Specifically, global max pooling captures the most prominent spectral responses across channels, generating a salient spectral feature vector that emphasizes critical spectral variations associated with disease stress. In contrast, global average pooling captures the mean spectral response per channel, forming a global spectral descriptor that reflects the overall distribution pattern. These pooled vectors are then passed through a hierarchical linear transformation module (Equation (2)) to extract discriminative spectral semantics. Specifically, Linear 1 projects the input into a latent space to highlight key spectral variations, while the interaction term X i n p u t Linear 1 ( X i n p u t ) models inter-channel dependencies and selectively emphasizes disease-relevant features. Linear 2 further abstracts these representations, enhancing the model’s sensitivity to subtle spectral cues induced by disease stress. The transformed feature vector is broadcasted and multiplied with the original feature maps along the channel dimension, yielding the final spectral semantic-enhanced features.
W r = C A C F = sigmoid MLP MaxPool C F + AvgPool C F
F o u t = Linear 1 ( X i n p u t ) + Linear 2 ( X i n p u t Linear 1 ( X i n p u t ) )
where X i n p u t denotes the input spectral feature map, F o u t represents the output feature map after enhancement, ⊙ indicates element-wise multiplication, and Linear 1 and Linear 2 refer to two independent fully connected layers.
Finally, these enhanced spectral features are concatenated with the spatial semantic-enhanced features along the channel dimension, forming a comprehensive multi-source feature representation that is subsequently fed into the feature extraction network for further processing.

2.3.2. Hierarchical Spectral Semantic Fusion Module

The limited spectral resolution of multispectral images poses a significant challenge in capturing the fine-grained spectral variations induced by plant diseases, thereby constraining the model’s discriminative capacity in disease region identification. Existing methods typically rely on the final feature layer of deep networks for classification, leveraging high-level spectral semantics and spatial features. However, relying solely on high-level features lacks the support of low-level spectral details, which are crucial for preserving subtle spectral variations within diseased regions. Spectral features at different levels encode a progressive transition from local details to global semantics, and utilizing only a single-level representation fails to fully exploit the hierarchical spectral information, ultimately constraining the accuracy of disease region classification.
To address this issue, a novel hierarchical spectral semantic fusion module was proposed (as shown in Figure 5), employing a pyramid architecture with an attention mechanism to effectively integrate spectral semantic information across different feature levels, thereby enhancing the model’s perception of hierarchical spectral semantics. As illustrated in Figure 4, the feature maps extracted by different ResBlocks in MSFNet form a pyramid structure, where each scale-specific feature map represents a distinct level within the hierarchical pyramid. To enhance the discriminative capability of key spectral–spatial features, the extracted multi-level feature maps are first processed by the Convolutional Block Attention Module (CBAM), which strengthens feature representation through channel and spatial attention mechanisms. The attention-refined features are propagated along two paths: one path continues bottom-up feature extraction by being fused with the next ResBlock output, thereby constructing the hierarchical pyramid structure, while the other undergoes global average pooling to generate a spectral feature vector at that level. These vectors from different levels are then concatenated to integrate spectral information across multiple layers. The final fused feature vector effectively aggregates hierarchical spectral semantics, providing a richer spectral representation for disease region classification.
As depicted in Figure 6, the CBAM consists of sequential channel and spatial attention mechanisms. The channel attention mechanism employs an excitation/compression strategy to enhance the focus on key spectral features, while spatial attention adaptively assigns weights to different spatial positions to highlight disease-related regions. Given input feature maps for channel and spatial attention denoted as C F and S F , the channel attention weighting formulation is shown in Equation (1), and the spatial attention computation is shown in Equation (3). By incorporating the CBAM, the discriminative power of spectral–spatial features is significantly enhanced.
S A S F = s i g m o d C o v 7 × 7 M a x P o o l S F + A v g P o o l S F

3. Results

3.1. The Experiment Settings

As shown in Table 3, experiments were performed on a cloud server equipped with an RTX 3080 Ti GPU, which included 12 GB of graphic memory, operating on an Ubuntu 20.04 LTS 64-bit system. The programming environment was set up using Python 3.8, alongside CUDA version 11.3 to support GPU acceleration. Furthermore, the model was implemented using the PyTorch deep learning framework, specifically version 1.10.0.
The training strategy employed in this study involved training the model from scratch without using pre-trained weights. A dropout layer was applied in the classifier to enhance generalization. Several dropout rates (0.1, 0.2, and 0.3), initial learning rates (e.g., 0.001 and 0.0005), and learning rate decay schedules were evaluated using a 5-fold cross-validation. The best-performing combination (with a dropout rate of 0.2, an initial learning rate of 0.001, and a step decay factor of 0.1 every 30 epochs) was selected based on the average validation accuracy across folds. The final model was trained for 150 epochs with a batch size of 16 using the selected settings. The Adam optimizer was adopted for parameter updates with its default parameters ( β 1 = 0.9 and β 2 = 0.999 ), which have demonstrated stable performance across a wide range of deep learning tasks and were found effective in our setup. Furthermore, the cross-entropy loss was used as the objective function. The final model was selected based on the highest accuracy achieved on the validation set.

3.2. Evaluation Metrics

In order to comprehensively and objectively evaluate the performance of MSFNet, four indicators, namely, accuracy, precision, recall, and F1-score, are selected for model evaluation. The specific calculation formulas are shown in Formulas (4)–(7).
Accuracy measures the proportion of correctly classified samples, reflecting overall model performance. Precision represents the ratio of correctly predicted positives to all predicted positives, indicating the reliability of positive predictions. Recall (sensitivity) quantifies the proportion of correctly predicted positives among all actual positives, highlighting the model’s ability to identify positive instances. Additionally, the F1-score, as the harmonic mean of precision and recall, offers a balanced evaluation, especially in imbalanced datasets.
A c c u r a c y = T P + T N T N + T P + F N + F P × 100 %
P r e c i s i o n = T P T P + F P × 100 %
R e c a l l = T P T P + F N × 100 %
F 1 - s c o r e = 2 · P r e c i s i o n · R e c a l l P r e c i s i o n + R e c a l l × 100 %
where TP denotes the number of positive samples correctly predicted by the model, TN denotes the number of negative samples correctly predicted, FN represents the number of negative samples incorrectly predicted as positive, and FP indicates the number of positive samples incorrectly predicted as negative.

3.3. Analysis of Prediction Results of MSFNet

To comprehensively assess the model’s performance, we computed the accuracy, precision, recall, and F1-score of each category, as well as the overall classification results. Additionally, PR curves were plotted for each class, and a confusion matrix was generated to provide deeper insights into the model’s classification behavior. The PR curves illustrate the balance between precision and recall across varying decision thresholds, while the confusion matrix offers a detailed analysis of misclassifications, highlighting both the model’s strengths and areas for improvement. These evaluations serve as a crucial basis for the further refinement and optimization of the model.
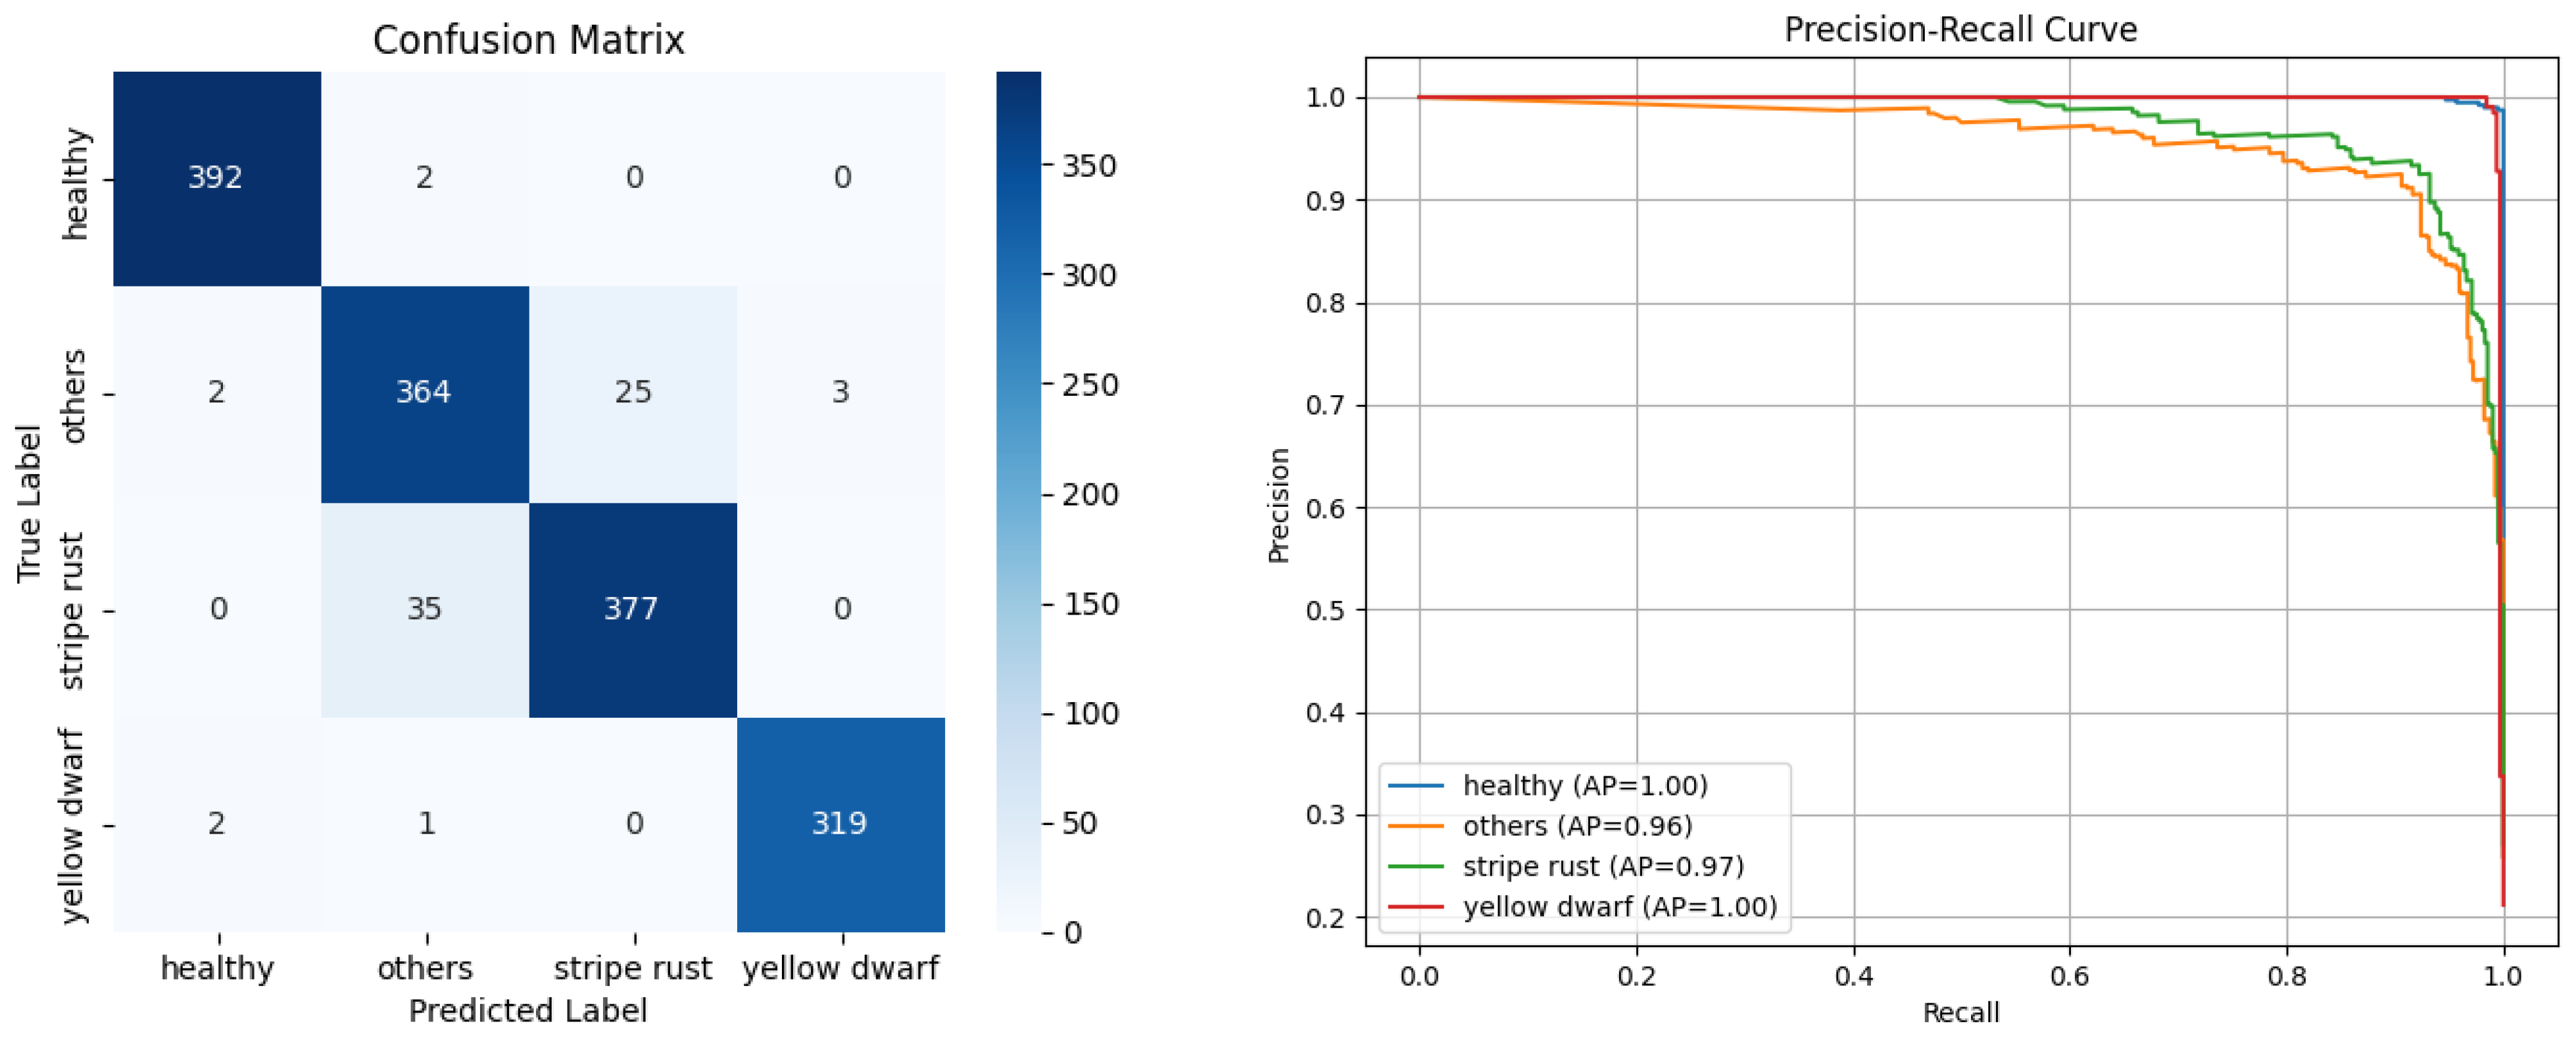
As shown in Table 4, all classification metrics exceed 90% across categories. However, the accuracy for others and stripe rust is relatively lower, at 92.4% and 91.5%, respectively. The confusion matrix (Figure 7) indicates a pronounced misclassification between these two categories, with 35 others samples misclassified as stripe rust, and 25 stripe rust samples misclassified as others. The others category encompasses diverse regions, including soil, buildings, and low-density weed areas, some of which—such as shadowed soil or sparsely vegetated backgrounds—may exhibit texture and spectral characteristics similar to the canopy of wheat stripe rust regions, thereby increasing the difficulty of accurate discrimination. This feature overlap is likely a key factor contributing to misclassification and highlights a potential direction for improving the model’s discriminative capability in future research. Furthermore, Figure 7 presents the P-R curves for each category, where all AP values exceed 0.95, indicating that the model maintains a good balance between precision and recall, ensuring the robustness of the detection results. Notably, the AP values for healthy and yellow dwarf reach 1.0, demonstrating the model’s exceptional discriminative ability for these categories and further validating its superior classification performance.

3.4. Comparison with SOTA Methods

To further assess the effectiveness of the proposed method, we conducted comparative experiments on MSWDD2024 using various state-of-the-art (SOTA) image classification models, including Transformer-based models (Vision Transformer [38] and Swin Transformer [39]) and CNN-based models (MobileNetV3-s [40], ShuffleNetV2 [41], SENet [42], ResNet [5], ResNeXt [43], and EfficientNetV2 [44]). All inference speed (FPS) measurements were conducted on the same hardware platform described in Section 3.1 to ensure consistency. As shown in Table 5, the proposed MSF-ResNet outperformed all baseline models across all evaluation metrics, demonstrating its superior performance and validating its effectiveness in wheat disease region classification.
Among the baseline models, the Transformer-based models (e.g., ViT and Swin Transformer) achieve lower accuracy, possibly due to their lack of explicit channel modeling and reliance on larger input sizes, which may limit their ability to capture fine-grained spectral–spatial patterns in small 64 × 64 patches. Among the CNN-based baseline models, SENet achieves the best performance, with an accuracy of 91.5%, primarily due to its channel attention mechanism, which effectively enhances the model’s ability to focus on discriminative spectral features. EfficientNetV2 also demonstrates strong classification performance (90.1%), benefiting from its compound scaling strategy, which strikes a balance between network depth, width, and resolution. Traditional ResNet models, while stable, slightly lag behind the aforementioned models, with ResNet18, ResNet50, and ResNet101 achieving accuracies of 89.4%, 88.7%, and 89.2%, respectively. Although deeper networks, such as ResNet101, extract richer feature representations, the improvement is marginal, likely due to the increased model complexity failing to effectively integrate refined spectral–spatial feature expressions, thus limiting performance gains.
Notably, the proposed MSFNet significantly outperforms all baseline models across all evaluation metrics, achieving the best performance, with an accuracy of 95.7%, a precision of 96.4%, a recall of 95.2%, and an F1-score of 95.8%. Moreover, MSFNet achieves a high inference speed of 62.18 FPS, which is only slightly lower than that of the fastest baseline ResNet18 (79.54 FPS) and significantly higher than that of most other models, including Transformer-based architectures. In addition, MSFNet contains only 14.2 M parameters, indicating lower memory and storage demands than the other methods. These results demonstrate that MSFNet not only delivers superior accuracy but also meets the computational and memory constraints required for real-time UAV deployment.
The superior performance of MSFNet is primarily attributed to its efficient data fusion strategy and multi-level spectral feature extraction mechanism. Specifically, the MSFM effectively uncovers complementary features between RGB and MS-VIs, enhancing the synergy of multi-source information and improving the effectiveness of data fusion. The HSSFM further integrates hierarchical spectral semantic information, overcoming the limitations of single-level feature extraction, while the attention mechanism optimizes feature representation, enhancing the model’s ability to discriminate disease regions. Overall, MSFNet excels in wheat disease region classification by deeply integrating multi-source data and hierarchical feature extraction, fully exploiting the potential of spectral information, and demonstrating exceptional robustness and generalization capabilities.

3.5. Ablative Experiments

The above comparative experiments demonstrate the superior performance of our proposed method. To further analyze the contribution of different data sources and validate the effectiveness of key components, we conducted an ablation experiment by selecting different data source combinations, the MSFM, and the HSSFM as ablation components.
As shown in Table 6, the experimental results indicate that using only RGB or MS-VIs as input leads to suboptimal performance across all evaluation metrics. This suggests that a single data source fails to provide sufficient feature representation, thereby limiting the model’s classification capability. When RGB and MS-VIs are combined, accuracy improves by 6.7% and 9.0% compared to using RGB or MS-VIs alone, respectively, while precision increases by 7.2% and 12.5%. These findings highlight the complementary nature of RGB and MS-VIs, demonstrating that multi-source data fusion significantly enhances regional classification accuracy.
Building upon multi-source data fusion, we further evaluate the impact of different modules. When the MSFM is incorporated, model performance improves considerably, with precision and recall increasing by 4.7% compared to the baseline model. This indicates that the MSFM effectively captures complementary spatial–spectral information and key features, thereby enhancing multi-source feature fusion. Furthermore, when the HSSFM is introduced, accuracy and precision improve by 4.8% and 4.7%, respectively, compared to the baseline, demonstrating that the HSSFM efficiently extracts and integrates multi-level spectral features, outperforming models that rely solely on single-level features.
Ultimately, when both the MSFM and HSSFM are integrated, the model achieves the highest performance across all evaluation metrics, surpassing both the baseline and single-module configurations. Specifically, accuracy and precision increase by 6.0%, further validating the effectiveness of the MSFM and HSSFM in multi-source data fusion and hierarchical spectral feature extraction.

3.6. The Detection Results of the Different Methods

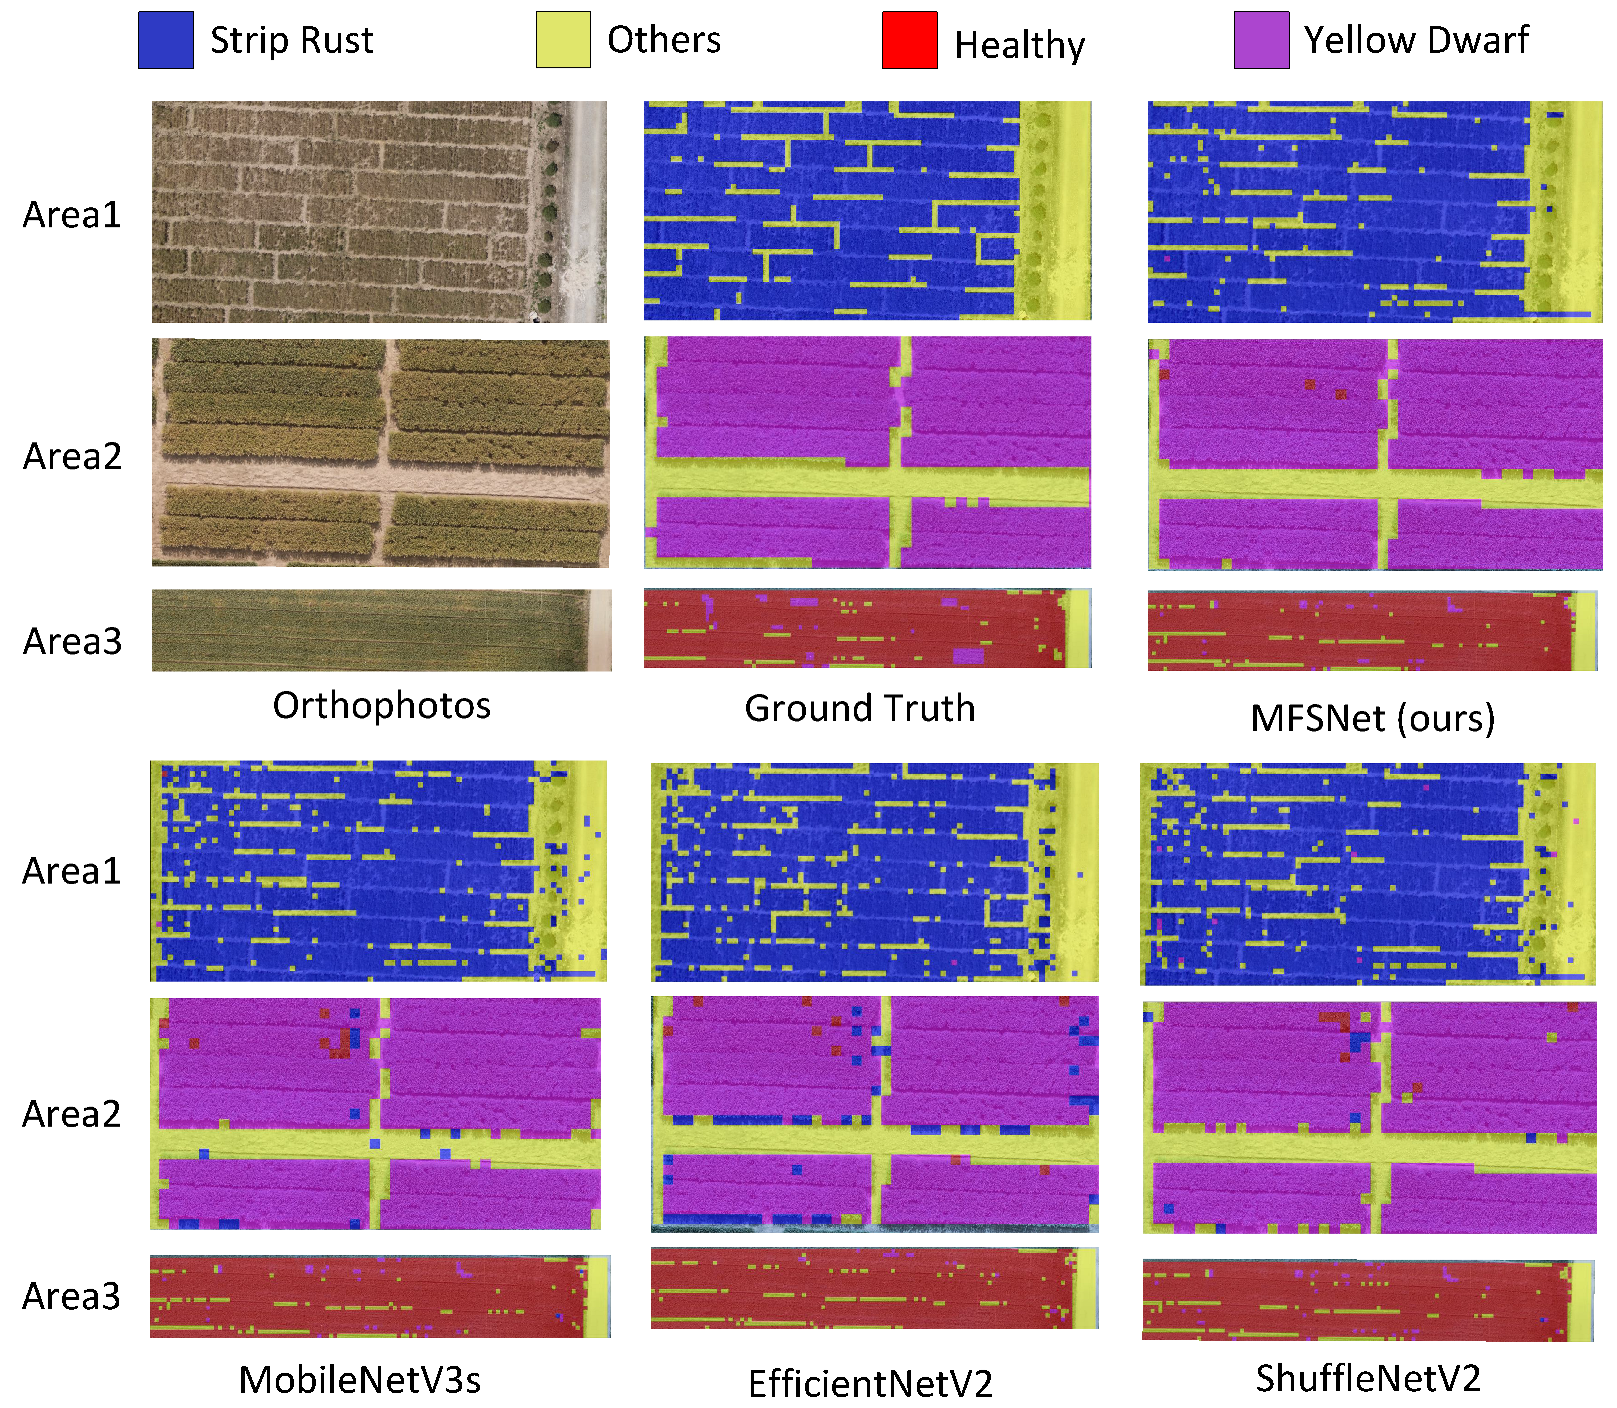
To better evaluate the model’s performance, three test regions were selected from the orthorectified imagery, and the recognition results of different models in these regions were post-processed for visualization, as shown in Figure 8.
Among them, Area 1 primarily consists of stripe rust, Area 2 is dominated by yellow dwarf disease, and Area 3 mainly contains healthy vegetation, with some regions affected by yellow dwarf disease. The results demonstrate that MSFNet achieves high recognition accuracy across all regions, with only a few misclassifications. In contrast, ShuffleNetV2 exhibits significant mutual misclassification between stripe rust and yellow dwarf disease in Area 1, while EfficientNetV2 erroneously classifies roadside trees as stripe rust in the same region. Moreover, MobileNetV3 suffers from both types of misclassification. Additionally, ShuffleNetV2, EfficientNetV2, and MobileNetV3 frequently misidentify wheat field shadows along the edges of Area 2 as disease-affected regions.
These misclassifications can be primarily attributed to the spatial similarity between different categories. For instance, wheat shadows share similar texture patterns with stripe rust and yellow dwarf disease. However, the comparative models have limited capabilities in capturing spectral variations, making them more susceptible to interference from spatially similar features, leading to misclassification. In contrast, MSFNet effectively integrates spatial and spectral information, enabling it to distinguish regions with similar spatial features but distinct spectral characteristics. This further validates the superiority of MSFNet in wheat disease detection.

3.7. Validation of the Effectiveness of the Proposed MSFM

To validate the effectiveness of the proposed MSFM in multi-source feature fusion and to assess its generalization across different network architectures, we designed and conducted a comparative experiment. Specifically, we selected several state-of-the-art deep learning models, including ShuffleNetV2, ResNeXt, MobileNetV3-s, SENet, ResNet50, and ResNet101. Each model was evaluated using two fusion strategies, namely, direct data concatenation (data fusion) and MSFM-based feature fusion, to analyze their impact on classification performance.
As shown in Table 7, the MSFM consistently improved classification performance across different network architectures, achieving a higher accuracy, precision, recall, and F1-score than conventional data fusion methods. This demonstrates that the MSFM effectively captures complementary features from multi-source data and optimizes feature fusion strategies, thereby enhancing the model’s discriminative capability. Notably, for deeper networks such as ResNeXt, ResNet50, and ResNet101, the MSFM achieved substantial performance gains, improving accuracy by 3.9%, 4.3%, and 3.4%, respectively. These results indicate that, in the context of this study, feature-level fusion outperforms direct data concatenation by better leveraging complementary information from multi-source inputs, ultimately enhancing the model’s ability to identify diseased regions.

3.8. Validation of the Effectiveness of the Proposed HSSFM

The previous ablation experiment demonstrated the advantage of the HSSFM in integrating hierarchical spectral semantic information. To further evaluate the effectiveness and generalization capability of hierarchical spectral semantic modeling for the classification of the HSSFM, we conducted comparative experiments on several state-of-the-art deep learning models, including ResNeXt, MobileNetV3-s, SENet, ResNet50, and ResNet101. The use of a single-level feature refers to directly utilizing the final feature layer of different models for classification after pooling or flattening. In contrast, a hierarchical feature extracts multi-scale feature layers from the model and employs the HSSFM to integrate hierarchical spectral semantics, generating more discriminative features for classification.
The experimental results (Table 8) demonstrate that the HSSFM effectively enhances classification performance across all network architectures. Compared to methods that rely solely on the final feature layer for classification, the HSSFM integrates multi-scale spectral semantic information, achieving superior performance in terms of accuracy, precision, recall, and F1-score. Notably, in deeper networks such as ResNet50 and ResNet101, the HSSFM improves classification accuracy by 5.1% and 5.0%, respectively. This improvement can be attributed to the more structured hierarchical features in deeper networks, allowing the HSSFM to more effectively capture and integrate multi-scale spectral features, thereby enhancing the model’s discriminative capability.
Overall, this experiment demonstrates the effectiveness and generalization capability of the HSSFM in multi-scale feature fusion. By deeply integrating hierarchical semantic information, the HSSFM enhances the model’s ability to identify diseased regions, further highlighting the significance of hierarchical spectral information in disease classification tasks.

3.9. Influence of Noise on Model Performance

To further evaluate the robustness of the proposed model under noisy conditions, we introduced synthetic noise into the test set images to simulate sensor interference and transmission errors. Two common noise types were considered: Gaussian noise and salt-and-pepper noise. Gaussian noise with a standard deviation of 0.2 was added to both RGB and multispectral channels to simulate random sensor disturbances. In addition, salt-and-pepper noise was introduced at a density of 0.1 to mimic image corruption caused by bit errors or hardware faults.
After generating the noisy dataset, we evaluated both the baseline ResNet50 and the proposed MSFNet models on the same set. As shown in Table 9, MSFNet outperformed ResNet50 across all categories in terms of classification accuracy, with all metrics exceeding 94%.
Furthermore, when comparing the results to those obtained on the clean test set (see Table 9), we observed that ResNet50 experienced a notable performance drop, with precision and recall decreasing by 2.5% and 3.4%, respectively. In contrast, MSFNet showed much smaller performance degradation under noise, with all metric drops remaining within 1%. These results demonstrate that MSFNet maintains high classification accuracy even in the presence of noise, indicating its strong robustness and practical applicability in real-world scenarios with imperfect imaging conditions.

3.10. Cross-Region Evaluation of Model Generalization

To further evaluate the generalization capability of MSFNet under different geographic conditions, we conducted a cross-region test using images collected from a wheat field located in a different area to the training sets. The additional dataset was collected from the Experimental Base of the Shaanxi Hybrid Rapeseed Research Center (as shown in Figure 9), which is geographically distinct from the area used for the original MSWDD2024 dataset. The collection and processing process of the data is consistent with that described in Section 2.1.
As shown in Table 10, MSFNet continued to exhibit excellent performance on the new test set collected from different fields. Specifically, the overall accuracy, precision, recall, and F1-score reached 94.7%, 94.6%, 95.0%, and 94.7%, respectively. Among the four classes, the model performed best on the healthy and stripe rust categories, with both exceeding 97% in all evaluation metrics. The remaining categories also maintained metrics above 90%, demonstrating the model’s strong robustness and generalization capability across different geographic conditions.
Compared to the results obtained on the test set from the original field (as shown in Table 5), the performance drop was marginal—most metrics decreased by less than 1%. These results suggest that MSFNet maintains a reliable prediction accuracy even when applied to regions beyond the training domain, confirming its potential for practical deployment in varied agricultural environments.

4. Discussion

The strong performance of MSFNet can be attributed to its architecture, which was specifically designed for multi-source fusion and hierarchical spectral feature modeling. Unlike traditional CNN- or Transformer-based approaches that process single-modality inputs, MSFNet adopts a dual-branch structure to jointly leverage RGB and MS-VI data. Within the MSFM, the spatial semantic enhancement branch captures detailed texture and structural patterns from RGB images, while the spectral enhancement branch focuses on the physiological variations captured by MS-VIs. In addition, the proposed HSSFM incorporates a pyramid structure and attention mechanism to integrate spectral semantics across multiple levels. This design enhances the model’s ability to capture fine-grained, scale-aware spectral variations, contributing to more accurate disease localization and classification.
Compared to existing methods, MSFNet exhibits significant advantages in all metrics. RGB-based models are prone to background interference due to the absence of spectral information, whereas MS-VI-based models, despite their spectral sensitivity, lack a sufficient spatial resolution to effectively capture structural details. By combining both modalities, MSFNet strikes an effective balance between spatial detail and spectral sensitivity. In particular, the introduction of the HSSFM enables deeper spectral reasoning across scales, a capability rarely addressed in previous works.
Despite its promising performance, the model has several limitations. First, all samples used in this study were collected during disease stages with visible symptoms, and the dataset lacks early-stage samples in which wheat plants exhibit no apparent signs of infection. This may hinder the model’s effectiveness in early disease detection, which is crucial for timely intervention in real-world agricultural scenarios. Additionally, the current model supports only the diagnosis of stripe rust and yellow dwarf diseases, along with the classification of healthy wheat and background regions. The number of supported disease categories remains narrow.
In future work, we aim to extend the model’s capability to recognize a broader range of wheat diseases and improve its diagnostic accuracy during the early stages of infection. We will also focus on enhancing the model’s robustness and generalization across various disease types, growth stages, and regional environments.

5. Conclusions

This paper proposes MSFNet, an ultra-efficient model tailored for the precise diagnosis of wheat disease-affected regions. Given the scarcity of publicly available remote sensing datasets for wheat disease regional classification, this study leverages a multispectral UAV platform to acquire both RGB and multispectral images of wheat canopies, constructing a high-quality multispectral wheat disease dataset named MSWDD2024. To effectively integrate multimodal data, a dual-branch multi-source fusion module is designed, incorporating a parallel spatial–spectral semantic enhancement branch to deeply extract spatial texture features from RGB images and spectral response characteristics from MS-VI images, thereby fully utilizing the complementary information of multi-source data. Furthermore, to enhance the model’s capability in perceiving spectral information at different levels, a novel hierarchical spectral semantic fusion module is proposed. By integrating attention mechanisms and a pyramid structure, this module effectively fuses spectral semantics across multiple levels, expanding the receptive field and improving spectral feature extraction. Experimental results on the MSWDD2024 dataset demonstrate that MSFNet achieves state-of-the-art performance, attaining an accuracy of 95.4%, a precision of 95.6%, a recall of 95.6%, and an F1-score of 95.6%. Notably, MSFNet outperforms single-source RGB-based methods by 12.7% in accuracy and 13.0% in precision, surpasses MS-VI-based models by 15.0% in accuracy and 18.3% in precision, and exceeds the ResNet18 baseline by 6.0% in accuracy, highlighting its robust multi-source fusion capabilities. These results strongly validate the effectiveness of MSFNet in wheat disease regional diagnosis, providing technical support for precision agriculture disease monitoring. Moreover, to extend the applicability of this approach to disease diagnosis in other crops and to enhance the generalizability of remote sensing-based plant disease detection, future research will focus on improving the model’s generalization ability and mitigating the noise caused by spectral and spatial variations across different plant species.

Author Contributions

Conceptualization, W.J.; Data curation, Z.G.; Formal analysis, W.J.; Funding acquisition, B.L.; Methodology, W.J.; Project administration, H.Z. and B.L.; Supervision, H.Z.; Validation, W.Z.; Visualization, W.J.; Writing—original draft, W.J., Z.G. and W.Z.; Writing—review and editing, H.Z. and B.L. All authors have read and agreed to the published version of the manuscript.

Funding

The APC was funded by the National Natural Science Foundation of China (No.62376226), the National Natural Science Foundation of China Youth Project (No.62406254), Shaanxi’s Key Research and Development Program (No. 2024NC-YBXM-191), Shaanxi’s Key Research and Development Program (No. 2024NC-ZDCYL-05-05), Shaanxi’s Key Research and Development Program (No. 2023-ZDLNY-63), Xianyang’s Key Research and Development Program (No. L2022-ZDYF-NY-019), the Technology Innovation Leading Program of Shaanxi (No. 2024QCY-KXJ-094), Xi’an Key Technology Research Projects for Key Agricultural Industry Chains (No. 2024JH-NYZD-0027), and the Chinese College Students’ Innovative Entrepreneurial Training Plan Program (No. 202410712188).

Institutional Review Board Statement

Not applicable.

Informed Consent Statement

Not applicable.

Data Availability Statement

The data presented in this study are available on request from the corresponding author. The data are not publicly available due to privacy.

Conflicts of Interest

The authors declare that they have no known competing financial interests or personal relationships that could have appeared to influence the work reported in this paper.

References

  1. Zhang, Q.; Men, X.; Hui, C.; Ge, F.; Ouyang, F. Wheat yield losses from pests and pathogens in China. Agric. Ecosyst. Environ. 2022, 326, 107821. [Google Scholar] [CrossRef]
  2. Serrago, R.A.; Carretero, R.; Bancal, M.O.; Miralles, D.J. Grain weight response to foliar diseases control in wheat (Triticum aestivum L.). Field Crop. Res. 2011, 120, 352–359. [Google Scholar] [CrossRef]
  3. Krizhevsky, A.; Sutskever, I.; Hinton, G.E. Imagenet classification with deep convolutional neural networks. Adv. Neural Inf. Process. Syst. 2017, 60, 84–90. [Google Scholar] [CrossRef]
  4. Szegedy, C.; Liu, W.; Jia, Y.; Sermanet, P.; Reed, S.; Anguelov, D.; Erhan, D.; Vanhoucke, V.; Rabinovich, A. Going deeper with convolutions. In Proceedings of the IEEE Conference on Computer Vision and Pattern Recognition, Boston, MA, USA, 7–12 June 2015; pp. 1–9. [Google Scholar]
  5. He, K.; Zhang, X.; Ren, S.; Sun, J. Deep residual learning for image recognition. In Proceedings of the IEEE conference on computer vision and pattern recognition, Las Vegas, NV, USA, 27–30 June 2016; pp. 770–778. [Google Scholar]
  6. Howard, A.G.; Zhu, M.; Chen, B.; Kalenichenko, D.; Wang, W.; Weyand, T.; Andreetto, M.; Adam, H. MobileNets: Efficient Convolutional Neural Networks for Mobile Vision Applications. arXiv 2017, arXiv:1704.04861. [Google Scholar]
  7. Zhang, X.; Zhou, X.; Lin, M.; Sun, J. Shufflenet: An extremely efficient convolutional neural network for mobile devices. In Proceedings of the IEEE Conference on Computer Vision and Pattern Recognition, Salt Lake City, UT, USA, 18–22 June 2018; pp. 6848–6856. [Google Scholar]
  8. Mitra, A.; Vangipuram, S.L.T.; Bapatla, A.K.; Bathalapalli, V.K.V.V.; Mohanty, S.P.; Kougianos, E.; Ray, C. Everything You wanted to Know about Smart Agriculture. arXiv 2022, arXiv:2201.04754. [Google Scholar]
  9. Goyal, L.; Sharma, C.M.; Singh, A.; Singh, P.K. Leaf and spike wheat disease detection & classification using an improved deep convolutional architecture. Inform. Med. Unlocked 2021, 25, 100642. [Google Scholar] [CrossRef]
  10. Nachtigall, L.G.; Araujo, R.M.; Nachtigall, G.R. Classification of Apple Tree Disorders Using Convolutional Neural Networks. In Proceedings of the 2016 IEEE 28th International Conference on Tools with Artificial Intelligence, San Jose, CA, USA, 6–8 November 2016; pp. 472–476. [Google Scholar] [CrossRef]
  11. Shoaib, M.; Shah, B.; Ei-Sappagh, S.; Ali, A.; Ullah, A.; Alenezi, F.; Gechev, T.; Hussain, T.; Ali, F. An advanced deep learning models-based plant disease detection: A review of recent research. Front. Plant Sci. 2023, 14, 1158933. [Google Scholar] [CrossRef]
  12. Sun, H.; Xu, H.; Liu, B.; He, D.; He, J.; Zhang, H.; Geng, N. MEAN-SSD: A novel real-time detector for apple leaf diseases using improved light-weight convolutional neural networks. Comput. Electron. Agric. 2021, 189, 106379. [Google Scholar] [CrossRef]
  13. Qi, J.; Liu, X.; Liu, K.; Xu, F.; Guo, H.; Tian, X.; Li, M.; Bao, Z.; Li, Y. An improved YOLOv5 model based on visual attention mechanism: Application to recognition of tomato virus disease. Comput. Electron. Agric. 2022, 194, 106780. [Google Scholar] [CrossRef]
  14. Tsouros, D.C.; Bibi, S.; Sarigiannidis, P.G. A Review on UAV-Based Applications for Precision Agriculture. Information 2019, 10, 349. [Google Scholar] [CrossRef]
  15. Velusamy, P.; Rajendran, S.; Mahendran, R.K.; Naseer, S.; Shafiq, M.; Choi, J.G. Unmanned Aerial Vehicles in Precision Agriculture: Applications and Challenges. Energies 2022, 15, 217. [Google Scholar] [CrossRef]
  16. Feng, A.; Zhou, J.; Vories, E.D.; Sudduth, K.A.; Zhang, M. Yield estimation in cotton using UAV-based multi-sensor imagery. Biosyst. Eng. 2020, 193, 101–114. [Google Scholar] [CrossRef]
  17. Fu, Z.; Jiang, J.; Gao, Y.; Krienke, B.; Wang, M.; Zhong, K.; Cao, Q.; Tian, Y.; Zhu, Y.; Cao, W.; et al. Wheat Growth Monitoring and Yield Estimation based on Multi-Rotor Unmanned Aerial Vehicle. Remote Sens. 2020, 12, 508. [Google Scholar] [CrossRef]
  18. Yang, Q.; Shi, L.; Han, J.; Zha, Y.; Zhu, P. Deep convolutional neural networks for rice grain yield estimation at the ripening stage using UAV-based remotely sensed images. Field Crop. Res. 2019, 235, 142–153. [Google Scholar] [CrossRef]
  19. Yubin, L.; Xiaoling, D.; Guoliang, Z. Advances in diagnosis of crop diseases, pests and weeds by UAV remote sensing. Smart Agric. 2019, 1, 1. [Google Scholar] [CrossRef]
  20. Shahi, T.B.; Xu, C.Y.; Neupane, A.; Guo, W. Recent Advances in Crop Disease Detection Using UAV and Deep Learning Techniques. Remote Sens. 2023, 15, 2450. [Google Scholar] [CrossRef]
  21. Kouadio, L.; El Jarroudi, M.; Belabess, Z.; Laasli, S.E.; Roni, M.Z.K.; Amine, I.D.I.; Mokhtari, N.; Mokrini, F.; Junk, J.; Lahlali, R. A Review on UAV-Based Applications for Plant Disease Detection and Monitoring. Remote Sens. 2023, 15, 4273. [Google Scholar] [CrossRef]
  22. Zhang, H.; Wang, L.; Tian, T.; Yin, J. A review of unmanned aerial vehicle low-altitude remote sensing (UAV-LARS) use in agricultural monitoring in China. Remote Sens. 2021, 13, 1221. [Google Scholar] [CrossRef]
  23. Lee, C.J.; Yang, M.D.; Tseng, H.H.; Hsu, Y.C.; Sung, Y.; Chen, W.L. Single-plant broccoli growth monitoring using deep learning with UAV imagery. Comput. Electron. Agric. 2023, 207, 107739. [Google Scholar] [CrossRef]
  24. Zhao, J.; Zhang, X.; Gao, C.; Qiu, X.; Tian, Y.; Zhu, Y.; Cao, W. Rapid Mosaicking of Unmanned Aerial Vehicle (UAV) Images for Crop Growth Monitoring Using the SIFT Algorithm. Remote Sens. 2019, 11, 1226. [Google Scholar] [CrossRef]
  25. Fernández, C.I.; Leblon, B.; Haddadi, A.; Wang, K.; Wang, J. Potato Late Blight Detection at the Leaf and Canopy Levels Based in the Red and Red-Edge Spectral Regions. Remote Sens. 2020, 12, 1292. [Google Scholar] [CrossRef]
  26. Golhani, K.; Balasundram, S.K.; Vadamalai, G.; Pradhan, B. Selection of a spectral index for detection of orange spotting disease in oil palm (Elaeis guineensis Jacq.) using red edge and neural network techniques. J. Indian Soc. Remote Sens. 2019, 47, 639–646. [Google Scholar] [CrossRef]
  27. Moghadam, P.; Ward, D.; Goan, E.; Jayawardena, S.; Sikka, P.; Hernandez, E. Plant disease detection using hyperspectral imaging. In Proceedings of the 2017 International Conference on Digital Image Computing: Techniques and Applications, Sydney, Australia, 29 November–1 December 2017; pp. 1–8. [Google Scholar] [CrossRef]
  28. Neupane, K.; Baysal-Gurel, F. Automatic Identification and Monitoring of Plant Diseases Using Unmanned Aerial Vehicles: A Review. Remote Sens. 2021, 13, 3841. [Google Scholar] [CrossRef]
  29. Duarte, A.; Borralho, N.; Cabral, P.; Caetano, M. Recent Advances in Forest Insect Pests and Diseases Monitoring Using UAV-Based Data: A Systematic Review. Forests 2022, 13, 911. [Google Scholar] [CrossRef]
  30. Li, H.; Tan, B.; Sun, L.; Liu, H.; Zhang, H.; Liu, B. Multi-Source Image Fusion Based Regional Classification Method for Apple Diseases and Pests. Appl. Sci. 2024, 14, 7695. [Google Scholar] [CrossRef]
  31. Hao, X.; Wang, Z.; Zhang, Y.; Li, F.; Wang, M.; Li, J.; Mao, R. Detecting wheat yellow dwarf disease by employing a Dual-Branch multiscale model from UAV multispectral images. Comput. Electron. Agric. 2025, 230, 109898. [Google Scholar] [CrossRef]
  32. De Silva, M.; Brown, D. Multispectral Plant Disease Detection with Vision Transformer–Convolutional Neural Network Hybrid Approaches. Sensors 2023, 23, 8531. [Google Scholar] [CrossRef]
  33. Xue, J.; Su, B. Significant remote sensing vegetation indices: A review of developments and applications. J. Sens. 2017, 2017, 1353691. [Google Scholar] [CrossRef]
  34. Meena, S.V.; Dhaka, V.S.; Sinwar, D. Exploring the role of Vegetation indices in Plant diseases Identification. In Proceedings of the 2020 Sixth International Conference on Parallel, Distributed and Grid Computing, Waknaghat, India, 6–8 November 2020; pp. 372–377. [Google Scholar] [CrossRef]
  35. Sims, D.A.; Gamon, J.A. Estimation of vegetation water content and photosynthetic tissue area from spectral reflectance: A comparison of indices based on liquid water and chlorophyll absorption features. Remote Sens. Environ. 2003, 84, 526–537. [Google Scholar] [CrossRef]
  36. Zahir, S.A.D.M.; Omar, A.F.; Jamlos, M.F.; Azmi, M.A.M.; Muncan, J. A review of visible and near-infrared (Vis-NIR) spectroscopy application in plant stress detection. Sens. Actuators Phys. 2022, 338, 113468. [Google Scholar] [CrossRef]
  37. Berger, K.; Machwitz, M.; Kycko, M.; Kefauver, S.C.; Van Wittenberghe, S.; Gerhards, M.; Verrelst, J.; Atzberger, C.; Van der Tol, C.; Damm, A.; et al. Multi-sensor spectral synergies for crop stress detection and monitoring in the optical domain: A review. Remote Sens. Environ. 2022, 280, 113198. [Google Scholar] [CrossRef] [PubMed]
  38. Dosovitskiy, A.; Beyer, L.; Kolesnikov, A.; Weissenborn, D.; Zhai, X.; Unterthiner, T.; Dehghani, M.; Minderer, M.; Heigold, G.; Gelly, S.; et al. An image is worth 16x16 words: Transformers for image recognition at scale. arXiv 2020, arXiv:2010.11929. [Google Scholar]
  39. Liu, Z.; Lin, Y.; Cao, Y.; Hu, H.; Wei, Y.; Zhang, Z.; Lin, S.; Guo, B. Swin transformer: Hierarchical vision transformer using shifted windows. In Proceedings of the IEEE/CVF International Conference on Computer Vision, Montreal, BC, Canada, 11–17 October 2021; pp. 10012–10022. [Google Scholar]
  40. Howard, A.; Sandler, M.; Chu, G.; Chen, L.C.; Chen, B.; Tan, M.; Wang, W.; Zhu, Y.; Pang, R.; Vasudevan, V.; et al. Searching for mobilenetv3. In Proceedings of the IEEE/CVF International Conference on Computer Vision, Seoul, Republic of Korea, 27 October–2 November 2019; pp. 1314–1324. [Google Scholar]
  41. Ma, N.; Zhang, X.; Zheng, H.T.; Sun, J. Shufflenet v2: Practical guidelines for efficient cnn architecture design. In Proceedings of the European Conference on Computer Vision, Munich, Germany, 8–14 September 2018; pp. 116–131. [Google Scholar]
  42. Hu, J.; Shen, L.; Sun, G. Squeeze-and-excitation networks. In Proceedings of the IEEE Conference on Computer Vision and Pattern Recognition, Salt Lake City, UT, USA, 18–22 June 2018; pp. 7132–7141. [Google Scholar]
  43. Xie, S.; Girshick, R.; Dollár, P.; Tu, Z.; He, K. Aggregated residual transformations for deep neural networks. In Proceedings of the IEEE Conference on Computer Vision and Pattern Recognition, Honolulu, HI, USA, 21–26 July 2017; pp. 1492–1500. [Google Scholar]
  44. Tan, M.; Le, Q. Efficientnetv2: Smaller models and faster training. In Proceedings of the International Conference on Machine Learning, PMLR, Virtual Event, 18–24 July 2021; pp. 10096–10106. [Google Scholar]
Figure 1. Imaging equipment and experimental site.
Applsci 15 07317 g001
Figure 2. The data processing workflow.
Applsci 15 07317 g002
Figure 3. The structure of MSFNet.
Applsci 15 07317 g003
Figure 4. The architecture of the MSFM.
Applsci 15 07317 g004
Figure 5. The framework of the HSSFM.
Applsci 15 07317 g005
Figure 6. The structure of the CBAM.
Applsci 15 07317 g006
Figure 7. The confusion matrix and PR curve of MSFNet.
Applsci 15 07317 g007
Figure 8. Visualization of the prediction results of different methods.
Applsci 15 07317 g008
Figure 9. Wheat field at the Shaanxi Hybrid Rapeseed Research Center.
Applsci 15 07317 g009
Table 1. The distribution of the MSWDD2024 dataset.
DiseasesTrainingValidationTestTotal
Healthy15771981971972
Others15691981971964
Stripe rust16472072062060
Yellow dwarf12881621611611
Table 2. Vegetation indices with corresponding formulas and descriptions.
IndexEquationDescription
NDVI R n i r R r e d R n i r + R r e d Vegetation health index using near-infrared and red reflectance.
TNDVI R n i r R r e d R n i r + R r e d + 0.5 Transformed NDVI, enhancing vegetation measurement sensitivity.
GNDVI R n i r R g r e e n R n i r + R g r e e n Green NDVI, uses green band for enhanced vegetation sensitivity.
RENDVI R r e d e d g e R r e d R r e d e d g e + R r e d Improved NDVI responding better to vegetation change.
MSAVI2 1 2 ( 2 R n i r + 1 ( 2 R n i r + 1 ) 2 8 ( R n i r R r e d ) ) Modified Soil-Adjusted Vegetation Index, reduces soil background effects.
RVI R r e d R b l u e Ratio Vegetation Index, measures vegetation health using NIR and red reflectance ratio.
DVI R n i r R r e d Difference Vegetation Index, calculates vegetation health using NIR and red reflectance.
GDVI R n i r R g r e e n Green Difference Vegetation Index, measures vegetation health using green and NIR reflectance.
GRVI R n i r R g r e e n Ratio of NIR to green reflectance, assessing vegetation condition.
OSAVI R n i r R r e d R n i r + R r e d + 0.16 Optimized Soil-Adjusted Vegetation Index, minimizing soil background impact.
GOSAVI R n i r R g r e e n R n i r + R g r e e n + 0.16 OSAVI variant using green band, adjusting for soil effects.
NDRE R n i r R r e d e d g e R n i r + R r e d e d g e Red-edge band-based index, monitoring chlorophyll content.
SR R n i r R r e d e d g e Simple Ratio, assessing vegetation health using NIR and red-edge reflectance.
NLI R n i r 2 R r e d R n i r 2 + R r e d Non-linear index, identifying plant photosynthetic activity.
RDVI R n i r R r e d R n i r + R r e d × ( R n i r R r e d ) Renormalized Difference Vegetation Index, reducing background noise.
MSR R n i r / R r e d 1 R n i r / R r e d + 1 Modified Simple Ratio, combining vegetation and soil data.
NG R g r e e n R n i r + R r e d + R g r e e n Normalized Green Index, assessing plant greenness.
NR R n i r R n i r + R r e d Normalized Ratio, analyzing vegetation using NIR and red bands.
IPVI R n i r R n i r + R r e d Infrared Percentage Vegetation Index, estimating vegetation cover using NIR.
MTVI2 1.5 ( 1.2 ( R n i r R g r e e n ) 2.5 ( R r e d R g r e e n ) ) ( 2 R n i r + 1 ) 2 ( 6 R n i r 5 R r e d ) 0.5 Modified triangular vegetation index for sparse vegetation monitoring and stress detection.
Table 3. The parameter settings in experiments.
ParametersValues
Central Processing UnitIntel Xeon Platinum 8352 V
Graphics Processing UnitRTX 3080 Ti
Operating SystemUbuntu 20.04 LTS 64-bit system
Version of PyTorch1.10.0
Version of CUDA11.3
Version of Python3.8
Table 4. Performance evaluation of MSFNet.
MetricsHealthyOthersStripe RustYellow DwarfTotal
Accuracy99.5%92.4%91.5%99.1%95.4%
Precision99.0%90.6%93.8%99.1%95.6%
Recall99.5%92.4%91.5%99.1%95.6%
F1-score99.2%91.5%92.7%99.1%96.6%
Table 5. Comparative experiment results.
ModelAccuracyPrecisionRecallF1-ScoreParamsFPS
Vision Transformer84.6%85.5%86.1%85.8%48.6 M51.96
Swin Transformer85.6%86.2%86.8%86.5%87.8 M26.91
MobileNetV386.6%87.2%87.0%87.1%41.5 M48.22
ResNeXt5088.1%88.3%88.5%88.4%25.0 M38.19
ShuffleNetV2-s88.2%88.4%88.6%88.5%14.5 M48.58
EfficientNetV2-s90.1%90.4%90.4%90.4%21.4 M23.49
SENet5091.5%91.1%91.7%91.4%26.1 M18.16
ResNet1889.4%89.6%89.8%89.7%13.1 M79.54
ResNet5088.7%88.6%89.0%88.8%25.6 M61.16
ResNet10189.2%88.8%89.4%89.1%44.6 M57.62
MSFNet95.4%95.6%95.6%95.6%14.2 M62.18
Table 6. The results of the ablation experiment. The symbol “✓” indicates the modules included in the ablation experiments.
ResNet18RGBMS-VIsMSFMHSSFMAccuracyPrecisionRecallF1-Score
82.7%82.4%82.2%82.3%
80.4%77.1%81.0%79.0%
89.4%89.6%89.8%89.7%
94.1%94.3%94.3%94.3%
94.2%94.3%94.1%94.2%
95.4%95.6%95.6%95.6%
Table 7. Generalization validation results of the MSFM across different networks.
ModelFusion MethodAccuracyPrecisionRecallF1-Score
ShuffleNetV2Data Fusion88.2%88.4%88.6%88.5%
MSFM89.9%↑ 1.7%90.3%90.3%90.3%
ResNeXtData Fusion88.1%88.3%88.5%88.4%
MSFM92.0%↑ 3.9% 92.3%92.1%92.2%
MobileNetV3sData Fusion86.6%87.2%87.0%87.1%
MSFM89.8%↑ 3.2% 90.4%90.2%90.3%
SENetData Fusion91.5%91.1%91.7%91.4%
MSFM93.1%↑ 2.4% 92.7%93.5%93.1%
ResNet50Data Fusion88.7%88.6%89.0%88.8%
MSFM93.0%↑ 4.3% 93.1%93.3%93.2%
ResNet101Data Fusion89.2%88.8%89.4%89.1%
MSFM92.4%↑ 3.2% 92.3%92.7%92.5%
Note: Bold values indicate the best performance achieved by the MSFM compared to the baseline Data Fusion method. The ↑ symbol denotes the improvement in percentage points over the baseline.
Table 8. Generalization validation results of the HSSFM across different networks.
ModelFeature for ClassificationAccuracyPrecisionRecallF1-Score
ResNeXtSingle-Level Feature88.1%88.3%88.5%88.4%
Hierarchical Feature91.3%↑ 3.2% 91.6%91.6%91.6%
MobileNetV3sSingle-Level Feature86.6%87.2%87.0%87.1%
Hierarchical Feature88.8%↑ 2.2% 88.9%89.1%89.0%
SENetSingle-Level Feature91.5%91.1%91.7%91.4%
Hierarchical Feature93.8%↑ 2.3% 94.2%93.8%94.0%
ResNet50Single-Level Feature88.7%88.6%89.0%88.8%
Hierarchical Feature93.8%↑ 5.1% 93.9%94.1%94.0%
ResNet101Single-Level Feature89.2%88.8%89.4%89.1%
Hierarchical Feature94.2%↑ 5.0% 93.8%94.4%94.1%
Note: Bold values indicate the best performance achieved by the MSFM compared to the baseline model. The ↑ symbol denotes the improvement in percentage points over the baseline.
Table 9. Performance evaluation of MSFNet and ResNet under noisy data conditions.
ModuleMetricsHealthyOthersStripe RustYellow DwarfTotal
ResNet50Accuracy90.5%82.4%80.5%91.5%86.1%
Precision91.0%83.6%80.8%90.1%86.1%
Recall89.8%80.4%80.5%89.9%84.9%
F1-score90.4%81.9%80.7%90.0%85.4%
MSFNetAccuracy98.9%91.9%91.4%98.7%95.1%
Precision98.3%90.2%93.1%98.5%94.8%
Recall98.8%91.4%90.4%98.7%94.7%
F1-score98.5%90.8%91.7%98.6%94.7%
Table 10. Cross-region evaluation results of MSFNet.
MetricsHealthyOthersStripe RustYellow DwarfTotal
Accuracy98.1%93.4%90.3%97.6%94.7%
Precision98.7%91.2%91.9%97.2%94.6%
Recall98.0%92.7%92.0%98.1%95.0%
F1-score98.3%91.9%91.9%97.5%94.7%
Disclaimer/Publisher’s Note: The statements, opinions and data contained in all publications are solely those of the individual author(s) and contributor(s) and not of MDPI and/or the editor(s). MDPI and/or the editor(s) disclaim responsibility for any injury to people or property resulting from any ideas, methods, instructions or products referred to in the content.

