Article

Dynamic Stall Mechanisms of Pitching Airfoil: IDDES Study Across Different Mach Numbers

National Key Laboratory of Helicopter Aeromechanics, Nanjing University of Aeronautics and Astronautics, Nanjing 210016, China
*
Author to whom correspondence should be addressed.
Appl. Sci. 2025, 15(13), 7309; https://doi.org/10.3390/app15137309
Submission received: 30 May 2025 / Revised: 25 June 2025 / Accepted: 26 June 2025 / Published: 28 June 2025

Abstract

This study investigates dynamic stall mechanisms of a pitching NACA 0012 airfoil through high-fidelity computational fluid dynamics (CFD) simulations. The improved delayed detached eddy simulation (IDDES) method based on a sliding mesh system is constructed and validated against experimental airload measurements. The results demonstrate a good agreement and the capability to capture three-dimensional flow structures. Comparative analyses at two Mach numbers of 0.283 and 0.5 reveal distinct stall physics. At the Mach number of 0.283, a notable 9.7° delay is observed between the static and dynamic stall. The airfoil experiences a leading-edge stall dominated by a strong adverse pressure gradient and generates rapid airload variations. In addition, trailing-edge vortex (TEV) and secondary leading-edge vortices (LEVs) induce distinct airload fluctuations. After the shedding of primary vortices, secondary vortices develop. In contrast, the airfoil at the Mach number of 0.5 presents a reduced stall delay of 6.4° and a shock-induced dynamic stall characterized by dispersed, smaller vortices, which results in mild airload variations during stall. Aerodynamic damping analysis identifies stall delay as a primary contributor to negative damping. Enhanced pitching stability at the higher Mach number correlates with reduced stall delay and different LEV development characteristics. Results across varying reduced frequencies show that increasing reduced frequency delays the aerodynamic response and stall onset. At Ma = 0.283, this increasement promotes a divergent tendency in pitching motion, whereas at Ma = 0.5, it induces greater oscillatory stability attributed to distinct stall characteristics.

1. Introduction

Dynamic stall remains a critical aerodynamic phenomenon limiting the maximum flight speed and maneuverability of conventional single-rotor helicopters, primarily due to transient flow separation and stall vortex under unsteady conditions [1]. Over decades, extensive efforts have been devoted to investigating its complex flow mechanisms, using experimental and computational approaches to characterize its evolutionary stages and impacting factors.
Experimental studies by McCroskey et al. [2,3,4,5] established foundational insights through oscillating airfoil tests, categorizing dynamic stall into four types based on maximum angle of attack (AoA): no stall, stall onset, light stall, and deep stall [6]. Mulleners and Raffel [7,8] further divided the process into five stages using time-resolved particle image velocimetry (TR-PIV), identifying primary and secondary instabilities during stall development. These studies clearly revealed the evolutionary stages and typical aerodynamic events during dynamic stall.
Compressibility effects, a critical factor in rotorcraft applications, were systematically reviewed by Carr et al. [9], who demonstrated that even at a Mach number of 0.2, supercritical flows significantly alter stall characteristics. Increased Mach numbers reduce lift overshoot amplitudes and advance stall onset [5,10]. Ames Research Center designed schlieren-based systems and observed shockwave formation and supersonic regions at Mach > 0.4 [11,12]. Matalanis et al. [13,14] experimentally and numerically investigated dynamic stall suppression using combustion-powered actuation on a modified VR-12 airfoil across a Mach number range of 0.2 to 0.5. Nevertheless, experimental studies at Reynolds numbers (Re) representative of full-scale rotors (Re ≥ 1 × 10⁶) remain sparse. Systematic comparisons have revealed significant discrepancies in dynamic stall characteristics between low-Re (<1 × 10⁶) and high-Re (≥1 × 10⁶) conditions [15,16,17]. While Lorber et al. [18] and Gardner et al. [19] explored high-Re conditions (2.0–4.0 × 10⁶), they focused on aerodynamic loads and omitted detailed flowfield analyses.
Computational fluid dynamics (CFD) has emerged as a numerical tool, with turbulence modeling strategies evolving from Reynolds-averaged Navier–Stokes (RANS) to hybrid RANS-LES frameworks. Spalart et al. [20,21,22] proposed detached eddy simulation (DES) methods, balancing accuracy and computational cost. Recent studies by Kim et al. [23] using SU2 solver highlighted compressibility-induced changes in stall regime at Mach numbers of 0.2–0.4. Khalifa et al. [24,25] compared RANS, detached DES (DDES), and improved DDES (IDDES), emphasizing three-dimensional flow features. Visbal’s group [16,26,27,28,29,30,31] advanced implicit LES (ILES) for low-to-medium Reynolds flows, revealing effects of compressibility [31] and airfoil geometry [32,33] on dynamic stall mechanisms: thin airfoils experience leading-edge laminar separation bubble bursting, whereas thicker airfoils encounter trailing-edge separation interference. Nevertheless, these conclusions are constrained to low Mach numbers (Ma < 0.1) and Re ≤ 1.0 × 10⁶.
Despite significant advancements, our understanding of dynamic stall mechanisms in compressible, high-Reynolds-number flows remains incomplete, particularly at high Mach numbers relevant to helicopter rotor operations. This study employs sliding grid and IDDES methods to simulate dynamic stall at different Mach numbers. Aerodynamic behavior is analyzed through airload hysteresis, stall regime, vortex structures, and aerodynamic damping characteristics. In the paper, numerical methods and their validation is introduced in Section 2. This is followed by results and discussions on airfoil dynamic stall characteristics at two Mach numbers of 0.283 and 0.5, respectively. Finally, key findings are concluded.

2. Numerical Methods

2.1. CFD Methods

The Reynolds-averaged Navier–Stokes (RANS) equations are employed as the governing equations of airfoil flow, which can be expressed in the following integral form:
t Ω W d Ω + Ω F c F v · n d S = 0
where ∂Ω is the boundary of a control volume Ω; n is the unit normal vector of the surface element dS; W, Fc and Fv are the vector of conserved variables, convective fluxes, and viscous fluxes, respectively, which are written as
W = ρ ρ u ρ v ρ w ρ E , F c = ρ V V ω ρ u V V ω + I x p ρ v V V ω + I y p ρ w V V ω + I z p ρ H V V ω + V ω p , F v = 0 I x τ x x + I y τ x y + I z τ x z I x τ y x + I y τ y y + I z τ y z I x τ z x + I y τ z y + I z τ z z I x Θ x + I y Θ y + I z Θ z
where ρ denotes the air density, p the static pressure, E and H the total energy and enthalpy per unit mass, respectively. u, v, and w are the velocity components of the absolute velocity vector V, and Vω is the grid velocity vector; Ix, Iy and Iz are unit vectors along the x, y, and z axis. τij represents the viscous stress, and Θi is the terms describing the work of the viscous stresses and the heat conductive in the fluid.
The k-ω shear stress transport (SST) turbulence model is adopted to account for the effects of turbulence. The SST model comprises two transportation equations relating to the turbulent kinetic energy (k) and its specific dissipation rate (ω):
ρ k t + ρ V k = P k ρ k 3 / l R A N S + μ l + σ k μ t k
ρ ω t + ρ V ω = α ρ μ t P k β ρ ω 2 + μ l + σ ω μ t ω + 2 1 F 1 ρ σ ω 2 k ω ω
where F1 is the blending function. The terms on the right-hand side represent eddy-viscosity production, dissipation, and conservative diffusion, respectively.
A hybrid RANS-LES method can be built using the IDDES model based on the SST turbulence model [34], where the RANS length scale in Equation (2) is replaced by the IDDES length scale in the SST IDDES formulations. The IDDES length scale reads as follows:
l I D D E S = f ˜ d l R A N S + 1 f ˜ d l L E S
Here f ˜ d denotes the empirical blending function, l L E S denotes the LES length scale. For detailed formulas, please refer to reference [34].
The governing equations are solved using our in-house code CLORNS [35] based on a structured sliding mesh framework. Spatial discretization is achieved via the finite volume method (FVM): inviscid terms are computed using a fifth-order TENO scheme with Roe’s flux difference splitting, while viscous terms employ second-order central differencing. Compared to classical ENO and WENO schemes, the TENO scheme achieves high-resolution capability via an adaptive low-dissipation framework, making it particularly suitable for dynamic stall problems involving both smooth and discontinuous flow. Temporal integration is realized by a second-order dual-time step algorithm, and the solution is advanced using the LU-SGS method.

2.2. Computational Model and Domain

The computational model features a NACA 0012 airfoil. Both the span (L) and chord (c) are set to 0.6 m. The airfoil is forced to undergo sinusoidal oscillation about the quarter-chord line. As shown in Figure 1, a structured sliding mesh is generated within a cylindrical computational domain surrounding the airfoil. The domain has a radius of 20 chord lengths (20c) and comprises two regions: a stationary region and an oscillatory region, which are separated by a sliding interface positioned 5 chord lengths (5c) from the pitching axis. A uniform mesh distribution is applied along the spanwise direction. Figure 1b shows the spanwise-section mesh and an enlarged view near both the leading and trailing edge. In the LES region, the mesh is refined to be approximately homogeneous and isotropic, in order to capture critical flow characteristics with high resolution. Additionally, the height of the first mesh normal to the wall is set to 4 × 10⁻⁶c to keep the non-dimensional wall distance (y+) below 1, thereby satisfying the requirements for near-wall turbulence modeling. The computational domain adopts translational periodic boundary conditions at both spanwise ends, a no-slip condition at the wall, and a non-reflecting condition at the far-field boundary, as shown in Figure 2.

2.3. Validation for CFD Method

To validate the CFD method for simulating oscillating airfoils under deep stall conditions, experimental data of a pitching NACA 0012 airfoil [3] are utilized. The simulation parameters are set as follows: Mach number (Ma) = 0.283, angle of attack (α) = 14.91° + 9.87° sin(ωt), reduced frequency (k) = 0.151, and Reynolds number (Re) = 3.45 × 10⁶. Different time steps and grid resolutions are used to assess temporal and grid independence. Detailed grid information is provided in Table 1. In the calculation, the URANS method is first employed until convergence is achieved. The IDDES method is then used to compute for seven full cycles, with results from the last five cycles recorded and averaged.
Figure 3 compares numerical results computed using three time steps (Δt denotes the non-dimensional time step) on the medium grid. Figure 4 compares results from three grid resolutions against experimental data. Notably, the CFD method overpredicts the peak values of drag and nose-down moment—a discrepancy also reported in prior studies [23,36]—likely stemming from inherent limitations of CFD methods. Conversely, the attached flow stage and stall initiation are well simulated, along with the peak lift magnitude. Across different time steps and grid densities, results exhibit good agreement during the upstroke, whereas some discrepancies arise in the downstroke. This divergence is primarily attributed to turbulent fluctuations in the massively separated flow after stall. Table 2 presents the computational results of critical dynamic stall parameters for three grids, all of which exhibit good consistency—further validating grid convergence. Overall, numerical predictions agree favorably with experimental measurements, validating the efficacy of the CFD method for analyzing dynamic stall phenomena of pitching airfoils. Subsequent calculations in the study adopt the medium grid and a time step of Δt = 0.005.
To validate the present CFD method at a high Mach number of 0.5, a modified VR-12 airfoil is employed. The airfoil features a 5%c trailing edge tab with a zero tab angle, and its coordinates are available in Reference [37]. The computation parameters are set as Ma = 0.5, α = 8° + 8° sin(ωt), k = 0.05, and Re = 4.3 × 10⁶.
Figure 5 shows a comparison among the experimental data [13], numerical results by Kim et al. using the RANS method [23], and the current calculated results. The present CFD method accurately captures the angles of lift stall, drag divergence, and moment stall. The peak value of the lift coefficient is in good agreement with the experimental data. During the initial pitching down stage, both the RANS method used by Kim et al. and the present IDDES method exhibit limitations due to fully turbulent separation. Nevertheless, the present IDDES method successfully captures the gradual lift and moment stall behavior and outperforms the RANS method, which predicts an abrupt lift and moment stall.

3. Aerodynamics at a Mach Number of 0.283

3.1. Aerodynamic Load Response at Ma = 0.283

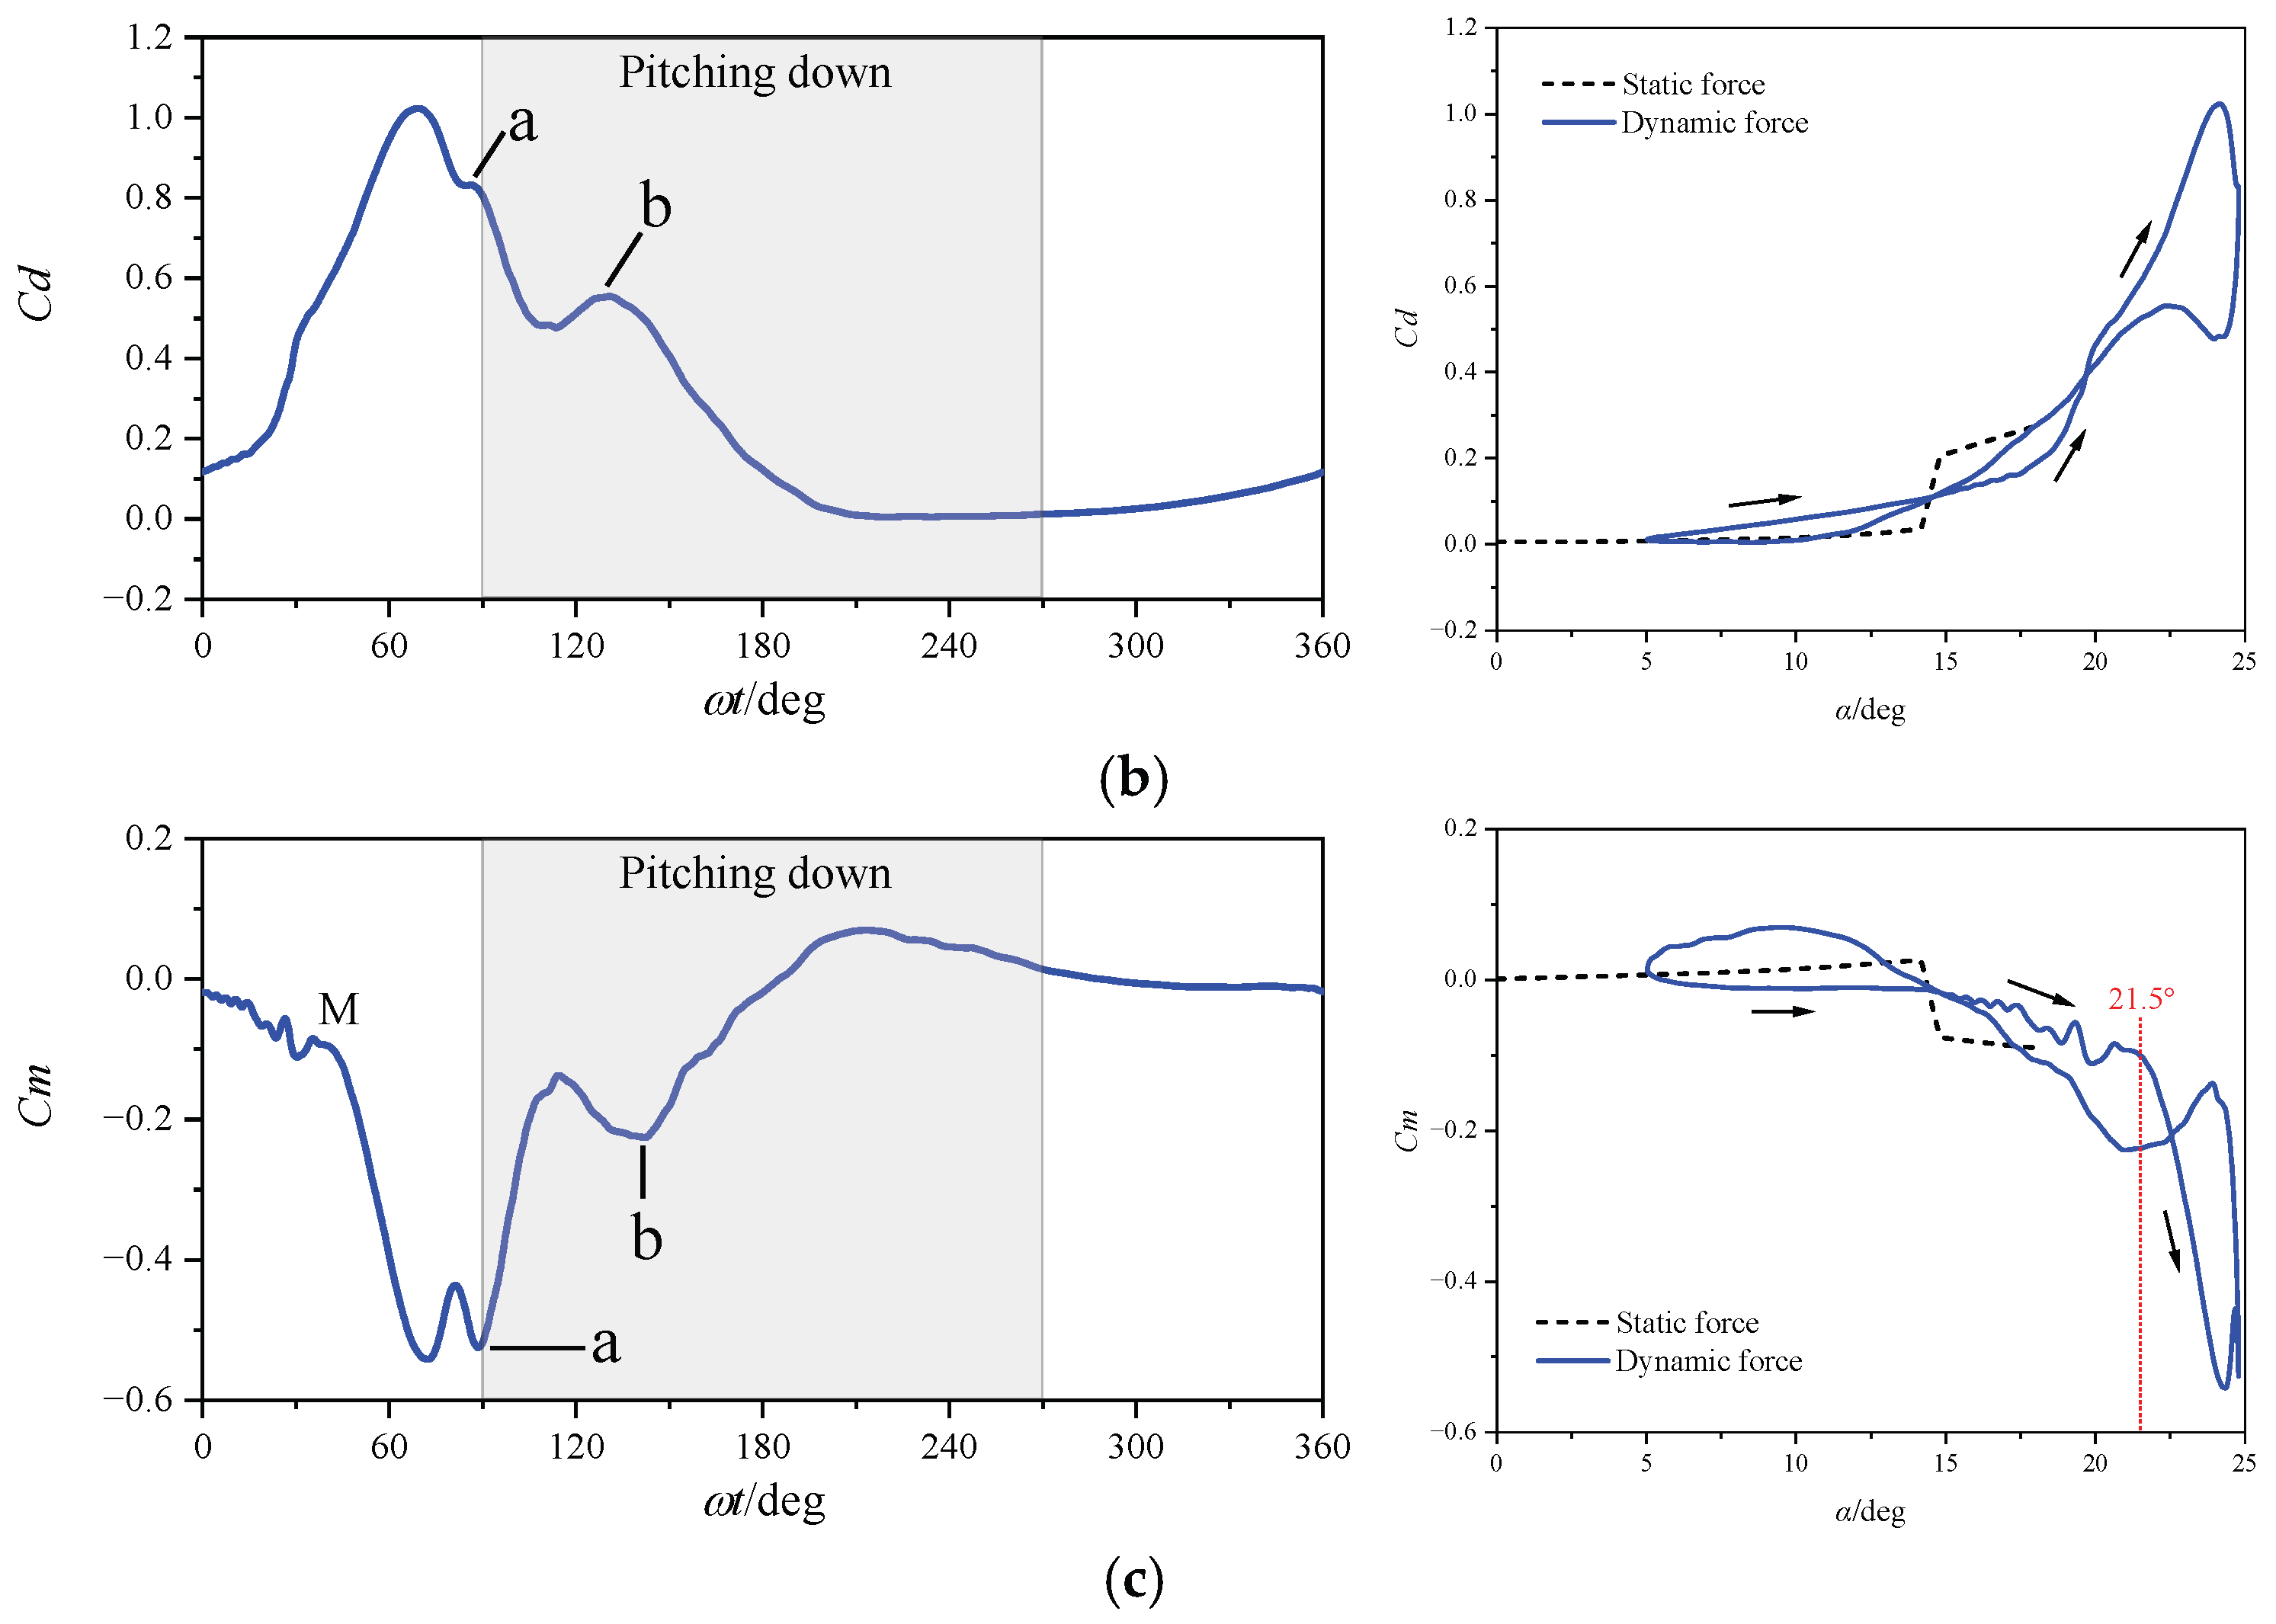
The dynamic stall characteristics of a pitching NACA 0012 airfoil are computed and analyzed at a Mach number of 0.283. Figure 6 presents the cycle-averaged lift, drag, and moment coefficients, as well as the lift stall (L) and moment stall (M) points. The arrows in the figure denote the variation trend of airloads. In the pitching-up stage, the lift coefficient increases gradually and reaches a peak value at a lift-stall angle of 21.5°, beyond which it drops rapidly. Drag divergence starts at an AoA of 17.6°, and the drag coefficient rises to its maximum value at an AoA of 24.2°. The moment coefficient remains stable until a moment stall angle of 23.7°, after which it experiences a sharp decline. In addition, two notable load fluctuations labeled ‘a’ and ‘b’ are observed in the figure. Compared to the static airfoil, the pitching airfoil indicates a significant 9.7° delay in dynamic stall, with the stall angle shifting from 14.0° to 23.7°. During the stall delay stage, the nose-down moment continues to increase at a gradual rate, exerting a critical influence on the aerodynamic damping of the pitching airfoil.
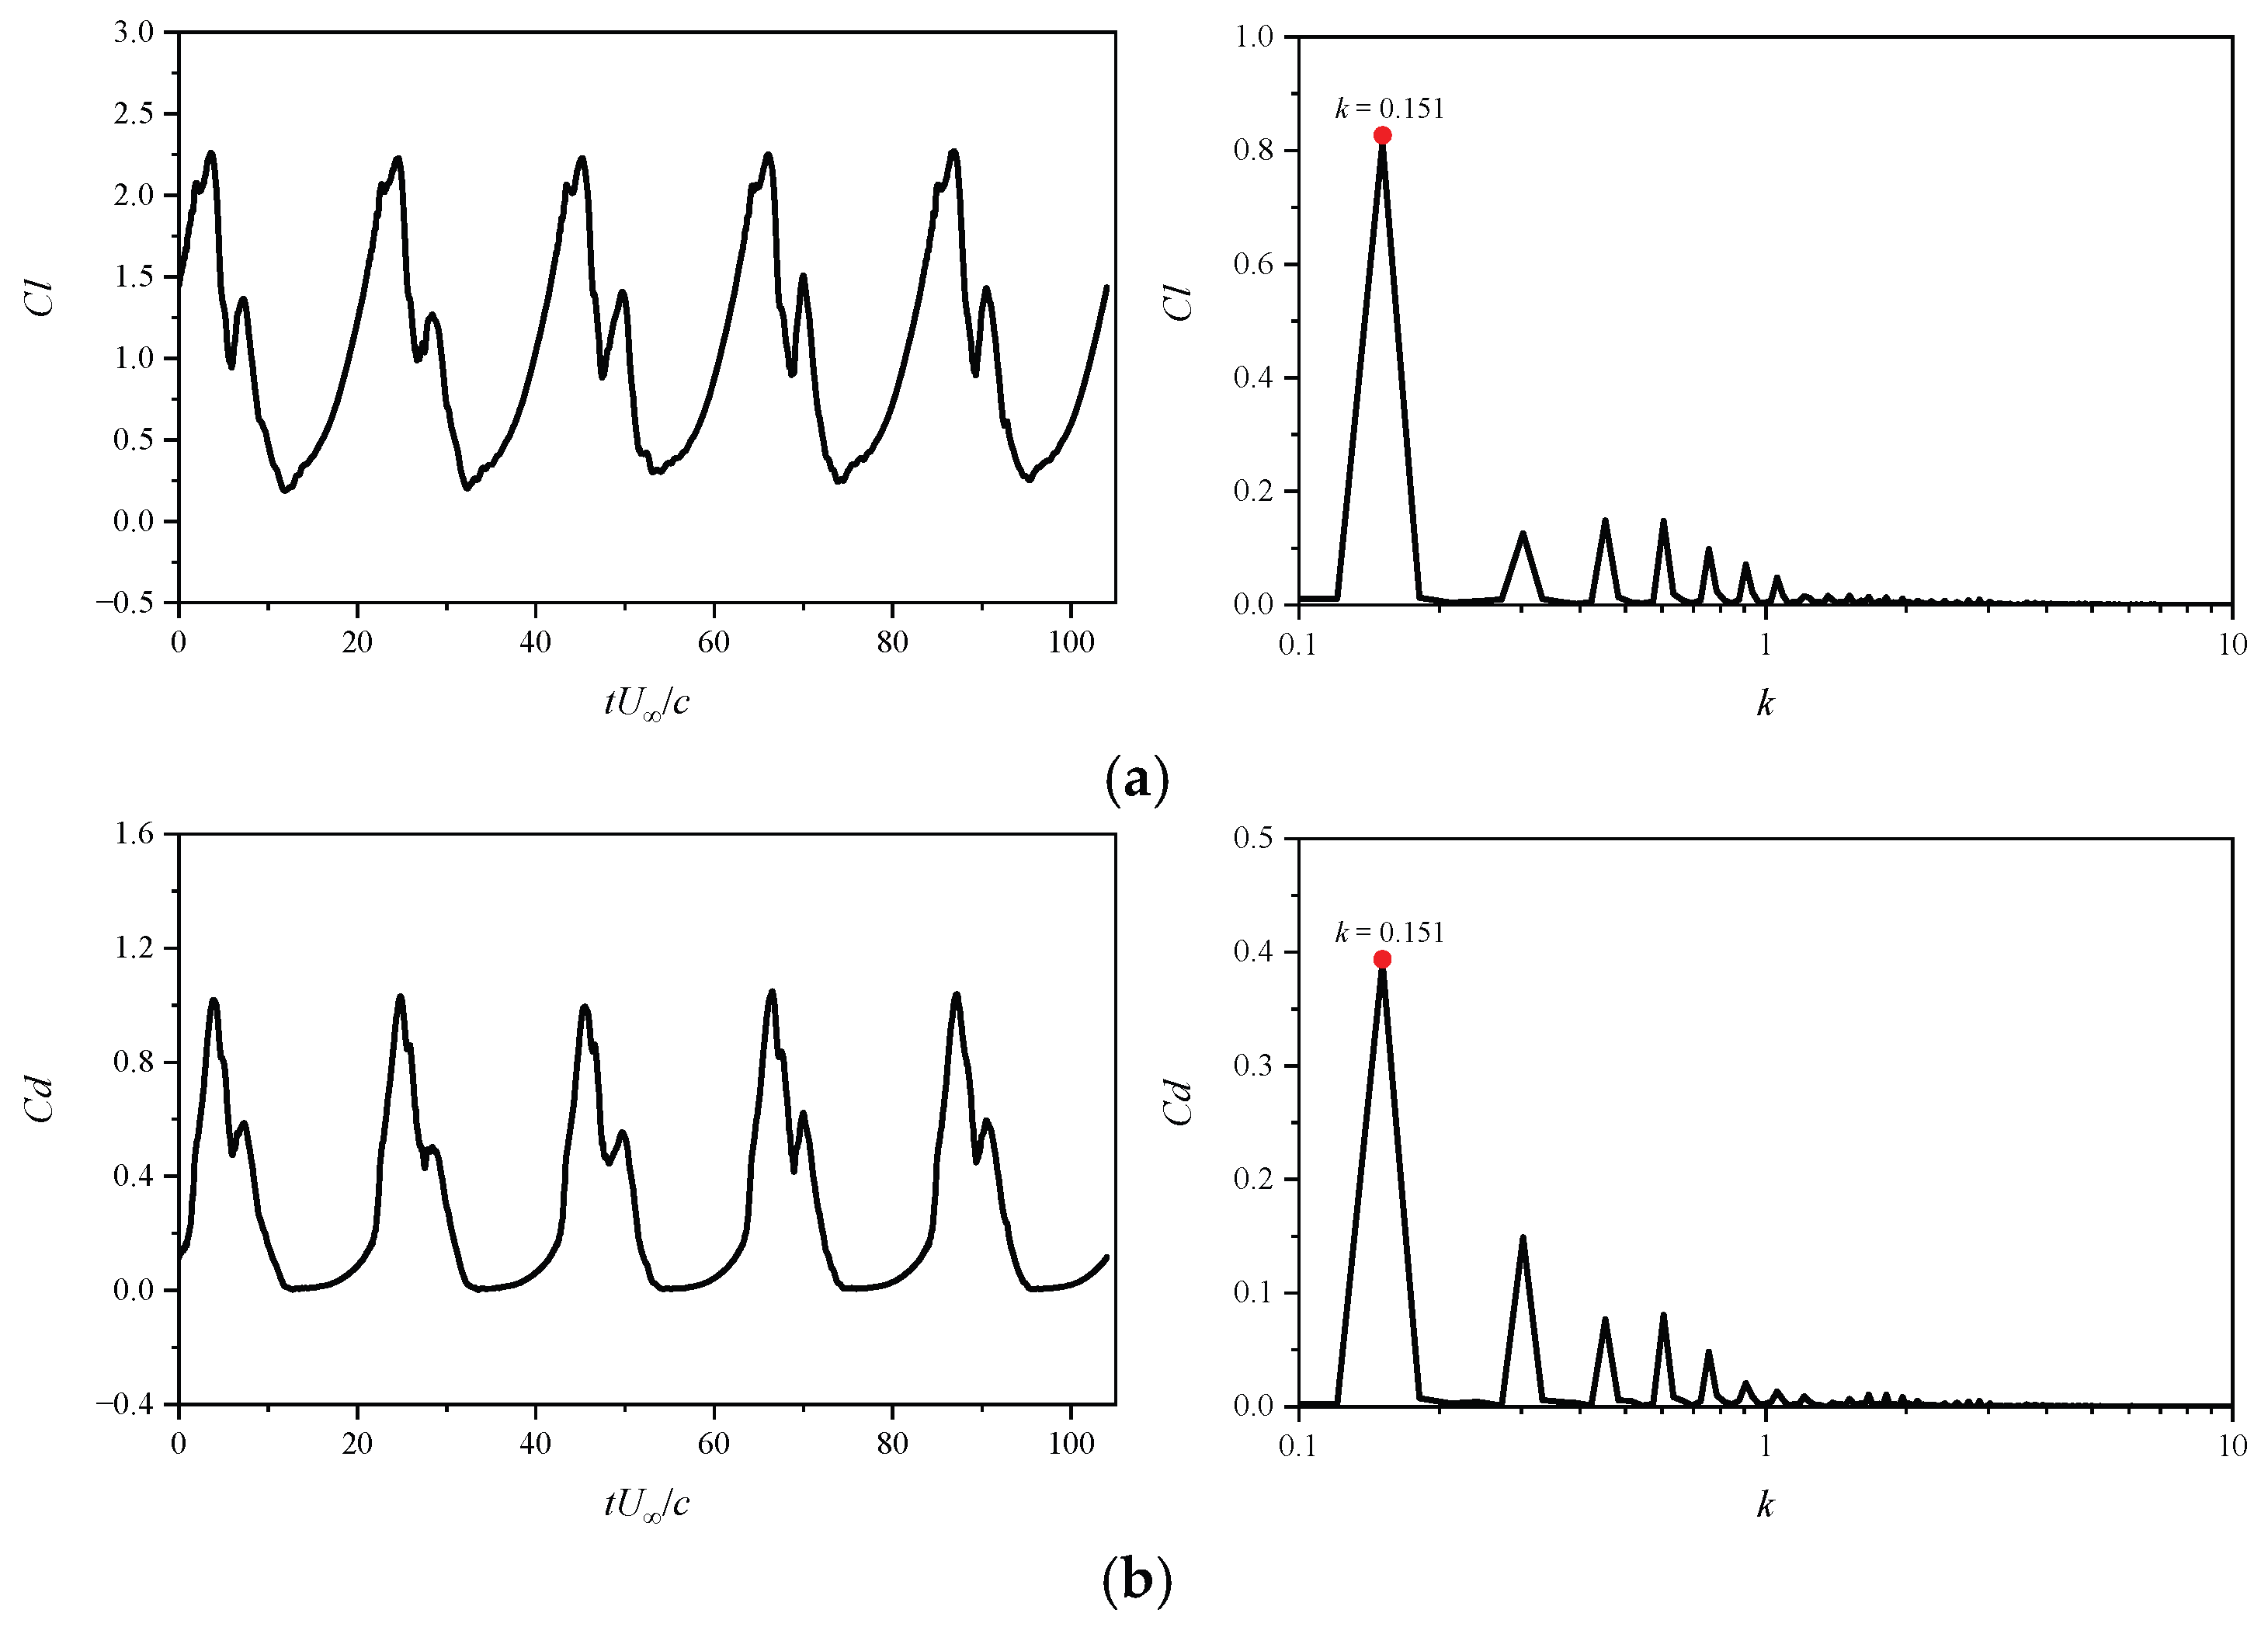
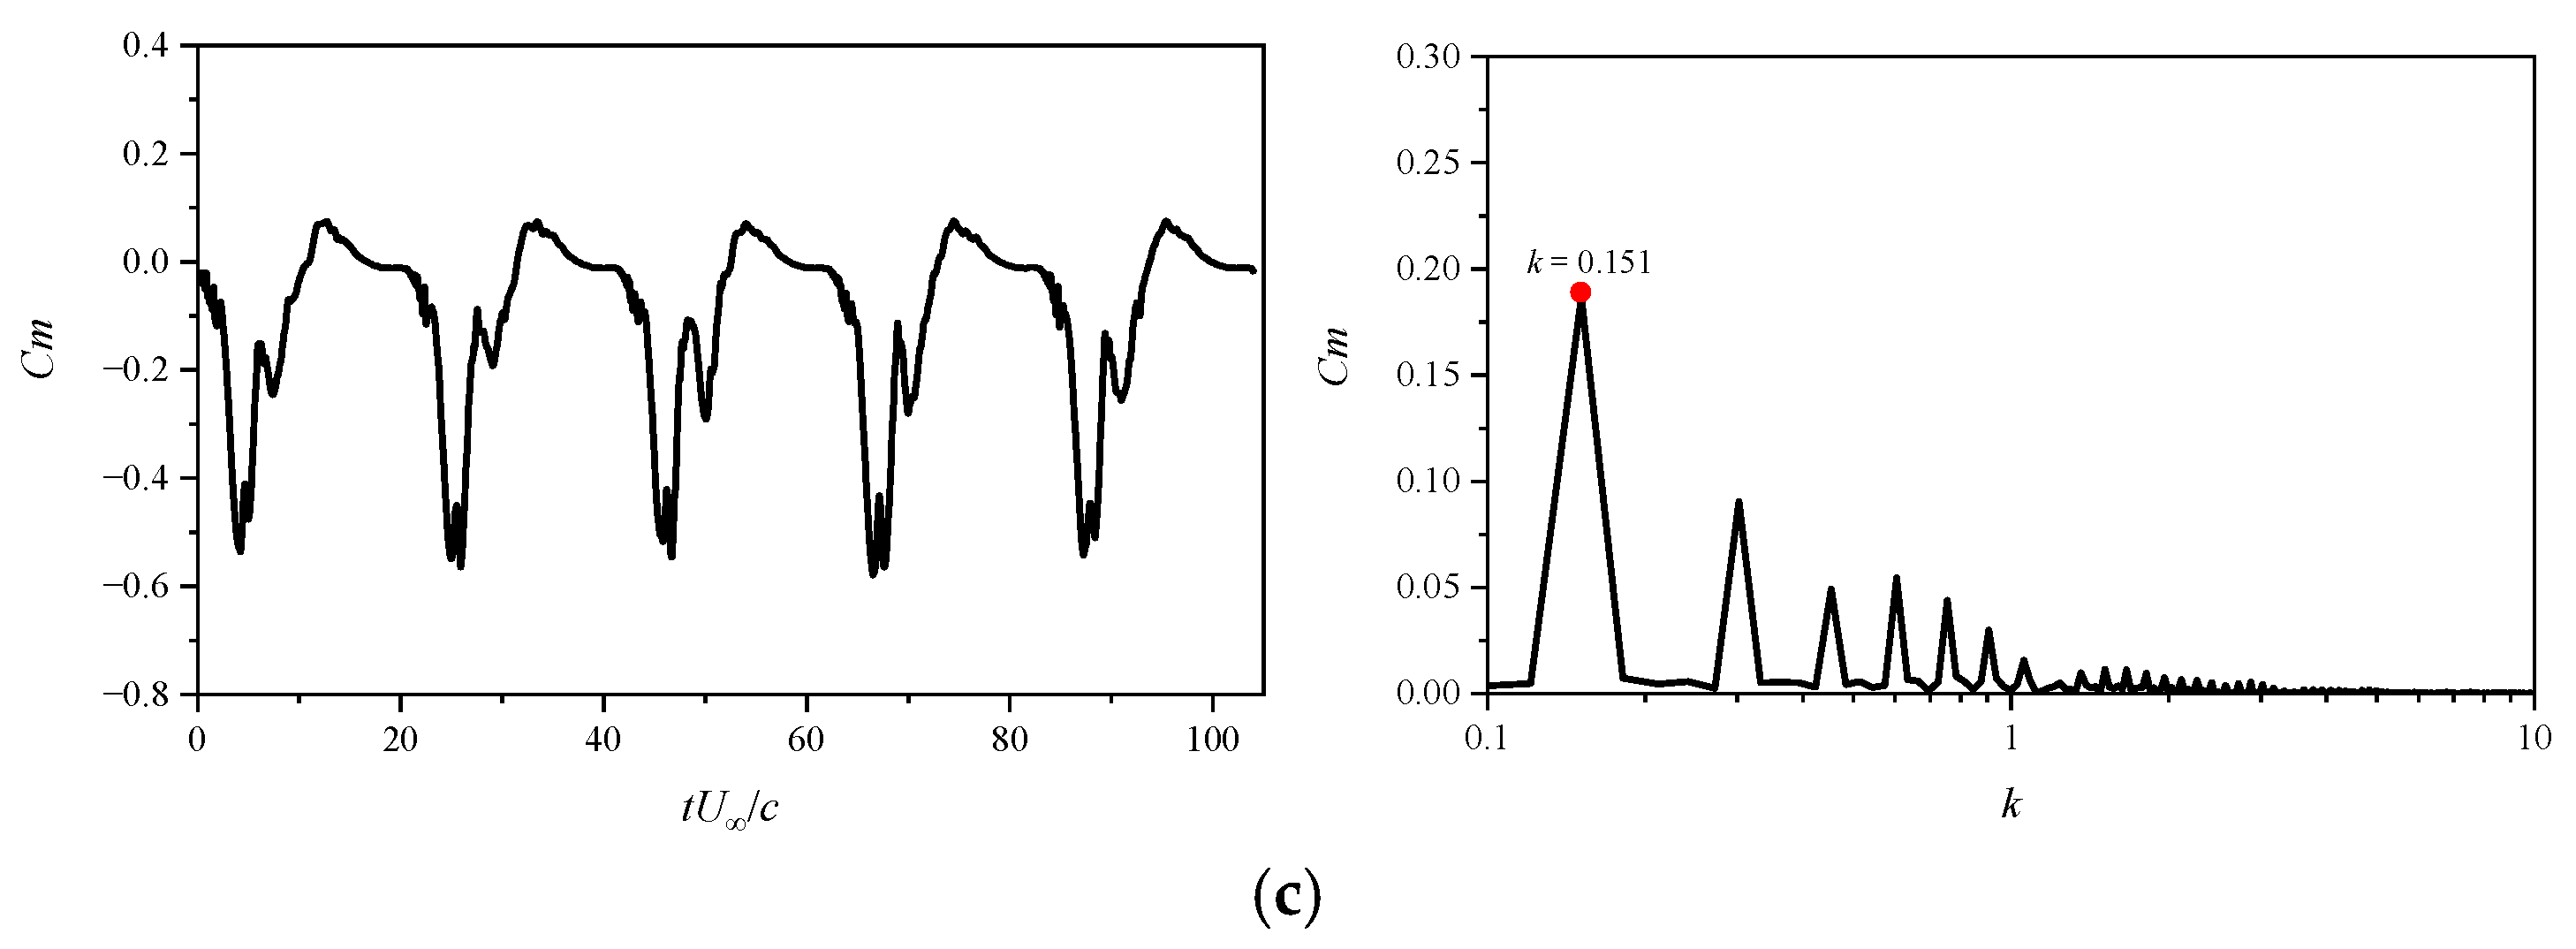
Figure 7 illustrates the time evolution of aerodynamic force coefficients over five consecutive pitching cycles, along with their corresponding frequency spectra. The lift, drag, and pitching moment coefficients all exhibit similar periodic behavior, with their variations dominated by a common normalized frequency, specifically, the airfoil pitching frequency k = 0.151. Notably, the frequency spectra also reveal distinct harmonic components.

3.2. Flowfield Feature at Ma = 0.283

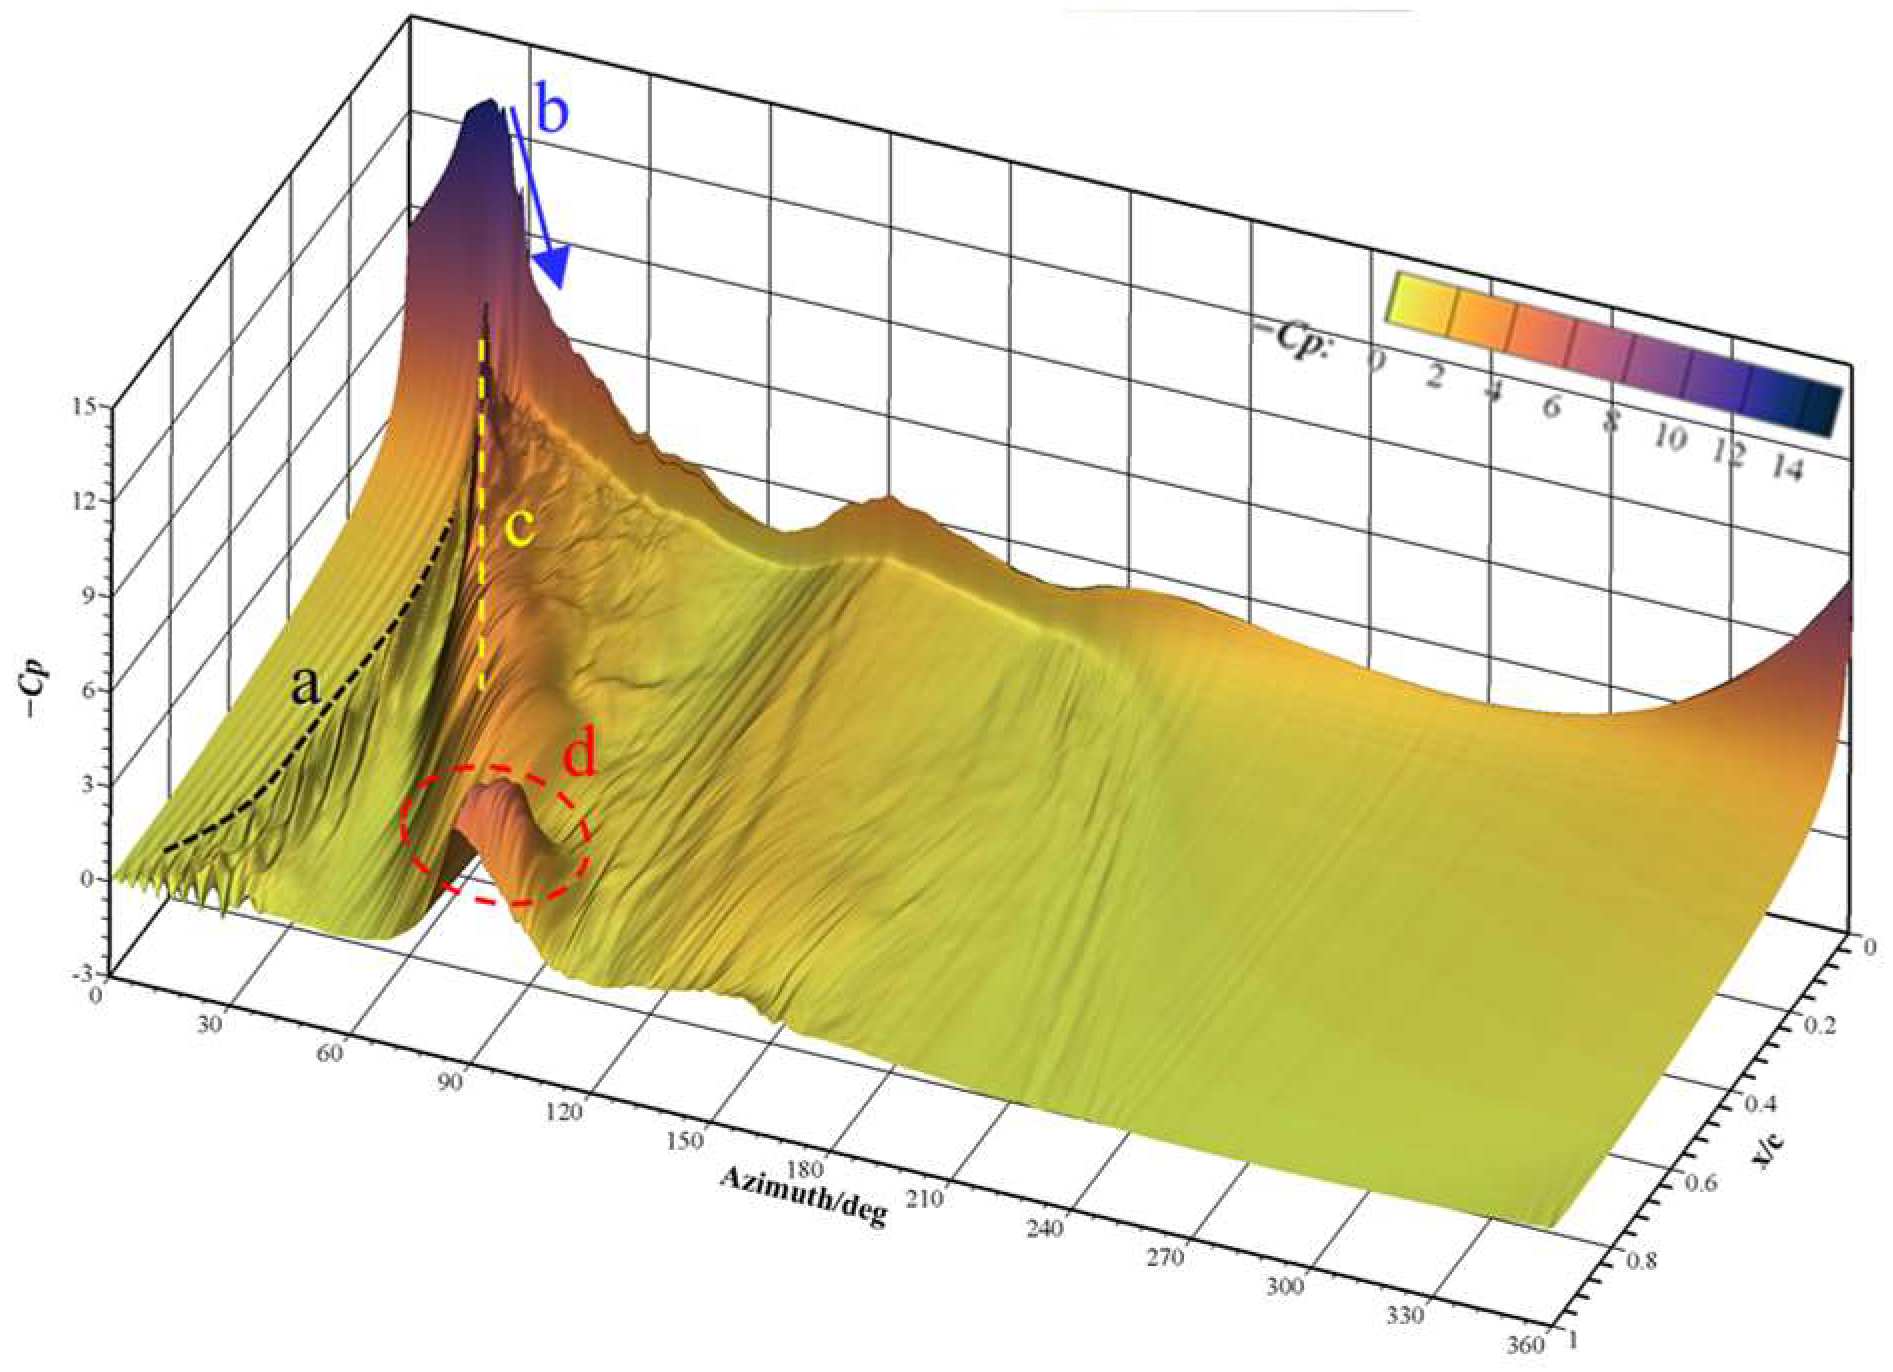
Spanwise-averaged pressure coefficient contours shown in Figure 8 reveal four sequential events during the pitching cycle: (a) trailing-edge separation (TES) propagation, (b) collapse of the leading-edge suction pressure peak, (c) leading-edge vortex (LEV) development, and (d) trailing-edge vortex (TEV) emergence. Following the collapse of the leading-edge suction pressure peak, an LEV forms, generating a new low-pressure region that progressively expands and transports downstream. As the LEV approaches the trailing edge, a TEV is induced, creating an additional low-pressure region. During the pitching-up circle, the suction pressure peak exceeds the critical pressure coefficient (Cpcr = −7.9), reaching a minimum value of approximately −13.0. This observation indicates the occurrence of localized supercritical flow near the leading edge.
Figure 9 presents Mach number and pressure coefficient contours for the center section at an AoA of 18.26°, corresponding to the highest suction pressure peak. The upward-pointing arrow ‘↑’ following the AoA value denotes the upstroke circle, while the downward-pointing one ‘↓’ denotes the downstroke circle. A supersonic region (Ma > 1, gray-shaded in Figure 9a) forms near the leading edge, yet no shock structures are observed (Figure 9b). This suggests that the airfoil undergoes compressibility effects while experiencing a deep dynamic stall regime characterized by a strong adverse pressure gradient.
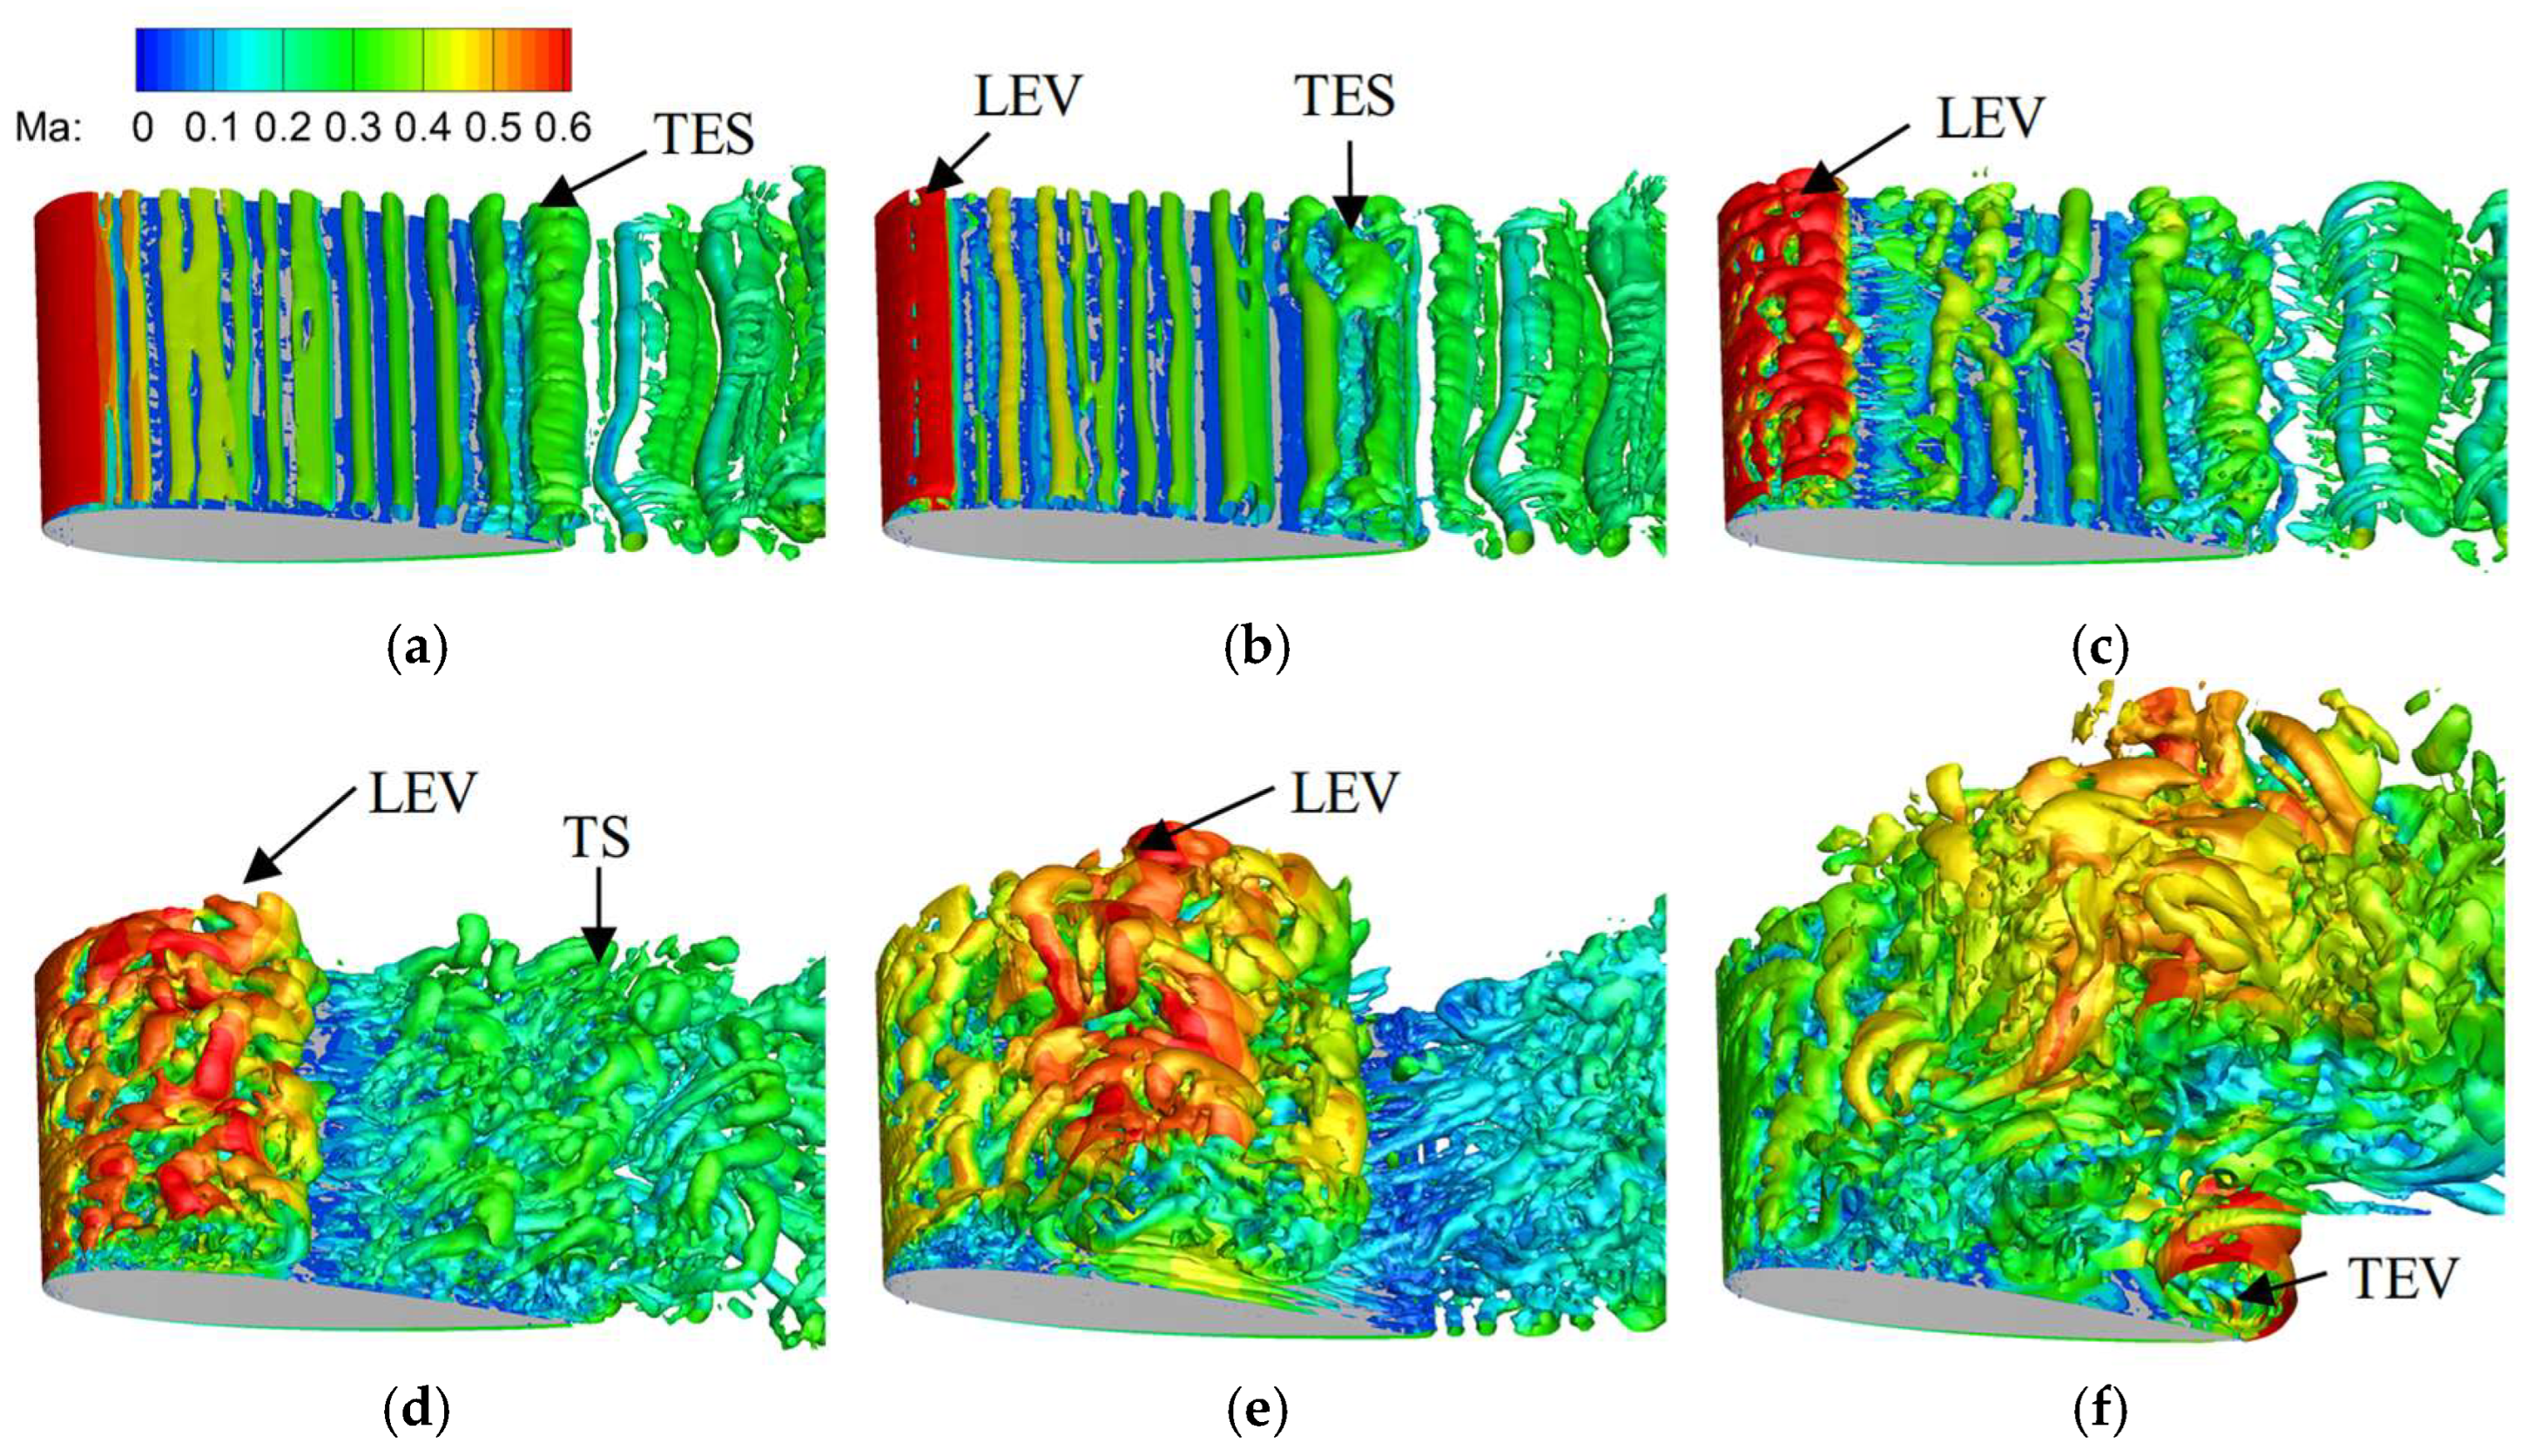
Figure 10 shows the iso-surfaces of the λ2-criterion (λ2 = −0.0001) in the pitching-up stage, displaying the evolution of vortical structures. In Figure 10a,b, both the LEV and TES exhibit quasi-two-dimensional characteristics during their incipient stages. As the AoA increases, the LEV experiences substantial growth and downstream convection (Figure 10c–e), which directly associated with the moment stall. During this period, the LEV evolves into multi-scale vortex structures dominated by pronounced three-dimensional interactions. Simultaneously, the TES develops into three-dimensional turbulent separation (TS), as illustrated in Figure 10d. Upon reaching the peak AoA of 24.79°, the LEV is displaced upward, while a TEV forms near the airfoil’s trailing edge.
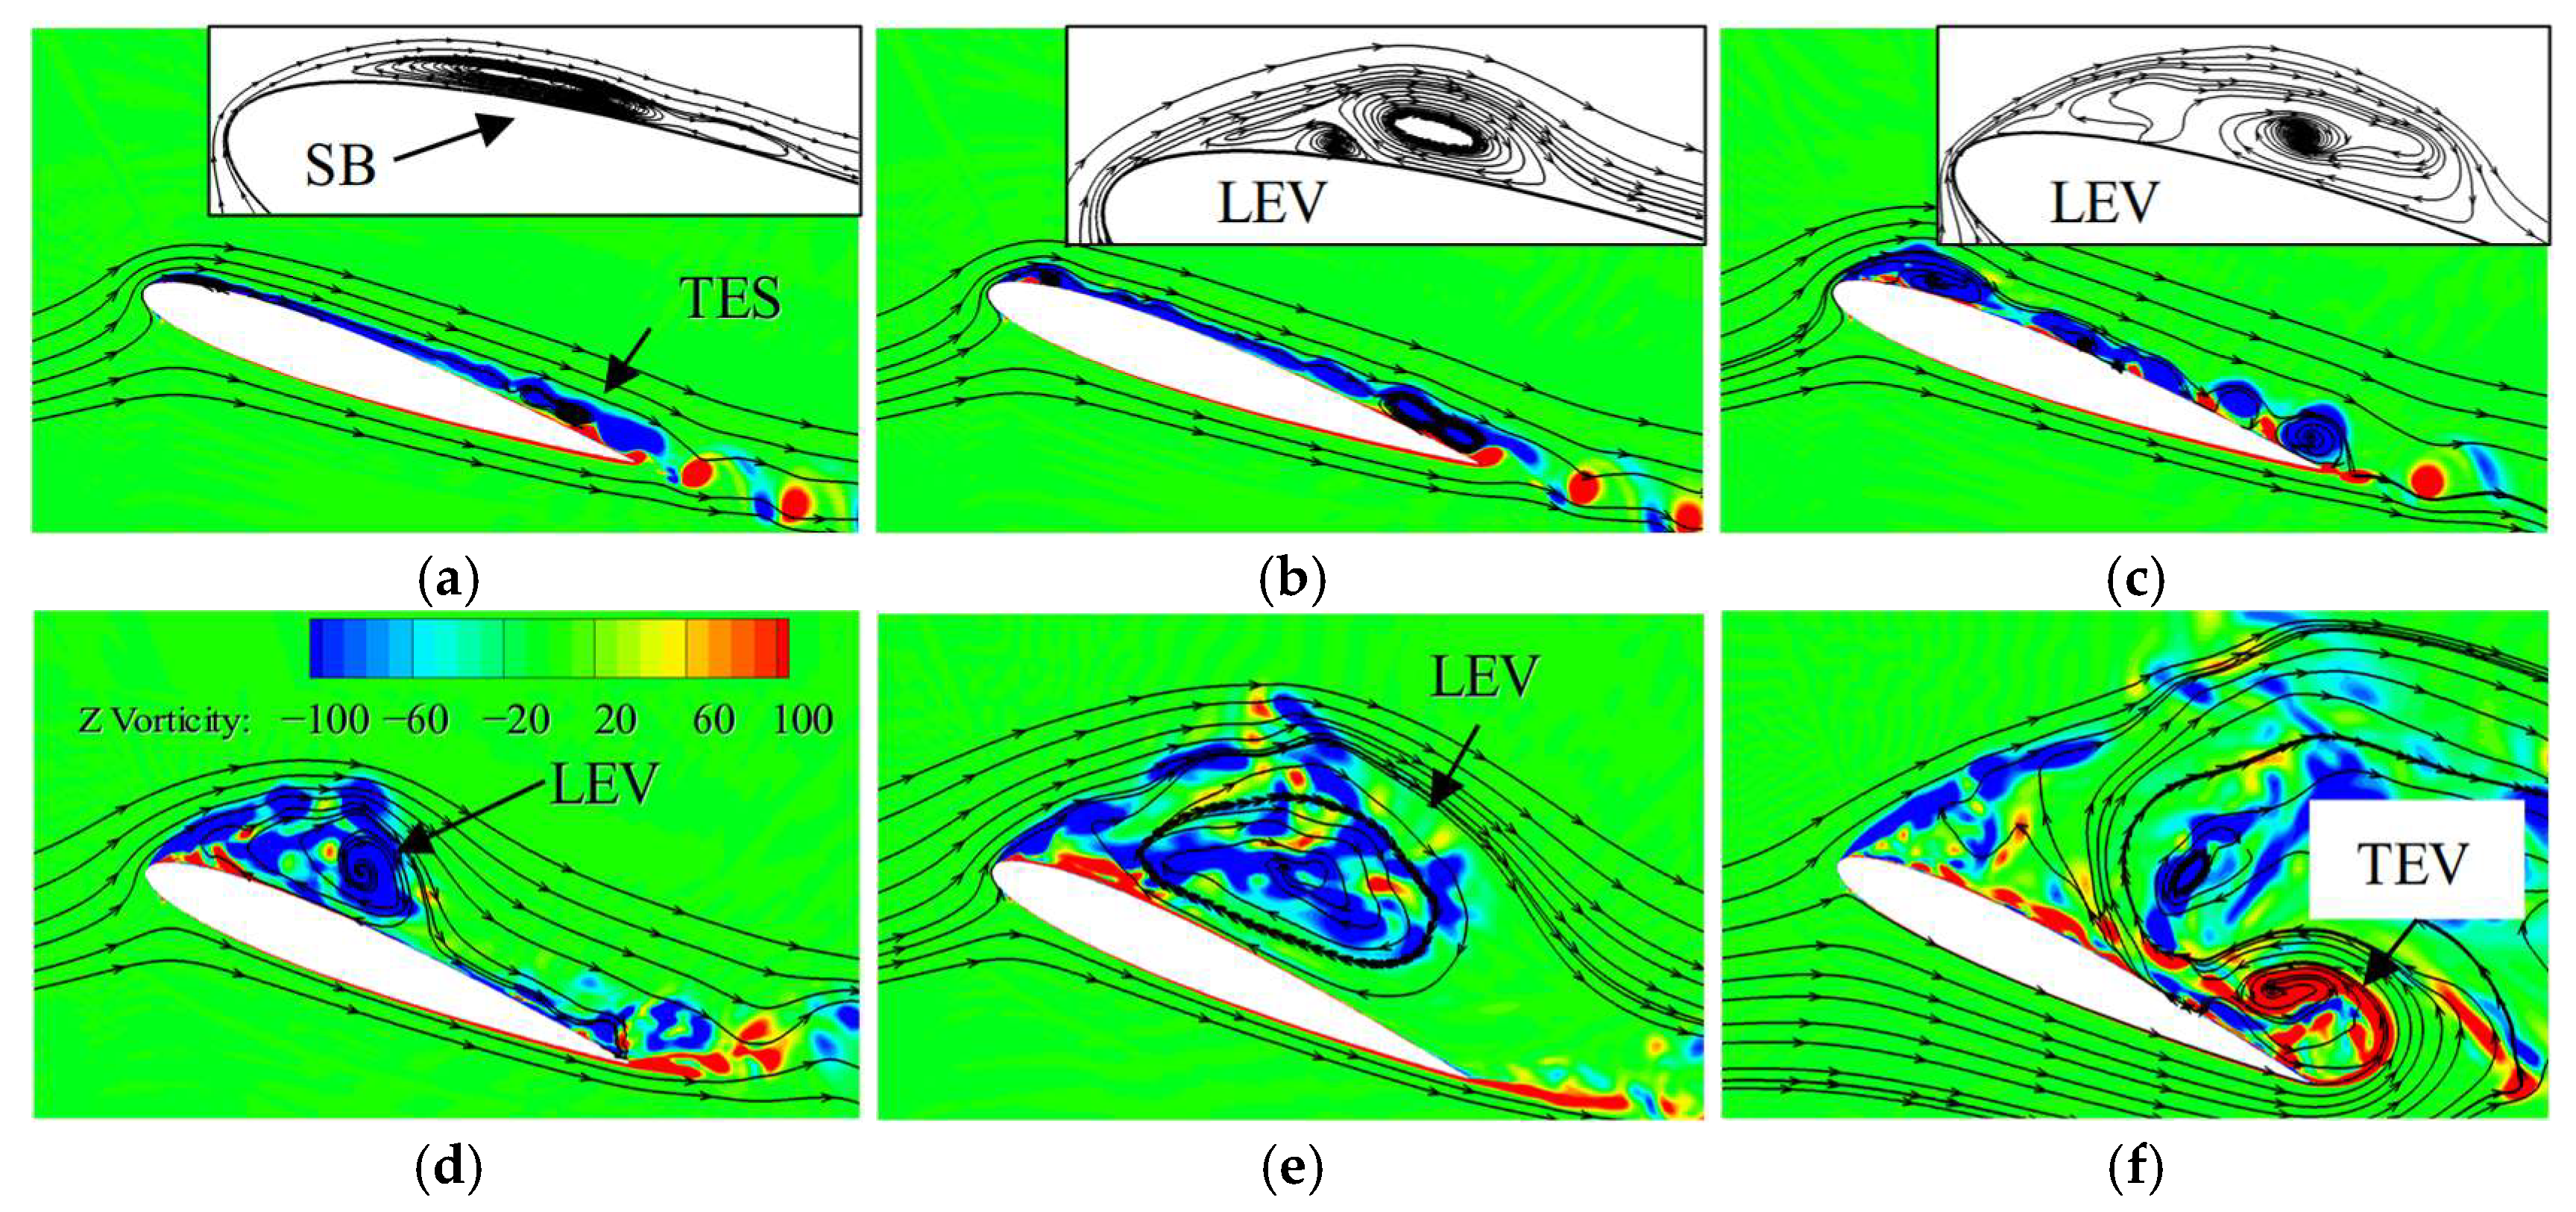
Figure 11 shows streamlines and z-vorticity contours for the center section in the pitching-up stage. At an AoA of 19.12°, a separation bubble (SB) forms near the leading edge. At the same time, multiple separation vortices are observed near the trailing edge, forming the trailing edge separation. These vortices induce pressure perturbations and pre-stall moment coefficient fluctuations (Figure 6c). The subsequent downstream convection and structural evolution of the LEV are detailed in Figure 11b–e, revealing a compact vortex structure. At the maximum AoA (Figure 11f), the presence of the TEV causes the upward displacement and subsequent breakdown of the LEV.
Figure 12 illustrates the pressure coefficient distribution along the upper airfoil surface at AoAs of 23.71° and 24.79° during the pitch-up maneuver. The chordwise pressure distribution demonstrates near-uniform characteristics, which can be attributed to flow separation induced by LEV shedding. As the maximum AoA is attained, a distinct low-pressure region develops near the trailing edge. This phenomenon is associated with the TEV, as clearly demonstrated in Figure 11f, and corresponds to the load fluctuation labeled ‘a’ in Figure 6. The low-pressure region induced by the TEV contributes to significant variations in the moment coefficient, primarily due to the considerable moment arm.
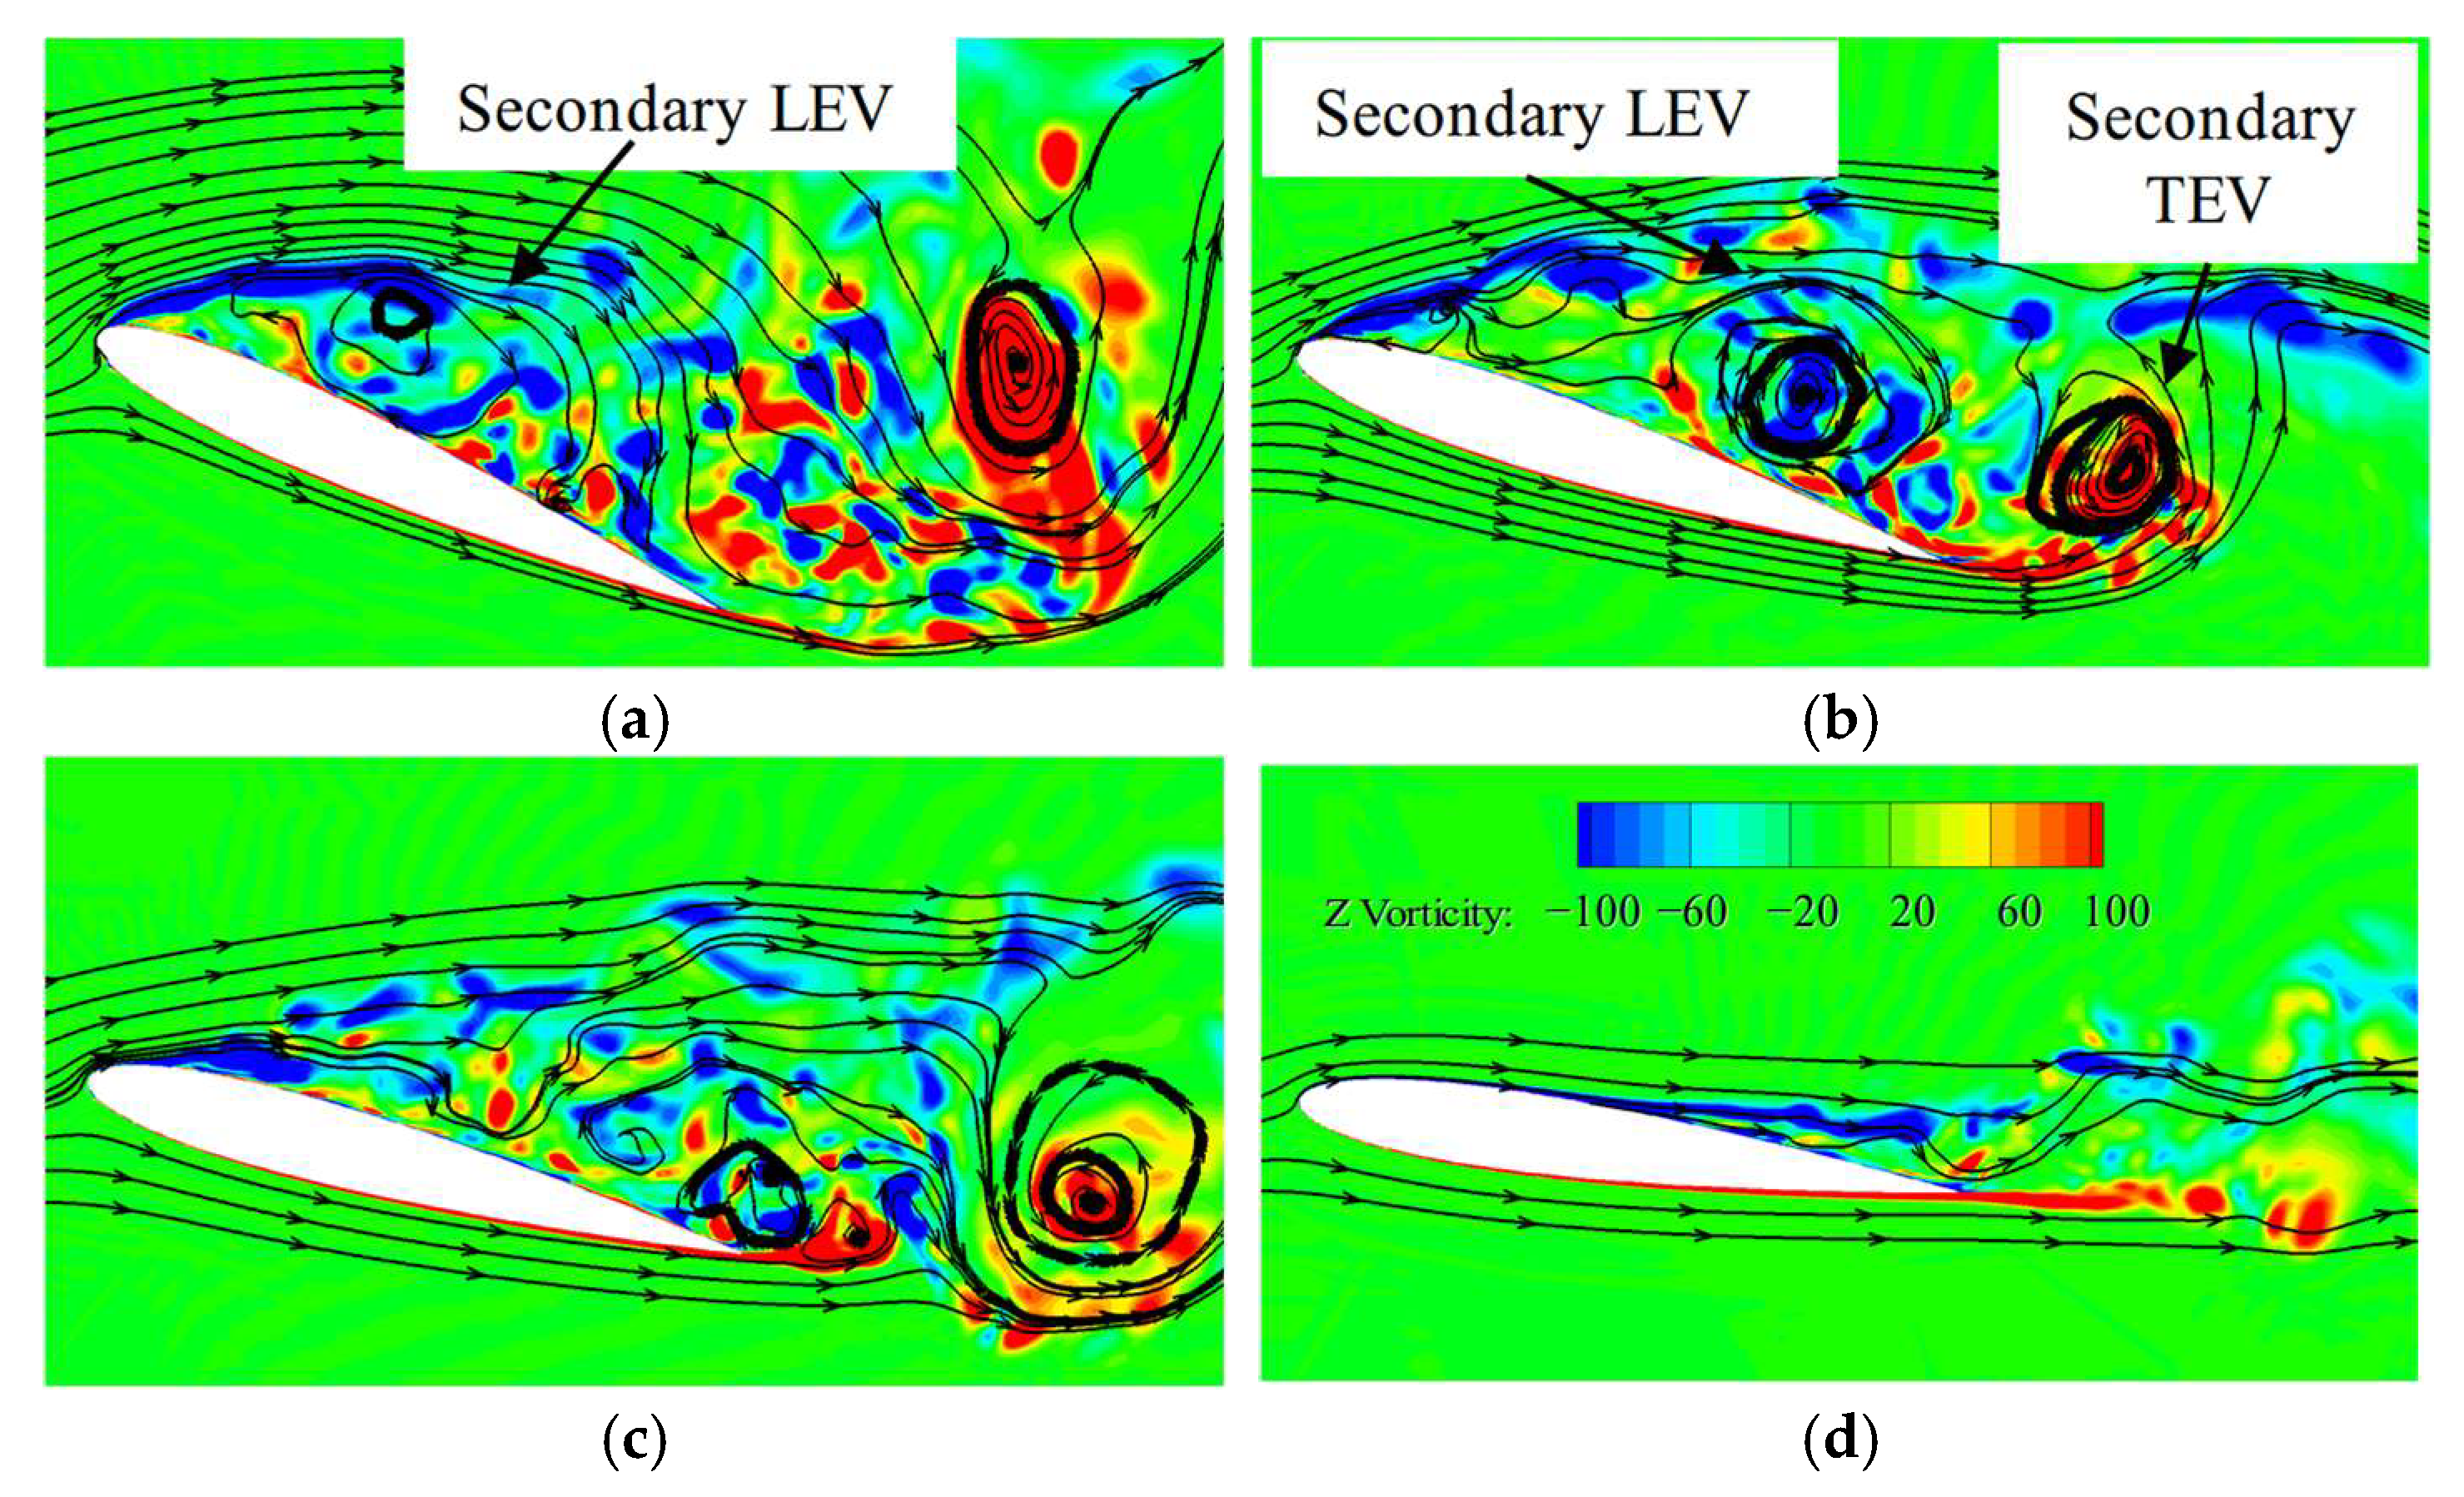
Following the shedding of the LEV and TEV, the formation of secondary vortices is observed in Figure 13. The secondary LEV undergoes evolution and downstream transportation, generating a low-pressure region illustrated in Figure 14a. This phenomenon is closely associated with the airload fluctuation marked as ‘b’ in Figure 6. The secondary TEV also induces a low-pressure area near the trailing edge. Additionally, the secondary TEV induces a low-pressure area near the trailing edge. During the pitching-down motion, flow reattachment gradually occurs, as shown in Figure 13d and Figure 14b.

3.3. Damping and Stability at Ma = 0.283

For helicopter rotor, torsional stability is tightly associated with aerodynamic damping. If the damping is negative, this would tend to promote stall flutter. Two methods are employed to evaluate the pitching stability: cycle-averaged and time-resolved aerodynamic damping. The cycle-averaged aerodynamic damping coefficient, Ξcycle [38], is defined as
Ξ c y c l e = 1 π α a 2 C m   d α
where αa denotes the pitching amplitude. The damping is positive when it corresponds to a counterclockwise loop in the Cm versus α curve.
A time-resolved aerodynamic damping coefficient Ξ(t) is defined by Bowles et al. [39],
Ξ ( t ) = 1 α a ( C ˜ m cos ω t C m sin ω t ) = C m 2 + C ˜ m 2 α a sin tan 1 C ˜ m C m ω t
where C ˜ m is obtained using the integral Hilbert transform of Cm.
Figure 15 presents the cycle-averaged and time-resolved damping, along with the AoA and moment coefficients. The positive cycle-averaged damping indicates that the airfoil’s oscillatory motion tends to stabilize, and the likelihood of stall flutter is low. Compared with the cycle-averaged damping, time-resolved damping is able to reveal transient stability. The figure shows that the aerodynamic damping is positive when the airfoil’s AoA is at its minimum. Due to stall delay caused by the pitching motion, the moment coefficient exhibits little variation as the AoA increases. Consequently, the aerodynamic damping gradually decreases and turns negative. During the moment stall stage, a significant increase in the nose-down moment occurs, accompanied by rising damping. This indicates that the downstream convection of the DSV positively contributes to the stability of the pitching motion. Conversely, during the pitching-down stroke, a secondary DSV forms, and its convection along the airfoil surface reduces both the nose-up moment and aerodynamic damping.

3.4. Effect of Reduced Frequency at Ma = 0.283

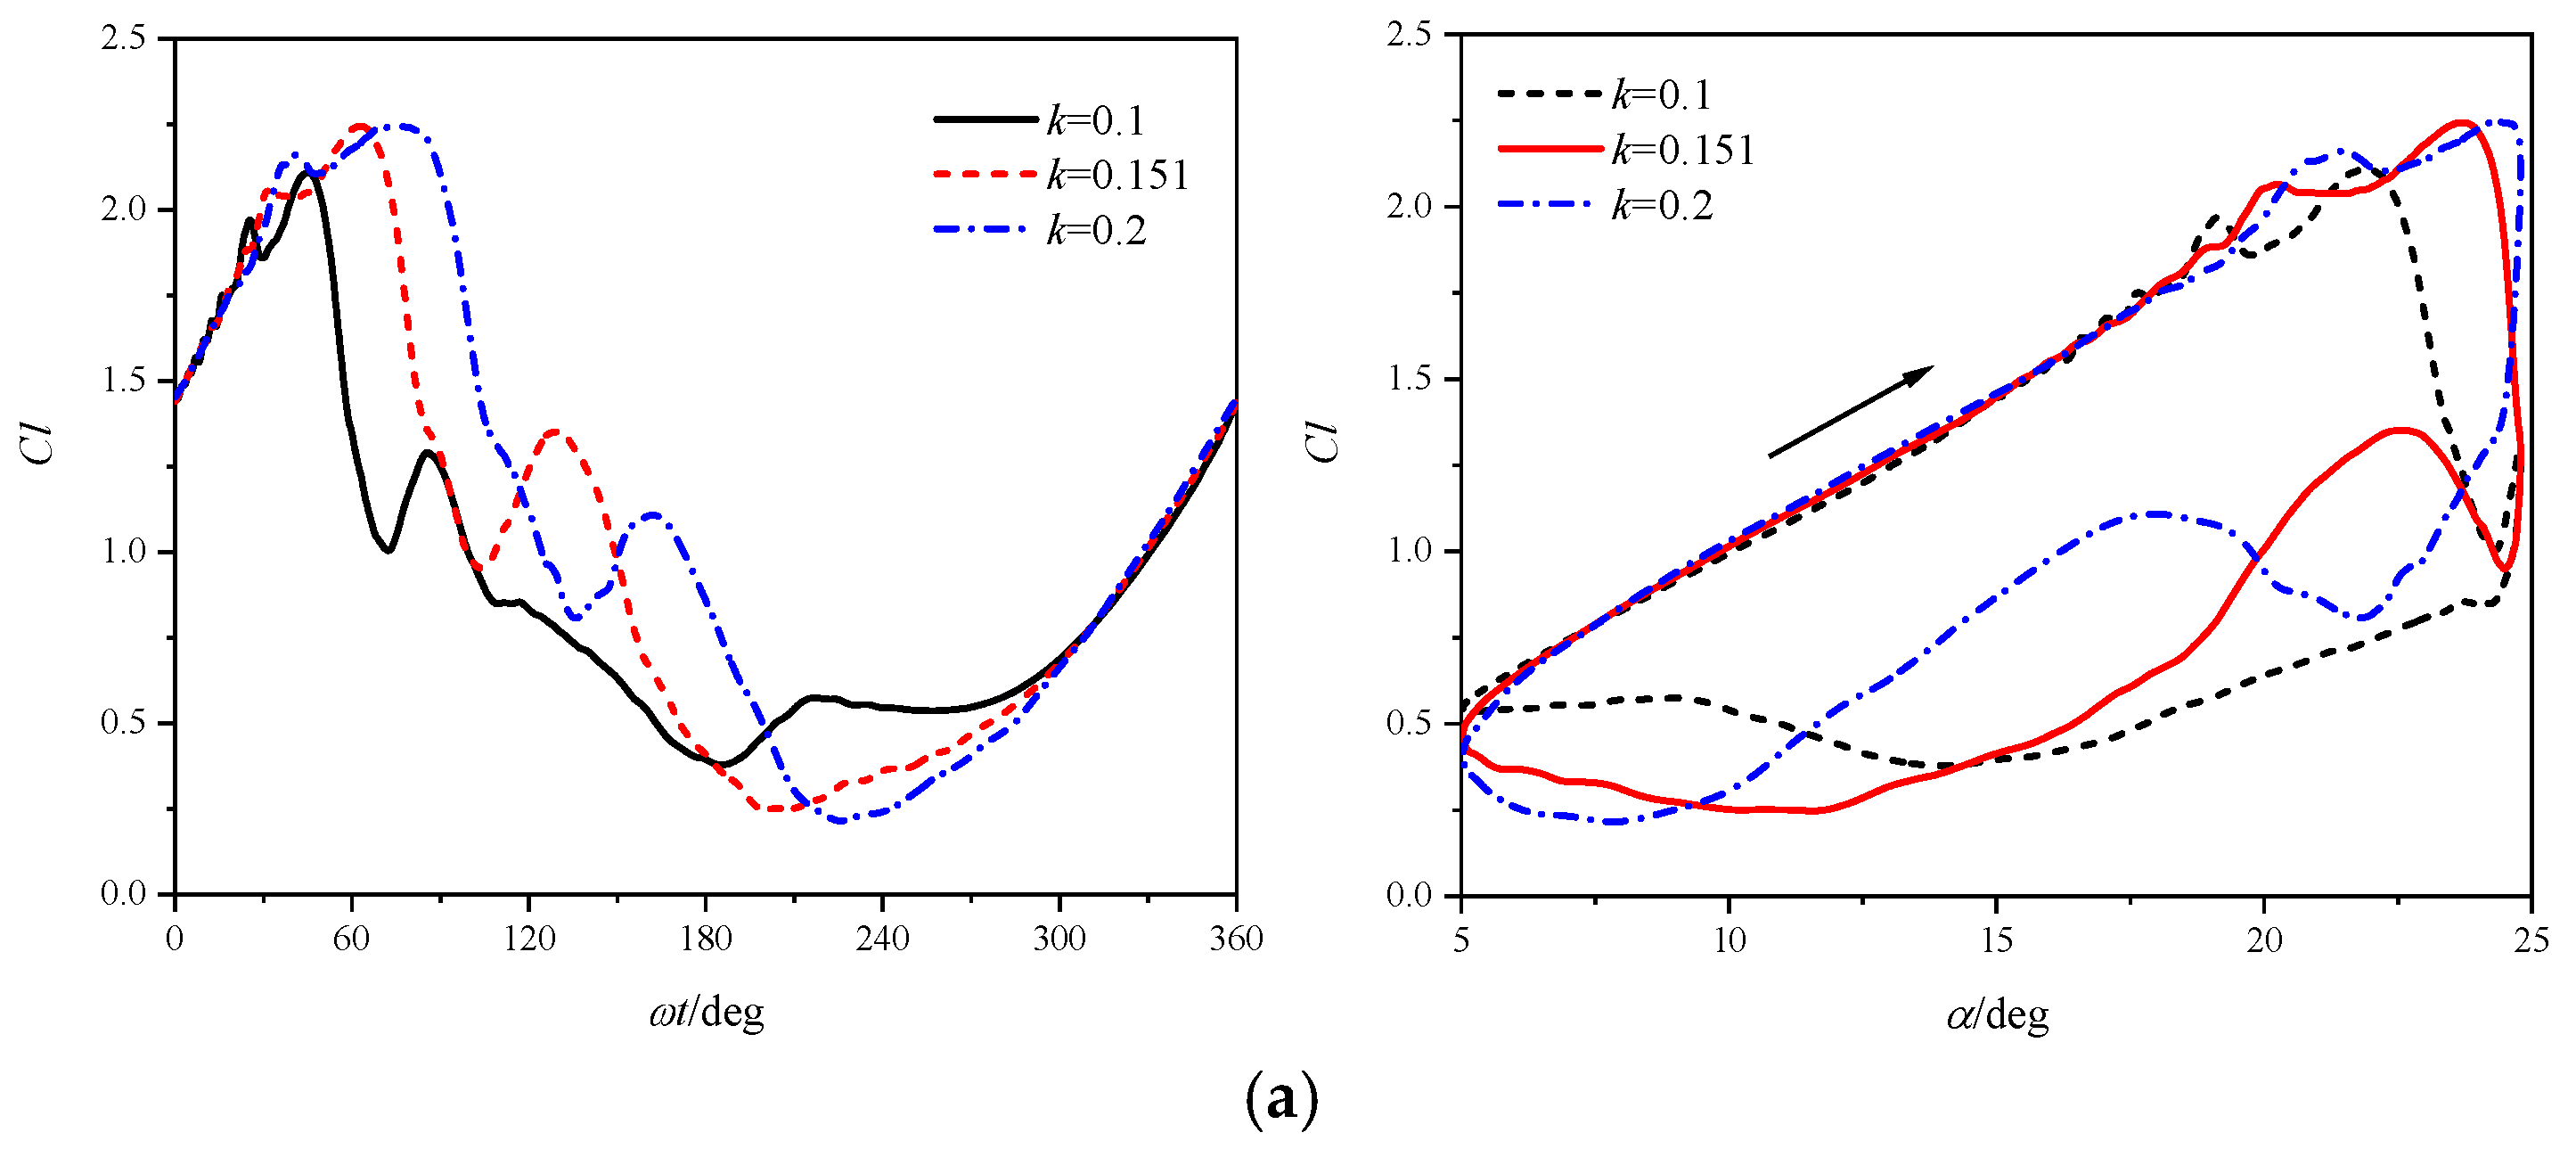
Figure 16 shows the airfoil aerodynamic coefficients at reduced frequencies of k = 0.1, 0.151, and 0.2. To facilitate comparative analysis, the figure includes curves illustrating the coefficient variations with AoA and azimuth angle. The oscillating airfoils at all three frequencies encounter deep stall, characterized by dramatic post-stall airload variations indicative of leading-edge stall behavior.
Notably, increasing the reduced frequency shifts the stall and reattachment stages to larger azimuth angles. In the attached flow stage, higher k amplifies the AoA change rate at equivalent angles, enhancing camber effects and consequently increasing lift, drag, and nose-down moment coefficients. Moreover, increased k significantly delays landmark aerodynamic events, including lift stall, moment stall, drag divergence, TEV, secondary DSV, and flow reattachment. Concurrently, this is accompanied by enhanced peaks in lift, drag, and nose-down moment, suggesting the emergence of stronger DSV structures.
Figure 17 illustrates suction surface pressure coefficients during the airfoil’s pitching-up stage at different reduced frequencies. Increasing the reduced frequency delays typical aerodynamic events, including suction peak collapse and the formation, convection, and shedding of DSV. Analysis of the local negative pressure region induced by DSV shows that higher reduced frequencies yield a more pronounced region, signifying stronger DSV influence on the airfoil. Notably, as the reduced frequency increases, the airfoil attains the maximum negative pressure peak at a larger AoA. Despite this shift, the peak magnitudes of negative pressure remain consistent across different reduced frequencies, further confirming that the increased lift overshoot amplitude stems primarily from enhanced DSV strength associated with higher k values.
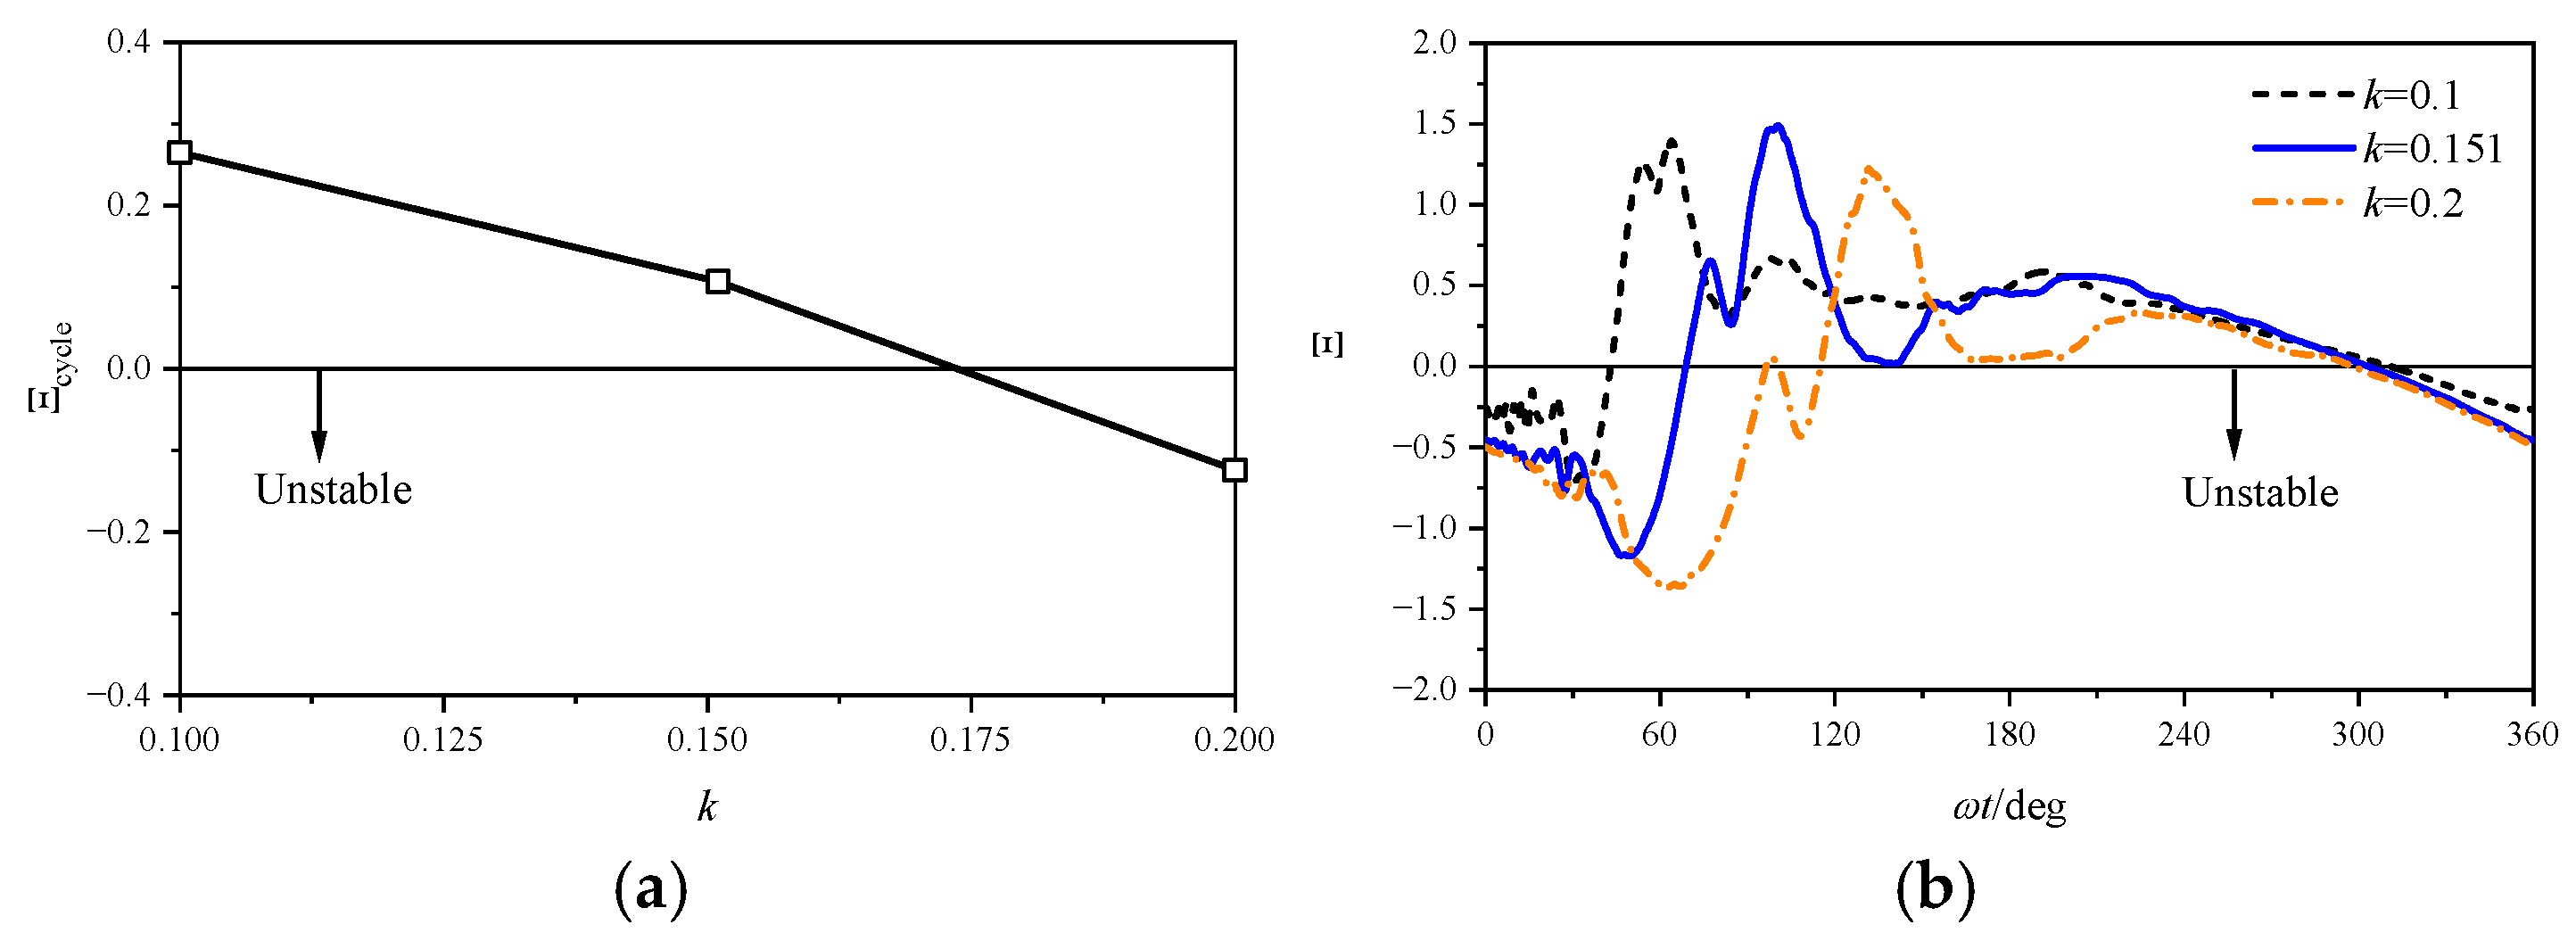
Figure 18 presents the cycle-averaged and time-resolved aerodynamic damping of an oscillating airfoil at different reduced frequencies. As k increases, the cycle-averaged damping decreases, turning negative when k = 0.2. Analysis of the transient damping curves reveals that with increasing k, the damping reduction stage prolongs attributed to delayed stall onset and DSV formation, yielding a more pronounced negative damping peak. Concurrently, the subsequent damping recovery stage, induced by DSV convection along the airfoil surface, is also delayed. These results indicate that for deep stall at low Mach numbers, the airfoil pitching motion tends to become unstable with the increase in reduced frequency.

4. Aerodynamics at a Mach Number of 0.5

4.1. Aerodynamic Load Response at Ma = 0.5

The aerodynamic characteristics of the pitching NACA 0012 airfoil at a higher Mach number of 0.5 are computed and analyzed. The kinematic parameters, including mean AoA, oscillation amplitude, and pitching frequency, are identical to those in Section 3.1. Correspondingly, the reduced frequency and Reynolds number at the high Mach number are 0.085 and 6.10 × 10⁶, respectively. Figure 19 compares the dynamic airloads at both Mach numbers, along with the static force at Ma = 0.5. As shown in Figure 19a, at Ma = 0.5, the airfoil experiences lift stall at a significantly lower AoA of 15.4° compared to the lift stall angle of 23.7° at Ma = 0.283. By comparing Figure 19 and Figure 6, a similar but less pronounced delay (6.4°) between dynamic and static stall is observed at Ma = 0.5. The peak values of lift, drag, and pitching moment all show a notable decrease as the Mach number increase from 0.283 to 0.5. Additionally, post-stall aerodynamic loads exhibit more moderate variations. These differences indicate changes in dynamic stall behavior under the compressibility effects of high Mach numbers.
Figure 20 depicts the temporal evolution of aerodynamic force coefficients, alongside their corresponding frequency spectra. Similarly to the case at Ma = 0.283, the fluctuations of force coefficients at Ma = 0.5 are primarily governed by the airfoil pitching frequency (k = 0.085). Additionally, the frequency spectra reveal notable harmonic components. Specifically, the third harmonic frequency (k = 0.256) is clearly discernible, with amplitudes amounting to approximately 36%, 16%, and 32% of the fundamental frequency for the lift, drag, and pitching moment coefficients, respectively.

4.2. Flowfield Feature at Ma = 0.5

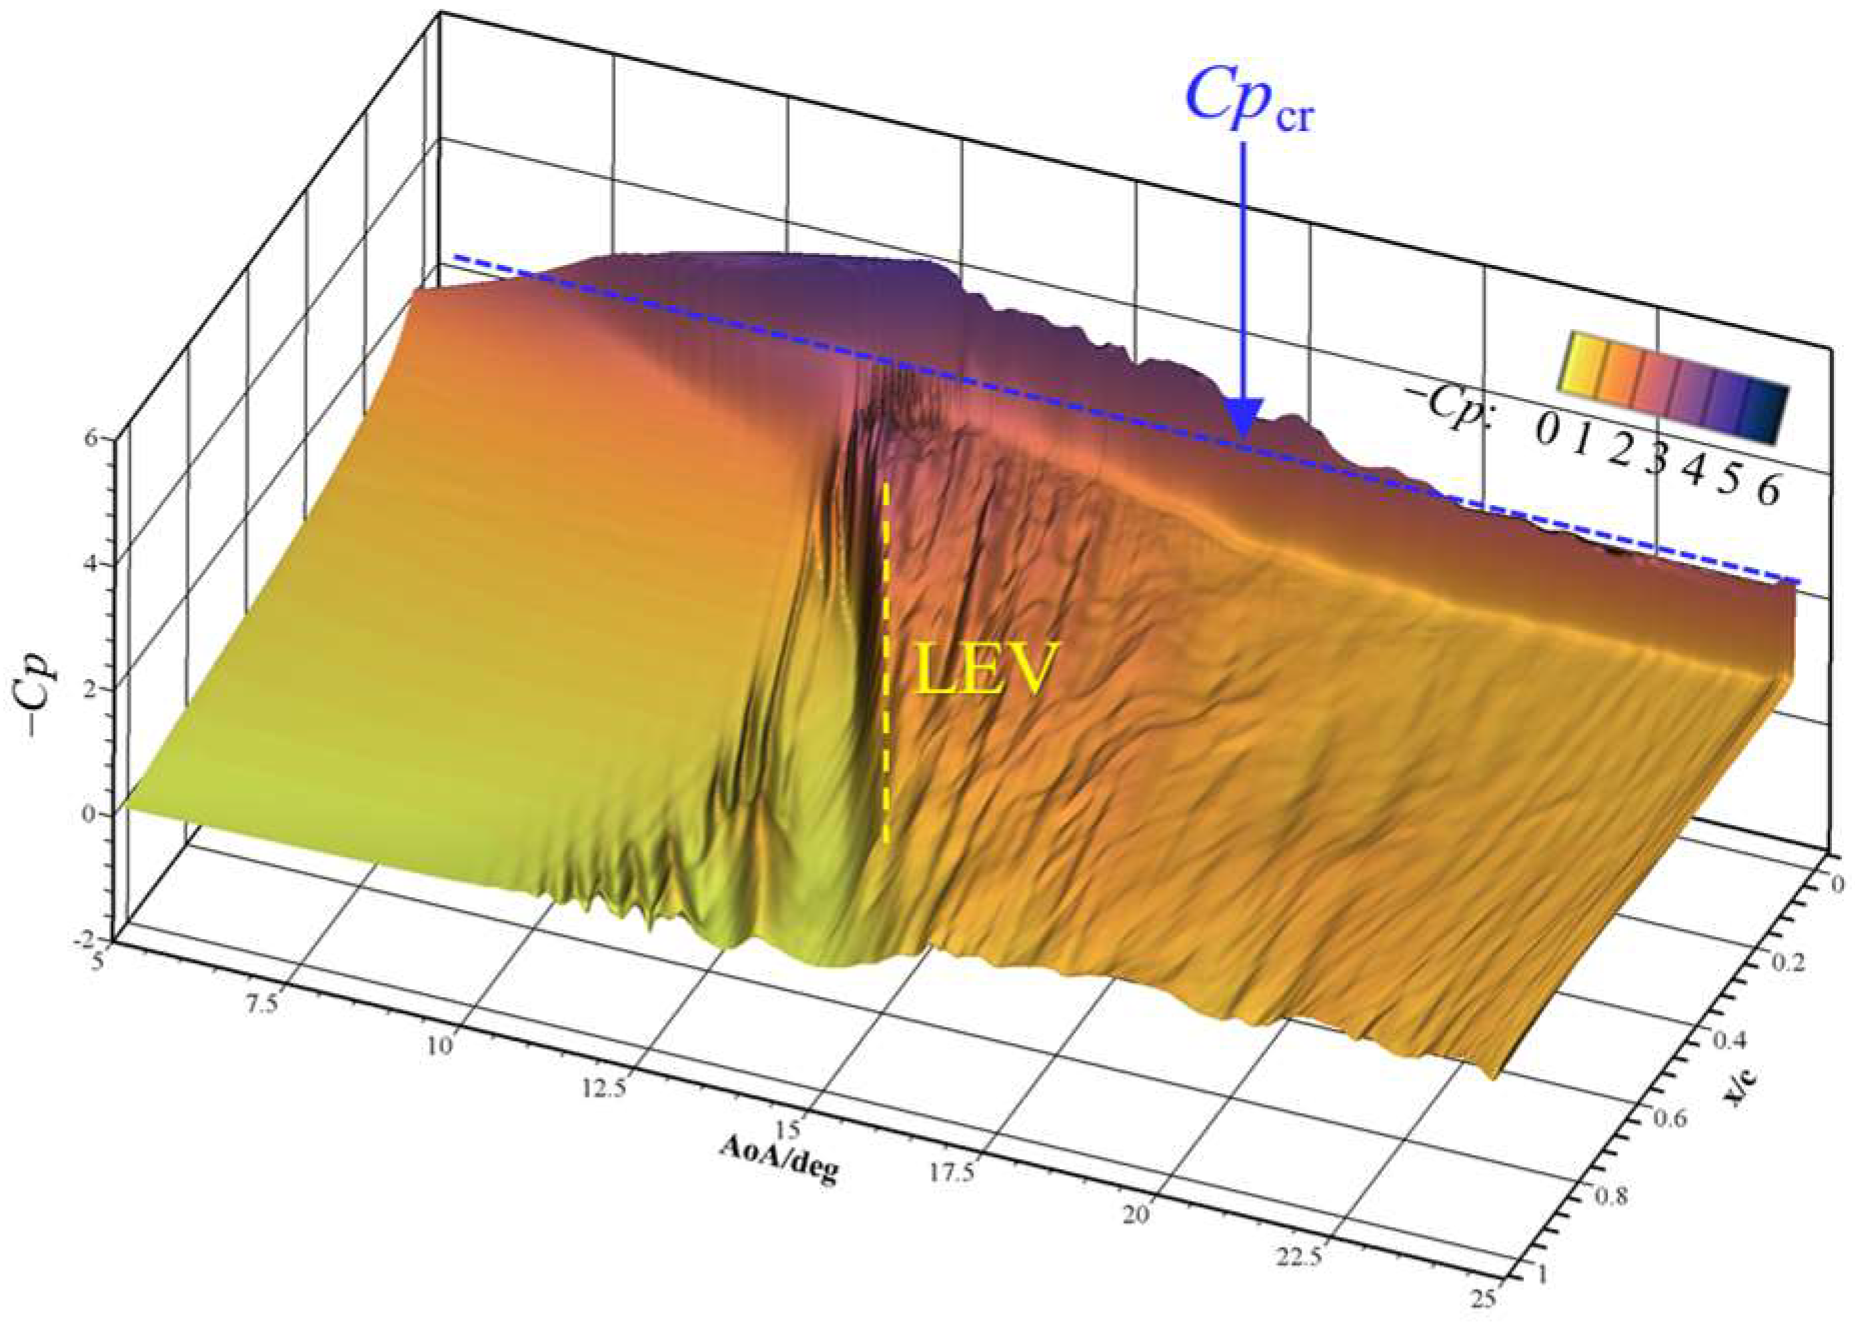
Figure 21 presents the spanwise-averaged pressure coefficient distribution on the airfoil suction surface in the pitching-up circle. The critical pressure coefficient (Cpcr) is also indicated in the figure. The results show that the airfoil experiences strong compressibility effects. The evolution of pressure contours reflects three aerodynamic events: TES, LEV development, and the progressive reduction in the suction peak. A comparative analysis of Figure 21 and Figure 8 suggests significant compressibility effects on stall vortex characteristics. At a low Mach number of 0.283, the LEV influences the pressure field with high intensity and a concentrated zone. In contrast, at a high Mach number of 0.5, the LEV exhibits weaker intensity and a dispersed area in its effect on the airfoil’s pressure field. This further demonstrates that the LEV behaves differently under strong compressibility effects.
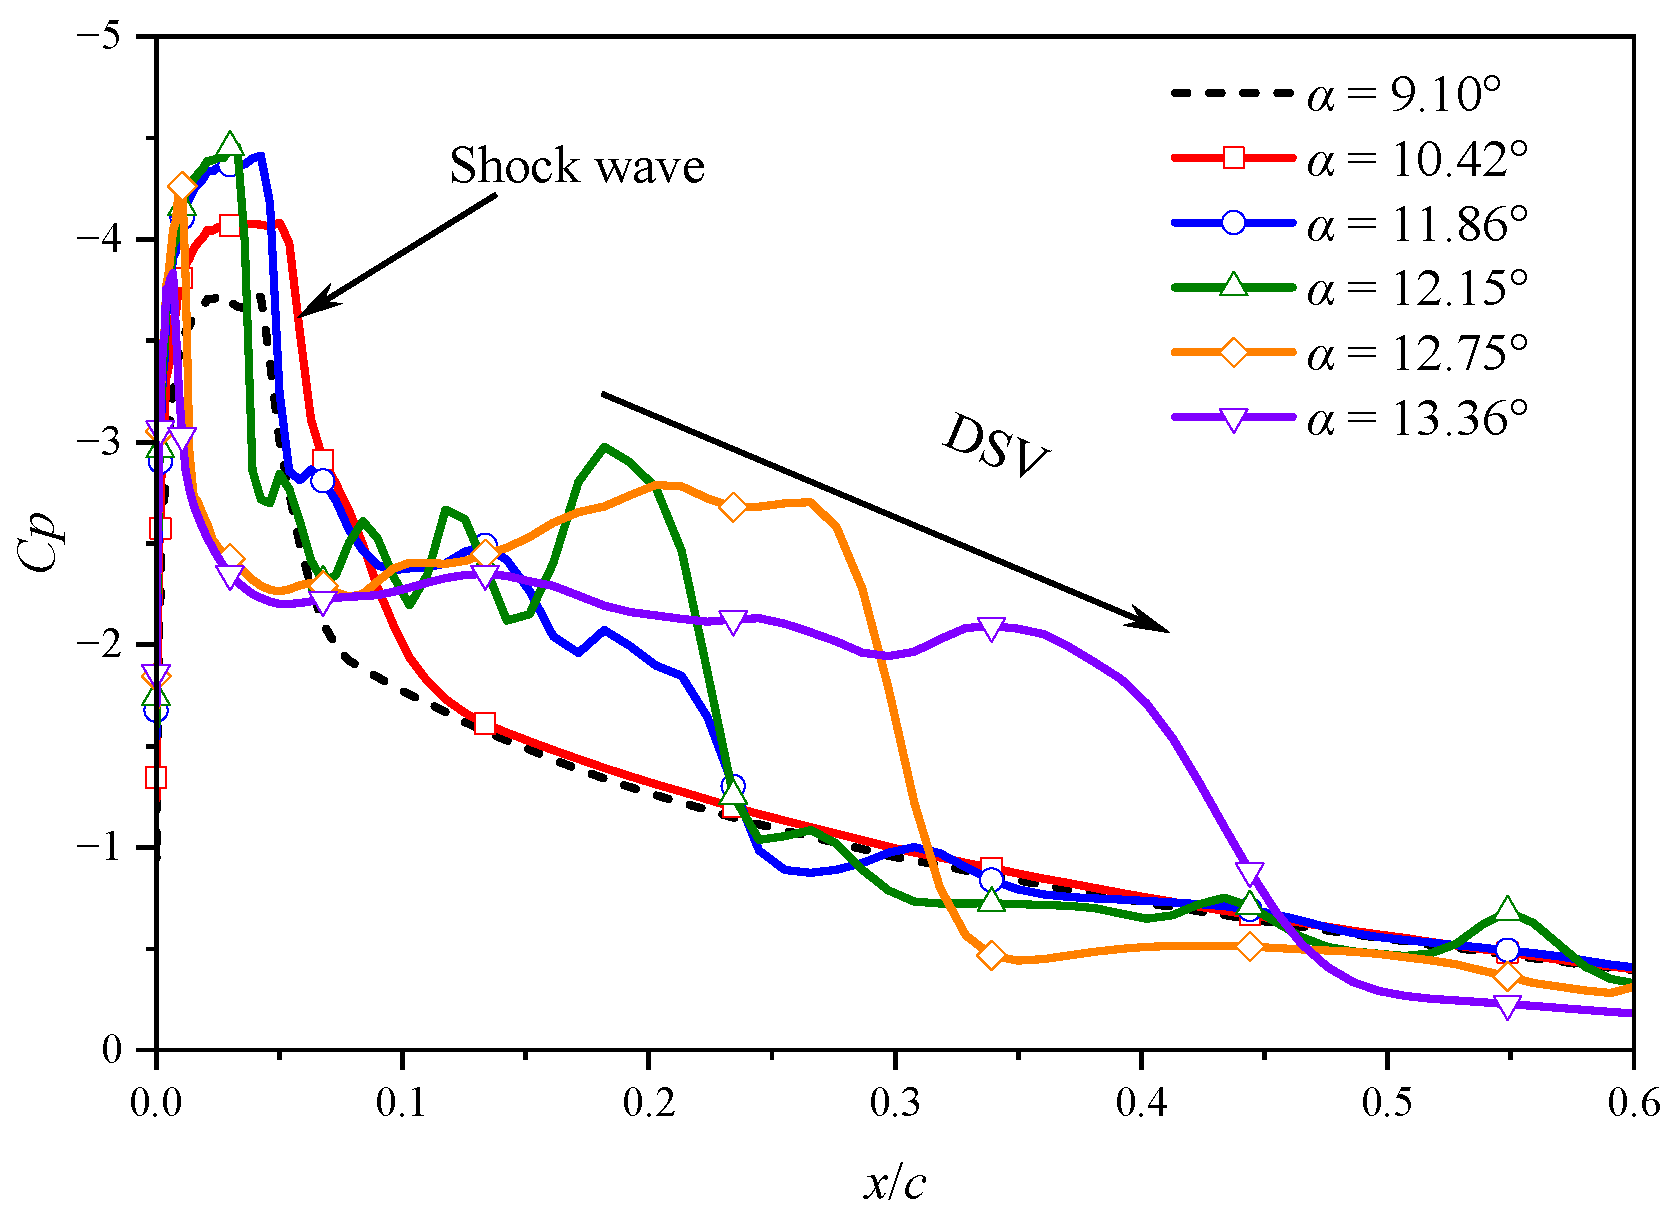
Figure 22 shows pressure coefficients at various AoAs indicates that a shock wave forms near the leading edge at α = 9.10°. As the AoA increases to 10.42°, the shock wave strengthens and moves downstream. Conversely, a further increase in AoA causes upstream shock migration, accompanied by significant pressure fluctuations and pressure reduction in the post-shock region, indicating shock-induced separation. As the AoA reaches 12.15°, a pronounced low-pressure region is observed, which results from the LEV formation. Gradual expansion of the region with increasing AoA suggests both vortex growth and downstream convection. Concurrently, the shock wave progressively dissipates.
Figure 23 presents the vorticity field and streamlines in the center cross-section during the pitching-up motion, providing detailed insights into the stall development process. The flowfield evolution is divided into two stages: the moment stall stage (Figure 23a–d) and the lift stall stage (Figure 23e–i). During the former stage, a sequence of vortices forms near the leading edge and then moves downstream, inducing low-pressure regions, as shown in Figure 21. In the subsequent lift stall stage, constant small vortices shed from the airfoil suction surface, leading to circulation loss. This phenomenon differs from the rapid shedding of a large LEV observed at the low Mach number of 0.283. The slow airload variations beyond stall at the high Mach number of 0.5 can be attributed to the gradual suction loss and circulation reduction associated with the constant shedding of small vortices. Additionally, the development of a TEV is clearly identified in Figure 23h,i.

4.3. Damping and Stability at Ma = 0.5

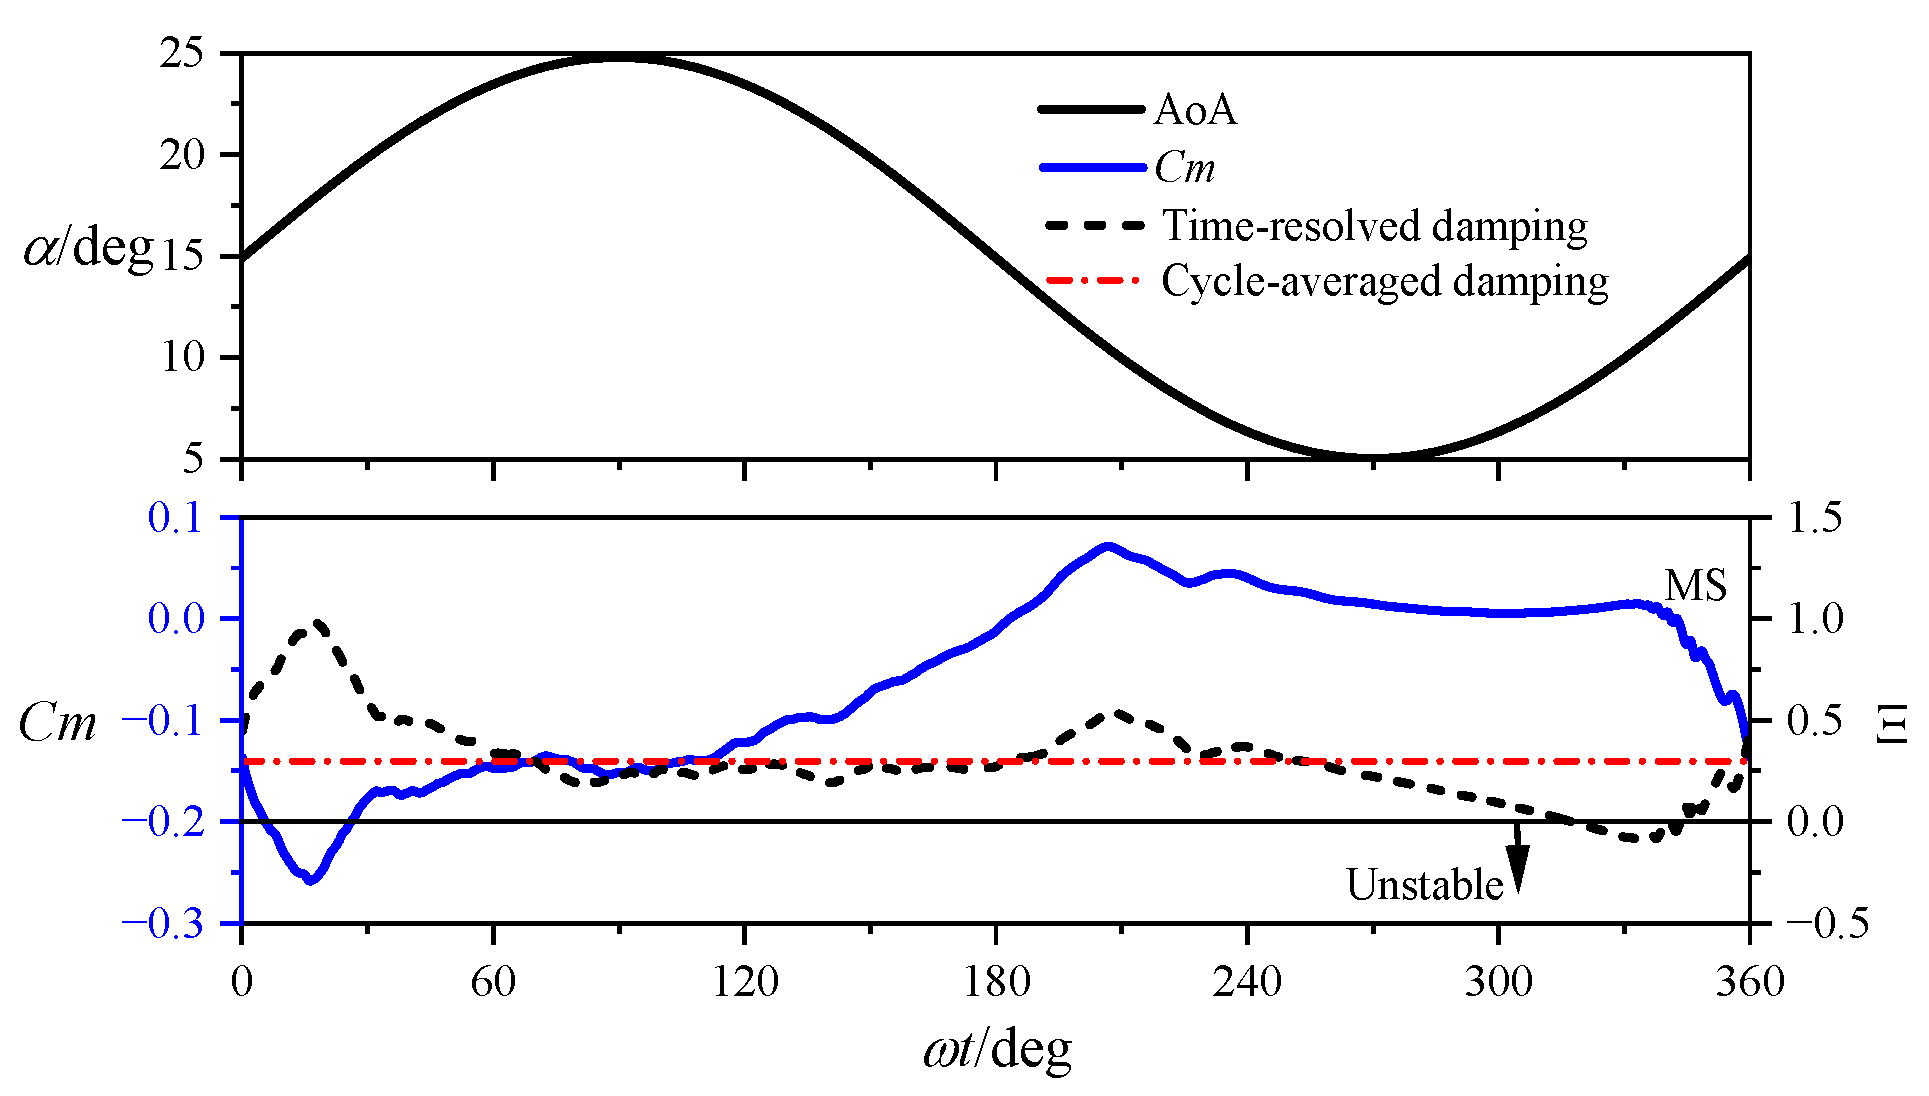
The moment coefficients at Ma = 0.5, shown in Figure 19c, exhibit a counterclockwise hysteresis loop without crossover, indicating a positive cycle-averaged damping. Figure 24 presents the cycle-averaged and time-resolved damping alongside the AoA and moment coefficients. The time-resolved damping gradually decreases during the pitching-up circle and turns negative between α = 8.24° and 12.06°. From the moment stall point, damping begins to increase due to vortex convection. Compared to the low Mach number case, the pitching motion at high Mach number shows greater stability, primarily attributed to two factors: (1) reduced stall delay effects and (2) distinct LEV development characteristics under strong compressibility effects.

4.4. Effect of Reduced Frequency at Ma = 0.5

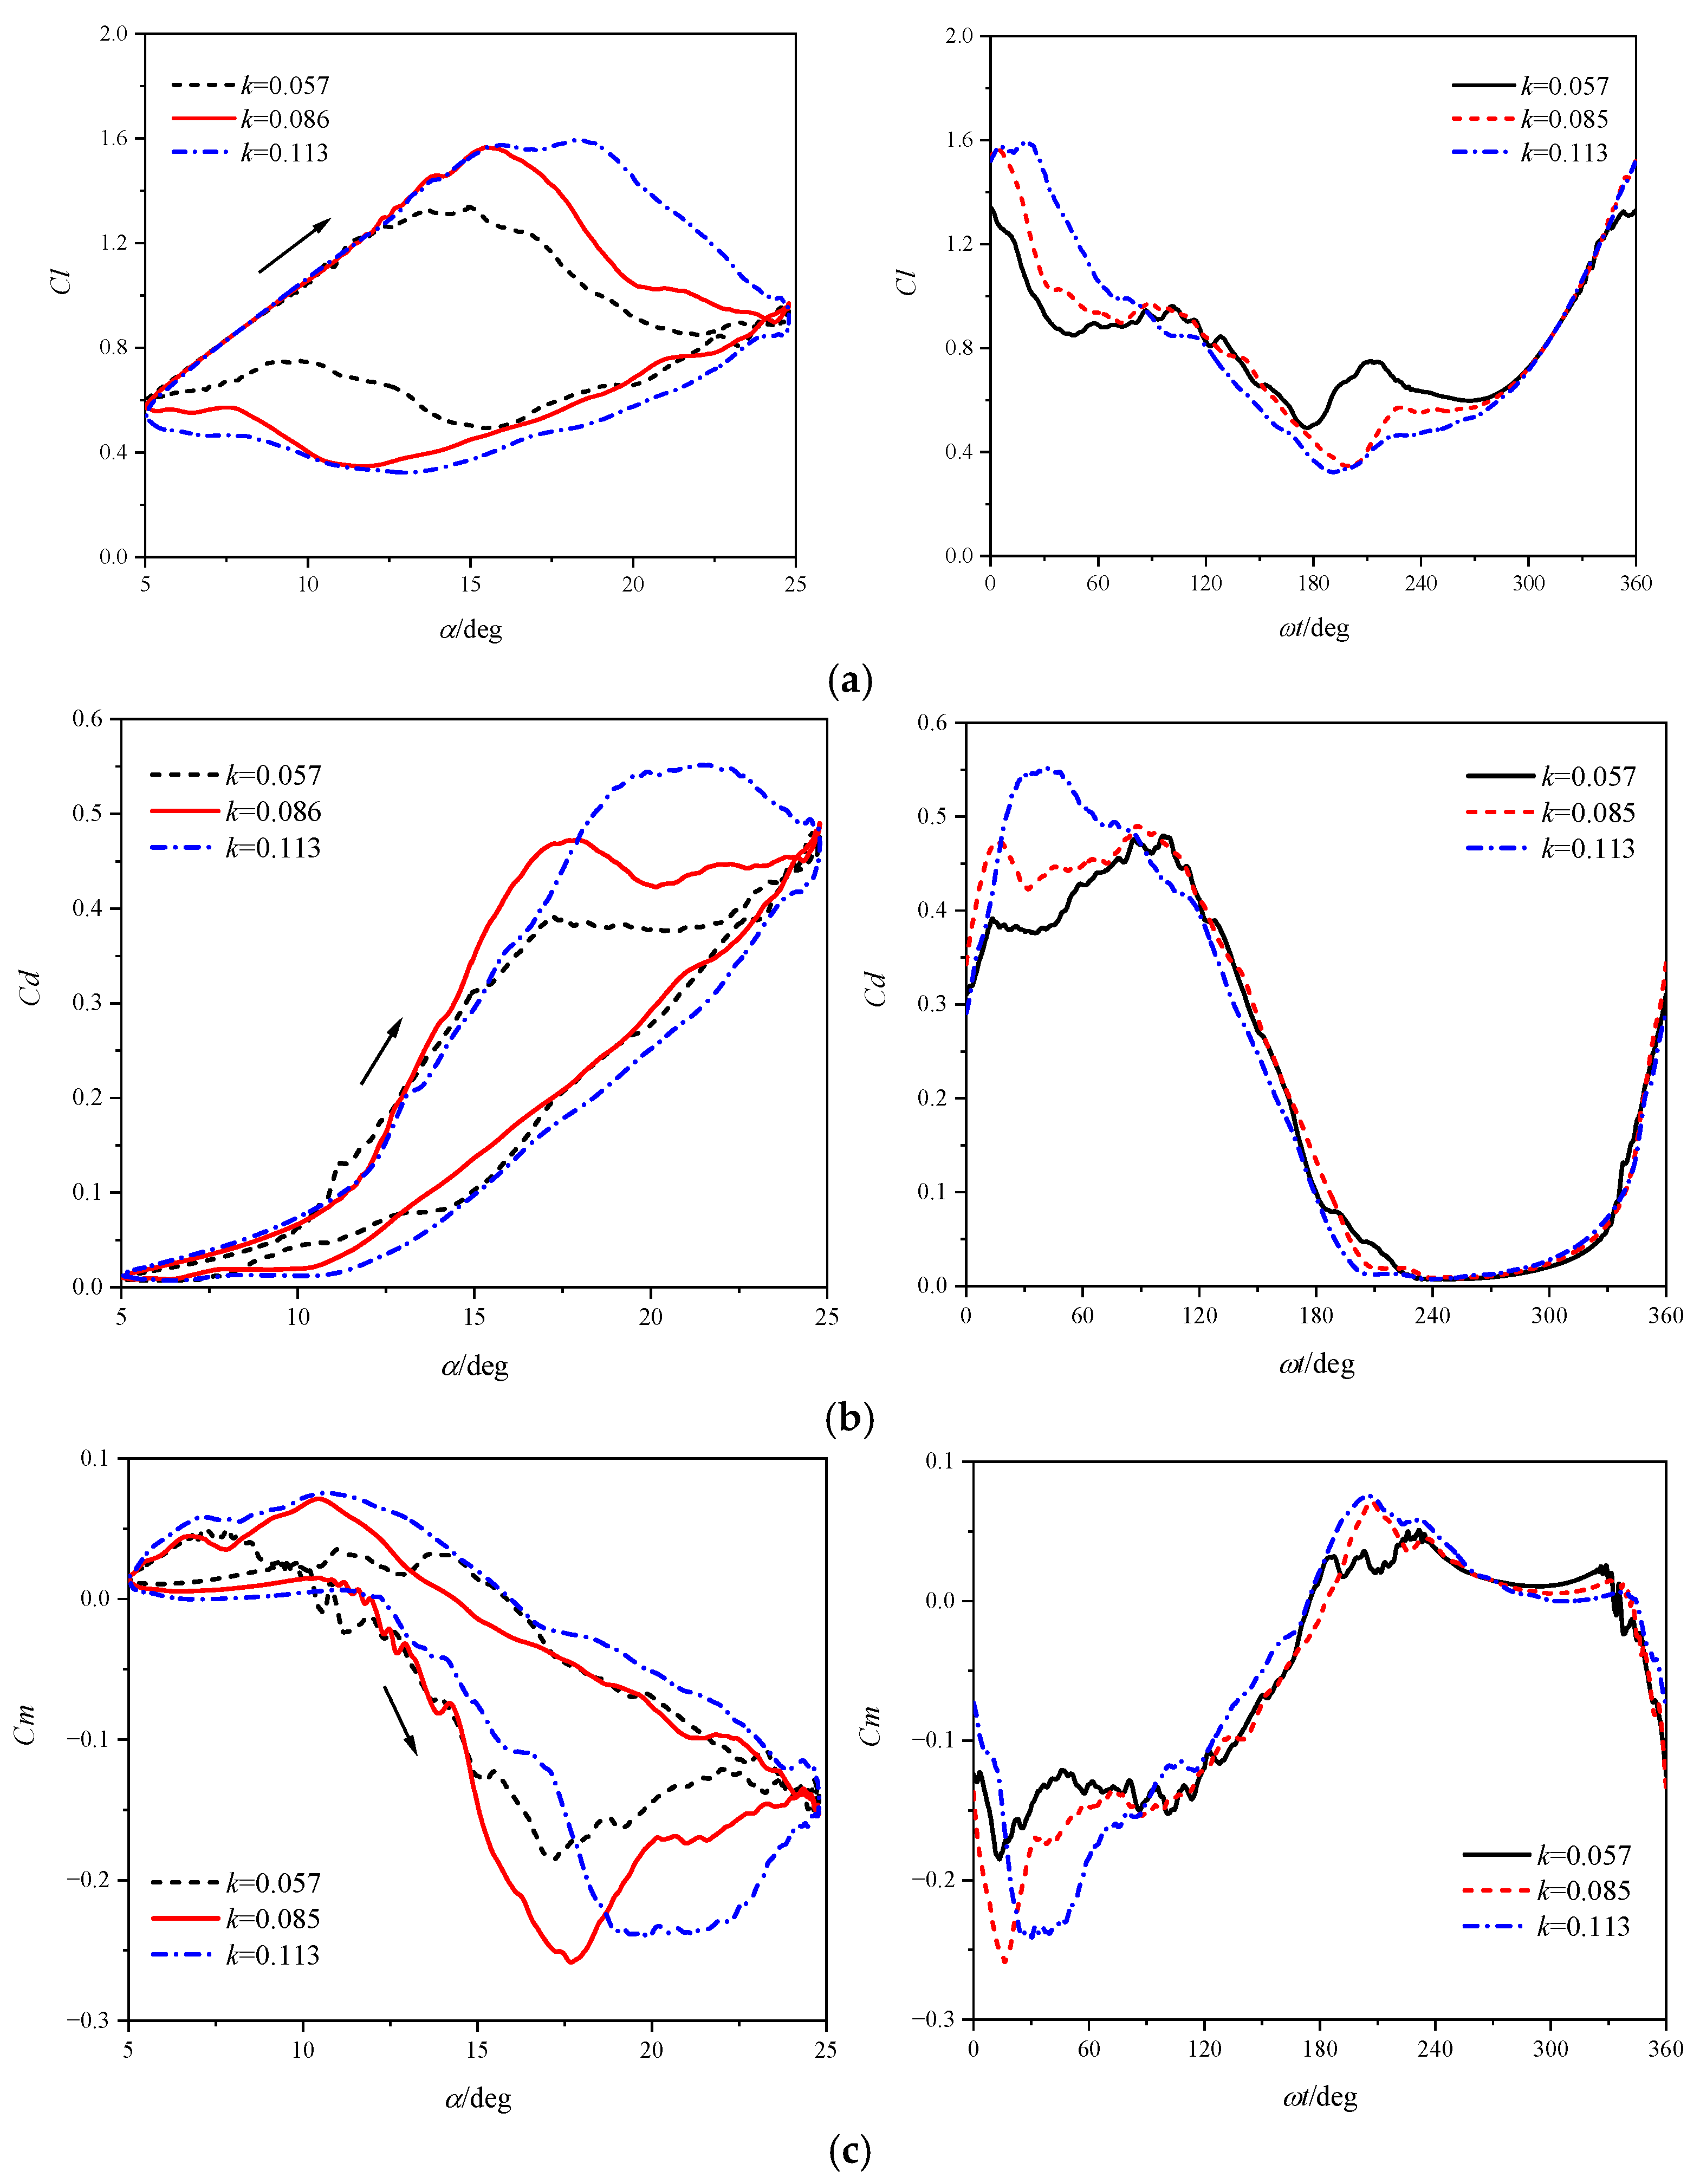
This section discusses the effect of reduced frequency on airfoil dynamic stall characteristics at Ma = 0.5. The airfoil pitching frequency maintains consistent with the Ma = 0.283 case, corresponding to reduced frequencies of k = 0.057, 0.085, and 0.113. Figure 25 presents the airfoil aerodynamic coefficients across varying reduced frequencies. Analysis shows that increasing the reduced frequency delays lift stall, drag divergence, and moment stall, while enhancing the hysteresis of aerodynamic forces. Notably, compared to the Ma = 0.283 case, the influence of reduced frequency is less pronounced at the current Mach number. After stall onset, the airfoil aerodynamic loads under all reduced frequencies exhibit a gradual variation trend.
Figure 26a depicts pressure coefficients at the airfoil leading edge for k = 0.085 across varying AoAs, while Figure 26b,c illustrate the same at fixed AoAs with different reduced frequencies. Analysis of Figure 26a reveals a leading-edge shock wave that strengthens and moves downstream with increasing AoA, until shock-induced boundary layer separation triggers upstream shock migration.
Observations from Figure 26b,c show that at identical AoAs, increasing k shifts the shock wave closer to the leading edge with reduced intensity. Shock-induced separation first occurs at k = 0.057 when AoA reaches 11.56°. These results indicate that higher reduced frequency delays aerodynamic response, thereby postponing shock-induced separation and stall onset. However, this delaying effect is less pronounced compared to low-Mach cases, highlighting compressibility as the dominant factor at higher Mach numbers.
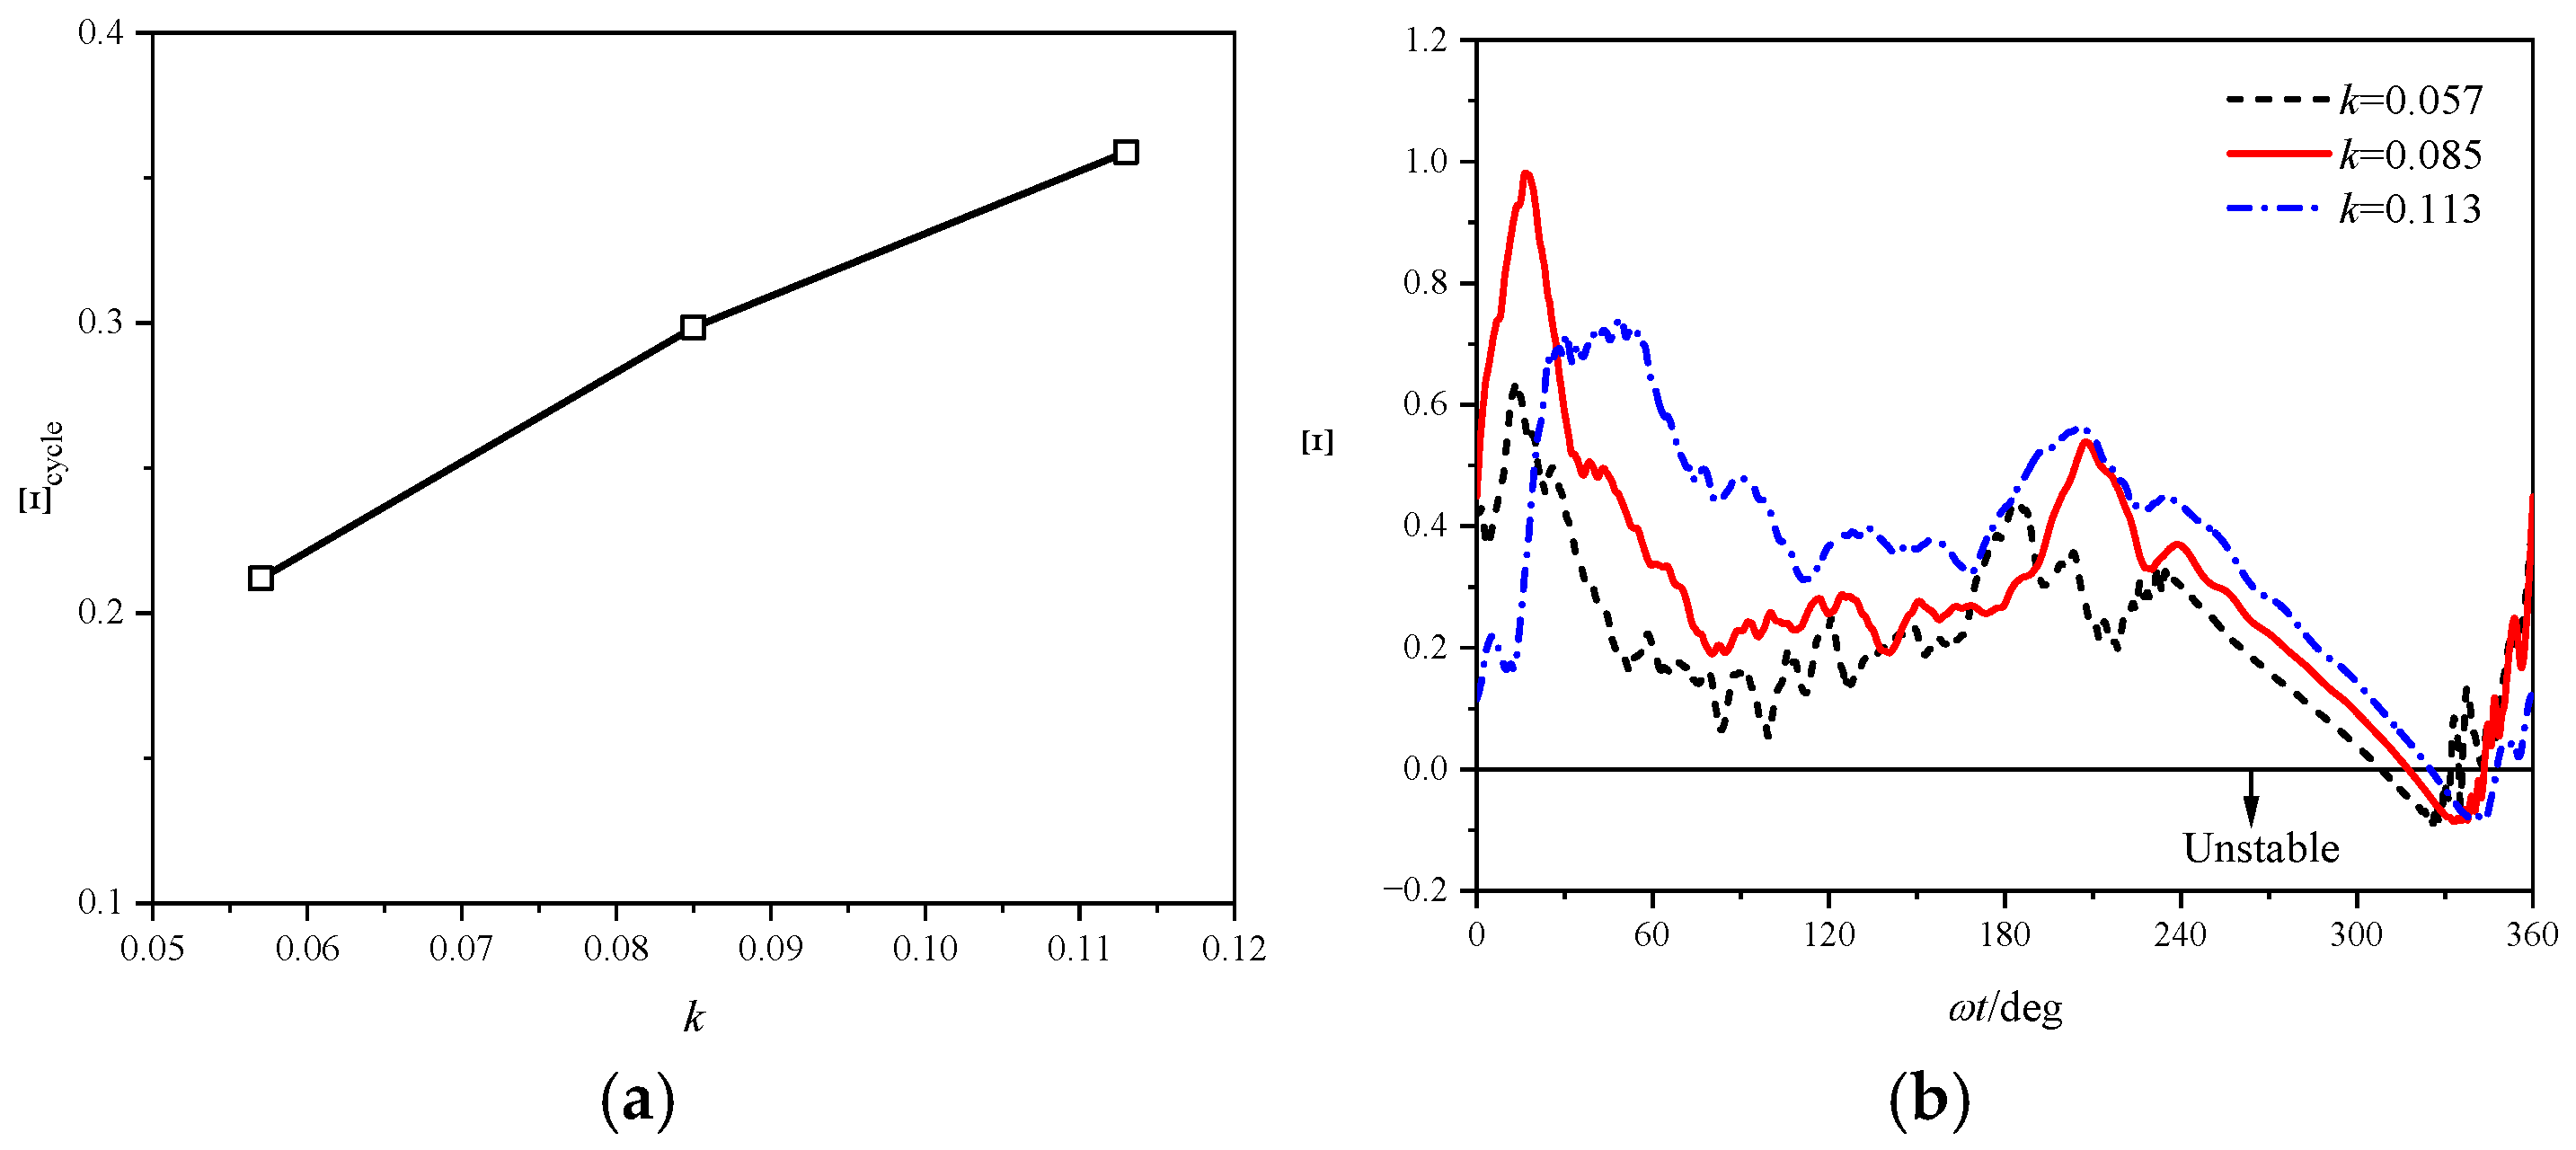
Figure 27 depicts the cycle-averaged and time-resolved aerodynamic damping of airfoil pitching motion across different reduced frequencies. Analysis shows that increasing the reduced frequency enhances the cycle-averaged damping, indicating a lower tendency for stall flutter. At high Mach numbers, the moment coefficient vs. AoA curves do not exhibit crossover (as shown in Figure 25c), and increasing the reduced frequency further amplifies the hysteresis of aerodynamic forces, thereby enhancing the stability of airfoil oscillatory motion. Examination of the time-resolved damping curves reveals that, due to the relatively weak delaying effect of increased reduced frequency on dynamic stall at high Mach numbers, the discrepancies in minimum transient damping coefficients across reduced frequencies remain negligible.

5. Conclusions

The aerodynamic characteristics of a pitching airfoil are investigated using the IDDES method, with a focus on airload distributions, vortex characteristics, and aerodynamic damping. The key findings are summarized as follows:
(1)
At the low Mach number of 0.283, the oscillatory motion induces a pronounced stall delay. The dynamic stall is characterized by a leading-edge stall caused by strong adverse pressure gradients, resulting in rapid variations in aerodynamic loads. The formation of a secondary LEV and TEV during the pitching-down stroke contributes to significant fluctuations in aerodynamic loads.
(2)
At the high Mach number of 0.5, the dynamic stall is dominated by shock-induced separation. The LEV shows a distinct structure characterized by dispersed, small vortices. The loss of leading-edge suction and circulation is moderate, leading to relatively mild variations in aerodynamic loads during stall.
(3)
The analysis of aerodynamic damping reveals that negative damping is primarily attributed to stall delay. The convection of LEV stabilizes the pitching motion during the pitching-up stage but destabilizes it during the pitching-down stage. Notably, the pitching motion indicates greater stability at the higher Mach number due to reduced stall delay effects and the dispersed stall vortices.
(4)
Increasing the reduced frequency delays the aerodynamic response of the pitching airfoil, thereby postponing dynamic stall. Specifically, at low Mach numbers, increasing the reduced frequency significantly delays dynamic stall and enhances the tendency for oscillatory motion to diverge. At high Mach numbers, although the delaying effect of increased reduced frequency on dynamic stall is relatively weak, it induces a more pronounced hysteresis effect in pitching moment and contributes to greater stability in oscillatory motion.

Author Contributions

Data curation, S.J.; funding acquisition, G.Z. and Q.Z.; validation, F.L. and L.M.; writing—original draft, S.J.; writing—review and editing, G.Z. and Q.Z. All authors have read and agreed to the published version of the manuscript.

Funding

This research is supported by the National Natural Science Foundation of China under Grant Number 12032012, China Postdoctoral Science Foundation under Grant Number 2024M764240, and Priority Academic Program Development (PAPD) of Jiangsu Higher Education Institutions.

Institutional Review Board Statement

Not applicable.

Informed Consent Statement

Not applicable.

Data Availability Statement

The original contributions presented in this study are included in the article. Further inquiries can be directed to the corresponding author.

Conflicts of Interest

The authors declare no conflicts of interest.

Abbreviations

The following abbreviations are used in this manuscript:
AoAAngle of attack
CFDComputational fluids and dynamics
FVMFinite volume method
IDDESImproved delayed detached eddy simulation
LESLarge eddy simulation
LEVLeading-edge vortex
RANSReynolds-averaged Navier–Stokes
SBSeparation bubble
TESTrailing-edge separation
TEVTrailing-edge vortex

Nomenclatures

The following nomenclatures are used in this manuscript:
cAirfoil chord
CdDrag coefficient
ClLift coefficient
CmPitching moment coefficient
CpPressure coefficient
ETotal energy per unit mass
F1Blending function
FcConvective fluxes
FvViscous fluxes
HTotal enthalpy per unit mass
Ix, Iy, IzUnit vectors along the x, y, and z axis
kKinematic energy
lIDDESIDDES length scale
lLESLES length scale
lRANSRANS length scale
nunit normal vector
pStatic pressure
PkProduction term
SControl surface
tPhysical time
u, v, wVelocity components of V
VAirstream velocity
VωGrid velocity
WConserved variables
ΘiTerms describing the work of the viscous stresses and the heat conductive
μlLaminar viscosity coefficient
μtTurbulent viscosity coefficient
ρAir density
τijViscous stress
ΩControl volume
ωSpecific dissipation rate
f ˜ d Empirical blending function

References

  1. Johnson, W. Helicopter Theory; Princeton University Press: Princeton, NJ, USA, 2012. [Google Scholar]
  2. McCroskey, W.J.; McAlister, K.W.; Carr, L.W.; Pucci, S.L. An Experimental Study of Dynamic Stall on Advanced Airfoil Sections Volume 1. Summary of the Experiment; NASA-TM-84245; NASA: Washington, DC, USA, 1982. [Google Scholar]
  3. McAlister, K.W.; Pucci, S.L.; McCroskey, W.J.; Carr, L.W. An Experimental Study of Dynamic Stall on Advanced Airfoil Sections Volume 2. Pressure and Force Data; NASA-TM-84245; NASA: Washington, DC, USA, 1982. [Google Scholar]
  4. Carr, L.W.; McCroskey, W.J.; McAlister, K.W.; Pucci, S.L.; Lambert, O. An Experimental Study of Dynamic Stall on Advanced Airfoil Sections Volume 3. Hot-Wire and Hot-Film Measurements; NASA-TM-84245; NASA: Washington, DC, USA, 1982. [Google Scholar]
  5. McCroskey, W.J.; McAlister, K.W.; Carr, L.W.; Pucci, S.L.; Lambert, O.; Indergrand, R.F. Dynamic Stall on Advanced Airfoil Sections. J. Am. Helicopter Soc. 1981, 26, 40–50. [Google Scholar] [CrossRef]
  6. McCroskey, W.J. The Phenomenon of Dynamic Stall; NASA TM-81264; NASA: Washington, DC, USA, 1981. [Google Scholar]
  7. Mulleners, K.; Raffel, M. The Onset of Dynamic Stall Revisited. Exp. Fluids 2012, 52, 779–793. [Google Scholar] [CrossRef]
  8. Mulleners, K.; Raffel, M. Dynamic Stall Development. Exp. Fluids 2013, 54, 1469. [Google Scholar] [CrossRef]
  9. Carr, L.W.; Chandrasekhara, M.S. Compressibility Effects on Dynamic Stall. Prog. Aerosp. Sci. 1996, 32, 523–573. [Google Scholar] [CrossRef]
  10. Fung, K.Y.; Carr, L.W. Effects of Compressibility on Dynamic Stall. AIAA J. 1991, 29, 306–308. [Google Scholar] [CrossRef]
  11. Chandrasekhara, M.S.; Carr, L.W.; Wilder, M.C. Interferometric Investigations of Compressible Dynamic Stall over a Transiently Pitching Airfoil. AIAA J. 1994, 32, 586–593. [Google Scholar] [CrossRef]
  12. Chandrasekhara, M.S.; Wilder, M.C.; Carr, L.W. Competing Mechanisms of Compressible Dynamic Stall. AIAA J. 1998, 36, 387–393. [Google Scholar] [CrossRef]
  13. Matalanis, C.G.; Bowles, P.O.; Jee, S.; Min, B.-Y.; Kuczek, A.E.; Croteau, P.F.; Wake, B.E.; Crittenden, T.; Glezer, A.; Lorber, P.F. Dynamic Stall Suppression Using Combustion-Powered Actuation (COMPACT). NASA/CR-2016-219336; NASA: Washington, DC, USA, 2016. [Google Scholar]
  14. Matalanis, C.G.; Bowles, P.O.; Min, B.Y.; Jee, S.; Kuczek, A.E.; Wake, B.E.; Lorber, P.F.; Crittenden, T.M.; Glezer, A.; Schaeffler, N.W. High-Speed Experiments on Combustion-Powered Actuation for Dynamic Stall Suppression. AIAA J. 2017, 55, 3001–3015. [Google Scholar] [CrossRef]
  15. Martin, J.M.; Empey, R.W.; McCroskey, W.J.; Caradonna, F.X. An Experimental Analysis of Dynamic Stall on an Oscillating Airfoil. J. Am. Helicopter Soc. 1974, 19, 26–32. [Google Scholar] [CrossRef]
  16. Benton, S.I.; Visbal, M.R. The Onset of Dynamic Stall at a High, Transitional Reynolds Number. J. Fluid Mech. 2019, 861, 860–885. [Google Scholar] [CrossRef]
  17. Zhu, W.; Bons, J.P.; Gregory, J.W. Reynolds Scaling Effects on Dynamic Stall of VR-7 and VR-12 Airfoils. In Proceedings of the AIAA Scitech 2019 Forum, San Diego, CA, USA, 7–11 January 2019. [Google Scholar]
  18. Lorber, P.F.; Carta, F.O. Airfoil dynamic stall at constant pitch rate and high Reynolds number. J. Aircr. 1988, 25, 548–556. [Google Scholar] [CrossRef]
  19. Gardner, A.D.; Richter, K.; Mai, H.; Altmikus, A.R.M.; Klein, A.; Rohardt, C.H. Experimental Investigation of Dynamic Stall Performance for the EDI-M109 and EDI-M112 Airfoils. J. Am. Helicopter Soc. 2013, 58, 1–13. [Google Scholar] [CrossRef]
  20. Spalart, P.R.; Jou, W.-H.; Strelets, M.; Allmaras, S.R. Comments on the Feasibility of LES for Wings, and on a Hybrid RANS/LES Approach. In Proceedings of the Advances in DNS/LES, New Brunswick, NJ, USA, 7–9 June 1999. [Google Scholar]
  21. Spalart, P.R.; Deck, S.; Shur, M.L.; Squires, K.D.; Strelets, M.K.; Travin, A. A New Version of Detached-eddy Simulation, Resistant to Ambiguous Grid Densities. Theor. Comput. Fluid Dyn. 2006, 20, 181–195. [Google Scholar] [CrossRef]
  22. Shur, M.L.; Spalart, P.R.; Strelets, M.K.; Travin, A.K. A Hybrid RANS-LES Approach with Delayed-DES and Wall-Modelled LES Capabilities. Int. J. Heat Fluid Flow 2008, 29, 1638–1649. [Google Scholar] [CrossRef]
  23. Kim, T.; Kim, S.; Lim, J.; Jee, S. Numerical Investigation of Compressibility Effect on Dynamic Stall. Aerosp. Sci. Technol. 2020, 105, 105918. [Google Scholar] [CrossRef]
  24. Khalifa, N.M.; Rezaei, A.; Taha, H.E. On Computational Simulations of Dynamic Stall and Its Three-Dimensional Nature. Phys. Fluids 2023, 35, 105143. [Google Scholar] [CrossRef]
  25. Khalifa, N.M.; Rezaei, A.S.; Taha, H.E. Comparing the Performance of Different Turbulence Models in Predicting Dynamic Stall. In Proceedings of the AIAA Scitech 2021 Forum, Virtual Event, 11–15 and 19–21 January 2021. [Google Scholar]
  26. Visbal, M.R. Numerical Investigation of Deep Dynamic Stall of a Plunging Airfoil. AIAA J. 2011, 49, 2152–2170. [Google Scholar] [CrossRef]
  27. Visbal, M.R. High-Fidelity Simulation of Transitional Flows past a Plunging Airfoil. AIAA J. 2009, 47, 2685–2697. [Google Scholar] [CrossRef]
  28. Visbal, M.R.; Gordnier, R.E.; Galbraith, M.C. High-Fidelity Simulations of Moving and Flexible Airfoils at Low Reynolds Numbers. Exp. Fluids 2009, 46, 903–922. [Google Scholar] [CrossRef]
  29. Visbal, M.R. Analysis of the Onset of Dynamic Stall Using High-Fidelity Large-Eddy Simulations. In Proceedings of the 52nd Aerospace Sciences Meeting, National Harbor, MA, USA, 13–17 January 2014. [Google Scholar]
  30. Visbal, M.R.; Garmann, D.J. Analysis of Dynamic Stall on a Pitching Airfoil Using High-Fidelity Large-Eddy Simulations. AIAA J. 2018, 56, 46–63. [Google Scholar] [CrossRef]
  31. Benton, S.I.; Visbal, M.R. Effects of Compressibility on Dynamic-Stall Onset Using Large-Eddy Simulation. AIAA J. 2020, 58, 1194–1205. [Google Scholar] [CrossRef]
  32. Sharma, A.; Visbal, M. Numerical Investigation of the Effect of Airfoil Thickness on Onset of Dynamic Stall. J. Fluid Mech. 2019, 870, 870–900. [Google Scholar] [CrossRef]
  33. Benton, S.I.; Visbal, M.R. Effects of Leading-Edge Geometry on the Onset of Dynamic Stall. AIAA J. 2018, 56, 4195–4198. [Google Scholar] [CrossRef]
  34. Gritskevich, M.S.; Garbaruk, A.V.; Schutze, J.; Menter, F.R. Development of DDES and IDDES Formulations for the k-ω Shear Stress Transport Model. Flow Turbul. Combust. 2012, 88, 431–449. [Google Scholar] [CrossRef]
  35. Zhao, Q.J.; Zhao, G.Q.; Wang, B.; Wang, Q.; Shi, Y.J.; Xu, G.H. Robust Navier-Stokes Method for Predicting Unsteady Flowfield and Aerodynamic Characteristics of Helicopter Rotor. Chin. J. Aeronaut. 2018, 31, 214–224. [Google Scholar] [CrossRef]
  36. Joo, W.; Lee, B.S.; Yee, K.; Lee, D.H. Combining passive control method for dynamic stall control. J. Aircr. 2006, 43, 1120–1128. [Google Scholar] [CrossRef]
  37. Jee, S.; Bowles, P.; Matalanis, C.; Min, B.-Y.; Wake, B.; Crittenden, T.; Glezer, A. Computations of combustion-powered actuation for dynamic stall suppression. In Proceedings of the AHS 72nd Annual Forum, West Palm Beach, FL, USA, 17–19 May 2016. [Google Scholar]
  38. Carta, F.O. An Analysis of the Stall Flutter Instability of Helicopter Rotor Blades. J. Am. Helicopter Soc. 1967, 12, 1–18. [Google Scholar] [CrossRef]
  39. Bowles, P.O.; Corke, T.C.; Coleman, D.G.; Thomas, F.O. Improved Understanding of Aerodynamic Damping Through the Hilbert Transform. AIAA J. 2014, 52, 2384–2394. [Google Scholar] [CrossRef]
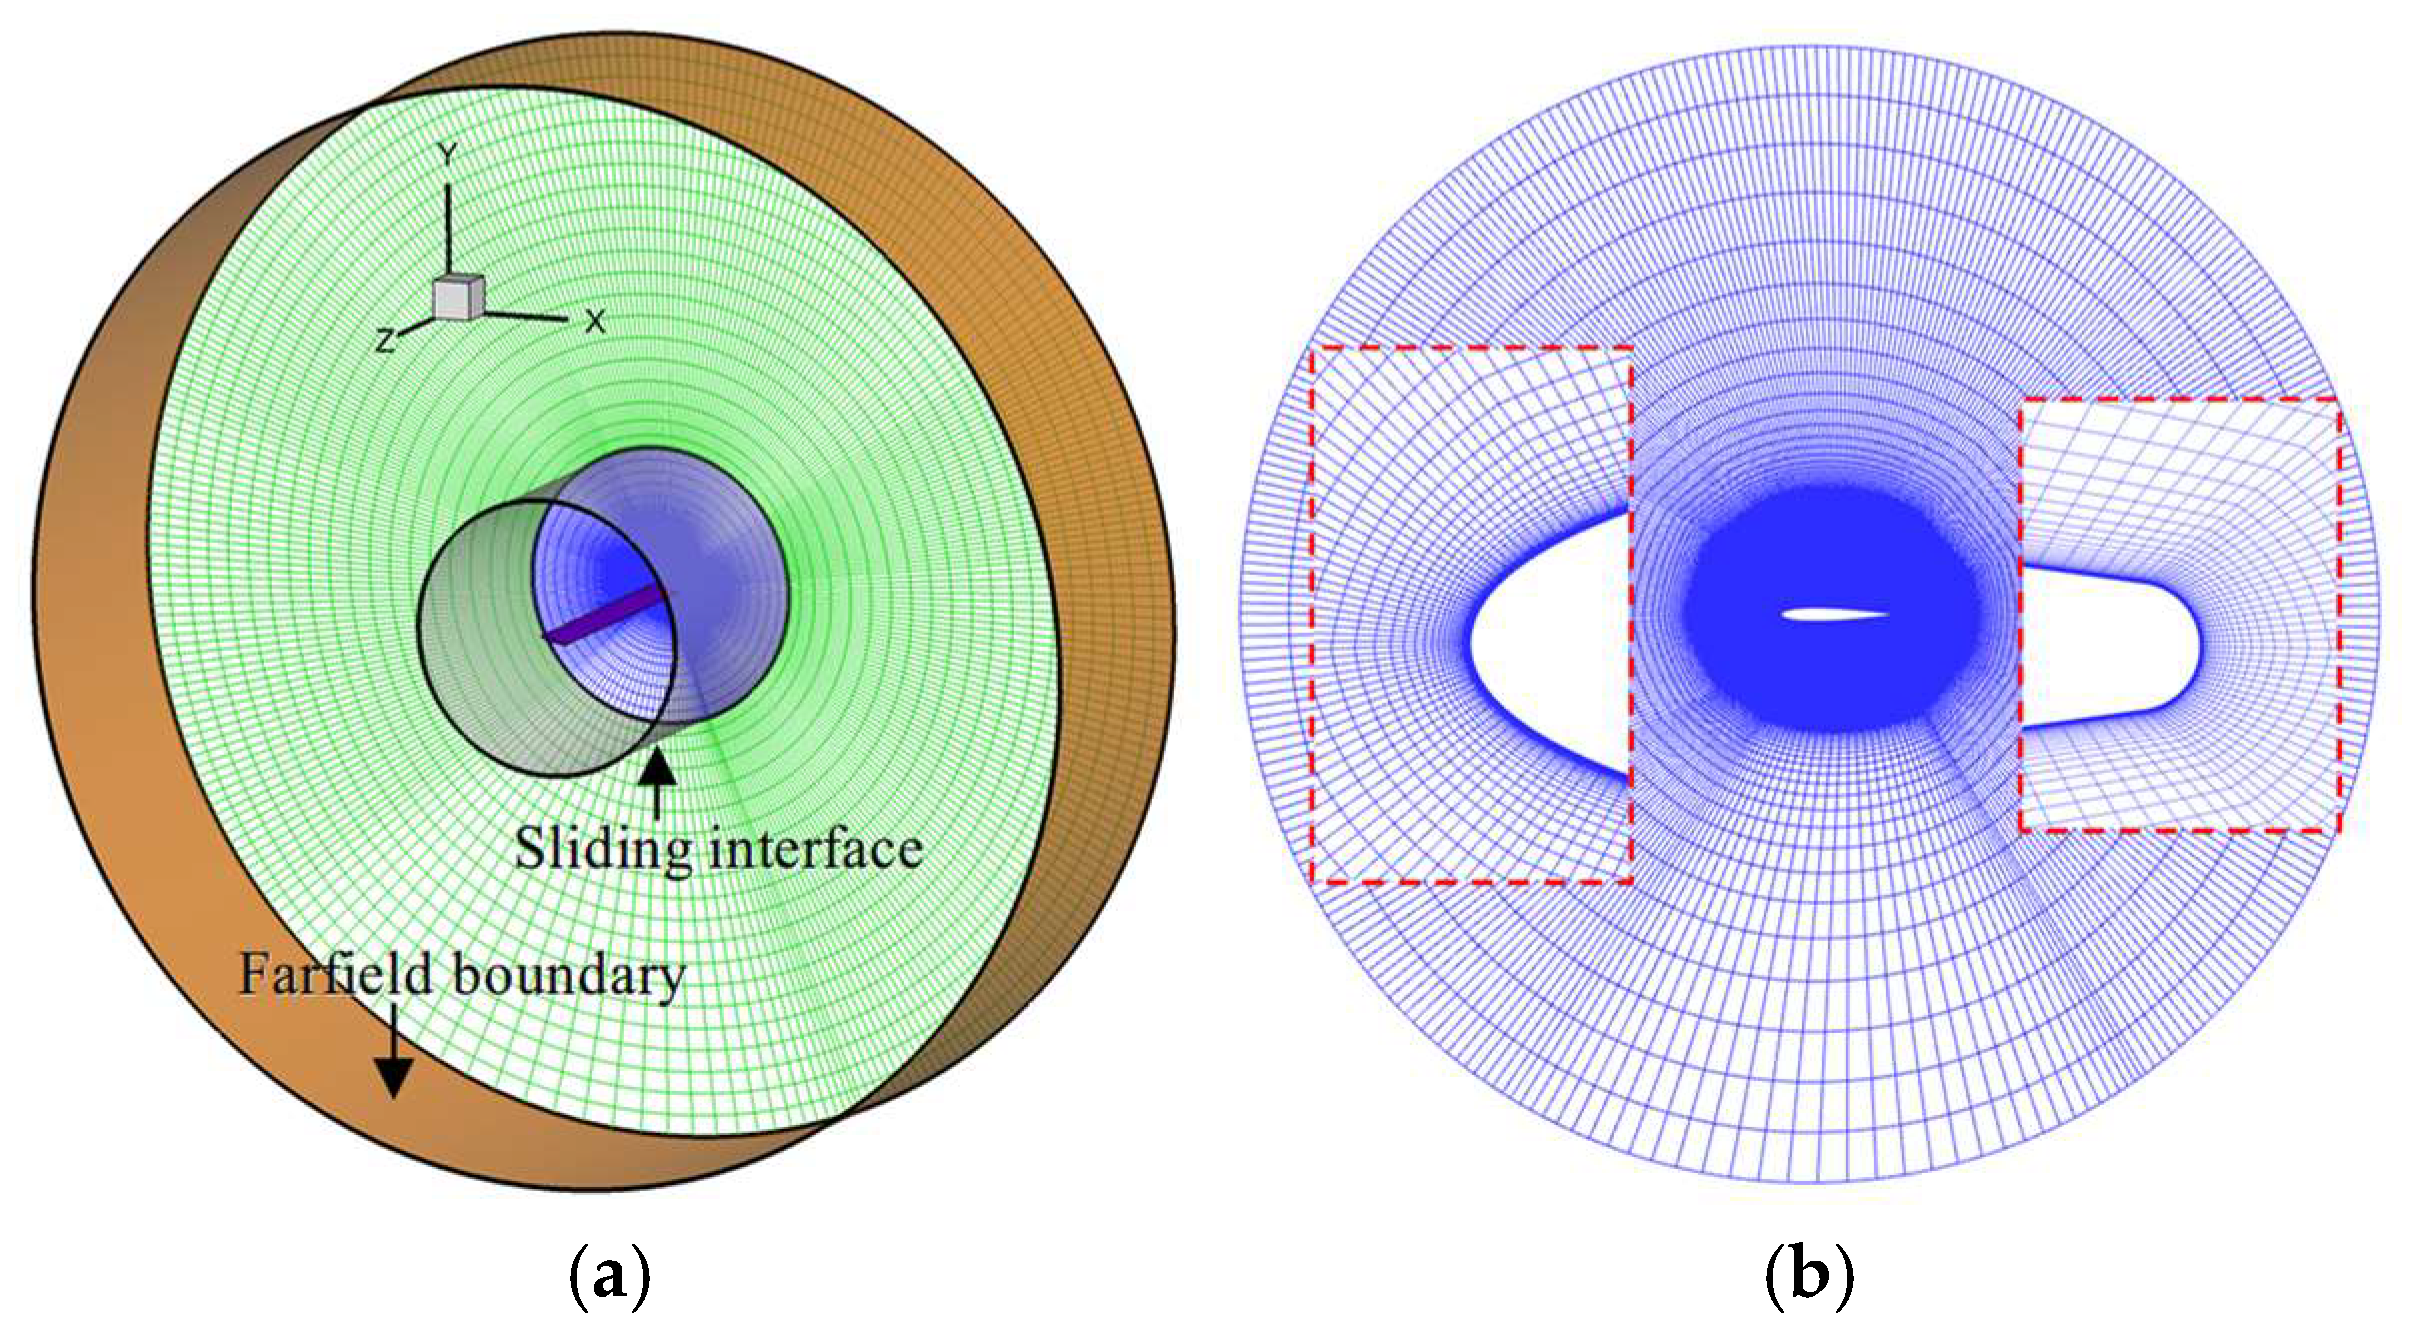
Figure 1. Sliding mesh surrounding the computational model: (a) computational domain; (b) sectional mesh and close-up view.
Applsci 15 07309 g001
Figure 2. Schematic diagram of boundary conditions.
Applsci 15 07309 g002
Figure 3. Comparisons of numerical results with different time steps and experimental data: (a) Cl; (b) Cd; (c) Cm.
Applsci 15 07309 g003
Figure 4. Comparisons of numerical results with different grids and experimental data for NACA 0012 airfoil at Ma = 0.283: (a) Cl; (b) Cd; (c) Cm.
Applsci 15 07309 g004
Figure 5. Comparisons among experimental data, calculated results by Kim et al. [23], and current numerical results for a modified VR-12 airfoil at Ma = 0.5: (a) Cl; (b) Cd; (c) Cm.
Applsci 15 07309 g005
Figure 6. Calculated forces of the pitching airfoil at Ma = 0.283: (a) Cl; (b) Cd; (c) Cm.
Applsci 15 07309 g006aApplsci 15 07309 g006b
Figure 7. Time evolution of aerodynamic forces and their frequency spectra at Ma = 0.283: (a) Cl; (b) Cd; (c) Cm.
Applsci 15 07309 g007aApplsci 15 07309 g007b
Figure 8. Contour of spanwise-averaged pressure coefficients on the airfoil upper surface at Ma = 0.283.
Applsci 15 07309 g008
Figure 9. Mach number and pressure coefficient contours for the center section at Ma = 0.283, α = 18.26°↑: (a) Mach number contour; (b) pressure coefficient contour.
Applsci 15 07309 g009
Figure 10. Iso-surfaces at λ2 = −0.0001 in the pitching up stage at Ma = 0.283: (a) α = 19.12°↑; (b) α = 19.40°↑; (c) α = 20.20°↑; (d) α = 21.67°↑; (e) α = 23.71°↑; (f) α = 24.79°.
Applsci 15 07309 g010
Figure 11. Streamlines and z-vorticity contours for the center section in the pitching up stage at Ma = 0.283: (a) α = 19.12°↑; (b) α = 19.40°↑; (c) α = 20.20°↑; (d) α = 21.67°↑; (e) α = 23.71°↑; (f) α = 24.79°.
Applsci 15 07309 g011
Figure 12. Pressure coefficient distribution on the upper surface in the pitching up stroke at Ma = 0.283.
Applsci 15 07309 g012
Figure 13. Streamlines and z-vorticity contours for the center cross-section in the pitching down stage at Ma = 0.283: (a) α = 23.71°↓; (b) α = 17.96°↓; (c) α = 14.91°↓; (d) α = 7.92°↓.
Applsci 15 07309 g013
Figure 14. Pressure coefficient distribution on the upper surface in pitching down stroke at Ma = 0.283: (a) α = 23.71°↓, 17.96°↓; (b) α = 14.91°↓, 7.92°↓.
Applsci 15 07309 g014
Figure 15. Cycle-averaged and time-resolved aerodynamic damping for the pitching airfoil at Ma = 0.283.
Applsci 15 07309 g015
Figure 16. Calculated forces of the pitching airfoil for different reduced frequencies at Ma = 0.283: (a) Cl; (b) Cd; (c) Cm.
Applsci 15 07309 g016aApplsci 15 07309 g016b
Figure 17. Pressure coefficients on the suction surface during the airfoil’s pitching-up stage at Ma = 0.283: (a) k = 0.1; (b) k = 0.151; (c) k = 0.2.
Applsci 15 07309 g017
Figure 18. Aerodynamic damping of airfoil oscillating motion with different reduced frequencies at Ma = 0.283: (a) cycle-averaged damping; (b) time-resolved damping.
Applsci 15 07309 g018
Figure 19. Comparisons of calculated airload of the pitching airfoil at Ma = 0.5 and 0.283: (a) Cl; (b) Cd; (c) Cm.
Applsci 15 07309 g019
Figure 20. Time evolution of aerodynamic forces and their frequency spectra at Ma = 0.5: (a) Cl; (b) Cd; (c) Cm.
Applsci 15 07309 g020
Figure 21. Contour of spanwise-averaged pressure coefficient on the upper surface in the pitch-up stroke at Ma = 0.5.
Applsci 15 07309 g021
Figure 22. Pressure coefficient distribution on the airfoil suction surface.
Applsci 15 07309 g022
Figure 23. Vorticity field and streamlines in the center section during pitch-up motion at Ma = 0.5: (a) α = 12.15°↑; (b) α = 13.36°↑; (c) α = 14.91°↑; (d) α = 15.22°↑; (e) α = 15.84°↑; (f) α = 16.15°↑; (g) α = 16.46°↑; (h) α = 16.76°↑; (i) α = 17.67°↑.
Applsci 15 07309 g023
Figure 24. Cycle-averaged and time-resolved aerodynamic damping for the pitching airfoil at Ma = 0.5.
Applsci 15 07309 g024
Figure 25. Calculated forces of the pitching airfoil for different reduced frequencies at Ma = 0.5: (a) Cl; (b) Cd; (c) Cm.
Applsci 15 07309 g025
Figure 26. Pressure coefficients near the airfoil leading-edge for different reduced frequencies at Ma = 0.5: (a) k = 0.085; (b) α = 9.10°↑; (c) α = 10.15°↑; (d) α = 11.56°↑.
Applsci 15 07309 g026
Figure 27. Aerodynamic damping of airfoil pitching motion for different reduced frequencies at Ma = 0.5: (a) cycle-averaged damping; (b) time-resolved damping.
Applsci 15 07309 g027
Table 1. Detailed information of grids.
Grid ResolutionGrid PointsCell Size in the LES Region
Coarse248 × 95 × 510.02c
Medium306 × 112 × 670.015c
Fine421 × 142 × 1010.01c
Table 2. Comparisons of results from different grids.
Grid ResolutionαdsClmaxCdmaxCmmin
Coarse23.82.241.0−0.50
Medium23.72.241.02−0.54
Fine23.72.241.01−0.53
Disclaimer/Publisher’s Note: The statements, opinions and data contained in all publications are solely those of the individual author(s) and contributor(s) and not of MDPI and/or the editor(s). MDPI and/or the editor(s) disclaim responsibility for any injury to people or property resulting from any ideas, methods, instructions or products referred to in the content.