Article

Load-Carrying Capacity Tests on Innovative Friction-Bolted Joints and Prototype Bolted Interconnection Nodes

Faculty of Mechanical Engineering, Wrocław University of Science and Technology, Wybrzeże Wyspiańskiego 27, 50-370 Wrocław, Poland
*
Author to whom correspondence should be addressed.
Appl. Sci. 2025, 15(13), 7299; https://doi.org/10.3390/app15137299
Submission received: 2 April 2025 / Revised: 16 June 2025 / Accepted: 25 June 2025 / Published: 28 June 2025
(This article belongs to the Special Issue Machine Automation: System Design, Analysis and Control)

Abstract

This study deals with innovative friction-bolted joints. The innovative bolted joints were designed for load-bearing structures of light cranes with spans up to 18 m and lifting capacities up to 160 kN, or similar load-bearing structures. The practical suitability of these connectors for use in the screw connection nodes of headframes with girders in light overhead cranes was confirmed by the positive results of experimental verification and experimental testing on physical models of these nodes. Specific elements were created and used in these joints, and several models were examined. The analyzed friction-bolted joints were found to have an increased load capacity when compared with typical assemblies. If using screws of higher strength grades, shortening the preparation of those joints is possible.

1. Introduction

Bolted joints are widely used in various technological contexts. To ensure their high durability, among other things, it is necessary to prevent their loosening. Loosening within these joints changes the load distribution not only in the joint itself, but also in the objects in which these fasteners are used, potentially leading to damage [1,2,3]. Bolted joints should also be able to carry the highest possible loads. A key design and assembly factor for meeting these requirements is ensuring that the initial load is sufficiently high [1]. In addition, the coefficient of friction within the parts to be joined plays an important role in ensuring the stability of these joints. These parameters are interrelated, as an increase in the coefficient of friction reduces the initial load [4].
However, while a decrease in the coefficient of friction increases the tendency to loosen, there is a specific range for this parameter in which its decrease does not increase the risk of joint loosening [5]. The coefficient of friction is affected by the type of friction present. This, in turn, depends primarily on the condition of the surface, the presence of lubricants, the type and quantity of the joints, and the possible use of coatings [5,6,7,8,9,10]. At the same time, it should be noted that during operations, especially with successive tightening and loosening cycles of bolt connection elements, the clamping force may decrease [11,12].
The effects of lubricants on the stability of the friction coefficient value during multiple tightening and loosening cycles have been observed. Consistently, the coefficient of friction remains stable or decreases in the presence of lubricants. However, in their absence, an increase in the coefficient of friction can be observed with successive tightening and loosening cycles of bolted joints [13].
One study [14] has presented a method for evaluating the course of loosening bolted connections. It is primarily applicable at an early stage. This post-initial state of bolted joint loosening is characterized by small relative movements and a relatively small loading degree. As it advances, the relative displacements in the bolted joints become larger and larger, relatively large loading degrees occur, and bolt tension begins to decrease rapidly [12,15,16]. Analyses of the course of bolted joint self-loosening indicate that this phenomenon is most common in transverse loading [15,17]. In addition, oscillations within the bolted joint can intensify its wear, taking the form of fretting, which makes self-loosening even more important for the correct operation of the joint [18,19,20]. For these reasons, analyzing the distribution of loads acting within a bolted joint is crucial for its safe and reliable operation [21,22]. This problem is of significant industrial importance as, among other things, about 25% of service problems in the automotive industry are associated with the loosening of fasteners. For example, loose fasteners have been found in more than 10% of newly manufactured cars [23].
Another fundamental reason for the loosening of bolted joints is vibrations [2,17,24,25,26,27]. Low thread angles increase the risk of loosening of those joints as well [28]. This is a significant problem, given that there is no fully effective method to protect against the loosening of bolted joints [24]. While self-loosening increases in bolted joints as rotational vibration amplitude rises, a high initial preload impedes the self-loosening of bolted joints [25]. Vibrations are fundamental, being one of the most common causes of failure in dynamically loaded bolted joints [29], and a finite element method study of bolted joints influenced by vibration is presented in [30].
Bolted joints have many damage mechanisms, as analyzed in [31], which characterizes the most important problems relating to the use of these joints. These failures can result from several leading causes, such as design, material, and assembly errors; overloading; fatigue; and adverse environmental influences [31]. All in all, protecting bolted joints from loosening is a critical engineering task. Especially as in some cases, the carrying capacity of the entire assemblies depends mostly on the strength of the bolted joints and therefore their reliability is crucial [32,33].
Overall, it can be noticed that existing bolted joint solutions can be improved. Among others, securing a higher tension force is a crucial goal. Simplifying bolted connections and lowering the required steps can also be achieved to ensure safer operation of those joints when screws with higher strength grades are used. Such solutions can additionally increase the load capacity of the vertical bolted connection. That was the foundation for the research presented below.

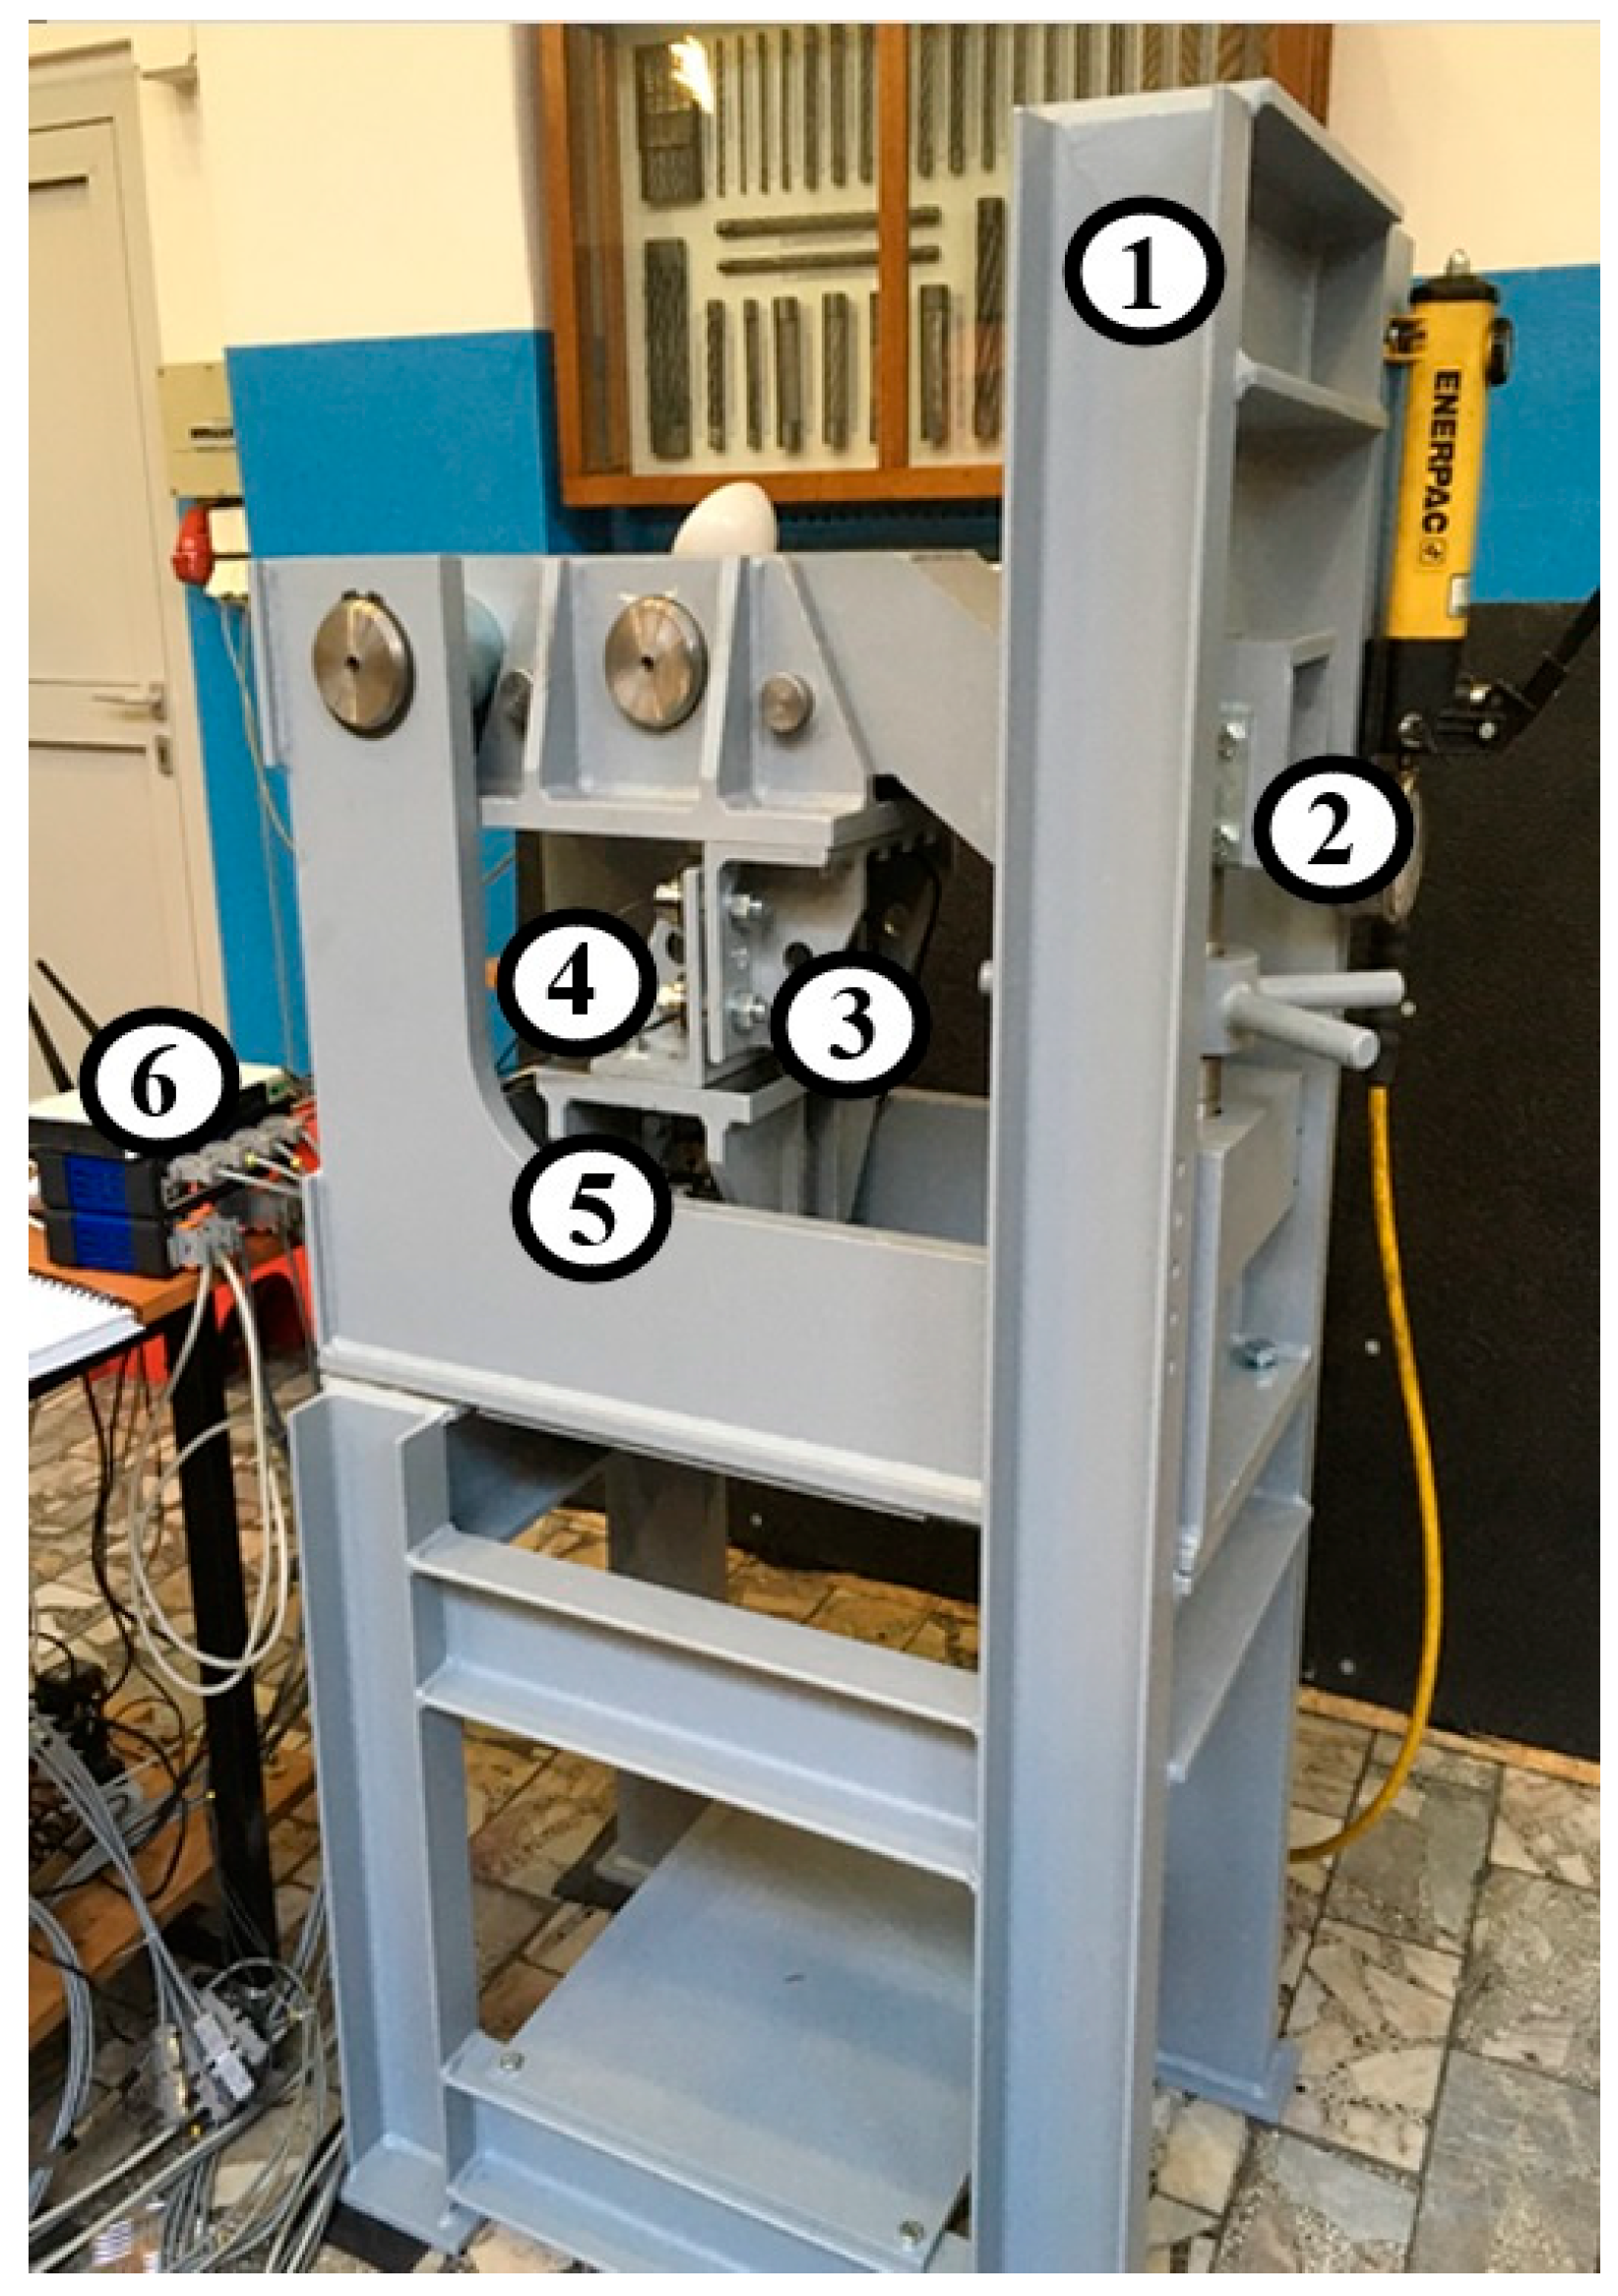
2. Materials and Methods

The paper presents a study of innovative bolted joints, the use of which will allow for the reduction of the requirements for the surfaces connected by those joints of components of crane supporting structures. Using innovative connectors, it is possible to avoid costly and time-consuming grinding of often large surfaces of crane components to be joined.
Due to the wide range of structural solutions of load-bearing structures (in terms of structure and size), it is not possible to indicate the achievable cost reduction on an absolute scale.
We prepared and experimentally verified innovative bolted friction joints and bolted connection nodes for use in light overhead cranes with girders, in order to obtain joints with increased resistance to self-loosening.
This research was carried out on a total of 19 physical models, grouped and designated hereafter as models I and II (screw friction joints) and models III, IV, and V (screw connection nodes with 4 or 6 of these friction joints). On the experimental loading test stand, an attempt was made to reproduce as closely as possible the loading conditions of the innovative bolted joints and entire (4 or 6) bolted nodes under study. The loading moment of a bolt node is derived from the method of load transfer, representing the interactions between the girder and the face in the real crane.
The research program included as many as 19 physical models reflecting the operating conditions of connections in various versions such as spans and capacities of light cranes. In the paper, it was decided to present several examples so as to present the problem and the results of the work as concisely as possible.
We built the life-sized (1:1) model I (innovative screw friction joint with M16 screws) and model III (screw connection node for the F = 25 kN crane) and the unreal-sized model II (innovative screw friction joint with M24 screw in 1:1.5 scale) and models IV and V (screw connection nodes for the F = 63 kN cranes). F = 63 kN and 125 kN cranes were created at decreased scales, cl (1:2 and 1:2.5), adopted according to the rules of model similarity theory as dimensionally independent quantities. Considering the scale dependencies of other dimensionally dependent quantities (among other forces) described below, this decreased scale made it possible to maintain a reasonable size for the experimental stand and load ranges of the models tested on it, including the loads used in the destructive tests for these models.
Based on the values of the force F, scales of linear dimensions and forces, the number of friction joints, and the size of the external diameters of the spacer-bearing machining rings, we assumed the following:
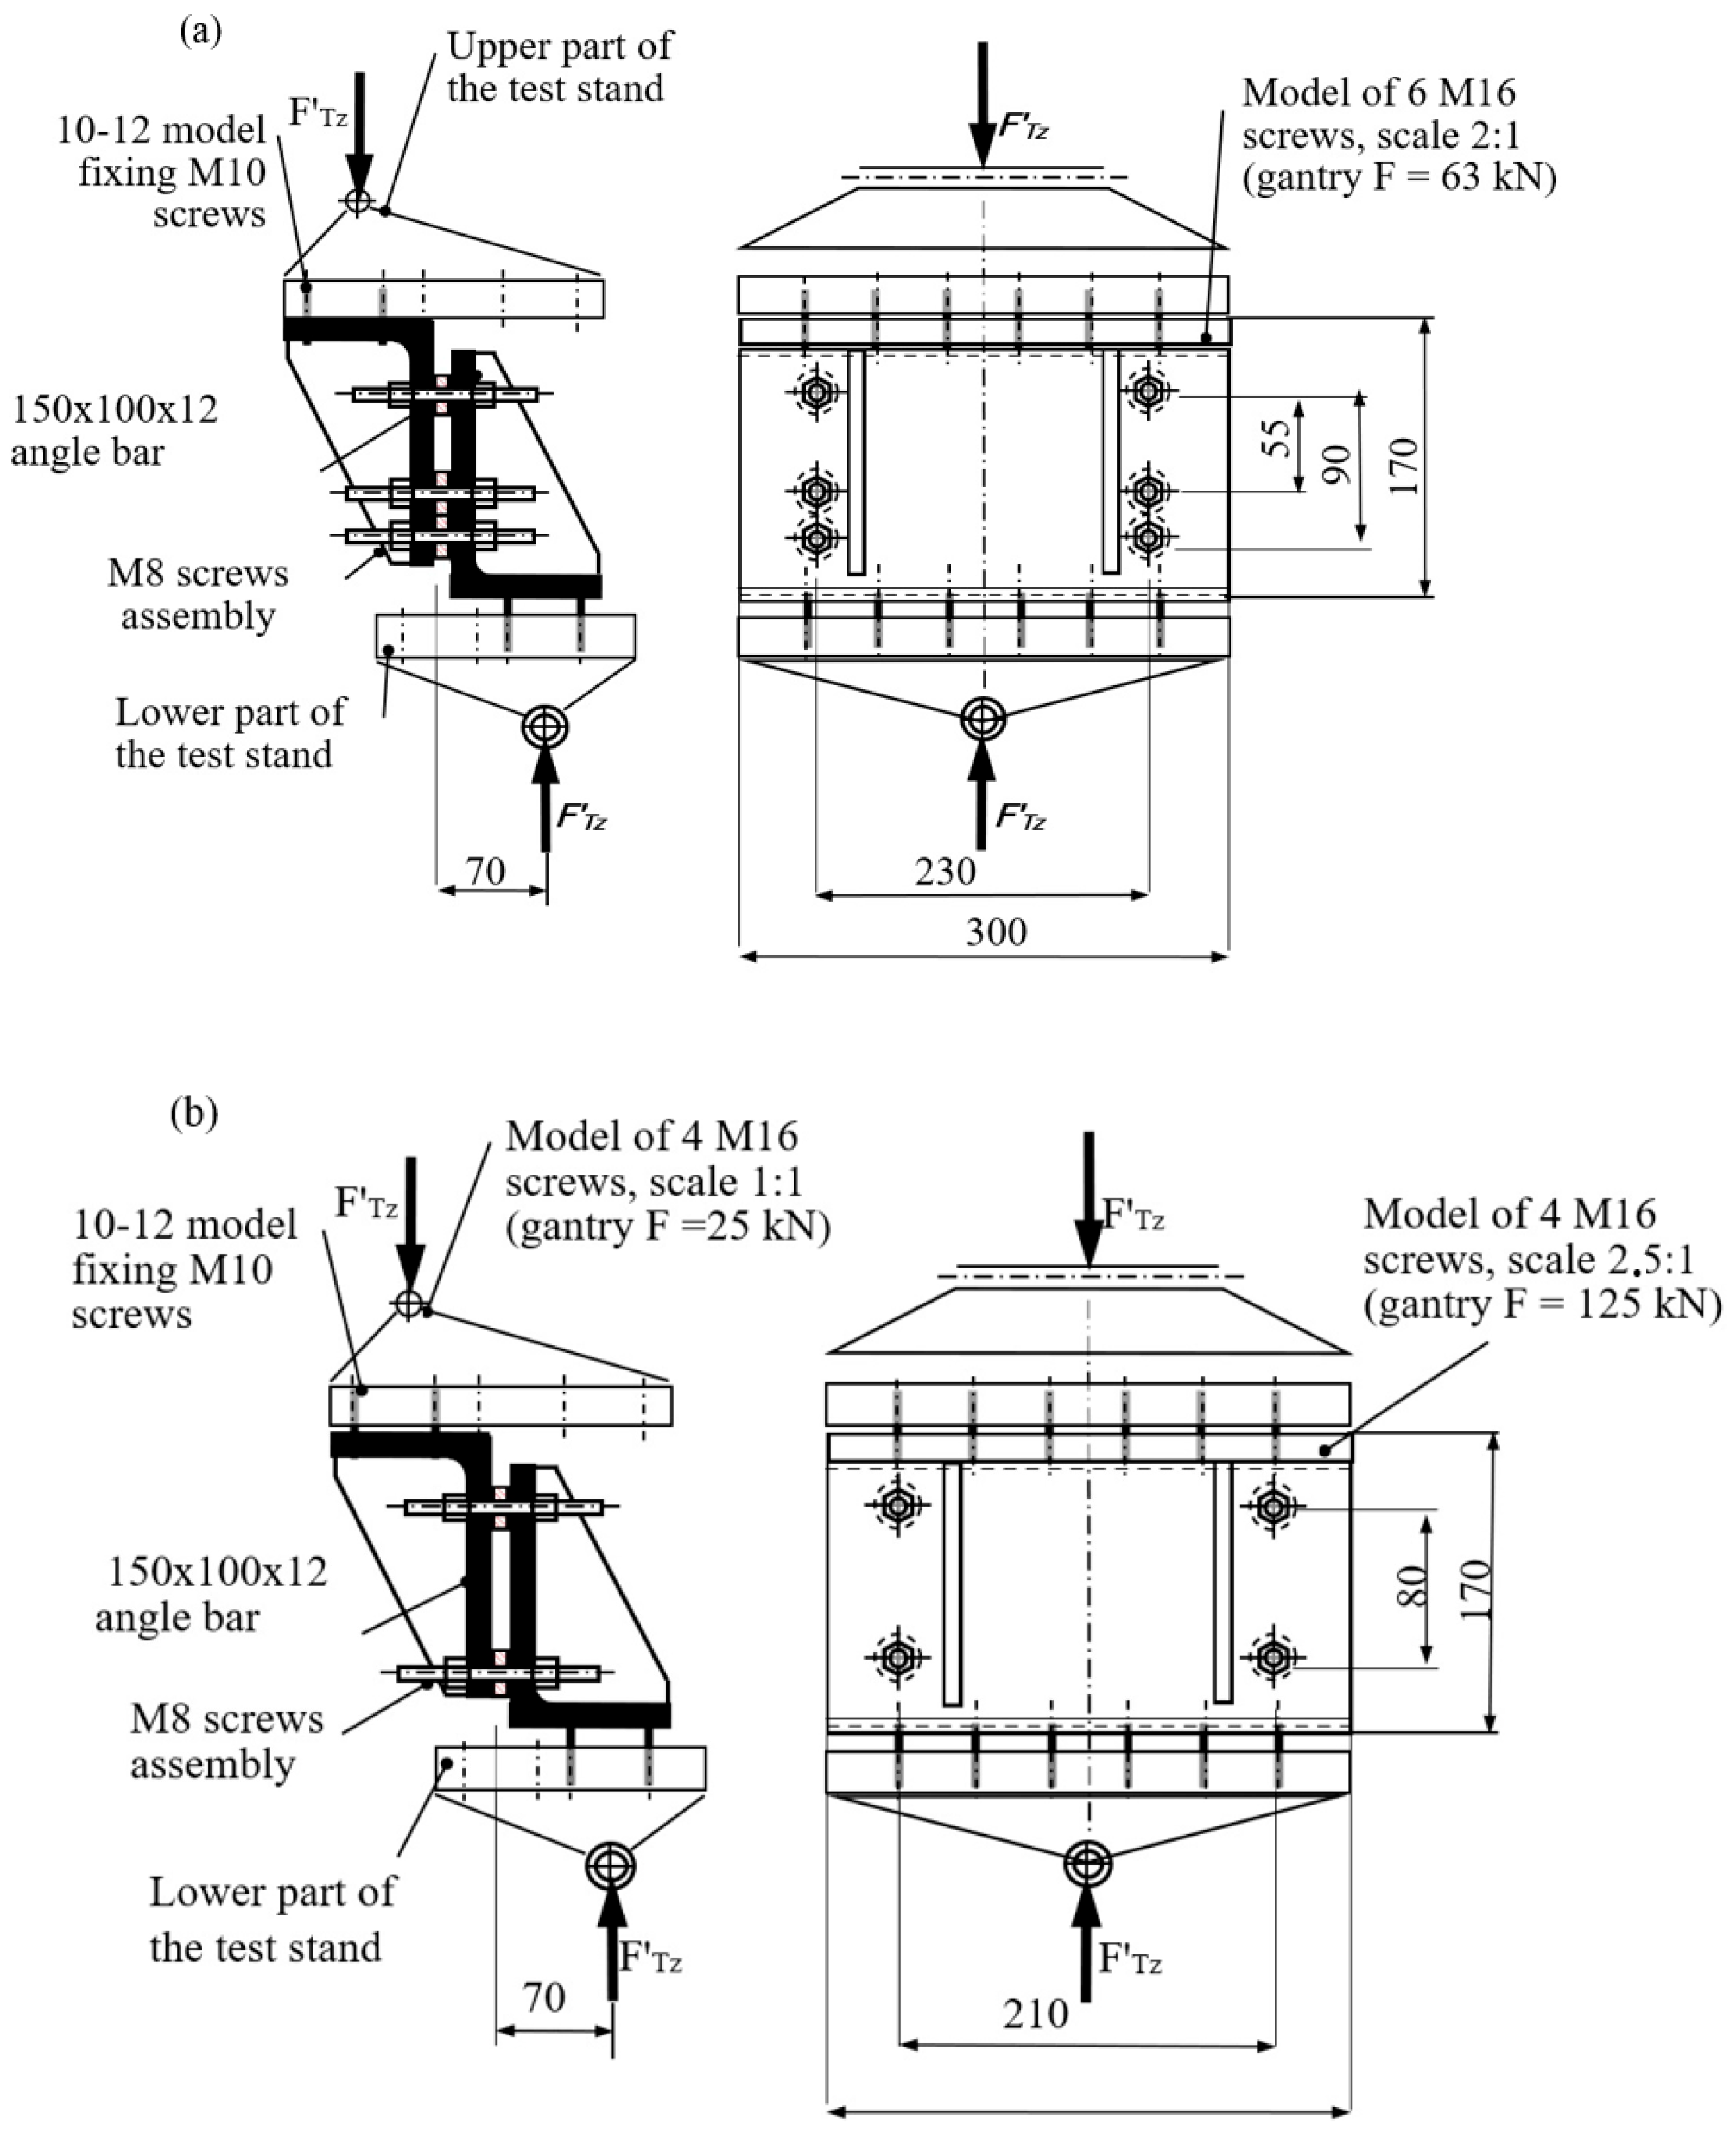
  • The maximum values of the force F set on the experimental bench will reach 500 kN, while the maximum values of the force F’Mzd (one of the pair of scaled forces from the moment Mzd) will reach 6500 N.
  • Models of screw connection nodes will be made in two linear dimension scales, kl, different from the node models with 6 M16 screws and 4 M24 screws.
  • Bolted junction models with 6 M16 bolts and 4 M24 bolts will be made at linear dimension scales with values appropriately selected at the maximum force F value, 500 kN.
  • The innovative friction-bolted joint models will be made life-size for those with M16 bolts and at a decreasing scale for those with M24 bolts.
  • Destructive testing will be primarily conducted on the life-sized M16 bolted friction joints models and the decreasing-scale bolted interconnection node models (with 4 or 6 innovative bolted friction joints).
The characteristic dimensions determining the sizes of the physical models tested on the experimental bench—namely, the heights and widths of the gusset-angle plates of these models—were selected from the following ranges: h’b = 70–150 mm and b’b = 100–300 mm. This also covered model I in the life-sized models (innovative friction screw joints and the screw connection node of the smallest crane, F = 25 kN).
To ensure the mutual pressure of the gusset-angle plates of the physical models, the corresponding spacings of the bolted connectors were selected from the following ranges: h’bs = 40–120 mm and b’bs = 70–270 mm. Using these scales, spacing values were selected for the reduced-scale and life-size physical models made.
The fabrication and preparation for testing each physical model required “whitening” sawing (using spacer-bearing machining rings) on the raw surfaces of the connected angles of these models. This eliminated (or at least compensated for) the influence of local imperfections on these surfaces and achieved complete friction–shape contact between these angles and the spacer-bearing rings. This also ensured the expected shear resistance of the screw connection nodes with innovative friction screw connectors according to patent no. PL 238010 B1.
Figure 1 shows that, for all physical models created at reduced scales, the essential type size is a ring used for M16 bolts at a 1:1 scale (Figure 2a). Converted to a scale of 1:1.5, the dimensions of this ring are equal to the corresponding dimensions of the ring used for M24 bolts. In contrast, rings converted at scales of 1:2 and 1:2.5 present dimensions very close to those of the ring in Figure 2b, representing one of the possible derived typologies selected for use in the model.
Experimental verification was carried out on the corresponding physical models, which were subjected to loading tests on a purpose-built experimental rig (Figure 2). This facilitated the controlled loading of these models for shear alone (characteristic of single-screw friction joints) or shear with bending (characteristic of multi-screw connection nodes in headframes with crane girders). The sheet metal parts and sections used on the test stand were made from S355J2G3 (1.0570) steel with a hardness of about 220 HB, while the cutting rings were made from tempered C45 (1.0503) steel and were surface hardened to 55 HRC.
In addition to the described models of spacer-bearing machining rings, the physical models also included repetitive pairs of ribbed L150 × 10 × 12 angles, representing the connected elements in single friction-bolted joints and gusset plates in the faces and girders of three cranes (from the group of the aforementioned light cranes, i.e., F = 25 kN, L = 6 m; F = 63 kN, L = 12 m; F = 125 kN, L = 18 m) at their bolted connection nodes and at various scales (Figure 3 and Figure 4). The models included strain gauge measuring points for relative strain–stress (on the angles), bolt tension force magnitudes (in strain gauge transducers under the nuts), and inductive linear displacement sensors, located as shown in Figure 5 and Figure 6.
The connecting angle brackets allowed us to achieve complete contact with the working surfaces in each physical model of a given innovative bolted friction joint or bolted connection node (Figure 7).
The experimental stand had an adequately strong and rigid structure at the maximum values of force F for loading the physical models (up to 550 kN for destructive tests). The stand included upper and lower tables on single and multi-axis joints. This allowed us to map the boundary conditions of the support and the physical loads of the models as closely as possible to those factors occurring in the real bolted joints and connection nodes in the cranes’ headframes with girders.
The stand was designed to load physical models (with force F) via a pressure arm using a hydraulic press or load-blocking bolt. It included strain gauge force transducers in the form of strain gauge pins in an articulated connection between the lower table and the stand base. This allowed us to control the quasi-statically changed-loaded force F, the values of which were recorded with those of the other quantities determined using the measuring system, as schematically shown in Figure 8. The schematic shows the following:
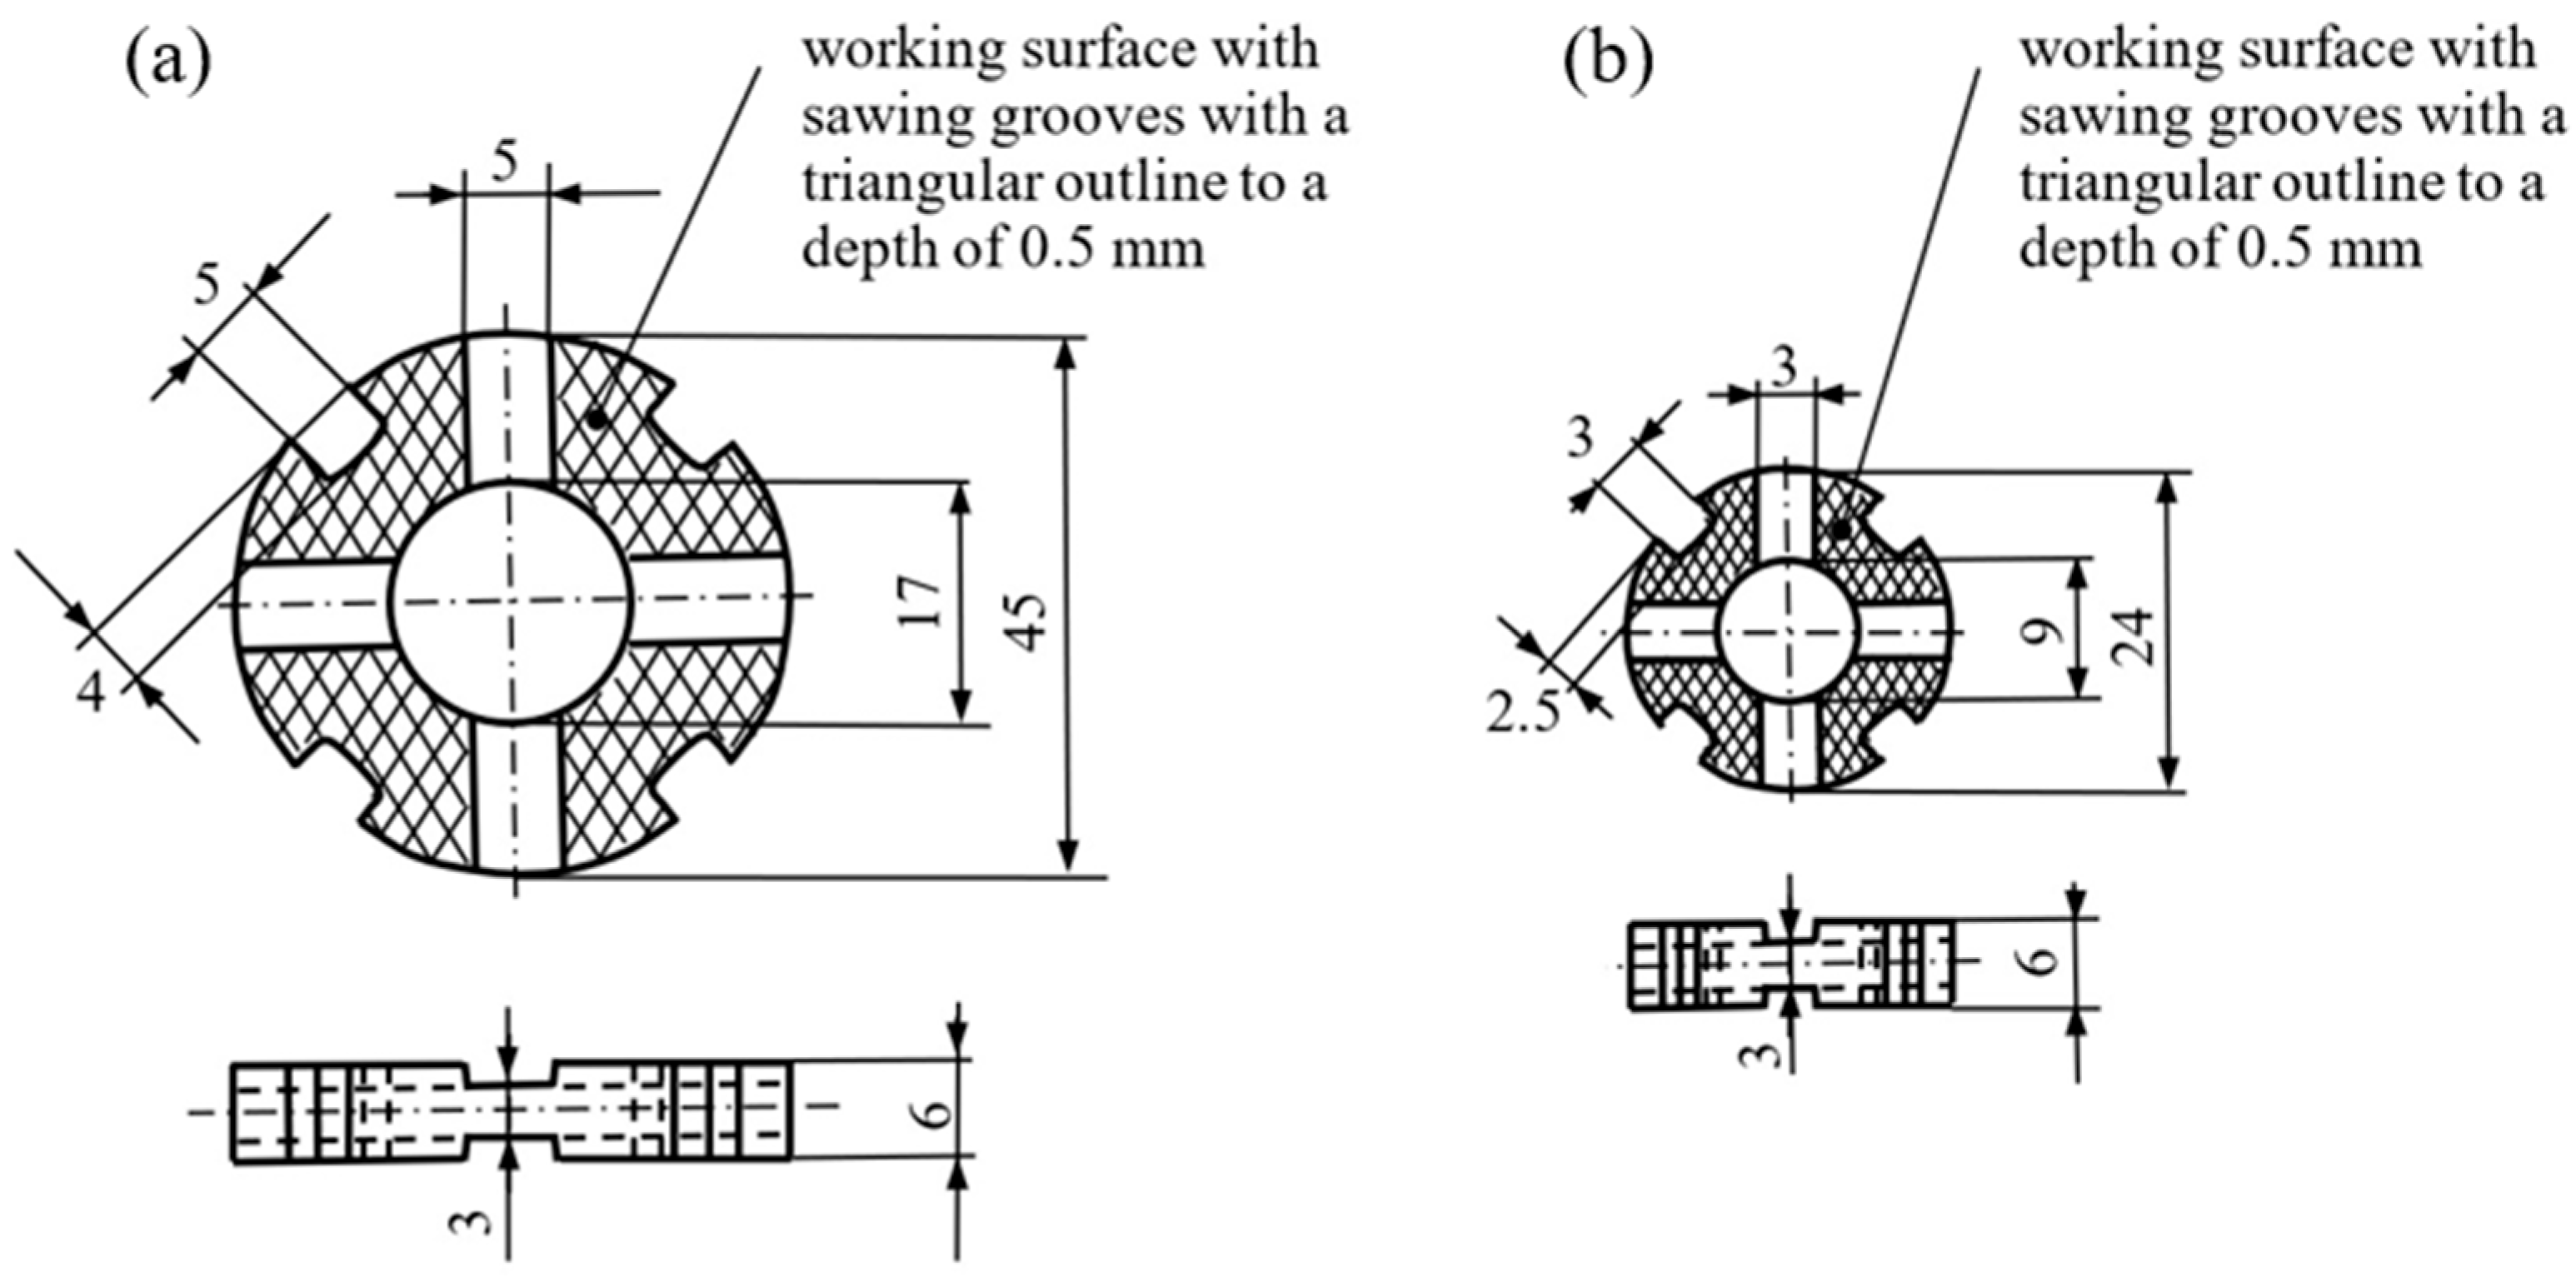
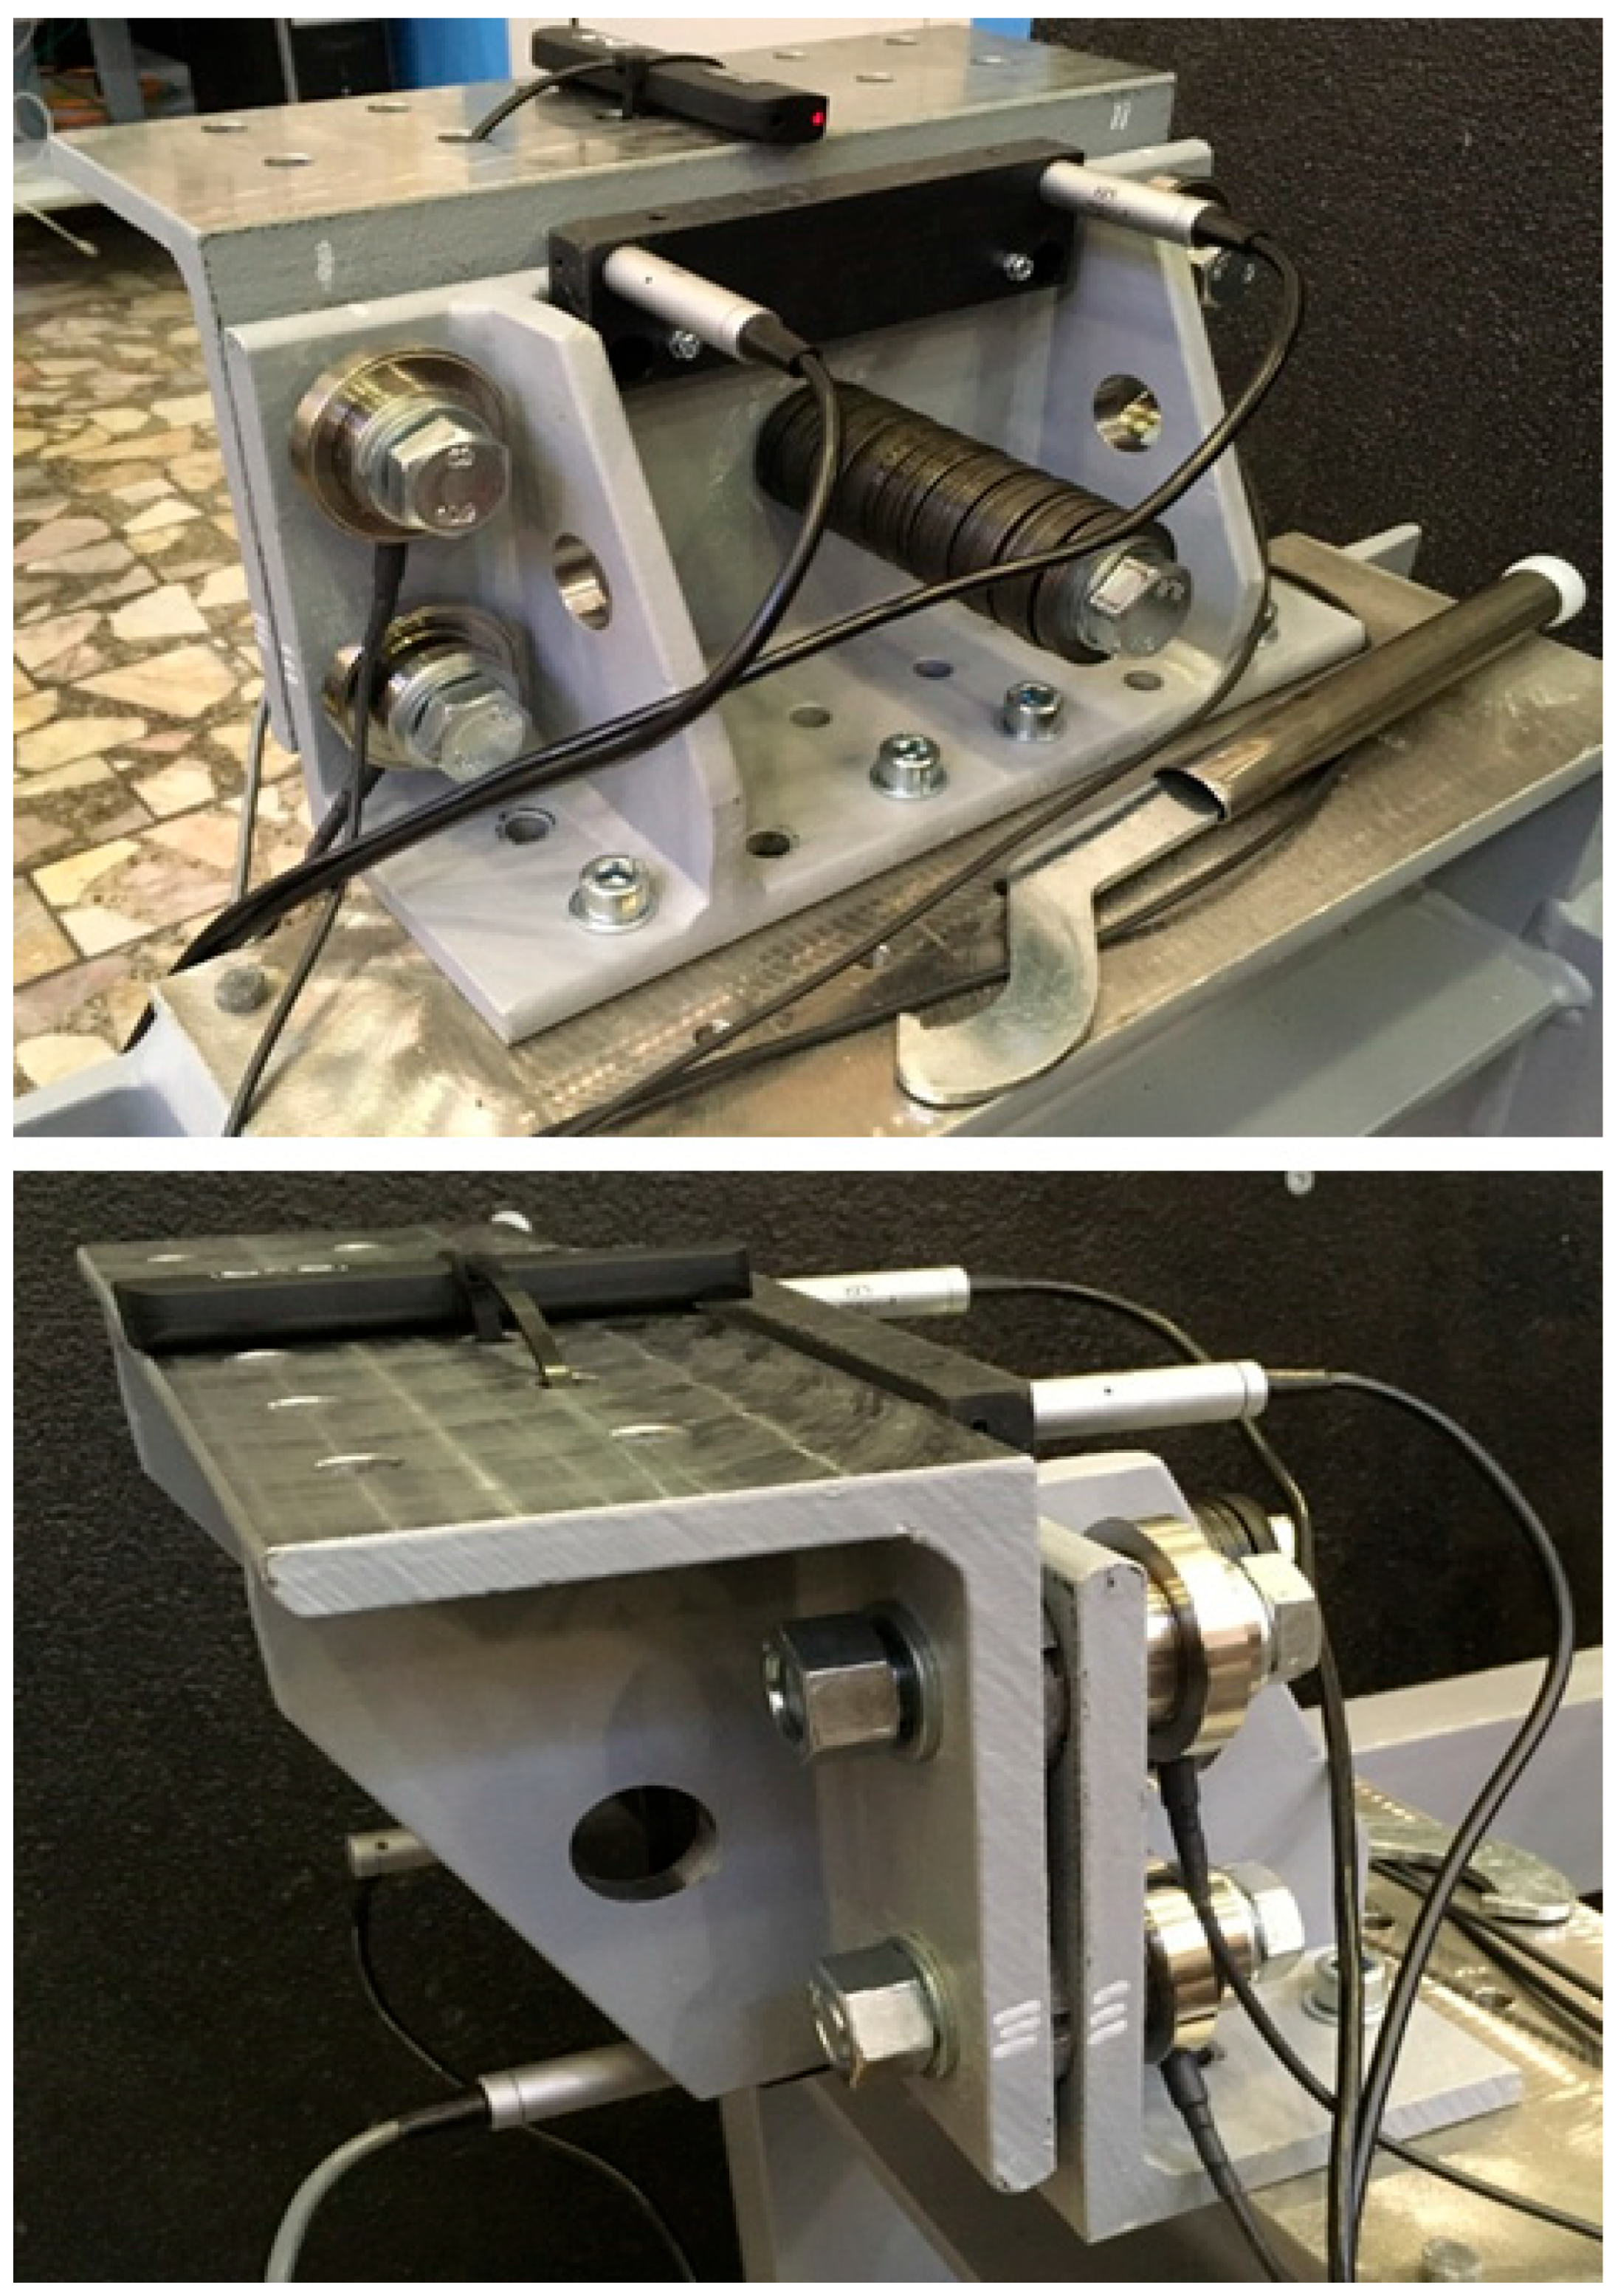
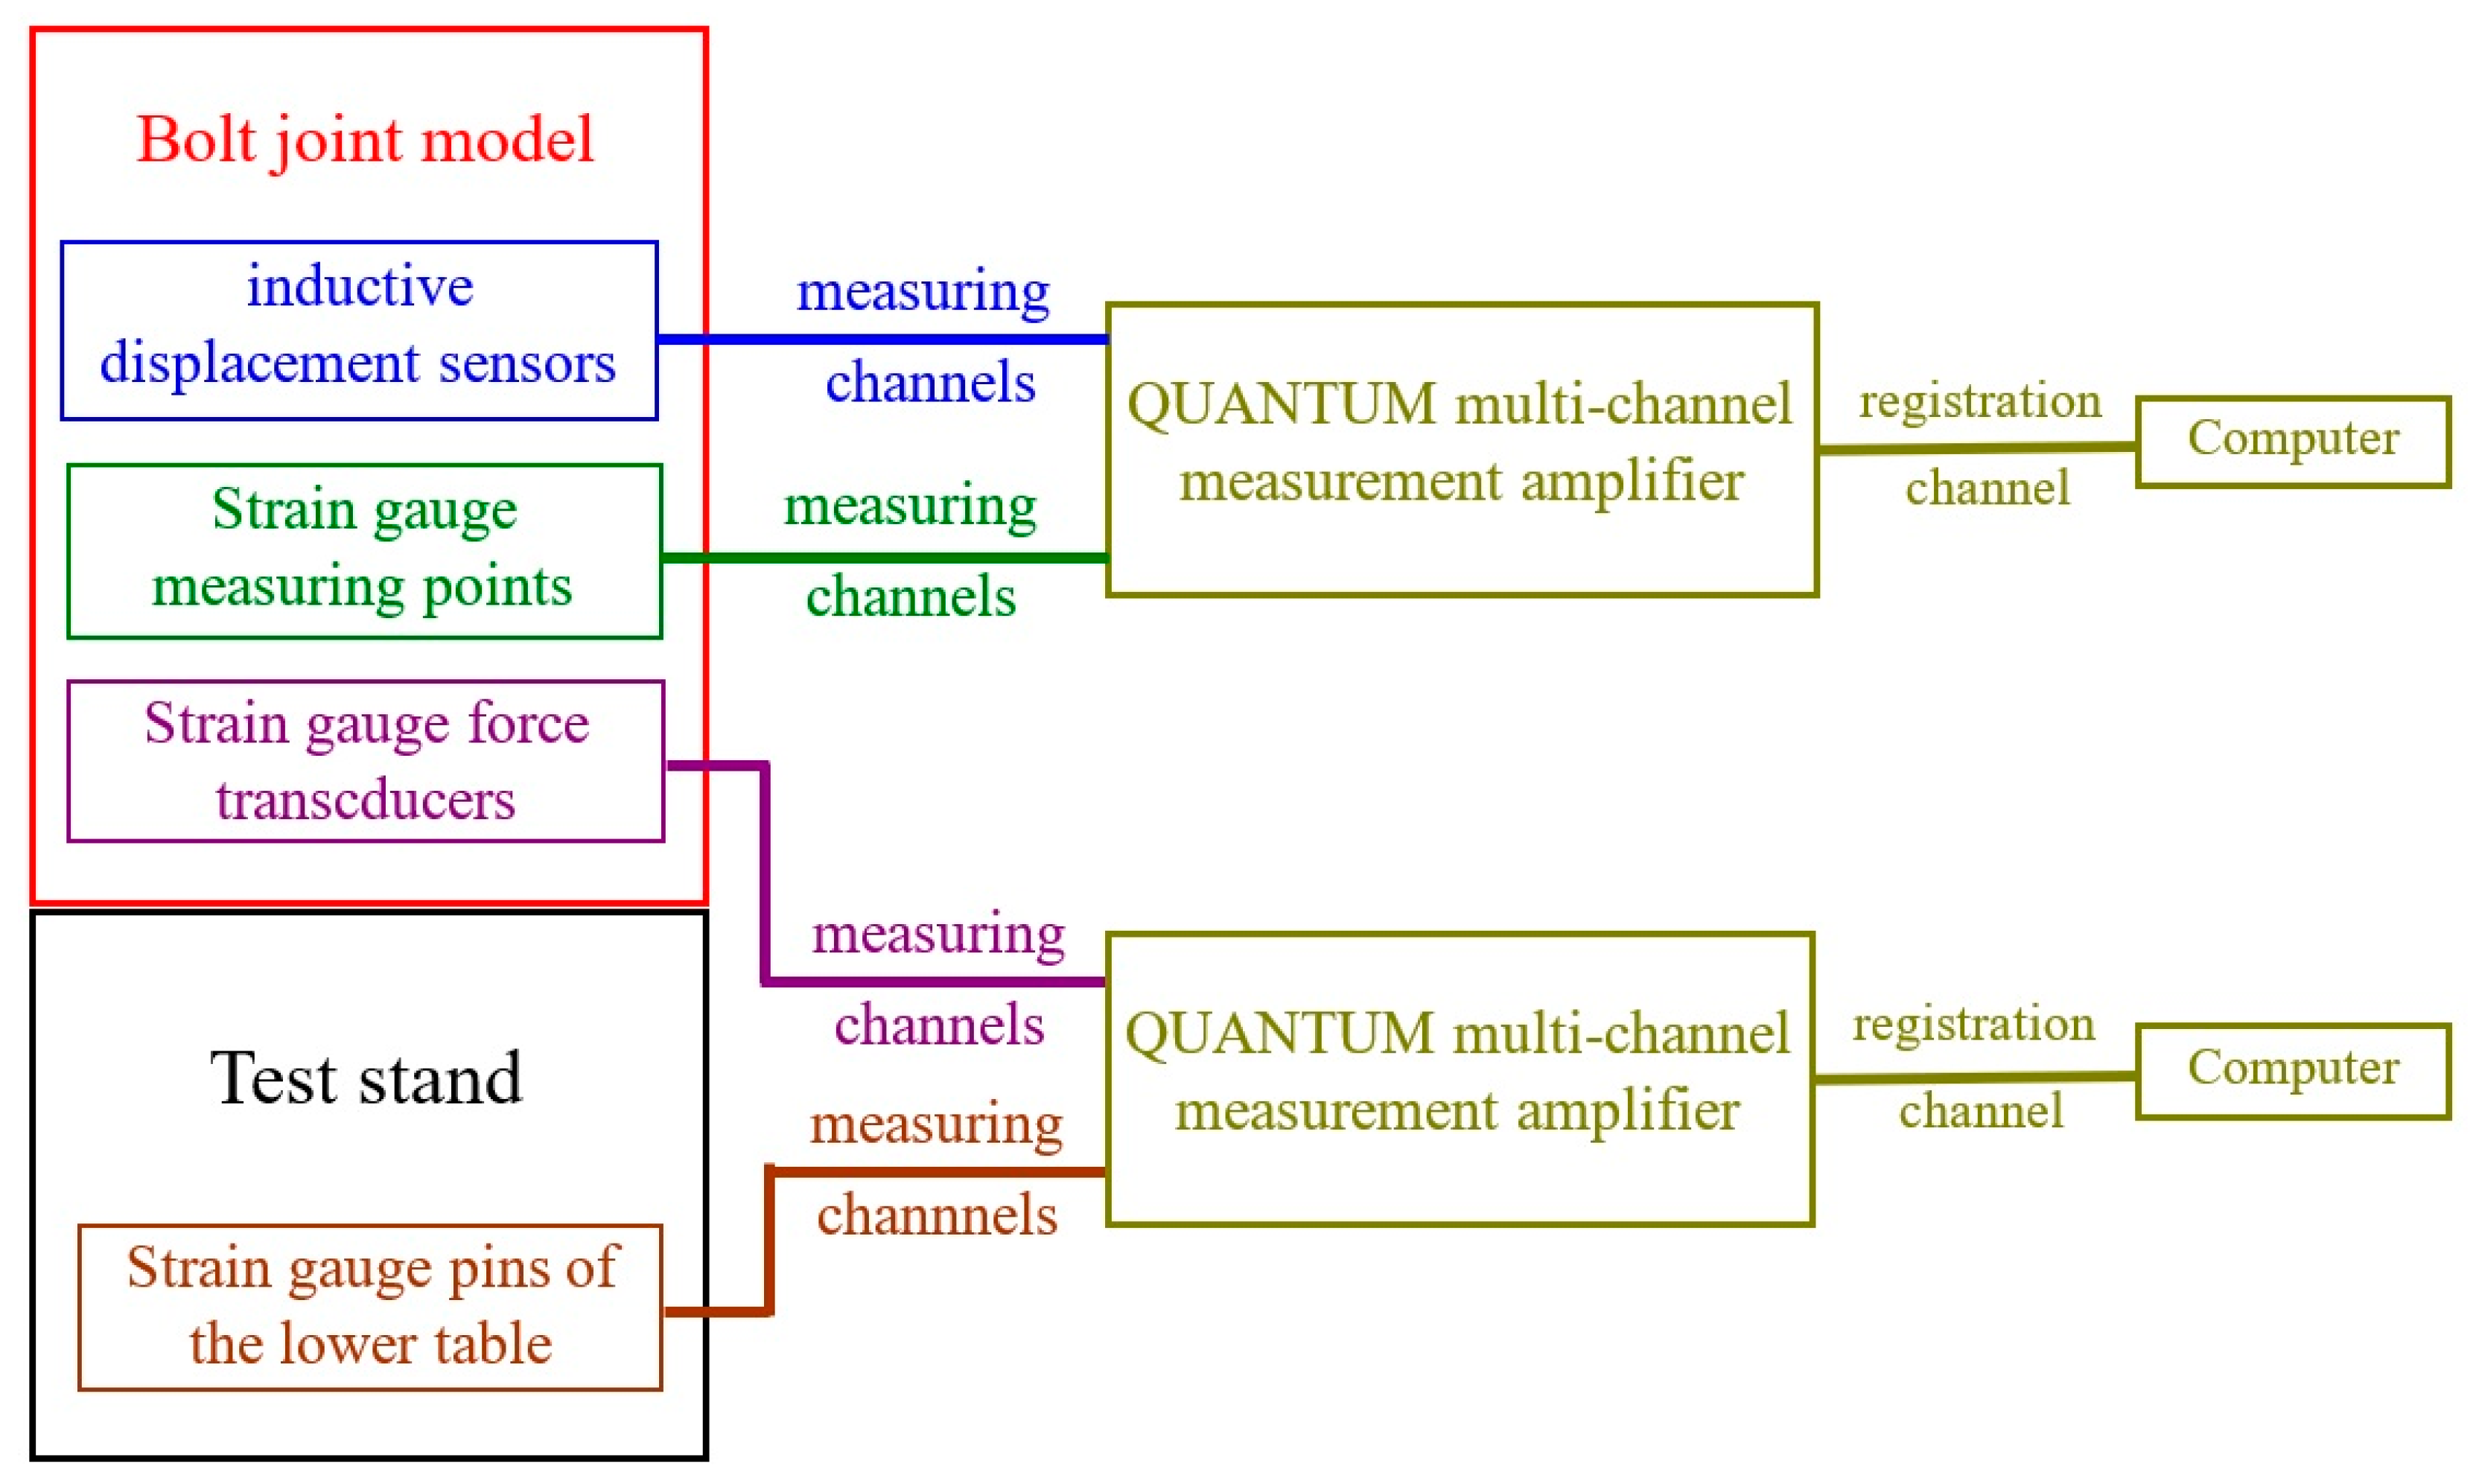
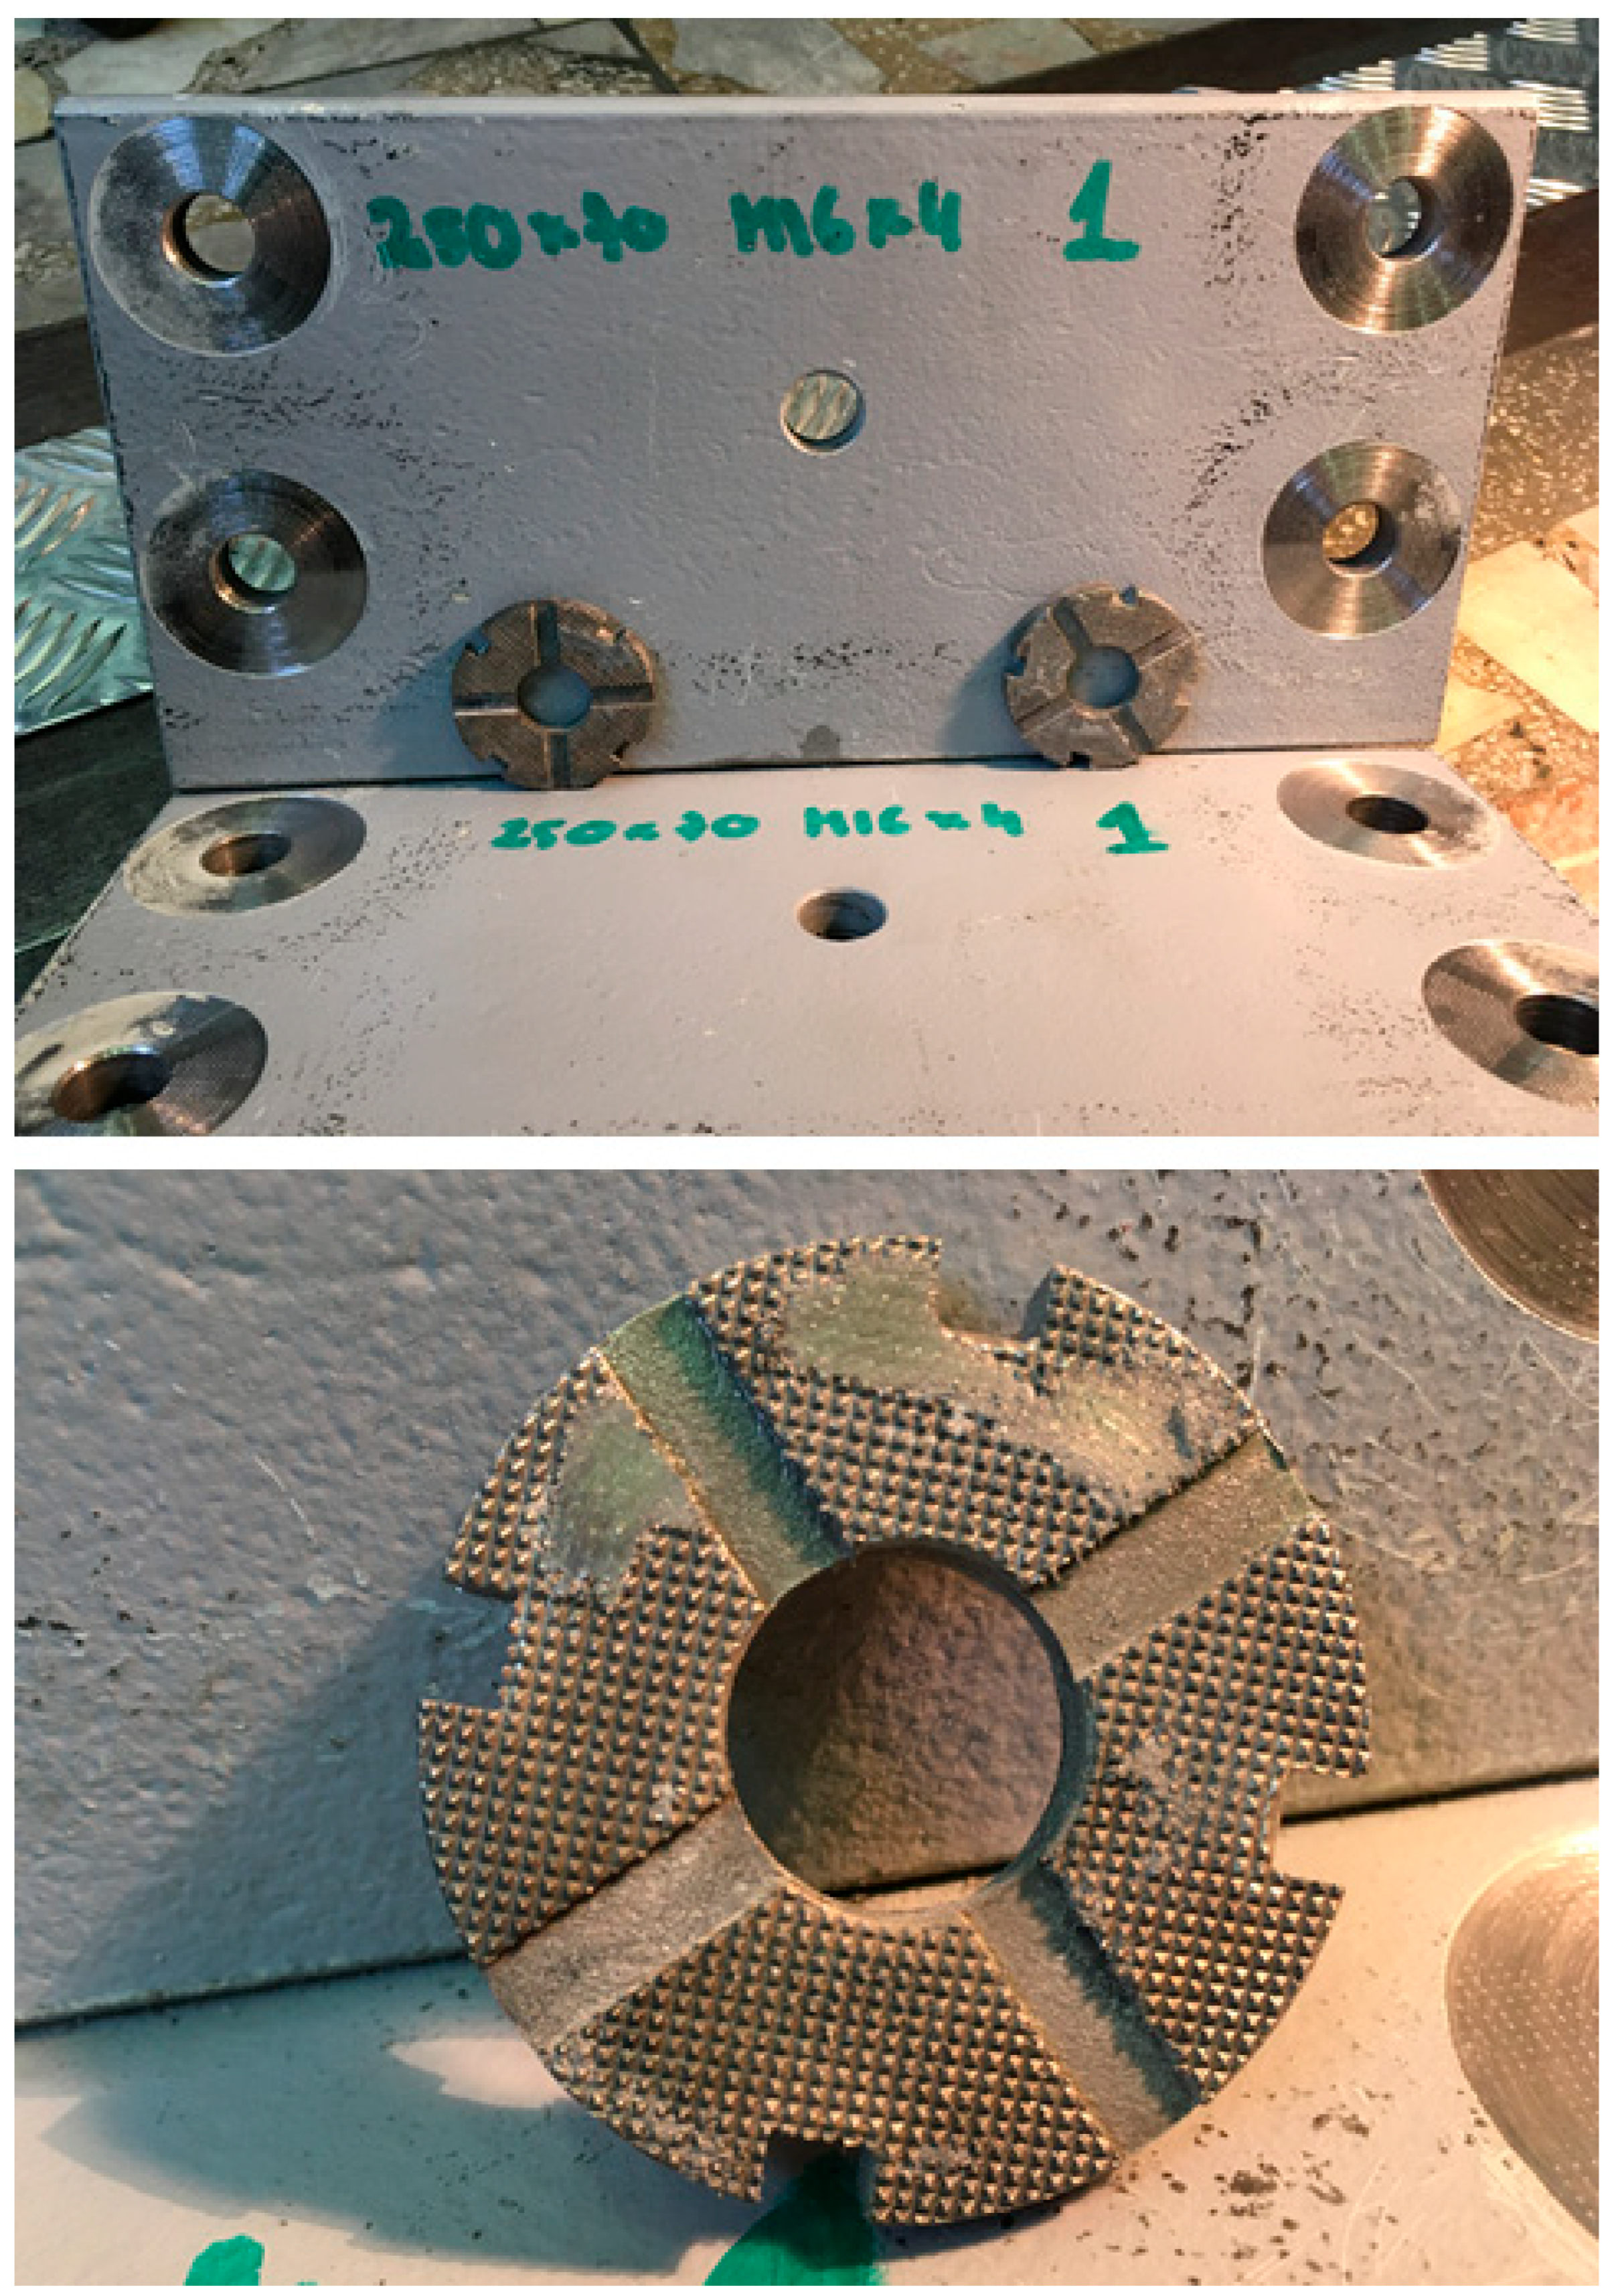
  • Resistance strain gauges with a measuring base of 3 mm, in pairs on the physical angles of the models (at the locations indicated in Figure 5 and Figure 6), in half-bridge arrangements. These were supplemented by full Wheatstone bridge arrangements with pairs of the same strain gauges on the outer plates to provide temperature compensation at each measuring point.
  • Resistance strain gauges (with a measurement base of 3 mm, a resistance of 120 Ohms, and a constant of k = 2.05) taped to the “strain gauge pins” of the stand (in the articulated connection of the lower table to the stand base) in full-bridge arrangements to measure the vertical and horizontal components of the lower table’s response to the external force F loading a given physical model of a bolted friction joint or junction node.
  • KMR-type strain gauge washers/force transducers from HBM with a measurement range of 200 kN under preloaded M16 bolts in physical models of bolted friction joints and bolted junctions, accuracy class 1.5.
  • MR-type strain gauge pads/force transducers from Hottinger Baldwin Messtechnik with a measurement range of 40 kN under M8 bolts with preloads in scaled physical models of bolted friction joints, accuracy class 1.5.
  • MDK-a-type inductive linear displacement sensors from VIS with a measuring range of 3 mm and an accuracy of 0.1% F.S.O.
  • KMM20-type force sensors from EMSYST with a measuring range of 0–5 kN and an accuracy of 0.25% F.S.O.
  • QuantumX MX840B- and MX1615B-type measuring multi-input amplifiers from Hottinger Baldwin Messtechnik to measure signals from points and strain gauge transducers and inductive sensors, with accuracy classes of 0.05 and 0.03, respectively.
The results of the first tests of this “whitening” sawing showed that primer paint on these surfaces, even in a thin layer, clogged the spaces between the teeth of the working surfaces of these rings (Figure 9). This reduced the effectiveness of sawing and necessitated prior adequate preparation of the surfaces of the angles of all the above-mentioned physical models before their “whitening”, which involved locally removing the paint coatings.
The first loading tests of the physical models showed an apparent hysteresis in the changes in the bolt tension forces and pronounced decreases in their values in the first few consecutive loading and unloading cycles. This was due to the progressive inelastic sinking of the teeth of the working surfaces of the spacer-bearing rings over the cycles (for the denting of these teeth into the jointed gusset-angle plates, see Figure 10). These decreases were limited to the magnitude of acceptable measurement errors (resulting from the accuracy of the measuring instruments) by “kneading down” the innovative friction-bolted joints several times (tightening their bolts), which was performed in advance before proceeding to each of the real load tests.
The physical models were tested successively as follows:
(a)
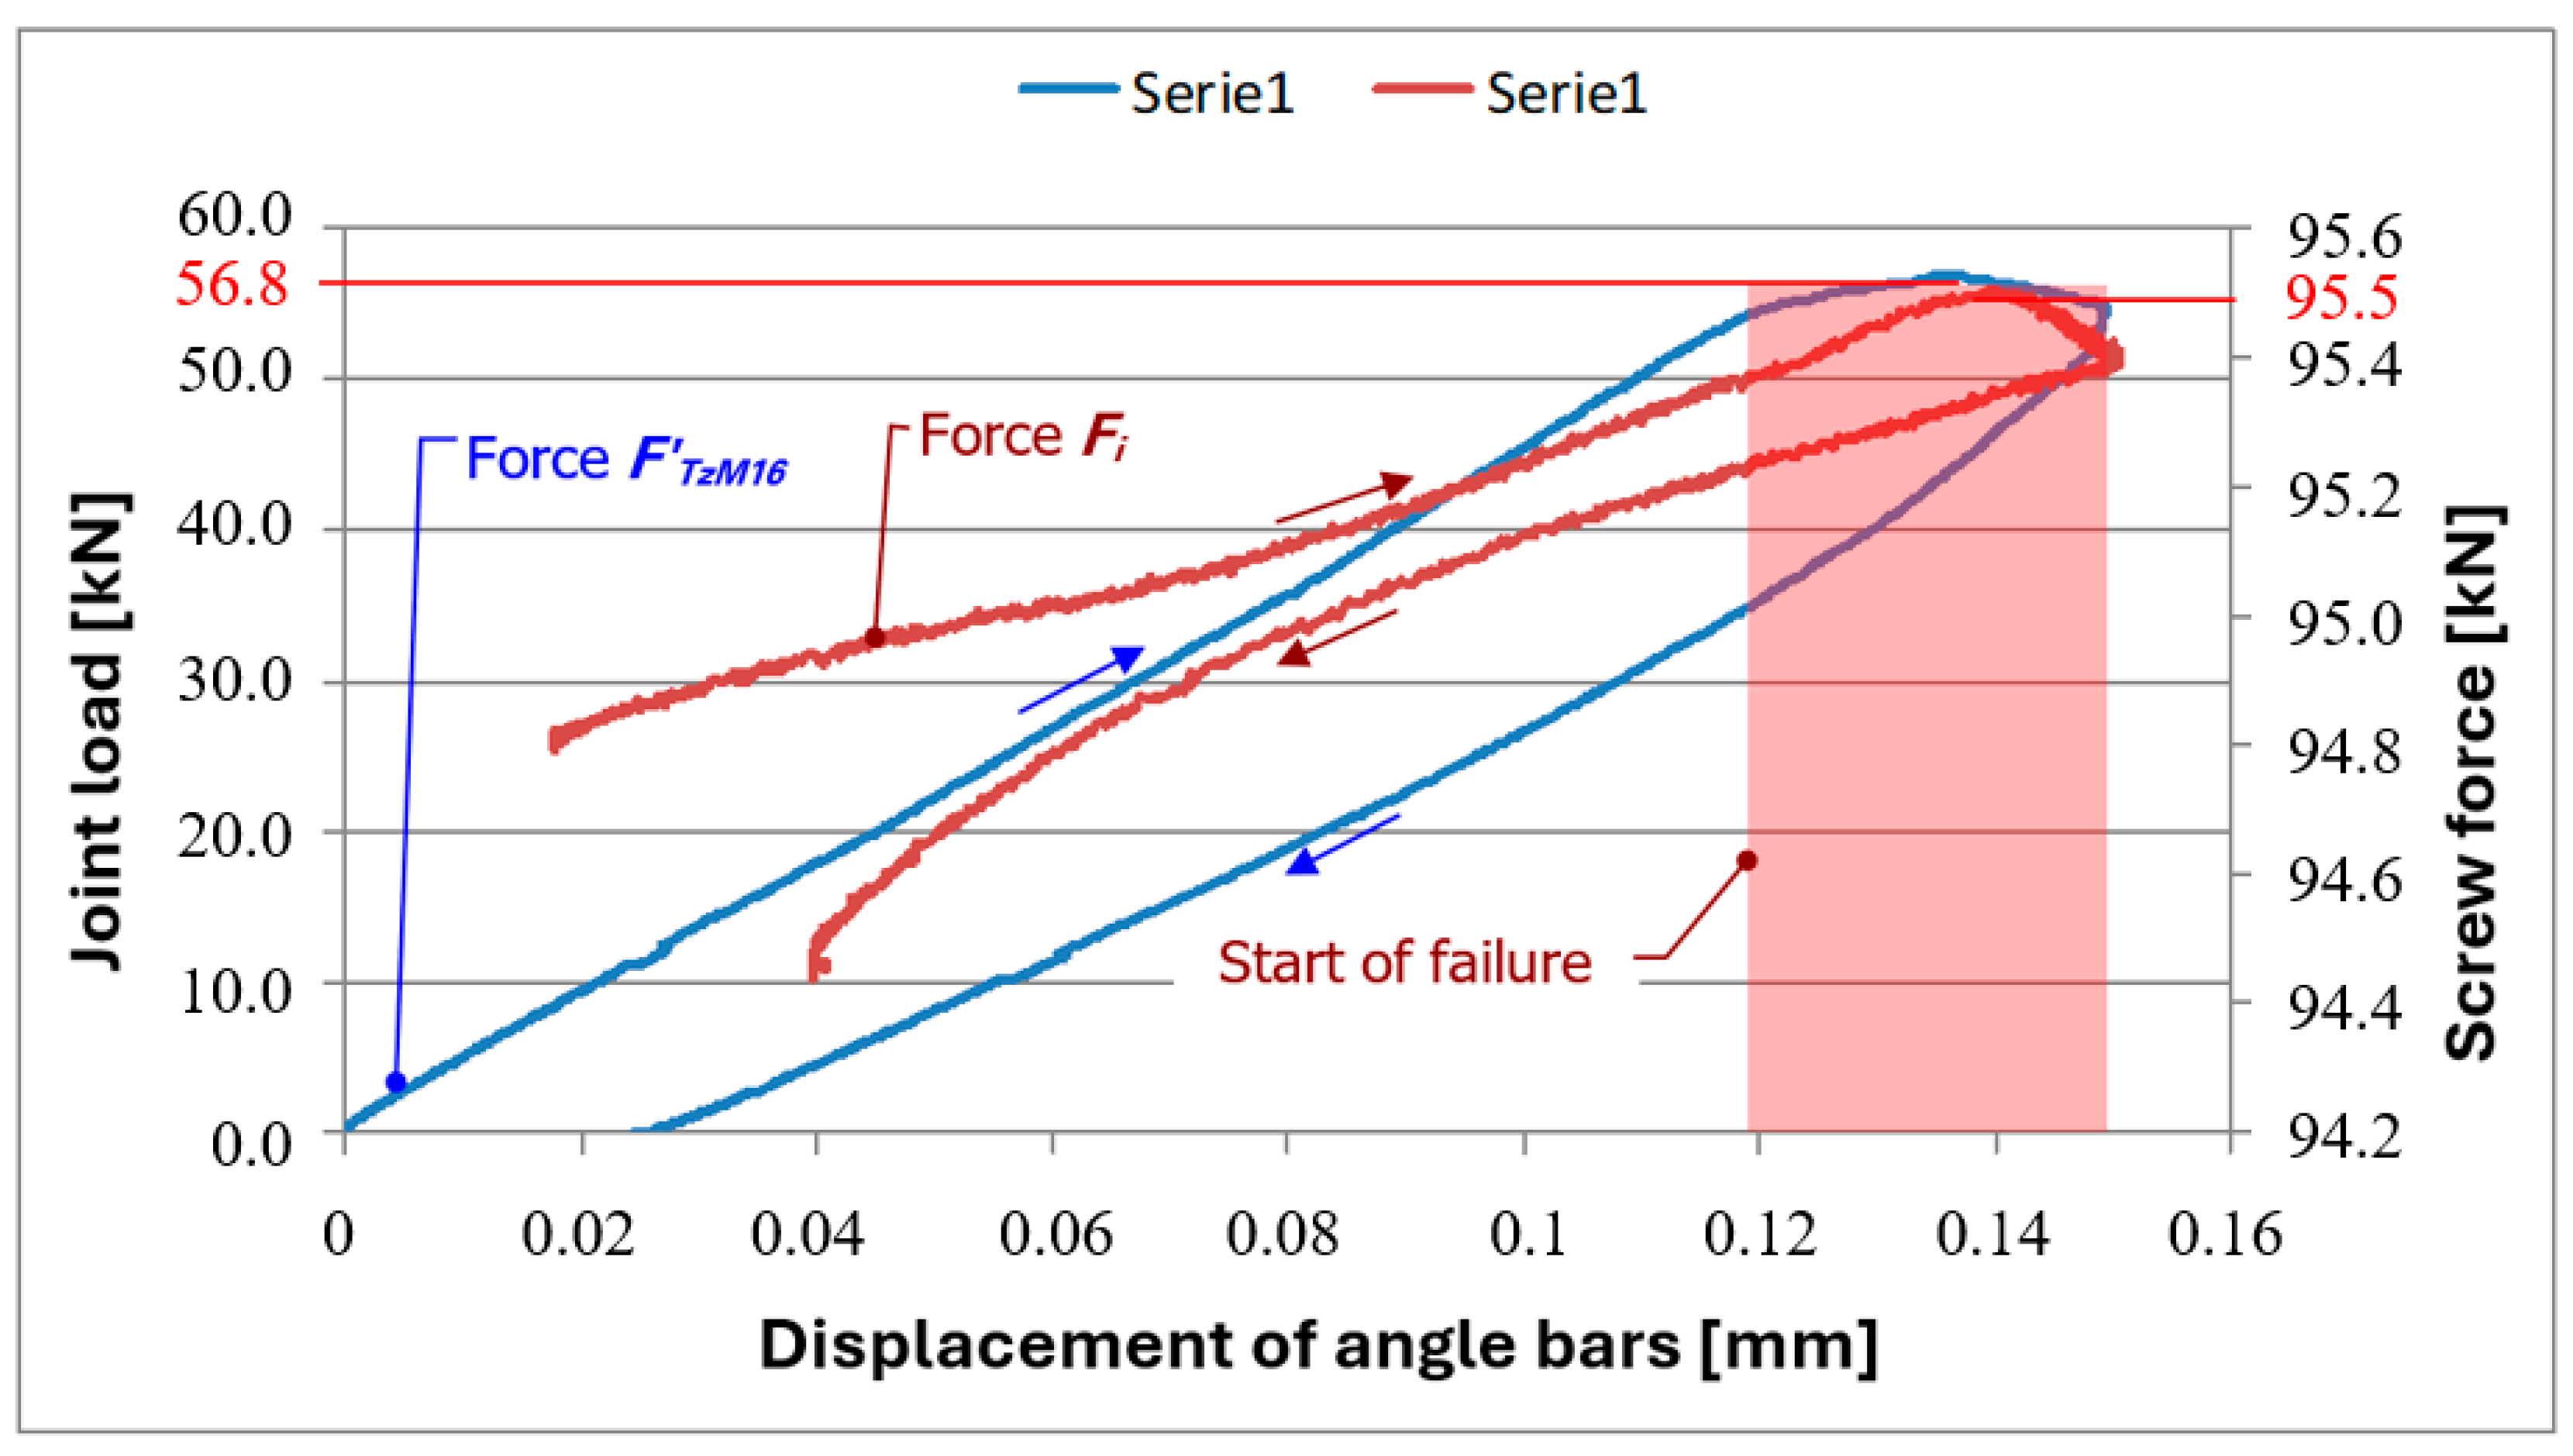
Load tests on physical model I (single innovative friction screw junction with M16 bolts, 1:1 scale). The results of these tests could also be applied to model II (single innovative friction screw junction with M24 bolts, 1:1.5 scale), meeting the criteria for model similarity.
(b)
Destructive tests on physical model I.
(c)
Load tests on physical model III (interconnecting node with M16 bolts, 1:1 scale).
(d)
Destructive tests on physical model III.
(e)
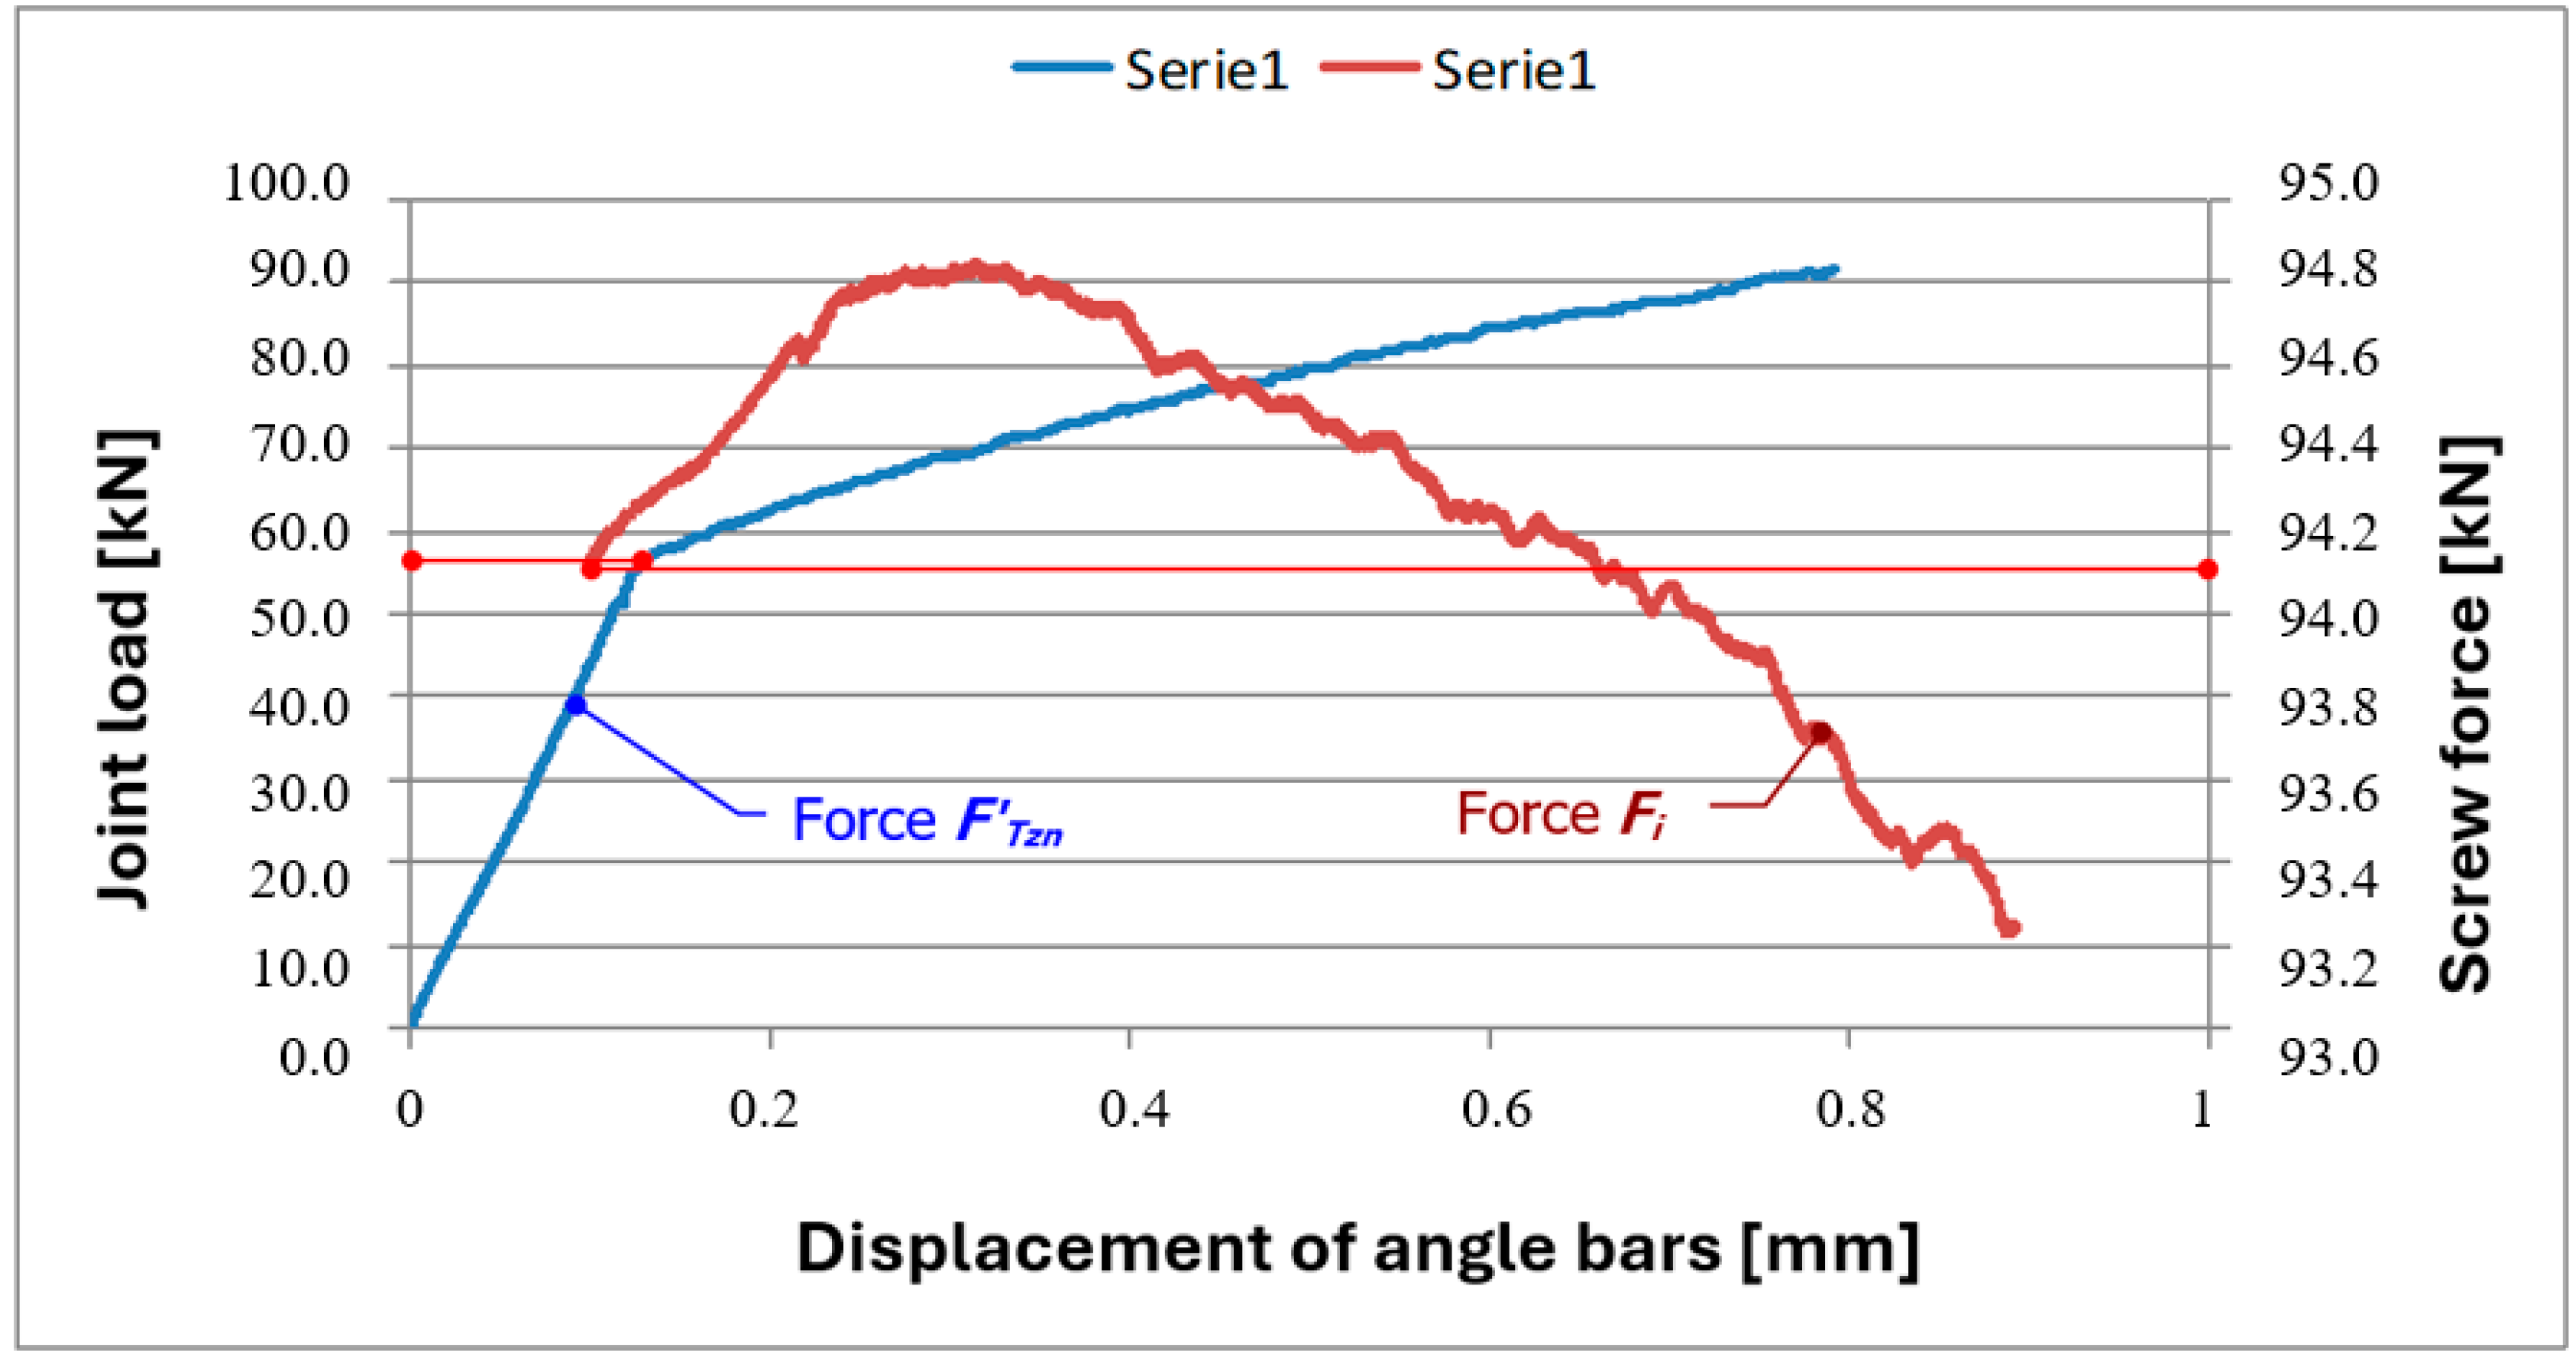
Load tests on physical model IV (connecting node with M16 bolts, 1:2 scale).
(f)
Destructive tests on physical model IV.
(g)
Load tests on physical model V (connecting node with M24 bolts, 1:2.5 scale).
(h)
Destructive tests on physical model V.

3. Results

The results can be discussed in accordance with the physical model description given in the final paragraph of Section 2. The surfaces of the two connecting angles were previously “whitened” in all cases.
(a) These tests were carried out on a bench (see Figure 1), with models as shown in Figure 3a. The surfaces of the two connecting angles were additionally “kneaded down” with spacer-bearing rings by tensioning the M16 bolt three times to a force value of F’pM16 = 98.9 kN + 2.5%. This value was practically equal to the preload force value F’pM24 = 222.5 kN for the M24 bolt at a scale of kF = 2.25, resulting from a scale of kl = 1.5. Each of the models was loaded five times with a vertical force, increasing in 10.0 kN increments in five steps until reaching a value of 50.0 kN, which is close to the frictional force limit, F’µTzM16, for models using M16 bolt ring data (dpzM16 = 45 mm, dpwM16 = 17 mm; see Figure 2a):
F’µTzM16 = µ × F’pM16 = 49.5 kN (for coefficient of friction µ = 0.5)
During each test, the strain gauge measuring point readings on the surfaces of the two joined angles and the inductive sensor readings of their relative displacements were recorded (Figure 5).
(b) These tests were carried out on the same bench as the one used in the loading tests on model I. The models were loaded with a vertical force, quasi-statically increasing in 10 kN increments in successive steps until reaching the failure effect (friction joints), defined as the inelastic mutual displacement of their connected angles without an increase in the external load. The force FM16 theoretically destroyed this joint, which was determined using ring data for an M16 bolt (dpzM16 = 45 mm, dpwM16 = 17 mm; see Figure 2a):
FM16 = ftu × AsFzM16 = 385.5 kN
where AsFzM16 = π[(dpzM16)2 − (dpwM16)2]/4 = 1363 mm2
ftu = 283 N/mm2
During these tests, the readings at the same measuring points as those used in the load tests were recorded, and similarly, these readings were averaged to determine the results of the destructive tests.
(c) These tests were carried out on the same bench as the one used in the load tests, but this time with the model III connection nodes according to Figure 3. The surfaces of the two connecting angles were additionally “crumpled,” and the M16 bolts had been pre-tensioned to the force value F’pM16 = 98.9 kN, with an accuracy of + 2.5%. The loading tests on physical model III were similar to those performed on model I, but model III was tested in a loading arrangement with a vertically increasing shear force, F, and additional forces, F’Mz = 2.5 kN, diverging in the horizontal plane. The five-fold loading cycles of these models were carried out in five 40.0 kN steps until reaching 200.0 kN, equal to four times the frictional force limit, F’µTzM16, defined according to Relation (1). During each test, strain gauge measuring point readings on the surfaces of the two joined angles and the inductive sensor readings of their relative displacements were recorded (Figure 6). The results of these trials were the averaged values of the aforementioned indications.
(d) These tests were carried out on the same bench as that of the loading tests on the III models. The models were loaded with a vertical force, quasi-statically increasing in 20.0 kN increments until the failure effect was detected. During these tests, the inductive linear displacement sensor readings from the destroyed model III were not recorded, as these sensors were removed from the bench due to their risk of mechanical damage. The readings recorded for the remaining measurement points were averaged to determine the results of the destruction tests on the above models.
(e) These tests were carried out on the same bench as the one used in load tests, but this time with the model IV connection nodes according to Figure 4a. The model bolt connectors (M8 bolts) had been preloaded to a force value of F’p6M16 = 21.8 kN, which was assumed to be lower than 34.2 kN (resulting from scale conversions) due to the possibility of plasticization in the M8 bolts. The locations of the strain gauge measuring points and linear displacement sensors of the elements in the above models were analogous to those shown in Figure 6. The course of the physical loading tests on the IV models was similar to those described above. However, the models were loaded with diverging forces with values up to F’Mz = 6.5 kN. The vertical loading force on these models was increased in 10.0 kN increments in seven steps until a value of 70.0 kN was reached.
(f) These tests were a continuation of the above-described loading tests using the IV models. The models were further loaded with a vertical force increasing in 20.0 kN increments in successive steps until their destruction after the horizontal displacement sensors of the angle brackets were removed in the direction of the opening of their lower screw joints. The readings recorded for the remaining measurement points were averaged to determine the results of the destructive tests.
(g) These tests were carried out on the same bench as the one used in the load tests, but this time with the model V connection nodes according to Figure 4b. The model bolt connectors (M8 bolts) had been preloaded to a force value of F’p6M16 = 21.8 kN, which was assumed to be lower than 34.2 kN (resulting from scale conversions) due to the possibility of plasticization in the M8 bolts. The locations of the strain gauge measuring points and linear displacement sensors of the elements in the above models were analogous to those shown in Figure 6. The course of the physical loading tests on model V was similar to those described above, but the models were loaded with diverging forces with values up to F’Mz = 6.5 kN. The vertical loading force on the models increased in 10.0 kN increments in six steps until reaching a value of 60.0 kN.
(h) These tests were a continuation of the above-described loading tests using the V models. The models were further loaded with a vertical force increasing in 20.0 kN increments in successive steps until their destruction after the horizontal displacement sensors of the angle brackets were removed in the direction of the opening of their lower bolted joints. The readings recorded for the remaining measurement points were averaged to determine the results of the destructive tests.
Select results of the load and destructive tests are presented in Table 1 and Table 2. Table 1, for example, shows the results of a load test on one of the I models, ending with its overloading by about 14% (concerning the maximum value of FM16 = 50.0 kN for the force loading in this model), i.e., to a value of 56.8 kN. At this point, the load capacity of the model’s friction joint was lost, marked as “floating” in Figure 11. This figure shows the changes in the Fi and FM16 forces during this test. Their ratio of maximum values, i.e., 56.8 kN to 95.5 kN, determines the value of the frictional joint limit coefficient, which is equal to 0.59.
The results of the destructive tests on model I confirmed the “floating” of the frictional joints of these models in a range of force values: 50 kN < Fnmax < 60 kN.
Given the results of the load and damage tests on model I, it can be concluded that its shear load capacities were not less than the corresponding design capacity, according to [34]. Furthermore, the experimental values of its friction joint limit coefficient were not less than the maximum friction coefficient value of 0.5, according to this standard.
Table 2 shows the results of the loading tests on the screw models of the joint nodes (models III, IV, and V), carried out in a manner analogous to the loading tests on models I and II, with different ranges and increments for the vertical external force and different initial screw tension values resulting from the different scales of these models. This primarily confirms the expected variation in the Fi tension forces in the screws of these models resulting from different engineering calculation methods, as they were quasi-statically loaded with the vertical external force F.
Accompanying this variation, changes in the relative strain and linear displacement values (marked in light and dark yellow in the boxes of Table 2) indicate the following:
(a)
Dilation occurred in the lower friction joints (at points 3, 4, 5, and 6) in all bolted junction models (III, IV, and V). The highest values of Fi exceeded the values of F’pM( ) with respect to preloading their bolts (M16 and M24 in the corresponding scales) but did not reach the values of the plasticizing forces for these bolts.
(b)
Tightening occurred in the top elements of the friction joints (at points 1 and 2) in all screw connection node models (III, IV, and V). The values of Fi fell (mostly after the first load tests) by 12% to 18% and, according to the averaged results, approximately 2% below the values of F’pM( ) in the initial bolt tension values.
This dilation undoubtedly reduces the form–factor contact of the load-bearing elements with the lower bolted friction joints; namely, the spacer-bearing rings with the connected elements. This is apparent in the surfaces of the connected elements–angles, with barely visible traces of tooth imprints from the spacer-bearing rings, as shown in Figure 4a. This dilation also undoubtedly reduces the shear capacity of these joints in the connecting bolt nodes in question.
However, pressing increases the shaped contact of the load-bearing upper elements of the bolted friction joints. Their working surfaces are then frictionally coupled, which is also evident in the surfaces of the connecting elements–angles, with apparent imprint marks from the distance-bearing teeth of the rings (Figure 10b). This undoubtedly increases the shear capacity of these joints and significantly compensates for the negative effect of dilation in the upper joints on the capacity of the connecting bolt nodes in question.
The results of the destructive tests on the model III, IV, and V connecting bolt nodes (Table 2) showed that the experimentally determined capacities of these nodes (the limits of their “flow”) are not less than their design capacities according to the standard [34]. According to this standard, the maximum values of F were determined for the load tests on these models.
In the model IV and V connection nodes (at 1:2 and 1:2.5 scales, respectively), it was possible to measure the linear displacements of their element angles during the destructive tests. The measurements from these tests show changes in the courses of the F and Fi values, deformations in strain gauges P1 and P2, and vertical linear displacements in the element angles of these models, indicating the limits/beginnings of their “floating”. These changes can be seen in the increments in the values of the quantities shown in Table 2 (in cells marked with colors in the case of model III), indicating the averaged values of the experimental load capacities of models IV and V are equal to 85 kN and 65 kN, respectively (see Figure 12). When these values are converted according to the force scales of these models, kF = 4.0 and kF = 6.25, we obtain values of 340 kN and 406 kN, respectively, which are the destructive forces of the real bolted connection nodes.
The measured values of the tensile Fi forces in the bolts are exemplified in Table 1 and Table 2. The tensile Fi force values in the bolts, relative deformations, and linear displacements in the plate angles of the tested models were the basis for the experimental verification of the numerical computational models. These models were subsequently used in numerical analyses of the load capacity of the bolted friction connection nodes in the main parts of the load-bearing structures of the light cranes. The models demonstrated the following:
(a)
A range of +20% for the differences between the measured and calculated values was adopted as a criterion for the positive verification of these numerical calculation models. This accounts for an adequate accuracy of +10% in the representative geometry, the mechanical strength parameters, and the load conditions of the real screw friction joints and the connecting nodes containing them. This defines the maximum deviations in the calculated values as no more significant than +10% deviations of those values measured in the tests, which is considered acceptable. The test values were converted according to the relevant kl of kF scales into values comparable to the calculated ones.
(b)
To reduce the impact of the scale effect on the verifications in question, weights were assigned to groups of physical model test results, mainly depending on their scaling. The greatest weights were assigned to the results for models tested on a 1:1 scale. In contrast, the test results for the other physical models were assigned smaller weights, proportional to fractions that were the inverse of the values of the scaled-down models.

4. Conclusions

Based on the results of all the above tests, we can conclude the following:
  • The tests generally confirmed the expected advantages of bolted friction joints, according to the solution described in patent no. PL 238010 B1. This also established the load capacity of the vertical bolted connection nodes in the faces and girders of light cranes (with the parameters listed in Table 1). Finally, this confirmed the possibility of using local machining on surfaces, connecting the nodes of flange plates or gusset plates (with the help of spacer-bearing machining rings to obtain complete contact between all load-bearing friction elements) without the need for machining of the entire plate surface.
  • Maintaining the geometric and mechanical parameters of spacer-bearing rings in innovative connectors—at least for those that are not inferior to those of the rings created for this research—is a fundamental condition for ensuring the effectiveness of “whitening” the surfaces of the connected elements. Maintaining these parameters also determines the real load capacity of innovative bolted connectors and the possibility of reducing the cost associated with forming connecting nodes in the load-bearing structures of light cranes with these connectors. This will make it possible to eliminate the need to machine (plan) the complete surfaces of connected elements (sheets) coming into contact with these nodes. Screw connection nodes containing innovative screw friction joints may have a load-bearing capacity 10% higher real load capacities than the calculated load capacities of comparable connection nodes, according to existing design solutions (e.g., the standards in [34,35,36,37]).
  • Ensuring the required load-bearing capacity of these connectors also depends on due care in their manufacture, particularly in kneading down, which mainly refers to the spacer-bearing rings of these joints. Three repetitions in the assembly work conducted for the experimental load-bearing structures were sufficient to achieve stability in the bolt preload forces in the innovative connection nodes of these structures. Under the described control test conditions, this allowed them to carry loads that were not smaller than those that occur under real operating conditions for the relevant cranes. Obtaining higher load capacities is conditioned not only by the hardness and quality of execution of the rings, but also by the care taken in creating these rings. With the help of such rings, as well as careful implementation, elements that need to be joined can be “whitened.” These elements can also be “whitened” by overcooking them several times with the rings in individual innovative friction joints before the final tensioning of their bolts.
  • Given the results of this research, we would be justified in undertaking further in-depth, fundamental research using appropriate tools applied in the field of technical sciences. Regarding friction-shaped joints in the innovative bolt joints described herein, such research would reveal the influence of the following factors on the magnitude of the forces applied to these joints: bolt preload forces; the depth and shape of the tooth outlines of the working surfaces of spacer-bearing machining rings; and kneading down.
  • Until these results are recognized and implemented, the current provisions in relevant regulations and standards on the limits of friction joint coefficients should be applied when designing load-bearing superstructures for light overhead cranes with connecting nodes using the types described in this study. These current values should be used even though they are at least several percent smaller than the corresponding values resulting from our tests. In experimental load-bearing structures, it is advisable to make their prototype connection nodes in two ways; for example, with class 10.9 bolts (as in the above-described physical models of the nodes tested on the experimental bench) and class 12.9 bolts.
  • Based on the results of the experimental physical tests conducted on the models, it can be expected that a higher tension force than that of class 10.9 bolts in class 12.9 bolts will make it possible to eliminate (or at least reduce) the need for the number of procedures required for the kneading down of connected elements and spacer-bearing machining rings in individual innovative bolted friction joints.
The presented results regarding this research were selected from the body of work carried out under the “Research on the development of modern connections in the construction of load-bearing structures of light overhead cranes” project (subsidized under ROP WO 2014–2020, Measure: 1.1 Innovations in enterprises), carried out by FORTECH Civil Company: G. Ceglarz, M. Kabata, and R. Żbik.
The innovative bolted joints under study were developed for use in load-bearing structures of light cranes (spans up to 18 m and lifting capacities up to 160 kN) and similar load-bearing structures.
This study presented descriptions and test results that concern the determination of the load-carrying capacity of innovative friction-bolted connectors (protected under patent no. PL 238010 B1); the multi-screw connection nodes containing them; and the possibility of applying these nodes to the load-bearing structures of light overhead cranes with lifting capacities to 160 kN, spanning up to 18 m, and working intensity groups of up to A5, according to the PN-ISO4301-1 standard [38].

Author Contributions

Conceptualization, R.C.; methodology, R.C.; software, R.C.; validation, R.C. and P.S.; formal analysis, R.C. and P.S.; resources, P.S.; writing—original draft preparation, R.C.; writing—review and editing, P.S. All authors have read and agreed to the published version of the manuscript.

Funding

Regional Operational Programme for Opolskie Voivodeship (RPO WO) 2014–2020, Activity: 1.1 Innovation in enterprises.

Institutional Review Board Statement

Not applicable.

Informed Consent Statement

Not applicable.

Data Availability Statement

The original contributions presented in this study are included in the article. Further inquiries can be directed to the corresponding author.

Conflicts of Interest

The authors declare no conflicts of interest.

References

  1. Krot, P.; Shiri, H.; Dąbek, P.; Zimroz, R. Diagnostics of Bolted Joints in Vibrating Screens Based on a Multi-Body Dynamical Model. Materials 2023, 16, 5794. [Google Scholar] [CrossRef] [PubMed]
  2. Vu, L.K.; Nguyen, B.D. Numerical Simulation for Self-Loosening Phenomenon Analysis of Bolt Joint under Vibration. Int. Sch. Sci. Res. Innov. 2020, 14, 603–606. [Google Scholar]
  3. Miao, R.; Shen, R.; Zhang, S.; Xue, S. A review of bolt tightening force measurement and loosening detection. Sensors 2020, 20, 3165. [Google Scholar] [CrossRef] [PubMed]
  4. Yu, Q.; Zhou, H.; Wang, L. Finite element analysis of relationship between tightening torque and initial load of bolted connections. Adv. Mech. Eng. 2015, 7, 1–8. [Google Scholar] [CrossRef]
  5. Ptak, A.; Leśniewski, T.; Purzycki, M.; Płonka, K. Efficiency of polymer materials in highly loaded systems in the aviation industry. Aviation 2023, 27, 272–278. [Google Scholar] [CrossRef]
  6. Croccolo, D.; De Agostinis, M.; Vincenzi, N. Influence of tightening procedures and lubrication conditions on titanium screw joints for lightweight applications. Tribol. Int. 2012, 55, 68–76. [Google Scholar] [CrossRef]
  7. Croccolo, D.; De Agostinis, M.; Fini, S.; Olmi, G. Tribological properties of bolts depending on different screw coatings and lubrications: An experimental study. Tribol. Int. 2017, 107, 199–205. [Google Scholar] [CrossRef]
  8. Brończyk, A. Analysis of friction and wear processes in an innovative spine stabilization system: Part 2. A study and model of the wear of a metal rod-polymer cord friction joint. Acta Bioeng. Biomech. 2022, 24, 23–35. [Google Scholar] [CrossRef]
  9. De Agostinis, M.; Fini, S.; Olmi, G. The influence of lubrication on the frictional characteristics of threaded joints for planetary gearboxes. Proc. Inst. Mech. Eng. C J. Mech. Eng. Sci. 2016, 230, 2553–2563. [Google Scholar] [CrossRef]
  10. Nelson, N.R.; Prasad, N.S.; Sekhar, A.S. Structural integrity and sealing behaviour of bolted flange joint: A state of art review. Int. J. Press. Vessel. Pip. 2023, 204, 104975. [Google Scholar] [CrossRef]
  11. Croccolo, D.; De Agostinis, M.; Vincenzi, N. Failure analysis of bolted joints: Effect of friction coefficients in torque-preloading relationship. Eng. Fail. Anal. 2011, 18, 364–373. [Google Scholar] [CrossRef]
  12. Liu, X.; Fan, J.; Wang, H.; Jiang, J.; Liu, J.; Gong, X.; Peng, J.; Zhu, M. Effect of wear between contact surfaces on self-loosening behaviour of bolted joint under low frequency torsional excitation. Tribol. Int. 2022, 174, 107764. [Google Scholar] [CrossRef]
  13. Liu, Z.; Zheng, M.; Yan, X.; Zhao, Y.; Cheng, Q.; Yang, C. Changing behavior of friction coefficient for high strength bolts during repeated tightening. Tribol. Int. 2020, 151, 106486. [Google Scholar] [CrossRef]
  14. Qin, X.; Peng, C.; Zhao, G.; Ju, Z.; Lv, S.; Jiang, M.; Sui, Q.; Jia, L. Full life-cycle monitoring and earlier warning for bolt joint loosening using modified vibro-acoustic modulation. Mech. Syst. Sig. Process 2022, 162, 108054. [Google Scholar] [CrossRef]
  15. Jiang, Y.; Zhang, M.; Lee, C.H. A study of early stage self-loosening of bolted joints. J. Mech. Des. 2003, 125, 518–526. [Google Scholar] [CrossRef]
  16. Ba, J.; Chen, Z.; Pan, F.; Li, Z.; Yang, G. Experimental investigation of self-loosening behavior of bolt joints with superelastic shape-memory alloy by macroscopic-mechanical response and microscopic evolution. J. Eng. Mech. 2020, 146, 06020004. [Google Scholar] [CrossRef]
  17. Zheng, Z.; Miao, X.; Huang, X.; Ding, P. Fastening reliability analysis of bolted joint anti-self-loosening. J. Constr. Steel Res. 2023, 202, 107776. [Google Scholar] [CrossRef]
  18. Zhang, M.; Zeng, D.; Lu, L.; Zhang, Y.; Wang, J.; Xu, J. Finite element modelling and experimental validation of bolt loosening due to thread wear under transverse cyclic loading. Eng. Fail. Anal. 2019, 104, 341–353. [Google Scholar] [CrossRef]
  19. Liu, J.; Ouyang, H.; Feng, Z.; Cai, Z.; Liu, X.; Zhu, M. Study on self-loosening of bolted joints excited by dynamic axial load. Tribol. Int. 2017, 115, 432–451. [Google Scholar] [CrossRef]
  20. Zhang, M.; Lu, L.; Wang, W.; Zeng, D. The roles of thread wear on self-loosening behavior of bolted joints under transverse cyclic loading. Wear 2018, 394–395, 30–39. [Google Scholar] [CrossRef]
  21. Shi, T.; Qi, Z.; Liu, C.; Li, X. Tension and torsion distributions in tapered threaded connections. Int. J. Mech. Sci. 2025, 291–292, 110135. [Google Scholar] [CrossRef]
  22. Shi, T.; Liu, Y.; Liu, Z.; Liu, C. Distributions of tension and torsion in a threaded connection. Int. J. Mech. Sci. 2024, 261, 108684. [Google Scholar] [CrossRef]
  23. Gong, H.; Ding, X.; Liu, J.; Feng, H. Review of research on loosening of threaded fasteners. Friction 2022, 10, 335–359. [Google Scholar] [CrossRef]
  24. Li, Y.; Liu, Z.; Wang, Y.; Cai, L.; Zheng, M. Experimental study on behavior of time-related preload relaxation for bolted joints subjected to vibration in different directions. Tribol. Int. 2020, 142, 106005. [Google Scholar] [CrossRef]
  25. Li, Z.; Chen, Y.; Sun, W.; Jiang, P.; Pan, J.; Guan, Z. Study on self-loosening mechanism of bolted joint under rotational vibration. Tribol. Int. 2021, 161, 107074. [Google Scholar] [CrossRef]
  26. Pirdayr, A.; Mohammadi, M.; Javad Kazemzadeh-Parsi, M.; Rajabi, M. Self-loosening effects on vibration characteristics of plates with bolted joints: An experimental and finite element analysis. Measurement 2021, 185, 109922. [Google Scholar] [CrossRef]
  27. Gong, H.; Liu, J. Some factors affecting the loosening failure of bolted joints under vibration using finite element analysis. Proc. Inst. Mech. Eng. C J. Mech. Eng. Sci. 2018, 232, 3942–3953. [Google Scholar] [CrossRef]
  28. Wang, Y.; Qian, C.; Kong, L.; Zhou, Q.; Gong, J. Design Optimization for the Thin-Walled Joint Thread of a Coring Tool Used for Deep Boreholes. Appl. Sci. 2020, 10, 2669. [Google Scholar] [CrossRef]
  29. Pai, N.G.; Hess, D.P. Three-dimensional finite element analysis of threaded fastener loosening due to dynamic shear load. Eng. Fail. Anal. 2002, 9, 383–402. [Google Scholar] [CrossRef]
  30. Wróbel, J.; Pietrusiak, D.; Rozmus, R.; Roicki, R.; Zarzycki, B.; Stefanek, P. Failure analysis and guidelines for further exploitation of centrifugal slurry pumps used for copper flotation waste transport: A case study. Eng. Fail. Anal. 2025, 174, 109479. [Google Scholar] [CrossRef]
  31. Croccolo, D.; De Agostinis, M.; Fini, S.; Mele, M.; Olmi, G.; Scapecchi, C.; Tariq, M.H.B. Failure of Threaded Connections: A Literature Review. Machines 2023, 11, 212. [Google Scholar] [CrossRef]
  32. Grzejda, R.; Warzecha, M.; Urbanowicz, K. Determination of the Preload of Bolts for Structural Health Monitoring of a MultiBolted Joint: FEM Approach. Lubricants 2022, 10, 75. [Google Scholar] [CrossRef]
  33. Krynke, M.; Ulewicz, R. Analysis of the influence of bearing mounting on their static. Transp. Res. Procedia 2019, 40, 745–750. [Google Scholar] [CrossRef]
  34. PN-EN 13001-3.1; Safety of Cranes. General Principles of Design. Part 3.1: Limit States and Verification of Steel Structure. Polish Committee for Standardization: Warsaw, Poland, 1991. (In Polish)
  35. PN-91/M-06517; Cranes. Design and Calculation of Riveted and Bolted Connections in Steel Support Structures. Polish Committee for Standardization: Warsaw, Poland, 1991. (In Polish)
  36. ISO 12480-1: 2024; Cranes—Safe Use. Part 1: General. ISO: Geneva, Switzerland, 2024.
  37. ISO 8686-1: 2012; Cranes—Design principles for loads and load combinations Part 1: General. ISO: Geneva, Switzerland, 2012.
  38. PN-ISO 4301-1; Cranes—Classification—Part 1: General. ISO: Geneva, Switzerland, 2016.
Figure 1. View of the experimental loading test stand with built-up models of the screw connection node: 1—test stand frame, 2—hydraulic-mechanical load generator, 3—tested bolted joints, 4—KMR-type strain gauges, 5—bolted joints load measuring pin, 6—QuantumX MX840B and MX440B measurement amplifiers and router (Hottinger Brüel & Kjær).
Applsci 15 07299 g001
Figure 2. Sketches of spacer-bearing models of machining rings in screw models for friction joints and connection nodes in the load-bearing structures of light cranes: (a) M16 bolts at 1:1 scale and M24 bolts at 1:1.5 scale; (b) M16 bolts at 1:2 scale and M24 bolts at 1:2.5 scale.
Applsci 15 07299 g002
Figure 3. Sketches of physical model at 1:1 scale: (a) bolted friction joint with M16 bolt (model I); (b) bolted connection node of F = 25 kN, L = 6 m crane (model III).
Applsci 15 07299 g003
Figure 4. Sketches of screw connection node models for cranes: (a) F = 63 kN, L = 12 m at 1:2 scale with 6 M16 bolts (model IV); (b) F = 125 kN, L = 18 m at 1:2.5 scale with 4 M24 bolts (model V).
Applsci 15 07299 g004
Figure 5. Locations of strain gauge measuring points, shims/force transducers, and inductive linear displacement sensors on physical models of innovative screw friction joints (with M16 or M24 bolts).
Applsci 15 07299 g005
Figure 6. Locations of strain gauge measuring points, force pads/transducers, and inductive linear displacement sensors on physical models of bolted junctions containing innovative bolted friction joints (made at 1:1 and reducing scales).
Applsci 15 07299 g006
Figure 7. Views of the physical model of the screw connection node with four friction joints and a package of disc springs (centrally pressing the angles while “whitening” their surfaces) after installing four strain gauge force transducers (under the screw heads) and four inductive linear displacement sensors.
Applsci 15 07299 g007
Figure 8. Schematic of the measurement system with the apparatus used for load tests and destructive testing on physical models of screw friction joints and interconnecting nodes.
Applsci 15 07299 g008
Figure 9. Views of the elements comprising the dismantled physical model of a screw connection node with four friction joints. The images were taken after test-sawing the spacer-bearing rings of its angles, which were covered in paint. Visible saw marks and ring areas clogged with paint are visible.
Applsci 15 07299 g009
Figure 10. Views of the element-angle surfaces of model III’s screw junction after destructive testing: (a) lower friction joint; (b) upper friction joint.
Applsci 15 07299 g010
Figure 11. Example waveforms of the force Fi values; bolt tension in one example of model I; and the value of the force FM16, which slightly overloaded this model in one of the load tests. This ended with the loss of the load-carrying capacity of the friction joint in this model.
Applsci 15 07299 g011
Figure 12. Example waveforms of the force Fi values, bolt tension in the next group in model I, and the force Fn load on this model, determined based on readings recorded from the corresponding measurement points (Figure 8) in the destructive test of this model.
Applsci 15 07299 g012
Table 1. Selected results of load and destructive tests in I models.
Force FM16
[kN]
Force Fi (Screw Tension) [kN]Relative Deformation of Strain Gauges [%]Inductive Sensor Linear Displacement [mm]
Point P1
(Upper)
Point P2
(Lower)
Sensor 1Sensor 2 *Sensor 3Sensor 4 *
Direct. HDirect. VDirect. HDirect. VDirect. HDirect. VDirect. HDirect. V
Results of load tests
30.095.40.0001%0.0050%0.0008%−0.0068%−0.022−0.080−0.019−0.055
40.095.50.0001%0.0065%0.0011%−0.0093%−0.037−0.110−0.032−0.069
50.095.60.0000%0.0079%0.0015%−0.0120%−0.052−0.138−0.049−0.087
56.895.5−0.0002%0.0085%0.0020%−0.0140%−0.076−0.172−0.074−0.100
Results of destructive tests
60.094.8−0.0006%0.0083%0.0024%−0.0152%-−0.209-−0.125
70.094.6−0.0013%0.0083%0.0038%−0.0191%-−0.361-−0.274
80.094.2−0.0021%0.0079%0.0058%−0.0243%-−0.563-−0.462
90.093.4−0.0028%0.0070%0.0083%−0.0305%-−0.805-−0.681
* Negative values indicate displacement of the loaded upper element in the direction of the lower element.
Table 2. Selected results of load and destructive tests.
Force F [kN]Screw Tension Forces Fi in the Model
[kN]
Relative Strain at Strain Gauge Sensor Points [%]Linear Displacement at Inductive Sensor Points *
[mm]
Sensor 1Sensor 2Sensor 3Sensor 4
F1F2F3F4F5F6P1P2 P3P4Dir. HDir. VDir. HDir. V
Model of node III in load tests
120.080.980.192.289.30.0120.0100.000−0.002−0.773−0.097−0.780−0.125
160.081.180.398.194.50.0170.0160.001−0.002−1.049−0.136−1.065−0.169
200.081.680.7104.5100.40.0220.0220.002−0.001−1.320−0.171−1.341−0.211
Model of node III in destructive tests
240.082.079.0114.5109.20.0310.0310.002−0.001
280.084.079.5118.4113.30.0330.0340.0030.000
320.088.880.4123.6120.00.0370.0400.0040.002
Model of node IV in load tests
40.016.917.221.122.925.325.80.01010.00770.00520.0048−0.322−0.045−0.350−0.059
50.016.817.121.223.125.926.70.01210.00980.00620.0056−0.393−0.044−0.422−0.062
60.016.617.021.423.426.827.60.01420.01200.00720.0063−0.467−0.039−0.495−0.061
Model of node IV in destructive tests
70.016.516.921.723.827.928.60.01660.01430.00800.0070−0.545−0.027−0.573−0.054
90.014.215.622.325.431.030.10.02160.01850.00930.0092−0.1380.006
11012.515.622.730.034.232.20.02650.02380.01160.0086−0.438−0.235
Model of node V in load tests
40.025.624.331.330.70.0090.0080.0000.001−0.2381−0.0191−0.2548−0.0287
50.025.524.332.031.50.0110.0100.0000.001−0.2945−0.0178−0.3174−0.0295
60.025.424.132.832.40.0140.0120.0000.001−0.3557−0.0090−0.3869−0.0217
Model of node V in destructive tests
70.024.723.033.833.60.0143%0.0141%0.00040.0008−0.046−0.023
90.024.321.140.039.60.0183%0.0178%0.00020.0015−0.351−0.231
110.023.020.345.445.70.0223%0.0201%0.00020.0030nd−0.617nd−0.396
* Negative values indicate increasing distance of model angles from each other.
Disclaimer/Publisher’s Note: The statements, opinions and data contained in all publications are solely those of the individual author(s) and contributor(s) and not of MDPI and/or the editor(s). MDPI and/or the editor(s) disclaim responsibility for any injury to people or property resulting from any ideas, methods, instructions or products referred to in the content.

