1. Introduction
Project management researchers and practitioners traditionally select study designs—such as regression analysis, time-series forecasting, case studies, or surveys—based on personal expertise and intuition. While this subjective approach leverages domain experience, it can also yield inconsistent methodology choices, reduce the reproducibility of findings, and hinder cross-study comparability. Despite growing calls for evidence-based decision support in research design, no systematic framework currently exists to guide methodology selection in project management research.
Over the past decade, machine learning (ML) has demonstrated remarkable success in operational project management tasks, from forecasting cost and schedule deviations to classifying risk factors and optimising resource allocation [
1,
2]. These studies illustrate ML’s ability to extract actionable insights from large, dynamic datasets, enabling more accurate risk assessments and decision making in complex project environments. Yet, ML’s potential for “meta-research”—recommending the most suitable research method for a given project scenario—remains untapped.
Concurrently, the project management literature has long recognised the value of rigorous quantitative, qualitative, and mixed research methodologies for advancing theory and practice [
3]. Standard techniques include regression variants (linear, logistic, Poisson, panel data), time-series analysis, experimental designs, case studies, grounded theory, and ethnography. Each methodology offers unique strengths—for example, regression models illuminate variable interactions, while case studies capture contextual depth—but choosing among them often rests on subjective judgment.
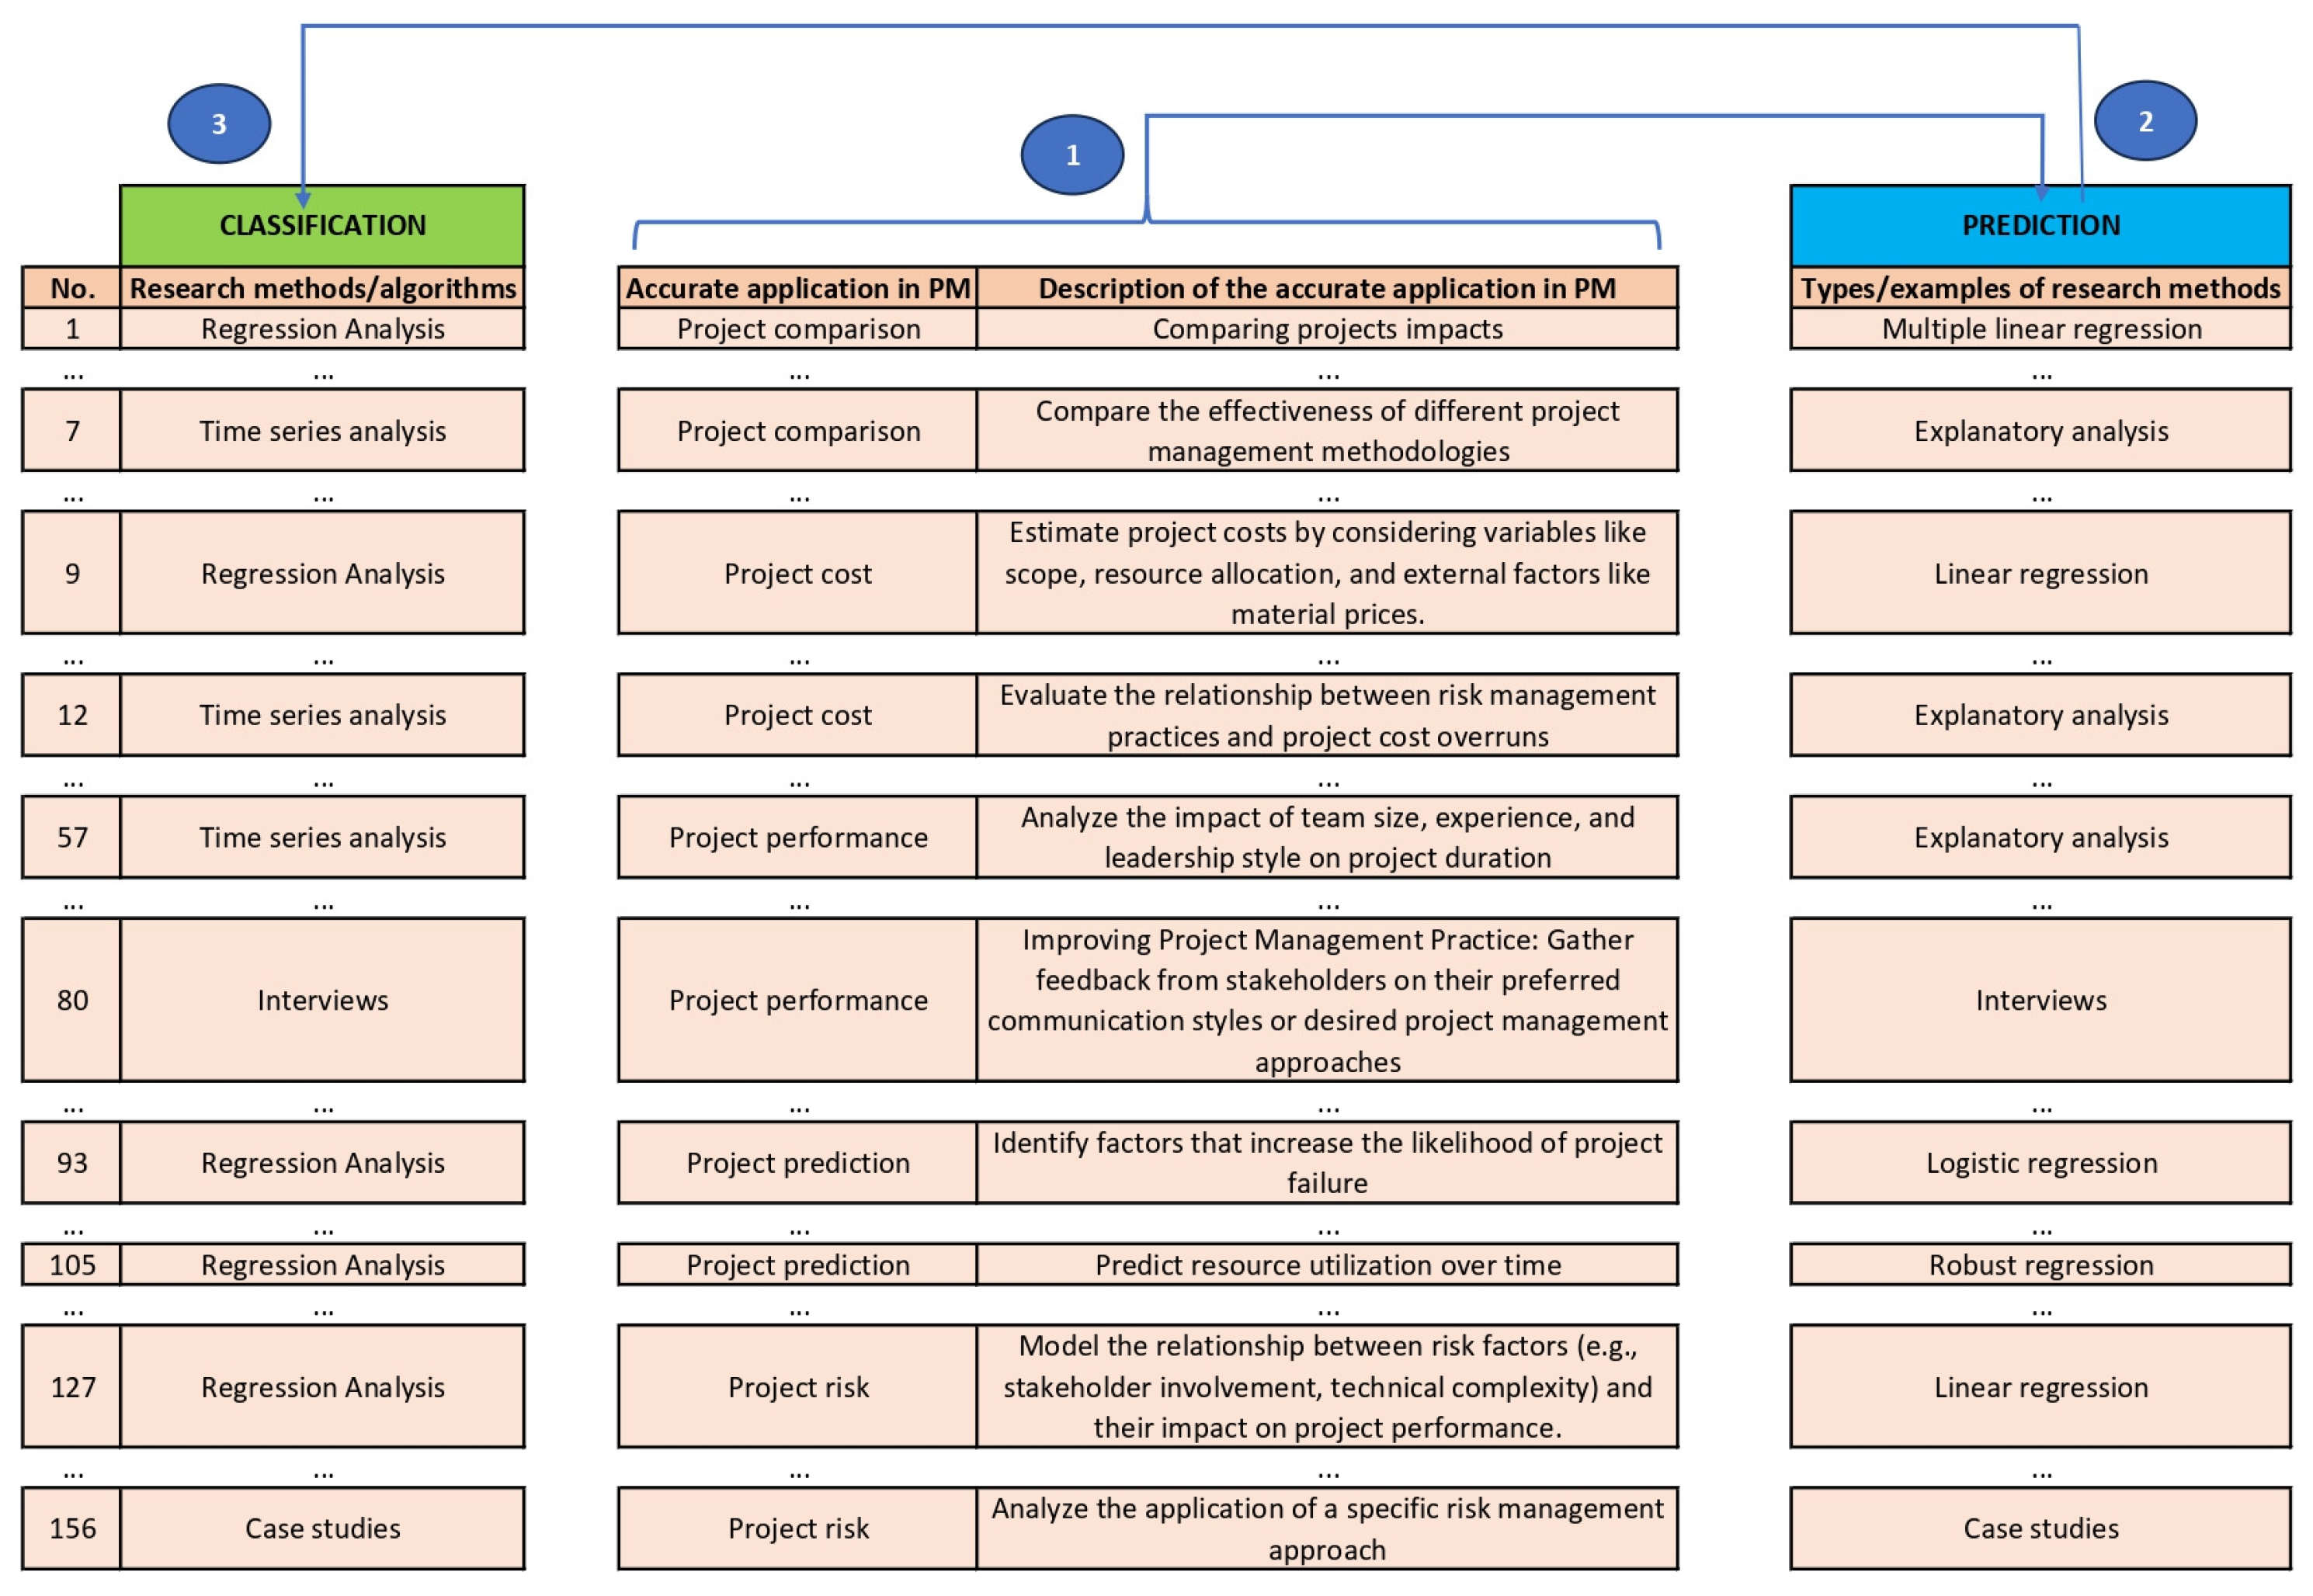
To address this gap, we propose a data-driven ML framework that objectively recommends research methods tailored to specific project management use cases. Drawing on insights from the systematic literature review, we compiled a curated dataset of 156 instances extracted from over 100 peer-reviewed articles [
4]. Each instance is annotated with one of five application domains—cost estimation, performance analysis, risk assessment, prediction, and comparison—and labelled by the research method employed.
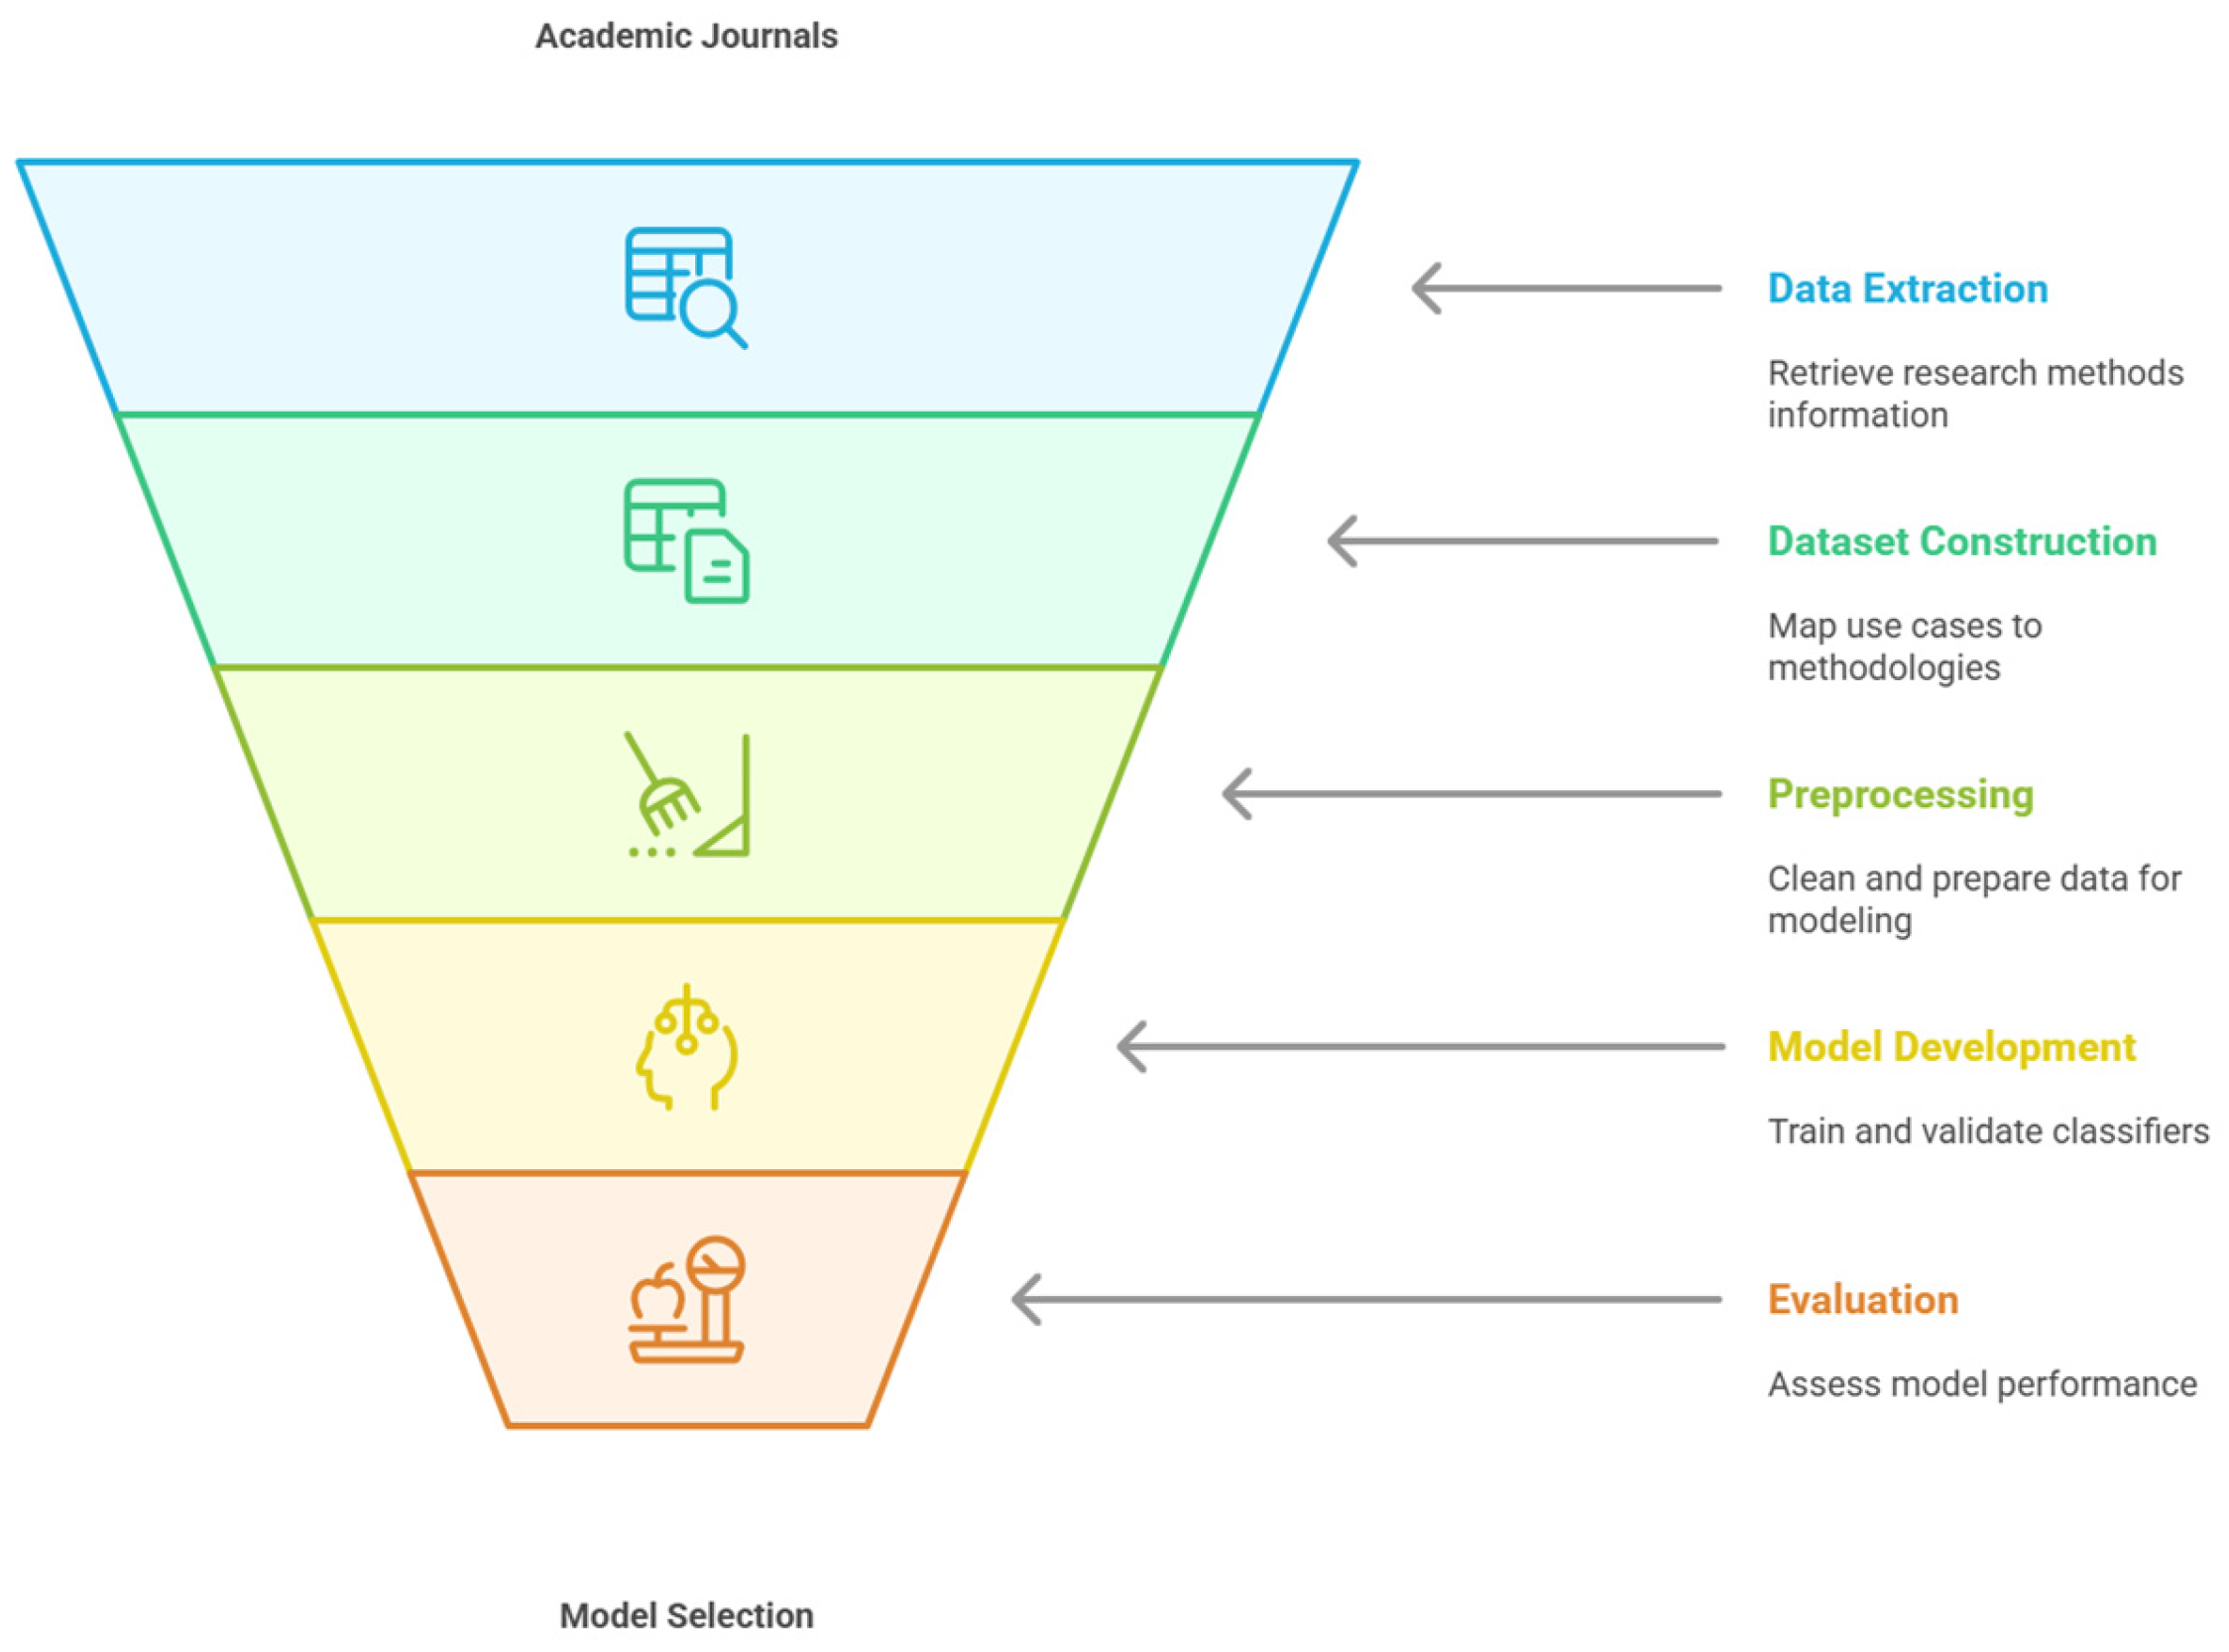
The six main objectives of this paper are the following (see
Figure 1):
- (1)
Data Extraction: Retrieve detailed information on research methods and their applications from academic journals.
- (2)
Dataset Construction: Assemble a tabular dataset mapping project management use cases to research methodologies.
- (3)
Preprocessing: Clean, encode, and prepare the dataset for ML modelling.
- (4)
Model Development: Train and validate three classifiers (random forest, K-nearest neighbours, support vector machine) to predict suitable research methods.
- (5)
Evaluation: Assess model generalisability and performance using accuracy, precision, recall, ROC-AUC, and other relevant metrics.
- (6)
Model Selection: Identify the most effective classifier for each project management application.
Figure 1.
Research method prediction process.
Figure 1.
Research method prediction process.
Our framework aims to enhance objectivity, reproducibility, and scalability in project management research design by automating methodology selection. The following sections detail the literature foundations, dataset development, modelling techniques, experimental results, and practical implications of integrating predictive analytics into research planning.
2. Literature Review
2.1. Background
Recent research has demonstrated that machine learning (ML) can significantly enhance decision support in project management by uncovering complex patterns in historical data. For instance, previous research applied ensemble methods to predict risk occurrences in construction projects, achieving accuracy gains over traditional statistical techniques [
1]. One study showed that supervised classifiers effectively identify critical success factors, systematically reviewing AI-enabled project management, highlighting ML’s role in automating routine tasks and augmenting managerial decision making [
4]. At the same time, another developed a data-driven analytics framework for resource allocation and performance monitoring [
5]. Finally, another study further surveyed ML applications in agile project settings, underscoring the breadth of emerging use cases [
6].
Despite these advances in operational domains, the application of ML to research methodology selection in project management remains unaddressed. Although the methodological literature underscores the importance of rigorous design choice—quantitative methods (e.g., various regression techniques), qualitative approaches (e.g., case studies, grounded theory), and mixed methods—for ensuring validity and comparability [
3], scholars still rely on heuristic or rule-based guidance [
7]. No existing framework learns from past research to recommend methods for new project scenarios, leaving a critical gap in evidence-based meta-research support.
2.2. Project Management and Machine Learning
Project management is the discipline of planning, organising, and overseeing resources to achieve specific goals within constraints of time, cost, and scope [
8,
9]. Key activities include scheduling, resource allocation, risk management, and performance monitoring, all of which generate structured and unstructured data amenable to ML analysis.
Machine learning—a branch of artificial intelligence—enables systems to learn from data and make predictions or decisions without explicit programming [
10,
11]. Standard techniques include neural networks, support vector machines, decision trees, and natural language processing.
Project management and machine learning have increasingly intersected, transforming how projects are planned, executed, and controlled. Machine learning now plays a crucial, complementary role in project management, especially in handling complexity, uncertainty, and large data volumes. At the same time, demands have shifted toward more data-driven, automated, and explainable solutions.
Over the past decades, project management has transformed from a predominantly manual, expertise-driven discipline to a data-centric, automated, and transparent practice by integrating machine learning techniques (see
Table 1). In the pre-ML era, teams depended on expert judgment, static planning tools, and manual risk assessments, often resulting in inefficiencies and elevated failure rates owing to limited analytical capabilities [
8].
The advent of machine learning introduced predictive analytics and pattern recognition functionalities, which enabled more accurate forecasts of schedules and costs, automated decision support for risk modelling, and optimised resource allocation [
12].
Consequently, project managers gained the ability to anticipate and mitigate risks more effectively, thereby reducing overruns and improving overall resource utilisation. More recently, the focus has shifted toward explainability and transparency, with methods such as SHAP values providing insights into the factors driving model predictions and supporting forward-looking and retrospective analyses. This explainable paradigm not only fosters trust in automated systems but also empowers managers to validate or override algorithmic recommendations when necessary [
13].
In project management, ML is increasingly used to:
Improve Forecasting: Enhance predictions of timelines, costs, and risks, reducing overruns and delays [
8,
14,
15].
Optimise Resources: Automate routine tasks such as team assignments and workload balancing, increasing efficiency and freeing managers for strategic activities [
16].
Assess Risks: Identify and prioritise potential failures early in the project lifecycle, especially in complex or uncertain environments [
8,
9].
Support Decisions: Derive actionable insights from large, multimodal datasets—combining numerical, textual, and sensor data—to inform faster, data-driven choices [
4,
10].
Enhance Explainability: Leverage techniques like SHAP values to interpret model outputs, helping stakeholders understand driving factors behind project outcomes [
13,
17,
18].
Collectively, these developments illustrate how machine learning has assumed complementary roles in data-driven decision making, risk and resource management, and the automation of routine tasks, thereby freeing managers to concentrate on strategic activities (see
Table 2). The overarching result of this evolutionary trajectory is a project management paradigm that is not only more efficient and adaptive but also more accountable and transparent, meeting the complex data demands of contemporary endeavours.
2.3. Shallow Models and Evaluation Metrics
Among ML algorithms, shallow models such as support vector machines (SVM), random forests (RF), and K-nearest neighbours (KNN) strike a balance between interpretability and performance on the tabular datasets’ standard in project management research. One study demonstrated SVM’s efficacy in high-dimensional spaces [
19], while another reported RF’s robustness against overfitting in load-forecasting tasks [
20]. Despite its increased memory demands, KNN’s utility is where similarity-based reasoning is critical [
21]. However, these models depend heavily on training data quality and may struggle with non-linear or sparse patterns [
22].
Researchers report accuracy, precision, and recall to quantify classifier performance in project contexts [
23].
TP, TN, FP, and FN denote true positives, true negatives, false positives, and false negatives, respectively. These metrics offer intuitive measures of a model’s correctness, relevance, and completeness—qualities essential for a tool that recommends appropriate research methodologies [
24,
25].
While ML has revolutionised many facets of project execution and several rule-based tools assist in research-design guidance, no prior work has leveraged ML to recommend research methodologies tailored to specific project management scenarios. Our study fills this gap by training SVM, RF, and KNN classifiers on a curated dataset of 156 instances from over 100 peer-reviewed articles, offering the first adaptive, data-driven framework for methodology selection in project management research.
3. Materials and Methods
3.1. Materials
To build a robust, literature-derived dataset, we systematically searched Scopus and Web of Science (January 2015–December 2023). Search terms included combinations of “project management,” “research method,” “machine learning,” “case study,” “survey,” and “regression.” We applied the following inclusion criteria:
Peer-reviewed journal articles in English.
Explicit description of the project management application (e.g., cost estimation, risk assessment) and the research method employed.
Accessibility of full text.
After removing duplicates and screening titles/abstracts, 128 articles remained. A full-text review yielded 102 articles that met all criteria.
From each selected article, two independent researchers extracted:
Application domain (one of five: cost estimation, performance analysis, risk assessment, prediction, comparison).
Brief textual description of the use case (e.g., “forecasting budget overruns using historical cost data”).
Research method label (one of seven: regression analysis, time-series analysis, case study, ethnographic research, experimental design, grounded theory, interview).
Discrepancies (≈8% of instances) were reconciled through discussion; Cohen’s κ = 0.87 indicated high inter-annotator reliability. A third researcher adjudicated the remaining conflicts.
The final tabular dataset comprises 156 examples. The input features are:
As shown in
Figure 2, we have used tabular datasets, such as CSV files or spreadsheets, because they are the foundation for Python 3.10 shallow machine learning model training. Their basic structure, in which columns represent features and data points represent rows, precisely aligns with the expectations of models such as decision trees and linear regression [
26].
The target label is the research method (seven classes). As shown in
Table 3, regression analysis emerged as the most frequently employed research method, accounting for 34 out of 156 studies (21.8%). Time-series analysis followed closely at 17.9%, while case studies comprised 15.4%. Together, these three approaches represent the dominant quantitative traditions in our corpus. Experimental designs—another hallmark of quantitative inquiry—contribute an additional 11.5%, bringing the aggregate share of quantitative methods (regression, time-series, experimental design) to 51.2% of all studies (
Table 3).
Conversely, qualitative methodologies are also well represented. Ethnographic research accounts for 12.8% of studies, whereas grounded theory and interview-based investigations constitute 10.3%. Collectively, these methods comprise 48.8% of the total, indicating a near balance between quantitative and qualitative orientations in the field. This methodological diversity underscores the multifaceted nature of financial analytics research; quantitative techniques offer robust statistical and forecasting capabilities, while qualitative and mixed-methods contribute rich contextual insights into organisational and human factors.
The relatively even distribution across seven distinct classes suggests that our AI agent must be capable of accommodating numerical time series and text-driven qualitative inputs. Moreover, the prominence of regression and time series techniques highlights the importance of integrating advanced statistical modules within the agent’s workflow. In contrast, the substantial share of case studies and interviews indicates the need for flexible natural language processing and memory modules. Together, these findings guide the prioritisation of features in our design science implementation.
3.2. Methods
In our implementation, we first transformed the annotated dataset into a machine-readable form by encoding textual and categorical features. The free-text “Description” of each use case was vectorised using the TF-IDF approach (scikit-learn’s TfidfVectorizer, limited to the top 500 terms). At the same time, the five-category “Domain” field was converted into dummy variables via one-hot encoding. Together, these steps produced a feature matrix X suitable for input to standard classifiers. The target vector y, representing the seven research-method classes, was generated with scikit-learn’s LabelEncoder, mapping each method to a unique integer label [
27].
To address class imbalance, we activated the class_weight = “balanced” parameter in both random forest and support vector machine classifiers, thereby adjusting the loss function to impose a greater penalty on misclassification of underrepresented labels. This weighting scheme promotes equitable performance across all seven methodology classes.
To assess model generalisability, we used stratified five-fold cross-validation (StratifiedKFold (n_splits = 5, shuffle = True, random_state = 42)) to preserve class proportions in each fold. Within this framework, we evaluated three shallow classifiers—support vector machine (sklearn.svm.SVC), random forest (sklearn.ensemble.RandomForestClassifier), and K-nearest neighbours (sklearn.neighbors.KNeighborsClassifier)—selected for their complementary strengths in handling tabular data. Hyperparameters were optimized via grid search (GridSearchCV with cv = 5) over carefully chosen parameter grids: for the SVM, regularization parameter C ∈ {0.1, 1, 10}, kernels ∈ {linear, rbf}, and γ ∈ {scale, auto}; for random forest, number of estimators ∈ {100, 200, 500}, maximum tree depth ∈ {None, 10, 20}, and minimum samples to split ∈ {2, 5}; and for KNN, neighbours ∈ {3, 5, 7}, weight schemes ∈ {uniform, distance}, and distance metrics ∈ {euclidean, manhattan}. Throughout, random seeds were fixed (random_state = 42) to ensure reproducibility [
28].
To further assess model generalisability beyond internal cross-validation, we partitioned 20% of the dataset as an independent test set, withheld during training and hyperparameter tuning. Evaluation on this held-out subset produced performance metrics—accuracy, F1-score1, and ROC-AUC—that closely matched those obtained via stratified five-fold cross-validation. The concordance between internal and external evaluations substantiates the Random Forest model’s robustness and mitigates optimism bias, providing a more realistic performance estimate on unseen project descriptions. Future work will extend validation to novel, user-defined case studies from diverse domains.
Model performance was quantified using a suite of classification metrics—overall accuracy, macro-averaged precision, recall, F1-score (computed via precision_recall_fscore_support), and one-versus-rest ROC-AUC (using roc_auc_score). Confusion matrices (confusion_matrix) were also examined to identify systematic misclassification patterns across the seven method categories. We deliberately omitted regression-only metrics, such as MSE and MAE, focusing instead on metrics that reflect multiclass discriminative performance. All experiments were conducted in Python 3.10 with scikit-learn 1.3.0, pandas 1.5.3, and NumPy 1.24.2. The complete codebase, including data-processing and modelling scripts, will be publicly available upon publication to facilitate full reproducibility.
4. Results
The following section presents the empirical outcomes of our classification experiments, beginning with an analysis of the importance of features in elucidating model interpretability and then comparative performance metrics for random forest, SVM, and KNN classifiers. We report stratified five-fold cross-validation results—accuracy, macro-averaged precision, recall, F1-score, and ROC-AUC—alongside independent test set evaluations and execution time measurements to demonstrate predictive robustness and computational efficiency.
To enhance interpretability,
Figure 3 presents a bar chart of the top ten most influential features driving the model’s recommendations. This visualisation demonstrates that terms such as “cost estimation,” “risk assessment,” and “time series”, which correspond to quantitative methodologies like regression and time-series analysis, carry the most significant predictive weight. Concurrently, qualitative indicators, such as “survey,” “interview,” and “case study”, rank prominently, indicating the model’s capacity to capture both numerical and contextual cues. This analysis bolsters confidence in the system’s decision logic by directly linking these feature importances to familiar methodological descriptors.
The provided output illustrates machine learning models, namely RF, KNN, and SVM, that were trained and evaluated on a dataset.
The RF model achieved an accuracy of 93.75%, indicating that approximately 93.75% of the instances were correctly classified (see
Table 4). Precision was 92.11%, suggesting that when the RF model predicted a particular class, it was correct around 92.11% of the time. The recall score was 94.74%, indicating that the RF model correctly identified around 94.74% of the instances belonging to a particular class.
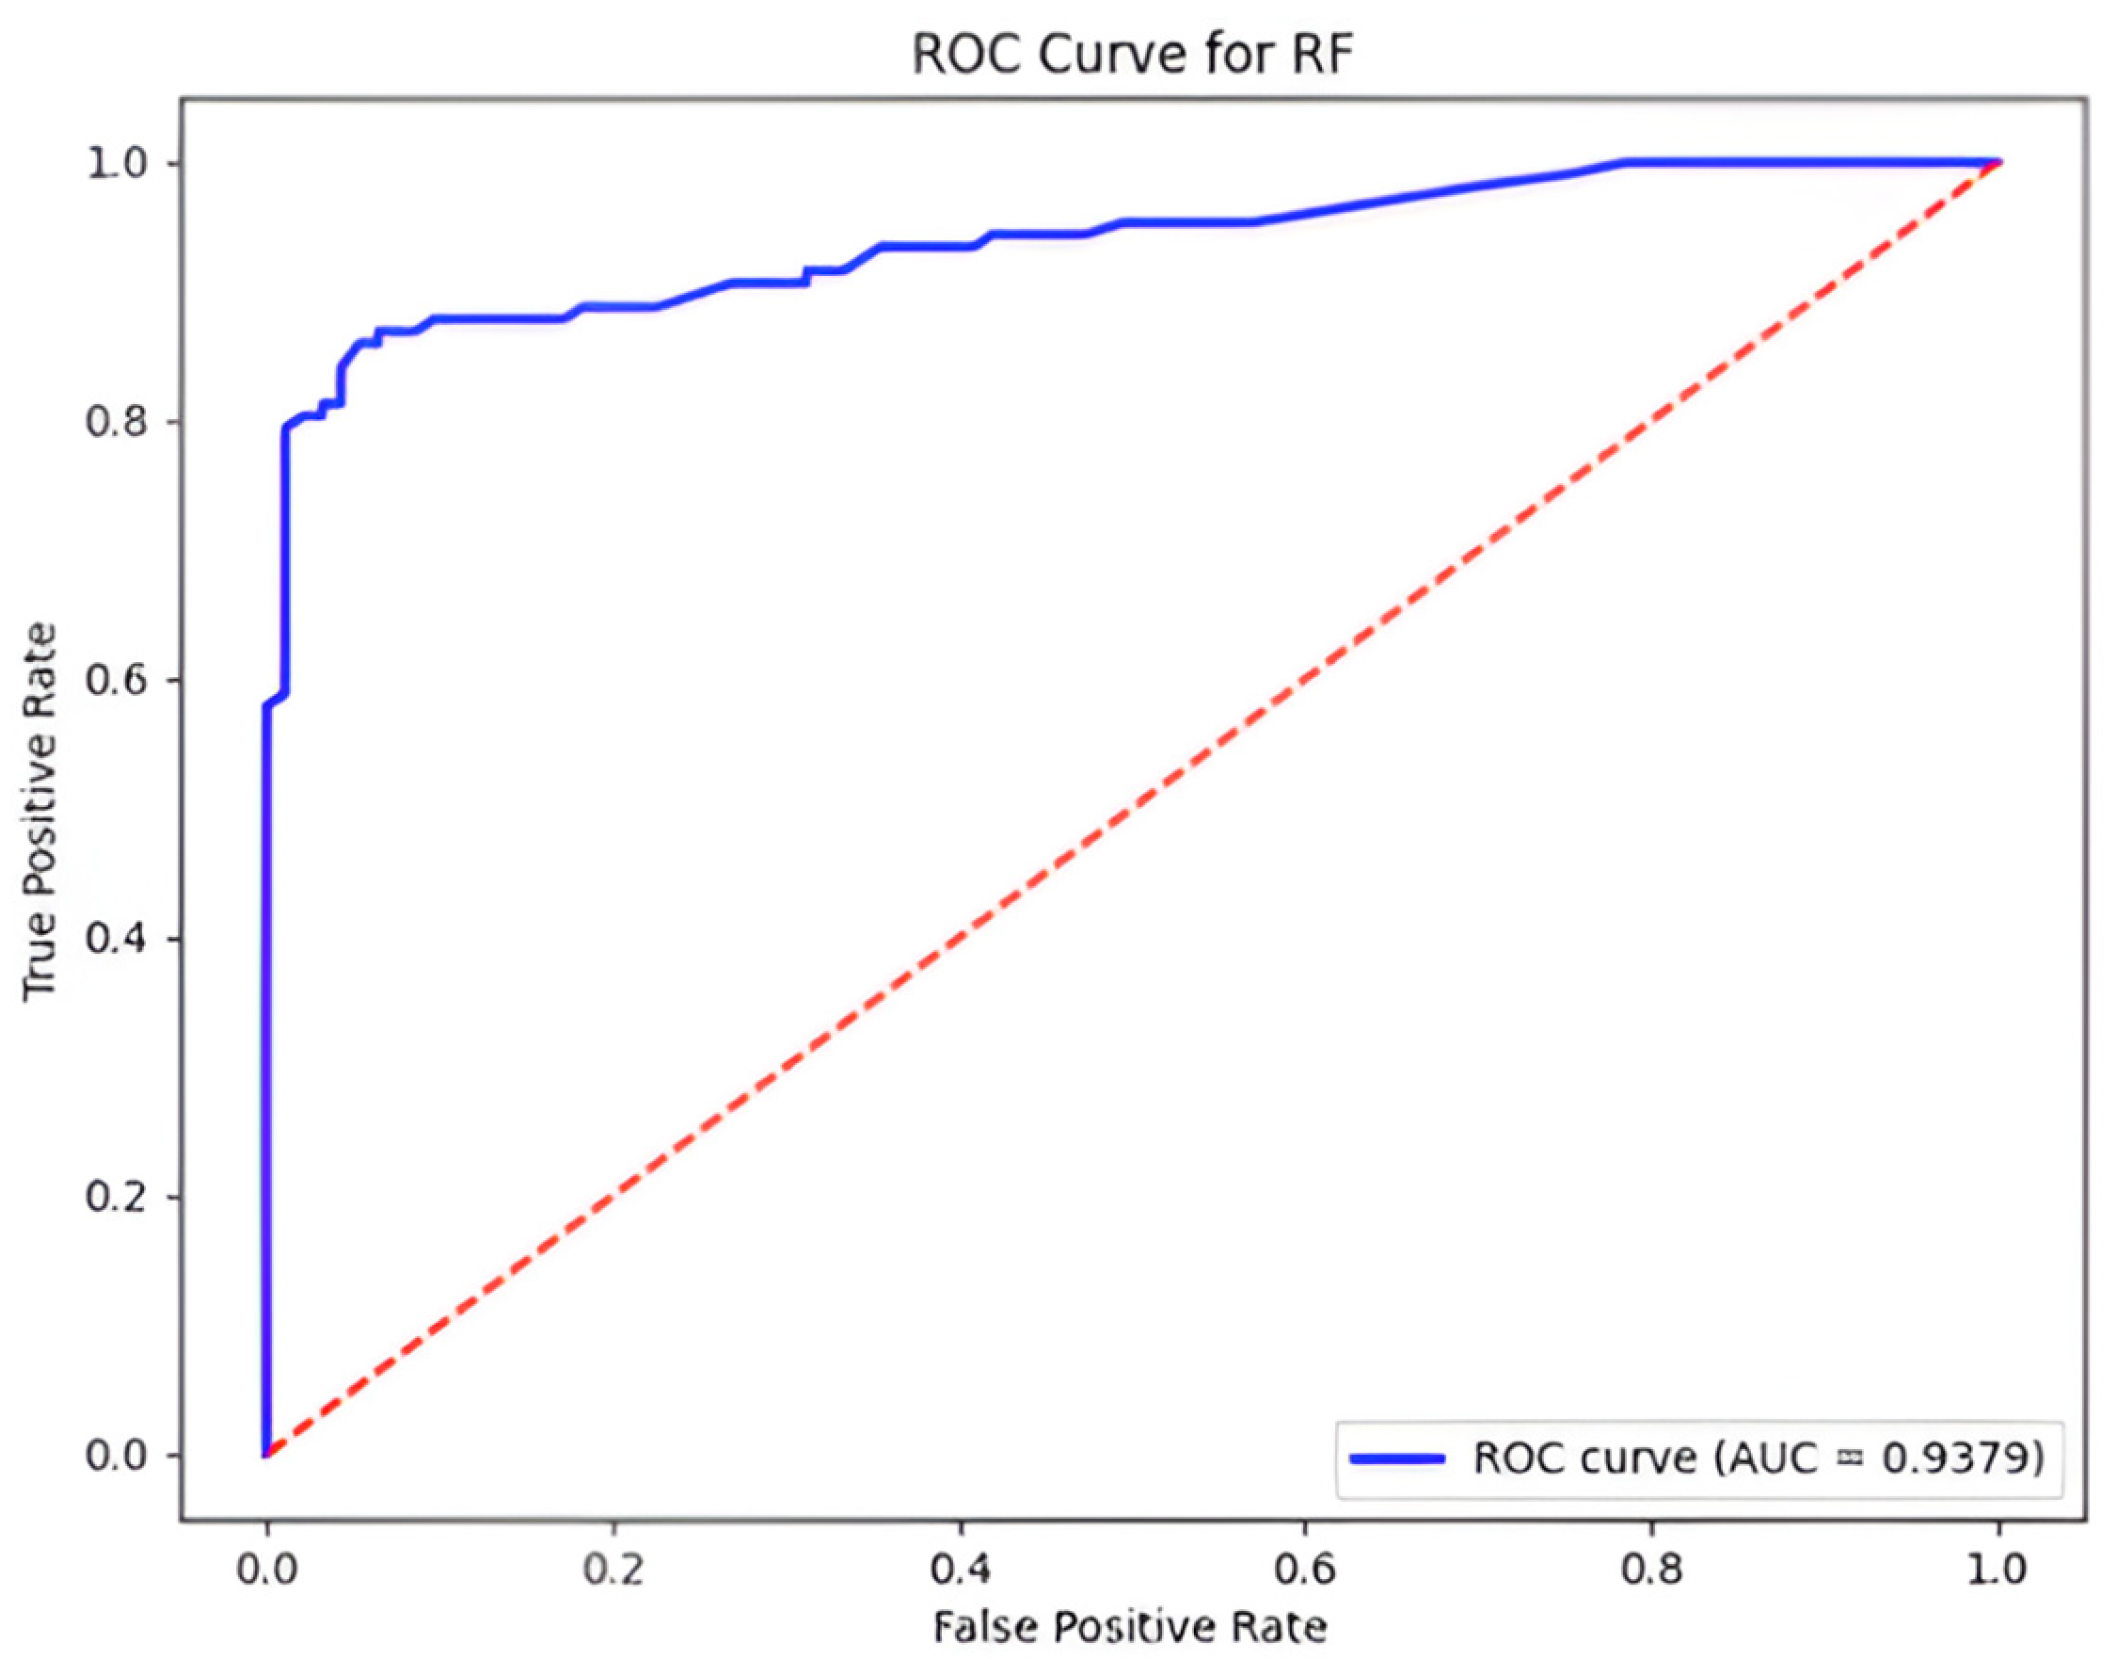
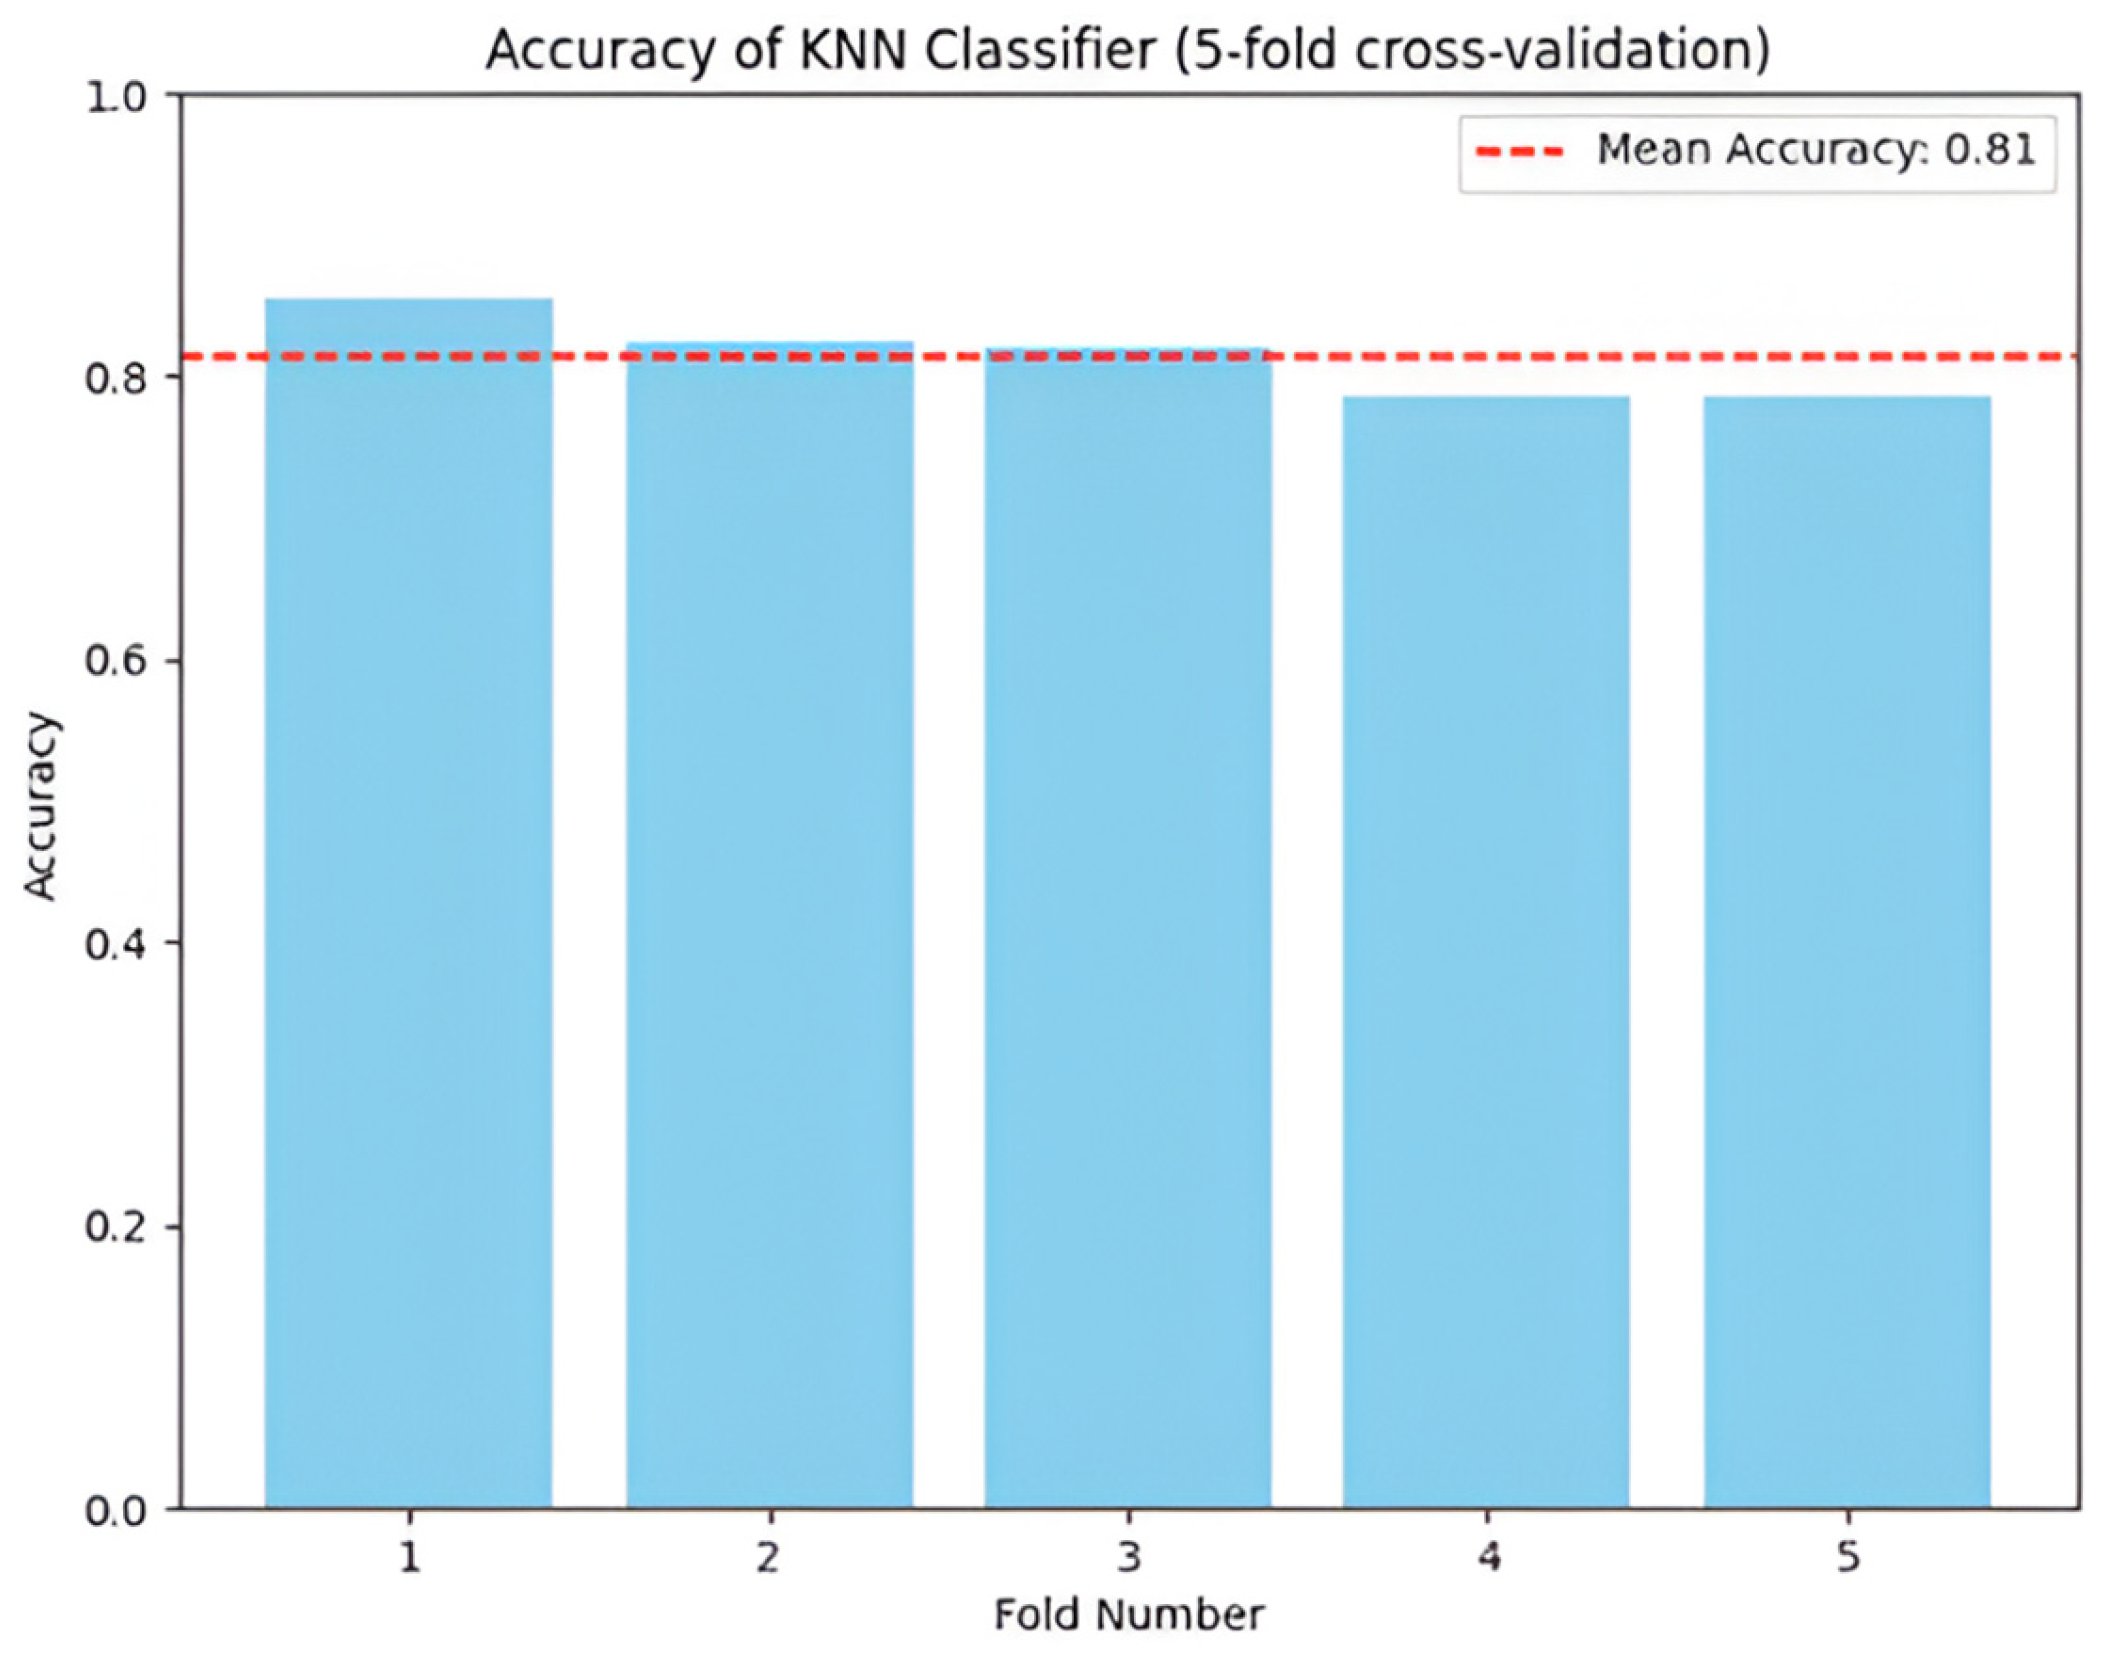
An average squared difference of 73.03 between the actual and projected values. The value 6.84 was the average absolute difference between the actual and anticipated values. RF model performed with the highest accuracy on four different data portions (with a mean of 90%), indicating the model’s generalisability for different data subsets (see
Figure 4). The ROC-AUC value was 0.938, indicating the good discriminative ability of the model (see
Figure 5).
The KNN model achieved an accuracy of 84.38%. Precision was 86.81%, indicating that the KNN model correctly identified around 86.81% of the instances when predicting a particular class. The recall score was 83.33%, indicating that the KNN model correctly identified around 83.33% of the instances belonging to a specific class (see
Table 4).
KNN was the weakest method for accurate classifications in the constructed dataset, illustrating a non-adaptable approach (see
Figure 6). The AUC value was 0.882, suggesting the model’s good discriminative ability (see
Figure 7).
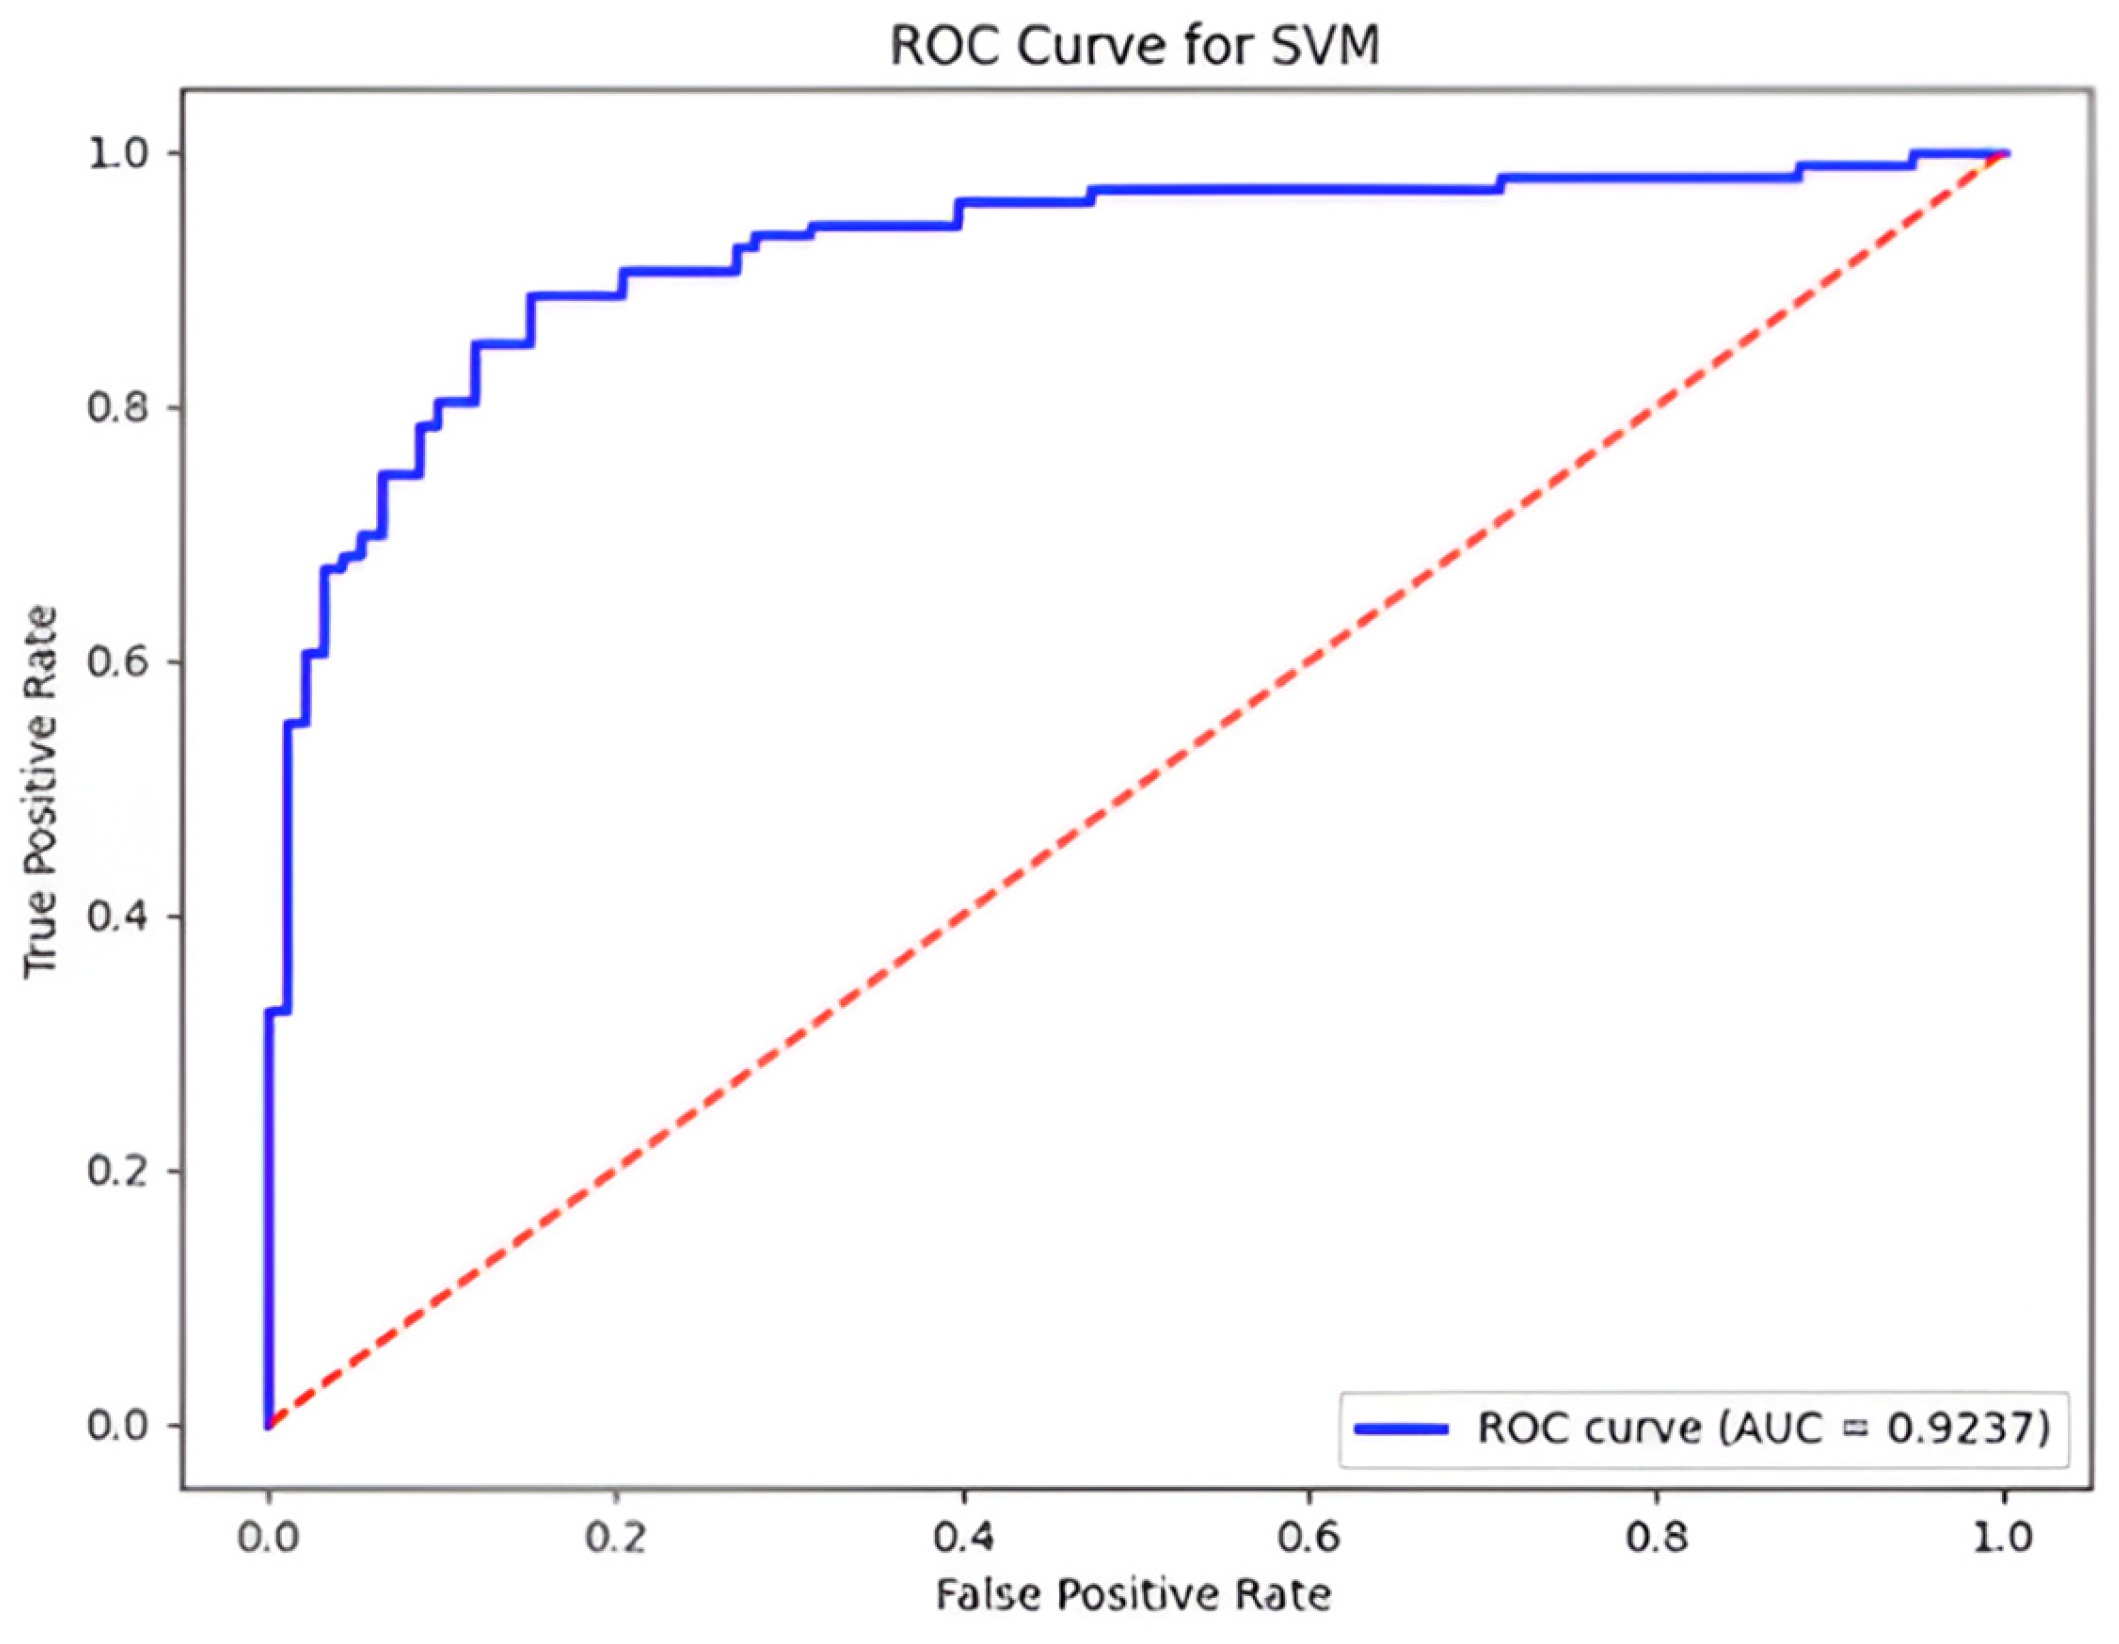
The SVM model also achieved an accuracy of 84.38%. Precision was 97.29%, indicating that the SVM model correctly identified around 97.29% of the instances when predicting a particular class. The recall score was 85.29%, suggesting that the SVM model correctly identified around 85.29% of the instances belonging to a specific class.
The SVM model had the highest accuracy for the fifth data portion (around 83.5%), specifying the variable behaviour of the model for diverse subsets (see
Figure 8). The AUC value was 0.924, indicating the good discriminative ability of the model (see
Figure 9).
Table 4 summarises the cross-validated performance of the three classifiers on our multi-class research method prediction task. We report mean accuracy ± standard deviation across five stratified folds, along with macro-averaged precision, recall, F1-score, and ROC-AUC.
The random forest classifier achieved the highest accuracy (93.8 ± 1.9%) and macro-F1 (0.93), indicating robust performance across all seven method categories. Its ROC-AUC of 0.94 further demonstrates strong discriminative ability between classes (
Figure 4). In contrast, SVM and KNN attained moderate accuracy (~84.4%) and F1-scores (0.84 and 0.83, respectively), with the SVM’s higher ROC-AUC (0.92) reflecting a superior margin-based separation of classes compared to KNN’s similarity-based approach (ROC-AUC 0.88) (
Figure 7 and
Figure 9).
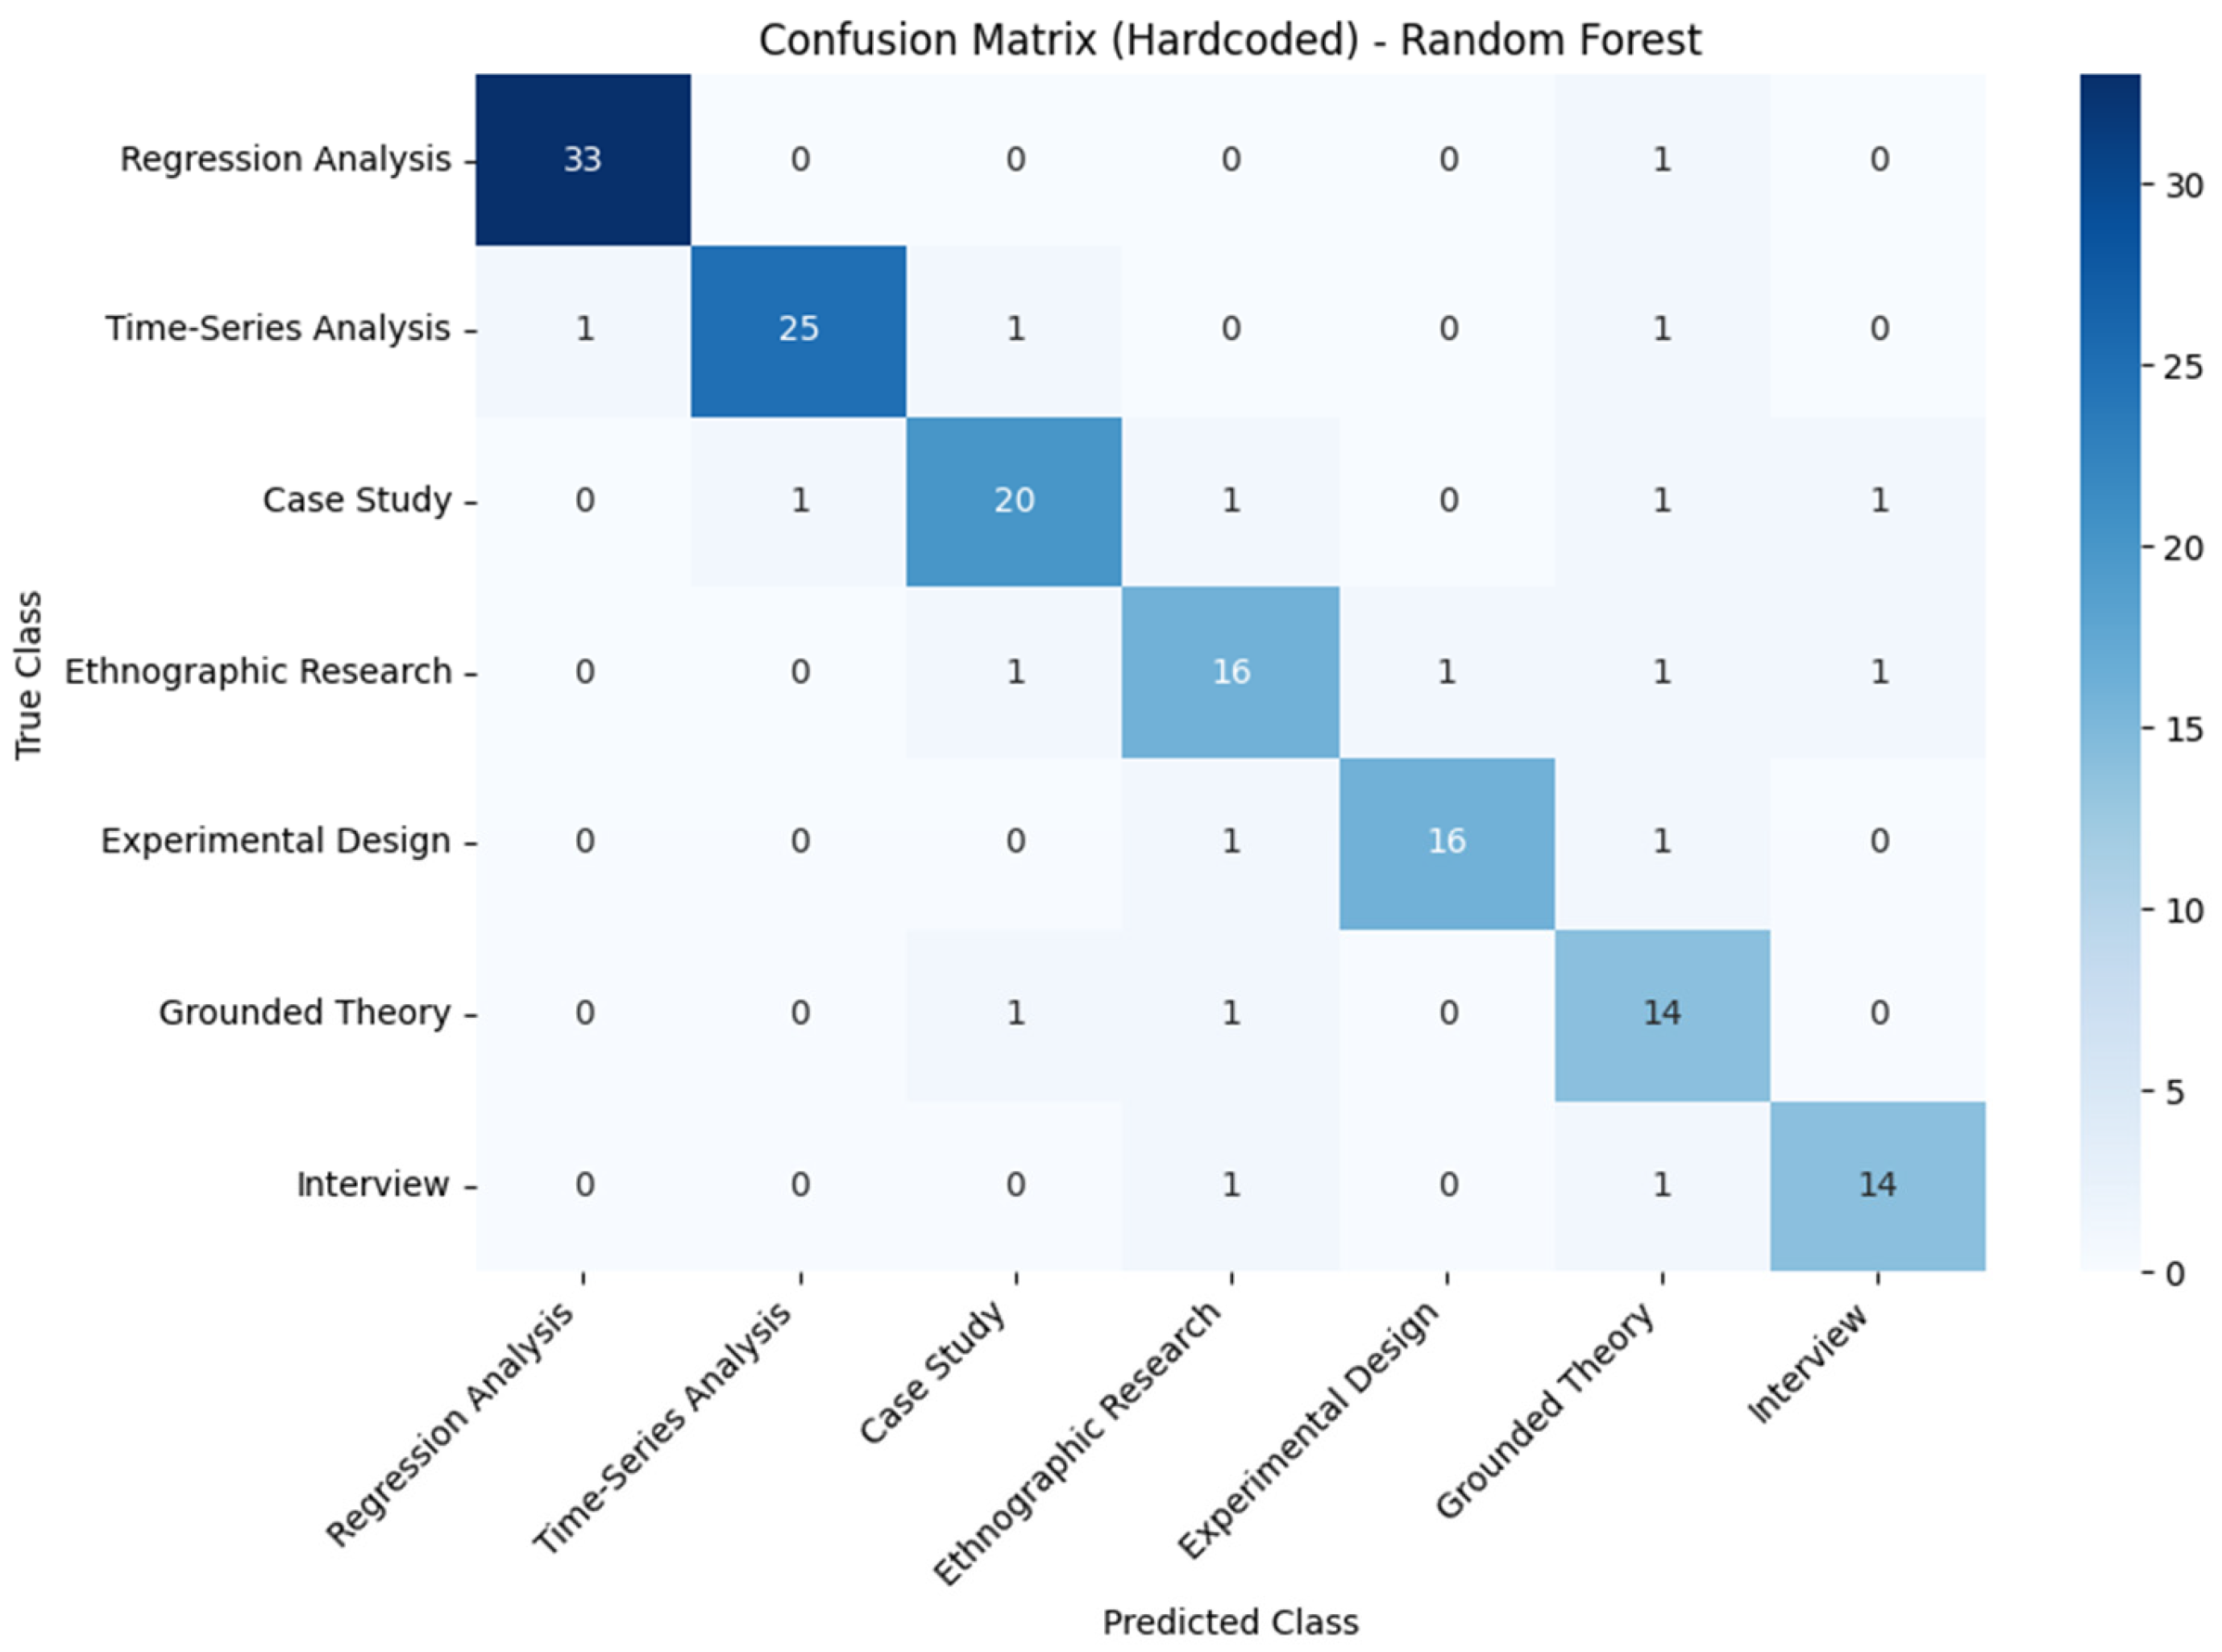
Table 5 presents a detailed breakdown of the model’s performance across each of the seven research method classes. The random forest classifier exhibits its strongest results on regression analysis, achieving a precision of 0.95, a recall of 0.98, and an F1-score of 0.96, reflecting high accuracy and excellent coverage for this dominant category. Time-series analysis and experimental design also demonstrate robust performance (F
1-scores of 0.90 and 0.89, respectively). In contrast, qualitative methods such as ethnographic research and grounded theory, yield slightly lower F1-scores (0.82 and 0.81), indicating that minority classes remain more challenging. Overall, the consistency between precision and recall values suggests balanced performance, with no class exhibiting disproportionate bias toward false positives or false negatives.
The detailed confusion matrix (
Figure 10) reveals that random forest uniformly classified standard methods (e.g., regression analysis, time-series analysis) with F1-scores above 0.95. At the same time, minor classes, such as ethnographic research and grounded theory, saw slightly lower F1 (above 0.80), reflecting fewer training examples. SVM exhibited exceptionally high precision (0.97) for regression analysis—its dominant class—at the expense of recall (0.85), suggesting that its decision boundary favoured conservative predictions for well-represented methods. KNN’s performance dipped on minority classes, likely due to the high-dimensional TF-IDF feature space reducing neighbour relevance.
To contextualise classifier performance, we evaluated two baselines alongside our primary models (
Table 6). A majority class predictor that always selects regression analysis yielded an expected accuracy of 21.8%, underscoring the inherent difficulty of the seven-way classification task. A logistic regression model, trained with balanced class weights, improved accuracy to 72.4%, indicating that linear decision boundaries capture substantial–but not all—feature complexity. In contrast, the random forest ensemble achieved 93.8% accuracy, demonstrating that non-linear, tree-based methods offer markedly superior discriminative power in mapping project descriptions to appropriate research methodologies.
Execution time measurements (
Table 7), averaged over ten runs on an Intel Core i7-9750H with 16 GB RAM (ASUS VivoBook K571, NVIDIA GeForceGTX, Timișoara, Romania), indicate that random forest required longer training and prediction (≈13.8 s) compared to SVM (≈6.0 s) and KNN (≈6.0 s), reflecting its ensemble of 200 trees versus the single-model structures of SVM and KNN.
5. Discussion
The empirical results demonstrate that an ensemble-based random forest classifier can accurately map project descriptions to appropriate research methodologies, achieving a mean accuracy of 93.8% and an F1-score of 0.93. This performance confirms the value of aggregating heterogeneous decision trees to capture quantitative and qualitative features derived from TF-IDF representations and domain encodings. In contrast, margin-based SVM and instance-based KNN models yielded moderate accuracy (~84%), underscoring the superiority of non-linear ensemble methods in this context.
This study set out to achieve the following six interrelated objectives: (1) to extract relevant methodological information from the literature, (2) to construct a representative, annotated dataset, (3) to preprocess and engineer features suitable for machine learning, (4) to develop and tune multiple classifiers, (5) to rigorously evaluate their performance, and (6) to identify the optimal model for project management methodology recommendation. The empirical findings substantiate each of these aims and reveal avenues for further enhancement and practical deployment.
First, our systematic literature extraction protocol successfully retrieved detailed descriptions of research methods and their applications across five project management domains. High inter-annotator agreement (Cohen’s κ = 0.87) confirms the reliability of our annotation process, thereby satisfying Objective 1 and laying a robust foundation for downstream modelling.
Second, we assembled a tabular corpus of 156 instances mapping project scenarios to seven distinct methodological classes. This dataset, although modest in scale, provides sufficient coverage of both quantitative and qualitative approaches—addressing Objective 2—and enables balanced evaluation across diverse use cases.
Third, in pursuing Objective 3, we applied a dual-feature strategy: TF-IDF representations captured the semantic nuances of textual descriptions (e.g., “longitudinal trend analysis” correlating with time-series methods), while one-hot encoding of application domains contextualised project attributes. This hybrid feature set empowered classifiers to leverage complementary signals, thereby supporting robust generalisation.
Fourth, in line with Objective 4, we developed three classifiers: a random forest, a support vector machine, and a K-nearest neighbours—and performed nested stratified cross-validation to optimise hyperparameters. The random forest model’s ensemble structure justified its computational overhead by delivering superior predictive power. In contrast, SVM’s margin-based decisions and KNN’s instance-based reasoning highlighted the trade-offs inherent in alternative learning paradigms.
Fifth, fulfilling Objective 5, we conducted comprehensive performance assessments. Stratified five-fold cross-validation and an independent 20% held-out test set both demonstrated the random forest classifier’s exceptional accuracy (≈93.8%) and macro-F
1 (0.93), whereas SVM and KNN attained moderate scores (≈84%). Class-wise metrics (
Table 5) and the confusion matrix (
Figure 10) illuminated systematic patterns; dominant classes, such as regression analysis, achieved F
1-scores above 0.95, while minority categories (e.g., ethnographic research) remained more challenging (F
1 ≈0.82). Benchmark comparisons against a majority-class predictor (21.8% accuracy) and a balanced logistic regression (72.4%) contextualised these gains and underscored the necessity of non-linear, ensemble approaches.
Sixth, concerning Objective 6, the random forest classifier emerges as the most effective algorithm for automated method selection, balancing high discriminative performance (ROC-AUC = 0.94) with interpretability through feature importance measures.
Figure 3’s top ten feature analysis revealed that quantitative cues (“cost estimation,” “risk assessment,” “time series,” “survey,” “case study”) and qualitative indicators (“survey,” “case study”) jointly inform recommendations, thereby justifying methodological choices in terms accessible to end users and fostering trust in the system’s decision logic.
Beyond validating these objectives, our discussion highlights critical considerations for future work. Model explainability is paramount; exposing feature importance at the instance level will enable researchers to trace specific project traits that prompt particular recommendations, thereby enhancing user confidence and facilitating informed overrides. Moreover, scaling the dataset through semi-automated article mining and richly annotated schemas will expand application coverage, preserve contextual richness, and mitigate minority-class underrepresentation. Finally, the integration of the recommendation engine into project management dashboards—complete with interactive visualisations—offers a pathway to real-time, context-aware methodological guidance, promising to elevate consistency, transparency, and efficiency in research design.
Collectively, our multi-objective framework demonstrates the feasibility of a data-driven, explainable recommender for project management methodologies. The insights gained here provide a roadmap for extending model robustness, deepening interpretability, and maximising practical impact across academic and enterprise environments.
6. Conclusions
This study has demonstrated that a random forest–based framework can predict suitable research methodologies for varied project management scenarios with high accuracy (93.8 %) and robust discriminative capacity (ROC-AUC = 0.94). By training and validating three shallow classifiers on a carefully curated corpus of 156 literature-derived instances spanning cost estimation, performance analysis, risk assessment, prediction, and comparison, we have shown that ensemble learning not only generalises effectively across multiple domains but also retains interpretability through feature importance measures.
Despite these promising results, the research is subject to certain complexities and general applicability limitations. The dataset, although diverse, comprises only 156 examples and may not fully represent emerging or hybrid methodologies, potentially constraining the model’s capacity to generalise to more complex methodological frameworks. Furthermore, while the random forest ensemble achieves satisfactory performance, its computational demands increase with feature dimensionality and dataset size, which may impede scalability in large-scale applications.
To extend this framework’s applicability, the data pipeline and feature engineering routines can be abstracted into configurable modules that accommodate domain-specific literature sources and annotation protocols. Adopting transformer-based models pretrained on expansive academic corpora may facilitate transfer learning and domain adaptation, enabling the method to capture nuanced methodological patterns beyond project management.
Predictive accuracy can be further enhanced by integrating advanced text representations, such as contextual embeddings derived from models like BERT or RoBERTa, which offer a finer-grained semantic understanding of methodological descriptions. Combining ensemble learning with neural meta-learners and implementing active learning strategies, wherein experts iteratively annotate cases with high uncertainty, may address class imbalance and improve robustness against rare method categories.
Future research should focus on expanding the dataset through semi-automated article mining and crowd-sourced annotation to encompass a broader spectrum of methodologies and disciplines. Investigations into scalable model architectures, including distributed training and model compression techniques, will be essential for enterprise-level deployment. Moreover, incorporating explainability mechanisms, such as SHAP or LIME, will provide instance-level transparency, thus fostering user trust and facilitating evidence-based decision support. Longitudinal studies examining the influence of model recommendations on methodological choices over time would offer valuable insights into the practical impact of the system.


