Article

Readability Formulas for Elementary School Texts in Mexican Spanish

by
Daniel Fajardo-Delgado
1,
Lino Rodriguez-Coayahuitl
2,
María Guadalupe Sánchez-Cervantes
1,
Miguel Ángel Álvarez-Carmona
3 and
Ansel Y. Rodríguez-González
2,*
1
Department of Systems and Computation, Tecnológico Nacional de México, Instituto Tecnológico de Ciudad Guzmán, Ciudad Guzmán 49100, Mexico
2
Centro de Investigación Científica y de Educación Superior de Ensenada, Unidad Académica Tepic, Tepic 63155, Mexico
3
Centro de Investigación en Matemáticas, Unidad Monterrey, Apodaca 66628, Mexico
*
Author to whom correspondence should be addressed.
Appl. Sci. 2025, 15(13), 7259; https://doi.org/10.3390/app15137259 (registering DOI)
Submission received: 20 May 2025 / Revised: 17 June 2025 / Accepted: 24 June 2025 / Published: 27 June 2025
(This article belongs to the Special Issue Machine Learning and Soft Computing: Current Trends and Applications)

Abstract

Readability formulas are mathematical functions that assess the ‘difficulty’ level of a given text. They play a crucial role in aligning educational texts with student reading abilities; however, existing models are often not tailored to specific linguistic or regional contexts. This study aims to develop and evaluate two novel readability formulas specifically designed for the Mexican Spanish language, targeting elementary education levels. The formulas were trained on a corpus of 540 texts drawn from official elementary-level textbooks issued by the Mexican public education system. The first formula was constructed using multiple linear regression, emulating the structure of traditional readability models. The second was derived through genetic programming (GP), a machine learning technique that evolves symbolic expressions based on training data. Both approaches prioritize interpretability and use standard textual features, such as sentence length, word length, and lexical and syntactic complexity. Experimental results show that the proposed formulas outperform several well-established Spanish and non-Spanish readability formulas in distinguishing between grade levels, particularly for early and intermediate stages of elementary education. The GP-based formula achieved the highest alignment with target grade levels while maintaining a clear analytical form. These findings underscore the potential of combining machine learning with interpretable modeling techniques and highlight the importance of linguistic and curricular adaptation in readability assessment tools.

1. Introduction

Reading comprehension—the ability to understand written texts—is essential for success in academic, professional, and social environments. Uncovering the right fit between students’ reading ability and text difficulty is critical for comprehension and remains a challenging task for teachers [1]. Usual methods to match students to appropriate texts are through readability formulas, which provide an estimated measure of the difficulty of a text to read. Readability formulas draw on text attributes that integrate syntactic (sentence) and semantic (vocabulary) dimensions. Although a diversity of readability formulas exist in the scientific literature [2,3], most of them are suitable only for the English language.
Limited efforts have been made to extend current English readability formulas to other languages. In particular, only a few approaches exist for the Spanish language in spite of the vast cultural and linguistic differences in Spanish-speaking countries. Furthermore, variations in dialects (regional speech patterns) and sociolectal—differences in the way language is used by particular social groups, classes, or subcultures—occur across different countries. For instance, the use of “vos” as a second-person singular pronoun is common but not universally employed. It is worth noting that there is currently no readability formula tailored specifically to Mexican Spanish texts, despite Mexico having one of the largest populations of Spanish speakers globally, with more than twice as many speakers as any other country in the world.
Readability formulas have traditionally been associated with adapting written material—primarily textbooks—to achieve more effective didactic communication (e.g., [4]). They have also been used to measure the readability of online patient education materials (e.g., [5]). While psycholinguistic research continues to advance readability assessment, recent studies have begun exploring computational approaches to this task.
In recent years, techniques based on standard machine learning and deep learning approaches have been used to develop models for automatically assessing the readability level of texts [6]. Some of these works have been modeled using feature engineering [7], but currently, most of them rely on word embedding representations [8,9] and deep learning [10,11,12] approaches, which have demonstrated improved performance over linguistic feature-based systems. In particular, transformer-based language models such as BERT and RoBERTa have shown strong predictive capabilities in readability assessment tasks across various languages [13,14]. From a machine learning perspective, the readability assessment is often viewed as a classification task, where an annotated set of corpora is trained with its corresponding labels. However, these models are often considered “black boxes” due to their lack of interpretability. Furthermore, most of these models are trained on corpora that do not reflect linguistic variants of a language, leading to potential mismatches between the estimated readability levels and the actual curricular complexity encountered by students. In spite of the recent efforts, there is currently no approach offering both high accuracy and interpretability to assess the readability for elementary school texts in Mexican Spanish. This highlights the pressing need for readability models that are not only transparent but also explainable contextually.
This paper presents two novel readability formulas tailored for the Mexican Spanish language. The contribution of this work is twofold. First, to the best of our knowledge, these are the first readability formulas specifically designed to assess elementary school texts in the Mexican Spanish language. Despite Mexico being the largest Spanish-speaking country in the world—home to over 125 million native speakers—there has been a notable absence of readability formulas adapted to its specific linguistic and educational contexts. Second, one of the proposed formulas is the first of its kind to be generated through GP, a technique within evolutionary computation that simulates natural selection and biological evolution to solve complex problems. A key advantage of GP over conventional machine learning approaches is its capacity to produce interpretable models, expressed as explicit closed-form equations. This interpretability allows for greater transparency and deeper understanding of the linguistic features that influence text difficulty. To assess the effectiveness of the proposed formulas, an experimental study was carried out, comparing their performance against several well-established readability formulas. The experimental results indicate that the proposed formulas exhibit a markedly stronger correlation with Mexican elementary grade levels. This suggests that they offer a more accurate and interpretable means of assessing text difficulty in the context of Mexican Spanish educational materials.
The remainder of this paper is organized as follows. Section 2 reviews some of the most used readability formulas, with a particular focus on those developed for the Spanish language. Section 3 details the methodology adopted for the development of the proposed readability formulas. Section 4 presents the experimental setup, outlines the evaluation criteria, and discusses the results obtained from the comparative analysis. Finally, Section 5 summarizes the main findings of this study and outlines directions for future research.

2. Related Work

According to [2,3], more than 200 readability formulas exploit linguistic, syntactic, and semantic clues for assessing the readability of a given text. This section describes some of the most popular and efficient, especially those intended for the Spanish language. Most of these formulas arise from the psycholinguistic research area, while other more recent ones are produced using machine learning algorithms.

2.1. Traditional Readability Formulas

The earliest formulas to automatically compute the difficulty of a text were devised for English. One of the first readability formulas (and possibly the most influential) is the Flesch Reading Ease scale [15], which gives a text a score between 0 (most difficult) and 100 (easiest). A score of 100 approximately corresponds to elementary school grade-level 4. The Flesch index, shown in Equation (1), is based on structural text features such as the average sentence length ( A S L ) and the average number of syllables per word ( A S W ).
Flesch = 206.835 ( 1.015 × A S L ) ( 84.6 × A S W ) .
An adaptation of the basic Flesch formula for the Spanish language was proposed by Fernández-Huerta in [16]. This adaptation primarily involves slight adjustments to the weight coefficients for 100-word samples. Equation (2) presents a modification of the Fernández-Huerta formula that works for a passage containing any number of words by considering the total number of sentences (S) and words (W) (this modified version of the Fernández-Huerta formula is proposed in https://linguistlist.org/issues/22/22-2332/, accessed on 20 May 2025). The Flesch and Fernández-Huerta formulas are structured into seven levels ranging from 0 to 100, wherein a higher score indicates that the text is easier to read.
Fernández - Huerta = 206.84 ( 60 × A S W ) ( 102 × S / W ) .
Later, Gutiérrez de Polini [17] proposed one of the first readability formulas devised originally for the Spanish language (without adaptations). The Gutiérrez de Polini index, shown in Equation (3), combines structural text features such as the number of letters (L), number of words (W), and number of sentences (S) for samples of 100 words. Similarly to the Fernández-Huerta formula, the lower the value computed for a text, the harder it is to read. However, the Gutiérrez de Polini formula is intended only for sixth-grade school texts.
Gutiérrez de Polini = 95.2 ( 9.7 × L ) / W ( 0.35 × W ) / S .
Another precursor in developing readability formulas for Spanish texts is the formula proposed by Szigriszt-Pazos in [18], as depicted in Equation (4). He establishes a correlation between readability and the comprehensive nature of the content in terms of perspicuity—the ability to understand something clearly and without ambiguity. This formula evaluates texts based on the total number of syllables (Y), words (W), and sentences (S), with lower scores indicating more intricate texts and higher scores suggesting easier comprehension. The Szigriszt-Pazos scale categorizes texts as standard when they score between 51 and 65, with scores closer to 0 or 100 indicating increasing difficulty or ease of understanding, respectively. In  [19], Barrio Cantalejo proposed the Inflesz scale, an alternative interpretation of the Szigriszt-Pazos formula. According to Barrio Cantalejo, the interpretation of Szigriszt-Pazos’ perspicuity formula needs adjustment as it may have been based on non-representative or haphazard selection of texts. The Inflesz scale completes the process opened by Szigriszt-Pazos, reviews his scale comparing it with Flesch’s original, and proposes a scale more adjusted to Spanish reading habits.
Szigriszt - Pazos = 206.835 ( 62.3 × Y ) / W W / S .
Another readability index tailored for the Spanish language is the μ formula, devised by Baquedano in [20]. This formula employs the characters or letters within a text as its fundamental metric unit for computing statistics related to measures of central tendency and dispersion. According to this methodology, the lexical “richness” of a text correlates consistently with the dispersion around the average number of characters per word. Equation (5) illustrates the μ formula, where x L ¯ represents the mean number of letters per word and σ t 2 denotes its variance. A text’s readability is inversely proportional to the variability of its letters; therefore, texts with lower variability are deemed more readable.
μ = ( W / W 1 ) × ( x L ¯ / σ t 2 ) × 100 .
Other formulas are used to calculate the years of schooling necessary to understand a text, such as the Crawford and the Spanish orthographic length (SOL) formulas. Crawford [21] proposed a readability formula based on a multiple regression analysis of passages extracted from elementary-level readers. These materials, commonly used in the United States, Latin America, and Spain, were each designed for a specific grade level. His formula establishes a relationship between textual features and the appropriate grade level for comprehension. Crawford focuses on two primary factors in his research: the number of sentences (S) and the number of syllables (Y) in a 100-word passage. The formula derived from his study is applicable up to the elementary sixth-grade level.
Crawford = ( S × 0.205 ) + ( Y × 0.049 ) 3.407 .
Alternatively, Contreras et al. [22] introduced an extension of the SMOG formula for the Spanish language. They employed the SOL measurement to determine the educational level needed to comprehend Spanish texts. This is achieved through the analysis of complex words, especially polysyllabic ones (P), and the evaluation of sentence structure.
SMOG = ( 1.043 × 30 P / S ) + 3.1291
SOL = 2.51 + 0.74 × SMOG
Table 1 summarizes some of the readability levels of formulas developed for the Spanish language, excluding those that estimate the years of schooling required to comprehend a text. While the Fernández-Huerta formula provides grade-level interpretations based on score ranges, the Gutiérrez de Polini formula is calibrated exclusively for sixth-grade elementary texts. In contrast, the Szigriszt-Pazos formula and the Inflesz scale do not define specific educational grade levels.
Some readability formulas that stand out for other languages are the Gulpease and the Osman formulas. The Gulpease index [23], introduced in the 1980s by the gruppo universitario linguistico pedagogico (GULP) at the University of Rome, is specifically designed for the Italian language. Unlike many traditional readability formulas, the Gulpease index measures word length in characters rather than syllables, a method that has proven to be more effective in assessing the readability of Italian texts. On the other hand, the Osman index [24] is tailored for Arabic texts by adapting conventional readability formulas like Flesch. This index leverages diacritics—marks added to letters to guide pronunciation and clarify meaning—to accurately count syllables. It includes the counting of hard words (C), the number of syllables per word ( D ) , the count of complex words in Arabic (G), and the number of ‘Faseeh’ words (H). The Gulpease and Osman formulas are mathematically represented by Equations (9) and (10), respectively.
Gulpease = 89 + ( 300 · S ) ( 10 · L ) W
Osman = 200.791 1.015 × A S L 24.181 × C + D + G + H W

2.2. Readability Models Produced by Machine Learning Algorithms

Recent research on readability formulas has evolved to consider syntactic, semantic, and discourse-level complexities, driven by advancements in natural language processing (NLP) tools such as dependency and constituency parsers, anaphora resolution systems, and resources like WordNet [6]. NLP tools, combined with machine learning (ML) algorithms, have been applied to predict readability across some domains (e.g., web pages [25] or online health resources [26]).
In the context of the Spanish language, López-Aguita et al. [27] utilized classical machine learning algorithms—such as LinearSVC, Multilayer Perceptron, Random Forest, and Naive Bayes—to create a classification model aimed at determining the appropriate reading age for children’s Spanish texts. They compared these algorithms using traditional NLP representations like Word2Vec and TF-IDF to identify which produced the most accurate predictions. Similarly, Uçar et al. [28] used both feature-based machine learning and deep learning models to predict the educational grade level of Spanish science texts in obligatory secondary education.
Despite the advancements in predictive accuracy achieved through ML approaches for readability assessment, the issue of interpretability remains a significant concern. Few studies have focused on developing ML models that generate more interpretable results. For instance, Morato et al. [29] evaluated the readability of Spanish e-government websites using a decision tree generated by the C4.5 algorithm, which provides a more transparent and interpretable model. However, there remains a gap in the literature regarding the integration of interpretability with high predictive accuracy in readability assessment models. This gap highlights the need for further research into developing models that can balance these two critical aspects, enabling more effective and understandable tools for assessing text readability across different languages and domains.

3. Methodology

The methodology adopted in this study comprises four main phases: (1) compiling a representative corpus of Mexican Spanish texts, (2) designing a custom point-based readability scale aligned with the official Mexican elementary curriculum, (3) developing an initial readability formula using a linear regression approach, and (4) implementing a GP algorithm to automatically generate a second, more interpretable readability formula.

3.1. Corpus Compilation

A corpus comprising 540 Spanish texts from elementary education levels, ranging from first to sixth grade, was compiled for this work. The distribution of texts is uniform, with 90 texts per grade, ensuring balanced representation of reading materials across all educational stages. These texts were sourced from lecture books provided by the Mexican public education system, specifically from the official curriculum for elementary schools as established in 1993 and 2019. Texts were validated by experts in pedagogy, linguistics, and the literature to ensure their relevance and appropriateness for the targeted student age groups (https://www.gob.mx/conaliteg, accessed on 20 May 2025). The textbooks from the ‘new Mexican school’ reform, introduced in 2023, do not include a dedicated reading book for each grade level and were therefore excluded from this compilation.
Table 2 presents the statistical summary of the corpus. Interestingly, there is no clear progression in text characteristics that would naturally reflect the increasing complexity of educational materials across grade levels. This phenomenon is particularly evident in the texts from the fourth grade, which have a higher average word count and a greater number of words per sentence compared to texts from the fifth and sixth grades. This discrepancy arises from the inclusion of longer texts in the fourth-grade lecture book from the 1993 curriculum. In contrast, the fourth-grade texts exhibit a lower average number of sentences than most other grades, with the exception of first grade.
Some lectures included words from indigenous Mexican languages, such as Nahuatl, which were excluded from the analysis to maintain a clear focus on the readability of standard Spanish. However, all readable text presented to the students—including titles, author names, and any accompanying text—was retained to ensure the corpus accurately reflects the complete educational content provided to the children.
A curation process was performed on the corpus to remove elements that do not provide meaningful information or to modify other extraneous characters or spaces that could introduce noise into the data. During this process, stop words like periods and commas were carefully inserted to ensure complete and grammatically correct sentences. Additionally, sentence-initial letters were transformed into uppercase to standardize the text formatting. We used the natural language toolkit (NLTK) [30] for the steps of the tokenization and addition of the stop words.
This thorough approach ensured the corpus remained consistent, comprehensive, and representative of the materials used in the educational system, thereby enhancing the reliability of subsequent analyses.

3.2. Design of the Point-Based Readability Scale

The aim of this study is to develop readability formulas that offer accurate and interpretable means of assessing text difficulty within the context of Mexican Spanish educational materials. To this end, a custom point-based readability scale ranging from 100 to 0 is proposed, where a score of 100 corresponds to texts suitable for first-grade students and a score of 0 corresponds to texts appropriate for sixth-grade students. This inverse scale reflects a gradual increase in reading complexity, with lower scores indicating more challenging texts typically aligned with higher elementary grade levels.
Unlike traditional readability formulas—which often associate ranges of scores with educational levels (e.g., scores from 91 to 100 indicating “very easy” texts for early primary readers, as in Table 1)—the proposed scale uses fixed target values that decrease in increments of 20 for each elementary grade level. This approach simplifies interpretation and provides a direct mapping to the structure of the Mexican elementary education system.
This formulation allows the problem to be treated as a regression task, where the goal is to develop models that can predict readability scores as close as possible to these target values. For instance, a well-fitted model should output values close to 100 for first-grade texts and values near 0 for sixth-grade texts. This design ensures consistency between predicted scores and the intended reading difficulty.
Table 3 presents the proposed readability levels based on this scale. A score below 0 is interpreted as “very difficult”, suggesting that the text may be more appropriate for students beyond elementary school, such as those in secondary education. This threshold also serves as a soft boundary for flagging texts potentially unsuitable for the intended reading level. We believe that this mapping enhances the alignment between quantitative scores and pedagogical expectations, making it easier to evaluate and select grade-appropriate educational texts in the Mexican Spanish context.

3.3. Readability Formula Based on Linear Regression

This section presents the initial readability formula proposed in this study, developed using a linear regression approach. The objective is to develop a transparent, interpretable model that maps textual features to elementary grade-level difficulty, in a manner consistent with traditional readability metrics. Emphasis is placed on maintaining simplicity, enabling practical application in educational settings, and facilitating direct comparison with established formulas, which are predominantly linear combinations, occasionally involving ratios of features.
To align with the simplicity of widely used readability formulas (see Section 2), conventional features based on counts of syllables, words, and sentences to assess text readability were considered. These features were extracted using the NLTK library, along with supplementary Python modules, which enabled the tokenization of texts into syllables, words, and sentences while adhering to Spanish grammatical conventions.
The analyzed features include the total number of words (W), letters (L), sentences (S), syllables (Y), polysyllabic words (P), average sentence length ( A S L = W / S ), average syllables per word ( A S W = Y / W ), and average letters per word ( x L = L / W ). These features were initially selected to ensure consistency with established readability formulas and to maintain interpretability, facilitating comparison across methods.
To explore the relationships among these variables, a correlation matrix heatmap was generated, as shown in Figure 1. This visualization highlights a strong linear correlation among W, L, S, Y, and P, which are naturally interrelated due to the structure of written language. Interestingly, A S L exhibits the highest linear correlation with the grade level.
Building on these insights, new combinations and interaction terms among variables were introduced, including polynomial features to capture nonlinear relationships, to identify the most effective subset of variables. This involved fitting separate regression models for all possible combinations of variables and selecting the subset that minimized the mean squared error (MSE). Although the computational time complexity of ordinary least squares (OLS) regression is O ( n p 2 + p 3 ) , where n is the number of observations and p the number of variables [31], the exhaustive nature of the subset selection process increases exponentially with the number of variables. However, given the relatively limited number of features considered in this study, this approach remained computationally feasible. In line with the hierarchical principle, all main effects associated with any interaction terms were retained during the selection process. Following feature selection, a series of linear regression models were then developed and evaluated based on their MSE, using the proposed point-based scale. These models were trained using only 60% of the corpus, in accordance with the division outlined in Section 4. The models were fitted using OLS, with data manipulation and regression performed via Python libraries such as pandas, scikit-learn, and statsmodels.
The best-performing model (i.e., the one with the minimum MSE) included four main effect terms (W, S, A S W , and  x L ) and four interaction terms ( W 2 / ( L × S ) , L / Y , L × P , and  L × S × P ), as defined in Equation (11).
Linear - MX = 193.7654 0.0743 × W + 0.4407 × S + 174.6279 × A S W 79.1952 × x L 2.8881 × W 2 / ( L × S ) + 120.0677 × ( L / Y ) + 1.9723 × 10 5 × L × P 3.5555 × 10 8 × L × S × P
The term W 2 L × S in Equation (11) originates from the division between average sentence length ( A S L ) and average word length ( x L ), capturing more nuanced patterns in sentence structure.
An F-statistic applied to Equation (11) confirms that the model is statistically significant overall, indicating that at least one of its terms contributes significantly to explaining the variance in the response variable. Notably, while the contributions of individual main effects terms were limited, the inclusion of interaction terms led to statistically significant improvements, highlighting the importance of modeling interactions in text complexity.

3.4. Automatic Generation of a Readability Formula Using GP

This section introduces the second proposed readability formula, derived through a GP approach to enable a more flexible, nonlinear modeling of complex interactions among linguistic features. GP is a type of evolutionary algorithm introduced by Koza [32] that simulates the process of natural evolution to automatically evolve programs capable of solving a given task. GP operates on a population of candidate solutions, each encoded as a tree-like structure composed of functions and terminals. These individuals evolve over successive generations through biologically inspired operators such as reproduction, crossover, and mutation, leading to progressively improved solutions.
Each individual in this context is a candidate readability formula, represented as a hierarchical program tree of operations and operands. These program trees are structured as LISP S-expressions, a common format in GP for expressing tree-based programs. The leaves of these program trees, known as terminals, are drawn from a predefined set T, which consists of the syntactic features extracted from the texts as well as numeric constants. Specifically, the terminal set is defined as T = { W , L , S , Y , P , A S L , A S W , x L } C , where each named element corresponds to a distinct linguistic feature introduced in Section 3.3, and C denotes a set of real-valued constants sampled uniformly from a predefined range. Internal nodes within the program trees are selected from a predefined set of functions F = { + , , × , ÷ , min , max , m e a n } . This set comprises binary arithmetic operations (addition, subtraction, multiplication, and protected division) as well as reduction functions (minimum, maximum, and mean of two values). Protected division (÷) ensures numerical stability and prevents division-by-zero errors, enabling the generation of valid and robust models throughout the evolutionary process.
The best individual identified through the evolutionary process is designated as the selected readability formula. To evaluate the effectiveness of each individual (as a candidate readability formula), the mean square error (MSE) is used to measure the difference between the predicted readability scores and the expected scale scores. The GP algorithm iteratively evolves individuals that increasingly minimize the MSE, thereby enhancing their accuracy in predicting text readability according to the established scale.
During the evolutionary process, also referred to as training, the population of individuals undergoes reproduction through the application of variation operators such as crossover and mutation. Crossover selects two parent trees and produces offspring by exchanging randomly chosen subtrees between them. Mutation, on the other hand, selects a single individual and replaces a randomly chosen subtree with a newly generated random subtree. These operations introduce variation and enable the exploration of the search space. The resulting offspring are then evaluated for their fitness and compete for selection into the subsequent generation. This iterative process continues until a predefined number of generations is reached, ensuring the progressive refinement of solutions over time. The detailed steps of this evolutionary process are outlined in Algorithm 1.
Algorithm 1: Genetic Programming for Readability Formula Discovery
Applsci 15 07259 i001
In Algorithm 1, D denotes a labeled dataset containing text samples and associated grade-level labels. Function InitPopulation( N , d max ) generates the initial population P 0 by randomly constructing N individuals (syntax trees) using the variable-depth grow method, with maximum depth d max . This method selects functions or terminals for each node at random, with the probability of selecting a terminal increasing with the node’s depth. Considering random trees of size O ( d max ) , function InitPopulation requires O ( N d max ) time. The function Eval( P , D ) computes the fitness of each individual in population P by comparing predicted grade levels to true labels in D , using the MSE as the fitness criterion. Computing the MSE for n observations requires O ( n ) time, so evaluating the fitness of all N individuals, each with size d max , takes O ( n N d max ) time. The function BinaryTournament( P ) constructs a mating pool M by repeatedly selecting the fitter individual from randomly sampled pairs in P . Implementing function BinaryTournament requires O ( N ) time. The pool O g of offspring is created via ApplyGeneticOperators( M , p c , p m , p n , d max ), which applies protected crossover, protected mutation, and numeric mutation (according to their respective probabilities) while respecting the maximum tree depth. Function ApplyGeneticOperators take O ( N d max ) time. The resulting offspring O g are evaluated using Eval. Then, SelectNextGen( P , O , N ) forms the next generation by selecting the top N individuals from the union P O (by using a sorting algorithm), keeping half from the current population and half from the offspring. The execution time of function SelectNextGen is O ( N log N ) . Finally, BestIndividual( P ) returns the highest-fitness individual in population P —i.e., the best-evolved readability formula. The overall execution time of Algorithm 1 is O ( G N ( d max n + log N ) ) .
Algorithm 1 largely follows a standard Genetic Programming framework, with two critical modifications: the use of ‘protected’ genetic operations and the inclusion of ‘numeric mutation’. Protected genetic operations enforce structural constraints by ensuring that all offspring remain within the predefined maximum tree depth. This control preserves the syntactic validity and interpretability of evolved individuals, addressing a common limitation in standard crossover and mutation, which can lead to uncontrolled growth. In parallel, numeric mutation, introduced by Evett and Foster [33], perturbs the numeric constants found in terminal nodes. This operator aims to fine-tune real-valued parameters within individuals, enhancing the expressiveness and precision of evolved formulas. Together, these two modifications were essential for evolving readability formulas that are both compact and accurate.
Algorithm 1 was implemented using TurboGP [34], a modern GP library written in Python that supports both standard components and recent advances in the field. In contrast to other widely used GP frameworks such as gplearn [35] and DEAP [36], TurboGP provides native support for protected genetic operations and the numeric mutation operator required in this study.
Table 4 presents the evolutionary settings used in Algorithm 1. While it is inherently challenging to precisely estimate the effects of individual operators and parameter configurations in GP, a series of preliminary trials were conducted to identify a consistently effective setup.
The algorithm was executed over 10 independent runs. In general, the best individuals from each run exhibited comparable performance. Among these top-performing candidates, the one with the lowest mean squared error (MSE) was selected as the proposed readability formula. Figure 2 illustrates the structure of this fittest individual as a program tree, where the number 4 corresponds to the textual feature P, and the number 5 corresponds to A S L , based on the enumeration generated by TurboGP v.1.3.1. Equation (12) presents its corresponding mathematical expression.
GP - MX = 82.33 A S L min ( P , 26.8 )
The interpretation of Equation (12) is as follows. Readability scores range from 100 (easiest) to 0 (hardest), with all texts beginning at a baseline score of 82.33 . This score is reduced linearly as the ASL increases. Additionally, a penalty of 26.8 points is applied if the number of polysyllabic words exceeds a threshold of 26; otherwise, the penalty equals the actual count of polysyllabic words.

4. Experimental Study

This section presents the experimental evaluation conducted to assess the performance of the proposed readability formulas. The study incorporates several key components: the benchmark indices used for comparison, the statistical analysis methods applied to determine the significance of the results, and the metrics employed to evaluate the solution quality.
The corpus described in Section 3.1 was divided into training and testing sets, following a validation set approach, with 60% of the data allocated for training and the remaining 40% reserved for testing. To ensure the reproducibility of results, the random number generator was initialized with a fixed seed value of 42. The development of both proposed readability formulas—the linear regression-based model and the one derived through the GP approach—was conducted exclusively using the training set. Since the computational cost of variable selection used in linear regression increases exponentially with the number of variables, using consistent dataset splits helped manage complexity and avoid repeated evaluations across varying random partitions. All experimental results and performance evaluations presented in this section are based on the unseen testing set.
The experiments were carried on a system equipped with an Apple M2 Pro processor, 16 GB of RAM, and running OS X 14.6.1. All benchmark indices and proposed formulas were implemented in Python 3.12.1.

4.1. Benchmark Indices

The effectiveness of the proposed formulas—Linear-MX and GP-MX, defined in Equations (11) and (12), respectively—is evaluated through a comparative analysis against both traditional readability formulas developed for the Spanish language and well-established formulas from other linguistic contexts (see Section 2). Among the Spanish-language benchmarks, the comparison includes the Fernández-Huerta, Gutiérrez de Polini, Szigriszt-Pazos, and the μ index—each of which typically uses a readability scale ranging from 0 to 100. Additionally, the Crawford and SOL formulas are considered, both of which estimate the years of schooling required to understand a given text.
To broaden the evaluation, internationally recognized formulas such as the Flesch Reading Ease scale (English), the Gulpease index (Italian), and the Osman index (Arabic) are also included. These formulas serve as valuable comparative baselines, highlighting the language-specific nature of the readability assessment and underscoring the relevance of the proposed models.
It is important to note that many of the benchmark indices do not directly align with standardized elementary grade levels, particularly within the Mexican context. Nevertheless, they remain widely used tools for measuring text difficulty and offer an essential point of reference for evaluating the relative strengths and limitations of new models. By incorporating a diverse set of readability metrics, this study enables a comprehensive assessment of how effectively the proposed formulas model text complexity for elementary education in Mexican Spanish.

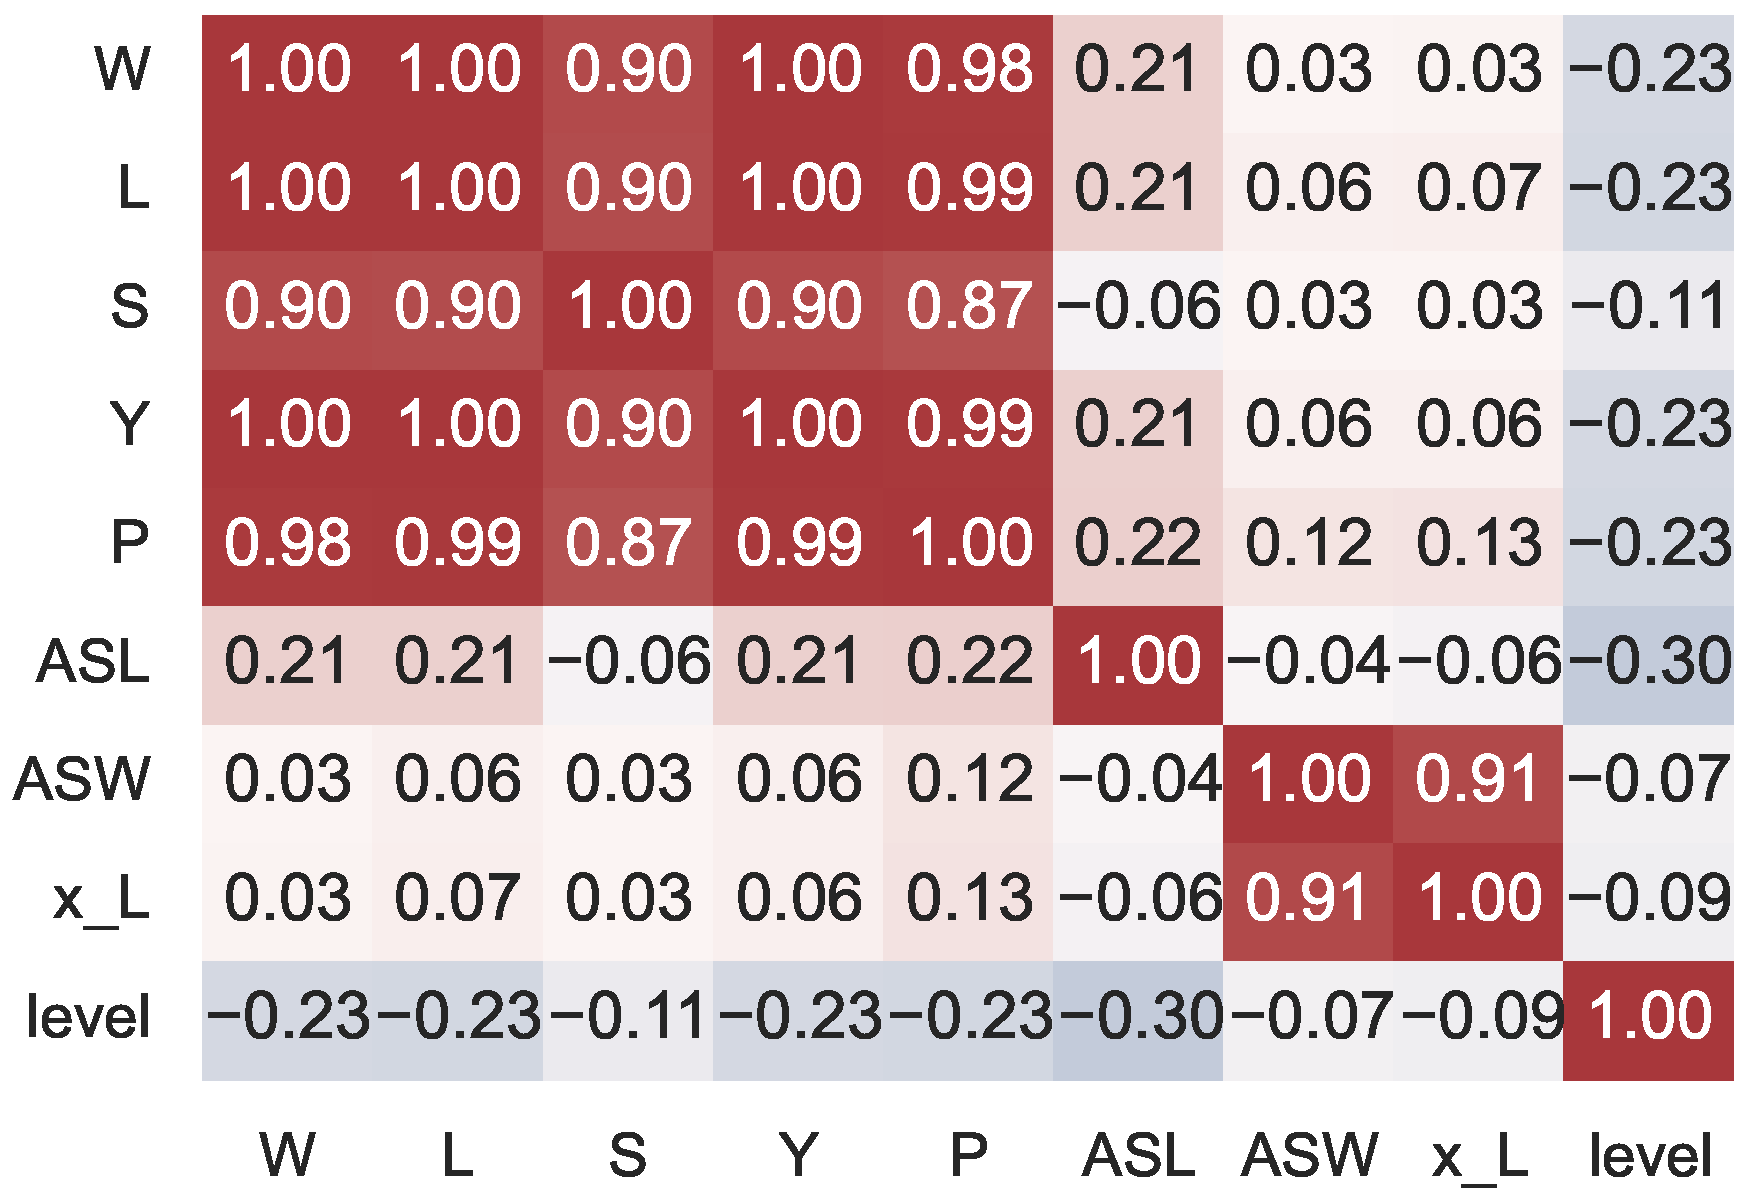
4.2. Statistical Analysis

The predictions produced by the readability formulas—referred to as readability scores—were analyzed using statistical methods to assess both the normality of the distributions and the presence of significant differences across Mexican elementary grade levels.
To evaluate the normality of the data, the Shapiro–Wilk test [37] was applied to the readability scores obtained for each grade level. In most cases, the resulting p-values exceeded the significance threshold of α = 0.05 , indicating insufficient evidence to reject the null hypothesis of normality. This suggests that the majority of the score distributions approximate a normal distribution, justifying the use of parametric methods for subsequent analysis.
Based on this result, a one-way analysis of variance (ANOVA) was conducted to determine whether the readability scores differed significantly across the six elementary grade levels. Since the ANOVA indicated significant differences for all the cases, Tukey’s honestly significant difference (HSD) test [38] was employed for post hoc pairwise comparisons. Tukey’s HSD includes adjustments to control the familywise error rate, thereby reducing the likelihood of Type I errors arising from multiple comparisons.
It is important to note that these statistical comparisons are independent of the readability scales used by each index. Consequently, the tests focus solely on the discriminatory power of each index in separating grade levels, rather than on the specific numerical ranges of their scales. This enables a fair comparison across indices, regardless of their original scale design or unit of measurement.
Tukey’s HSD test yields a symmetric matrix of p-values, denoted as M, for each readability index. Each element M [ i ] [ j ] in this matrix represents the p-value corresponding to the comparison between grade levels i and j.

4.3. Performance Metrics

To evaluate the performance of each readability formula, standard regression metrics were employed, including MSE and root mean squared error (RMSE) [39], as well as the coefficient of determination ( R 2 ). To this aim, the readability scores generated by the benchmark indices were normalized according to their respective readability scales, ensuring consistency and comparability across different formulas. Specifically, the median value of each scale’s predefined range was selected as a fixed reference point for the corresponding school grade. For instance, the Fernández-Huerta index defines the readability range for sixth-grade texts between 71 and 80 (see Table 1); hence, a fixed comparison value of 75 was assigned. Similarly, for the Szigriszt-Pazos index, the central reference value was set at 70. This normalization process facilitates a fair evaluation of each formula’s predictive accuracy by aligning the expected values with standardized grade-level targets, thereby allowing the regression metrics to reflect meaningful deviations from pedagogically relevant benchmarks.
In addition to these conventional metrics, a metric Δ p , defined in Equation (13), is introduced to assess the degree of statistical separation among grade levels. This metric is derived from the symmetric matrix M of p-values obtained via Tukey’s HSD post hoc test, where n represents the number of educational levels considered. The formulation of Δ p is designed to reward significant differences between readability scores corresponding to more distant grade levels while penalizing the absence of such differences.
Δ p = n i = 1 n j = 1 n | i j | · M [ i ] [ j ]
A lower Δ p value indicates high p-values between grade levels, suggesting that the different n levels are not statistically distinguishable in terms of their predicted readability scores. Conversely, a higher Δ p reflects better separation and alignment with the intended educational progression.
Thus, Δ p provides a complementary performance perspective by incorporating statistical evidence of grade-level separability, providing a complementary perspective to traditional regression metrics.

4.4. Experimental Results

Figure 3 presents the familywise error rates obtained through Tukey’s HSD test, assessing the degree of separability among Mexican elementary grade levels for various readability formulas. In this context, p-values close to 0 indicate statistically significant differences between grade levels, while values near 1 suggest no meaningful distinction in textual difficulty between those levels. The findings reveal that most formulas struggle to clearly differentiate between texts from grades 4 to 6 and, to a lesser extent, between grades 1 and 3. However, some formulas do succeed in identifying distinctions within the lower grade levels (grades 1–4). This pattern of separability—forming two main blocks (grades 1–3 and 4–6)—is especially evident for the Linear-MX formula (g). It exhibits highly significant p-values (close to 0) across reading scores of text between grades 1 and 4 and grades 5 and 6. The GP-MX formula (h) also shows good separation, particularly between grades 1 and 2 and the higher grades. However, there are some non-significant p-values among mid-level grades (grades 3–5), suggesting a moderate overlap in readability scores for these levels. The SOL index (f) offers reasonably good performance as well, correctly distinguishing between many grade levels, although it tends to show higher p-values (weaker separability) between grades 4 and 6. Traditional Spanish formulas such as Gutiérrez de Polini (b), Szigriszt-Pazos (c), μ (d), and Crawford (e) exhibit moderate performance. They are generally capable of distinguishing early grade levels (especially grades 1 vs. 4 or 5), but their sensitivity declines sharply in upper grades, with p-values often exceeding 0.3, indicating little statistical distinction. Interestingly, among the foreign-language formulas, the Gulpease index (j) (Italian) performs surprisingly well, surpassing even some Spanish-specific formulas like μ and Crawford. It provides good separation, especially in early grades, and remains relatively consistent through middle grades. In contrast, the Flesch (i) and Osman (k) formulas underperform in this context. While they show strong separation in the earliest grades (grades 1–2 vs. higher grades), their ability to distinguish between middle and upper elementary grades is notably weaker, confirming the challenges of applying non-Spanish formulas to Spanish texts without adaptation. Finally, the Fernández-Huerta index (a), despite being designed for Spanish, exhibits the poorest performance. It shows almost no statistically significant differences between any grade levels, with most p-values near 1.0, suggesting it is largely insensitive to progressive changes in text complexity across the elementary grades. This weakness may stem from its simplistic formula and outdated assumptions about language structure.
Figure 4 shows the distribution of readability scores generated by each readability index. Notably, the fourth grade often breaks the expected trend of progressively decreasing readability levels (or increasing, in the case of the Crawford and SOL formulas). In the case of the Gutiérrez de Polini formula, the absence of a clear trend is justifiable, as this formula was specifically designed to assess sixth-grade educational texts, and thus may not generalize well across other grade levels. The Linear-MX and GP-MX formulas exhibit the clearest downward trends, aligning well with the expected progression in text complexity across elementary grades. Linear-MX, in particular, shows a consistent decline in median scores from grades 1 to 6 with limited overlap, indicating a regular grade-level sensitivity. By contrast, traditional formulas such as Fernández-Huerta and Szigriszt-Pazos show flatter distributions, with limited variation across grades. This suggests these formulas may lack sufficient resolution to distinguish between the incremental increases in difficulty typical of elementary school materials. The μ index displays a more gradual trend, although with considerable overlap between distributions. The Crawford and SOL formulas show a modest upward trend. While Crawford formula indicates a range of age between 0 and 5 for most of the texts, the SOL formula provides a pretty realistic range between 3 and 11. Among the cross-linguistic formulas, the Gulpease formula displays a discernible downward trend but with greater score dispersion, while the Osman and Flesch formulas exhibit wide overlaps and irregular patterns, indicating lower alignment with the Spanish-language educational context.
Table 5 reports the performance metrics—MSE, RMSE and R 2 —for the readability formulas. The MSE and RMSE values provide measures of the average and root-mean-squared deviations, respectively, between the predicted and actual grade levels. Lower values indicate better predictive accuracy. The regression-based performance metrics reveal a clear contrast between the proposed formulas (Linear-MX and GP-MX) and traditional or cross-linguistic readability formulas. Among all formulas, GP-MX achieves the highest R 2 (0.179), closely followed by Linear-MX, indicating their superior alignment with grade-level expectations. Although these formulas do not yield the lowest MSE or RMSE values, their higher R 2 suggests they better capture the overall trend and variability in the data, offering more meaningful predictions of readability across grade levels. By contrast, Flesch and Osman show extremely poor performance, with very high RMSE values (over 70 and 45, respectively) and large negative R 2 , suggesting that these models explain far less variance than a constant baseline. Traditional formulas such as Fernández-Huerta and Szigriszt-Pazos yield the lowest RMSE and MSE values, but exhibit negative R 2 , indicating poor fit. Interestingly, Fernández-Huerta has the second-lowest RMSE but a notably low R 2 , hinting at low variance in predictions rather than true alignment with target grades. Notice that the Crawford and SOL formulas were excluded from this comparison, since they compute the number of years of education necessary to understand a text instead of a readability level in the range from 0 to 100, so the MSE and RMSE would be biased.
Figure 5 presents the values of the metric Δ p , as defined in Equation (13), which measures the separability of readability levels based on the statistical significance of Tukey’s HSD post hoc comparisons across educational grades. The results offer several key insights into the performance of both traditional and proposed readability formulas. The Linear-MX model achieved the highest score ( Δ p = 6.53 ), indicating superior performance in distinguishing between texts intended for different grade levels. This suggests the model is more effective than the rest of the formulas at capturing linguistic features aligned with educational progression in the corpus. The GP-MX model followed closely with an Δ p value of 8.12 , demonstrating that even a compact, symbolic representation derived through GP can yield strong differentiation across grade levels. Among the traditional Spanish-language formulas, the Fernández-Huerta index performed the worst ( Δ p = 49.92 ), followed by Szigriszt-Pazos ( Δ p = 15.81 ) and Osman ( Δ p = 15.92 ). These results indicate that such formulas may not align well with the specific characteristics of Mexican elementary-level texts. The Gutiérrez-Polini ( Δ p = 14.55 ) and SOL ( Δ p = 10.57 ) formulas showed moderately better results but still fell short compared to the proposed models. Indices originally developed for other languages, such as Flesch, Gulpease, and Osman, also underperformed in this context, underscoring the limitations of applying traditional formulas across different linguistic and educational settings.

4.5. Discussion

The experimental results underscore the limitations of traditional readability formulas when applied to Mexican Spanish educational texts. Formulas originally developed for Spanish, such as Fernández-Huerta, Szigriszt-Pazos, and Gutiérrez-Polini, as well as those adapted from other languages, generally fail to capture the incremental complexity of texts across elementary grade levels. This is reflected in their low separability scores, limited R 2 values, and overlapping score distributions. These findings suggest that such models lack the sensitivity needed to align with contemporary curricular progression in the Mexican context.
In contrast, the proposed formulas—Linear-MX and GP-MX—demonstrate clear advantages in both predictive accuracy and grade-level differentiation. The Linear-MX model achieved the highest Δ p score, indicating a superior ability to distinguish between texts from different educational stages. Although the GP-MX model slightly outperformed in terms of RMSE and R 2 , its lower separability score suggests a reduced capacity to distinguish adjacent grade levels. Therefore, while GP-MX offers marginally better regression performance, Linear-MX appears more effective for grade classification tasks.
These results have both theoretical and practical implications. Theoretically, they confirm the importance of context-specific modeling in readability assessment, particularly the use of statistical and symbolic regression approaches guided by empirical data. Practically, they point to the value of tailored formulas for educational content evaluation, curriculum design, and adaptive content generation.
The methodology used to construct the proposed formulas can be transferable to other languages or educational systems. While the formulas themselves are language-dependent and cannot be directly applied to other linguistic contexts due to reliance on features sensitive to language structure (e.g., syllables, sentence length), the modeling strategy remains valid. With retraining on language-specific corpora and proper adaptation to linguistic and curricular features, this approach offers a robust framework for developing localized readability tools across diverse educational and linguistic settings.
Although recent large language models (LLMs) have demonstrated strong performance in a variety of NLP tasks, their applicability to readability assessment poses important challenges. LLMs typically require substantial computational resources and extensive training data, which may limit their feasibility in real-world classroom or curriculum design settings. Moreover, they operate as black-box systems, reducing interpretability and making it difficult to align their outputs with pedagogical goals. In contrast, the proposed models are lightweight and interpretable: the Linear-MX model is based on standard multiple linear regression, while the GP-MX model, though more computationally intensive during training, generates compact symbolic expressions with low inference cost.
Regarding the relatively low R 2 values observed, this can be attributed to the inherent complexity and variability of early-grade Spanish texts, which do not always follow a strictly incremental progression in linguistic difficulty. For example, some fourth-grade texts featured more complex syntactic structures or vocabulary than sixth-grade texts, often due to thematic content or pedagogical intent. These inconsistencies reflect curricular objectives rather than purely linguistic complexity. Furthermore, real-world educational materials frequently include non-textual elements—such as illustrations, formatting, or contextual cues—that support comprehension but are not captured by textual features alone. Despite these limitations, the proposed models outperform traditional readability formulas and provide interpretable, context-aware assessments that align more closely with educational expectations, offering a solid foundation for evaluating early-grade text complexity.

5. Conclusions

This study introduced two novel readability formulas, Linear-MX and GP-MX, designed to quantify the difficulty level of Mexican Spanish texts intended for elementary school readers. Linear-MX was developed using a linear regression approach, while GP-MX employed GP to derive concise, interpretable, closed-form expressions based on non-linear feature combinations. Both models were fitted using a representative corpus of 540 texts sourced from official Mexican public education textbooks and evaluated using a combination of statistical and regression-based performance metrics.
The experimental analysis showed that the proposed formulas outperformed traditional Spanish and international readability formulas in predicting Mexican elementary grade levels. While Linear-MX and GP-MX perform similarly, GP-MX achieved the best balance between accuracy and interpretability, making it a practical tool for educational contexts where model transparency is essential. Statistical testing via ANOVA and Tukey’s HSD further confirmed that the proposed models more effectively captured significant differences across grade levels, especially where traditional formulas failed to maintain a consistent progression of complexity.
Despite these positive results, the study presents several limitations. The models rely on surface-level linguistic features—such as sentence length, word length, and lexical patterns—which, while effective, may not capture deeper semantic or syntactic dimensions of text complexity. Additionally, the corpus, although representative of the national curriculum, excludes texts with indigenous vocabulary and may not fully reflect regional or stylistic variation across the broader Spanish-speaking population.
Future work may extend this study in several directions. One avenue involves expanding the feature set to include indicators of syntactic complexity, lexical diversity, and semantic coherence, which could enhance both model interpretability and predictive power. Another promising direction is to adapt and validate the proposed models for other regional varieties of Spanish and for indigenous languages spoken in Mexico, thereby promoting greater inclusivity and generalizability. Additionally, systematically comparing datasets across languages and educational systems for readability modeling remains challenging due to structural and contextual differences, yet it offers a promising avenue for future research. Finally, incorporating qualitative assessments from educators and domain experts may help validate readability estimates and align them more closely with pedagogical standards.

Author Contributions

Conceptualization, D.F.-D., M.Á.Á.-C., and M.G.S.-C.; methodology, D.F.-D., M.Á.Á.-C., M.G.S.-C., and A.Y.R.-G.; software, D.F.-D., L.R.-C., and M.G.S.-C.; validation, L.R.-C. and A.Y.R.-G.; writing—original draft preparation, D.F.-D. and M.G.S.-C.; supervision, L.R.-C. and A.Y.R.-G.; project administration, D.F.-D., M.Á.Á.-C., and M.G.S.-C. All authors have read and agreed to the published version of the manuscript.

Funding

This research was funded by the Tecnológico Nacional de México under grant number 23018.25-P.

Institutional Review Board Statement

Not applicable.

Informed Consent Statement

Not applicable.

Data Availability Statement

For reproducibility purposes, the set of Mexican Spanish texts is available at https://github.com/dfajardod/mexican_spanish_lectures (accessed on 7 June 2025).

Acknowledgments

The authors are thankful to Jorge Omar Pérez-Villalvazo and Diego A. Morán-Acevedo for their valuable technical support in the Linear-MX analysis conducted in this study.

Conflicts of Interest

The authors declare no conflicts of interest.

Abbreviations

The following abbreviations are used in this manuscript:
GPGenetic programming
NLPNatural language processing
MLMachine learning
NLTKNatural Language Toolkit
MSEMean squared error
RMSERoot mean squared error
ANOVAAnalysis of variance
HSDHonestly significant differences

References

  1. Fry, E.B. Elementary Reading Instruction; McGraw-Hill: New York, NY, USA, 1977. [Google Scholar]
  2. North, K.; Zampieri, M.; Shardlow, M. Lexical Complexity Prediction: An Overview. ACM Comput. Surv. 2023, 55, 179. [Google Scholar] [CrossRef]
  3. Benjamin, R.G. Reconstructing Readability: Recent Developments and Recommendations in the Analysis of Text Difficulty. Educ. Psychol. Rev. 2012, 24, 63–88. [Google Scholar] [CrossRef]
  4. Alghamdi, E.A.; Gruba, P.; Velloso, E. The Relative Contribution of Language Complexity to Second Language Video Lectures Difficulty Assessment. Mod. Lang. J. 2022, 106, 393–410. [Google Scholar] [CrossRef]
  5. Kaundinya, T.; El-Behaedi, S.; Choi, J.N. Readability of Online Patient Education Materials for Graft-Versus-Host Disease. J. Cancer Educ. 2023, 38, 1363–1366. [Google Scholar] [CrossRef]
  6. Vajjala, S. Trends, Limitations and Open Challenges in Automatic Readability Assessment Research. arXiv 2022, arXiv:2105.00973. [Google Scholar] [CrossRef]
  7. Imperial, J.M. BERT Embeddings for Automatic Readability Assessment. arXiv 2021, arXiv:2106.07935. [Google Scholar] [CrossRef]
  8. Filighera, A.; Steuer, T.; Rensing, C. Automatic Text Difficulty Estimation Using Embeddings and Neural Networks. In Transforming Learning with Meaningful Technologies, Proceedings of the 14th European Conference on Technology Enhanced Learning Delft, The Netherlands, 16–19 September 2019; Scheffel, M., Broisin, J., Pammer-Schindler, V., Ioannou, A., Schneider, J., Eds.; Springer: Cham, Switzerland, 2019; pp. 335–348. [Google Scholar]
  9. Jiang, Z.; Gu, Q.; Yin, Y.; Chen, D. Enriching Word Embeddings with Domain Knowledge for Readability Assessment. In Proceedings of the 27th International Conference on Computational Linguistics, Santa Fe, NM, USA, 20–26 August 2018; pp. 366–378. [Google Scholar]
  10. Martinc, M.; Pollak, S.; Robnik-Šikonja, M. Supervised and Unsupervised Neural Approaches to Text Readability. Comput. Linguist. 2021, 47, 141–179. [Google Scholar] [CrossRef]
  11. Yancey, K.; Pintard, A.; Francois, T. Investigating readability of French as a foreign language with deep learning and cognitive and pedagogical features. Lingue Linguaggio Riv. Semest. 2021, 2, 229–258. [Google Scholar] [CrossRef]
  12. Nadeem, F.; Ostendorf, M. Estimating Linguistic Complexity for Science Texts. In Proceedings of the Thirteenth Workshop on Innovative Use of NLP for Building Educational Applications, New Orleans, LA, USA, 5 June 2018; Tetreault, J., Burstein, J., Kochmar, E., Leacock, C., Yannakoudakis, H., Eds.; Association for Computational Linguistics: Stroudsburg, PA, USA, 2018; pp. 45–55. [Google Scholar] [CrossRef]
  13. Lee, B.W.; Jang, Y.S.; Lee, J.H.J. Pushing on Text Readability Assessment: A Transformer Meets Handcrafted Linguistic Features. arXiv 2024, arXiv:2109.12258. [Google Scholar] [CrossRef]
  14. Alaparthi, V.S.; Pawar, A.A.; Suneera, C.M.; Prakash, J. Rating Ease of Readability using Transformers. In Proceedings of the 2022 14th International Conference on Computer and Automation Engineering (ICCAE), Brisbane, Australia, 25–27 March 2022; pp. 117–121. [Google Scholar] [CrossRef]
  15. Flesch, R.F. Art of Readable Writing; MAcmilla Publishing: Sydney, Australia, 1949. [Google Scholar]
  16. Fernández-Huerta, J. Medidas sencillas de lecturabilidad. Consigna 1959, 214, 29–32. [Google Scholar]
  17. Gutiérrez de Polini, L.E. Investigación Sobre Lectura en Venezuela. Technical report. In Primeras Jornadas de Educación Primaria; Ministerio de Educación: Caracas, Venezuela, 1972. [Google Scholar]
  18. Szigriszt-Pazos, F. Sistemas Predictivos de Legibilidad del Mensaje Escrito: Fórmula de Perspicuidad. Ph.D. Thesis, Universidad Complutense de Madrid, Facultad de Ciencias de la Información, Madrid, Spain, 1993. [Google Scholar]
  19. Barrio Cantalejo, I.M. Legibilidad y Salud: Los métodos de Medición de la Legibilidad y su Aplicación al Diseño de Folletos Educativos Sobre Salud. Ph.D. Thesis, Universidad Autónoma de Madrid, Madrid, Spain, 2007. [Google Scholar]
  20. Baquedano, M.M. Legibilidad y variabilidad de los textos. Boletín Investig. Educ. Artículo Rev. 2006, 21, 13–25. [Google Scholar]
  21. Crawford, A.N. A Spanish Language Fry-Type Readability Procedure: Elementary Level; Evaluation, Dissemination and Assessment Center, California State University: Los Angeles, CA, USA, 1984; Volume 7. [Google Scholar]
  22. Contreras, A.; García-Alonso, R.; Echenique, M.; Daye-Contreras, F. The SOL Formulas for Converting SMOG Readability Scores Between Health Education Materials Written in Spanish, English, and French. J. Health Commun. 1999, 4, 21–29. [Google Scholar] [CrossRef] [PubMed]
  23. Lucisano, P.; Piemontese, M.E. Gulpease: Una formula per la predizione della difficolta dei testi in lingua italiana. Sc. Citta 1988, 3, 57–68. [Google Scholar]
  24. El-Haj, M.; Rayson, P. OSMAN—A Novel Arabic Readability Metric. In Proceedings of the Tenth International Conference on Language Resources and Evaluation (LREC’16), Portorož, Slovenia, 23–28 May 2016; Calzolari, N., Choukri, K., Declerck, T., Goggi, S., Grobelnik, M., Maegaard, B., Mariani, J., Mazo, H., Moreno, A., Odijk, J., et al., Eds.; European Language Resources Association (ELRA): Paris, France, 2016; pp. 250–255. [Google Scholar]
  25. Pantula, M.; Kuppusamy, K.S. A Machine Learning-Based Model to Evaluate Readability and Assess Grade Level for the Web Pages. Comput. J. 2020, 65, 831–842. [Google Scholar] [CrossRef]
  26. Liu, Y.; Ji, M.; Lin, S.S.; Zhao, M.; Lyv, Z. Combining Readability Formulas and Machine Learning for Reader-oriented Evaluation of Online Health Resources. IEEE Access 2021, 9, 67610–67619. [Google Scholar] [CrossRef]
  27. López-Anguita, R.; Montejo Ráez, A.; Martínez Santiago, F.; Díaz Galiano, M.C. Legibilidad del texto, métricas de complejidad y la importancia de las palabras. Proces. Leng. Nat. 2018, 61, 101–108. [Google Scholar] [CrossRef]
  28. Uçar, S.Ş.; Aldabe, I.; Aranberri, N.; Arruarte, A. Exploring Automatic Readability Assessment for Science Documents within a Multilingual Educational Context. Int. J. Artif. Intell. Educ. 2024, 34, 1417–1459. [Google Scholar] [CrossRef]
  29. Morato, J.; Iglesias, A.; Campillo, A.; Sanchez-Cuadrado, S. Automated readability assessment for spanish e-government information. J. Inf. Syst. Eng. Manag. 2021, 6, em0137. [Google Scholar] [CrossRef]
  30. Bird, S.; Loper, E. NLTK: The Natural Language Toolkit. In Proceedings of the ACL Interactive Poster and Demonstration Sessions, Barcelona, Spain, 21–26 July 2004; pp. 214–217. [Google Scholar]
  31. Hawkins, D.M.; Yin, X. A faster algorithm for ridge regression of reduced rank data. Comput. Stat. Data Anal. 2002, 40, 253–262. [Google Scholar] [CrossRef]
  32. Koza, J.R. Genetic Programming: On the Programming of Computers by Means of Natural Selection; MIT Press: Cambridge, MA, USA, 1992. [Google Scholar]
  33. Evett, M.; Fernandez, T. Numeric mutation improves the discovery of numeric constants in genetic programming. Genet. Program. 1998, 98, 66–71. [Google Scholar]
  34. Rodriguez-Coayahuitl, L.; Morales-Reyes, A.; Escalante, H.J. TurboGP: A flexible and advanced python based GP library. arXiv 2023, arXiv:2309.00149. [Google Scholar]
  35. Stephens, T. Genetic Programming in Python with a Scikit-Learn Inspired API. Available online: https://gplearn.readthedocs.io/en/stable (accessed on 5 June 2025).
  36. Fortin, F.A.; De Rainville, F.M.; Gardner, M.A.G.; Parizeau, M.; Gagné, C. DEAP: Evolutionary algorithms made easy. J. Mach. Learn. Res. 2012, 13, 2171–2175. [Google Scholar]
  37. Shapiro, S.S.; Wilk, M.B. An Analysis of Variance Test for Normality (Complete Samples). Biometrika 1965, 52, 591–611. [Google Scholar] [CrossRef]
  38. Tukey, J.W. The Problem of Multiple Comparisons; Princeton University: Princeton, NJ, USA, 1953; Unpublished Manuscript. [Google Scholar]
  39. Devnath, L.; Kumer, S.; Nath, D.; Das, A.; Islam, R. Selection of wavelet and thresholding rule for denoising the ECG signals. Ann. Pure Appl. Math. 2015, 10, 65–73. [Google Scholar]
Figure 1. Correlation matrix heatmap of the textual features. The heatmap uses a diverging colormap: red tones represent positive correlations (up to 1), blue tones represent negative correlations (down to 1 ), and white indicates no correlation (0). Deeper color intensity reflects stronger correlation values.
Applsci 15 07259 g001
Figure 2. The fittest individual produced by Algorithm 1.
Applsci 15 07259 g002
Figure 3. Familywise error rate by using Tukey’s HSD test accross elementary grade levels. Color intensity reflects the magnitude of the error rate.
Applsci 15 07259 g003
Figure 4. Boxplots showing the distribution of readability levels generated by each readability index.
Applsci 15 07259 g004
Figure 5. Values of the metric Δ p , which quantifies the separability of elementary grade levels based on the statistical significance of post hoc comparisons using Tukey’s HSD test across educational grades.
Applsci 15 07259 g005
Table 1. Readability levels based on the scales defined by traditional readability formulas developed for the Spanish language.
Fernández-Huerta and μ Gutiérrez de Polini
(6th Grade)
Szigriszt-PazosInfleszReadability Levels
91–100 (4th grade)>7086–10080–100Very easy
81–90 (5th)61–7076–8565–80Easy
71–80 (6th)51–6066–75 Relatively easy
61–70 (7th to 8th)41–5051–6555–65Standard
51–60 (9th to 10th)34–4036–50 Relatively difficult
31–50 (11th to 12th)21–3316–3540–55Difficult
0–30 (College)≤200–150–40Very difficult
Table 2. Corpus characterization.
Grade1st2nd3th4th5th6th
Avg. number of words83.37205.68226.94302.28295.37299.63
Avg. number of sentences8.8319.5221.4918.9620.7119.83
Avg. number of words per sentence9.4111.0112.5217.8014.6315.51
Avg. number of syllables per word1.761.781.801.801.771.81
Avg. number of letters per word4.354.414.474.474.424.50
Table 3. Adapted readability levels based on the point-based scale proposed in this work.
Readability ScaleMexican Elementary Grade LevelsReadability Levels
1001st gradeVery easy
802nd gradeEasy
603rd gradeRelatively easy
404th gradeStandard
205th gradeRelatively difficult
06th gradeDifficult
<07th grade or higherVery difficult
Table 4. Configuration settings for the proposed GP algorithm.
Population size (N)5000
Number of generations (G)50
Maximum allowed tree depth2
Selection methodBinary tournament
Protected crossover rate ( p c )0.30
Protected mutation rate ( p m )0.30
Protected numeric mutation rate ( p n )0.40
Primitives + , , × , ÷ , min , max , mean
Constants range[−1, 1]
Table 5. Performance metrics for readability formulas. Best values are highlighted in green.
FormulaMSERMSE R 2
Fernández-Huerta516.6022.73−0.771
Gutiérrez-Polini1095.0433.090.061
Szigriszt-Pazos452.0821.26−0.550
μ 949.8530.82−2.257
Linear-MX959.3530.970.178
GP-MX958.3930.960.179
Flesch5151.2771.77−16.662
Gulpease2029.1945.05−5.957
Osman2040.0045.17−5.994
Disclaimer/Publisher’s Note: The statements, opinions and data contained in all publications are solely those of the individual author(s) and contributor(s) and not of MDPI and/or the editor(s). MDPI and/or the editor(s) disclaim responsibility for any injury to people or property resulting from any ideas, methods, instructions or products referred to in the content.

