Abstract
This paper presents a novel framework for integrating Building Information Modeling (BIM), Lean Construction tools, and Emerging Technologies to optimize construction project management. The framework categorizes these elements across four phases: Plan, Design, Construction, and Operation in construction projects. Each phase identifies specific intersections and synergies among the three domains to enhance functionality, collaboration, and value delivery. Integration is built upon core principles such as functionality alignment, process efficiency, and lifecycle optimization. This study also highlights Key Performance Indicators (KPIs) to evaluate the framework’s effectiveness in real-world applications and addresses limitations to guide future research. The framework was developed and validated using the Design Science Research Methodology (DSRM). The proposed approach offers a transformative pathway for addressing inefficiencies, reducing waste, and maximizing project outcomes in modern construction.
1. Introduction
The construction industry is a key driver of economic growth worldwide, contributing significantly to infrastructure development, job creation, and technological advancements. However, despite its crucial role, the sector continues to face persistent challenges, including cost overruns, project delays, inefficiencies, and poor coordination among stakeholders [1,2]. Numerous studies and industry reports highlight that a significant proportion of construction projects face budget overruns and schedule delays, primarily due to fragmented workflows, inefficient resource allocation, and poor decision-making processes [3]. These issues are compounded by the complexity of modern construction projects, which require better coordination, integration of digital tools, and real-time performance monitoring, and management of resources to achieve better project outcomes [4]. Addressing these challenges requires the strategic integration of Lean Construction, Building Information Modeling (BIM), and Emerging Technologies, which have become pivotal methodologies for optimizing construction workflows. Lean Construction emphasizes eliminating waste, streamlining workflows, and improving efficiency through systematic planning and continuous improvement strategies [5], while BIM facilitates better collaboration by providing a centralized platform for data sharing, visualization, and lifecycle management across project stakeholders [6]. Emerging Technologies such as Artificial Intelligence (AI), Internet of Things (IoT), construction robotics, and digital technologies further enhance these processes by enabling automation, real-time monitoring, and secure data management [7]. Building upon an extensive literature review conducted by the authors [8], this study identifies critical synergies between these methodologies.
A significant gap remains in their holistic integration within construction project management frameworks. Existing frameworks focus on Lean Construction with BIM alone but lack Emerging Technologies capabilities [9]. Additionally, studies integrating Emerging Technologies often do so in isolation without a structured approach that aligns them with BIM and Lean Construction in a coherent lifecycle framework. So, the review [8] revealed gaps in existing frameworks, particularly in integrating Lean Construction and Emerging Technologies with BIM to address the industry’s pressing challenges. This research addresses this gap by proposing a comprehensive framework that systematically integrates Lean Construction, BIM, and Emerging Technologies across the four key lifecycle phases of construction projects—the Plan Phase, which focuses on early-stage decision making, feasibility assessment, and cost estimation; Design Phase; Construction Phase; and Operation Phase, which facilitates predictive maintenance, space utilization, and asset management. The framework is evaluated using Key Performance Indicators (KPIs) such as cost efficiency, time savings, productivity, and stakeholder satisfaction, ensuring a holistic understanding of its impact.
To develop and validate the proposed framework, the study follows the Design Science Research Methodology (DSRM), a widely accepted approach for designing and evaluating innovative solutions (artifacts) in complex environments [10]. The DSRM process comprises three steps as follows: (i) designing and developing the framework; (ii) proposing the framework; and (iii) evaluation.
This study offers a twofold contribution as follows: theoretically, it advances the construction management literature by establishing a unified framework that bridges the siloed application of Lean Construction, BIM, and Emerging Technologies, a gap noted in previous studies. Practically, it provides industry professionals with a scalable and validated tool to enhance project management efficiency, reduce waste, and improve coordination throughout the construction lifecycle. The framework’s empirical validation using expert input ensures its relevance and applicability to current industry challenges.
The remainder of this paper is structured as follows: Section 2 presents the research methodology, detailing the DSRM approach used in designing and evaluating the framework. Section 3 provides a comprehensive literature review on Lean Construction, BIM, and Emerging Technologies, identifying their individual and collective contributions and Key Performance Indicators. Section 4 introduces the proposed framework, explaining its core components and their integration across construction lifecycle phases. Section 5 describes the evaluation process, including expert validation and their insights. Finally, Section 6 concludes with the findings, limitations, and future research directions and the study’s contributions to industry and academia.
Key Contributions of This Study
- Proposes a novel, integrative framework combining Lean Construction, BIM, and Emerging Technologies.
- Structures integration across the full construction lifecycle (Plan, Design, Construction, and Operation).
- Validated through expert review with high agreement scores across SEQUAL dimensions.
- Provides a theoretically grounded basis for improving KPIs such as cost efficiency, stakeholder collaboration, and process automation through the structured integration of Lean, BIM, and Emerging Technologies.
2. Materials and Methods
The framework was developed using the Design Science Research Methodology (DSRM) [10], a systematic approach for designing and evaluating solutions in Information Systems (IS) research [11]. DSRM involves the following three main steps: (i) design and development; (ii) proposal; and (iii) evaluation, ensuring consistency with the existing literature and facilitating artifact acceptance.
Previous studies have demonstrated DSRM’s effectiveness in construction contexts. One study [12] highlighted its structured approach to problem solving in civil engineering, enhancing project efficiency and productivity. Another integrated Agile Project Management, Design Thinking, and Lean Start-up with DSRM for Lean Construction research, emphasizing iterative processes and improving experiment validity [13]. Additionally, another study [14] utilized DSRM to explore 3D printing technology in formwork, outlining key steps such as problem identification, artifact creation, and evaluation. In this study, the framework development began with a literature review [8] identifying relevant Lean Construction tools, BIM uses, and Emerging Technologies aligned to lifecycle phases. The framework was then proposed by integrating these elements systematically, aiming to improve efficiency, reduce waste, and enhance collaboration, aligned with industry KPIs such as cost efficiency, time savings, and stakeholder satisfaction. Finally, expert evaluations assessed the framework’s practicality and effectiveness, leveraging their extensive experience in construction management, BIM, Lean methodologies, and Emerging Technologies [15]. Figure 1 illustrates the conceptual framework (DSRM) developed in this study.
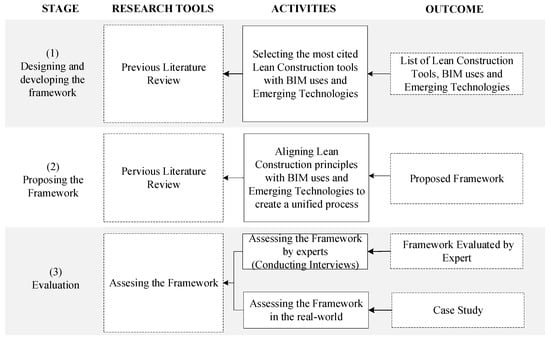
Figure 1.
Research method (DSRM).
3. Literature Review
3.1. Lean Construction and BIM Interaction
This section synthesizes prior research on the interaction between Lean Construction and Building Information Modeling (BIM), highlighting their complementary roles in improving construction efficiency and process integration. The insights presented here serve to complete and extend the authors’ previous study on the systematic literature, which identified key tools and functions enabling this integration and informed the conceptual development of the proposed framework.
Existing studies emphasize the independent benefits of Lean Construction, BIM, and Emerging Technologies [7,16,17]. BIM integration with Lean Construction is well-established, particularly BIM’s role as a digital enabler. The study in [18] demonstrates that BIM enhances waste reduction, logistics, scheduling, cost management, and real-time tracking when combined with Lean tools like Last Planner System (LPS), Target Value Design (TVD), Kanban, and Just-in-Time (JIT) [19,20]. This research introduced BeaM!, a BIM-integrated Lean production system that improved workflow reliability and reduced variability. A BeaM! case study confirmed significant improvements in task coordination and efficiency. However, the study mainly covers the Construction phase, neglecting full lifecycle integration (Plan–Design–Construction–Operation) and excluding Emerging Technologies, highlighting the need for a more comprehensive framework. Table 1 summarizes the key findings of the study [18]:

Table 1.
Key summary of the interactions and findings of [18].
Another study [22], reinforces BIM and Lean Construction integration, highlighting BIM’s role in enhancing Lean principles through improved workflow coordination, waste reduction, and optimized scheduling. It identifies key Lean methodologies, Value Stream Mapping (VSM), Target Value Design (TVD), Last Planner System (LPS), and Kanban, which benefit from BIM’s real-time visualization and automated tracking. Notable cases include the Lower Manhattan Construction Command Center (LMCCC) in the USA, where BIM-driven 4D scheduling improved coordination, reduced rework, and mitigated risks; the Yas Island Hotel project, located in the United Arab Emirates, demonstrating BIM’s effectiveness in prefabrication planning and scheduling; and the KAUST Solar Chimney project located in Saudi Arabia, showcasing construction sequencing and work detailing improvements. Additionally, the CCJ Precast Project located in Brazil, utilized BIM automation to reduce processing time by 80%. Despite these strengths, the study mainly emphasizes BIM’s visualization capabilities, lacking a structured integration with Emerging Technologies. Table 2 summarizes the findings of the study in [22].
Table 2.
Key summary of the interactions and findings of [22].
Reference [23] emphasizes the synergy between Lean Construction and BIM, demonstrating enhanced waste reduction, efficiency, and decision making. BIM supports clash detection to minimize rework and waste, aligning with Lean’s Just-In-Time (JIT) for optimized material procurement. Collaboration improves through BIM’s Common Data Environment (CDE), integrated with Lean’s Last Planner System (LPS) for reliable scheduling. Workflow optimization is achieved via 4D BIM visualizations complementing Lean pull planning techniques. For quality control, BIM integrates real-time analysis with Lean’s PDCA cycle, while Lean’s Target Value Design (TVD) closely aligns with BIM cost estimation tools. However, the study mainly offers theoretical models without empirical project validation and lacks integration with emerging technologies like AI, IoT, and Blockchain. Table 3 summarizes the findings.
Table 3.
Key summary of the interactions and findings of [23].
The study in [24] examines BIM and Lean Construction synergies, highlighting enhanced efficiency, waste reduction, and optimized decision making. It emphasizes benefits to Lean tools, Value Stream Mapping (VSM), Last Planner System (LPS), and Target Value Design (TVD), from BIM’s real-time visualization and digital tracking. BIM supports waste reduction via clash detection and prefabrication aligned with Lean’s Just-In-Time (JIT). Integration with a Common Data Environment (CDE) strengthens collaboration, providing stakeholders real-time updates. Automated quality control through BIM simulations and IoT monitoring aligns with Lean’s Kaizen and PDCA cycles. However, the study mainly addresses BIM as a Lean enabler during design and construction phases, offering limited insights into post-construction operations. Additionally, detailed strategies for implementing AI, IoT, and Digital Twins are lacking, emphasizing the need for a comprehensive BIM–Lean–Emerging Technologies lifecycle framework. Table 4 summarizes these findings.
Table 4.
Key summary of the interactions and findings of [24].
Study [21] investigates Lean Construction and BIM integration, aiming to enhance workflow efficiency, waste reduction, and collaboration in the design phase. It highlights Lean tools, Last Planner System (LPS), Target Value Design (TVD), Set-Based Design (SBD), and Choosing by Advantages (CBA), which benefit from BIM integration for improved decision making. The paper emphasizes Integrated Project Delivery (IPD) and Big Room collaboration for effective communication among stakeholders, and it discusses IoT and Digital Twins for performance monitoring, though it lacks comprehensive coverage of automation and AI-driven processes. Despite validating Lean–BIM synergies in planning and coordination, the study’s scope is limited to the design phase, without the exploration of lifecycle-wide integration or the inclusion of Emerging Technologies. It also notes challenges with software interoperability and a shortage of real-world case validations. Table 5 summarizes the study’s key findings.
Table 5.
Key summary of the interactions and findings of [21].
A study of the state-of-the-art review [25] on BIM and Lean Construction interactions highlights BIM as a key enabler of Lean principles, enhancing workflow efficiency, waste reduction, and process transparency. The study emphasizes the use of Last Planner System (LPS), Value Stream Mapping (VSM), and Pull Planning to integrate Lean methodologies within BIM-based design and construction workflows. While BIM significantly improves collaboration through Integrated Project Delivery (IPD), Common Data Environment (CDE), and clash detection, the research lacks automation strategies, AI-driven decision making, Blockchain applications, and emerging technologies, all crucial for next-generation construction management. Table 6 summarizes the study’s key findings.
Table 6.
Key summary of the interactions and findings of [25].
Reviewed studies on Lean Construction and BIM integration identify critical gaps justifying a comprehensive, technology-enhanced Lean–BIM framework. Most existing research emphasizes the design and early construction phases, overlooking execution, logistics, and post-construction operations. While BIM effectively enables Lean methods for workflow optimization, waste reduction, and collaboration, standardized full lifecycle integration remains lacking. Additionally, studies frequently omit Emerging Technologies, and interoperability issues between BIM and Lean tools present practical challenges. This paper addresses these gaps by proposing a unified framework integrating Lean Construction, BIM, and Emerging Technologies across the entire project lifecycle.
3.2. Selected Lean Construction Tools
Lean Construction principles focus on minimizing waste and maximizing value throughout the project lifecycle [26]. The tools selected for this framework were identified through an extensive literature review and tailored to address the specific challenges in each phase of construction projects [8], and based on their functionalities in the construction process, they aligned with core management principles [27]. In the Plan and Design phases, tools such as Value Stream Mapping (VSM) and Target Value Design (TVD) are utilized to enhance early-stage efficiency. VSM offers a visual representation of processes, helping to identify non-value-adding activities [28], while TVD promotes cost alignment with client priorities through early stakeholder engagement [29]. The PDCA (Plan–Do–Check–Act) facilitates iterative improvements and quality control in both planning and operational phases [30], and Kaizen drives continuous improvement in the Design and Operation phases, fostering iterative refinements in workflows and processes. This emphasizes the importance of standardizing processes to enable the effective implementation of the PDCA cycle [31].
While PDCA, Kaizen, and LPS all support continuous improvement and control, their application within the framework is differentiated by scope and lifecycle phase. PDCA functions as a strategic cycle applied during the planning and operational stages. Kaizen acts as a continuous improvement philosophy embedded across stages, especially in design and operation. In contrast, LPS is a tactical tool focused on short-term planning. This phase-based distinction ensures that each tool aligns with its intended management function.
Total Quality Management (TQM) reinforces quality assurance across disciplines, embedding responsibility for continuous enhancement at all organizational levels [32]. Visual Management (VM) is applied during the Design phase to strengthen transparency and collaboration. By using graphical communication tools and real-time data visualization, VM facilitates shared understanding and early issue detection [33]. In the Construction phase, tools such as Takt Planning, Just-In-Time (JIT), and Kanban help optimize workflow pacing, material delivery, and resource allocation. Takt Planning ensures consistent production rhythms [34], JIT aligns deliveries with actual site needs to minimize waste [35], and Kanban supports task tracking and prioritization [36]. The 5S Methodology enhances workplace organization and safety by instilling structured site management practices [37]. Finally, the Last Planner System (LPS) is incorporated as a central planning tool across phases, particularly to reinforce short-term scheduling, team accountability, and workflow reliability [38]. These Lean Construction tools were strategically incorporated into the framework to align with the phases of Plan, Design, Construction, and Operation, ensuring holistic integration with BIM uses and Emerging Technologies.
3.3. BIM Uses
Building Information Modeling (BIM) plays a pivotal role in streamlining construction processes by enhancing collaboration, visualization, and decision making [6]. This study builds upon the BIM analysis presented in the previous literature review [8], particularly the adoption of the Penn State BIM Uses framework due to its comprehensive and structured classification of BIM applications across the construction lifecycle. The framework offers a standardized foundation for aligning BIM functionalities with project phases—Planning, Design, Construction, and Operation—ensuring interoperability and clarity in implementation strategies [39,40]. For the purposes of this research, the relevant BIM uses were selectively mapped to the framework’s life cycle phases based on their capacity to support Lean integration and technology-enabled workflows. These include functions such as capturing existing conditions (3D/7D), authoring 4D models, cost estimation (5D), performance and sustainability analysis (6D), and facility management (7D). Each BIM use is associated with one or more BIM dimensions that enhance data visualization, decision making, and coordination throughout the project lifecycle. A detailed justification and categorization of these uses and dimensions is provided in an earlier review [8].
3.4. Emerging Technologies
The technologies identified and incorporated into this framework are tailored to address specific challenges and improve efficiencies across all lifecycle phases and were selected based on the literature review conducted [8]. These include Laser Scanning, Photogrammetry, and Reality Capture, which facilitate precise documentation of existing site conditions for accurate planning, design, and verification [41,42]. Drones/UAVs (Unmanned Aerial Vehicles) enable aerial site inspections, progress tracking, and enhanced data collection for emergency management and large-scale project monitoring [43]. Artificial Intelligence (AI) and Machine Learning optimize cost estimation, predictive analytics, and data-driven decision making while automating scheduling, enhancing real-time quality control, and improving proactive project management [44,45,46,47]. AI Predictive Analytics specifically provides insights into structural performance, energy efficiency, and other critical project parameters during design and operational phases [47,48,49]. Digital Twins offer virtual replicas of physical assets for real-time monitoring, simulation, and performance optimization, enabling lifecycle management [44,45,50,51,52]. The Internet of Things (IoT) and sensors collect and transmit real-time data for maintenance monitoring, system performance evaluations, and energy management [45,46]. Big Data and Analytics analyze vast quantities of project related data to identify trends, optimize workflows, and improve decision making [51,53,54]. Geographic Information Systems (GISs) integrate spatial data with BIM to support site selection, environmental analysis, and resource planning [55]. Augmented Reality (AR), Virtual Reality (VR), and Mixed Reality (MR) enhance spatial visualization, immersive design reviews, and real-time collaboration during design and construction activities [56,57,58]. The Common Data Environment (CDE) provides a centralized platform for managing and sharing project information, ensuring all stakeholders access the latest data. Blockchain ensures secure, immutable data sharing, transparency, and collaboration across all phases while tracking sustainability metrics [47,54]. Robotics and Automation improve efficiency, precision, and safety in construction tasks, including material handling, repetitive processes, and onsite construction, with tools such as UAVs (Unmanned Aerial Vehicles) and AGVs (Automated Guided Vehicles) for transport and assembly [44,54,59,60,61]. Radio Frequency Identification (RFID) enables efficient tracking and management of materials and equipment, improving logistics and resource allocation [16,62,63]. Finally, 3D Printing/Additive Manufacturing supports on demand fabrication, reducing material waste and lead time while enabling customized construction solutions [47,54,60,64]. These Emerging Technologies complement Lean Construction tools and BIM applications, creating a cohesive and efficient framework for managing complex construction projects while addressing key industry challenges.
3.5. Key Performance Indicators (KPIs)
Key Performance Indicators (KPIs) are essential metrics for evaluating the efficiency, effectiveness, and overall success of the framework for construction projects. In this framework, the selected KPIs align with the best global practices and industry standards to ensure the integration of Lean Construction, BIM, and Emerging Technologies addresses critical project challenges. These KPIs include cost efficiency and savings, which evaluates the framework’s ability to minimize overall project costs, reduce waste, and support budget adherence [65]; time efficiency and delivery, measuring improvements in schedule reliability, reduction in delays, and on-time completion [65]; productivity and resource utilization, assessing the optimized use of labor, equipment, and materials to maximize performance [66,67]; waste reduction, which focuses on minimizing non value-adding activities and material waste [66]; quality and safety, monitoring improvements in construction quality, error prevention, and compliance with safety standards [65]; stakeholder satisfaction and collaboration, evaluating communication flow, coordination, and stakeholder engagement [67]; and process optimization and automation, which highlights advancements in automation, real-time data integration, and overall process efficiency [66,68]. To validate the effectiveness of the framework in real-world construction projects, a structured approach for measuring and assessing these KPIs is essential.
4. Integrated Framework for Construction Lifecycle Optimization
4.1. Framework Core
The framework is built on key interaction areas and core principles that ensure seamless synergy between Lean Construction, BIM, and Emerging Technologies. The integration is founded on waste reduction, process efficiency, stakeholder collaboration, continuous improvement, and value-driven decision making. The framework structures Lean–BIM and Emerging Technologies interactions across the entire project lifecycle (Plan–Design–Construction–Operation), ensuring workflow optimization, cost control, and real-time monitoring are embedded at every stage. It goes beyond traditional Lean–BIM models by addressing data interoperability, supply chain transparency, and lifecycle optimization, ensuring a scalable, technology-driven Lean–BIM methodology for enhanced project performance and sustainability [69]. The following Table 7 illustrates the framework in detail.
Table 7.
Framework integrating Lean Construction, BIM, and Emerging Technologies.
4.2. Application Recommendations of the Framework
To demonstrate the practical implementation of the proposed framework, a comprehensive set of application recommendations has been developed, covering the following four key phases of the construction lifecycle: Plan, Design, Construction, and Operation. While the full range of applications is provided in Appendix A.1, this section presents one representative example to illustrate how the integration of BIM, Lean Construction tools, and Emerging Technologies can be applied in practice.
4.2.1. Plan Phase
This subsection presents the recommended applications of the proposed framework for the plan phase. Below is one example of the first row of the framework that is shown in Table 7, and the rest are provided in Appendix A.1.
VSM in Capturing Existing Condition
Figure 2 provides a detailed visualization of the implementation process of the first step in the plan phase, which is using VSM in capturing existing conditions.

Figure 2.
Example for the application of VSM in capturing existing conditions and using different technologies (Laser Scanning, Photogrammetry, Reality Capture, and Drones/UAVs).
Figure 2.
Example for the application of VSM in capturing existing conditions and using different technologies (Laser Scanning, Photogrammetry, Reality Capture, and Drones/UAVs).
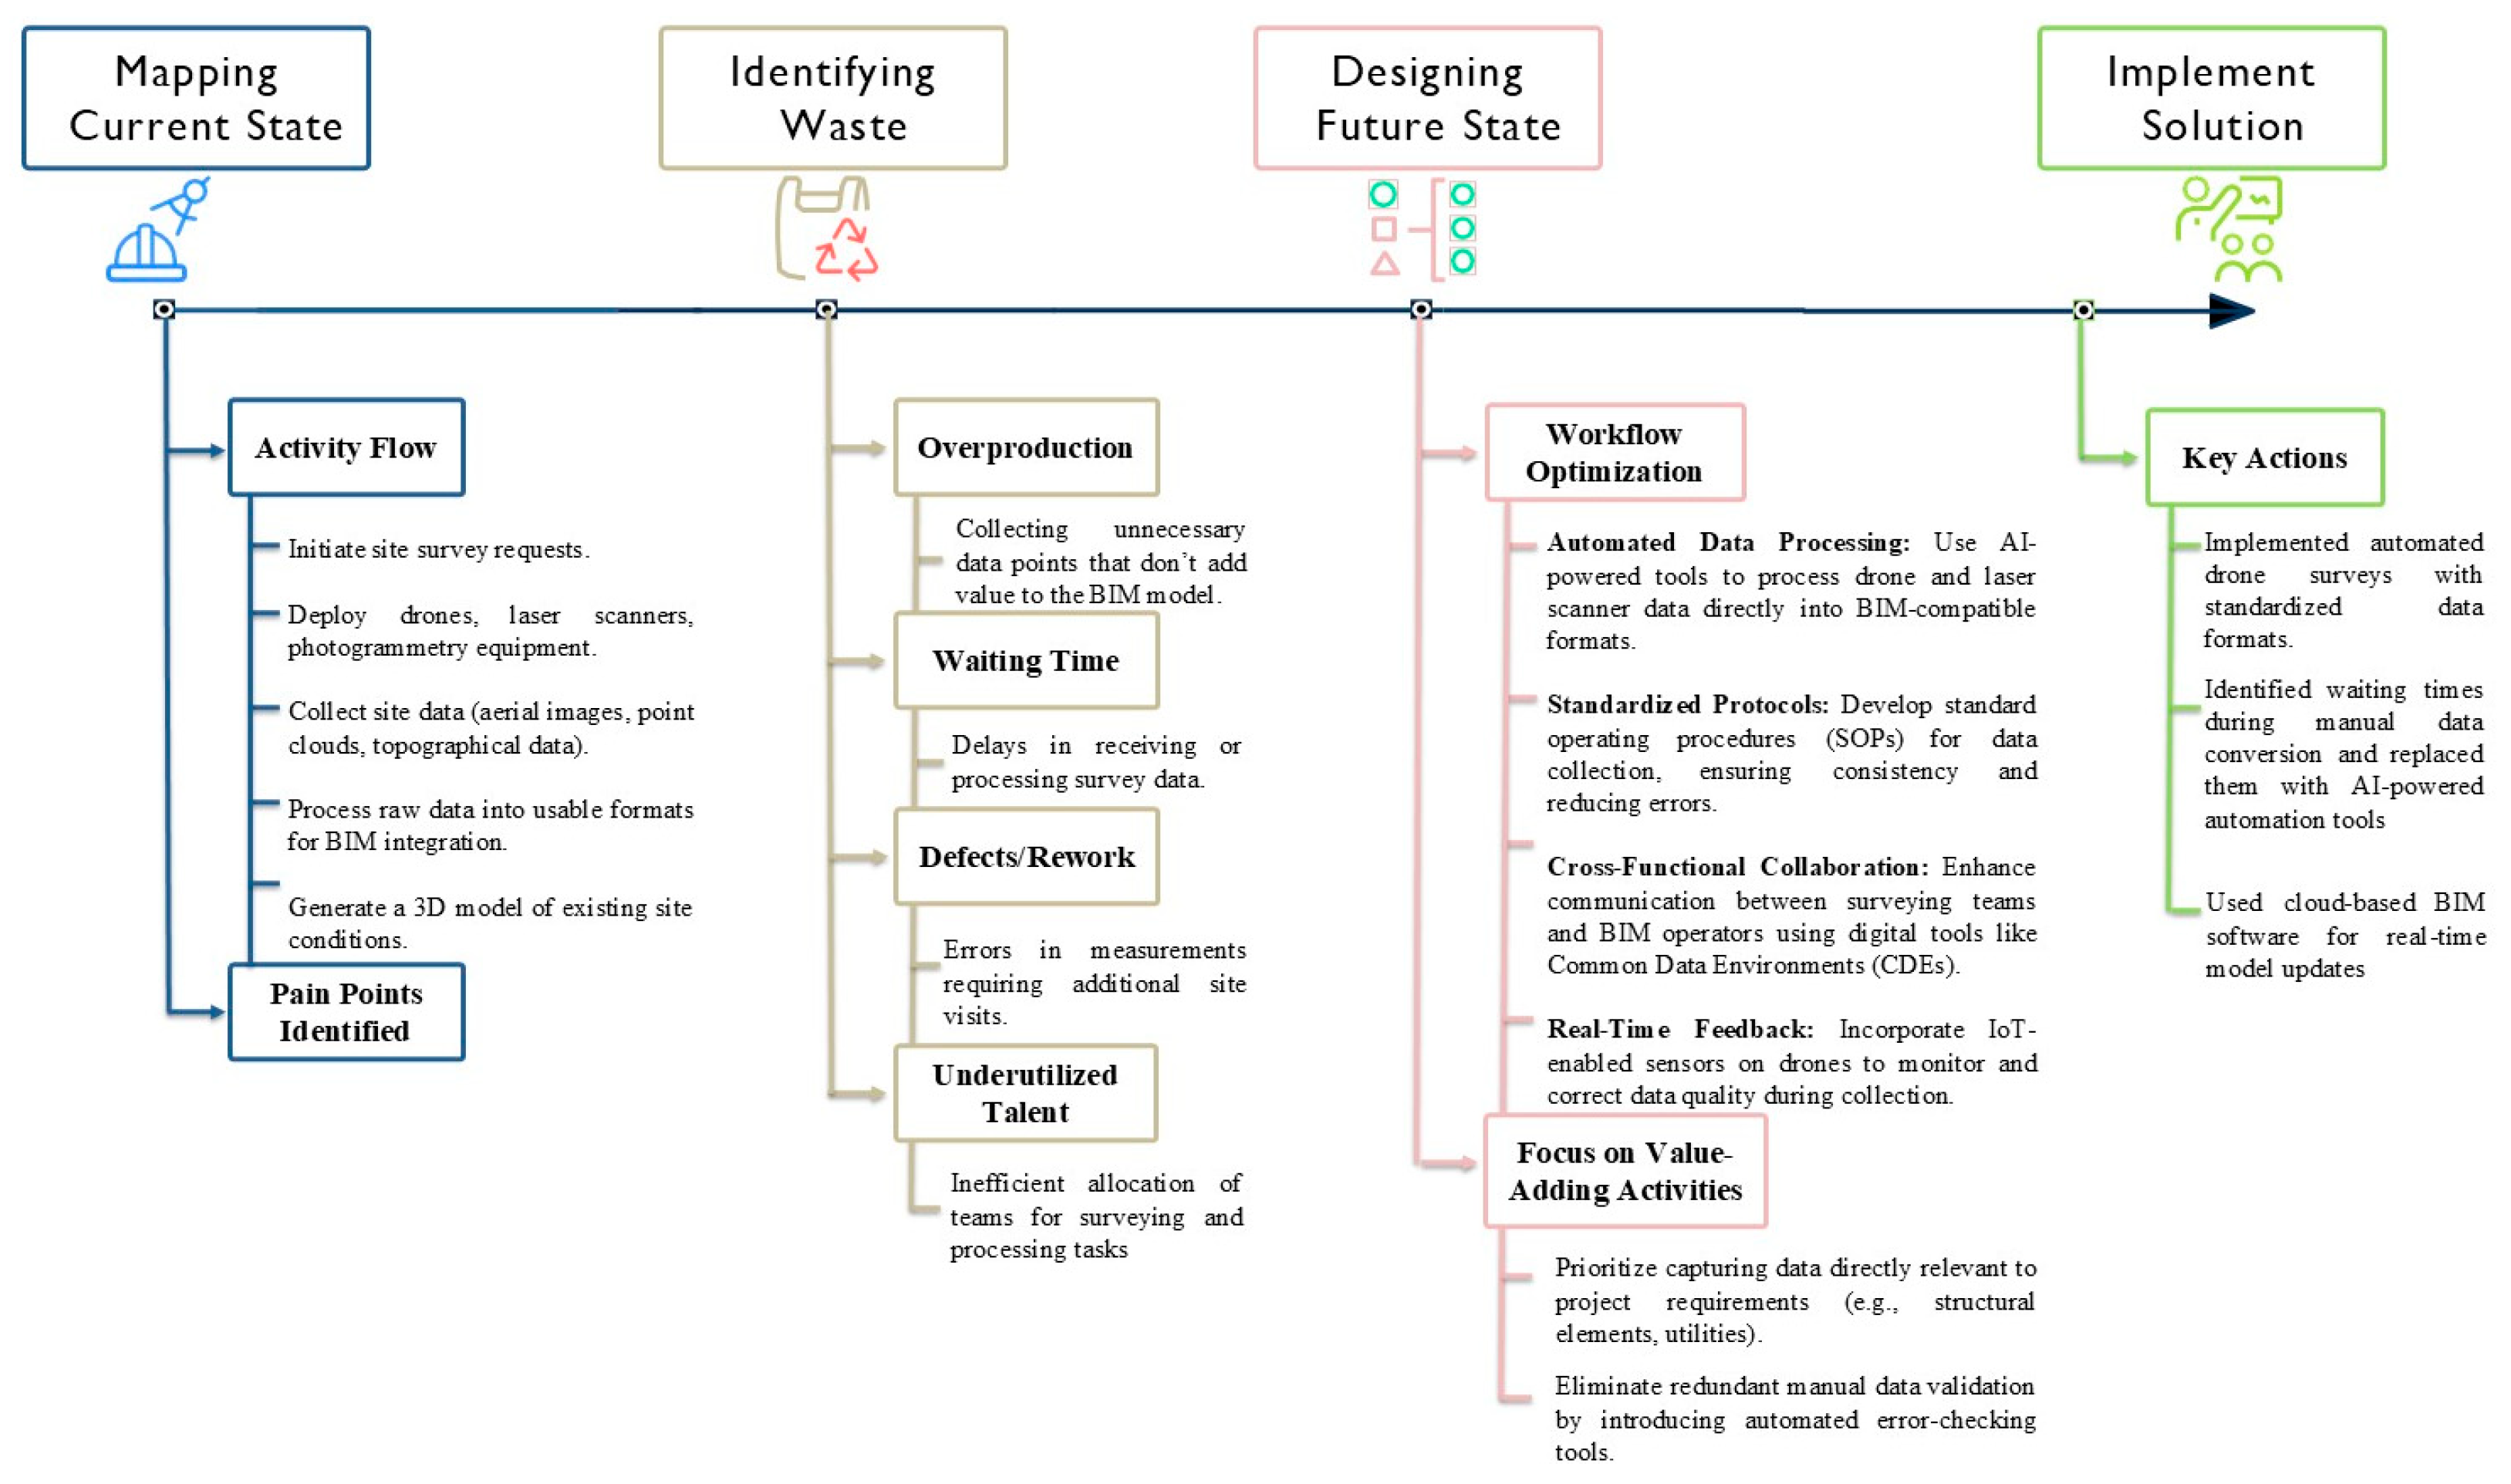
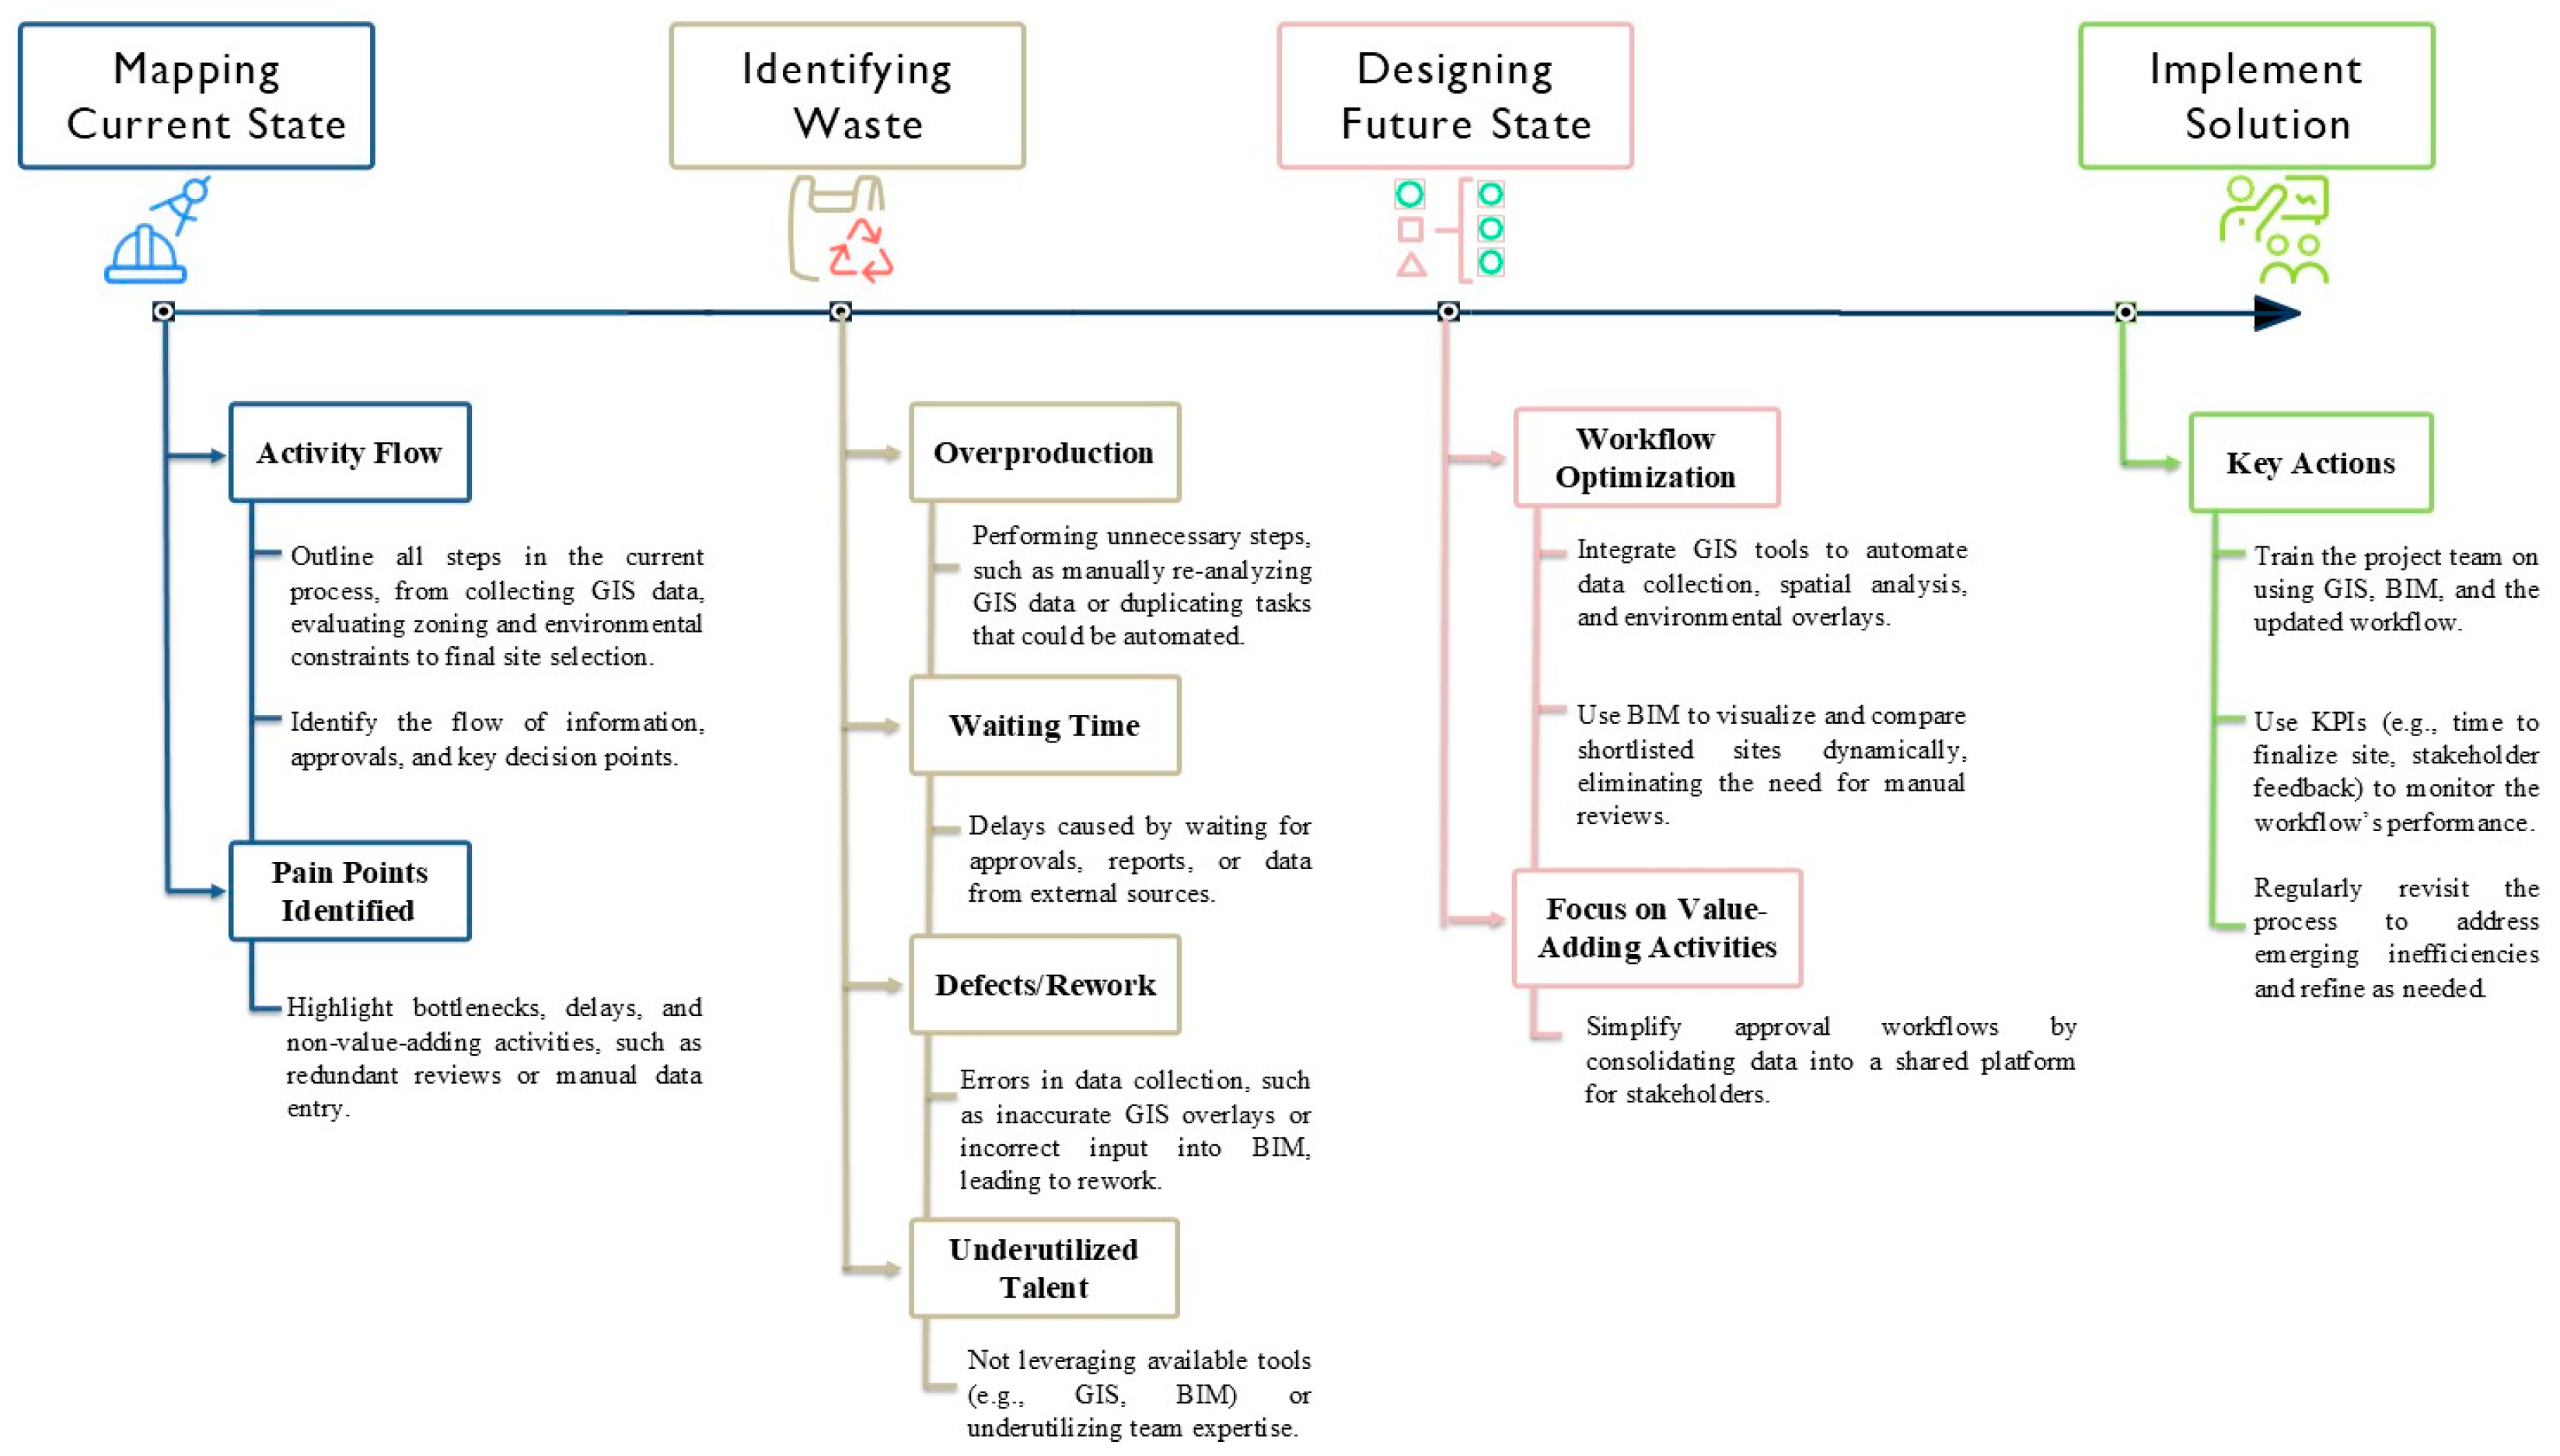
The diagram illustrates integrating Value Stream Mapping (VSM) with advanced technologies, laser scanning, photogrammetry, and drones during construction planning. VSM streamlines workflow by identifying inefficiencies, reducing redundant processes, and enhancing collaboration between data collection and BIM, resulting in reduced cycle time, improved accuracy, productivity, and cost savings [70].
The first step, Mapping the Current State, involves deploying drones, laser scanners, and photogrammetry to gather essential site data (aerial images, point clouds, and topographical details) converted into BIM-compatible 3D models. Common challenges include manual data validation, delays in processing data, and coordination inefficiencies [71]. The second step, Identifying Waste, categorizes workflow inefficiencies such as overproduction (excessive data), waiting times (processing delays), defects and rework (measurement errors), and underutilized talent (poor team allocation) [72].
In the third step, Designing the Future State, workflow optimizations include automating data processing using AI tools, establishing standardized protocols (SOPs) for consistent data collection, promoting cross-functional collaboration through Common Data Environments (CDEs) and implementing IoT-enabled drones for real-time quality control. Focus is placed on collecting project-critical data and automating error checks.
The final step, Implementation and Monitoring, involves training programs on VSM and technologies, real-time dashboards to monitor progress, and iterative feedback loops to continuously refine processes.
Direct impacts on KPIs include cost savings via reduced redundancies; improved time efficiency through automation; enhanced productivity by streamlined workflows; waste reduction by eliminating unnecessary data collection; improved quality and safety from standardized protocols; higher stakeholder satisfaction due to transparency; and process optimization leveraging AI and IoT, minimizing manual interventions.
5. Evaluation
5.1. Framework Assessment Approaches
A structured expert evaluation approach utilizing the Delphi Method [73] was adopted to assess the validity, feasibility, and applicability of the proposed framework. This systematic, iterative method collects structured feedback from expert panels, ensuring the integration of Lean Construction, BIM, and Emerging Technologies aligns with the industry’s best practices. The evaluation process includes the following:
- Expert selection: Diverse experts in Lean Construction, BIM, and Emerging Technologies, with a minimum of 10 years’ experience.
- Questionnaire development: A structured questionnaire based on the SEQUAL framework [74,75].
- First round assessment: Experts review the framework and provide quantitative (Likert-scale) and qualitative feedback.
- Second round refinement: Feedback is analyzed, and the framework is adjusted accordingly.
- Final validation round: Experts reassess the revised framework for validity and practicality.
Using this Delphi approach ensures the framework’s robustness, iterative refinement, and practical relevance to construction management.
5.2. Structured Expert Questionnaire
To ensure the comprehensive assessment of the proposed framework, this study adopts the Semiotic Quality Framework (SEQUAL). Originally developed to evaluate the quality of conceptual models, SEQUAL provides a structured set of dimensions for assessing how well a model or framework communicates its intended meaning to different stakeholders. It evaluates factors such as syntactic quality, semantic clarity, pragmatic usefulness, and other related dimensions, making it a suitable choice for assessing the clarity, applicability, and relevance of the proposed construction framework [74,75].
The expert evaluation is conducted through a structured questionnaire, focusing on assessing the framework based on predefined dimensions derived from the Semiotic Quality Framework (SEQUAL) used to assess the quality of the proposed framework; it provides a structured approach to evaluating the framework based on multiple quality dimensions [74,75]. The SEQUAL quality statements with seven dimensions outlined below is assessed, as presented in Table 8.
Table 8.
SEQUAL quality statements.
The questionnaire consists of 21 evaluation statements categorized under the seven key dimensions, which are presented to experts in the form of closed-ended questions. To further enrich the framework, an open-ended question (Q22) is included at the end of the survey, inviting experts to share additional feedback, suggestions, or critiques that may not have been captured in the structured items. This qualitative input aims to enhance the robustness and applicability of the framework. The participant information needed before responding to the evaluation statements, experts are asked to provide the following background information:
- Name (Optional).
- Occupation.
- Profession (Grade).
- Field of Work.
- Country of Residence.
- Years of Experience.
- Relevant Experience in Lean Construction, BIM, and Emerging Technologies.
The evaluation statements are assessed using a Likert scale as follows: 1 = Strongly Disagree; 5 = Strongly Agree. Table 9 states the questions’ statements.
Table 9.
Framework assessment statements.
Once responses are collected, a quantitative and qualitative analysis is conducted as follows:
- Non-parametric statistical analysis: (Wilcoxon signed-rank test in SPSS) will be conducted to determine statistical significance [76].
- Consensus analysis: The level of agreement across experts will be assessed to determine the framework’s acceptability [73].
- Qualitative insights: Open-ended feedback from experts will be analyzed to refine and improve the framework [73].
This structured approach ensures that the framework is rigorously evaluated, refined based on expert insights, and validated for industry-wide applicability.
5.3. Expert Assessment
An evaluation of the proposed framework was conducted through an expert review aimed at addressing questions Q1 to Q22. The panel comprised both academic and industry professionals who met the following two main eligibility criteria: over 10 years of experience in the field, and proven expertise in Lean Construction, Building Information Modeling (BIM), and Emerging Technologies. A total of 20 experts were invited to contribute to the study, of whom 12 agreed to participate. Participants were presented with the framework’s structure, components, and intended application for review and assessment with a 5-point Likert-scale questionnaire (1 = Strongly Disagree, 5 = Strongly Agree). Table 10 outlines the professional profiles of the participating experts.
Table 10.
Summary of expert participants’ profiles.
To enhance the representativeness of the results, the expert panel was purposefully selected to reflect a diverse distribution across professional roles, sectors, and geographies. Of the twelve experts, six are industry-based professionals, including directors, consultants, and Lean/BIM managers, while six are affiliated with academia, providing a balanced academic–industry perspective. The panel also reflects geographical diversity, with members from Europe (Spain, Germany, and Italy), the Middle East (Saudi Arabia), North America (USA), and South America (Chile). Professionally, the participants represent the architecture, civil engineering, construction management, and digital innovation domains, ensuring comprehensive expertise in Lean Construction, BIM, and Emerging Technologies. This multidisciplinary and multi-regional representation strengthens the external validity of the framework evaluation.
The expert panel comprised 12 professionals, a sample size consistent with Delphi studies in construction and management research, where a range between 10 and 18 participants is often sufficient to reach consensus and derive meaningful insights [77,78]. Moreover, this sample size is considered adequate for applying non-parametric tests such as the Wilcoxon signed-rank test and parametric procedures like the one-sample t-test in expert-based framework evaluations [79].
6. Results and Discussion
6.1. Reliability Analysis
To ensure the reliability of the questionnaire used to evaluate the proposed framework, a reliability analysis was conducted using Cronbach’s Alpha. As shown in Table 11, the scale, which consists of 21 questions, demonstrated acceptable internal consistency, yielding a Cronbach’s Alpha value of 0.757 [80]. This suggests that the scale is sufficiently reliable for measuring perceptions of the framework’s effectiveness.
Table 11.
Reliability statistics.
6.2. Descriptive Statistics (One-Sample Statistics)
A descriptive analysis was conducted to examine participants’ perceptions of the framework. The analysis was based on responses from 12 participants. Table 12 summarizes the one-sample statistics including the mean and standard deviation for each question.
Table 12.
Descriptive statistics.
Most items achieved a mean score above 4.00 on a 5-point Likert scale, indicating a generally favorable evaluation of the framework [81]. The highest-rated statement, “The framework serves as a solid foundation for future research”, received a perfect score of 5.00 with a standard deviation of 0.000, demonstrating unanimous agreement. Other highly rated items include the use of standardized industry terminology (M = 4.75, SD = 0.452), the integration of technologies to enhance automation (M = 4.75, SD = 0.452), and the flexibility and scalability of the framework (M = 4.67, SD = 0.492). These scores indicate strong confidence in the clarity, technological relevance, and adaptability of the proposed framework.
Conversely, two reverse-coded items addressing potential concerns about complexity and flexibility received low mean scores, suggesting that the majority of respondents did not view these aspects as problematic. Specifically, the statement “The framework is too complex to be practically implemented in real projects” scored a mean of 1.83 (SD = 0.718), while “The framework is not flexible enough to be applied across different scenarios” scored 1.75 (SD = 0.866). These items were intentionally reverse-phrased to detect negative perceptions; hence, low scores here indicate strong disagreement with the negative statements. This confirms that experts largely perceived the framework as both practically implementable and adaptable across diverse project contexts. Therefore, while the numerical values are low, their interpretation supports the framework’s strengths, not its weaknesses.
6.3. One-Sample t-Test
A one sample t-test was conducted to statistically verify whether the mean scores of each item differed significantly from a neutral test value of 3. The choice of this parametric test was justified as the data met the normality assumption [82] (Shapiro–Wilk test, p > 0.05), and the sample size (N = 12) was adequate for the central limit theorem to apply [81]. As detailed in Table 13, all items showed statistically significant deviations from neutrality (p < 0.05). Positive t-values indicate strong agreement with the statements, with the largest t-values observed in items related to standardized terminology, technology integration, and decision-making support. Notably, the negative phrasing of items regarding complexity and flexibility also yielded significant results, reaffirming that respondents did not perceive these as limitations.
Table 13.
One-sample t-test.
Although slightly lower in t-values compared to the highest-rated components, the following aspects still reflect strong agreement among respondents as follows: the framework’s effectiveness in addressing common industry challenges (t = 7.340, p = 0.000, Mean Difference = 1.417), capturing key dependencies and interactions (t = 5.745, p = 0.000, Mean Difference = 1.250), and presenting sufficient detail through diagrams and models (t = 7.091, p = 0.000, Mean Difference = 1.333). These results suggest a consistently positive perception, albeit with slightly more variation in participant responses. The 95% Confidence Intervals (CIs) for all statements do not include 0, confirming that the differences from the test value of 3 are statistically significant. Specifically, positive mean differences, reflected in the confidence intervals, with both bound above zero, reinforce the framework’s perceived strengths across various dimensions. Conversely, negative mean differences, where both CI bounds are below zero, indicate a clear rejection of concerns related to the framework’s complexity and lack of flexibility. This one-sample t-test provides strong evidence that the framework is well perceived across multiple dimensions.
6.4. Nonparametric Validation (Wilcoxon Signed-Rank Test)
The Wilcoxon signed-rank test was employed as a nonparametric alternative to validate the t-test results, addressing potential outliers or minor violations of normality. All items showed significant differences from neutrality (p < 0.05), confirming the robustness of the findings. Nonparametric tests, being particularly useful for small samples like this study, offer a conservative check on the results [79]. Table 14 summarizes the hypothesis test.
Table 14.
Hypothesis Test Summary.
Each hypothesis test in the table assesses whether a specific aspect of the framework has a median score of 3.000 (indicating a neutral rating). The decision to reject or retain the null hypothesis is based on the significance (Sig.) value. All p-values are below 0.05, demonstrating that the differences between the observed medians and the neutral value of 3.000 are statistically significant. Consequently, the null hypothesis was rejected for all items, indicating that participants rated each aspect of the framework significantly different from neutral. Given that the earlier one-sample statistics table reported mean scores predominantly above 4.000, these results collectively suggest that the framework was generally perceived positively.
6.5. Correlation Analysis (Spearman’s Rho)
Spearman’s rho correlation matrix, analyzing the relationships between various framework attributes, demonstrates internal consistency [83]. Strong positive correlations emerged between key constructs as follows: Q1 (framework clarity/documentation) and Q11 (Selected BIM, Lean Tools, and Emerging Technologies) (ρ = 0.826) highlighted that a well-structured framework directly facilitates appropriate BIM, Lean, and Emerging Technologies adoption, while Q20 (flexibility/scalability) and Q19 (automation enhancement) (ρ = 0.816) suggest that perceived scalability is closely tied to technological integration and operational efficiency. Similarly, the link between Q4 (ease of understanding) and Q15 (cross-project applicability) (ρ = 0.738) reinforced that clarity drives practical utility. A cohesive cluster of moderate correlations connected Q2 (visualization), Q5 (terminology), Q7 (workflow alignment), Q11, and Q14 (decision making), suggesting these elements collectively support framework efficacy. Notably, Q13 (collaboration) and Q12 (process optimization) correlated moderately with multiple items, emphasizing their integrative role. Overall, Spearman’s Rho analysis supports the construct validity of the framework, with clear clusters of interrelated items and a general pattern of positive associations, especially among core functional and strategic dimensions. Table 15 demonstrates the correlation analysis.
Table 15.
Spearman correlation matrix.
Overall, these results support the validity and perceived effectiveness of the proposed framework in facilitating a more integrated and efficient approach to construction process optimization through the convergence of BIM, Lean Construction, and Emerging Technologies.
6.6. Expert Feedback and Framework Refinements
In addition to the quantitative evaluation, experts provided open-ended feedback (Q22) to enhance the framework’s real-world applicability. Their insights highlighted several actionable areas for refinement. First, multiple experts stressed the need for real-world validation, recommending that future research includes case studies across various project types to assess the framework’s scalability and universality. Second, the importance of training and workforce readiness was emphasized, including the involvement of Lean-trained personnel and employee assessments to support effective framework adoption. Economic feasibility was also raised as a concern, with one expert questioning the return on investment. This led to the recommendation of integrating a cost-modeling component to evaluate the economic viability of implementing emerging technologies compared to traditional methods. Additionally, issues of standardization and regulatory alignment were noted, particularly concerning software interoperability among stakeholders and variations in regional regulations. One expert also criticized the limited vertical integration within the framework and recommended strengthening phase-specific workflows beyond horizontal BIM–Lean–Technology links. Experts unanimously stressed the importance of practicality, recommending modular implementation, cost–benefit toolkits, and real-world case studies, while affirming the framework’s theoretical robustness. These insights will guide future refinements, prioritizing pilot deployments, workforce training, and regulatory alignment to bridge the gap between theory and practice.
6.7. Influencing Factors on Framework Validity
While the framework demonstrated high expert agreement and robust statistical support, its validity is influenced by several interrelated factors. First, the expertise and background diversity of evaluators play a critical role in shaping feedback quality; professionals with industry experience may prioritize practicality, while academics may emphasize theoretical coherence. Second, project typology and scale, residential status, infrastructure, or mega-projects, can affect the relevance and adaptability of specific Lean, BIM, or Technology tools integrated within the framework. Third, regional context, including technological infrastructure, digital maturity, and regulatory requirements, impacts implementation feasibility. For instance, regions with limited digital adoption may encounter integration challenges despite the framework’s structured approach. Lastly, the stage of the project lifecycle at which the framework is applied may influence its perceived utility, with higher impact expected when adopted early (Plan or Design phases). These factors must be considered when interpreting the framework’s applicability and generalizability.
7. Conclusions
The integration of Lean Construction, Building Information Modeling (BIM), and Emerging Technologies proposed in this research provides a comprehensive approach to optimizing construction management across all lifecycle phases. This research builds directly upon a previous systematic literature review conducted by the authors, which identified the foundational tools and integration challenges related to Lean Construction, BIM, and Emerging Technologies. While the earlier study focused on mapping and analyzing the academic landscape, this paper addresses the observed gap by developing and validating a comprehensive integration framework structured across the full construction lifecycle. In doing so, it translates theoretical findings into a practical and actionable model for optimizing project delivery. By categorizing interactions clearly and illustrating synergies through a structured framework, this study clarifies how these combined methodologies enhance efficiency, reduce waste, and improve collaboration among stakeholders. Previous frameworks predominantly focused on either integrating BIM with Lean or separately exploring Emerging Technologies. In contrast, this research presents a uniquely holistic and systematically structured integration approach aligned with distinct lifecycle phases, validated through rigorous methodologies such as the Design Science Research Methodology (DSRM). This structured approach provides clear guidelines and actionable insights, enabling industry professionals to implement integrated strategies effectively and systematically. Furthermore, the framework’s division into distinct phases, each comprising specific steps, offers stakeholders valuable flexibility, allowing partial or incremental adoption based on specific project requirements or constraints. Despite its theoretical robustness and positive validation through expert consensus, certain limitations warrant consideration. Real-world applications and comprehensive empirical validation across diverse construction contexts are needed to fully assess practical effectiveness and scalability. Additionally, dependency on advanced technologies raises potential barriers related to workforce preparedness and necessary skillsets, highlighting the importance of targeted training programs and capacity-building initiatives. To address these limitations, future research should emphasize empirical validation through detailed case studies spanning various construction project types to confirm the framework’s adaptability and efficacy. Furthermore, economic feasibility studies and cost–benefit analyses are recommended to provide stakeholders with clearer insights into financial implications and facilitate informed decision making. Exploring software interoperability and standardization strategies is also crucial, ensuring seamless integration among Lean tools, BIM platforms, and Emerging Technologies, thereby overcoming the interoperability challenges highlighted by industry experts. The results of this study suggest that the developed framework has the potential to address persistent inefficiencies in construction management by promoting the early alignment of stakeholders, integration of emerging technologies, and lifecycle coordination. Expert evaluations confirmed its conceptual robustness. Although the framework has not yet been tested on site, it is structured in a way that aligns with current project delivery demands in fast-developing regions. The phase-based modular design allows flexibility and scalability across project types, particularly large-scale infrastructure and smart city initiatives. These attributes enhance the framework’s readiness for real-world piloting and contribute to ongoing efforts to improve cost control, waste reduction, and digital collaboration in construction.
Author Contributions
Conceptualization, O.A. and E.A.; methodology, O.A., E.A. and J.T.; software, O.A.; validation, O.A., E.A. and J.T.; formal analysis, O.A.; investigation, O.A.; resources, O.A.; data curation, O.A.; writing—original draft preparation, O.A.; writing—review and editing, O.A., E.A. and J.T.; visualization, O.A.; supervision, E.A. and J.T.; project administration, O.A.; funding acquisition, E.A. All authors have read and agreed to the published version of the manuscript.
Funding
This research was supported by the Vice-Rectorate for Research, Creation and Innovation (VINCI-DI) at Pontificia Universidad Católica de Valparaíso.
Institutional Review Board Statement
Ethical review and approval were waived for this study because it involved only interviews to gather the opinions of a group of experts who provided informed consent prior to participation. All measures were implemented to ensure participant anonymity and safeguard their data in compliance with the relevant policies.
Informed Consent Statement
Informed consent was obtained from all subjects involved in the study.
Data Availability Statement
The raw data supporting the conclusions of this article will be made available by the authors on request.
Conflicts of Interest
The authors declare no conflicts of interest.
Appendix A
Appendix A.1. Full Set of Application Recommendations of the Proposed Framework
This appendix presents the complete set of application recommendations developed to demonstrate the practical implementation of the proposed framework across the four key phases of the construction lifecycle, outlined as follows: Plan, Design, Construction, and Operation. These applications illustrate the integration of Lean Construction tools, Building Information Modeling (BIM), and Emerging Technologies in various scenarios. They provide a more detailed and comprehensive expansion of the representative example discussed in Section 4.2 of the main text.
Appendix A.1.1. Plan Phase
This subsection describes the framework’s applicability during the Plan phase, continuing the discussion initiated in Section 4.2.1. Each stage is elaborated sequentially according to the corresponding rows in Table 7.
TVD in Author Cost Estimation
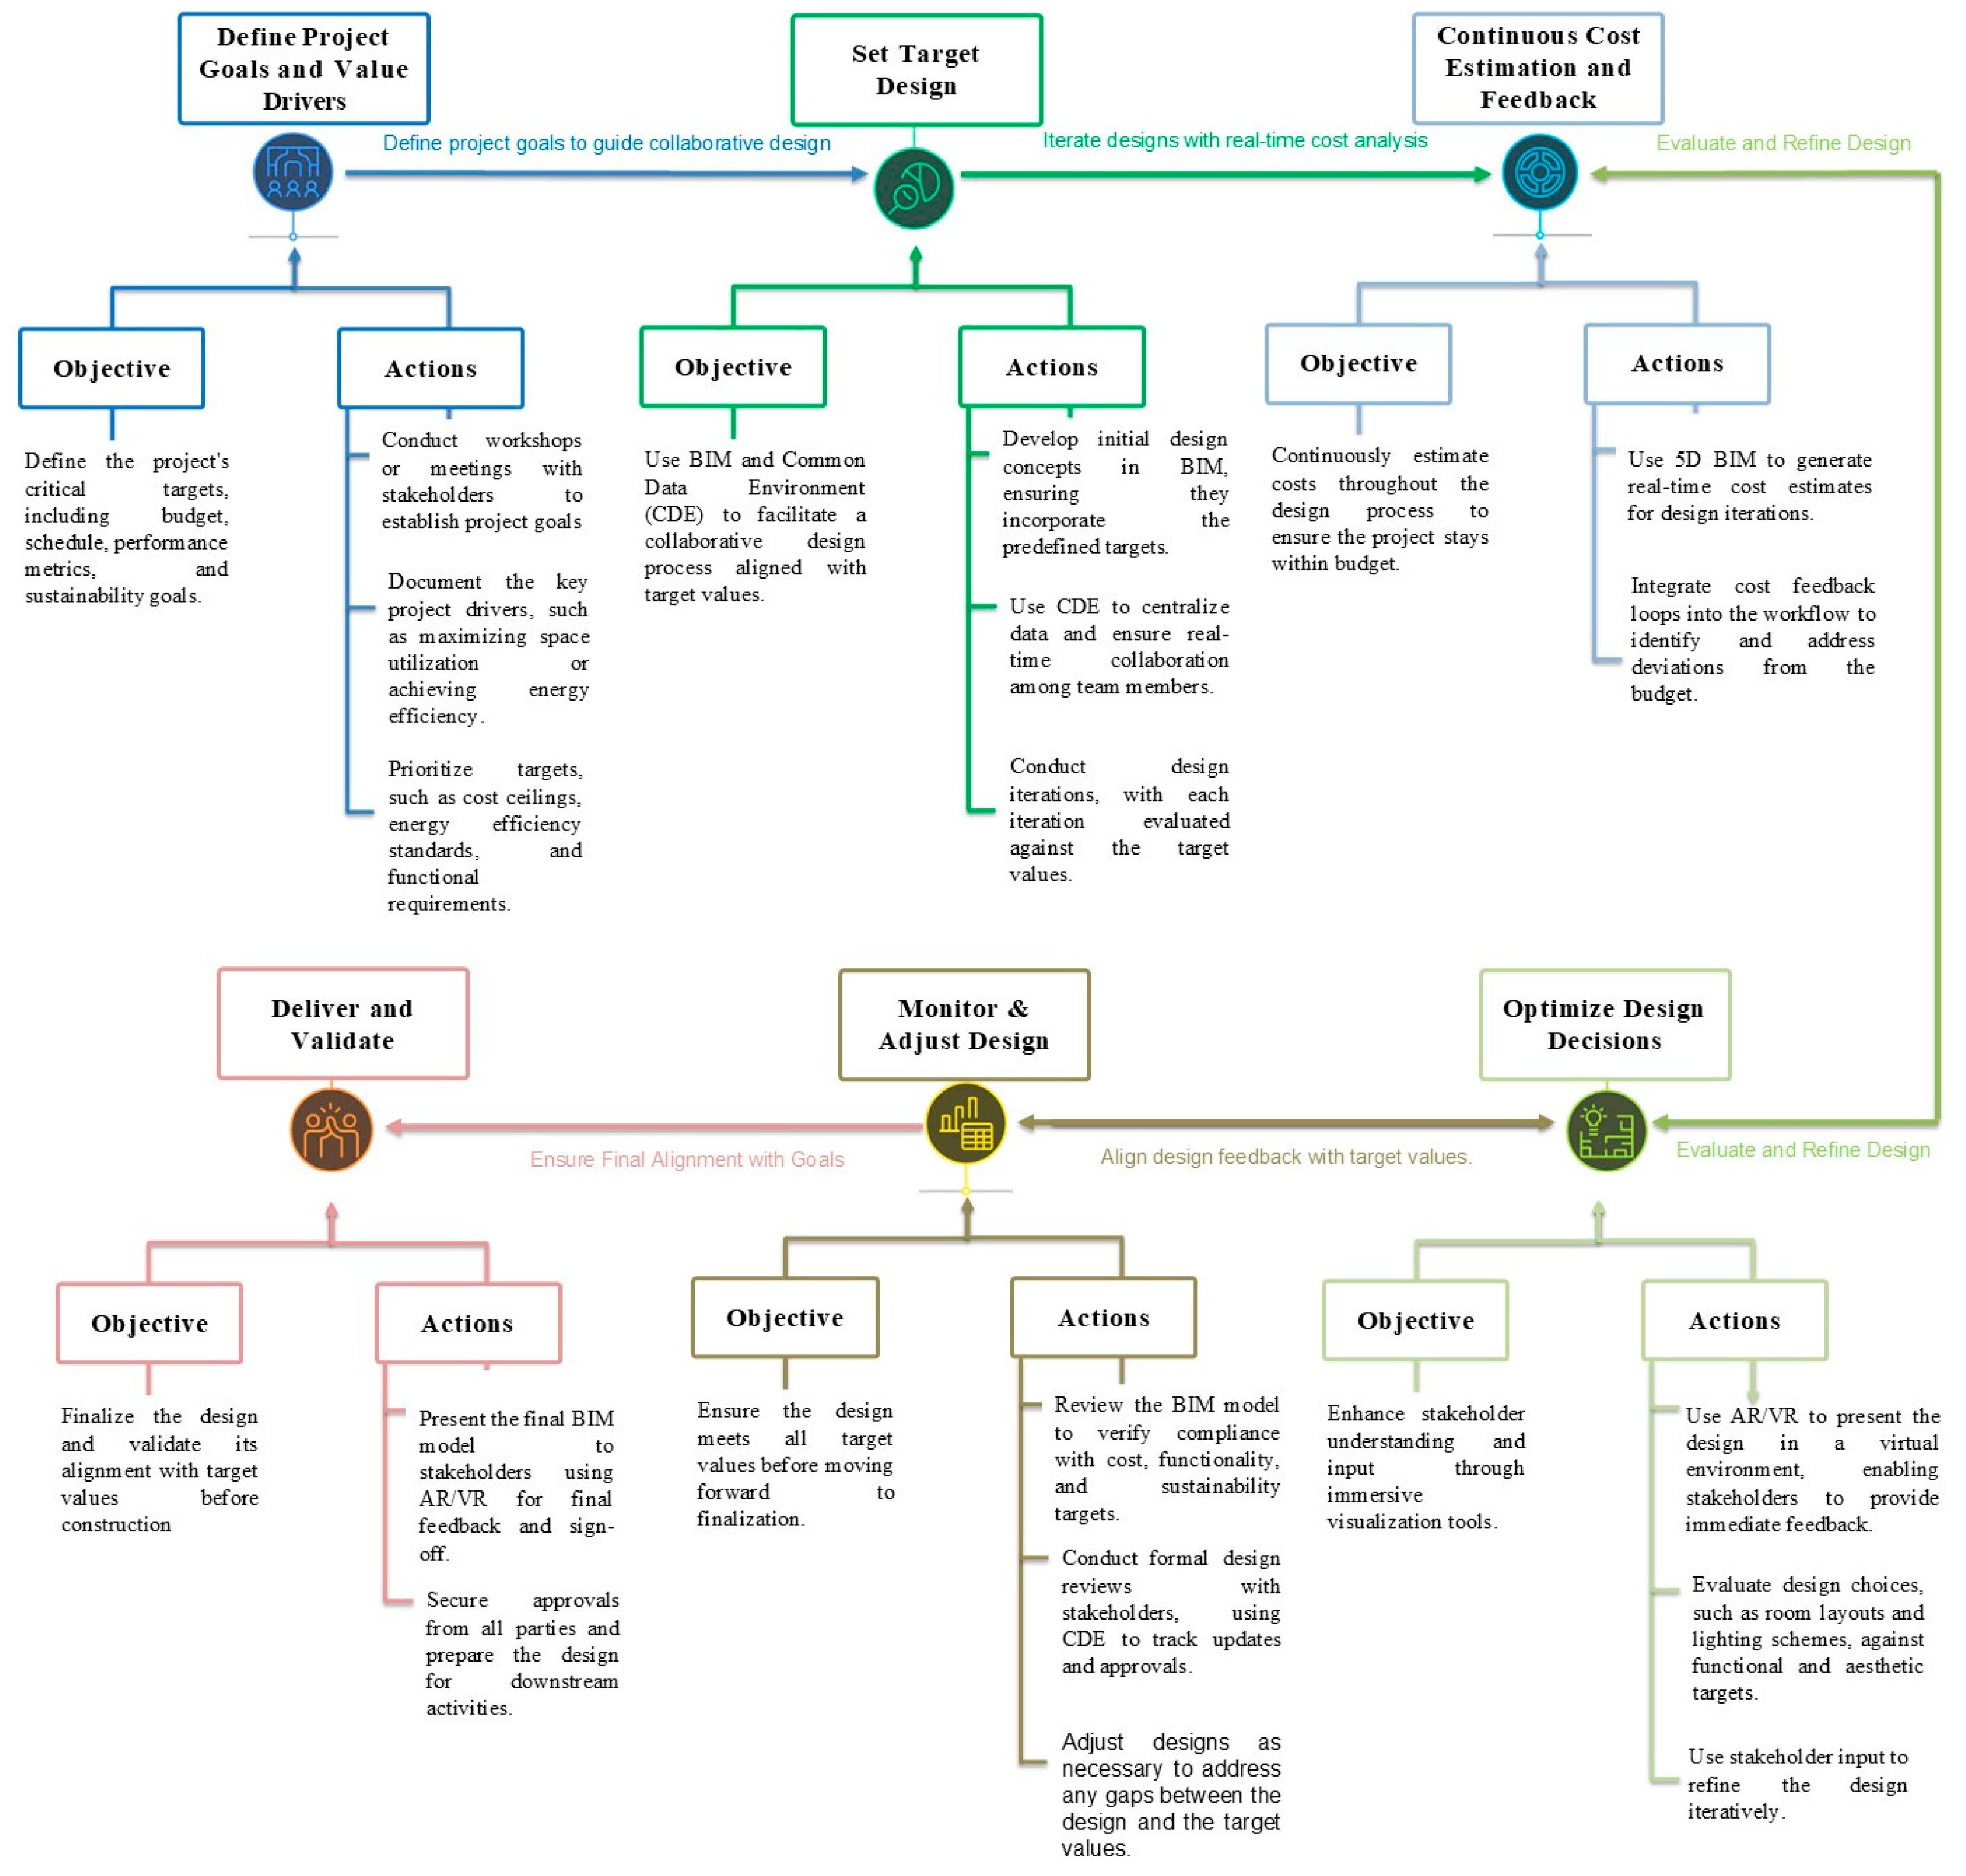
Figure A1 presents the implementation of Target Value Design (TVD), outlining a structured process to align project costs with client goals through phases such as goal definition, target costing, collaborative design, decision optimization, cost monitoring, and validation [84]. The process integrates BIM and Emerging Technologies to ensure cost efficiency, value delivery, and informed decision making. Defining Project Goals establishes client priorities (cost, sustainability, quality) through stakeholder workshops. Setting Target Costs breaks the budget into components using historical data and AI-driven predictions to align spending with value drivers. During Collaborative Design, stakeholders use BIM for real-time modeling and iterative refinement. Optimizing Design Decisions involves evaluating alternatives through BIM simulations and AI cost analysis to meet budget and value objectives, including prefabrication and material selection.
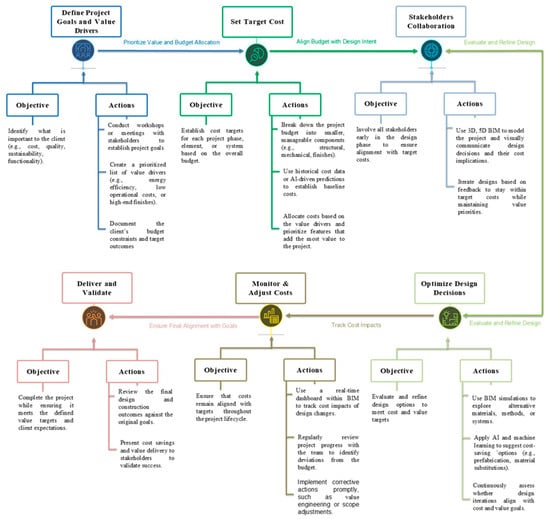
Figure A1.
Implementation process of Target Value Design (TVD) in Author Cost Estimation using different technologies (AI and Machine Learning).
Figure A1.
Implementation process of Target Value Design (TVD) in Author Cost Estimation using different technologies (AI and Machine Learning).
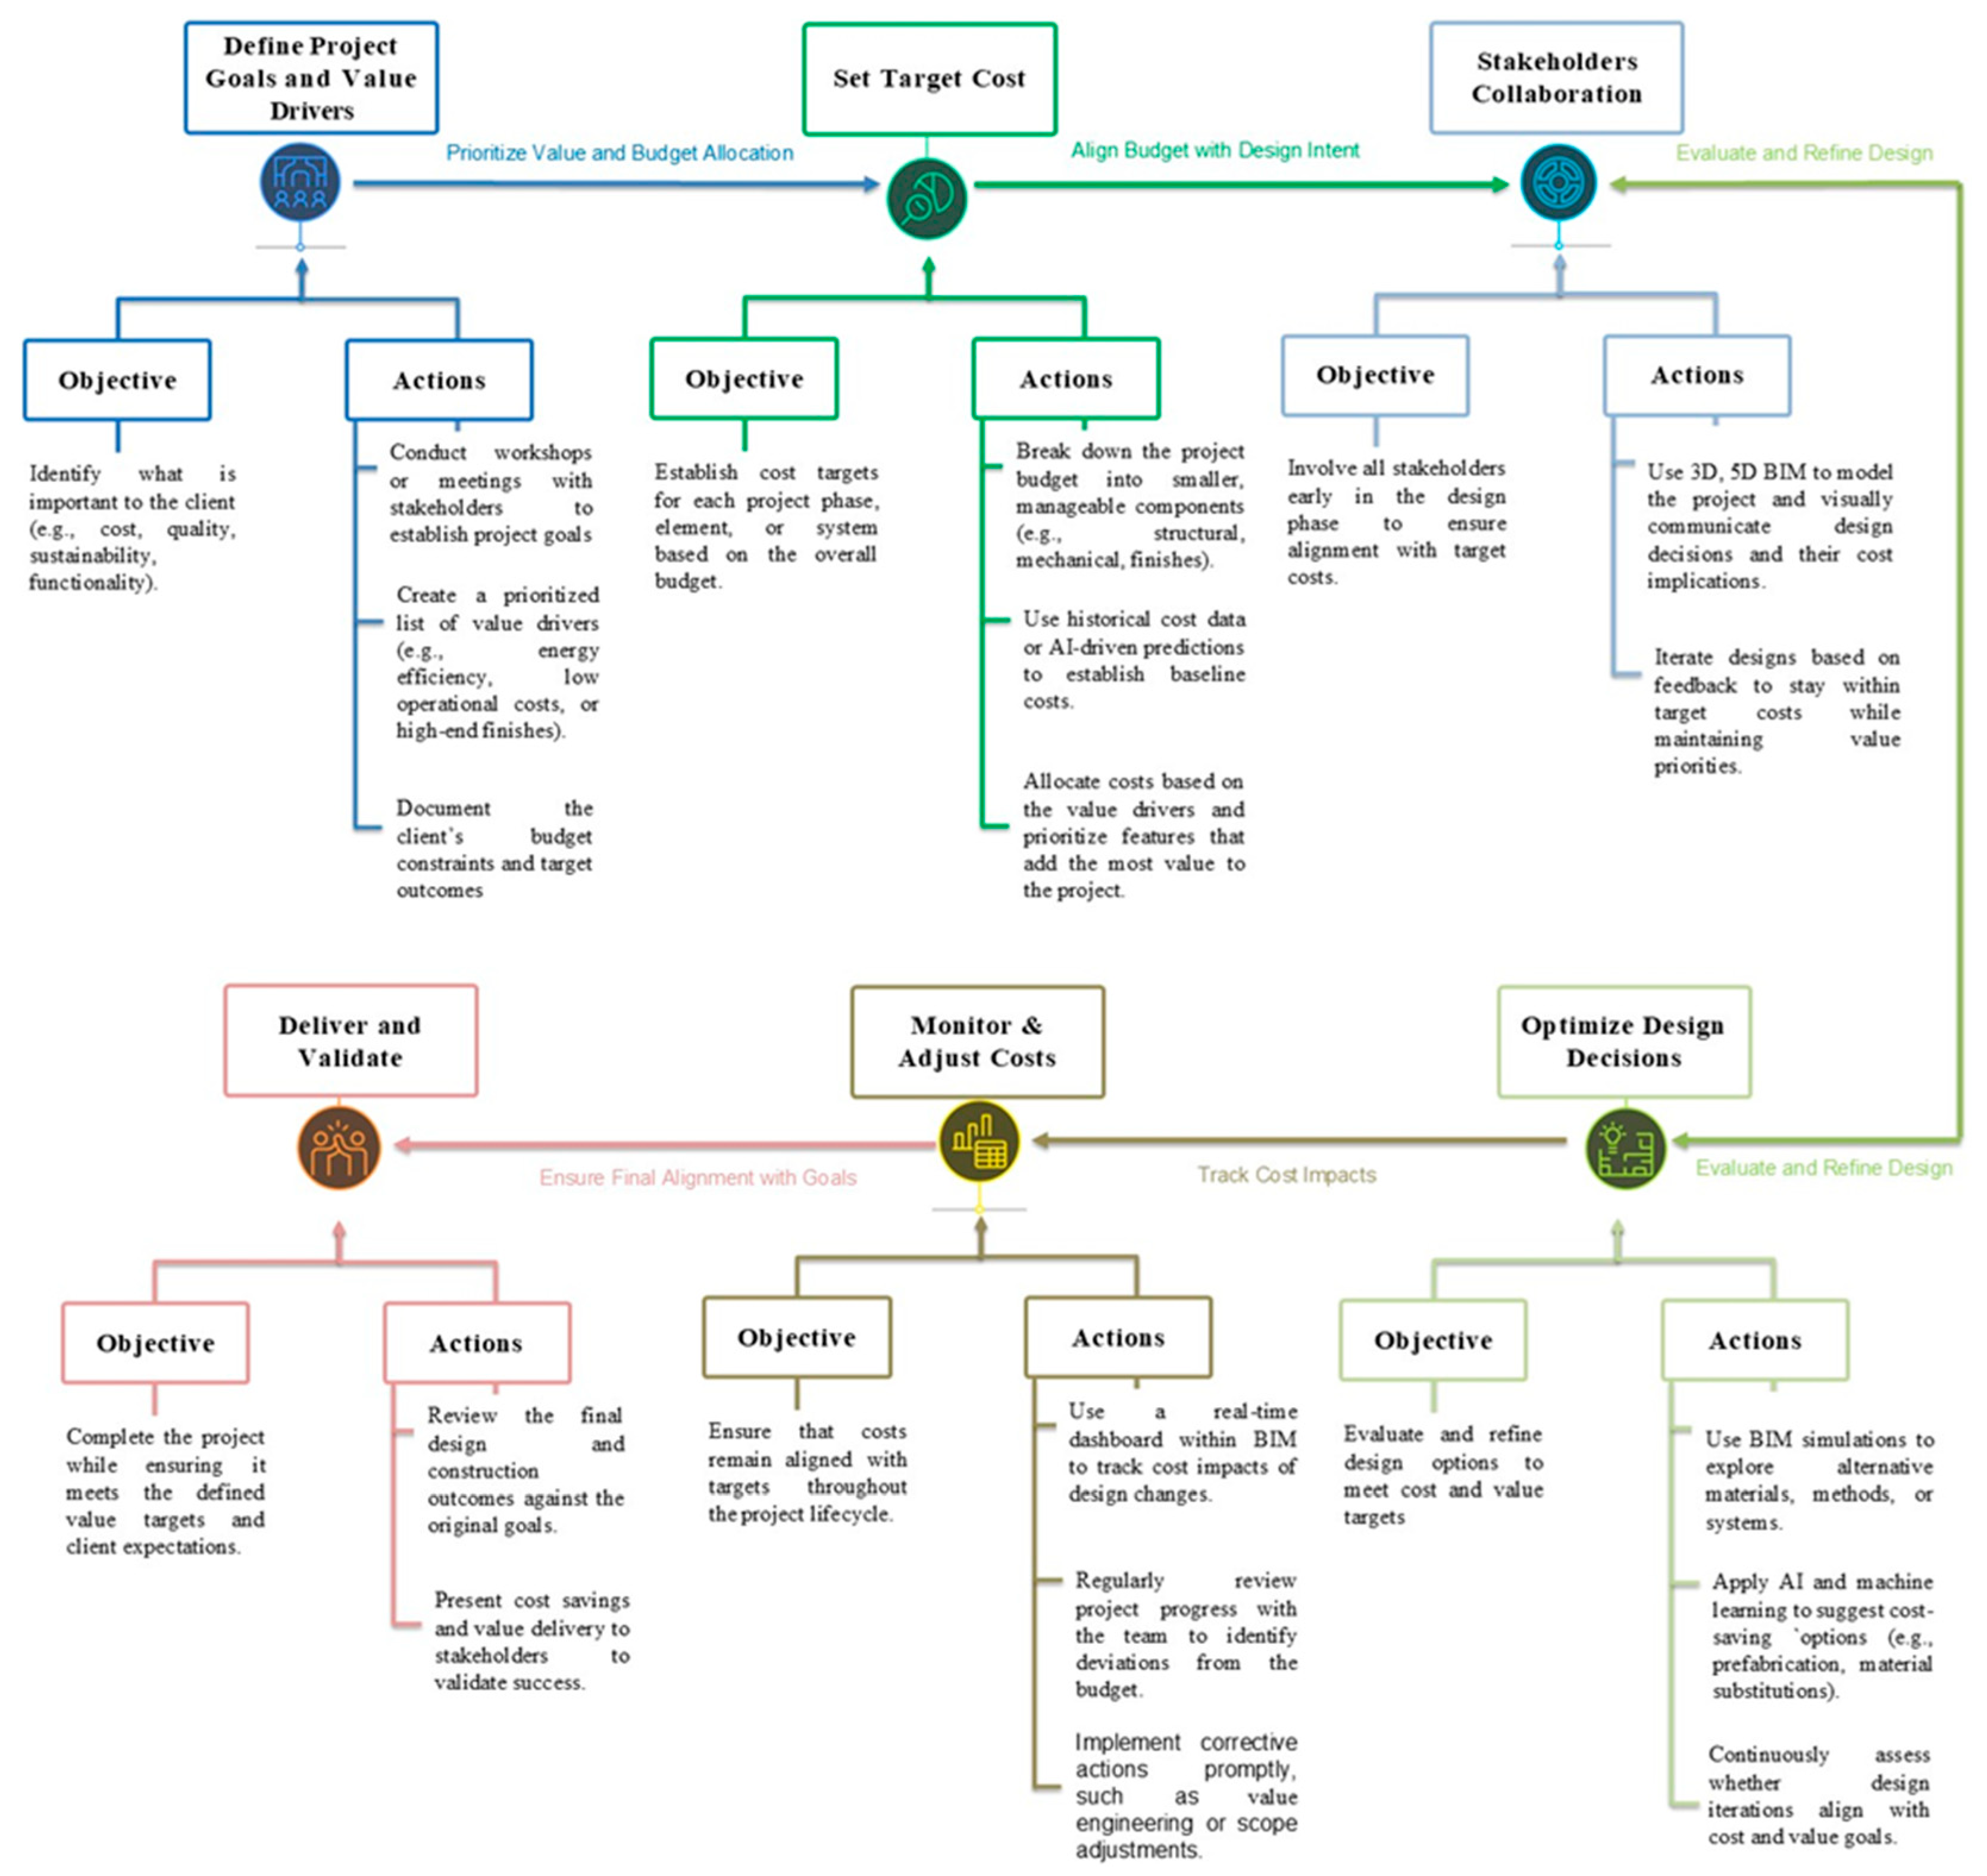
Monitoring and Adjusting Costs uses BIM dashboards to track changes, supported by regular budget reviews and corrective actions like value engineering. Finally, Delivering and Validating reviews outcomes against goals, documenting lessons learned to improve future TVD applications.
Key KPIs include cost efficiency through value-driven budgeting, improved time management via real-time tracking, enhanced stakeholder collaboration through transparency, and process optimization supported by BIM and AI. Waste reduction and quality improvements are secondary but positively affected.
LPS in Author 4D Model
Figure A2 illustrates the integration of the Author 4D Model (BIM), Last Planner System (LPS), and emerging technologies like Digital Twins and IoT to optimize construction planning and execution. Key steps include master scheduling, phase scheduling, lookahead planning, weekly work planning, commitment tracking, and continuous improvement. The 4D BIM model visualizes construction sequences, while LPS supports collaborative task management [85]. Digital Twins and IoT provide real-time insights and predictive updates to enhance workflow reliability.
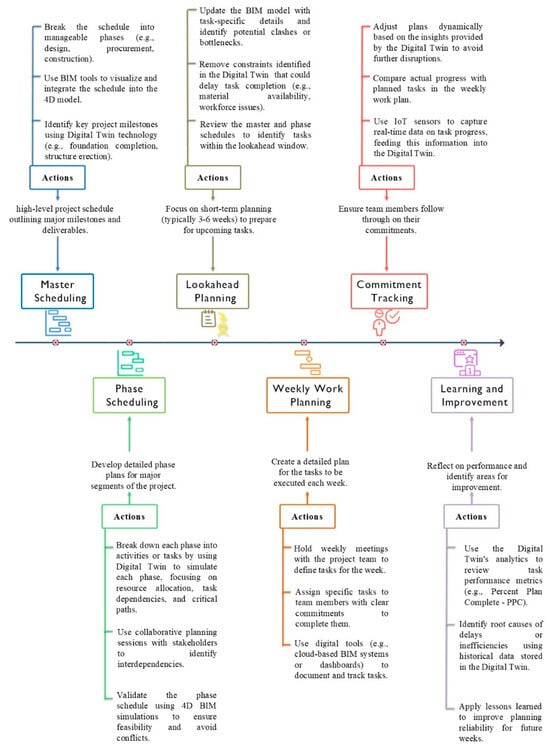
Figure A2.
Integration of the Last Planner System (LPS) with the Author 4D Model using different technologies (Digital Twins and IoT).
Figure A2.
Integration of the Last Planner System (LPS) with the Author 4D Model using different technologies (Digital Twins and IoT).
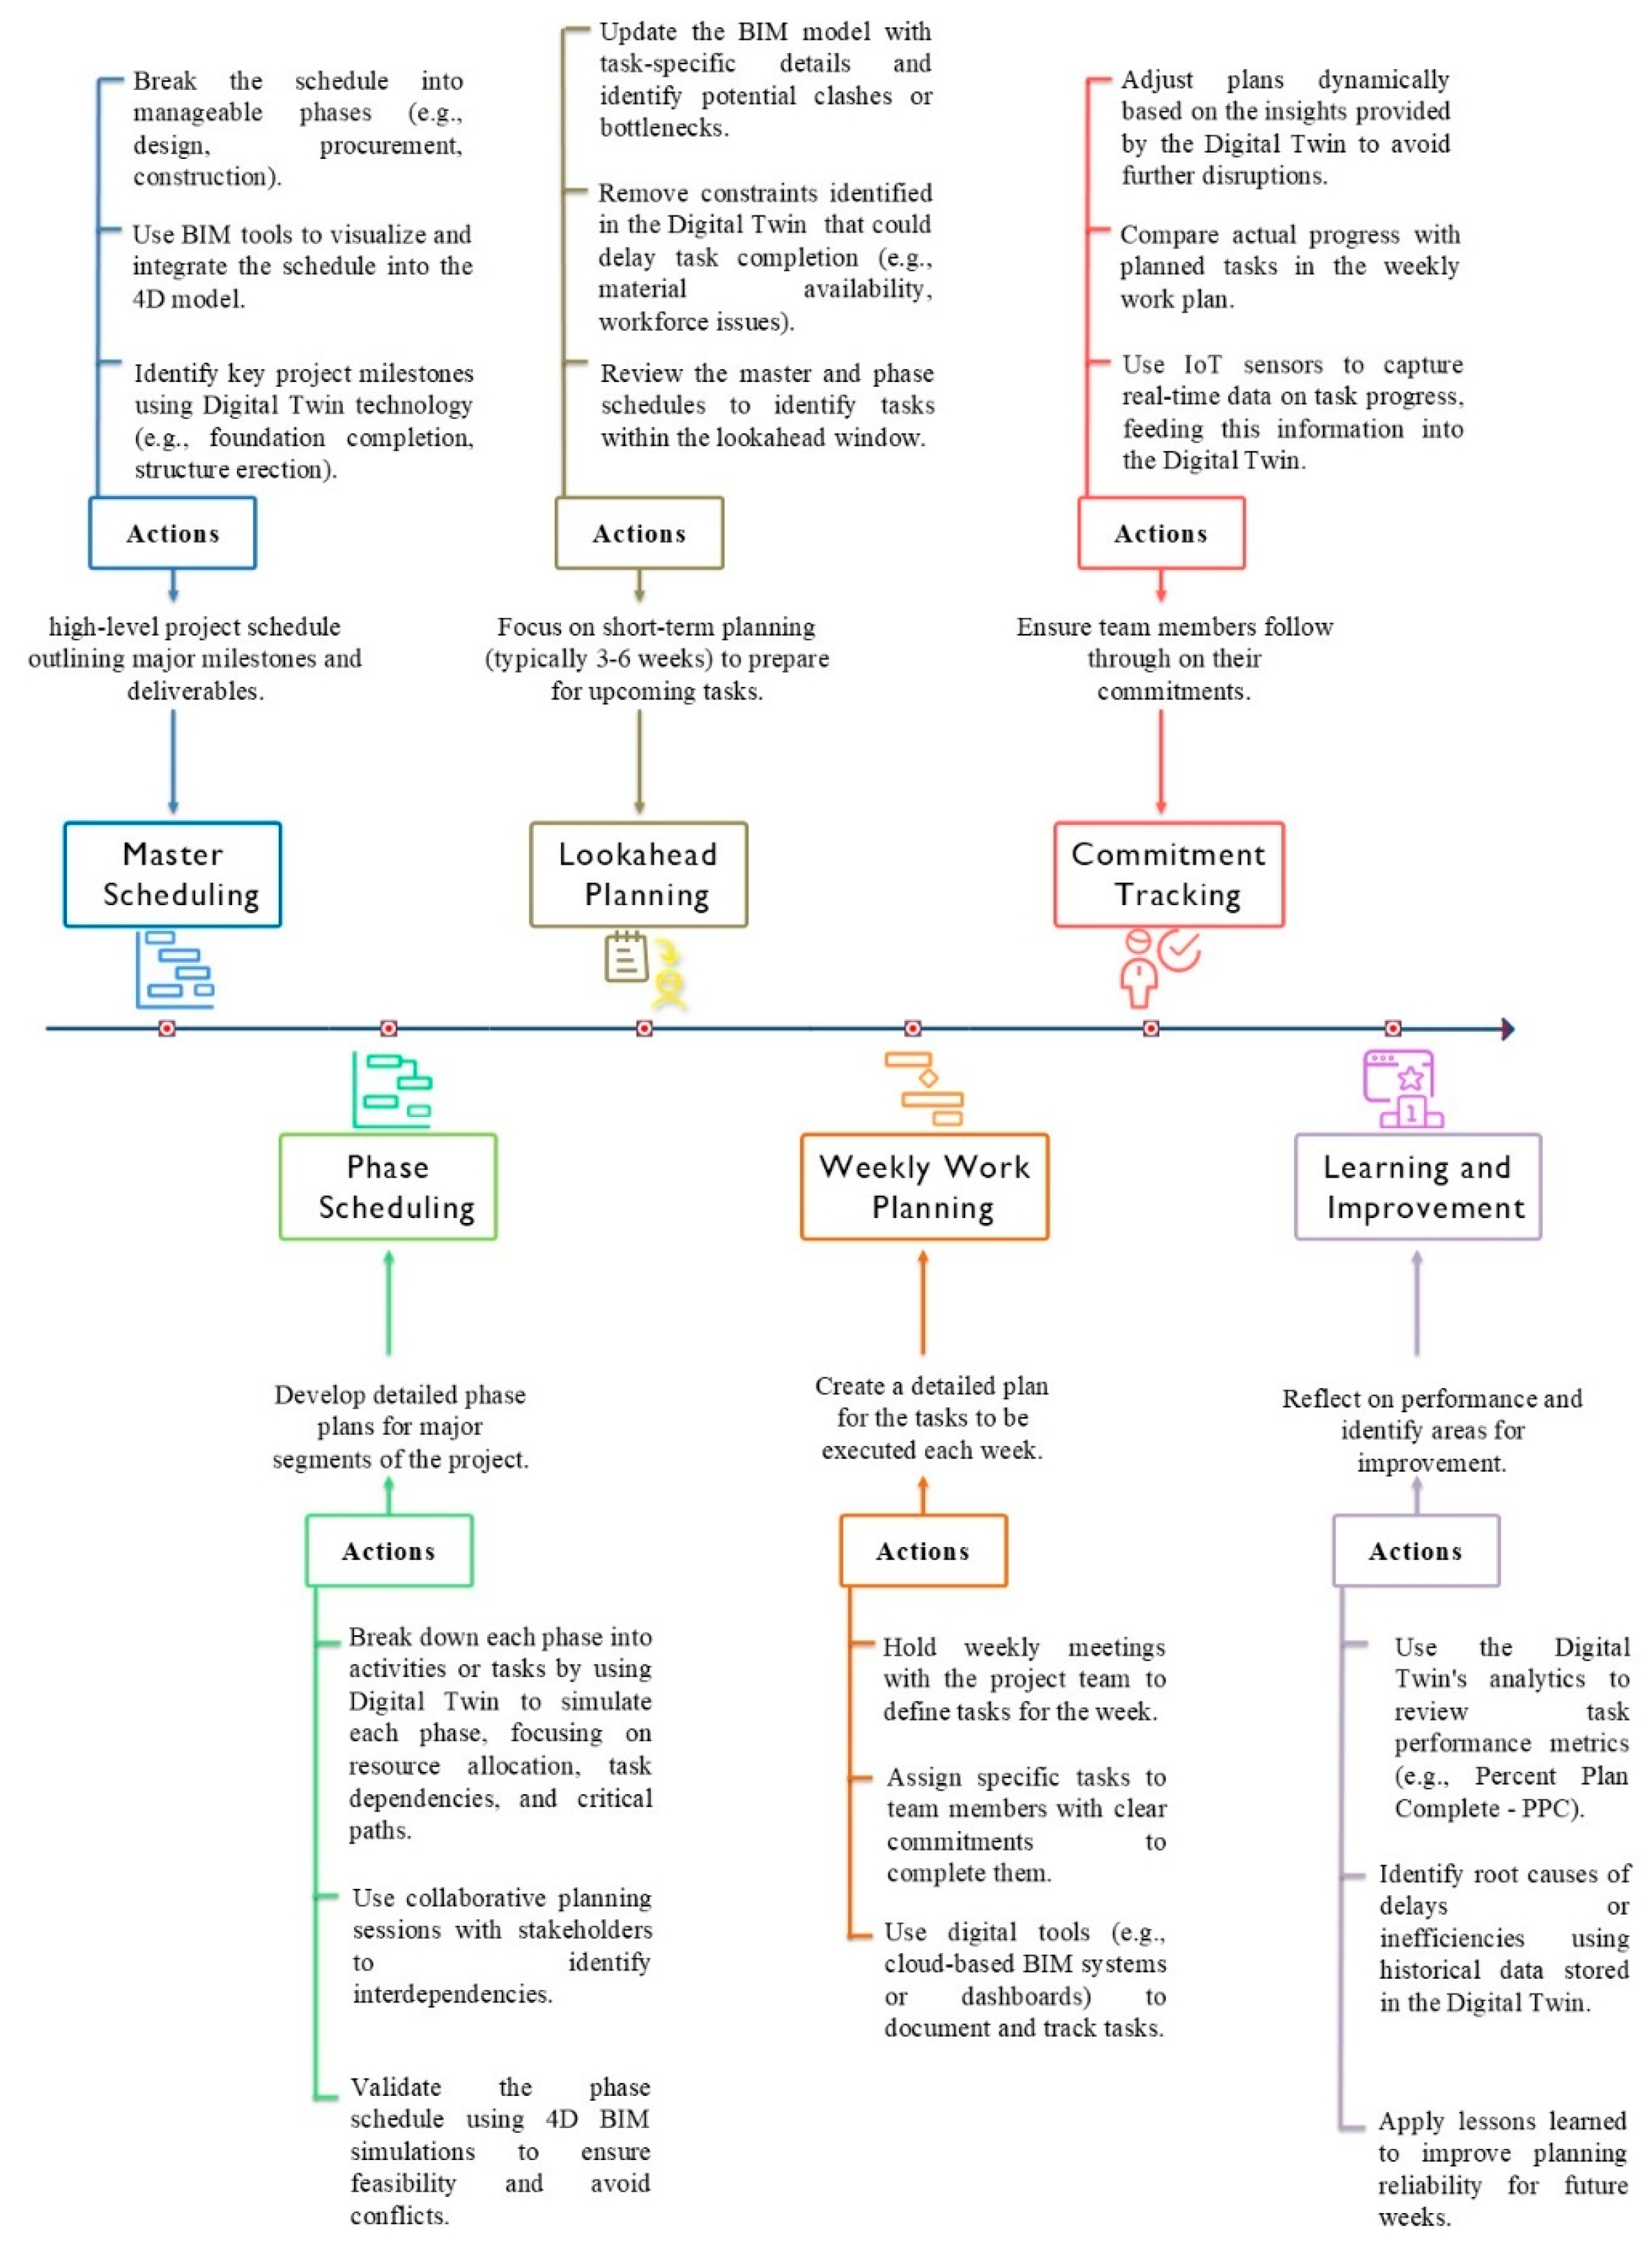
Master Scheduling develops high-level timelines using Digital Twins to simulate the project lifecycle and identify bottlenecks. Phase Scheduling breaks this into detailed plans, dynamically adjusted based on Digital Twin feedback. Lookahead Planning analyzes short-term tasks, factoring in real-time site conditions like material availability and weather. Weekly Work Planning refines task sequences using IoT data on workforce and equipment status.
Commitment Tracking monitors progress through IoT sensors, with Digital Twin updates helping address schedule deviations. Learning and Improvement uses analytics (e.g., Percent Plan Complete) to identify inefficiencies for future optimization.
KPI impacts include improved time efficiency through real-time adjustments, enhanced productivity via optimized task sequencing, and increased process automation through IoT and AI insights. Stakeholder collaboration is strengthened through 4D BIM visualizations, while cost efficiency benefits indirectly from improved planning and resource use.
PDCA in Analyze Program Requirements
Figure A3 demonstrates the integration of BIM, Lean’s Plan-Do-Check-Act (PDCA) cycle, and Big Data Analytics for analyzing program requirements [86]. This iterative process involves defining goals, implementing designs, evaluating outcomes, and refining processes. BIM serves as a visual and analytical platform, while Big Data supports data-driven decision making, promoting continuous improvement, resource efficiency, and stakeholder collaboration. In the Plan phase, BIM and Big Data define spatial and operational needs, producing a data-driven program with measurable KPIs. In Do, initial design prototypes are developed in BIM, integrating energy and material data. Check evaluates design performance against KPIs, using analytics and stakeholder feedback to identify gaps. In Act, the BIM model is refined based on these insights, ensuring improved accuracy and alignment with project goals.
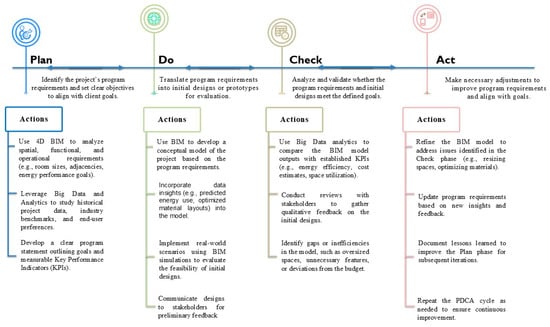
Figure A3.
PDCA Lean Construction tool integrated with Analyze Program Requirements as BIM Use and Big Data as Emerging Technologies.
Figure A3.
PDCA Lean Construction tool integrated with Analyze Program Requirements as BIM Use and Big Data as Emerging Technologies.

Key KPI impacts include cost savings through early optimization, improved delivery timelines by reducing redesigns, enhanced stakeholder engagement via feedback loops, and better process optimization through BIM and Big Data integration.
VSM in Analyze Site Selection Criteria
The diagram shows the integration of BIM, Value Stream Mapping (VSM), and GIS to optimize site selection [70]. VSM identifies workflow inefficiencies, while GIS provides spatial analysis and data visualization. BIM acts as a central platform, integrating GIS data to support collaborative, data-driven site selection aligned with project and stakeholder goals. The process starts with Mapping Current State, identifying bottlenecks like redundant approvals and manual data entry. Then, Identifying Waste applies the seven Lean Waste principles [87] to prioritize delays, unnecessary costs, and inefficiencies, using GIS analytics to reveal repeated site evaluation issues. An optimized workflow is then developed by automating data collection and spatial analysis through GIS, while BIM dynamically visualizes and compares site options. Centralized digital platforms streamline approvals and data sharing. Implementation and Monitoring include team training on GIS, BIM, and workflow improvements.
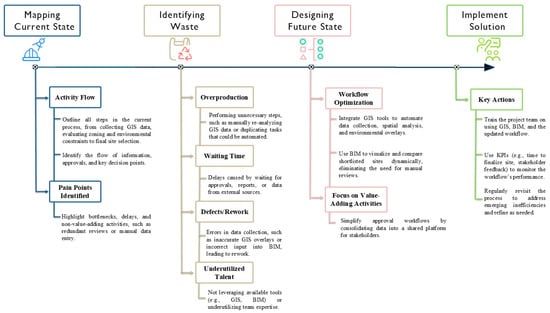
Figure A4.
Integration of BIM, Value Stream Mapping (VSM), and GIS for to optimize site selection criteria.
Figure A4.
Integration of BIM, Value Stream Mapping (VSM), and GIS for to optimize site selection criteria.
KPI benefits include time and cost efficiency through reduced delays and optimized resource use, improved stakeholder collaboration via transparent, data-driven decisions, and waste reduction by eliminating manual inefficiencies. Process optimization is enhanced through real-time analytics, although quality and safety impacts are indirect, focusing on regulatory alignment.
TVD in Author Design and Design Review Model
The step-by-step illustration in Figure A5 shows the implementation of Target Value Design (TVD) in the plan phase for Author Design and the Design Review Model of construction projects. It highlights how TVD integrates BIM, Lean tools, and emerging technologies such as CDE, AR, and VR to align design outputs with predefined project targets. Each step emphasizes collaboration, real-time feedback, and iterative refinement to ensure cost efficiency, stakeholder alignment, and value delivery throughout the design development process. Feedback loops demonstrate the iterative nature of TVD, enabling continuous improvement at every stage [84]. KPIs enhance the cost efficiency and savings are achieved by aligning design outputs with budget constraints, minimizing costly late-stage modifications. Time efficiency and delivery improve through real-time collaboration and rapid design iteration, reducing rework and delays. Stakeholder satisfaction and collaboration are enhanced as CDE centralizes design coordination, while AR/VR enables immersive stakeholder engagement and informed decision making. Process optimization and automation benefit from BIM-driven workflows, ensuring a structured, data-driven approach to design refinement. Additionally, waste reduction is realized by eliminating inefficiencies, optimizing resource allocation, and preventing design errors early in the process.
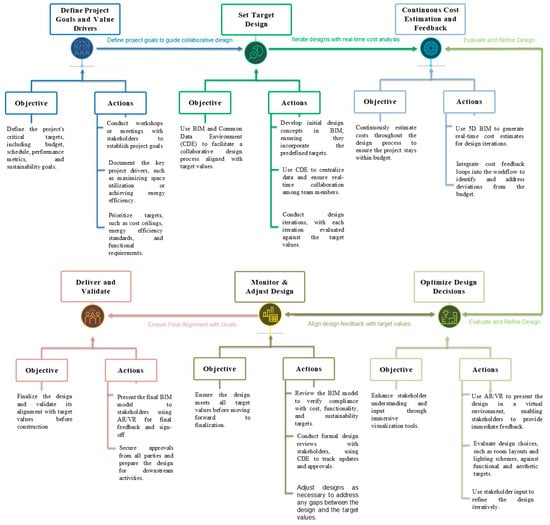
Figure A5.
Integration of BIM, Target Value Design (TVD), Common Data Environment (CDE), AR, VR for Optimizing Author Design, and Design Review Model.
Figure A5.
Integration of BIM, Target Value Design (TVD), Common Data Environment (CDE), AR, VR for Optimizing Author Design, and Design Review Model.
Appendix A.1.2. Design Phase
This subsection describes the framework’s applicability during the design phase, with each stage elaborated sequentially according to the corresponding rows in Table 7.
Kaizen in Analyzing Structural Performance
Figure A6 illustrates the use of Kaizen with BIM and AI Predictive Analytics to optimize structural performance in construction projects [88]. This cyclical process includes defining objectives, identifying issues, implementing improvements, and validating results, ensuring continuous refinement and high structural performance.

Figure A6.
Application of Kaizen for Analyze Structural Performance using AI Predictive Analytics.
Figure A6.
Application of Kaizen for Analyze Structural Performance using AI Predictive Analytics.
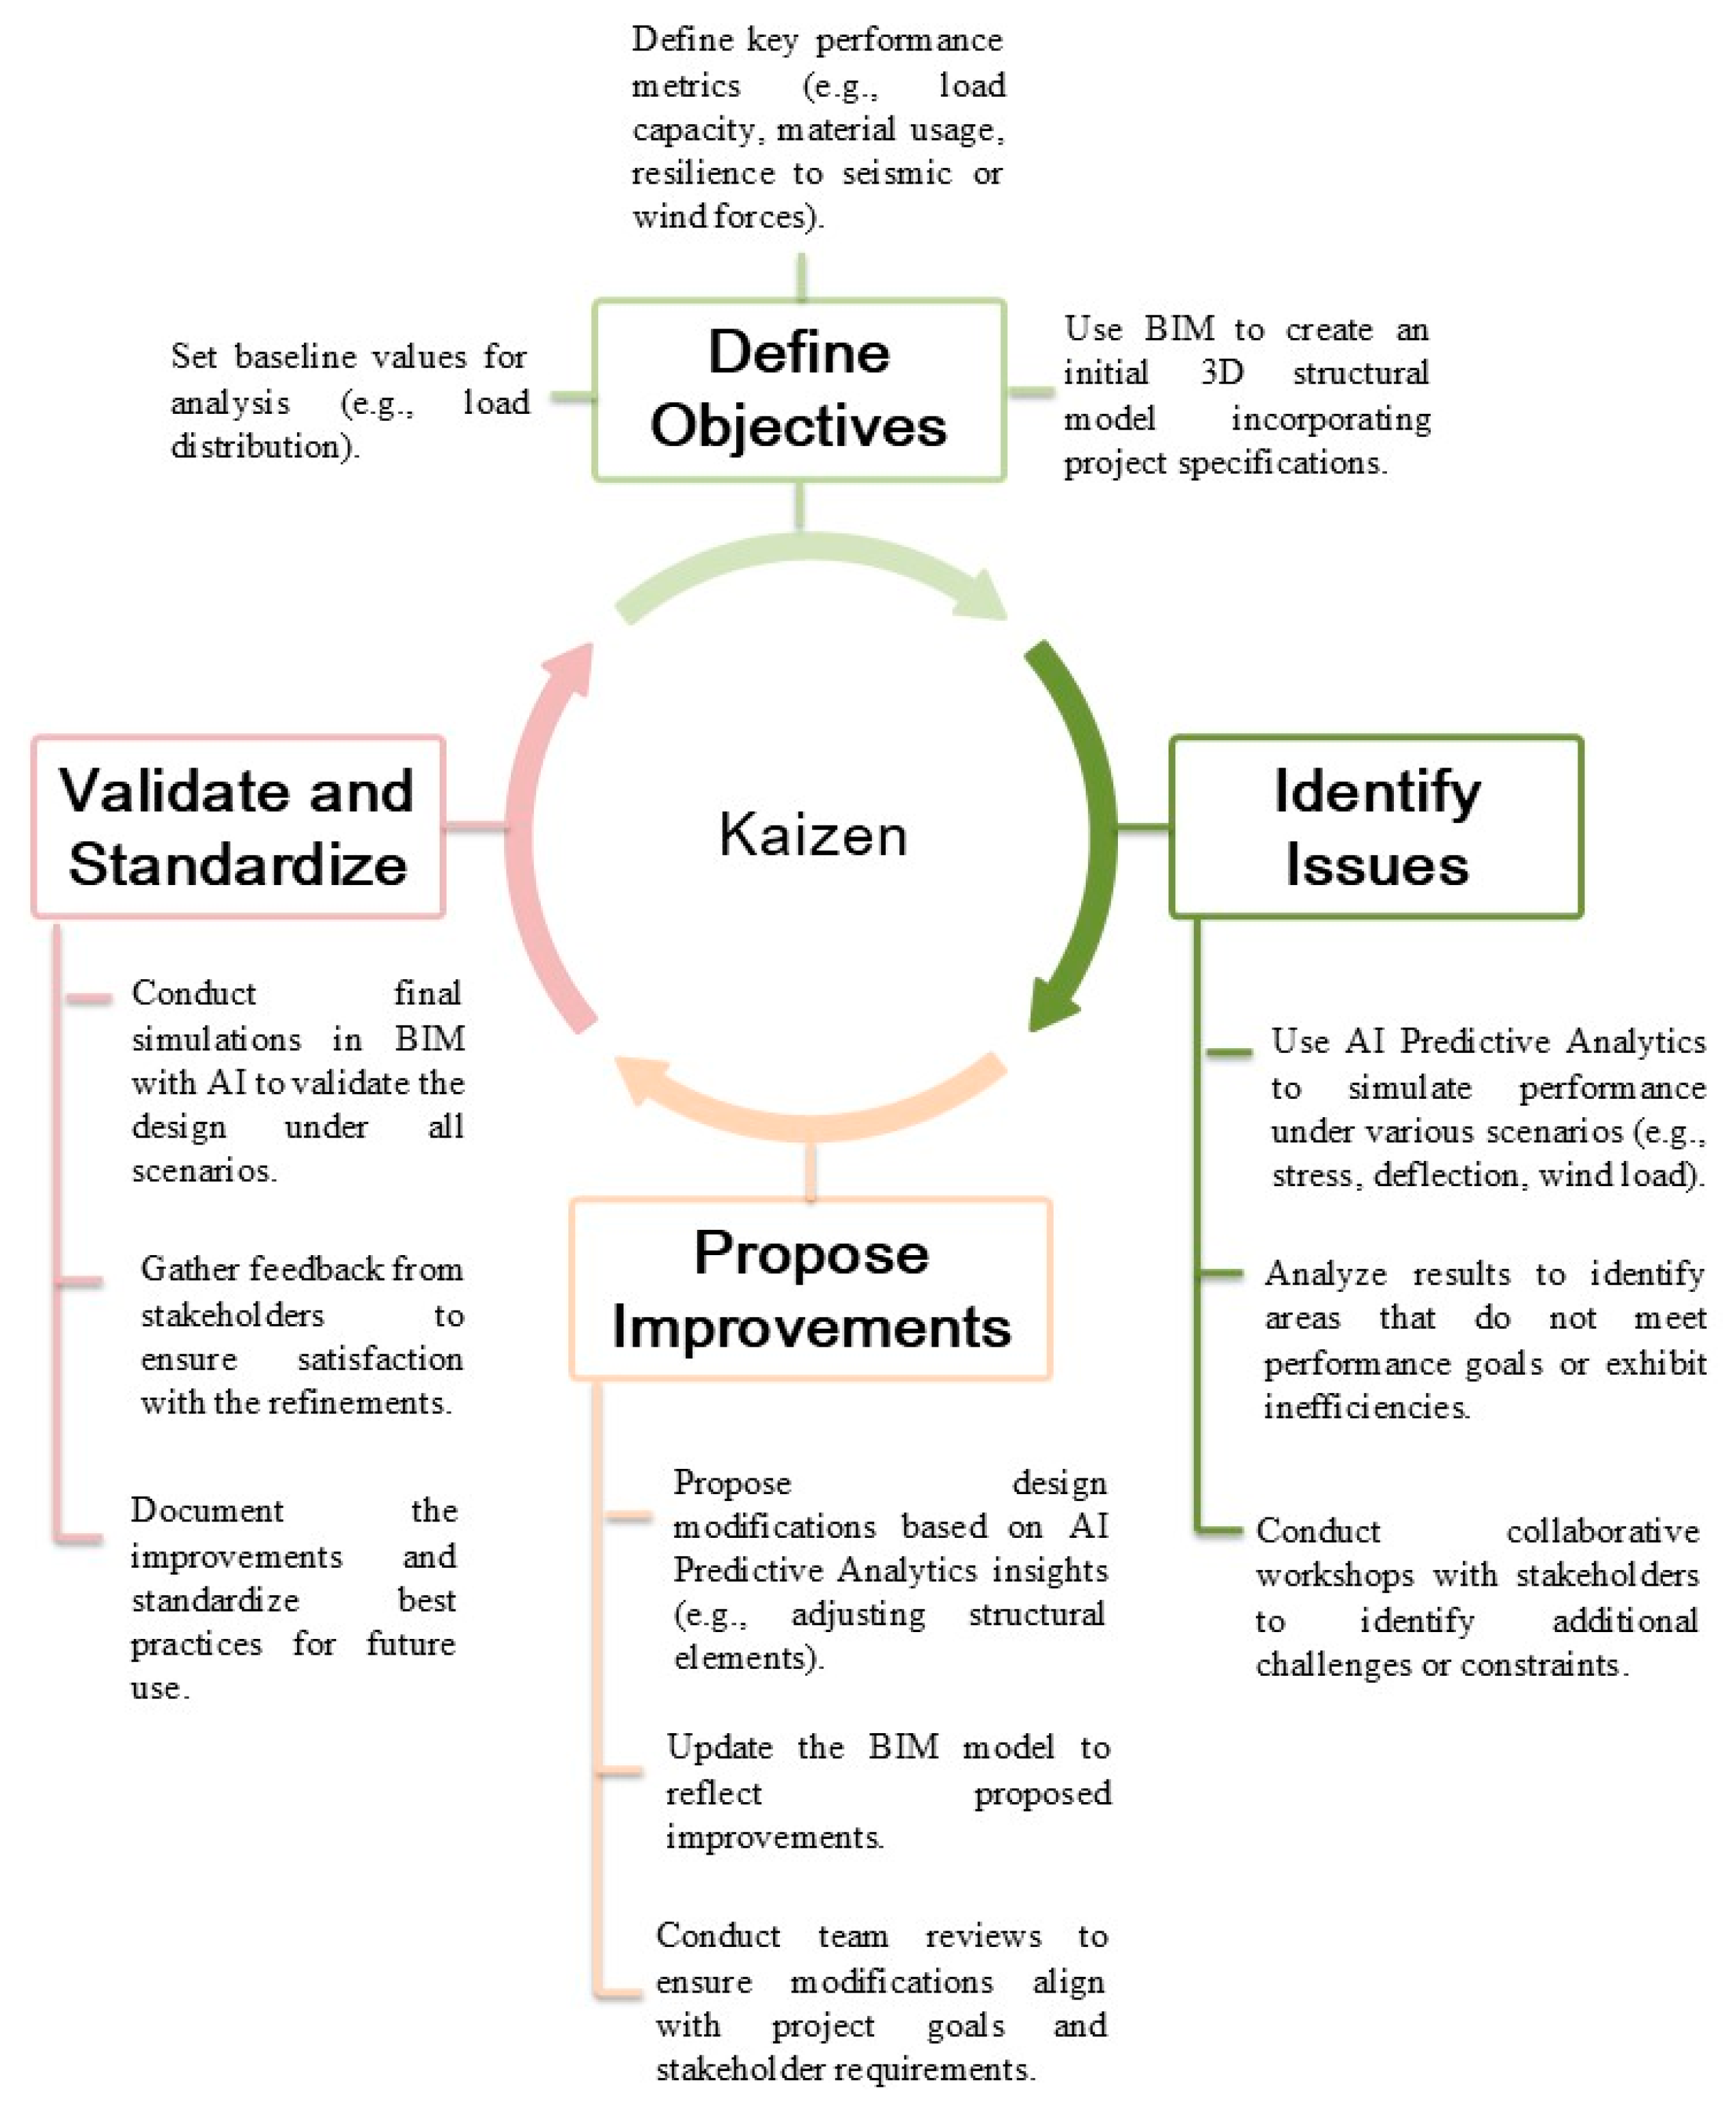
The process starts with Defining Objectives and Baseline using BIM to model structural metrics like load capacity and material use. Identifying Issues apply AI simulations to detect inefficiencies such as overdesign or waste, supported by stakeholder workshops. In Propose and Implement Improvements, AI guides design adjustments, which are validated through BIM simulations and stakeholder review. Validate and Standardize confirms that the refined design meets all performance criteria, with lessons learned documented for future use.
KPI impacts include cost savings from optimized material use, quality and safety improvements through validated structural performance, process optimization via AI-driven simulations, enhanced collaboration through real-time stakeholder engagement, and waste reduction by minimizing unnecessary material usage.
TQM in Analyze Energy and Lighting Performance
Figure A7 demonstrates the integration of BIM, Total Quality Management (TQM), and IoT to improve energy performance in building designs [89]. BIM provides a platform for energy simulations, IoT sensors supply real-time consumption data, and TQM ensures systems meet quality standards through continuous feedback. This process also applies to lighting performance optimization. Defining Energy Goals starts with BIM simulations to set targets, such as reducing consumption or achieving certifications like LEED or BREEAM. In Monitoring, IoT sensors capture real-time data on HVAC, lighting, and system efficiency, feeding this into BIM for comparison with targets. Identifying and Addressing Gaps uses TQM workshops to resolve issues like poor insulation or HVAC inefficiencies. Simulating and Validating Improvements updates the BIM model with proposed enhancements, validated through re-simulations. Feedback and Continuous Improvement uses IoT data to monitor performance post-implementation, refining future strategies. Key KPI benefits include cost savings through lower energy use, improved productivity from optimized systems, waste reduction by eliminating inefficiencies, enhanced quality and safety through compliance with standards, and ongoing process optimization via real-time IoT and BIM integration.
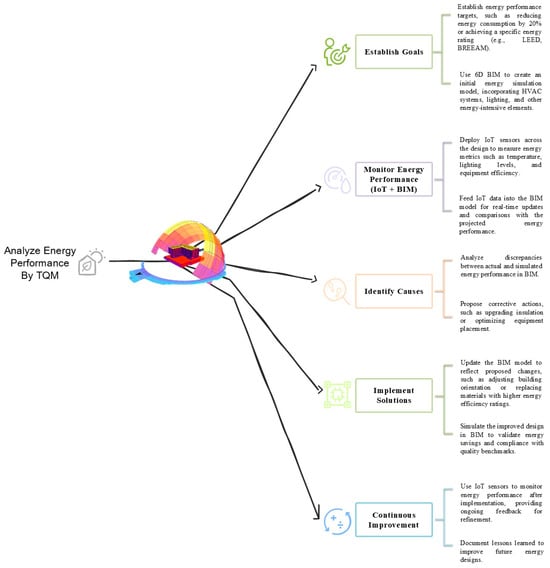
Figure A7.
Integration of BIM, TQM, and IoT for Energy Performance Optimization.
Figure A7.
Integration of BIM, TQM, and IoT for Energy Performance Optimization.

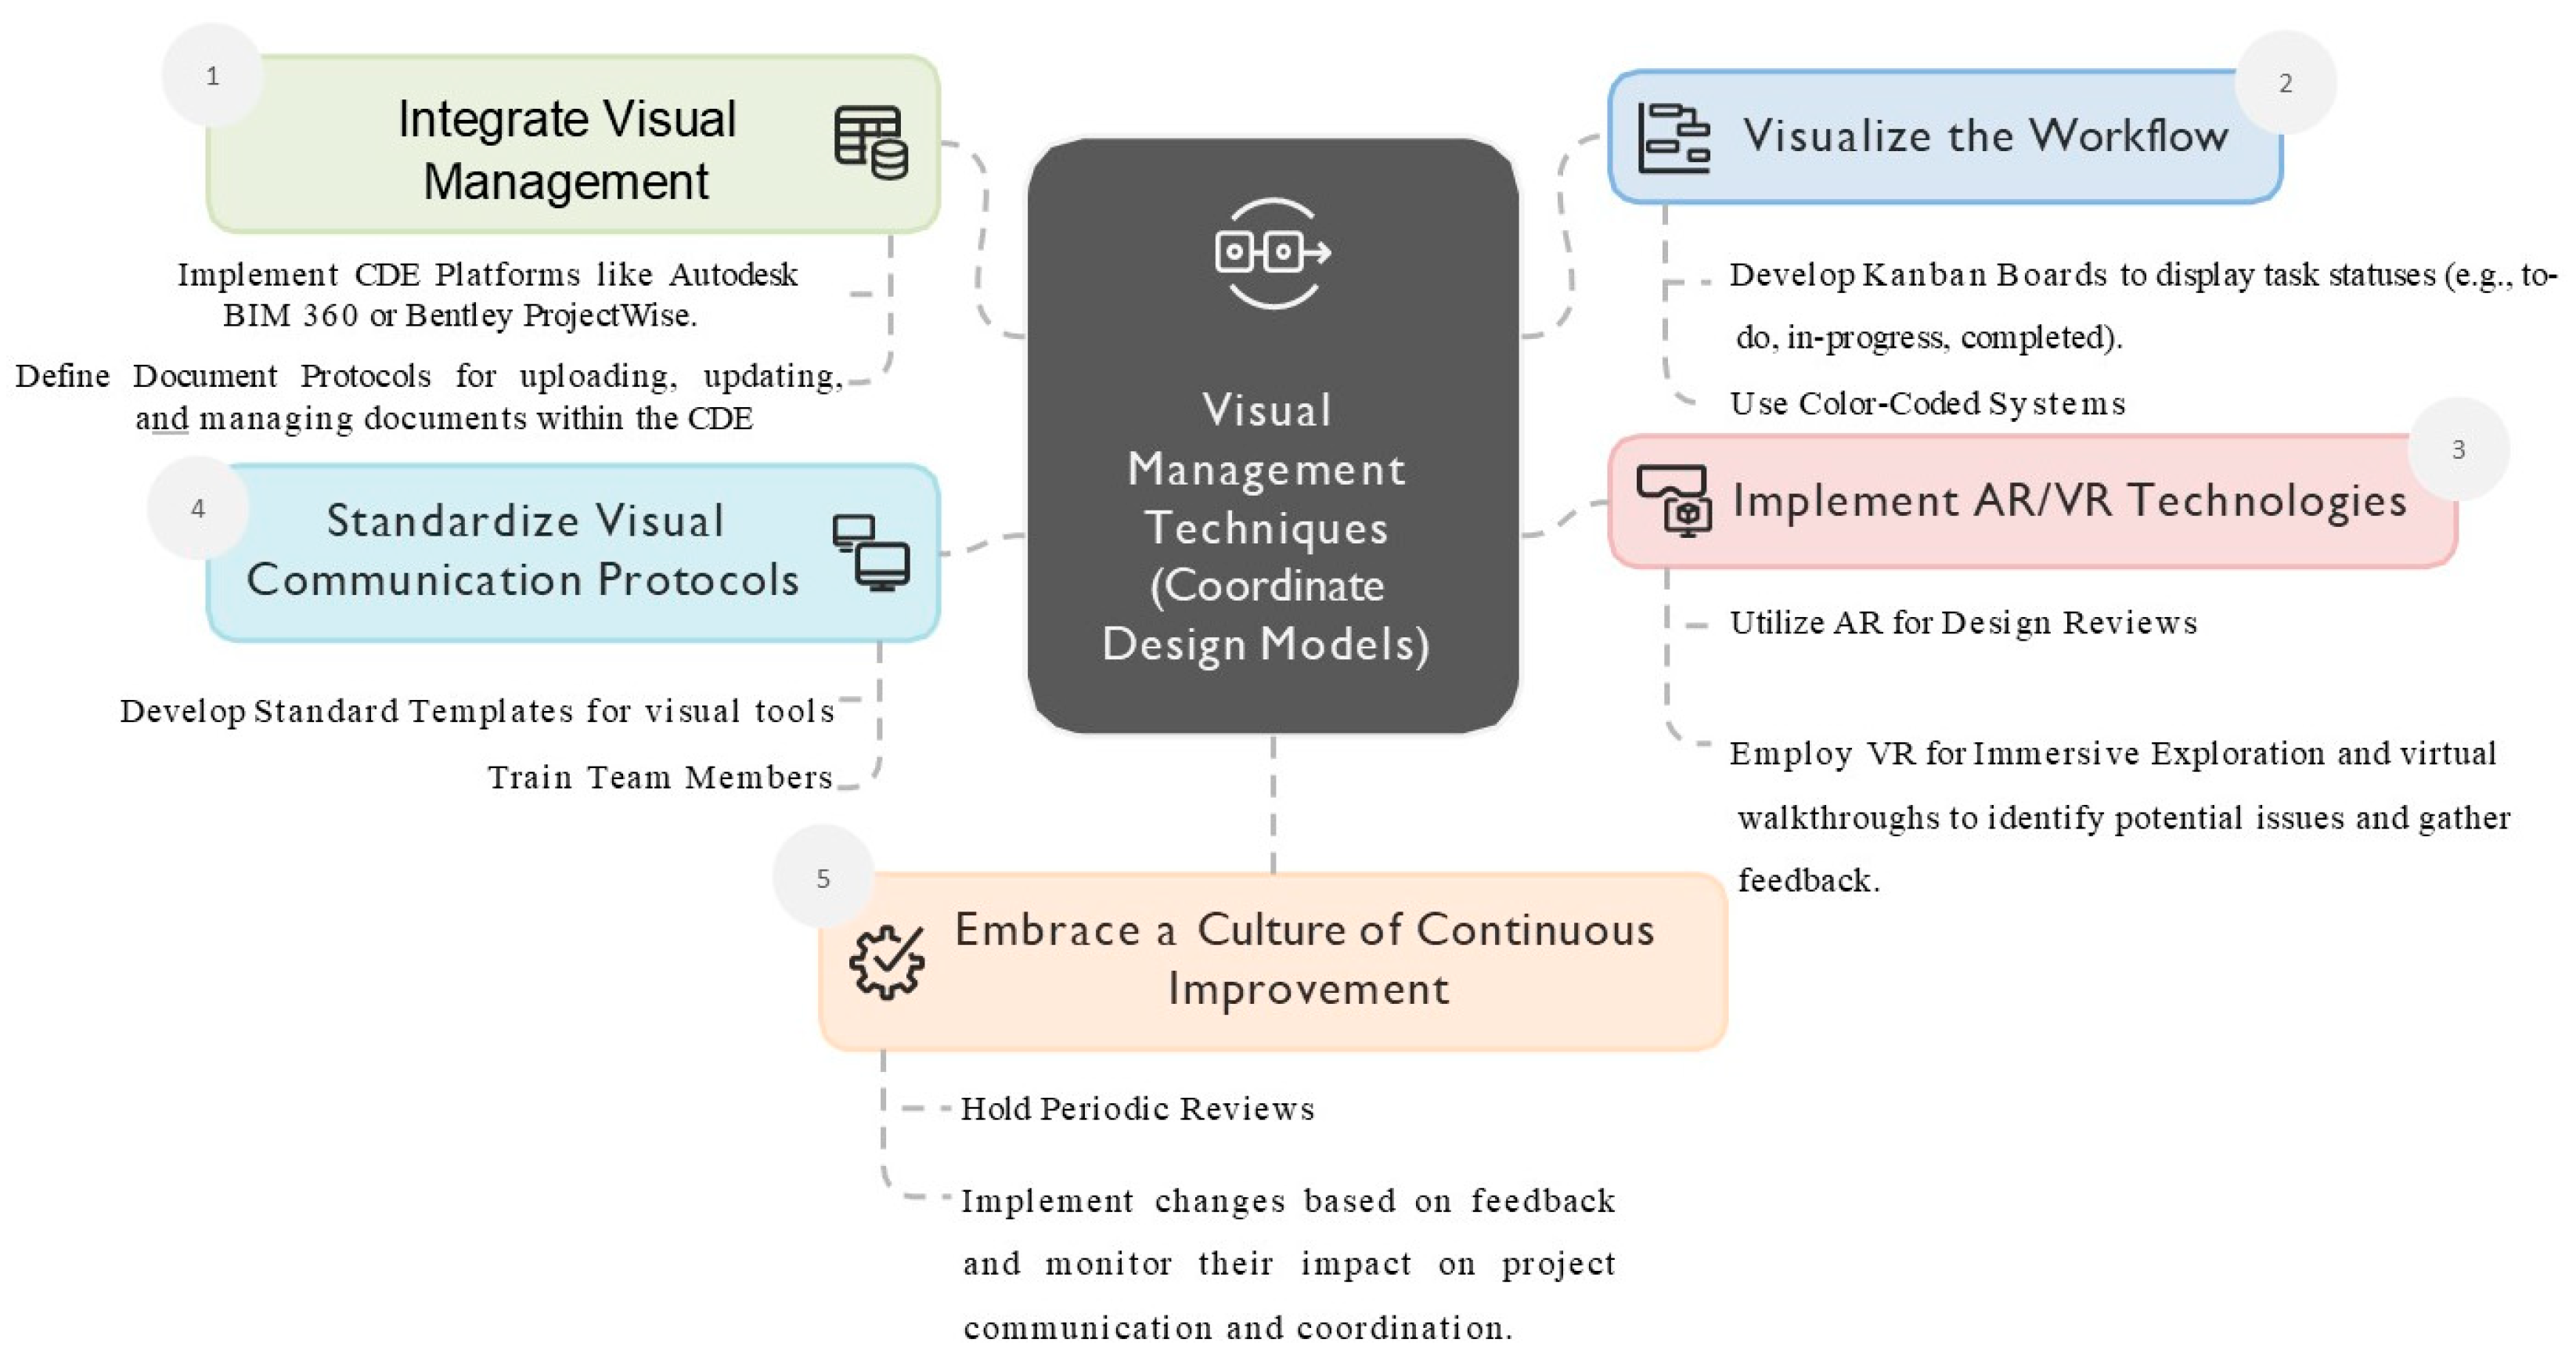
Visual Management Techniques in Coordinating Design Models
The diagram illustrates the use of Visual Management Techniques (VMT) to coordinate multidisciplinary design models [87]. It integrates a Common Data Environment (CDE) as the central platform, Kanban boards for workflow tracking, and AR/VR for enhanced spatial understanding. Standardized communication protocols and continuous improvement practices ensure team alignment and reduce errors. The process starts by Establishing a CDE (e.g., BIM 360, ProjectWise) to centralize models and documents. Visualizing the Workflow uses Kanban boards and color-coding to track progress transparently. AR/VR integration provides real-time spatial overlays and virtual walkthroughs to detect clashes and gather feedback. Standardizing Communication applies templates and symbols to unify project communication. Continuous Improvement is maintained through regular reviews and feedback loops. KPI benefits include improved time efficiency through real-time tracking, enhanced collaboration via AR/VR and CDE platforms, process optimization through automated updates and centralized data access, and waste reduction by minimizing errors and rework, supporting a more efficient design process.

Figure A8.
Application of Visual Management Techniques for Coordinating Design Models using CDE, VR, and AR.
Figure A8.
Application of Visual Management Techniques for Coordinating Design Models using CDE, VR, and AR.
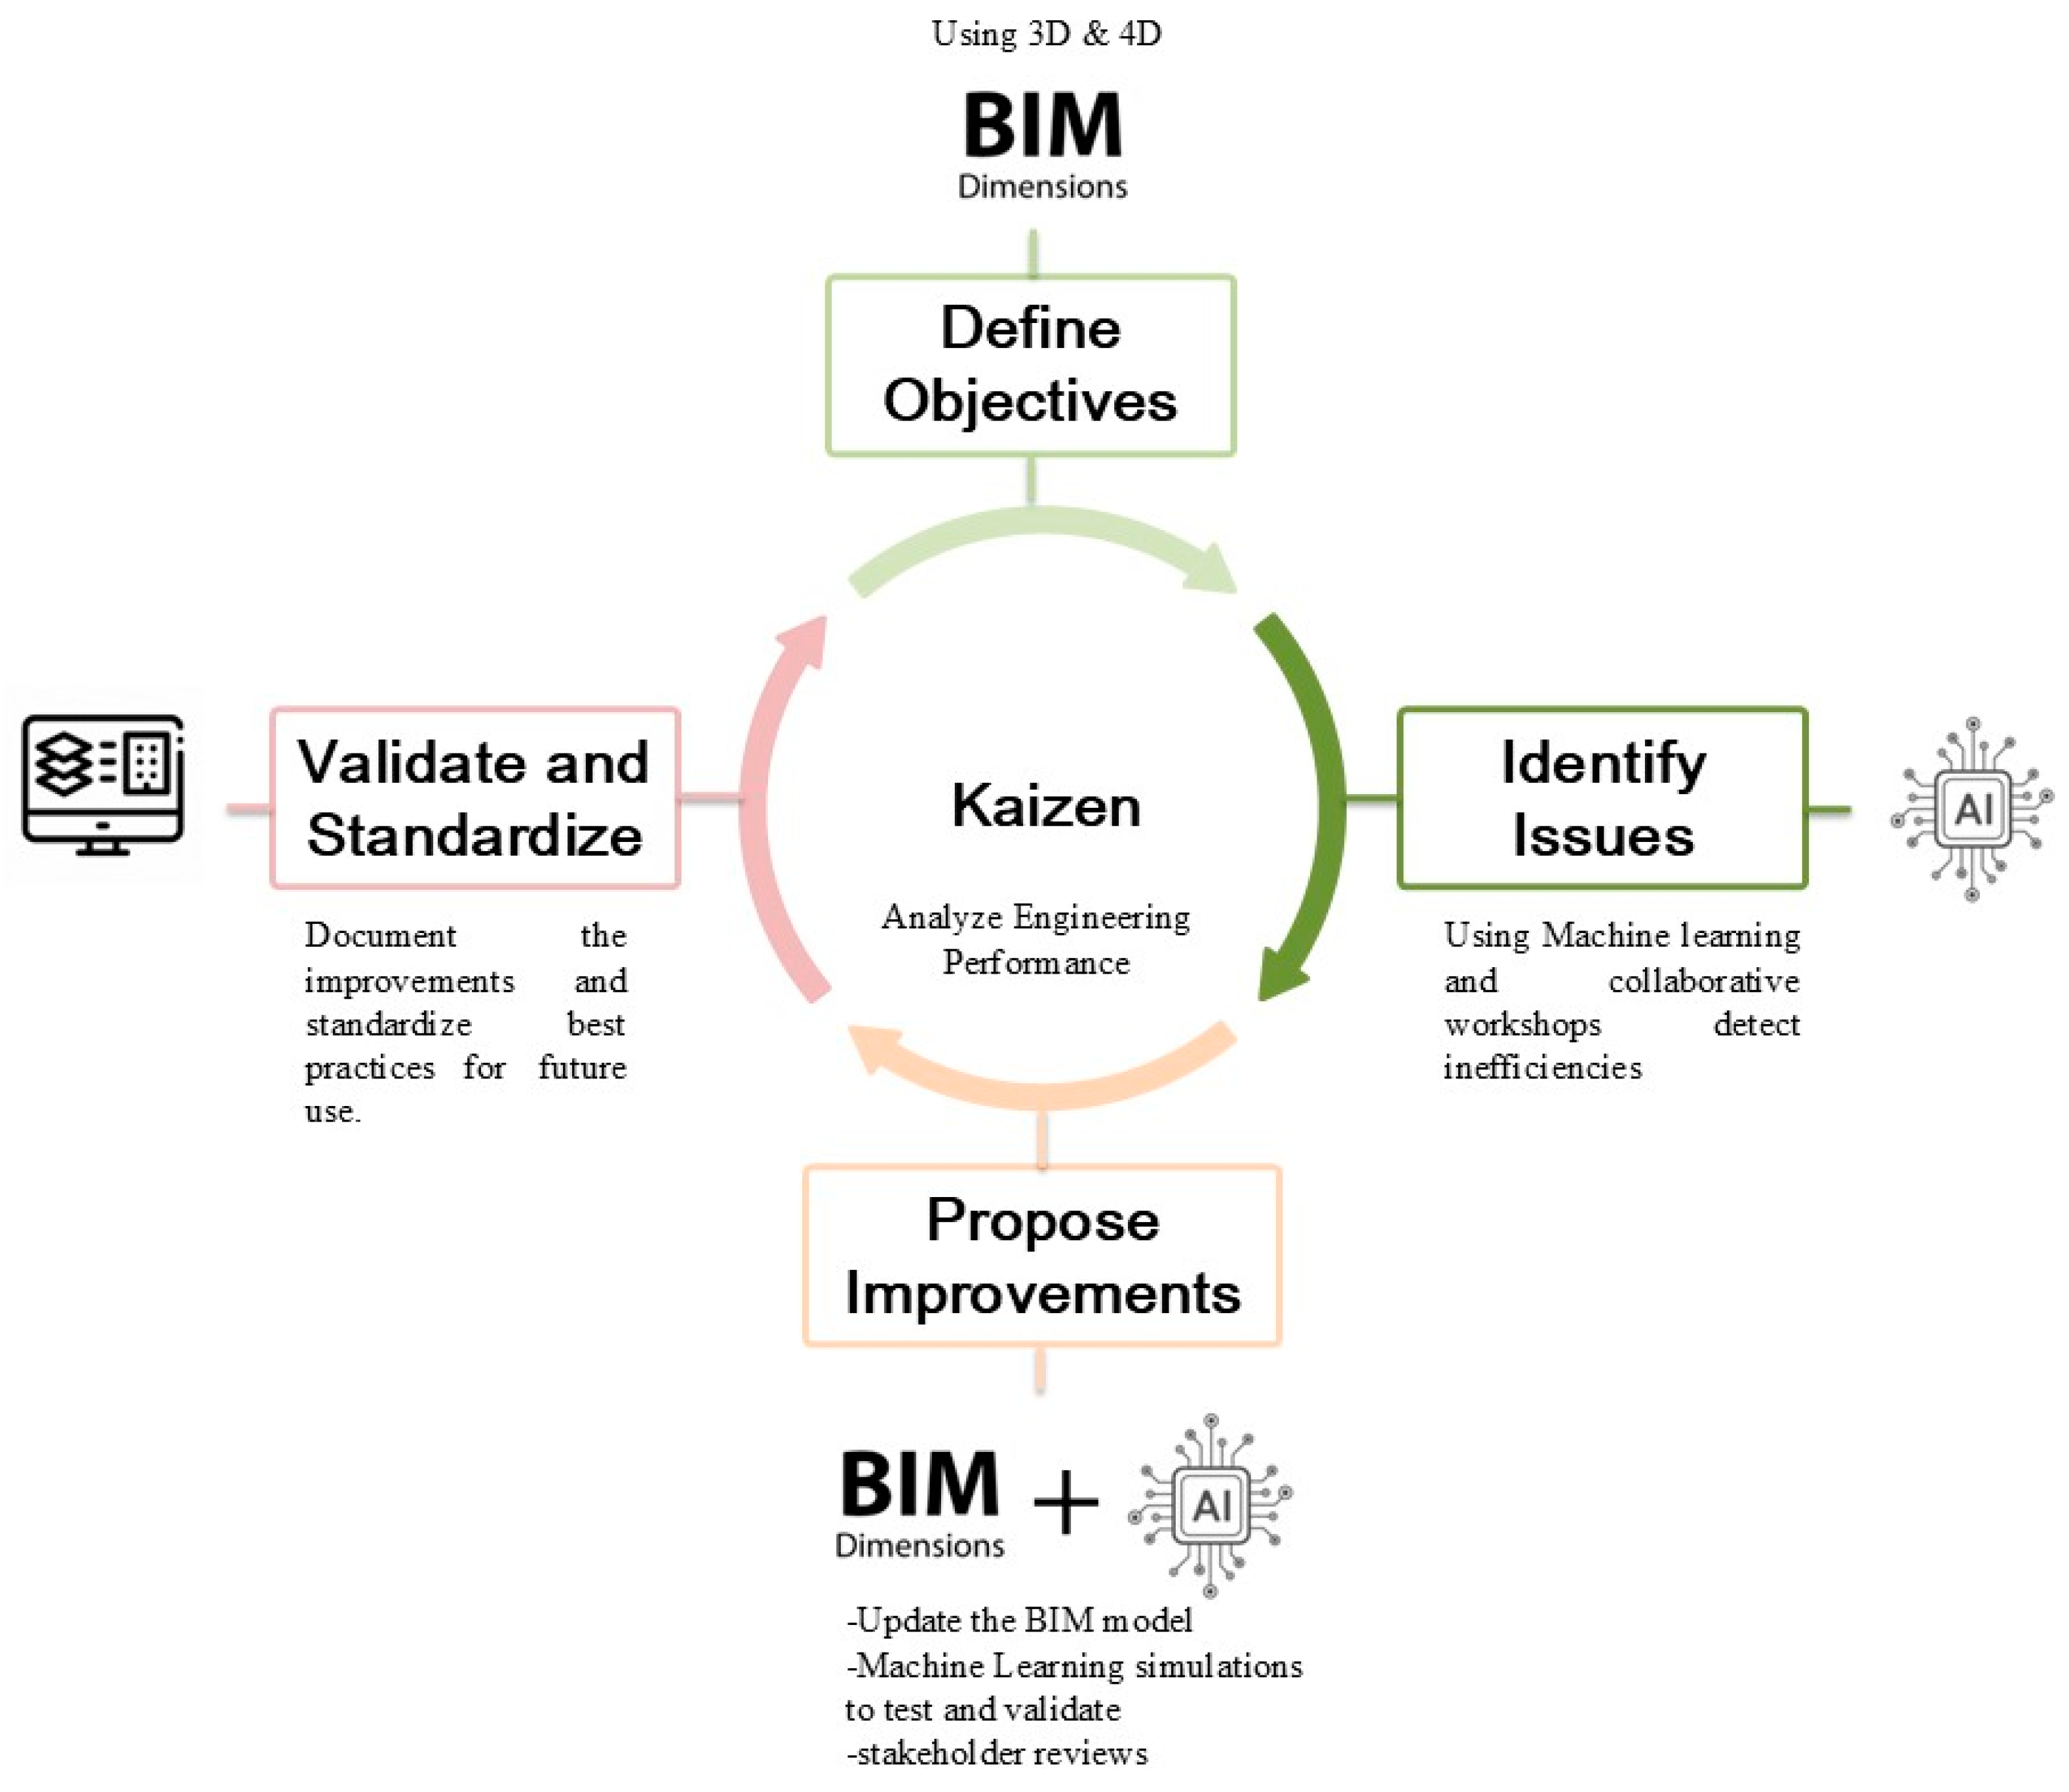
Kaizen in Analyze Engineering Performance
The diagram presents a four-step Kaizen cycle to optimize engineering performance, using 3D/4D BIM as the central platform and AI (Machine Learning) for data-driven insights [88]. The process includes defining objectives, identifying inefficiencies, testing improvements, and validating results to ensure continuous refinement and improved project outcomes. It starts with Defining Objectives and Metrics in BIM models covering structural, mechanical, and electrical systems. Identifying Issues uses AI simulations to detect inefficiencies such as overdesign or thermal bridging, supported by Kaizen workshops. Propose and Test Improvements involves updating the BIM model with optimized materials and layouts, validated through AI simulations and stakeholder reviews. Finally, Validate and Refine confirms improvements against baseline metrics. KPI benefits include cost savings from optimized material use, enhanced productivity through refined designs, process optimization via AI and BIM integration, and increased collaboration through workshops and feedback loops. Waste reduction and improved quality and safety result from minimizing excess materials and ensuring system reliability.

Figure A9.
Kaizen Integration for Engineering Performance Optimization using AI Machine Learning.
Figure A9.
Kaizen Integration for Engineering Performance Optimization using AI Machine Learning.
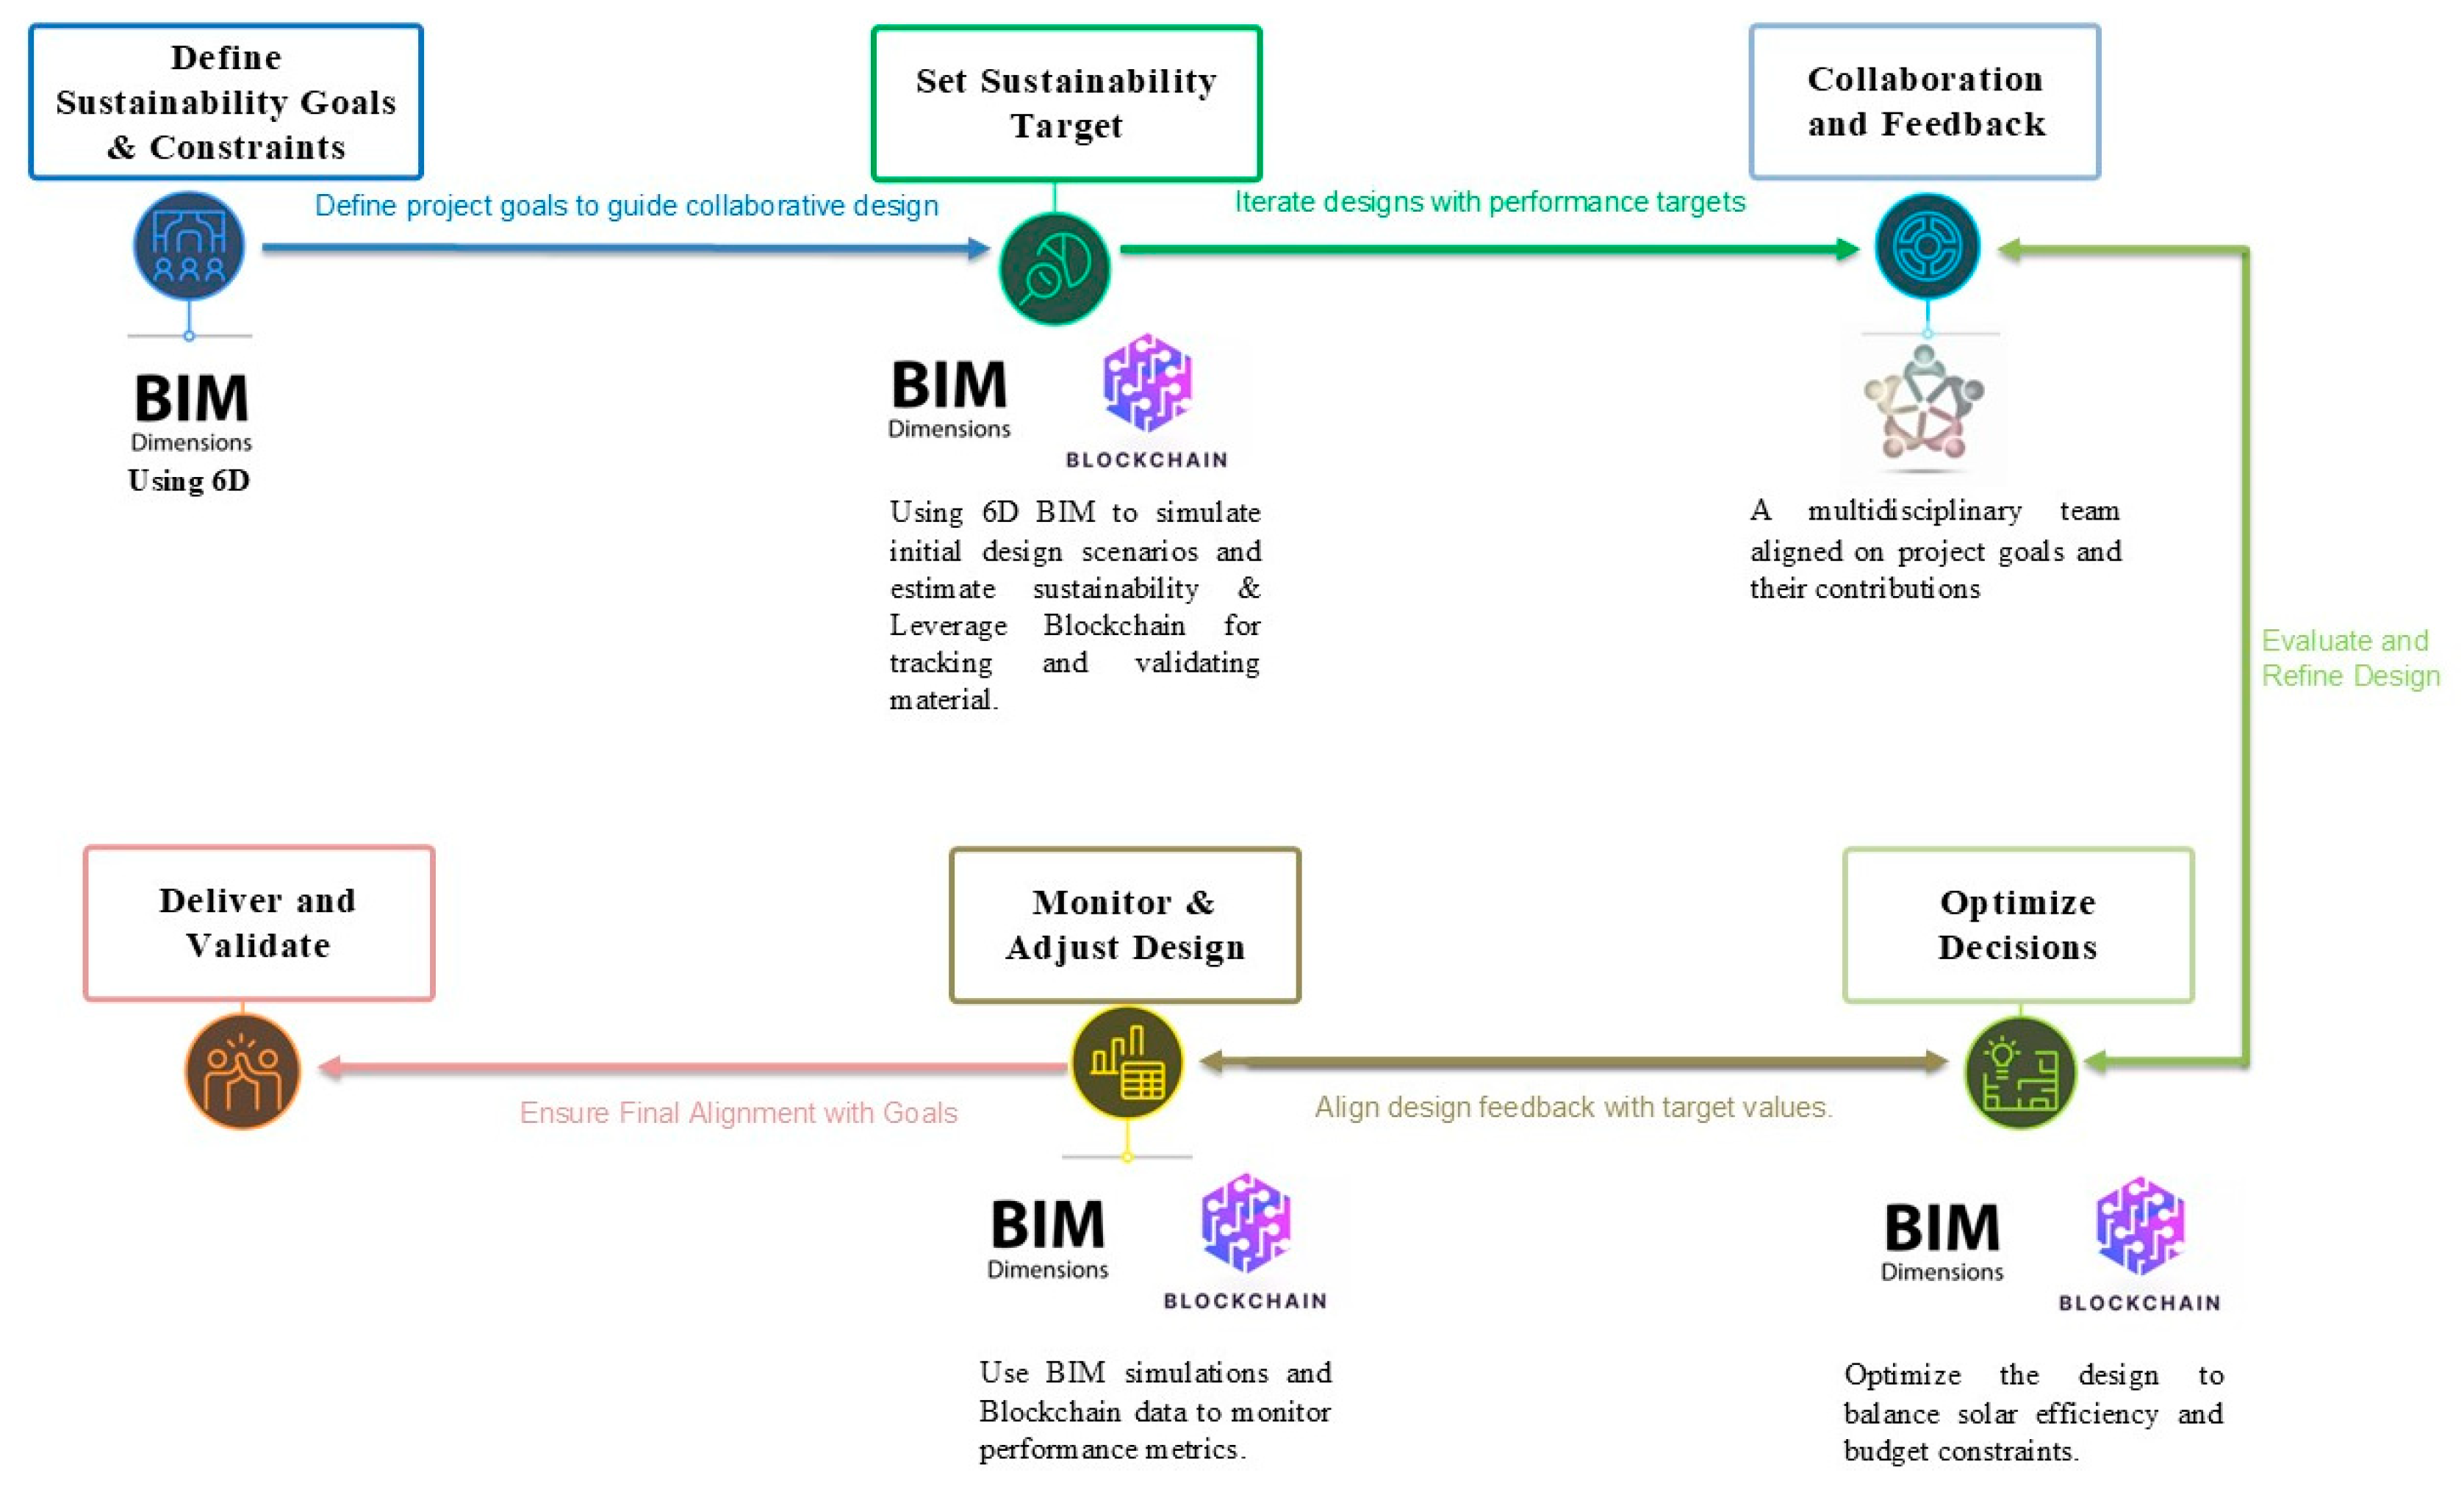
TVD in Analyzing Sustainability Performance
Figure A10 demonstrates the six-step application of Target Value Design (TVD) to enhance sustainability performance in construction projects. It integrates 6D BIM for modeling and simulations, Blockchain for transparent tracking of materials and certifications, and multidisciplinary collaboration to align sustainability goals with budget constraints. The process ensures the iterative refinement of designs, validation of performance metrics, and standardization of best practices, fostering continuous improvement in energy efficiency, material sustainability, and carbon reduction [84]. The impact of KPIs such as cost efficiency and savings by optimizing material use and energy performance reduce long-term operational costs. Time efficiency and delivery improve as Blockchain ensures supply chain transparency and BIM facilitates real-time performance tracking. Waste reduction is achieved through efficient material selection, lifecycle analysis, and energy-saving strategies. Quality and safety benefit from resilient, eco-friendly materials and regulatory compliance. Additionally, stakeholder satisfaction and collaboration improve as a multidisciplinary approach fosters the shared ownership of sustainability goals.
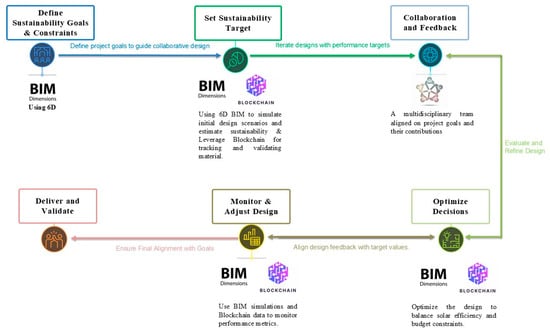
Figure A10.
TVD integration for Sustainability Performance Optimization using Blockchain.
Figure A10.
TVD integration for Sustainability Performance Optimization using Blockchain.
Appendix A.1.3. Construction Phase
This subsection describes the framework’s applicability during the construction phase, with each stage elaborated sequentially according to the corresponding rows in Table 7.
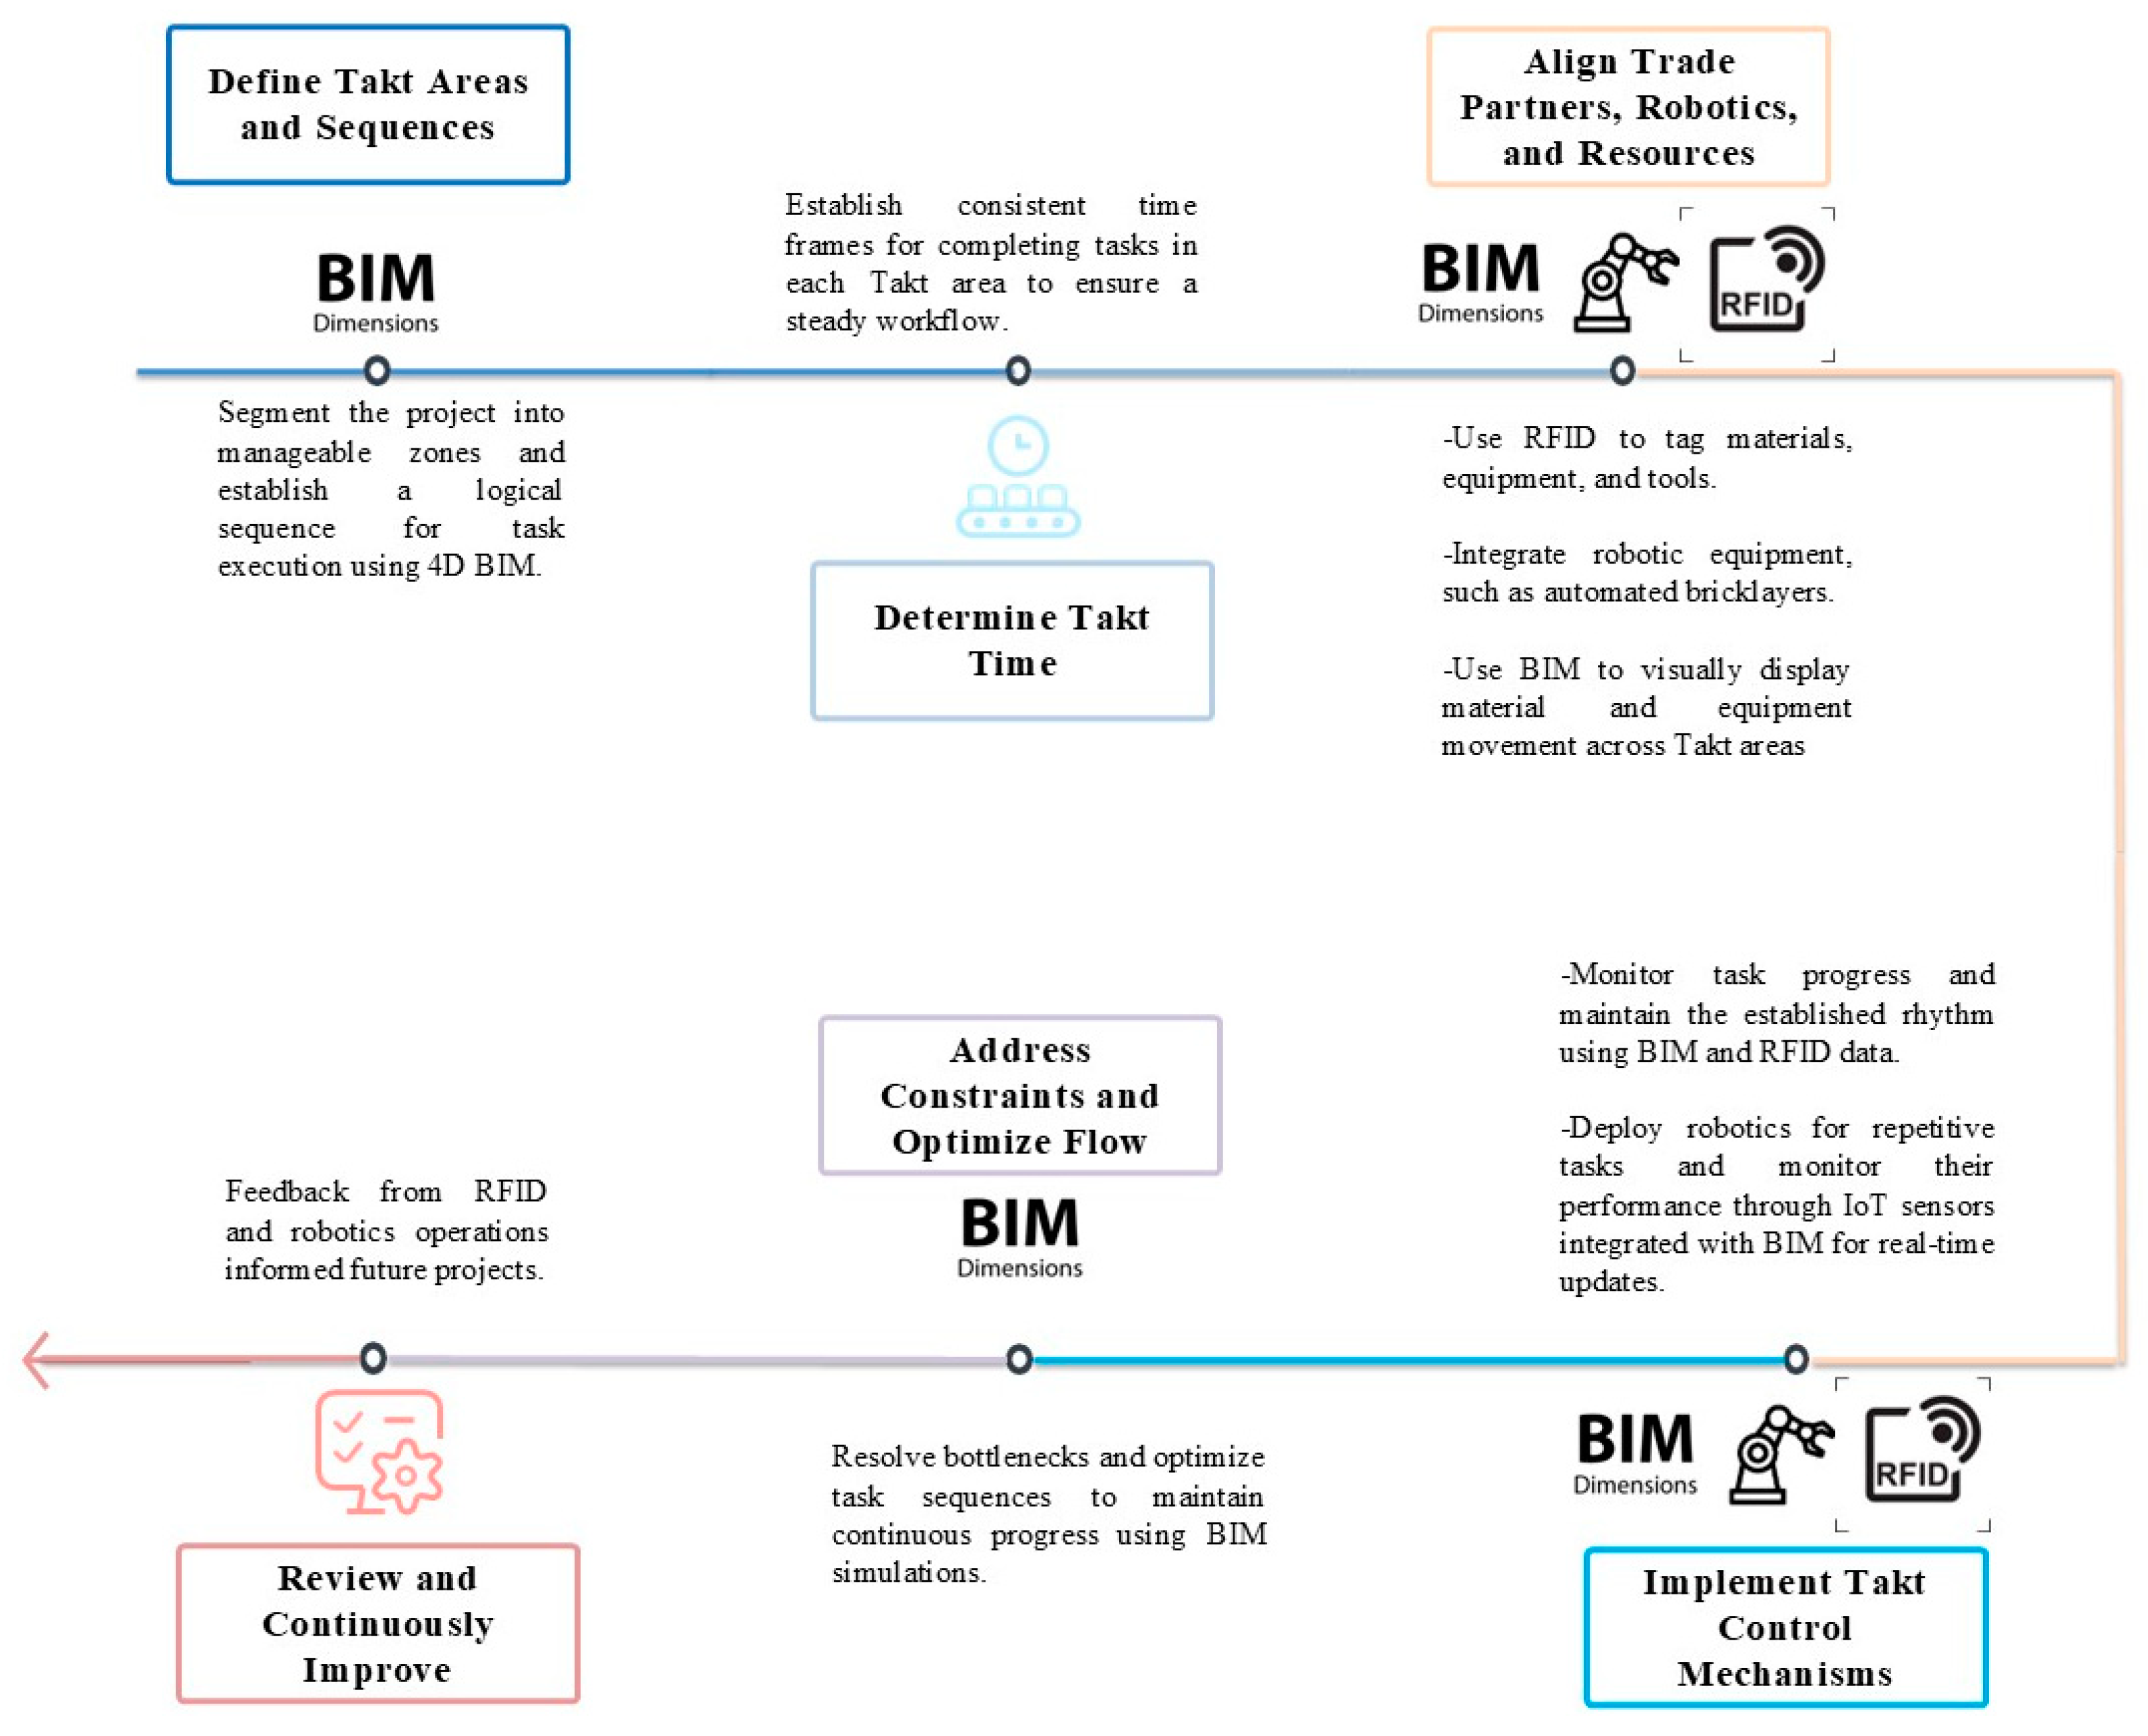
Takt Planning and Control in the Author Construction Site Logistics Model
Figure A11 presents the implementation of Takt Planning and Control, integrating Robotics, RFID, and BIM for workflow synchronization and real-time monitoring [90]. BIM visualizes logistics and task progress, while RFID and robotics data support continuous optimization, enhancing efficiency, reducing waste, and improving collaboration across trades. The process begins with Defining Takt Areas and Sequences using BIM to segment work zones and plan robotic tasks. Determining Takt Time uses BIM simulations to set task durations based on robotics and trade requirements. Aligning Resources ensures RFID-tracked materials and equipment are synchronized with the Takt plan, supported by BIM dashboards. Implementing Control Mechanisms uses real-time RFID and IoT data to track progress and ensure schedule adherence. Addressing Constraints applies analytics to resolve bottlenecks and optimize flow. Review and Continuous Improvement leverages BIM and RFID data with stakeholder feedback to refine strategies. KPI benefits include improved time efficiency, resource utilization, and process optimization through automation and real-time tracking. Stakeholder collaboration improves via transparent progress monitoring, while waste reduction is achieved by minimizing idle time and material waste.
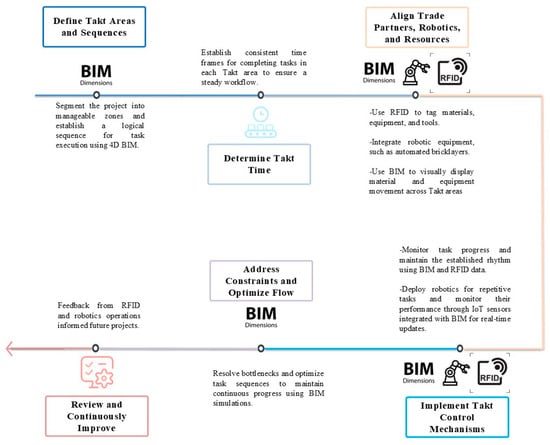
Figure A11.
Takt Planning and Control with Robotics, RFID, and BIM Integration.
Figure A11.
Takt Planning and Control with Robotics, RFID, and BIM Integration.
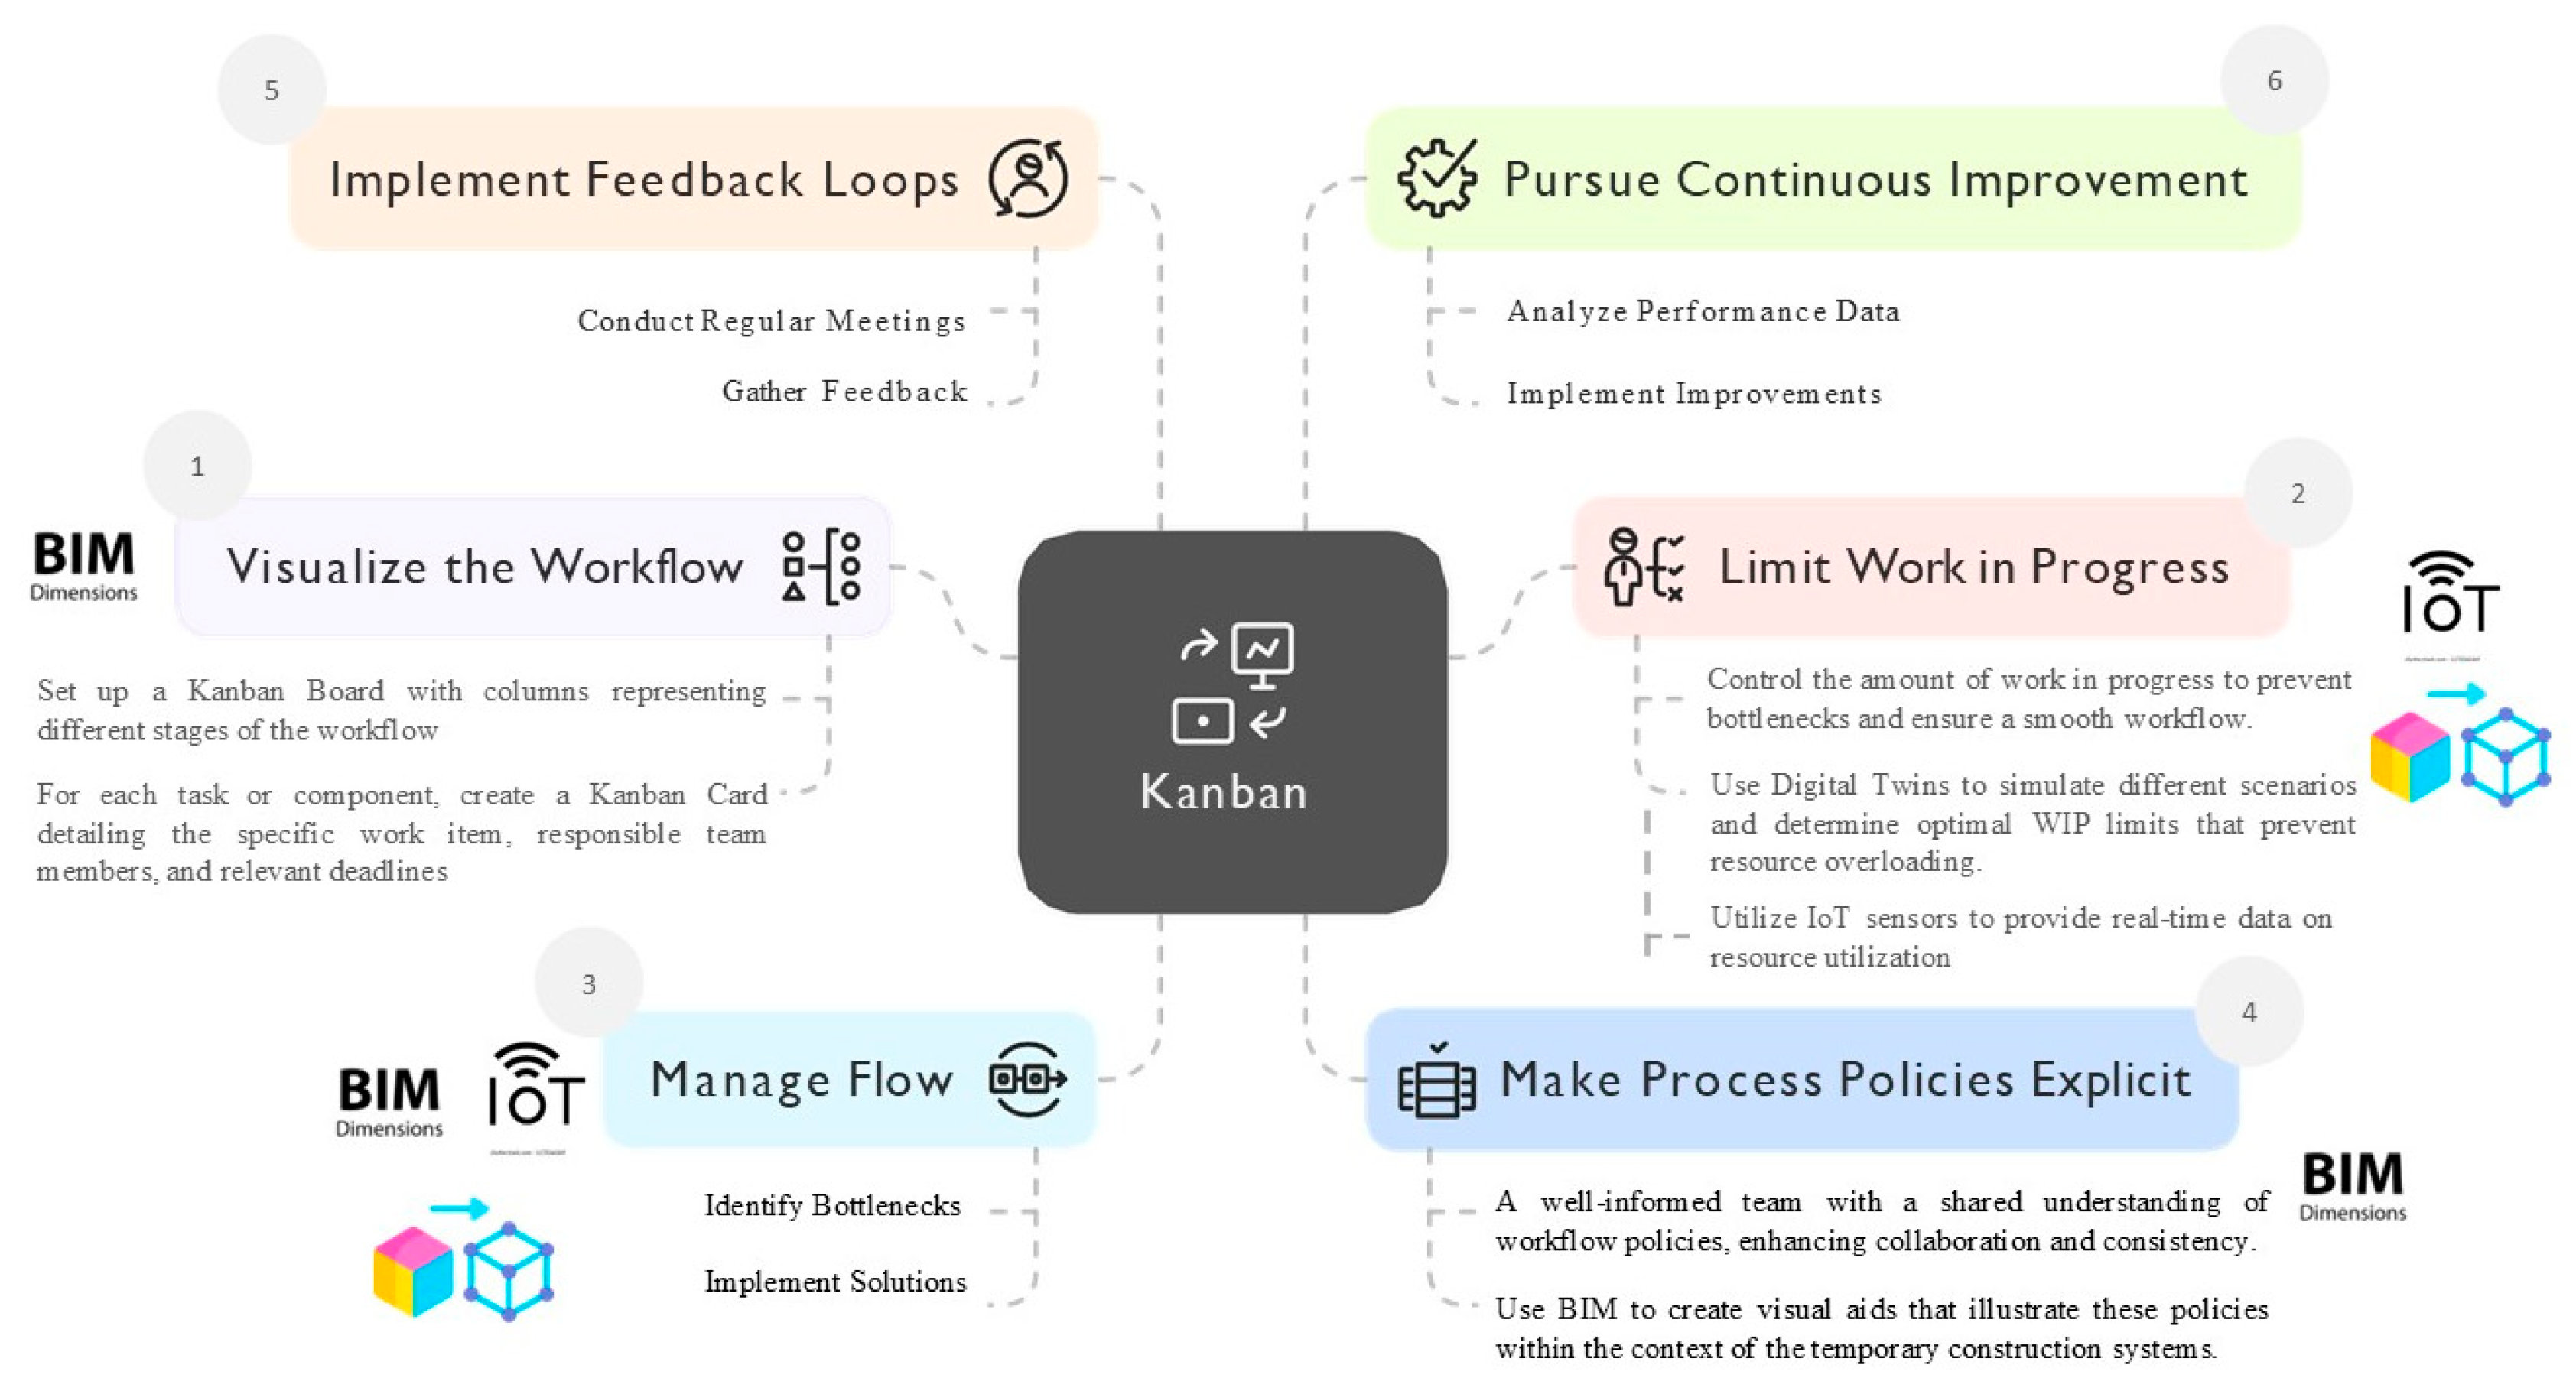
Kanban in Author Temporary Construction Systems Model
Figure A12 demonstrates the application of Kanban to optimize temporary construction systems by integrating BIM for workflow visualization, IoT for real-time monitoring, and Digital Twins for predictive analysis and improvement [91]. This process, from workflow visualization to setting work-in-progress (WIP) limits and applying feedback loops, ensures efficient task management, minimizes delays, and promotes stakeholder collaboration. Visualizing the Workflow uses Kanban boards to organize tasks across phases such as design, assembly, and dismantling, with BIM linking each to the model. IoT sensors update Kanban cards with real-time structural and environmental data. WIP Limits are set using Digital Twin simulations to balance workloads and prevent bottlenecks, with IoT adjusting limits based on real-time resource use. Managing Flow relies on Kanban and IoT to identify and resolve issues like material or equipment delays, supported by BIM simulations. Documenting Process Policies ensures consistency through BIM visual aids and team training. Feedback Loops incorporate IoT and Digital Twin insights for continuous workflow optimization. Continuous Improvement adjusts WIP limits and tests new strategies in Digital Twins before implementation. KPI benefits include improved time efficiency by minimizing task backlogs, enhanced productivity through real-time monitoring, better process optimization using Digital Twins, and increased collaboration through clear visualization and monitoring. Waste reduction is achieved by streamlining workflows and optimizing material and equipment use.
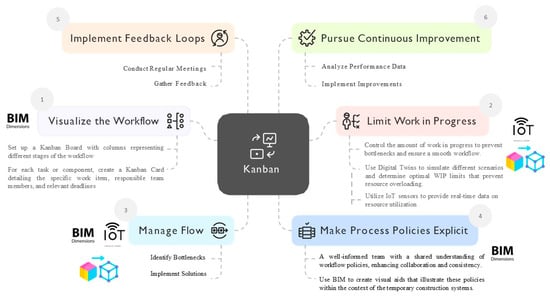
Figure A12.
Kanban for temporary construction systems using BIM, IoT, and Digital Twins.
Figure A12.
Kanban for temporary construction systems using BIM, IoT, and Digital Twins.
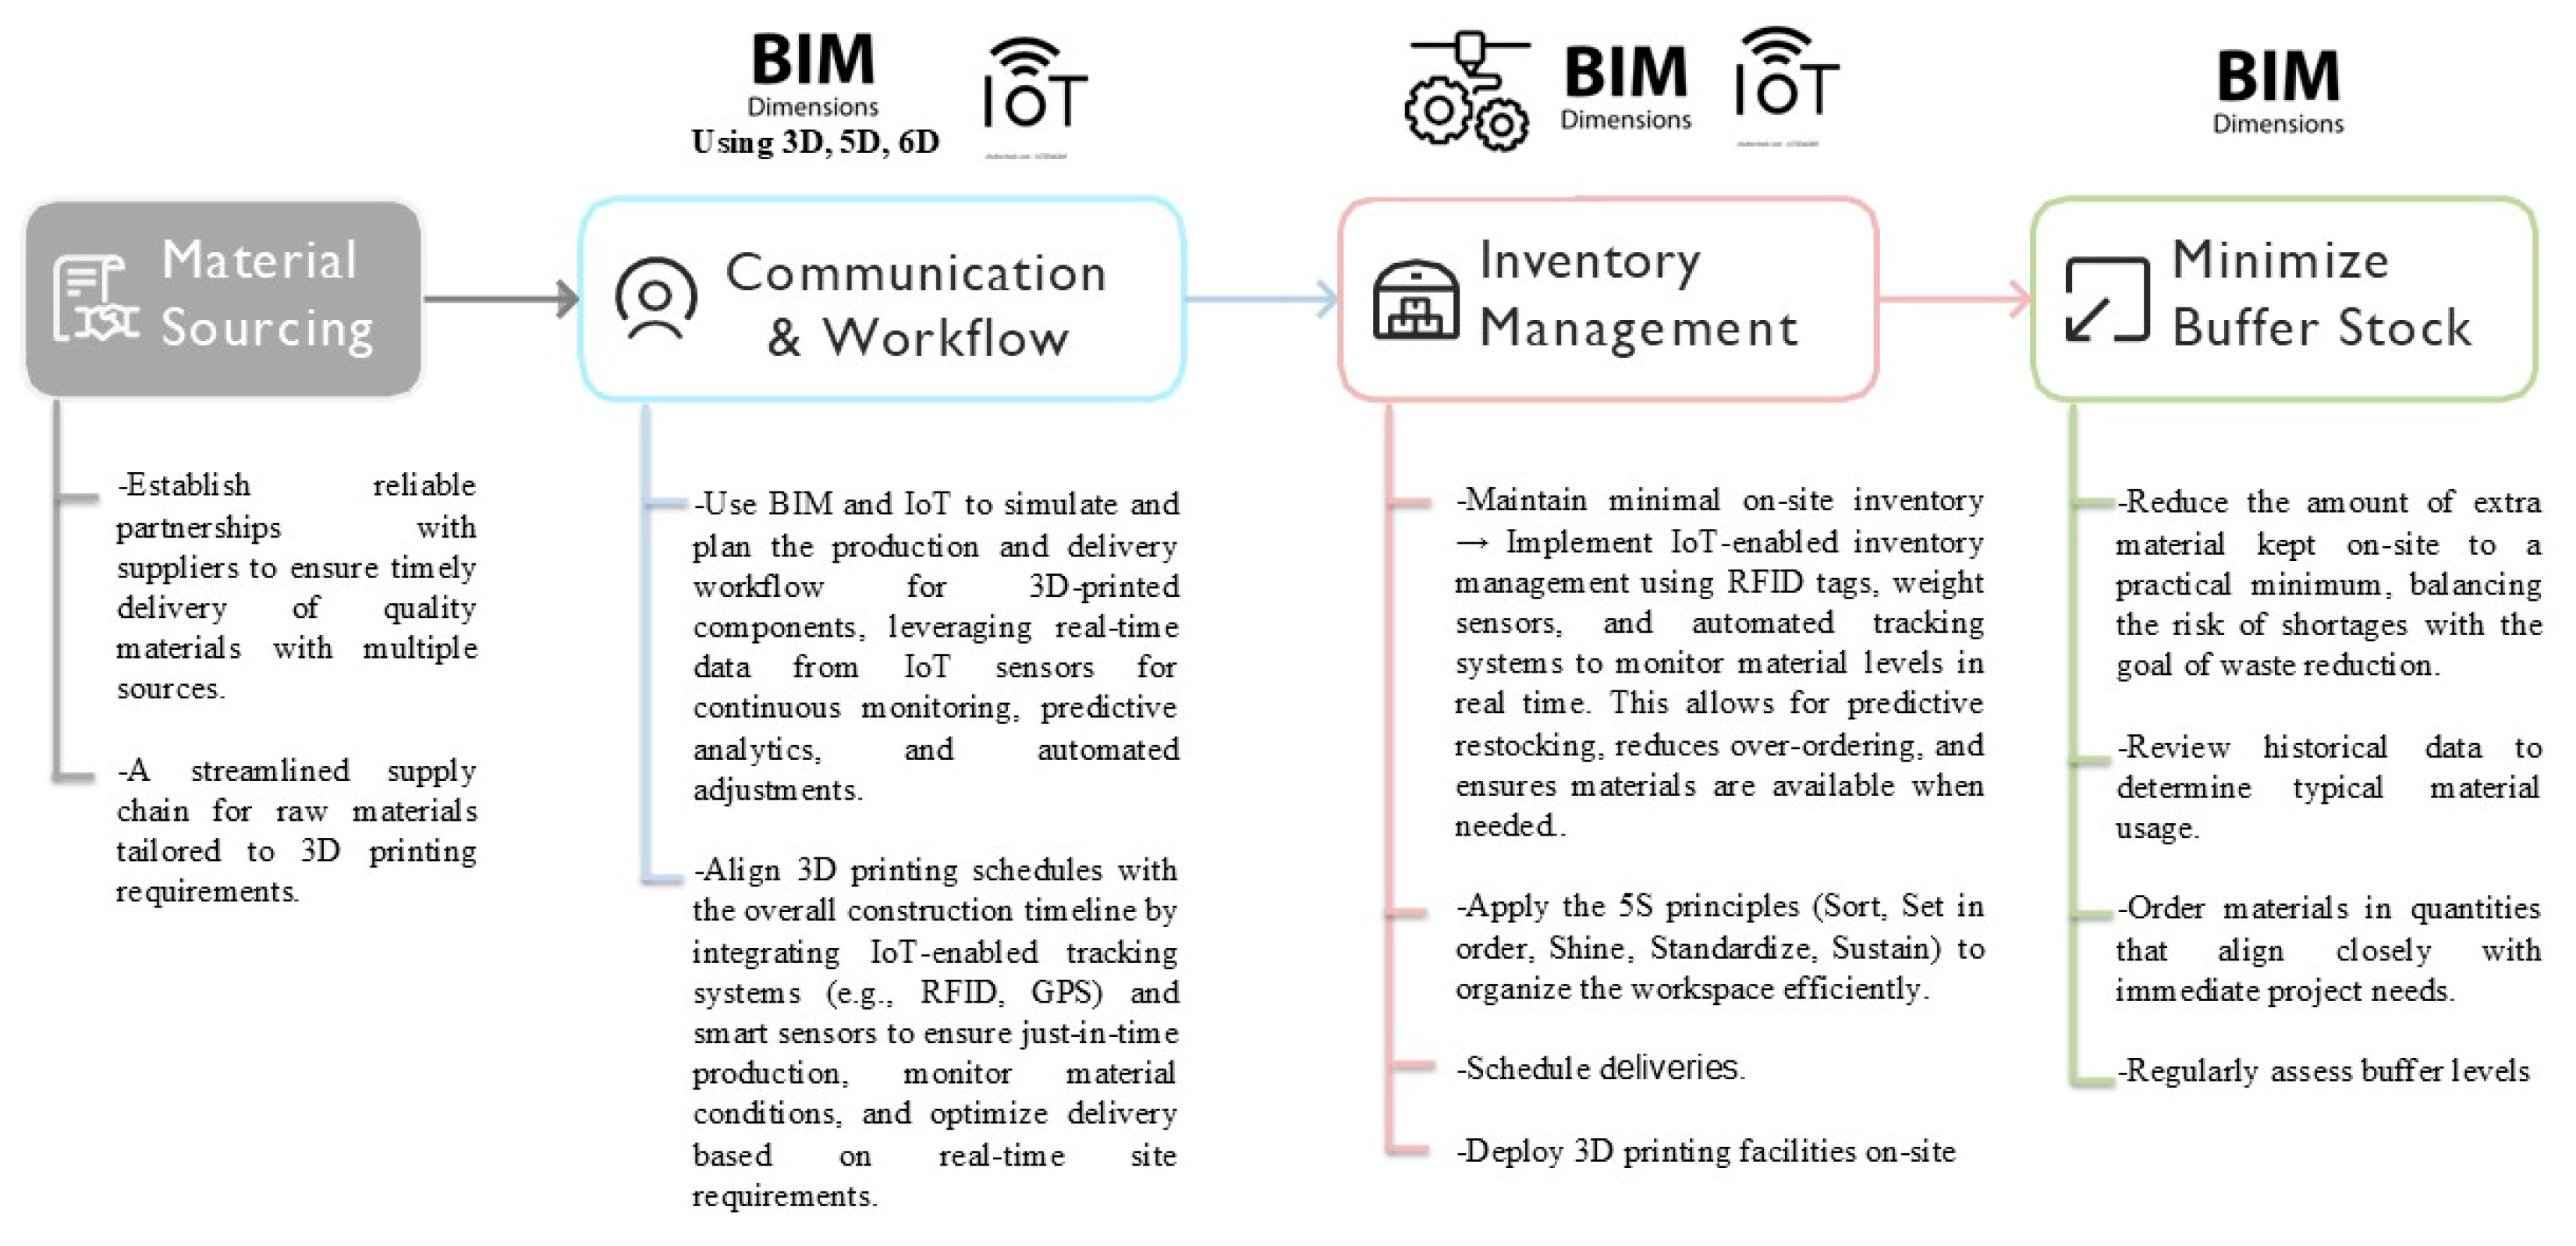
Just-in-Time in Fabricating Products
Figure A13 presents the integration of Just-in-Time (JIT) principles with 3D printing/offsite construction, IoT, and BIM to improve production and delivery efficiency in construction [92]. The process ensures on-demand fabrication, optimized material sourcing, and timely delivery. IoT sensors and RFID enable the real-time tracking of materials, machine performance, and environmental conditions. BIM (3D, 5D, 6D) supports workflow planning and visualization, while IoT data enable predictive maintenance and automated supply chain management. IoT-monitored 3D printing ensures accurate, waste-free production with automated alerts for replenishment and quality control. KPI impacts include improved time efficiency through on-demand production and automated inventory management. Cost savings result from reduced waste and minimized handling costs via IoT analytics. Productivity is enhanced through precise scheduling and real-time asset tracking. Process optimization benefits from BIM planning and IoT logistics monitoring. Finally, stakeholder collaboration improves through real-time dashboards and streamlined coordination.
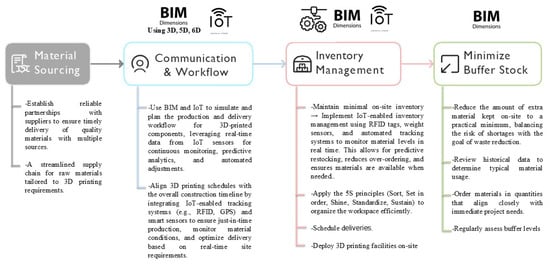
Figure A13.
Just-in-Time with 3D printing integration for construction efficiency.
Figure A13.
Just-in-Time with 3D printing integration for construction efficiency.
Kanban in Layout Construction Work
Figure A14 presents the Kanban-based workflow for managing construction layout activities by integrating 3D/4D BIM for planning, Kanban for task management, and AR/VR/MR technologies for spatial accuracy and real-time adjustments [91]. The process starts with visualizing tasks on Kanban boards (e.g., foundation marking and utility installation) linked to BIM models for precise placement. Limiting Work in Progress (WIP) ensures balanced workloads, supported by AR for real-time tracking. Flow management uses Kanban and AR/VR to detect and resolve bottlenecks, with MR simulations aiding in planning. Process standardization ensures team alignment through BIM-displayed policies. Feedback loops via daily standups and AR/VR reviews allow continuous task adjustments. Continuous improvement leverages BIM and Kanban metrics, supported by the MR testing of new layout strategies.

Figure A14.
Kanban for construction layout with BIM, AR, VR, and MR integration.
Figure A14.
Kanban for construction layout with BIM, AR, VR, and MR integration.
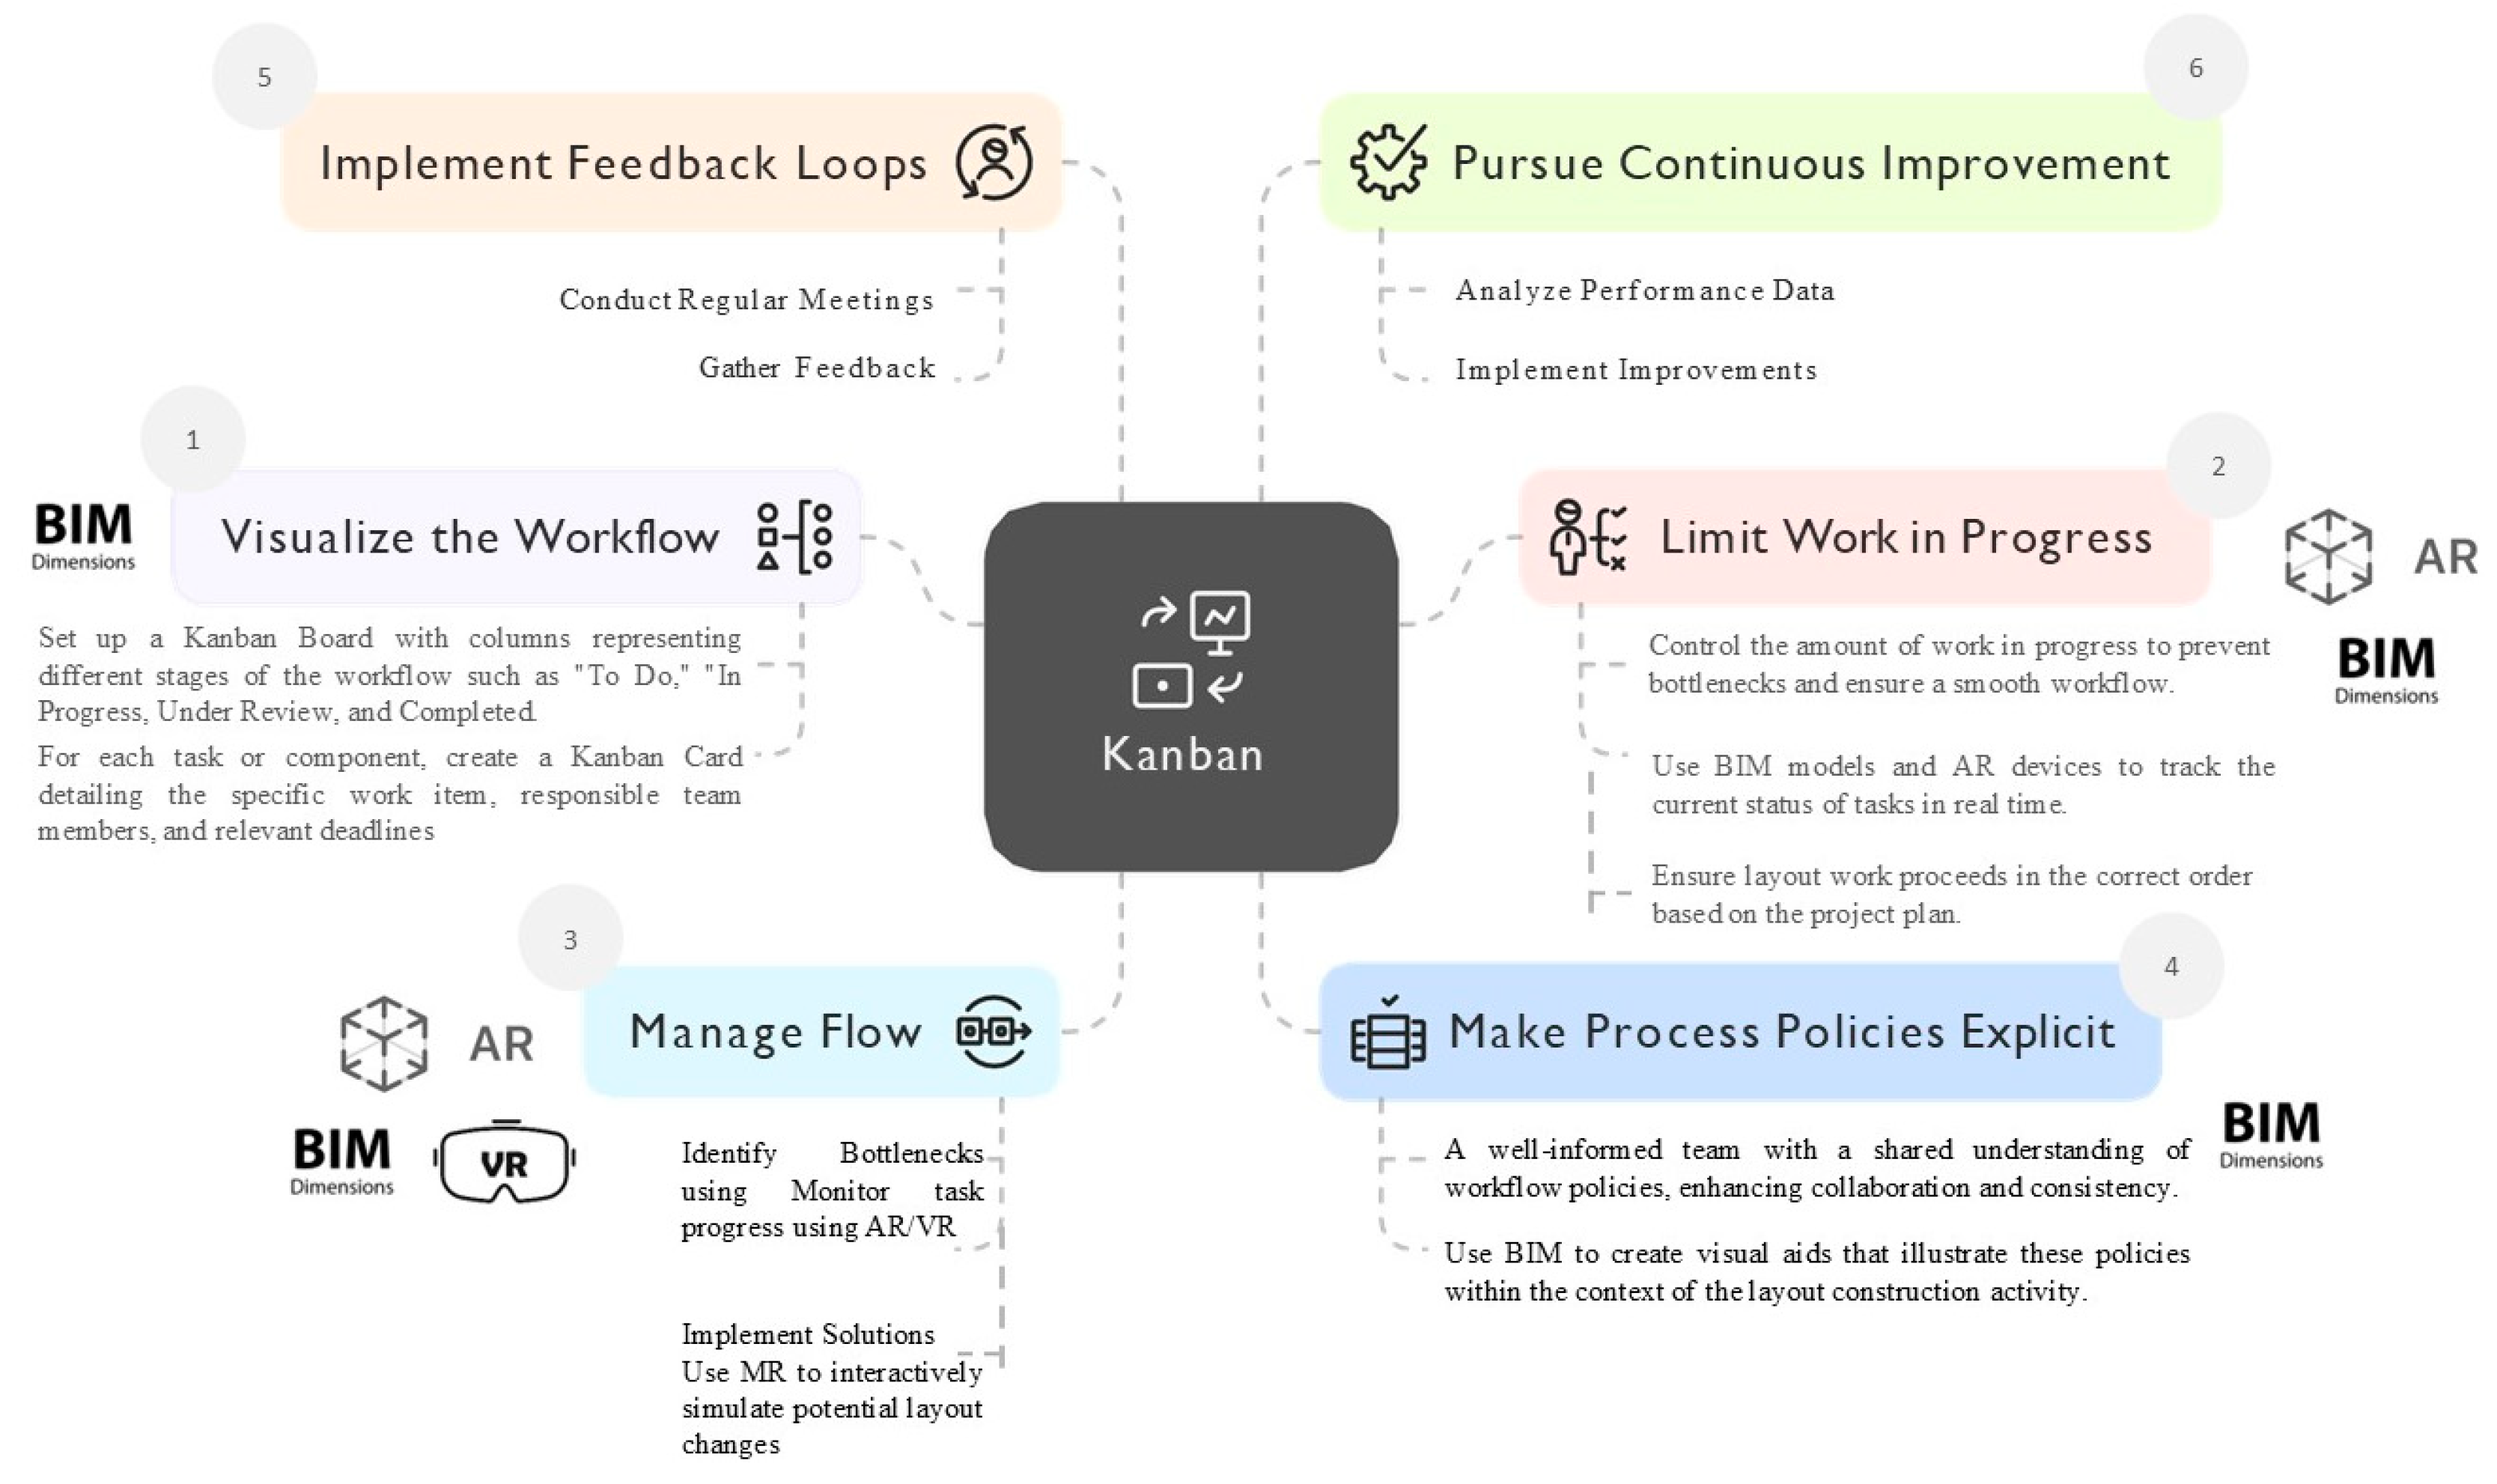
KPI impacts include improved time efficiency through real-time tracking and optimized sequencing, productivity through dynamic resource management, and process optimization via MR simulations. Stakeholder collaboration improves with enhanced visualization and feedback loops, while waste reduction is achieved by minimizing rework and material misallocation.
Appendix A.1.4. Operation Phase
This subsection describes the framework’s applicability during the Operation Phase, with each stage elaborated sequentially according to the corresponding rows in Table 7.
Kaizen-Driven Maintenance, System Performance, and Space Utilization
The diagram shows a Kaizen-driven process for optimizing maintenance, system performance, and space utilization through the integration of BIM, IoT, Digital Twins, and Big Data Analytics [88].
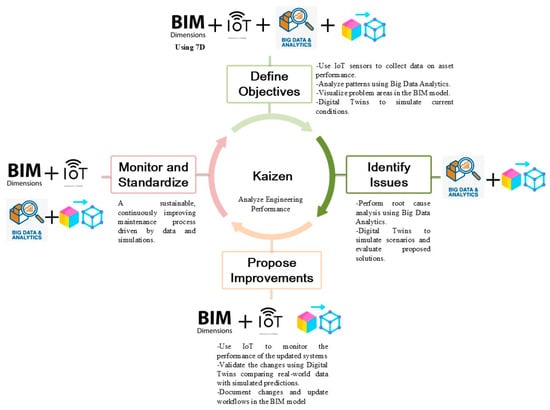
Figure A15.
Kaizen-driven maintenance, system performance, and space utilization using IoT, Digital Twins, and Big Data Analytics.
Figure A15.
Kaizen-driven maintenance, system performance, and space utilization using IoT, Digital Twins, and Big Data Analytics.
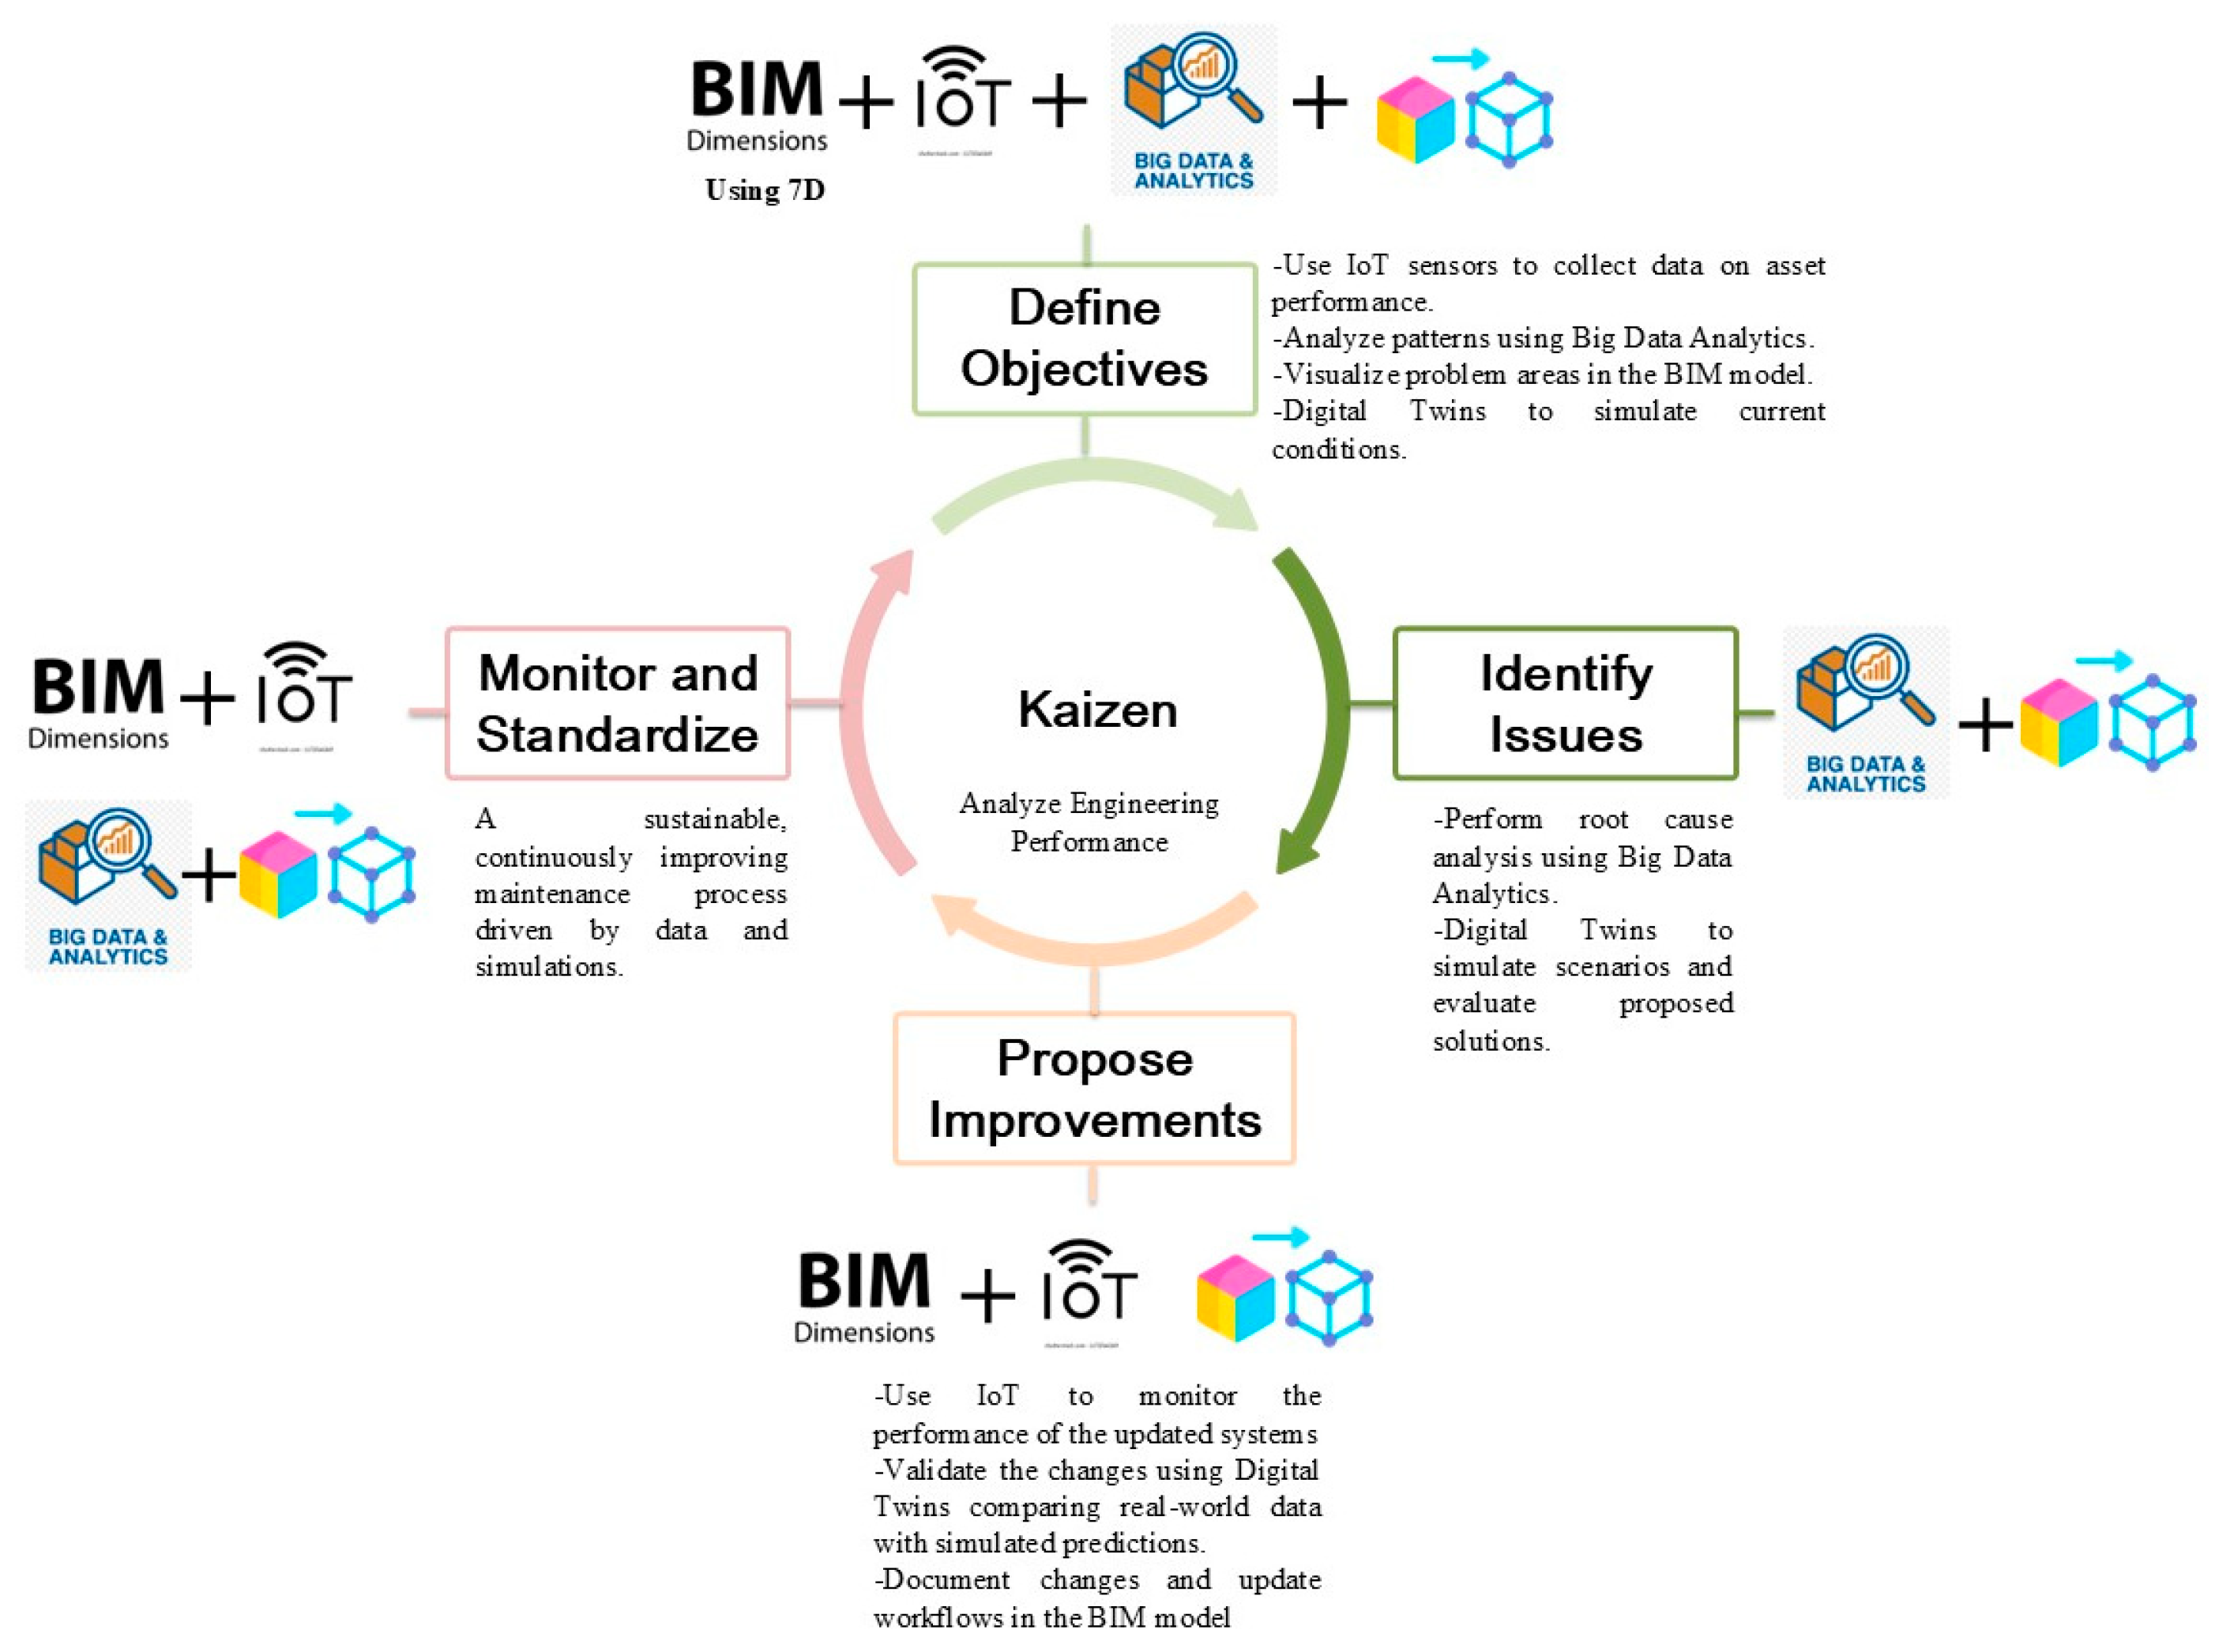
The process begins with problem identification, where IoT sensors and data analytics monitor real-time performance (e.g., temperature, energy, and vibration), while BIM and Digital Twins visualize issues for team review. In analyzing and planning solutions, simulations test root causes and proposed improvements, such as optimized maintenance schedules, which are integrated into BIM for team coordination. Implementation and testing involve applying these solutions, reconfiguring workflows, and validating results through Digital Twin simulations and real-time IoT tracking. Monitoring and continuous improvement follow, using ongoing data analysis and Digital Twin updates to refine processes and standardize successful practices in BIM-based protocols. KPI impacts include improved process optimization through predictive analytics and IoT monitoring, enhanced productivity through reduced downtime, and cost savings from fewer equipment failures. Stakeholder collaboration is strengthened by BIM-integrated feedback loops, while waste reduction is achieved by streamlining maintenance and improving energy efficiency.
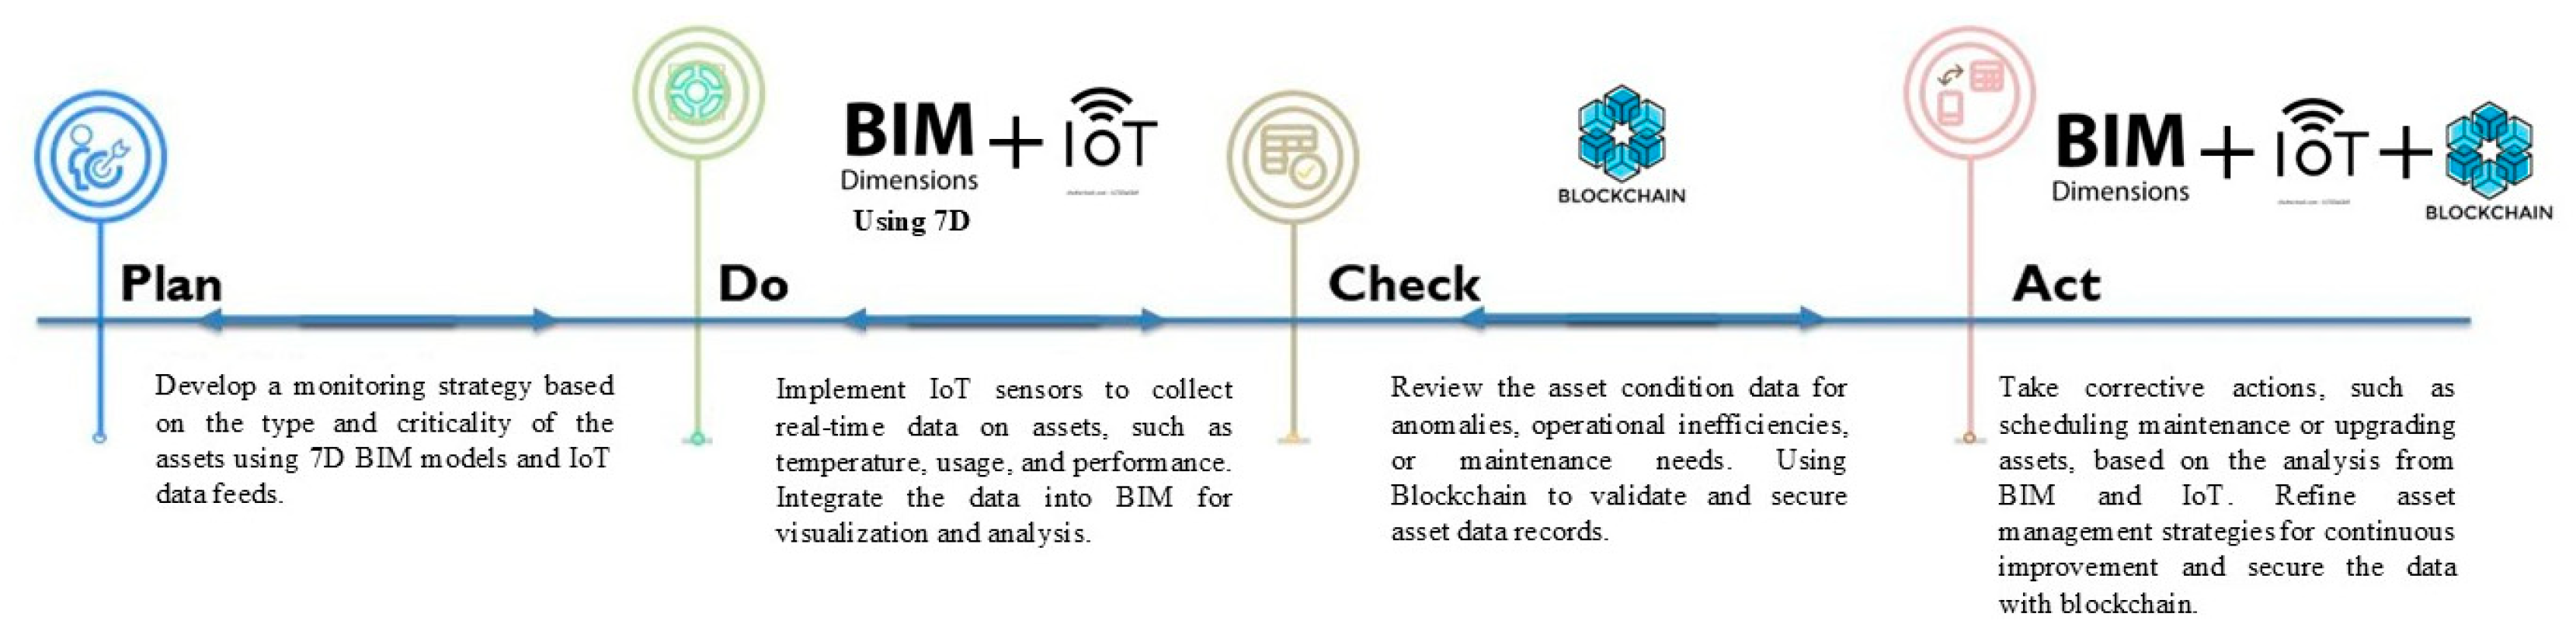
PDCA in Asset Monitoring
The diagram presents the application of the PDCA (Plan-Do-Check-Act) cycle for asset monitoring, which can also support emergency management by integrating BIM, IoT, and Blockchain technologies to improve decision making, operational efficiency, and data security [86]. The process starts with Plan, where BIM is used to map assets, define specifications, and deploy IoT sensors for monitoring conditions such as temperature and vibration. Blockchain is established to securely record asset data. In Do, IoT sensors stream real-time data to BIM for visual asset monitoring, with Blockchain ensuring secure, tamper-proof records. In Check, Big Data Analytics evaluate IoT data to detect trends and risks, while BIM benchmarks asset conditions and Blockchain verifies data integrity for accountability. Act involves applying predictive maintenance, updating BIM models with revised schedules, and logging actions on Blockchain to support continuous improvement. KPI outcomes include enhanced process optimization through automated monitoring and secured data management, improved productivity by reducing downtime, cost savings from preventive maintenance, and strengthened quality and safety through early issue detection. Stakeholder satisfaction benefits from improved transparency and reliable data secured by Blockchain and BIM-integrated dashboards.
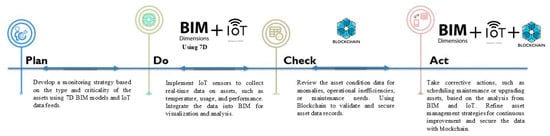
Figure A16.
PDCA for asset monitoring using IoT and Blockchain.
Figure A16.
PDCA for asset monitoring using IoT and Blockchain.
References
- Alsharef, A.; Ovid, A.; Uddin, S.M.J.; Albert, A. Biggest Challenges Facing the Construction Industry. In Construction Research Congress 2024, CRC 2024; American Society of Civil Engineers (ASCE): Reston, VA, USA, 2024; pp. 652–660. [Google Scholar] [CrossRef]
- Basar, O.; Basar, P. Challenges in construction industry. Pressacademia 2023, 17, 196–197. [Google Scholar] [CrossRef]
- Mahesh Babu, P.; Pedro, L.; GhaffarianHoseini, A. Construction projects: Interactions of the causes of delays. Smart Sustain. Built Environ. 2024. ahead-of-print. [Google Scholar] [CrossRef]
- Moreno, F.; Forcael, E.; Romo, R.; Orozco, F.; Moroni, G.; Baesler, F. Agile Project Management in the Pre-Construction Stage: Facing the Challenges of Projectification in the Construction Industry. Buildings 2024, 14, 3551. [Google Scholar] [CrossRef]
- Coccolini, D.; Alvise Bragadin, M.; Kähkönen, K. Implementation of lean construction in Finland. In Proceedings of the 2023 European Conference on Computing in Construction and the 40th International CIB W78 Conference, Heraklion, Greece, 10–12 July 2023. [Google Scholar] [CrossRef]
- Miao, C.; Wang, H.; Meng, X.; Hou, X.; Yan, Y.; Liu, S.; He, Y. BIM-Supported Knowledge Collaboration: A Case Study of a Highway Project in China. Sustainability 2024, 16, 9074. [Google Scholar] [CrossRef]
- Maali, O.; Ko, C.H.; Nguyen, P.H.D. Applications of existing and emerging construction safety technologies. Autom. Constr. 2024, 158, 105231. [Google Scholar] [CrossRef]
- Alnajjar, O.; Castillo, E.A.; Turmo, J. A Systematic Review of Lean Construction, BIM and Emerging Technologies Integration: Identifying Key Tools. Manuscript Submitted for Publication (Under Review). 2024. [Google Scholar]
- Araya-Santelices, P.; Grande, Z.; Atencio, E.; Lozano-Galant, J.A. Bridge Management with AI, UAVs, and BIM. Autom. Constr. 2025, 175, 106170. [Google Scholar] [CrossRef]
- Galaz-Delgado, E.I.; Herrera, R.F.; Atencio, E.; La Rivera, F.M.; Biotto, C.N. Problems and challenges in the interactions of design teams of construction projects: A bibliometric study. Buildings 2021, 11, 461. [Google Scholar] [CrossRef]
- Peffers, K.; Tuunanen, T.; Rothenberger, M.A.; Chatterjee, S. A design science research methodology for information systems research. J. Manag. Inf. Syst. 2007, 24, 45–77. [Google Scholar] [CrossRef]
- Gledson, B.; Zulu, S.L.; Saad, A.M.; Ponton, H. Digital leadership framework to support firm-level digital transformations for Construction 4.0. Constr. Innov. 2024, 24, 341–364. [Google Scholar] [CrossRef]
- Wickramasekara, A.N.; Gonzalez, V.A.; O’Sullivan, M.; Walker, C.G.; Abdelmegid, M.A. Exploring Controlled Experimental Settings for Lean Construction Research. In Proceedings of the IGLC 2021—29th Annual Conference of the International Group for Lean Construction—Lean Construction in Crisis Times: Responding to the Post-Pandemic AEC Industry Challenges, Department of Engineering, Civil Engineering Division, Pontificia Universidad Catolica del Peru, Lima, Peru, 14–17 July 2021; pp. 177–186. [Google Scholar] [CrossRef]
- Dakhli, Z.; Lafhaj, Z. Experimental and numerical prototyping of a complex cement column formwork for construction. Archit. Eng. Des. Manag. 2017, 13, 147–165. [Google Scholar] [CrossRef]
- Senanayake, G.; Hadiwattage, C.; Perera, K. Assuring Sustainable Construction at Project Inception Stage: A Project Feasibility Evaluation Criteria. Bhumi Plan. Res. J. 2023, 10, 51–68. [Google Scholar] [CrossRef]
- Darabseh, M. Lean applications in construction: Review article. U.Porto J. Eng. 2019, 5, 29–37. [Google Scholar] [CrossRef]
- Uvarova, S.S.; Orlov, A.K.; Kankhva, V.S. Ensuring Efficient Implementation of Lean Construction Projects Using Building Information Modeling. Buildings 2023, 13, 770. [Google Scholar] [CrossRef]
- Schimanski, C.P.; Pradhan, N.L.; Chaltsev, D.; Pasetti Monizza, G.; Matt, D.T. Integrating BIM with Lean Construction approach: Functional requirements and production management software. Autom. Constr. 2021, 132, 103969. [Google Scholar] [CrossRef]
- Garcés, G.; Forcael, E.; Osorio, C.; Castañeda, K.; Sánchez, O. Systematic Review of Lean Construction: An Approach to Sustainability and Efficiency in Construction Management. J. Infrastruct. Preserv. Resil. 2025, 6, 6. [Google Scholar] [CrossRef]
- Ibrahim, A.; Zayed, T.; Lafhaj, Z. Bridging Barriers to Lean Construction Adoption in Megaprojects: A Data-Driven Contribution to Sustainable Development Using SEM. Environ. Dev. Sustain. 2025, 1–50. [Google Scholar] [CrossRef]
- Mounla, K.E.L.; Beladjine, D.; Beddiar, K.; Mazari, B. Lean-BIM Approach for Improving the Performance of a Construction Project in the Design Phase. Buildings 2023, 13, 1447–1474. [Google Scholar] [CrossRef]
- Gerber, D.J.; Becerik-Gerber, B.; Kunz, A. Building Information Modeling and Lean Construction: Technology, Methodology and Advances from Practice. In Proceedings of the IGLC-18, Technion, The International Group for Lean Construction, Haifa, Israel, 14–16 July 2010. [Google Scholar]
- Onyango, A.F. Interaction between Lean Construction and BIM: How effectiveness in production can be improved if lean and BIM are combined in the design phase A literature review. Rochester Inst. Technol. 2016. [Google Scholar]
- Saieg, P.; Sotelino, E.D.; Nascimento, D.; Caiado, R.G.G. Interactions of Building Information Modeling, Lean and Sustainability on the Architectural, Engineering and Construction industry: A systematic review. J. Clean. Prod. 2018, 174, 788–806. [Google Scholar] [CrossRef]
- Andújar-Montoya, M.D.; Galiano-Garrigós, A.; Rizo-Maestre, C.; Echarri-Iribarren, V. Bim and lean construction interactions: A state-of-the-art review. In WIT Transactions on the Built Environment; WIT Press: Southampton, UK, 2019; pp. 1–13. [Google Scholar] [CrossRef]
- Koskela, L.J. Application of the New Production Philosophy to Construction. 2018. Available online: https://www.researchgate.net/publication/243781224 (accessed on 21 January 2025).
- Luna, A.; Herrera, R.F.; Castañeda, K.; Atencio, E.; Biotto, C. Benefits and Limitations of Lean Tools in the Building Design Process: A Functional and Comparative Analysis. Appl. Sci. 2025, 15, 5137. [Google Scholar] [CrossRef]
- Erikshammar, J.J.; Lu, W.; Stehn, L.; Olofsson, T. Discrete Event Simulation Enhanced Value Stream Mapping: An Industrialized Construction Case Study. Lean Constr. J. 2013, 2013, 47–65. Available online: https://www.ltu.se/ (accessed on 19 April 2024).
- Olender, M.; Rosen, A. Target Sustainability Design-Application of sustainability to the target value design method. J. Für Integr. Plan. Bau. Und Betreiben 2023, 1. [Google Scholar] [CrossRef]
- Martins, D.N.C.; Abilio, D.; Teles, W.d.S.; da Silva, M.C.; Silva, M.D.S.; Junior, L.A.V.; Andrade, M.N.; Oliveira, F.K.F.; Andrade, Á.N.M.; Silva, A.P.B.P. Aplicação da ferramenta PDCA: Um estudo de caso no setor de telefonia da secretaria municipal de saúde do nordeste do Brasil. Res. Soc. Dev. 2024, 13, e7813946888. [Google Scholar] [CrossRef]
- Stevens, M.; Eghbaljoo, A.; Thevissen, F. A Kaizen Event Enabled by System Engineering in an Infrastructure Project. In Proceedings of the 31st Annual Conference of the International Group for Lean Construction (IGLC31), International Group for Lean Construction, Lille, France, 26 June–2 July 2023; pp. 1451–1462. [Google Scholar] [CrossRef]
- Lamdjad, I.; Alfalahi, B.O.S. Total Quality Management (TQM) for the development of future smart and integrated cities and sustainable development. J. Infrastruct. Policy Dev. 2024, 8, 8456. [Google Scholar] [CrossRef]
- Pedo, B.; Koskela, L.; Tzortzopoulos, P.; Tezel, A.; Robinson, S. Visual Management (VM) supporting collaborative practices in infrastructure engineering design. IOP Conf. Ser. Earth Environ. Sci. Inst. Phys. 2022, 1101, 052012. [Google Scholar] [CrossRef]
- Kozlovská, M.; Klosova, D. Influence of Takt Time Planning on Construction Efficiency. IOP Conf. Ser. Mater. Sci. Eng. 2022, 1252, 012044. [Google Scholar] [CrossRef]
- Rivera-Gomez, H.; Sanchez-Partida, D.; Ortega-Reyes, A.O.; Gonzalez-Hernandez, I.J. Optimizing JIT production and maintenance strategies for material management in the presence of quality decline and random demand fluctuations. Acta Logist. 2024, 11, 281–292. [Google Scholar] [CrossRef]
- Anzules, M.C.; Moya, E.J.G. Kanban: Una metodología ágil para la gestión eficiente del flujo de trabajo en el desarrollo de software, una revisión sistemática. Rev. Ingenio Glob. 2024, 3, 17–28. [Google Scholar] [CrossRef]
- Mazur, M.; Korenko, M.; Žitňák, M.; Shchur, T.; Kiełbasa, P.; Dostál, P.; Dzhidzhora, O.; Idzikowski, A. Implementation and Benefits of the 5s Method in Improving Workplace Organisation—A Case Study. Manag. Syst. Prod. Eng. 2024, 32, 498–507. [Google Scholar] [CrossRef]
- Elmosalmi, D. Implementing the Last Planner System in a Design Project. Int. Conf. Civ. Infrastruct. Constr. 2023, 9, 2835–2845. [Google Scholar] [CrossRef]
- Nguyen, T.D.; Adhikari, S. The Role of BIM in Integrating Digital Twin in Building Construction: A Literature Review. Sustainability 2023, 15, 10462. [Google Scholar] [CrossRef]
- PennState College of Engineering. BIM Uses. 2024. Available online: https://bim.psu.edu/uses/ (accessed on 31 October 2024).
- Babu, P.R.S.; Babu, N.H. Using technology to achieve lean objectives. In Proceedings of the IGLC 2018—Proceedings of the 26th Annual Conference of the International Group for Lean Construction: Evolving Lean Construction Towards Mature Production Management Across Cultures and Frontiers, The International Group for Lean Construction, Chennai, India, 18–22 July 2018; pp. 1069–1078. [Google Scholar] [CrossRef]
- McHugh, K.; Koskela, L.; Tezel, A. Reality Capture Connecting Project Stakeholders. In Proceedings of the IGLC 2021—29th Annual Conference of the International Group for Lean Construction—Lean Construction in Crisis Times: Responding to the Post-Pandemic AEC Industry Challenges, Department of Engineering, Civil Engineering Division, Pontificia Universidad Catolica del Peru, Lima, Peru, 14–17 July 2021; pp. 737–746. [Google Scholar] [CrossRef]
- Lin, J.J.; Golparvar-Fard, M. Construction Progress Monitoring Using Cyber-Physical Systems. In Cyber-Physical Systems in the Built Environment; Springer International Publishing: Berlin/Heidelberg, Germany, 2020; pp. 63–87. [Google Scholar] [CrossRef]
- Piras, G.; Muzi, F.; Tiburcio, V.A. Digital Management Methodology for Building Production Optimization through Digital Twin and Artificial Intelligence Integration. Buildings 2024, 14, 72110. [Google Scholar] [CrossRef]
- Mbabu, A.; Underwood, J.; Munir, M. A lean strategic FM service model based on the digital twin. In EWork and EBusiness in Architecture, Engineering and Construction—Proceedings of the 14th European Conference on Product and Process Modelling, ECPPM 2022; CRC Press/Balkema: Boca Raton, FL, USA, 2023; pp. 242–249. [Google Scholar] [CrossRef]
- Sepasgozar, S.M.E.; Hui, F.K.P.; Shirowzhan, S.; Foroozanfar, M.; Yang, L.; Aye, L. Lean practices using building information modeling (Bim) and digital twinning for sustainable construction. Sustainability 2021, 13, 161. [Google Scholar] [CrossRef]
- Rivera, F.M.-L.; Mora-Serrano, J.; Valero, I.; Oñate, E. Methodological-Technological Framework for Construction 4.0. Arch. Comput. Methods Eng. 2021, 28, 689–711. [Google Scholar] [CrossRef]
- Chen, Q.; Feng, H.; de Soto, B.G. Revamping construction supply chain processes with circular economy strategies: A systematic literature review. J. Clean. Prod. 2022, 335, 130240. [Google Scholar] [CrossRef]
- Doukari, O.; Seck, B.; Greenwood, D. The Creation of Construction Schedules in 4D BIM: A Comparison of Conventional and Automated Approaches. Buildings 2022, 12, 1145. [Google Scholar] [CrossRef]
- Owais, O.A.; Poshdar, M.; Bidhendi, A.; Jaafar, K.; Sarhan, S. From Concept to Concrete: Digital Twins Enabling Different Levels of Lean Construction. In Proceedings of the 32nd Annual Conference of the International Group for Lean Construction (IGLC 32), International Group for Lean Construction, Auckland, New Zealand, 1–5 July 2024; pp. 767–779. [Google Scholar] [CrossRef]
- Araújo, C.S.; Costa, D.B.; Corrêa, F.R.; Ferreira, E.d.A.M. Digital Twins and Lean Construction: Challenges for Future Practical Applications. In Proceedings of the 30th Annual Conference of the International Group for Lean Construction, IGLC 2022, The International Group for Lean Construction, Edmonton, Canada, 25–31 July 2022; pp. 235–246. [Google Scholar] [CrossRef]
- Mbabu, A.; Underwood, J.; Munir, M. The Bim Maturity Process to the Digital Twin for Lean Strategic Facility Management. In Proceedings of the European Conference on Computing in Construction and the 40th International CIB W78 Conference, Heraklion, Greece, 10–12 July 2023. [Google Scholar] [CrossRef]
- Schulze, F.; Dallasega, P. Industry 4.0 concepts and lean methods mitigating traditional losses in engineer-to-order manufacturing with subsequent assembly on-site: A framework. In Procedia Manuf; Elsevier: Amsterdam, The Netherlands, 2020; pp. 1363–1370. [Google Scholar] [CrossRef]
- Fang, Y.; Gao, S. Construction 4.0 technology and lean construction ambidexterity capability in China’s construction industry: A sociotechnical systems perspective. Constr. Innov. 2024. ahead-of-print. [Google Scholar] [CrossRef]
- Deng, Y.; Gan, V.J.L.; Das, M.; Cheng, J.C.P.; Anumba, C. Integrating 4D BIM and GIS for Construction Supply Chain Management. J. Constr. Eng. Manag. 2019, 145. [Google Scholar] [CrossRef]
- Alizadehsalehi, S.; Hadavi, A. Synergies of Lean, BIM, and Extended Reality (LBX) for Project Delivery Management. Sustainability 2023, 15, 4969. [Google Scholar] [CrossRef]
- Singh, A.R.; Kumar, V.S. ‘Site layout planning waste’ typology and ITS handling through AR-BIM concept: A lean approach. In Proceedings of the IGLC 2018—Proceedings of the 26th Annual Conference of the International Group for Lean Construction: Evolving Lean Construction Towards Mature Production Management Across Cultures and Frontiers, The International Group for Lean Construction, Chennai, India, 26 July 2018; pp. 123–133. [Google Scholar] [CrossRef]
- Ratajczak, J.; Riedl, M.; Matt, D.T. BIM-based and AR application combined with location-based management system for the improvement of the construction performance. Buildings 2019, 9, 118. [Google Scholar] [CrossRef]
- Perera, W.S.D.; Ranadewa, K.A.T.O.; Parameswaran, A.; Weerasooriya, D. Status Quo of Digitalisation in the Sri Lankan Construction Industry. In World Construction Symposium; Ceylon Institute of Builders: Colombo, Sri Lanka, 2023; pp. 944–959. [Google Scholar] [CrossRef]
- Brissi, S.G.; Chong, O.W.; Debs, L.; Zhang, J. A review on the interactions of robotic systems and lean principles in offsite construction. Eng. Constr. Archit. Manag. 2022, 29, 383–406. [Google Scholar] [CrossRef]
- Antunes, R.; Poshdar, M. Envision of an integrated information system for project-driven production in construction. In Proceedings of the IGLC 2018—Proceedings of the 26th Annual Conference of the International Group for Lean Construction: Evolving Lean Construction Towards Mature Production Management Across Cultures and Frontiers, The International Group for Lean Construction, Chennai, India, 26 July 2018; pp. 134–143. [Google Scholar] [CrossRef]
- Kuining, Q.; Yongbin, W.; Tao, Z. Study of Digital Lean Construction Platform for Precast Components. In Computing in Civil and Building Engineering; ASCE Press: Reston, VI, USA, 2014; pp. 480–487. [Google Scholar] [CrossRef]
- Chen, C.; Tang, L.C.M.; Jin, Y. Development of 5D bim-based management system for pre-fabricated construction in China. In International Conference on Smart Infrastructure and Construction 2019, ICSIC 2019: Driving Data-Informed Decision-Making; ICE Publishing: London, UK, 2019; pp. 215–224. [Google Scholar] [CrossRef]
- He, R.; Li, M.; Gan, V.J.L.; Ma, J. BIM-enabled computerized design and digital fabrication of industrialized buildings: A case study. J. Clean. Prod. 2021, 278, 123505. [Google Scholar] [CrossRef]
- Akter, J.; Datta, S.D.; Islam, M.; Tayeh, B.A.; Sraboni, S.A.; Das, N. Assessment and analysis of the effects of implementing building information modelling as a lean management tool in construction management. Int. J. Build. Pathol. Adapt. 2024. ahead-of-print. [Google Scholar] [CrossRef]
- Aziz, R.M.; Nasreldin, T.I.; Hashem, O.M. The role of BIM as a lean tool in design phase. J. Eng. Appl. Sci. 2024, 71, 23. [Google Scholar] [CrossRef]
- AlBalkhy, W.; Chaize, E.; Morael, V.; Lafhaj, Z.; Iordanova, I. Lean Construction and Building Information Modeling (BIM) in Design Management: Survey Results from French Companies. In Proceedings of the 31st Annual Conference of the International Group for Lean Construction (IGLC31), International Group for Lean Construction, Lille, France, 2 July 2023; pp. 220–229. [Google Scholar] [CrossRef]
- Barkokebas, B.; Al-Hussein, M.; Hamzeh, F. Assessment of Digital Twins to Reassign Multiskilled Workers in Offsite Construction Based on Lean Thinking. J. Constr. Eng. Manag. 2022, 149, 04022143. [Google Scholar] [CrossRef]
- Lazari, V.; Chassiakos, A.; Karatzas, S. Multi-Objective Resource-Constrained Scheduling in Large and Repetitive Construction Projects. Algorithms 2024, 17, 351. [Google Scholar] [CrossRef]
- Lean Construction Institute. Value Stream Mapping. 2025. Available online: https://leanconstruction.org/lean-topics/value-stream-mapping/ (accessed on 27 January 2025).
- Michaud, M.; Forgues, E.C.; Carignan, V.; Forgues, D.; Ouellet-Plamondon, C. A lean approach to optimize BIM information flow using value stream mapping. J. Inf. Technol. Constr. 2019, 24, 472–488. [Google Scholar] [CrossRef]
- Gunduz, M.; Naser, A. Value Stream Mapping as a Lean Tool for Construction Projects. Int. J. Struct. Civ. Eng. Res. 2019, 8, 69–74. [Google Scholar] [CrossRef]
- Sourani, A.; Sohail, M. The Delphi Method: Review and Use in Construction Management Research. Int. J. Constr. Educ. Res. 2015, 11, 54–76. [Google Scholar] [CrossRef]
- Heggset, M.; Krogstie, J.; Wesenberg, H. Understanding model quality concerns when using process models in an industrial company. In Lecture Notes in Business Information Processing; Springer: Berlin/Heidelberg, Germany, 2015; pp. 395–409. [Google Scholar] [CrossRef]
- Krogstie, J.; Sindre, G.; Jørgensen, H. Process models representing knowledge for action: A revised quality framework. Eur. J. Inf. Syst. 2006, 15, 91–102. [Google Scholar] [CrossRef]
- Ewens, W.J.; Brumberg, K. Non-parametric Tests. In Introductory Statistics for Data Analysis; Ewens, W.J., Brumberg, K., Eds.; Springer Nature: Cham, Switzerland, 2023; pp. 205–217. [Google Scholar] [CrossRef]
- Okoli, C.; Pawlowski, S.D. The Delphi method as a research tool: An Example. Des. Consid. Appl. Inf. Manag. 2004, 42, 15–29. [Google Scholar] [CrossRef]
- Hallowell, M.; Gambatese, J. Qualitative Research: Application of the Delphi Method to CEM Research. J. Constr. Eng. Manag. Asce 2010, 136, 99–107. [Google Scholar] [CrossRef]
- Richardson, A. Nonparametric Statistics for Non-Statisticians: A Step-by-Step Approach by Gregory W. Corder; Dale J. Foreman. Int. Stat. Rev. 2010, 78, 451–452. [Google Scholar] [CrossRef]
- Bonett, D.G.; Wright, T.A. Cronbach’s alpha reliability: Interval estimation, hypothesis testing, and sample size planning. J. Organ. Behav. 2015, 36, 3–15. [Google Scholar] [CrossRef]
- Field, A. Discovering Statistics Using IBM SPSS Statistics, 5th ed.; SAGE Publications Ltd.: Thousand Oaks, CA, USA, 2018. [Google Scholar]
- IBM Corp. IBM SPSS Statistics 28 Brief Guide. 2021. Available online: https://www.ibm.com/docs/en/SSLVMB_28.0.0/pdf/IBM_SPSS_Statistics_Brief_Guide.pdf (accessed on 16 April 2025).
- Schober, P.; Boer, C.; Schwarte, L. Correlation Coefficients: Appropriate Use and Interpretation. Anesth. Analg. 2018, 126, 1763–1768. [Google Scholar] [CrossRef] [PubMed]
- Lean Construction Institute. Target Value Design (TVD). 2025. Available online: https://leanconstruction.org/lean-topics/target-value-delivery/ (accessed on 27 January 2025).
- Lean Construction Institute. The Last Planner System (LPS). 2025. Available online: https://leanconstruction.org/lean-topics/last-planner-system/ (accessed on 27 January 2025).
- Lean Construction Institute. PDCA. 2025. Available online: https://leanconstruction.org/lean-topics/pdca/ (accessed on 27 January 2025).
- Lean Construction Institute. Visual Management Techniques. 2025. Available online: https://leanconstruction.org/lean-topics/transparency-visual-management/ (accessed on 27 January 2025).
- Lean Construction Institute. Kaizen. 2025. Available online: https://leanconstruction.org/lean-topics/kaizen/#:~:text=Kaizen%20in%20Lean%20Design%20%26%20Construction&text=Building%20that%20environment%20starts%20at,environment%20where%20innovation%20can%20occur (accessed on 27 January 2025).
- Anvari, A.; Hojjati, S.M.H. A Study on Total Quality Management and Lean Manufacturing: Through Lean Thinking Approach. 2011. Available online: https://www.researchgate.net/publication/267409057 (accessed on 14 February 2025).
- Lean Construction Institute. Takt Planning and Control. 2025. Available online: https://leanconstruction.org/lean-topics/takt-time/#:~:text=Takt%20planning%20is%20the%20process,of%20the%20train%20of%20trades (accessed on 27 January 2025).
- Lean Construction Institute. KANBAN. 2025. Available online: https://leanconstruction.org/lean-topics/lean-kanban/#:~:text=In%20Lean%20design%20and%20construction,Lean%20mindset%20of%20continuous%20improvement (accessed on 27 January 2025).
- Lean Construction Institute. Just in Time (JIT). 2025. Available online: https://leanconstruction.org/lean-topics/just-in-time/ (accessed on 27 January 2025).
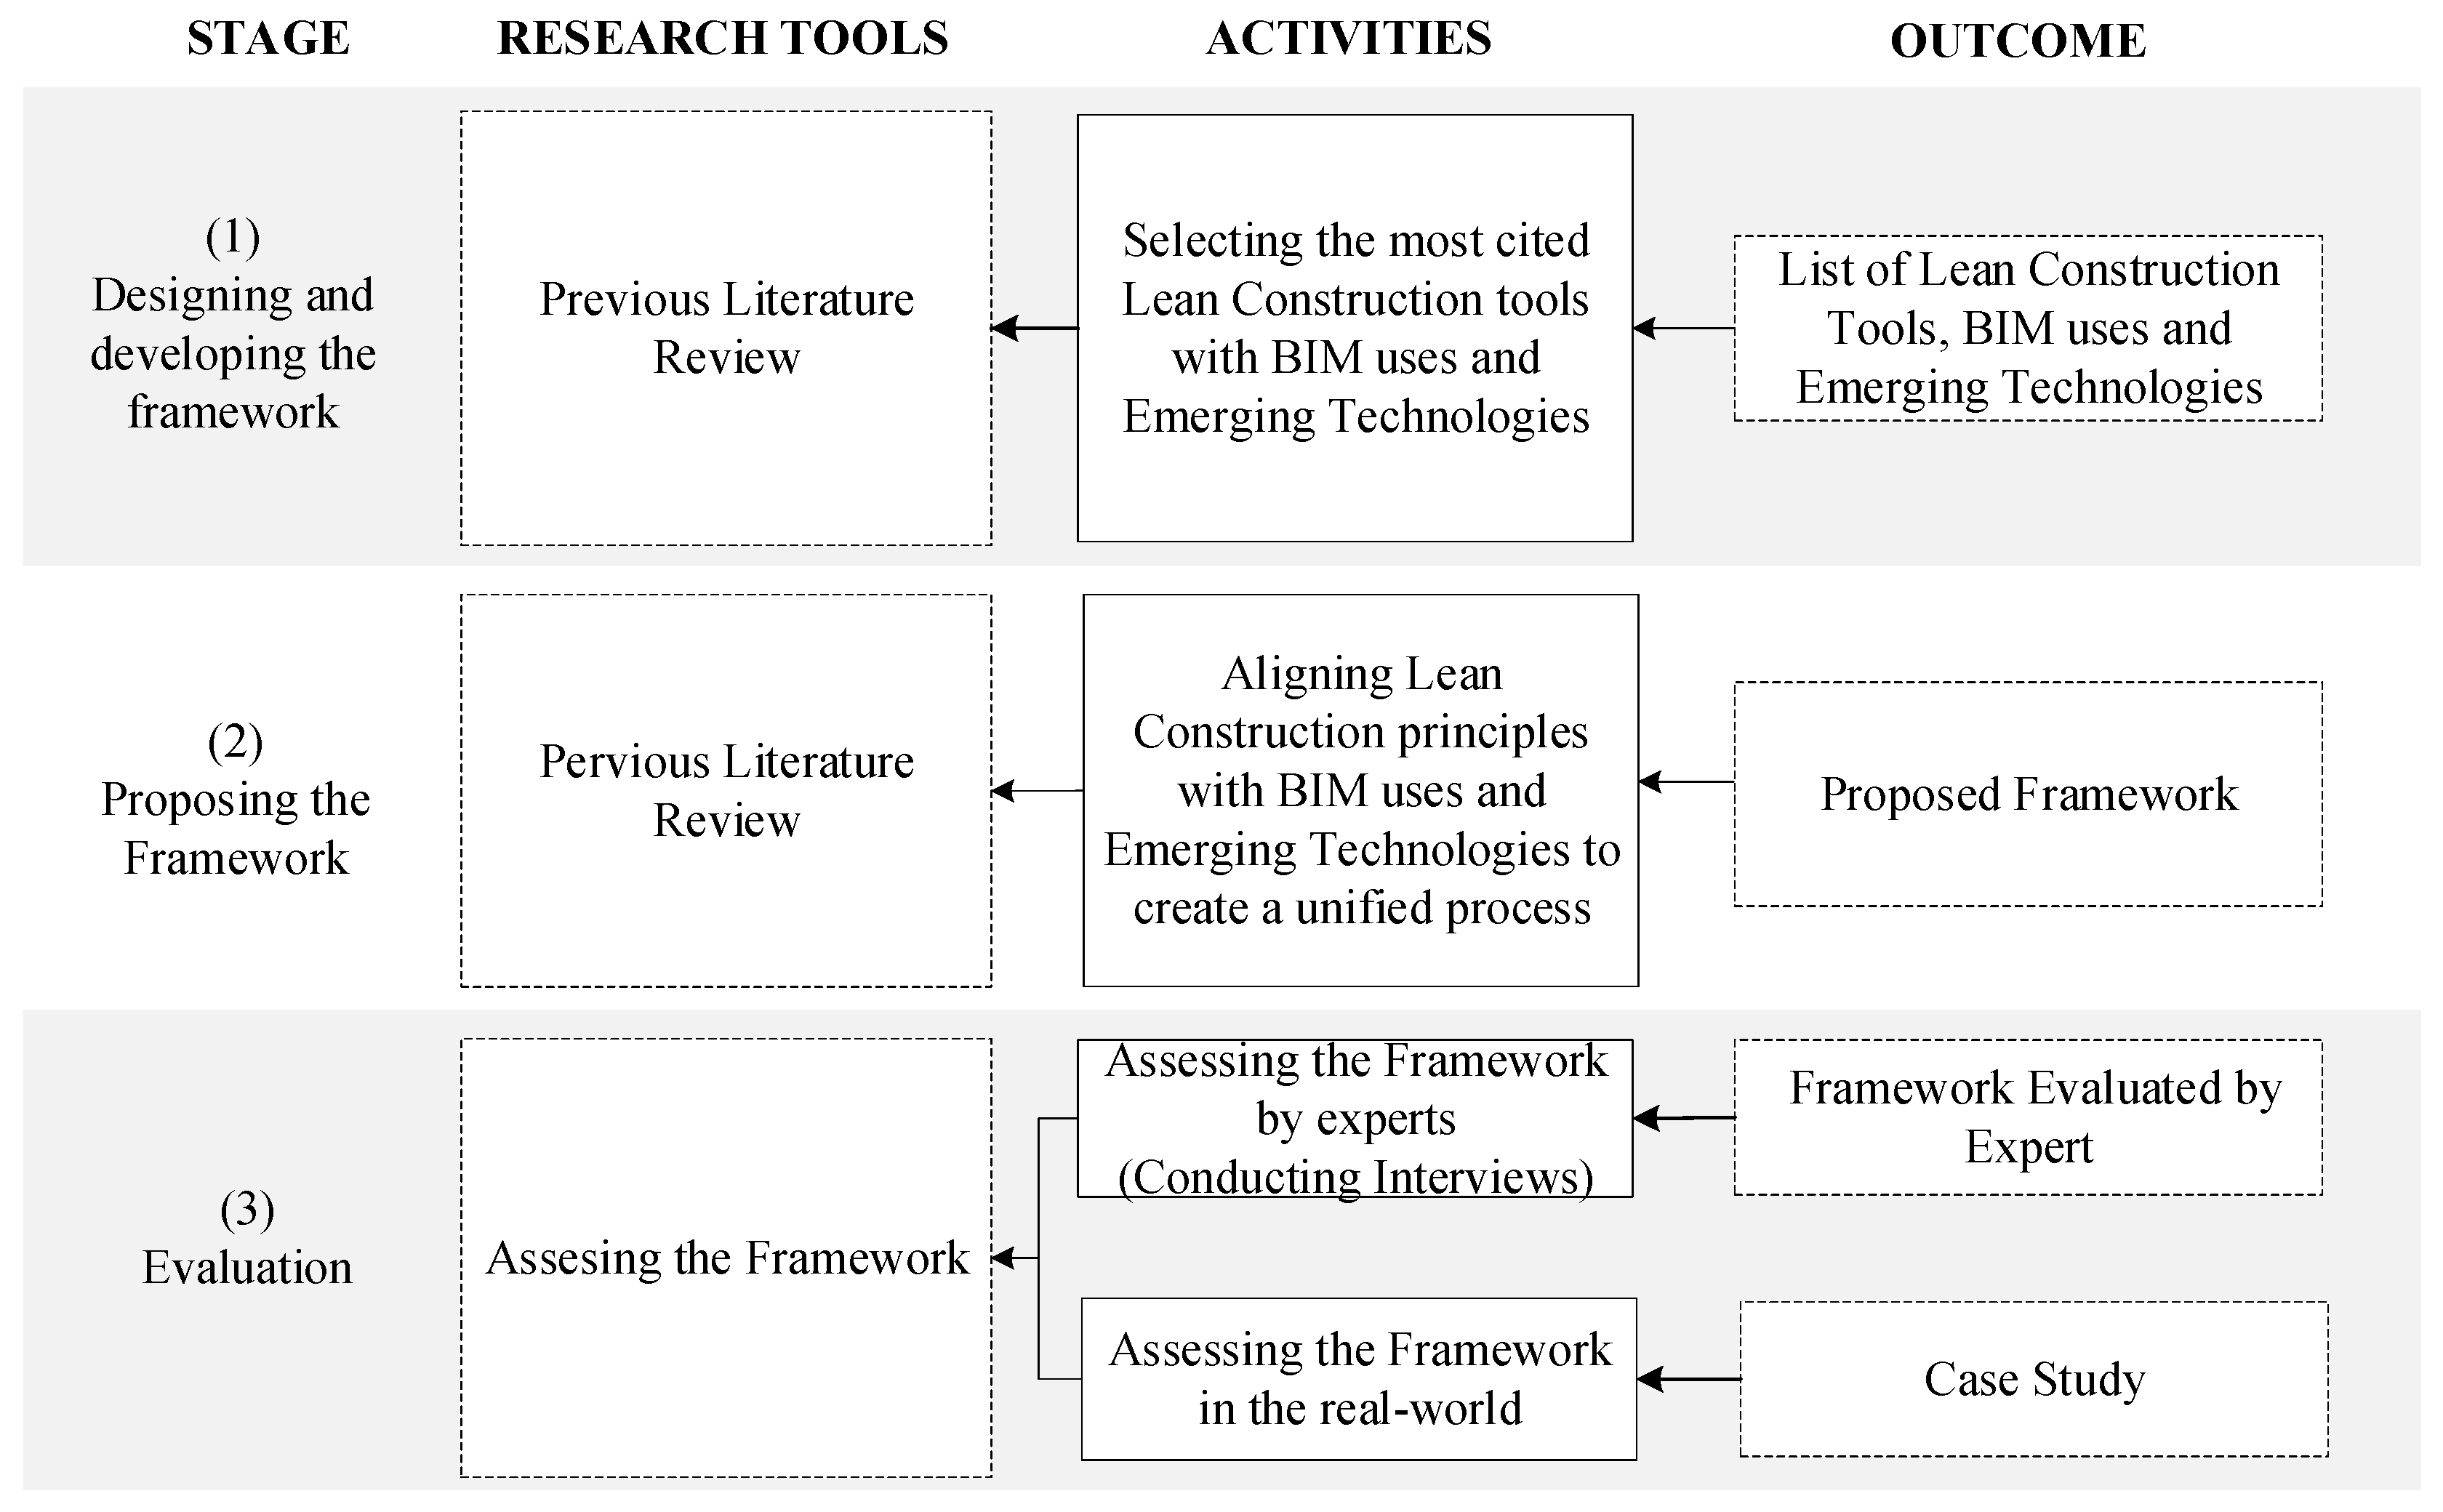
Disclaimer/Publisher’s Note: The statements, opinions and data contained in all publications are solely those of the individual author(s) and contributor(s) and not of MDPI and/or the editor(s). MDPI and/or the editor(s) disclaim responsibility for any injury to people or property resulting from any ideas, methods, instructions or products referred to in the content. |
© 2025 by the authors. Licensee MDPI, Basel, Switzerland. This article is an open access article distributed under the terms and conditions of the Creative Commons Attribution (CC BY) license (https://creativecommons.org/licenses/by/4.0/).