
Study on the Relationship Between Porosity and Mechanical Properties Based on Rock Pore Structure Reconstruction Model


Abstract
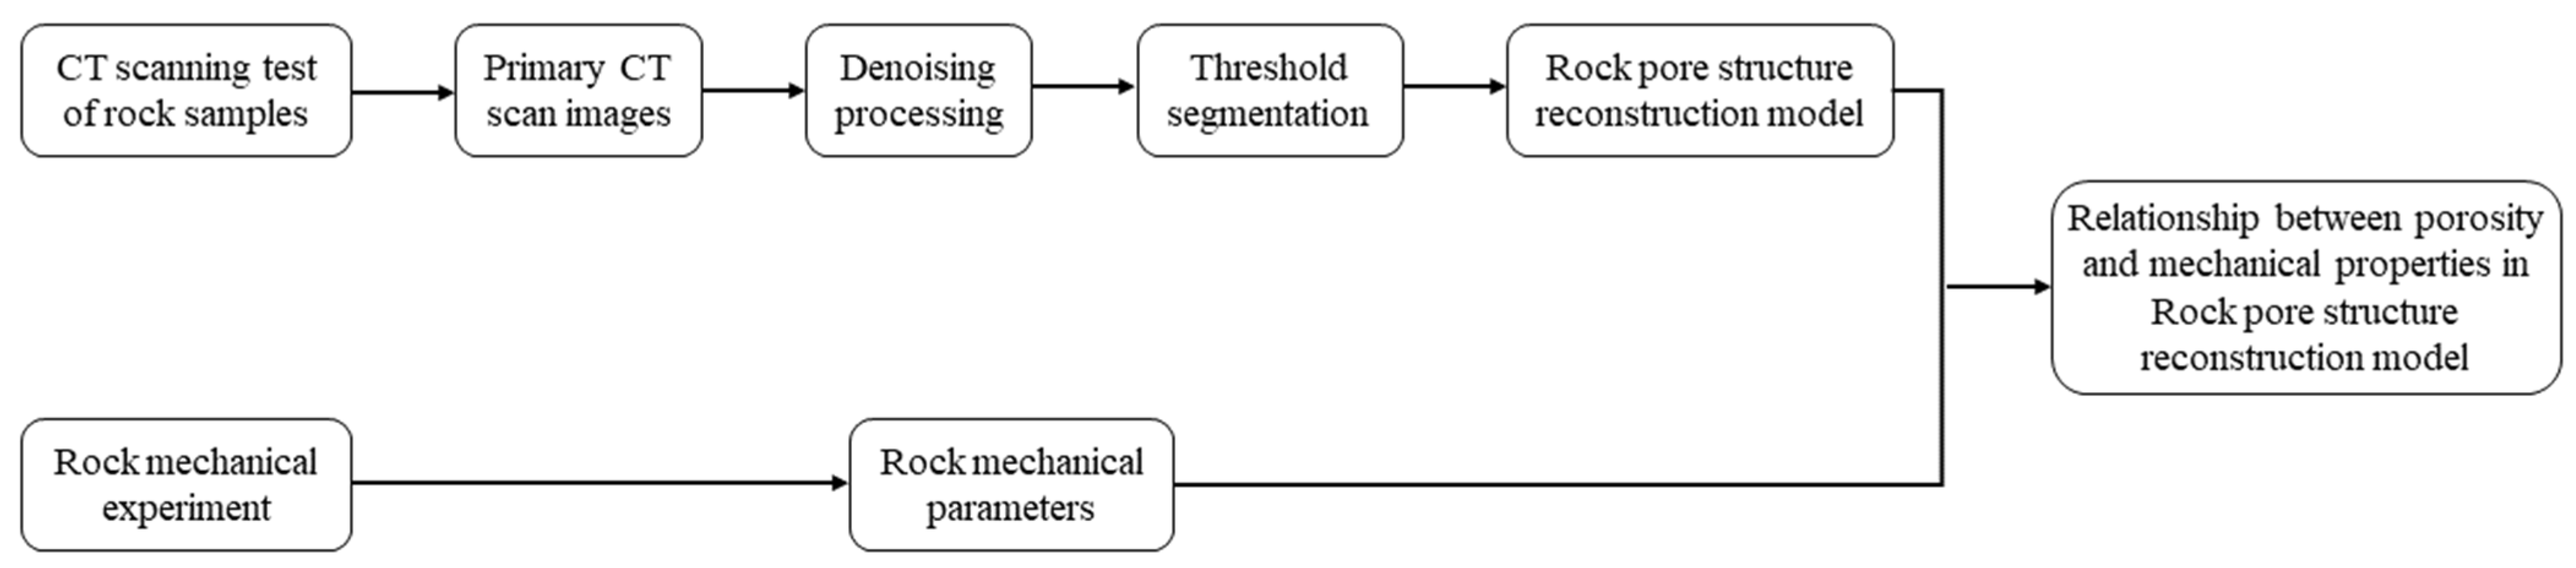
1. Introduction
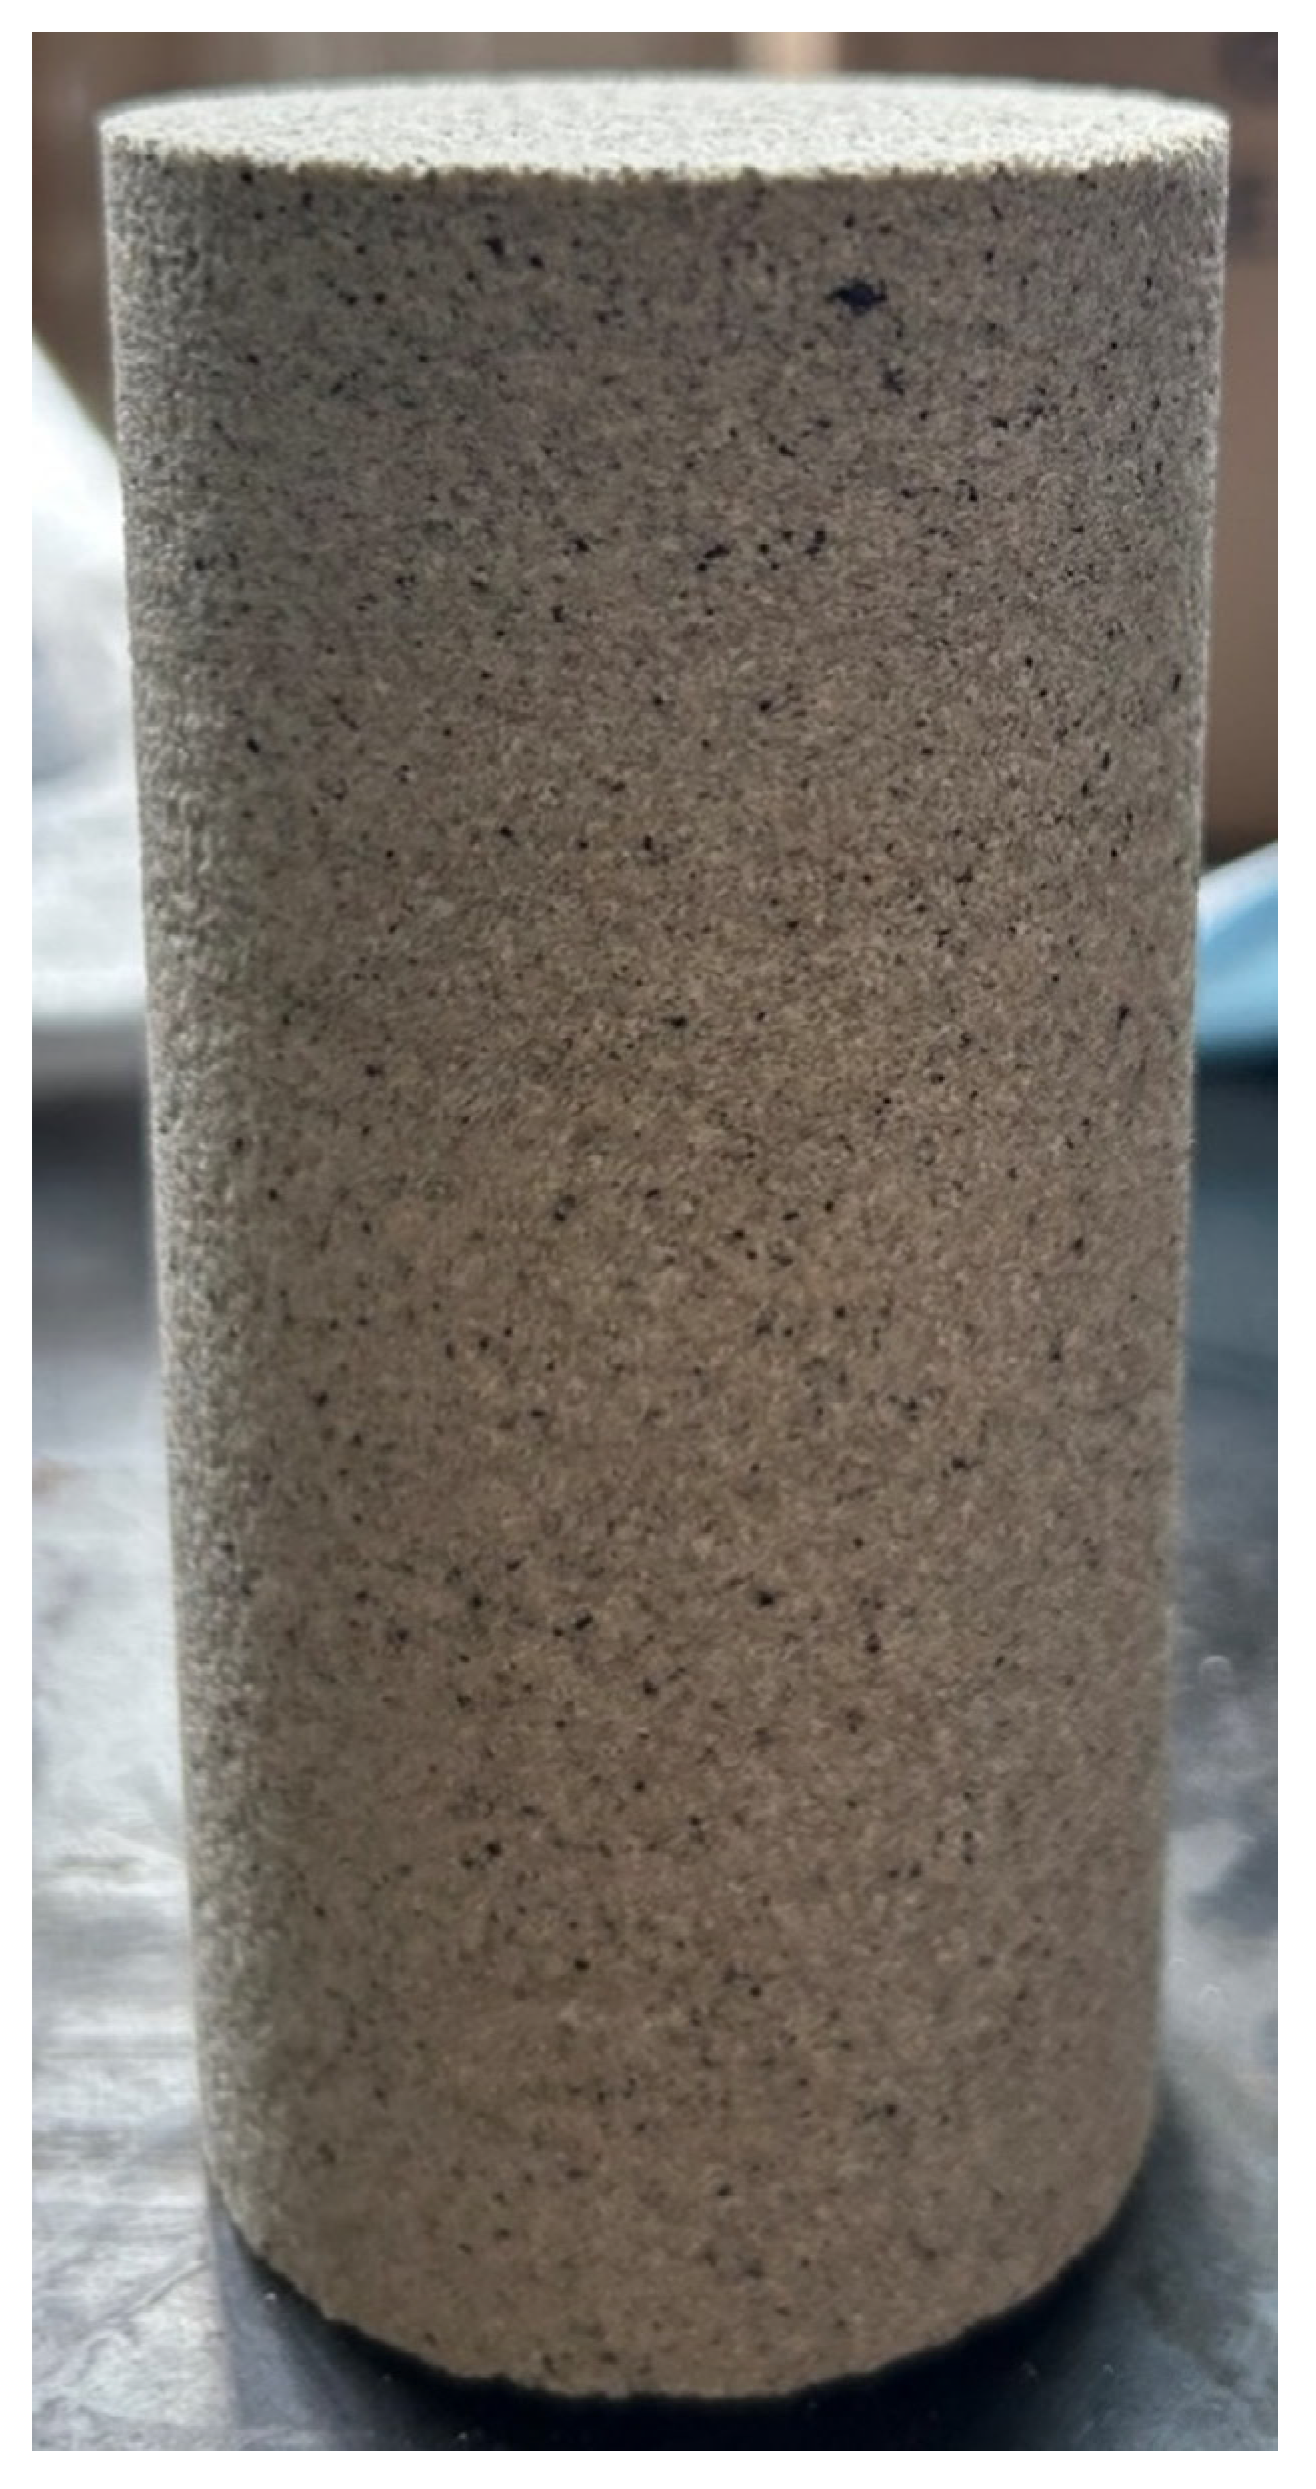
2. Rock Test
2.1. CT Scan Test
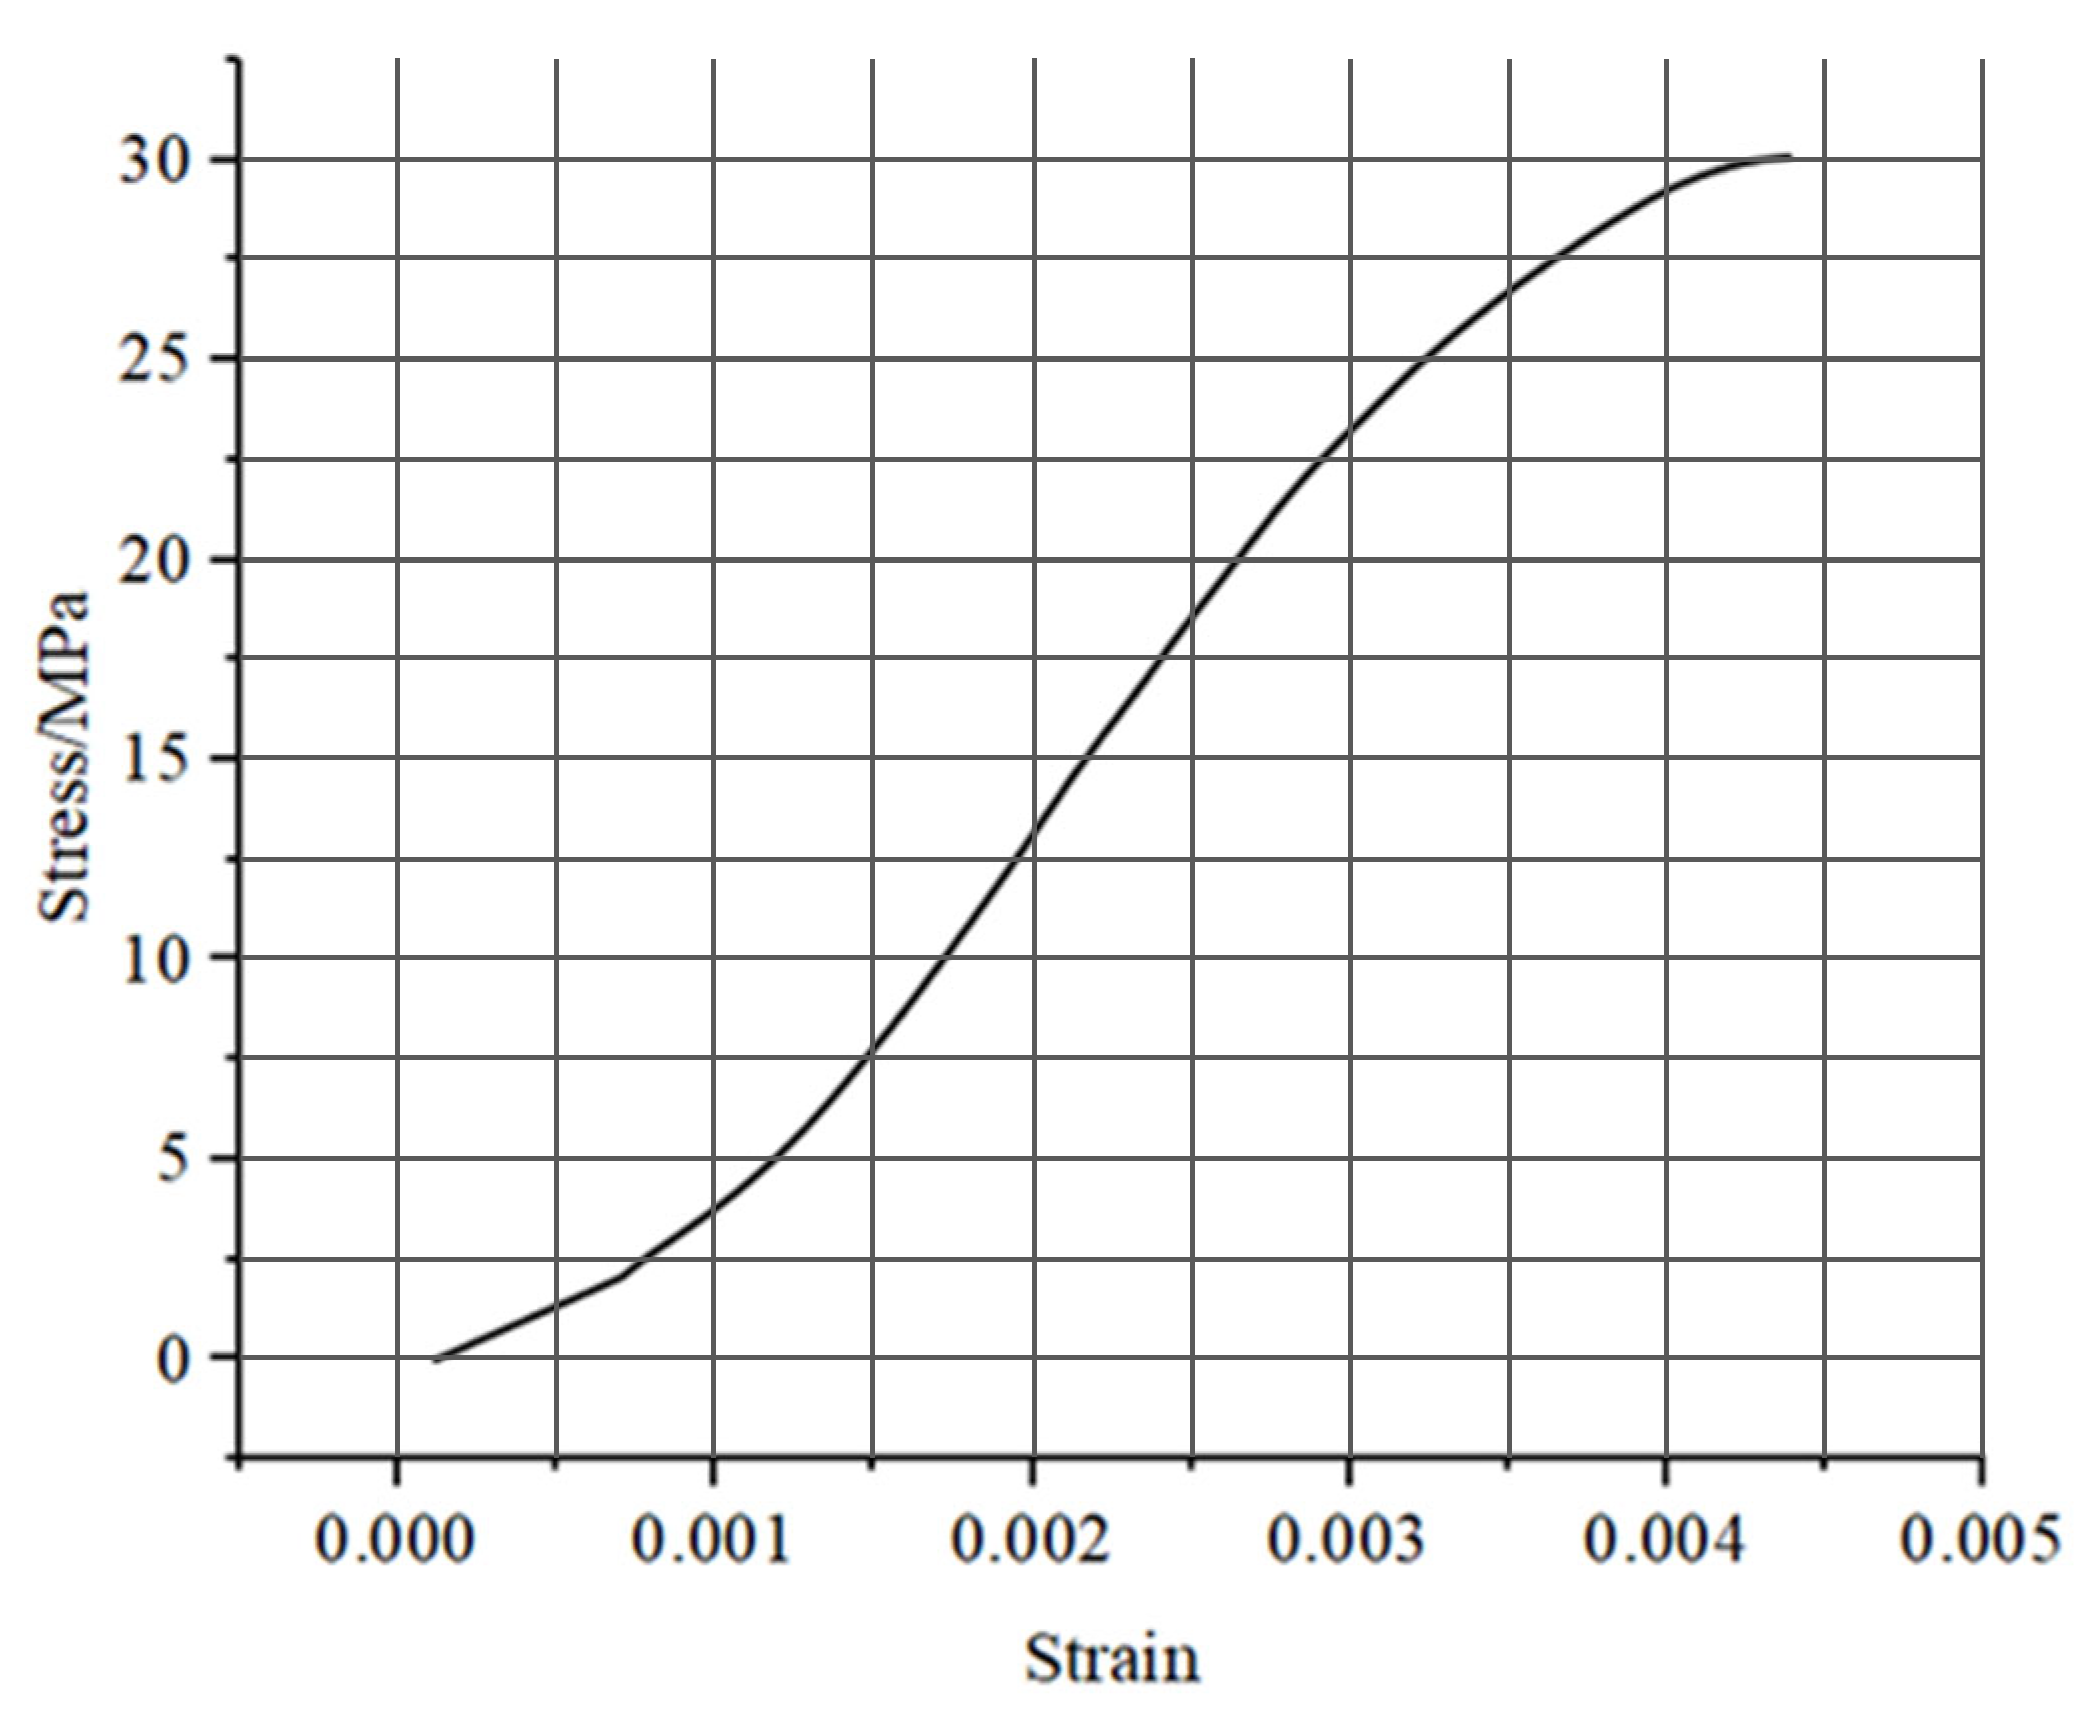
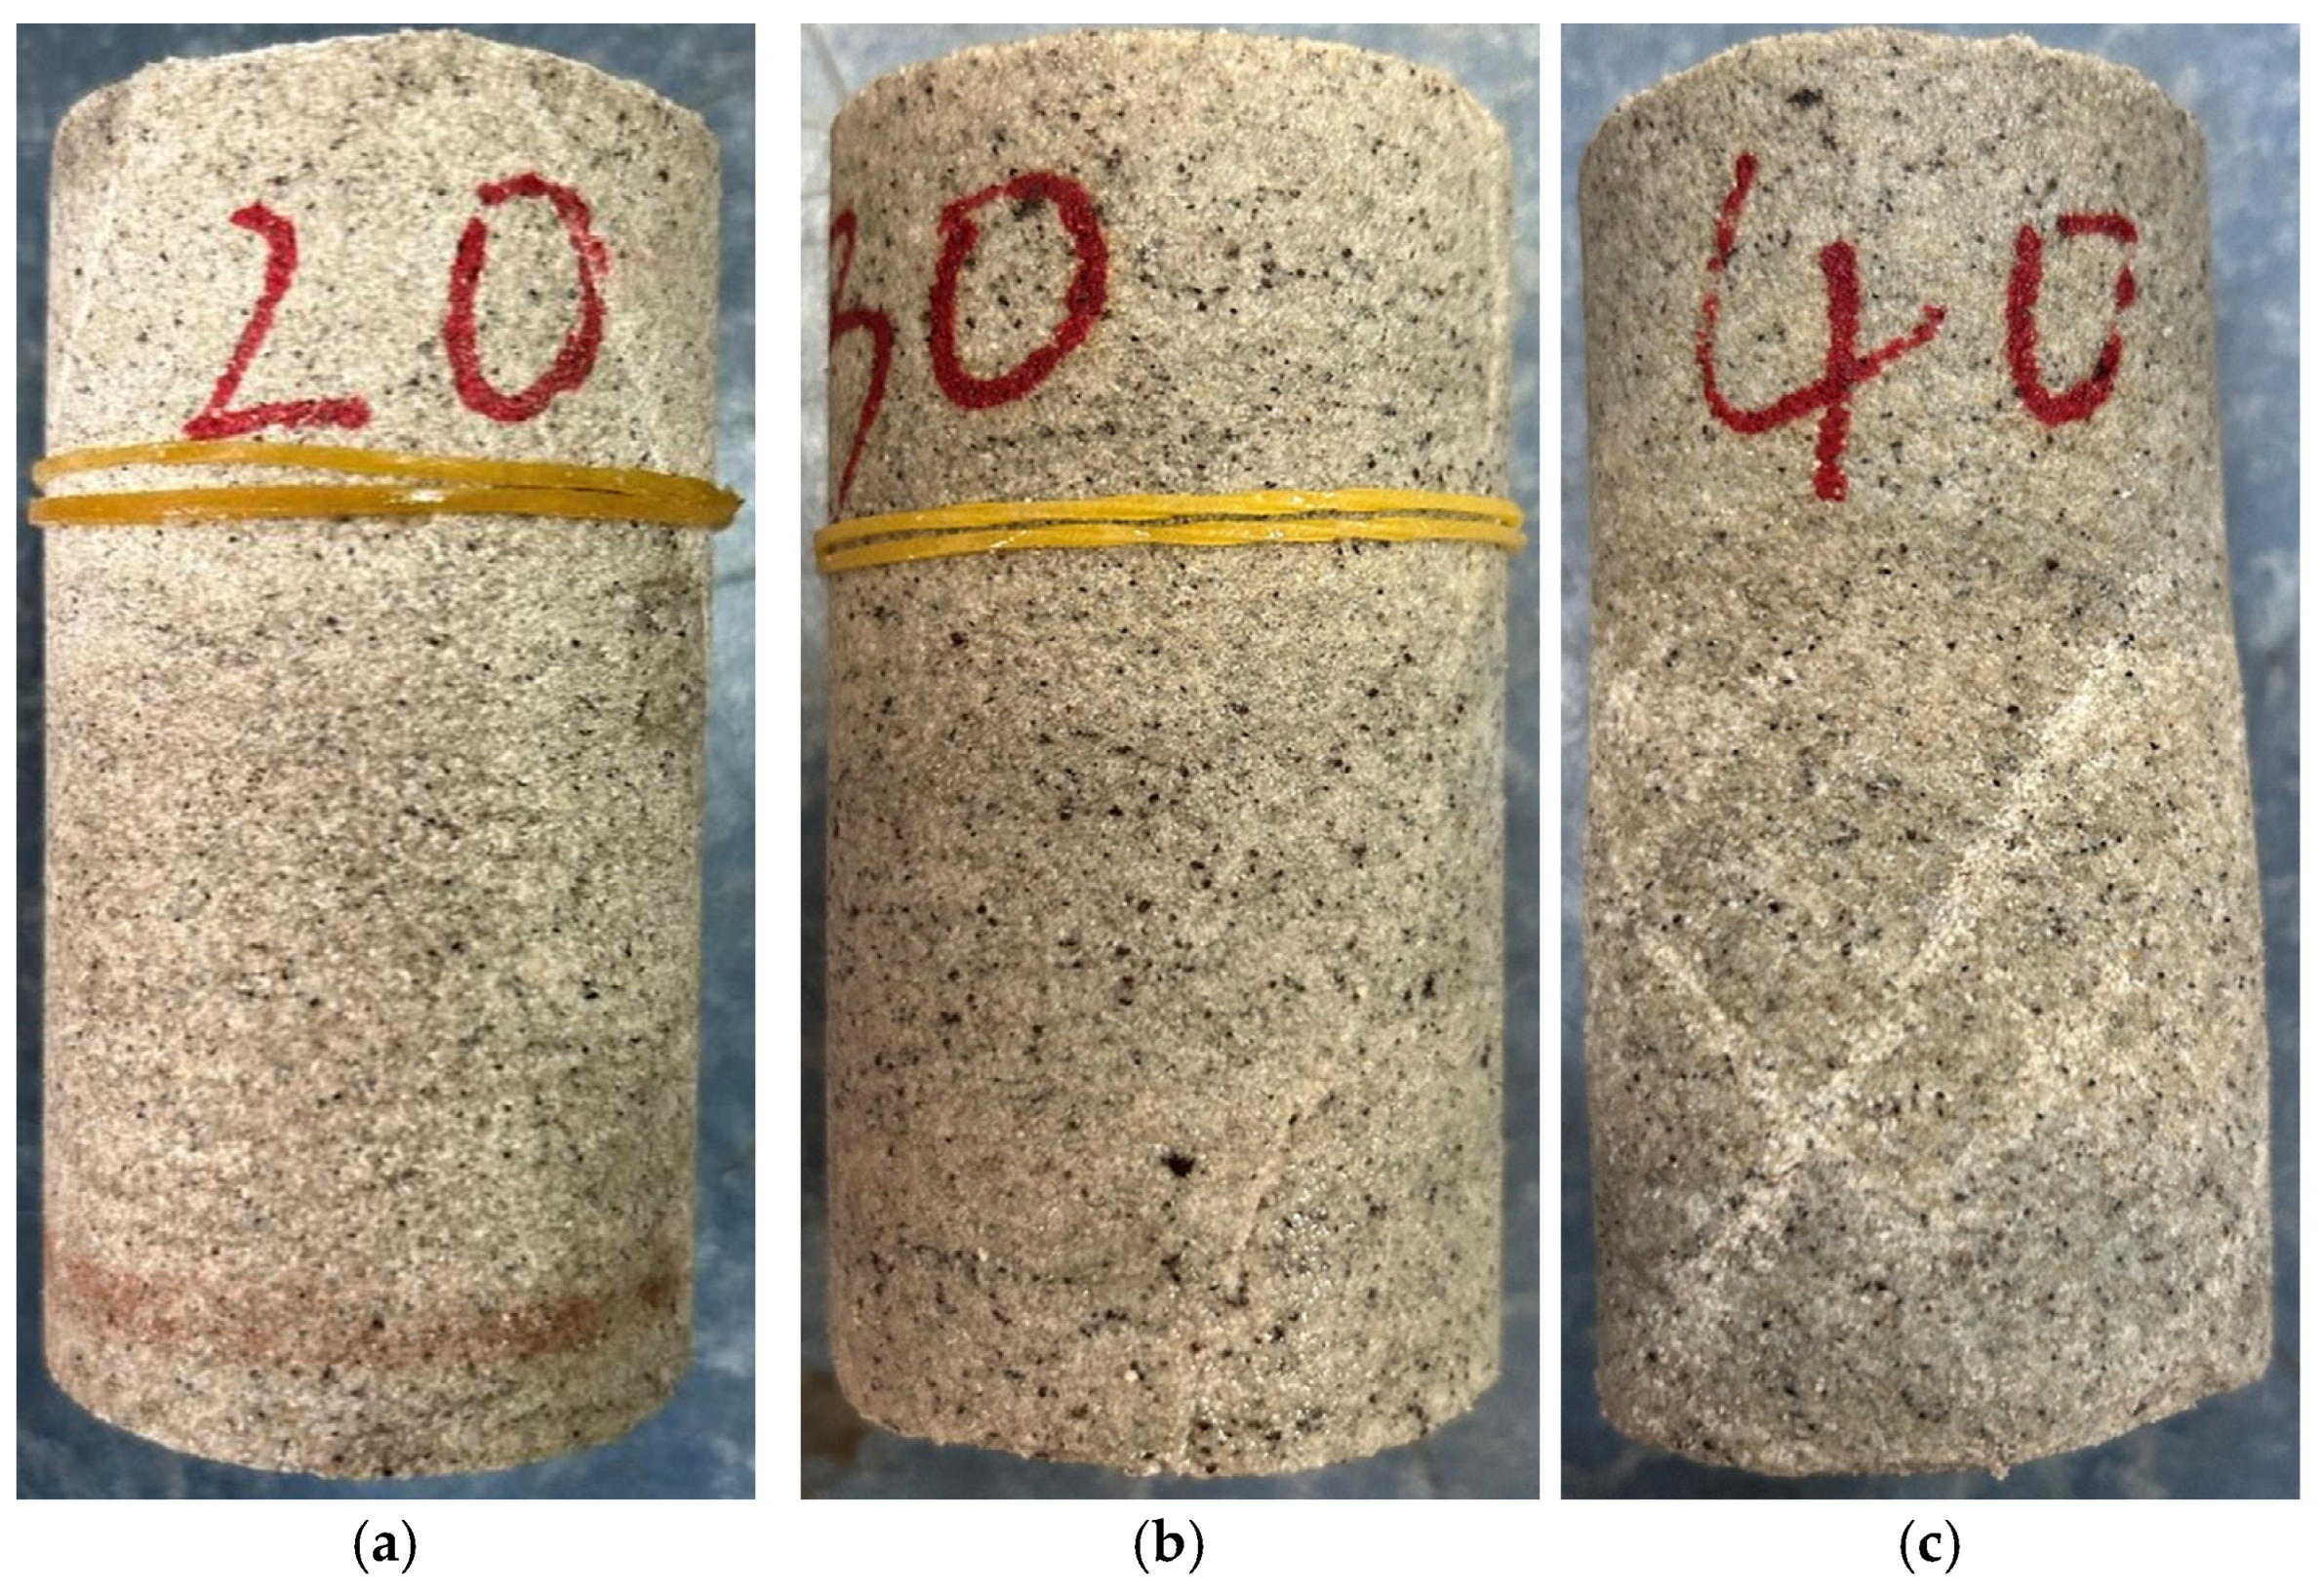
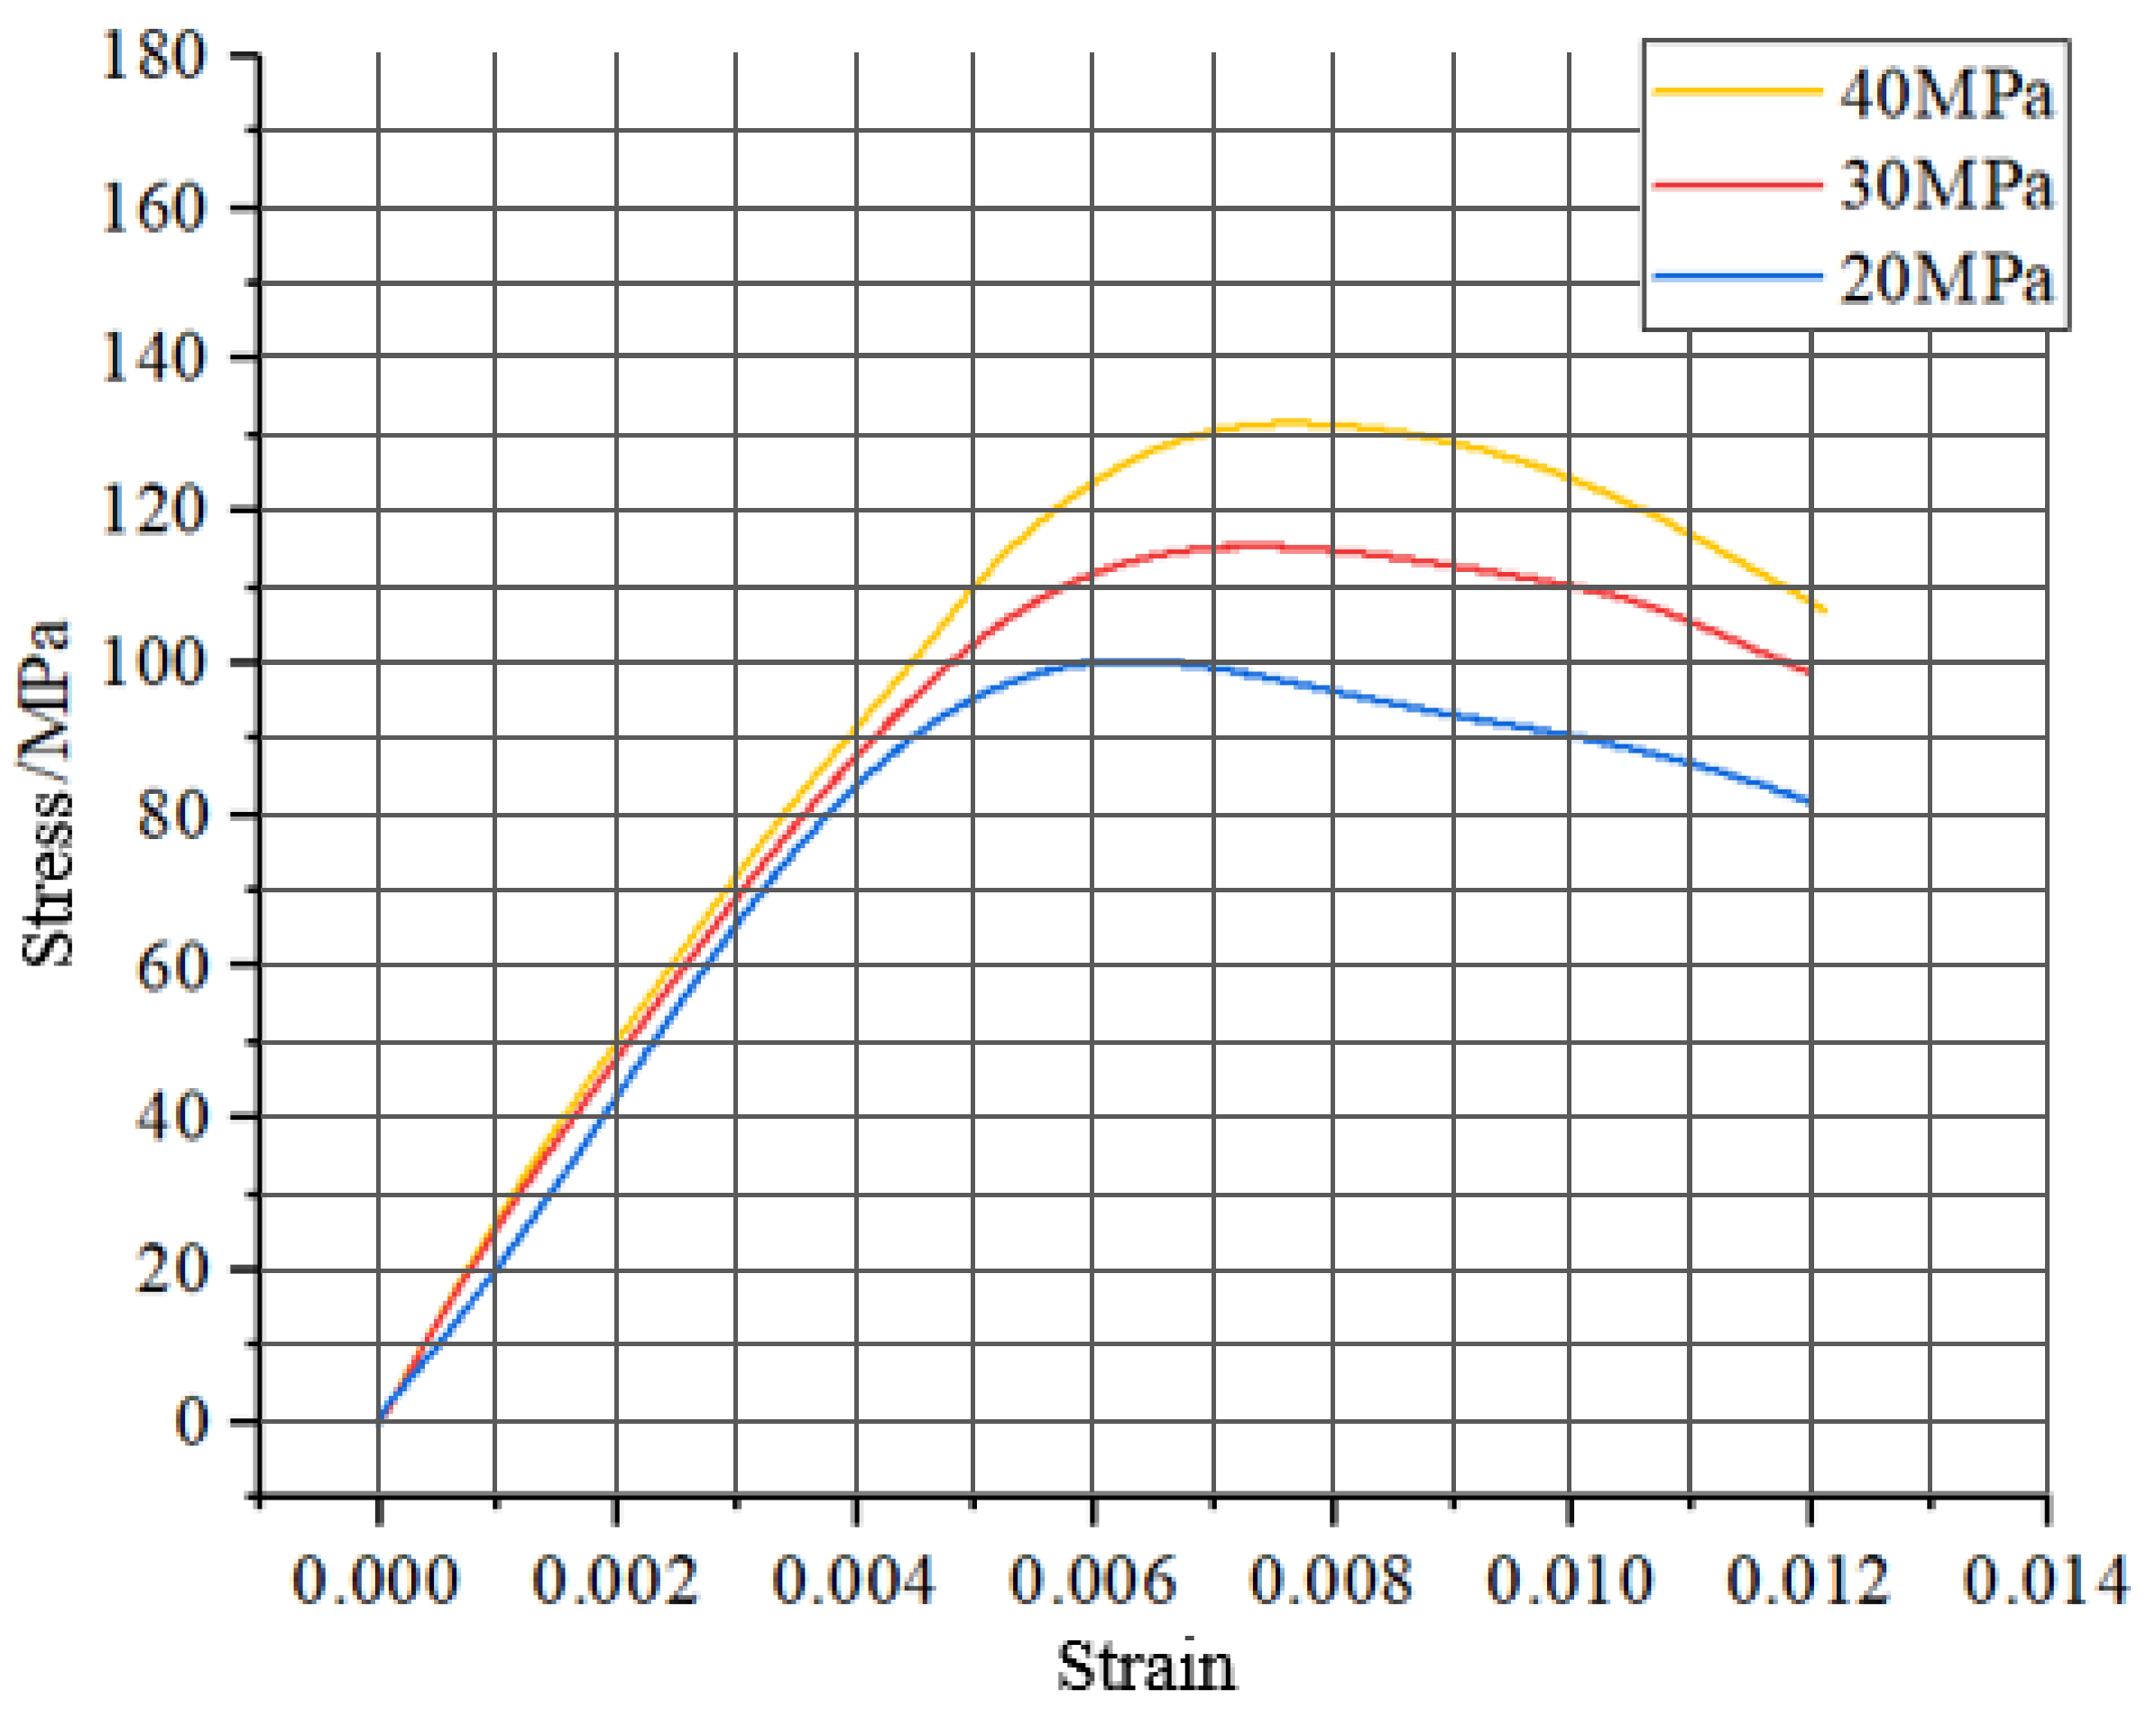
2.2. Mechanical Test
- (1)
- Calculation of the elastic modulus via linear regression of the axial stress–strain profiles within the Hookean region (R2 > 0.98);
- (2)
- Poisson’s ratio calculation using transverse-to-axial strain differentials;
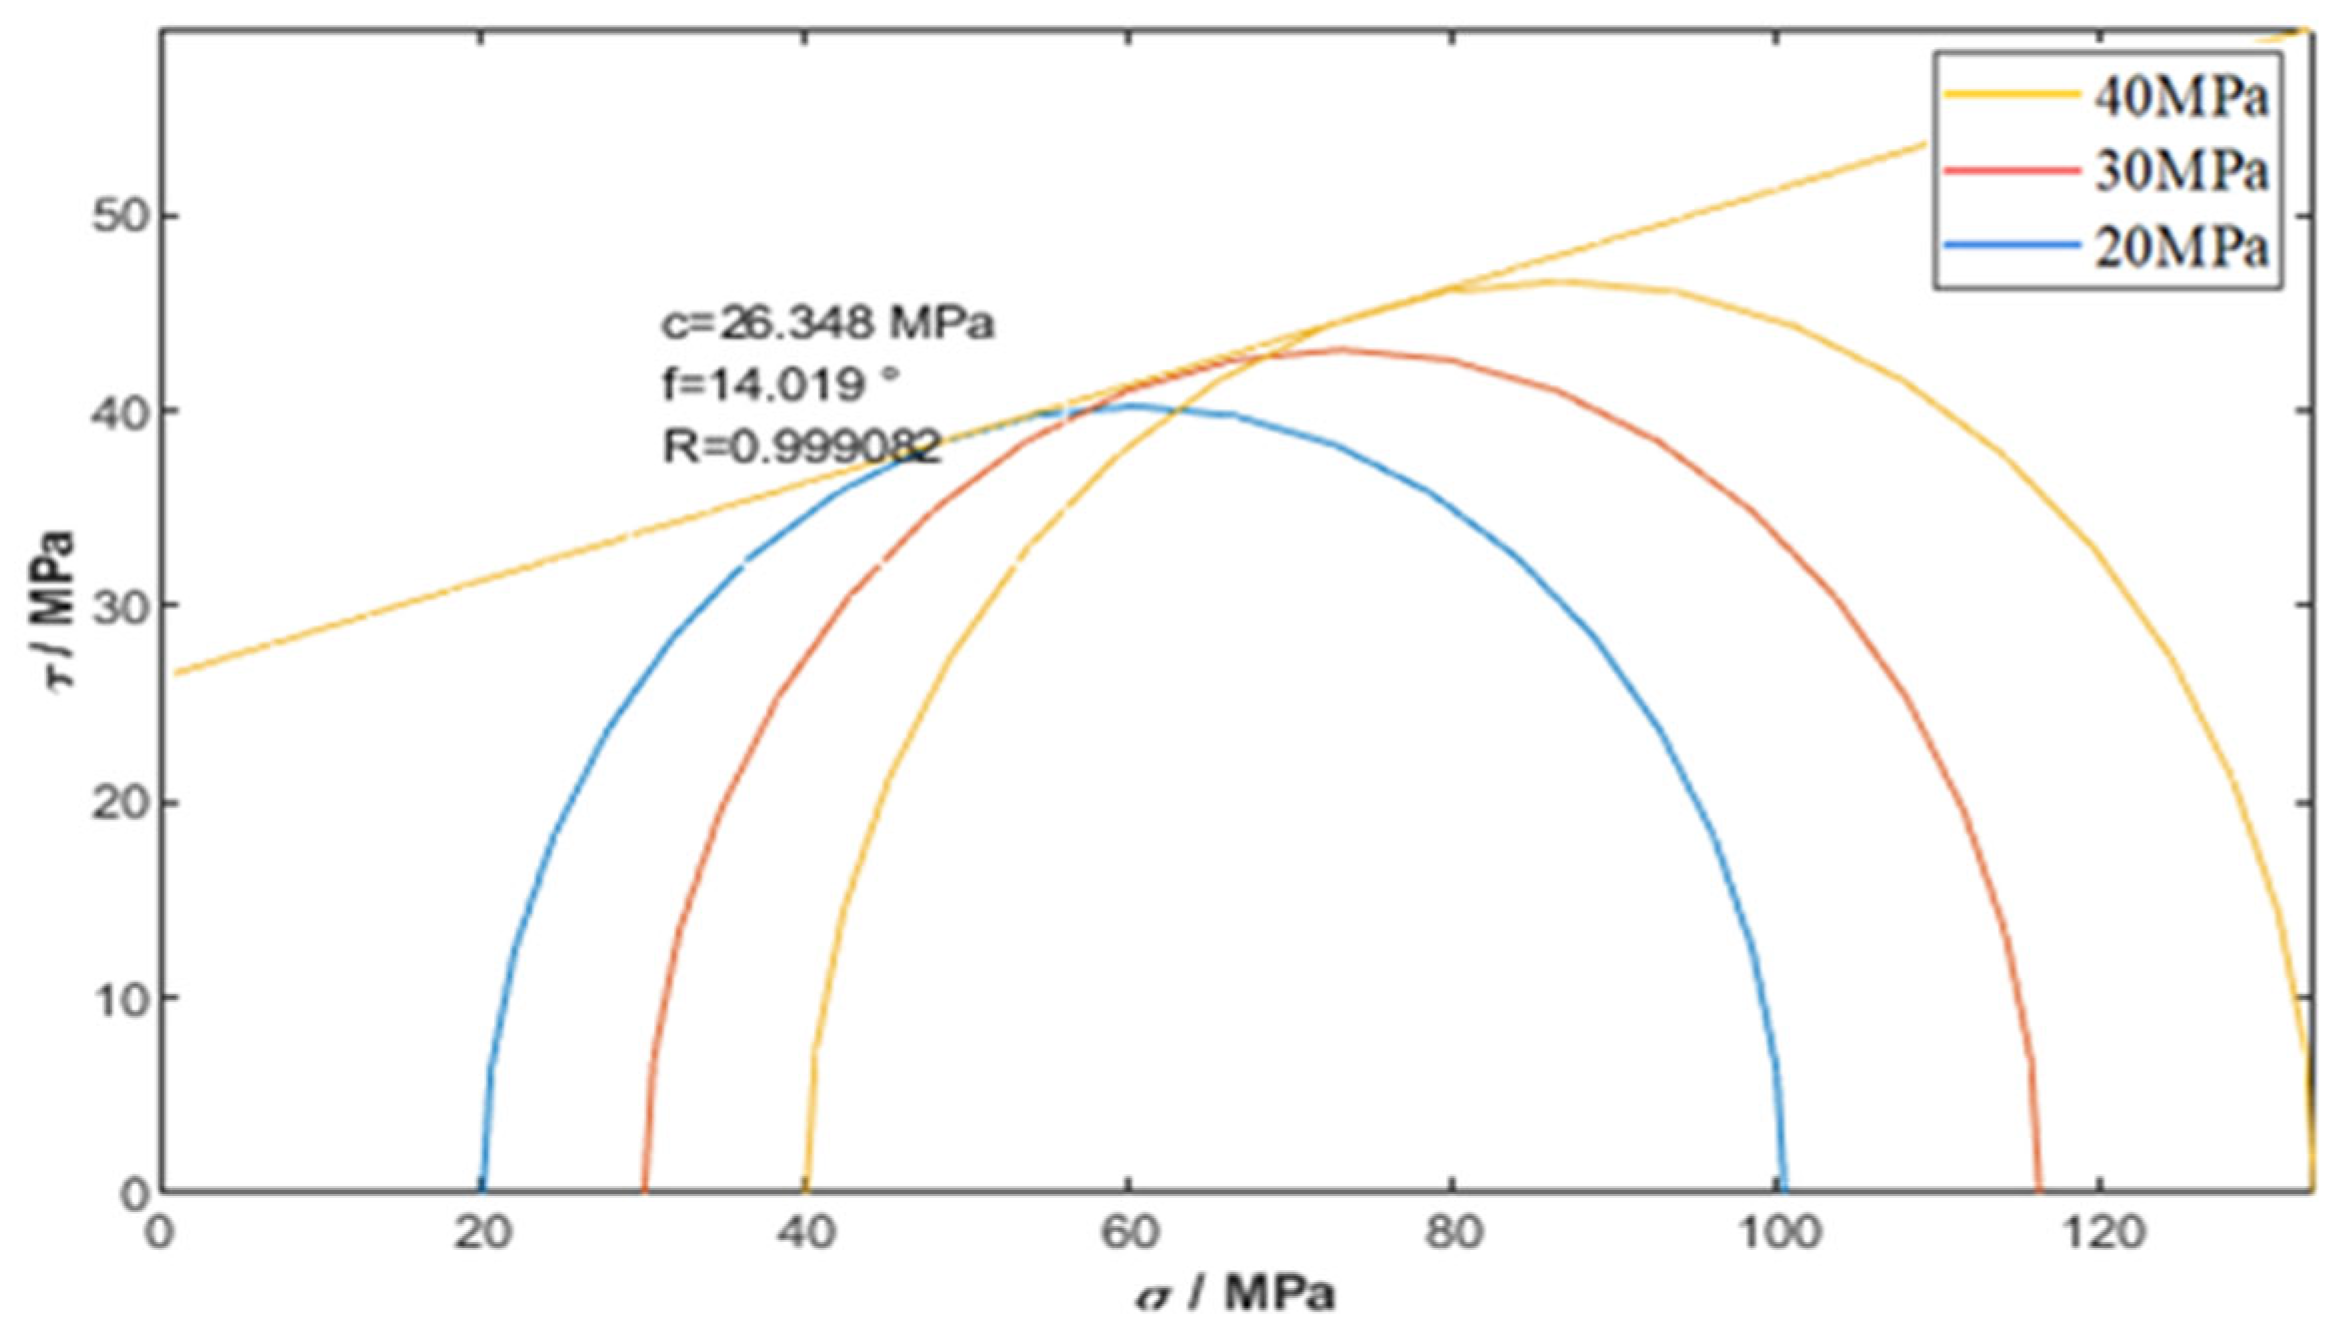
- (3)
- Mohr–Coulomb failure envelope construction through tangent line analysis of principal stress combinations, which yielded cohesive strength and internal friction angle.
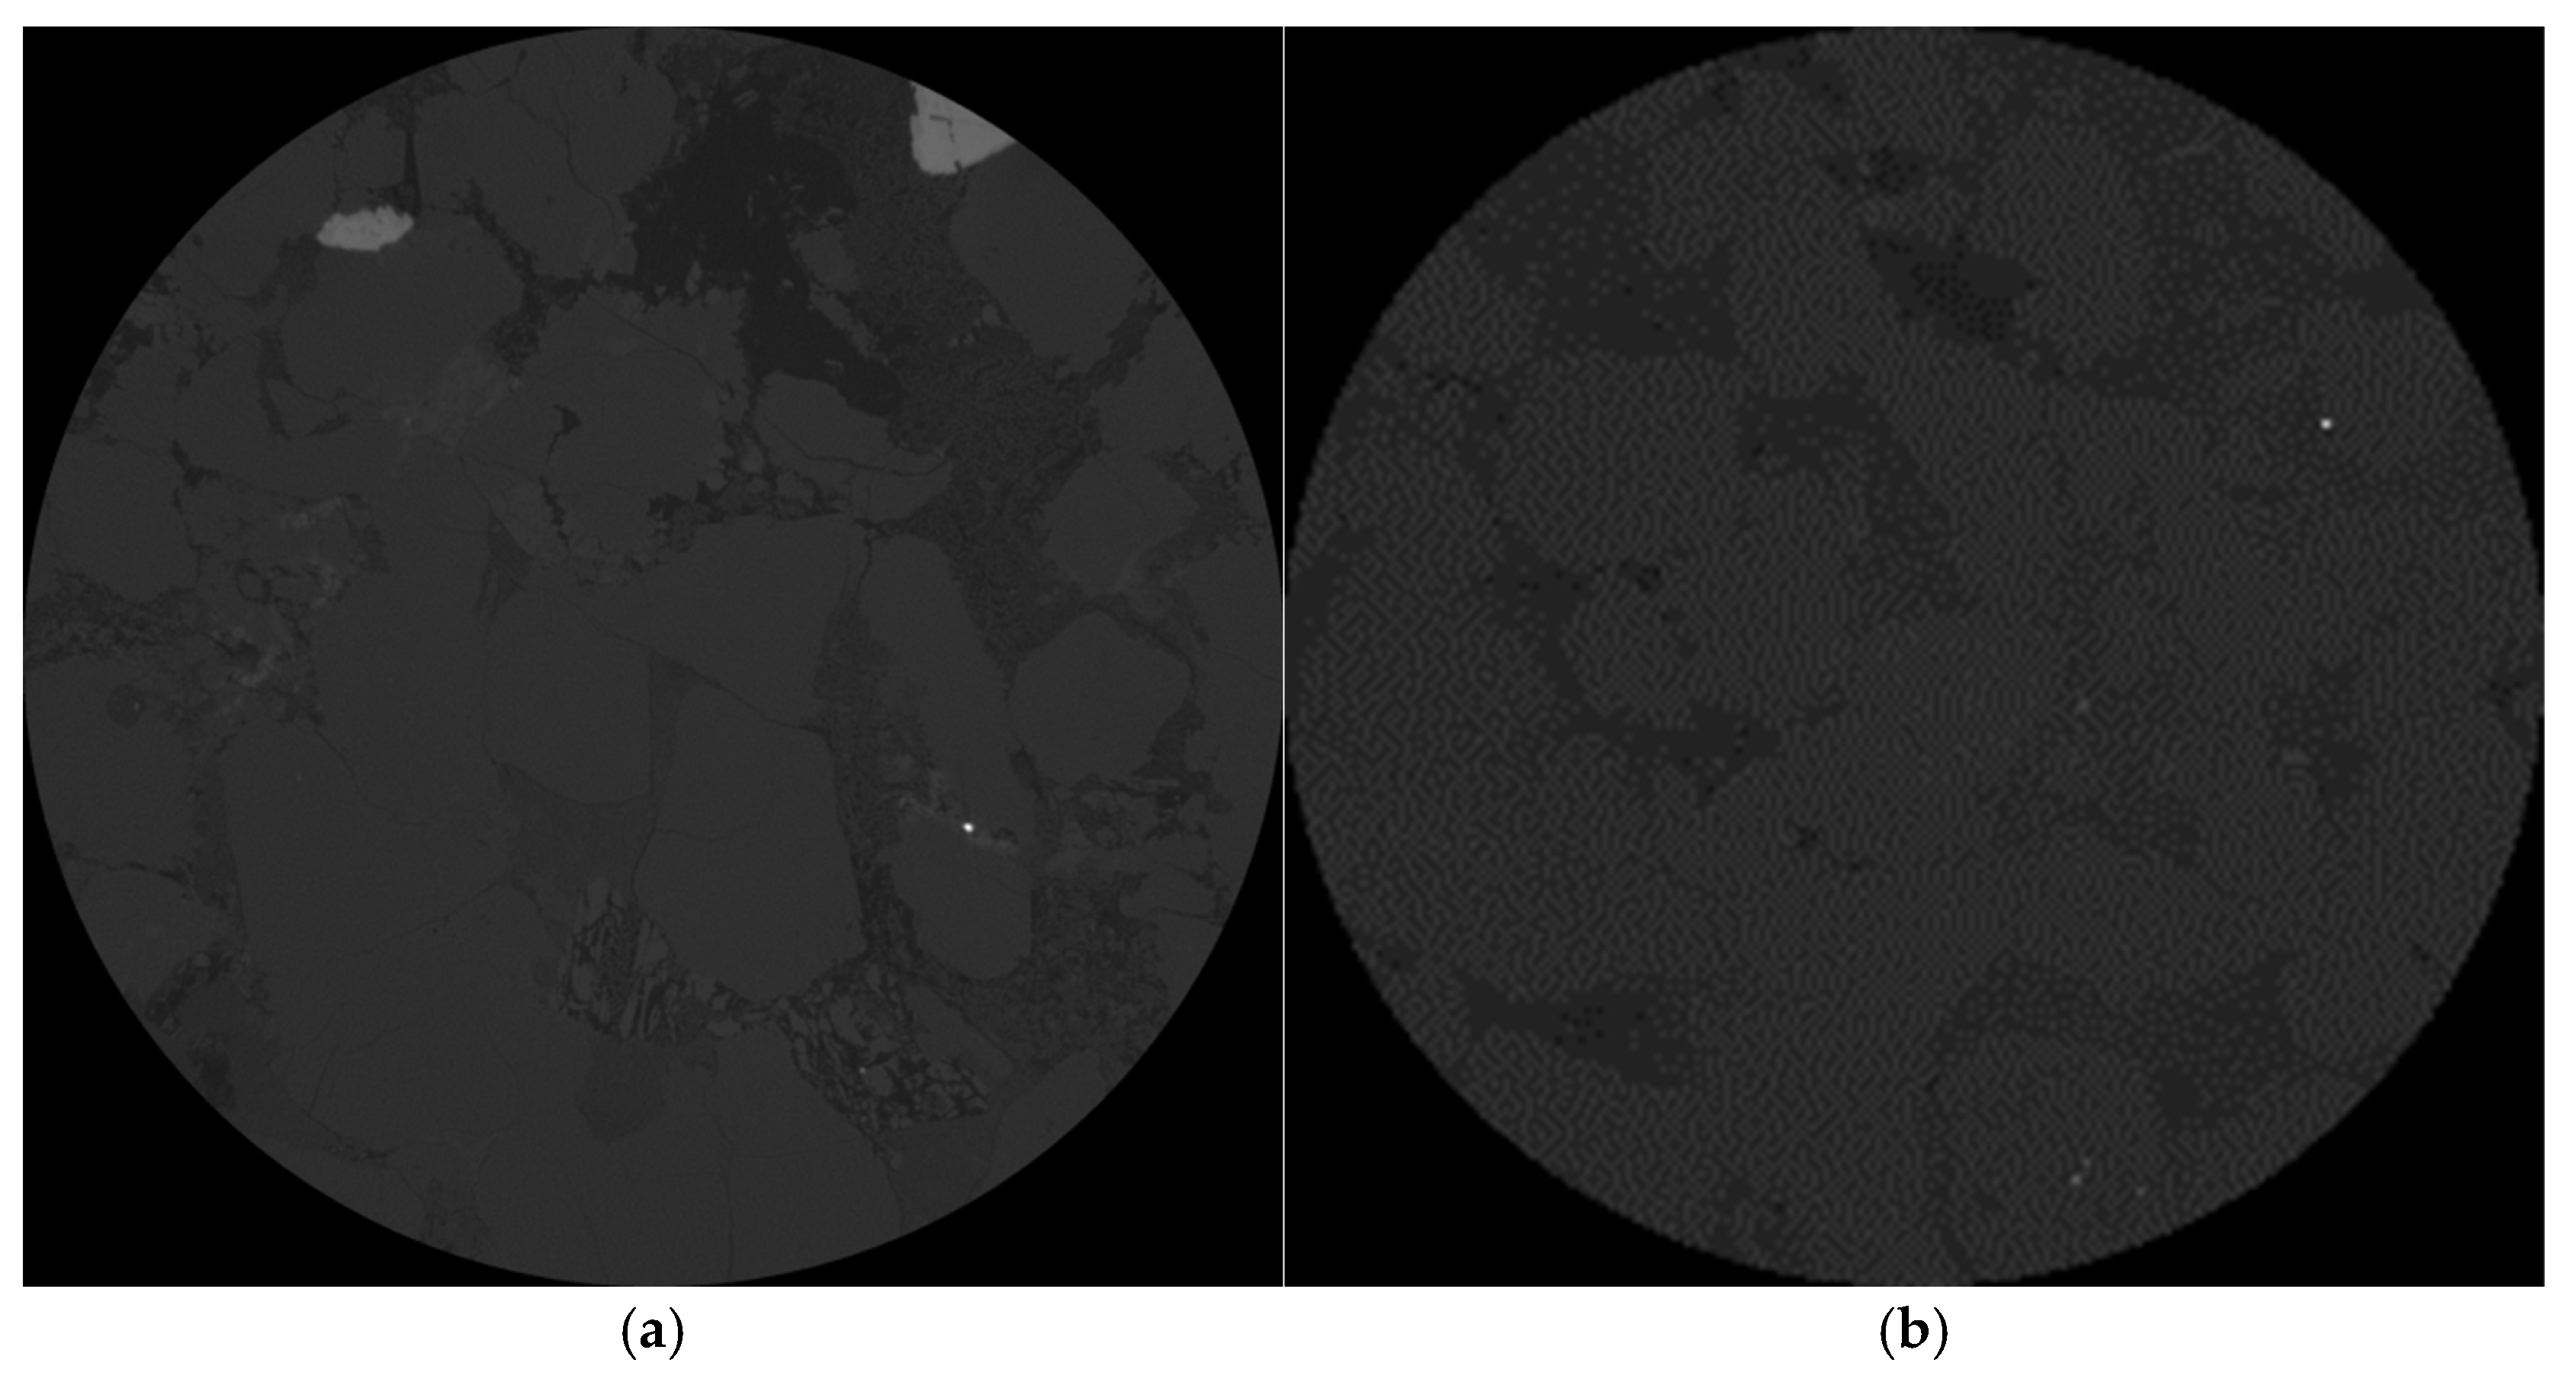
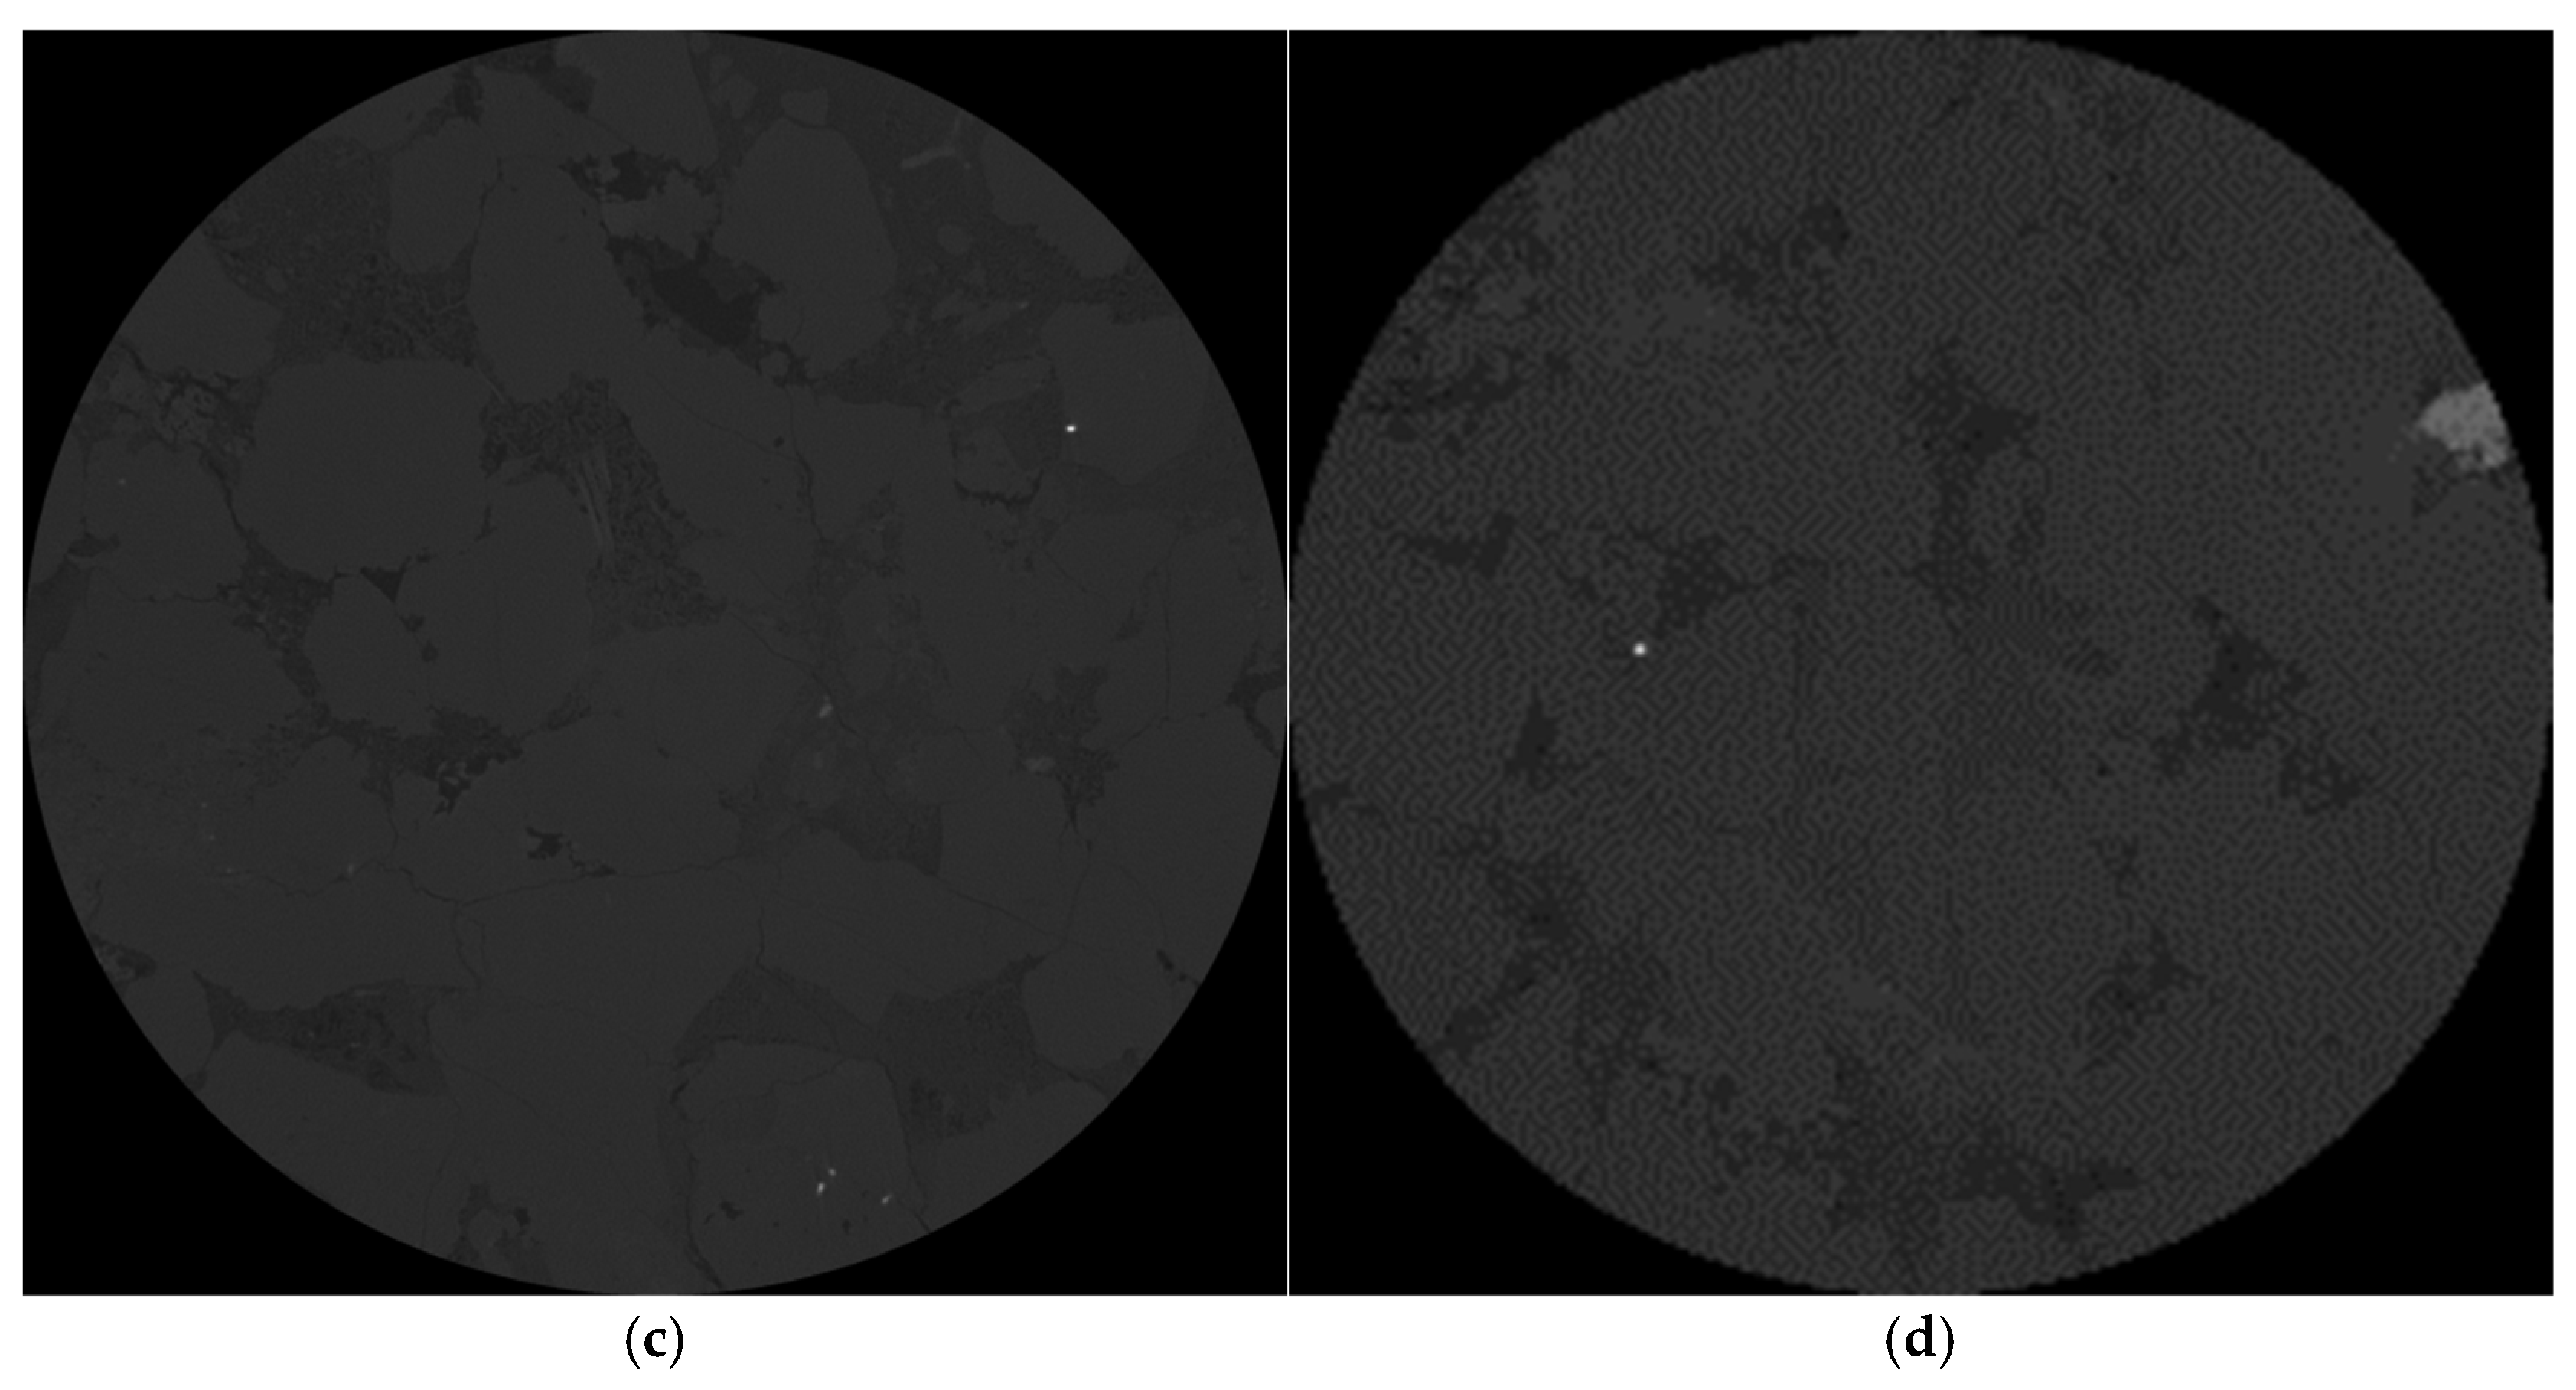
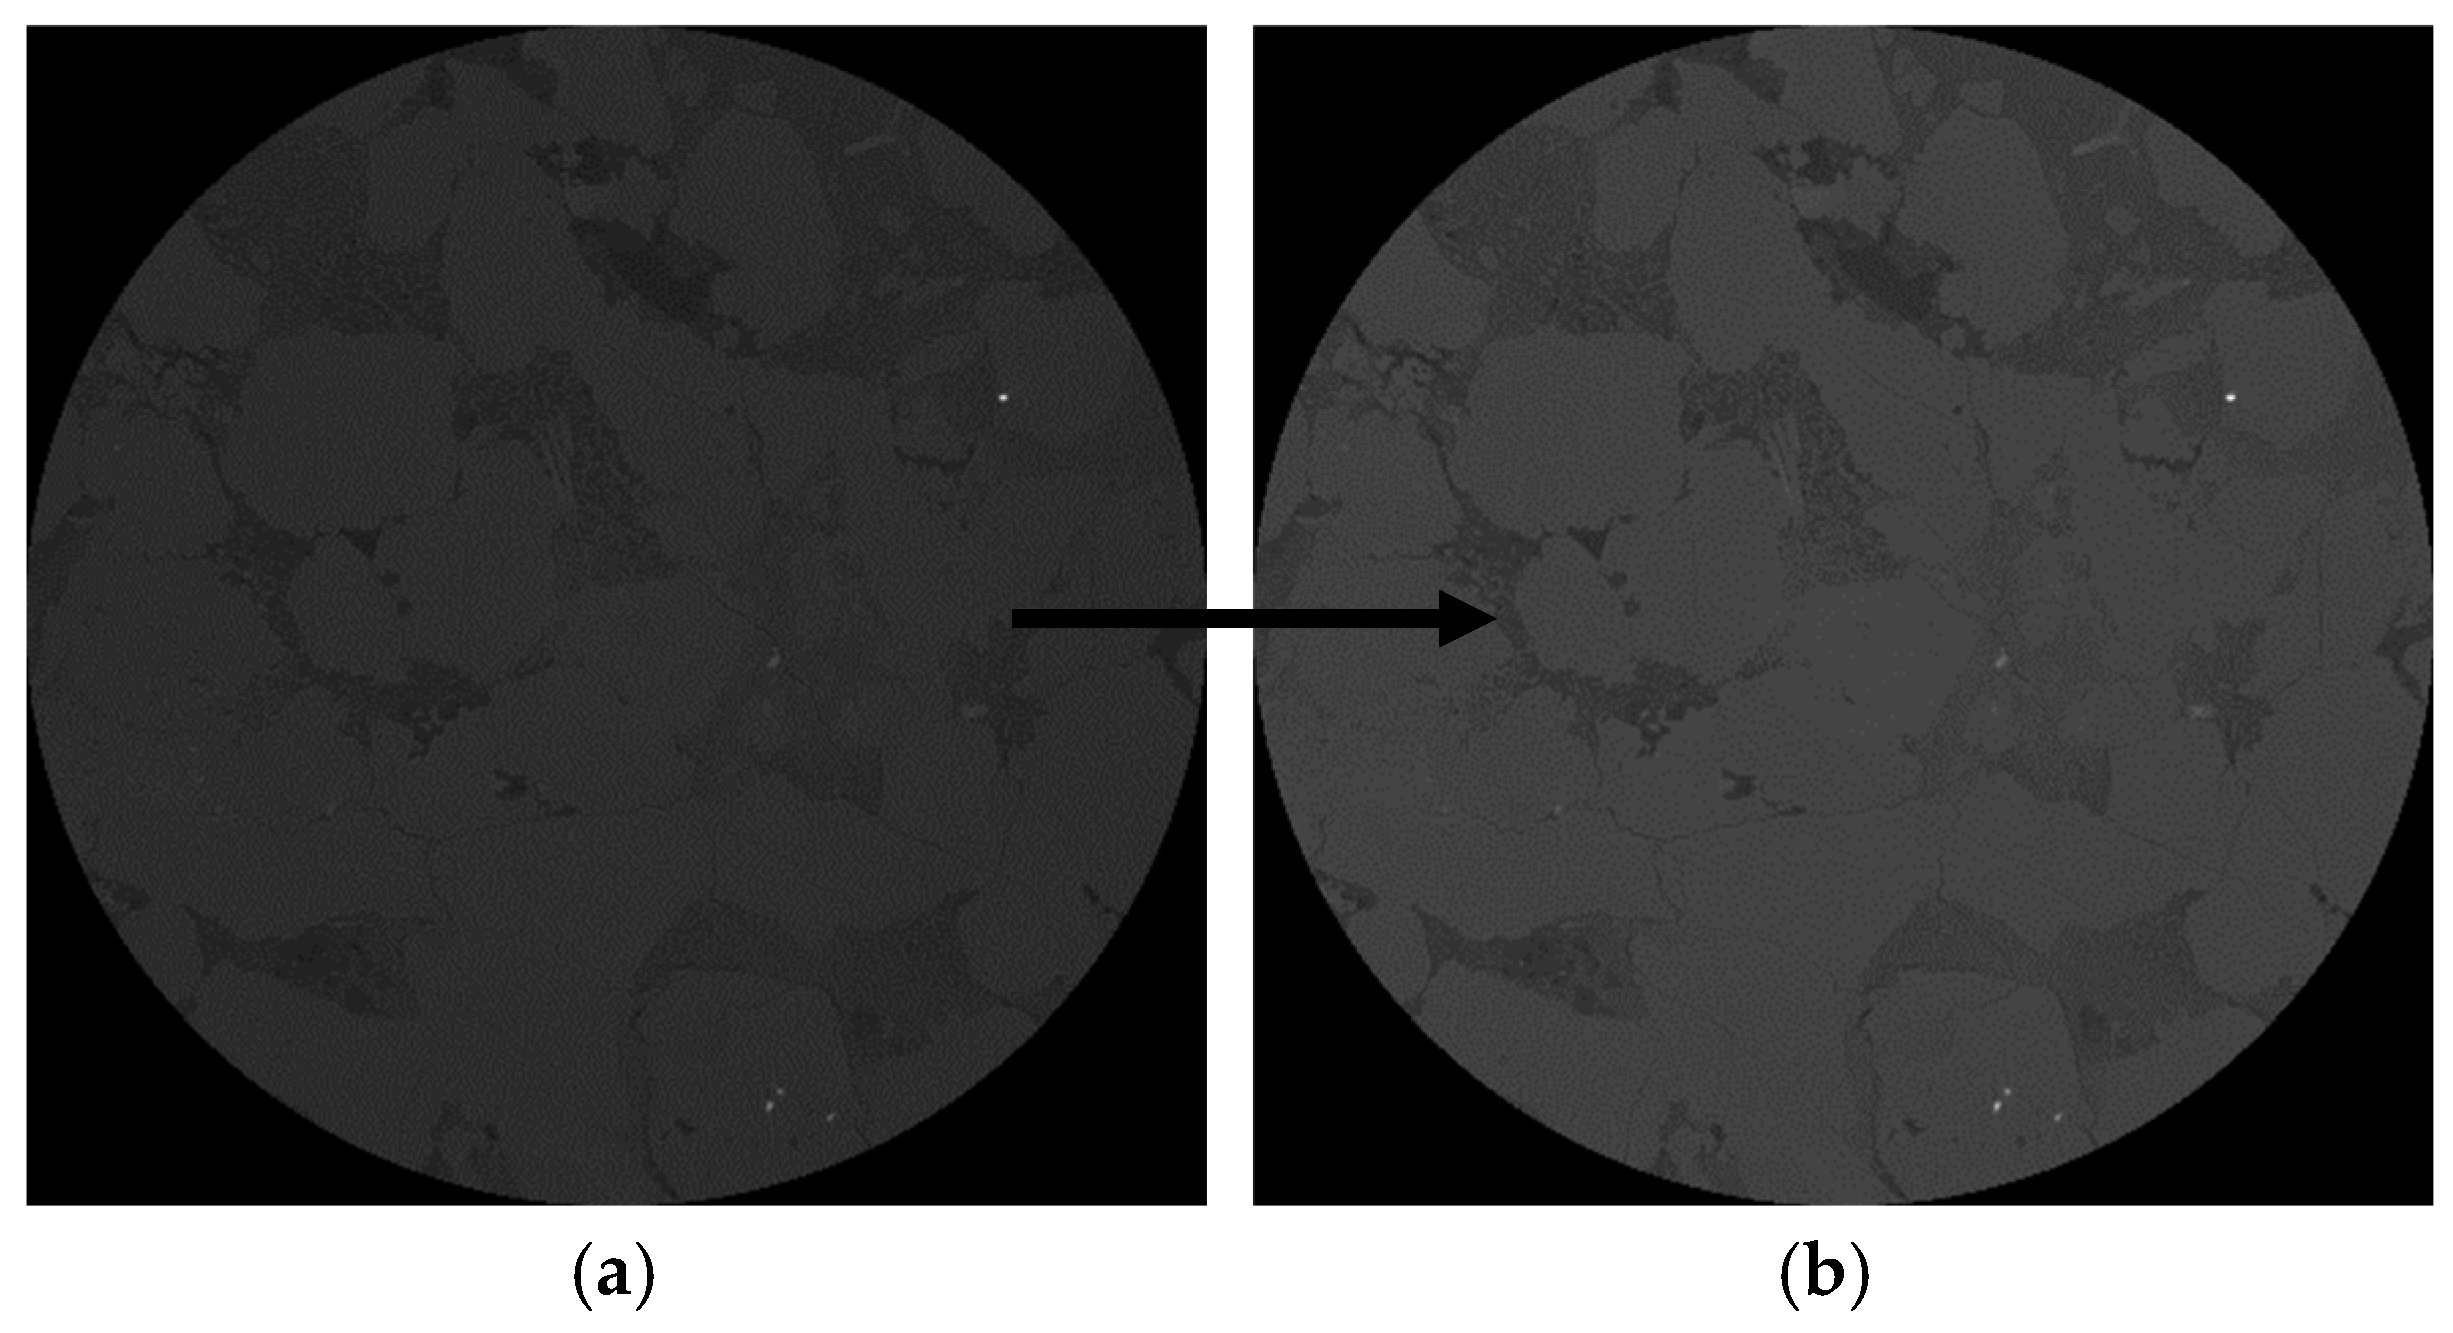
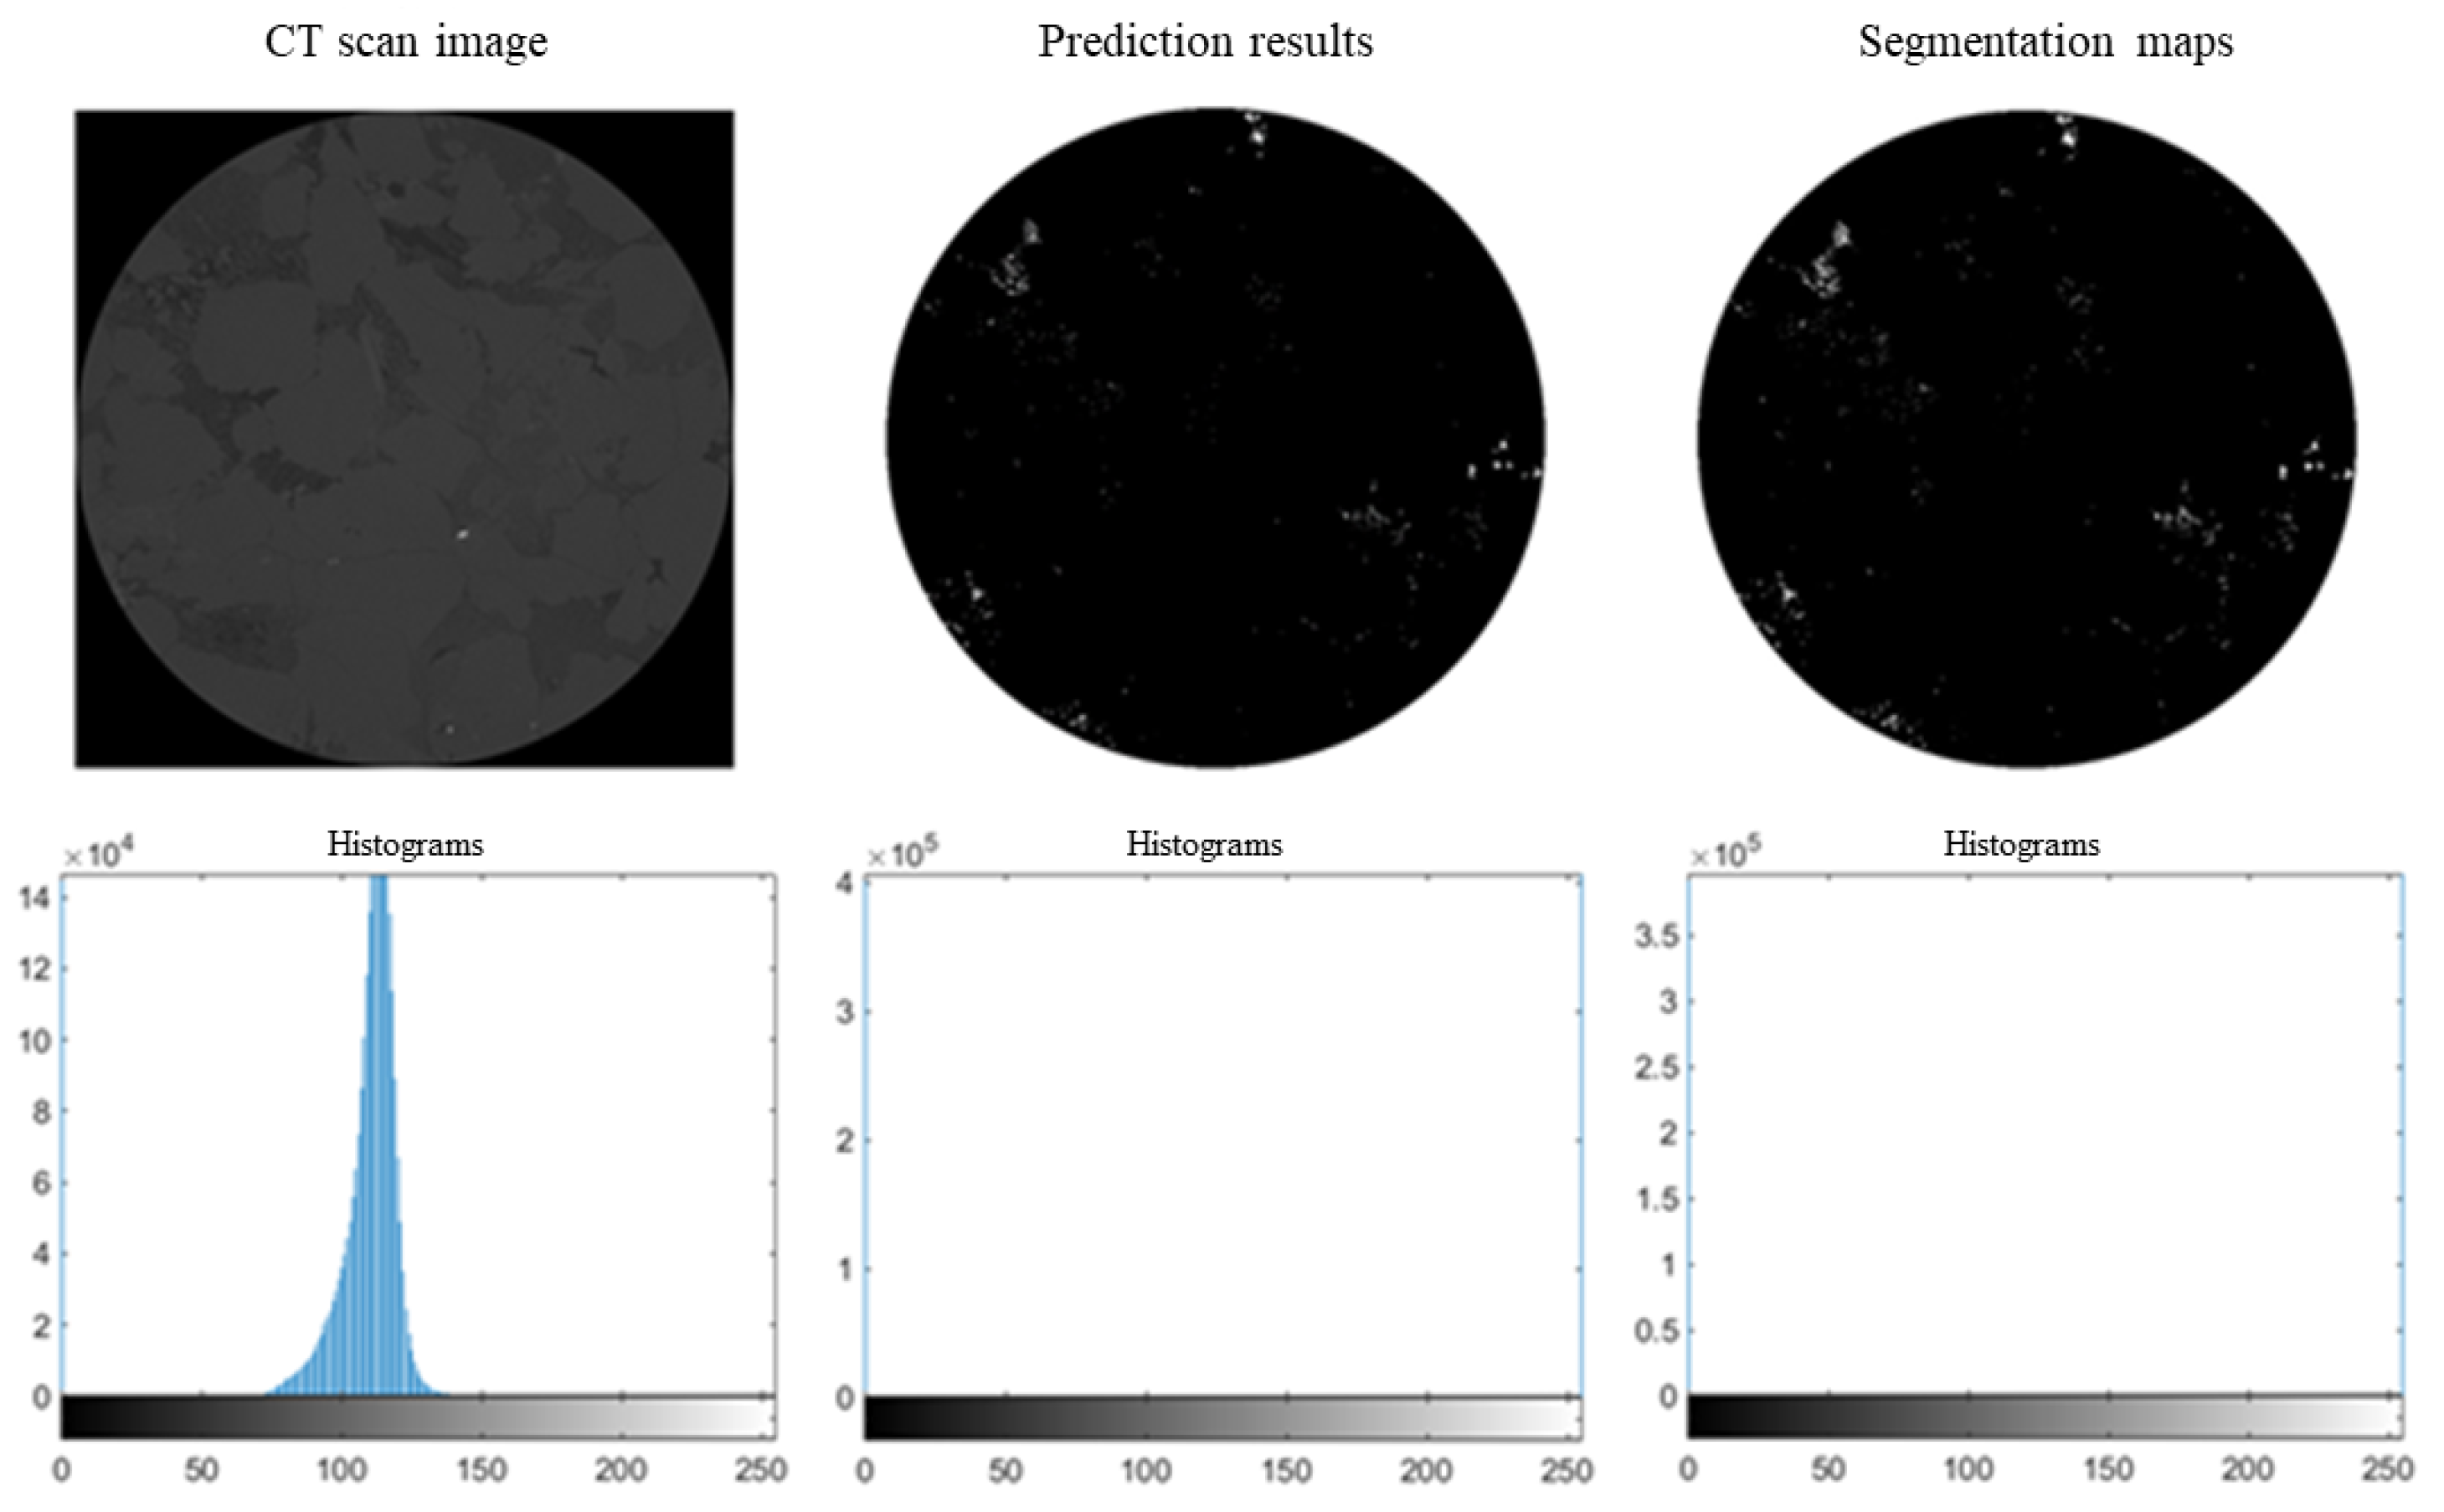
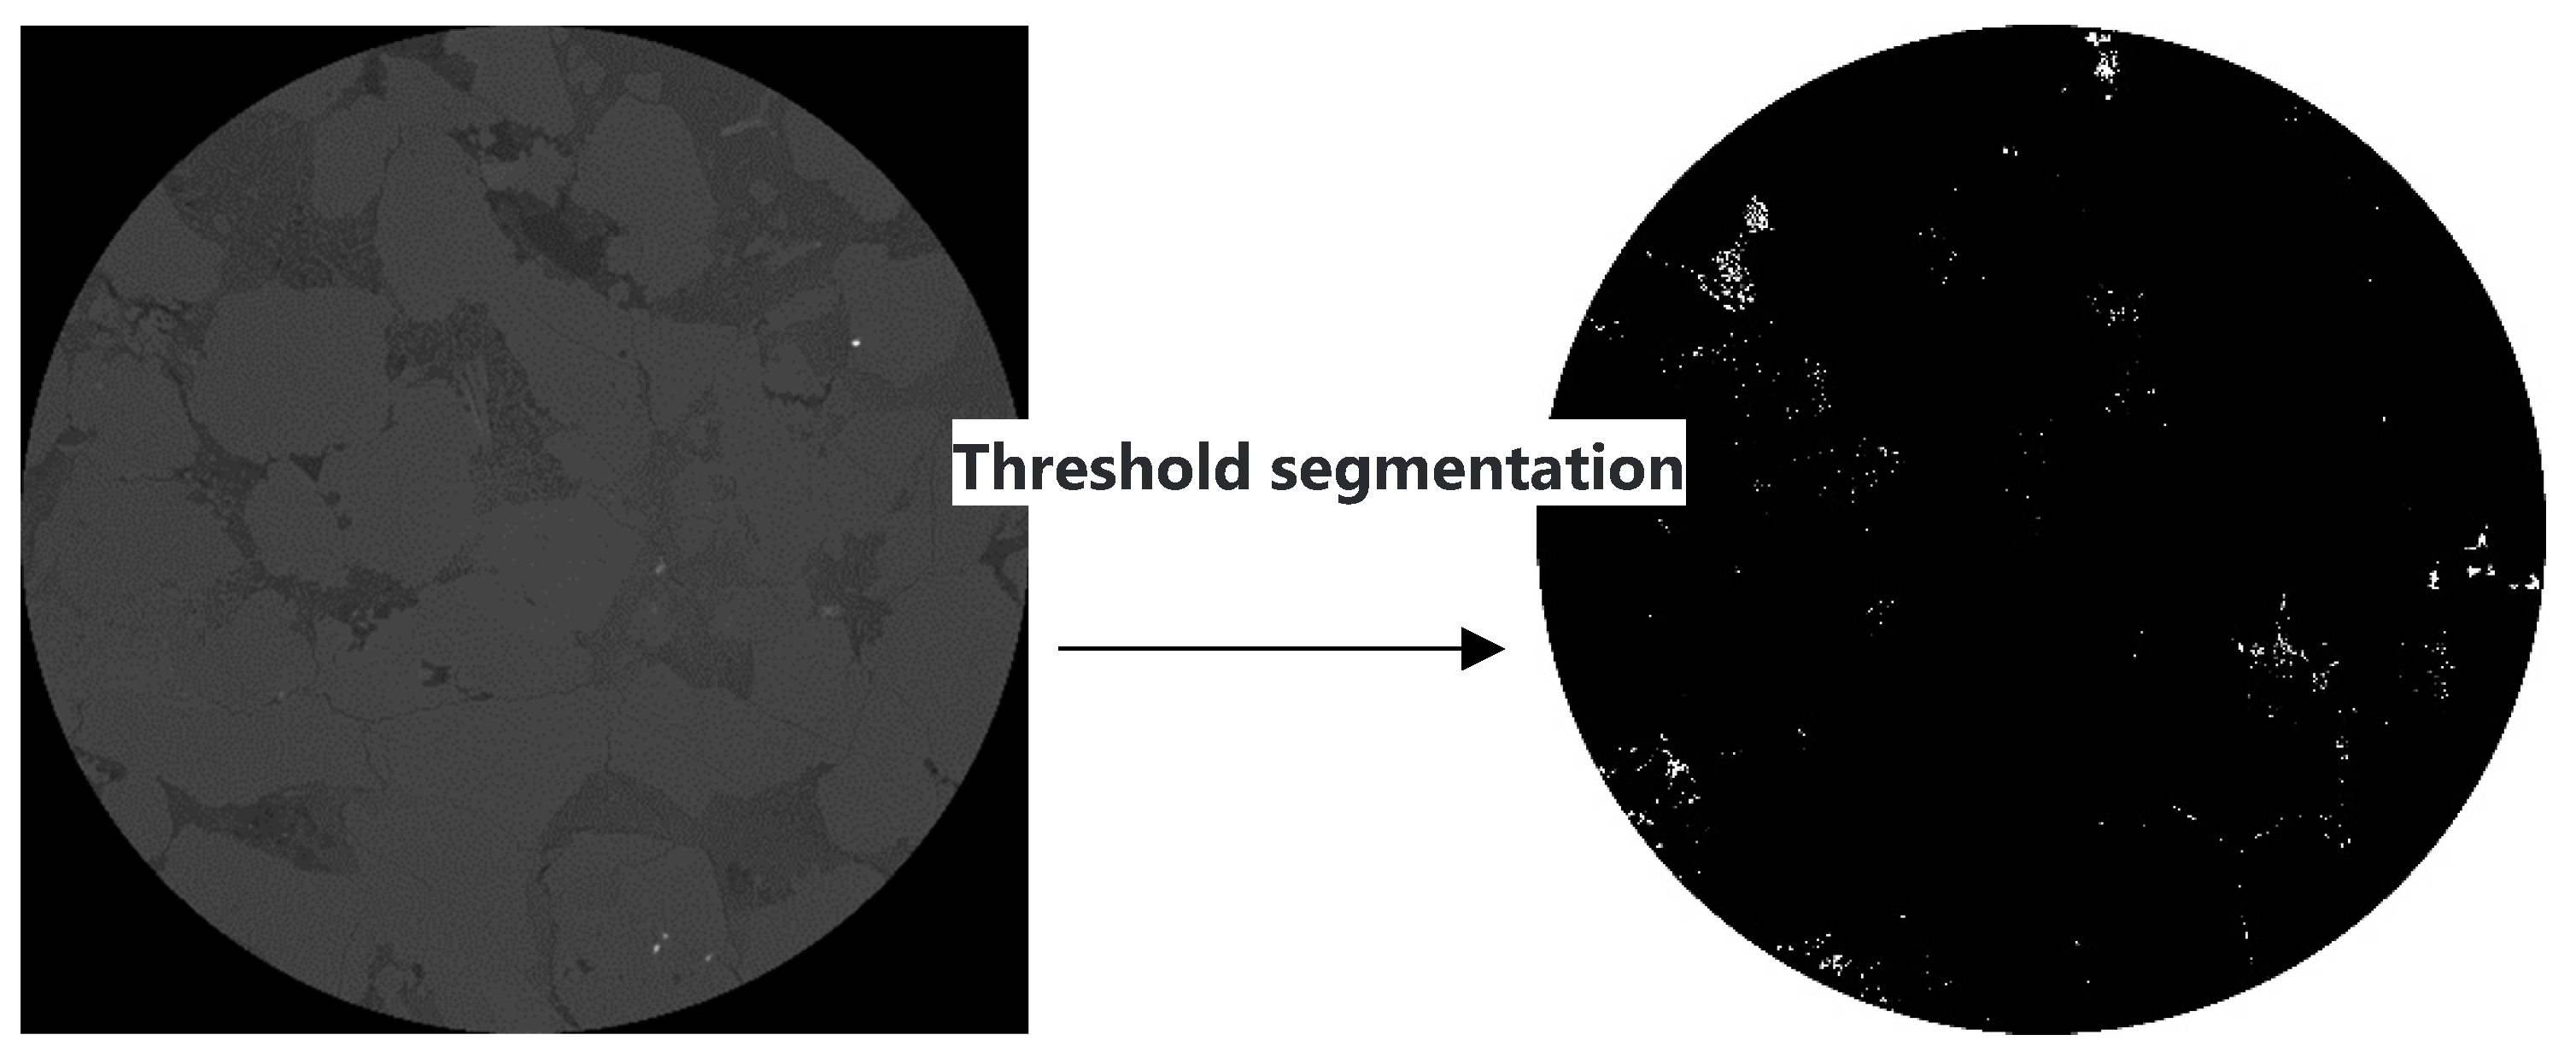
3. CT Scan Image Processing
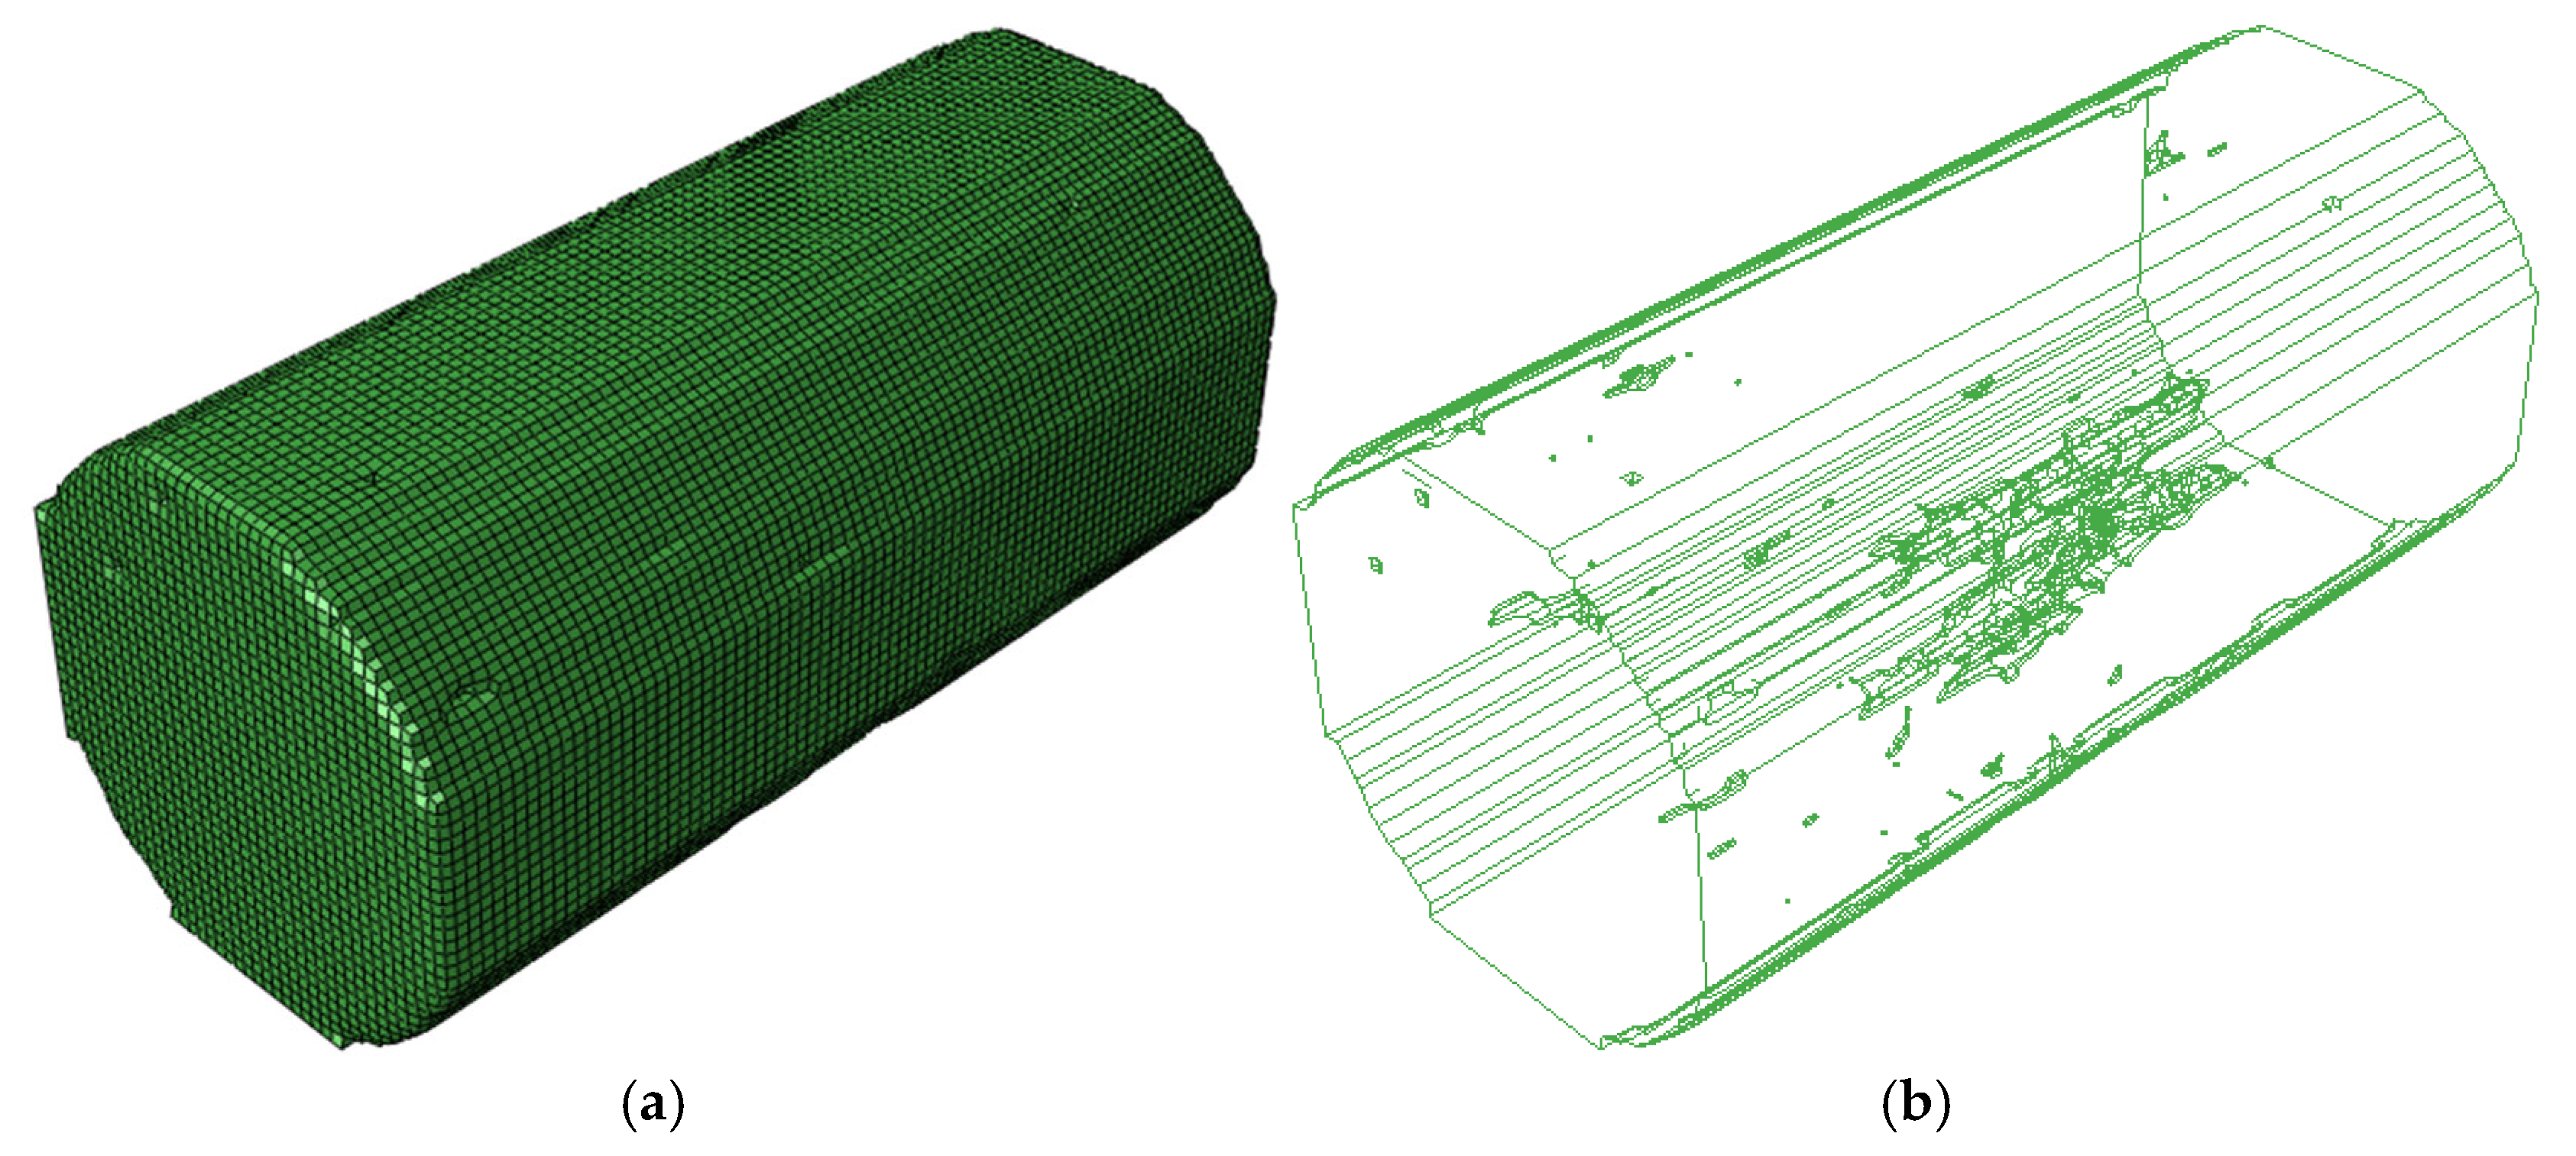
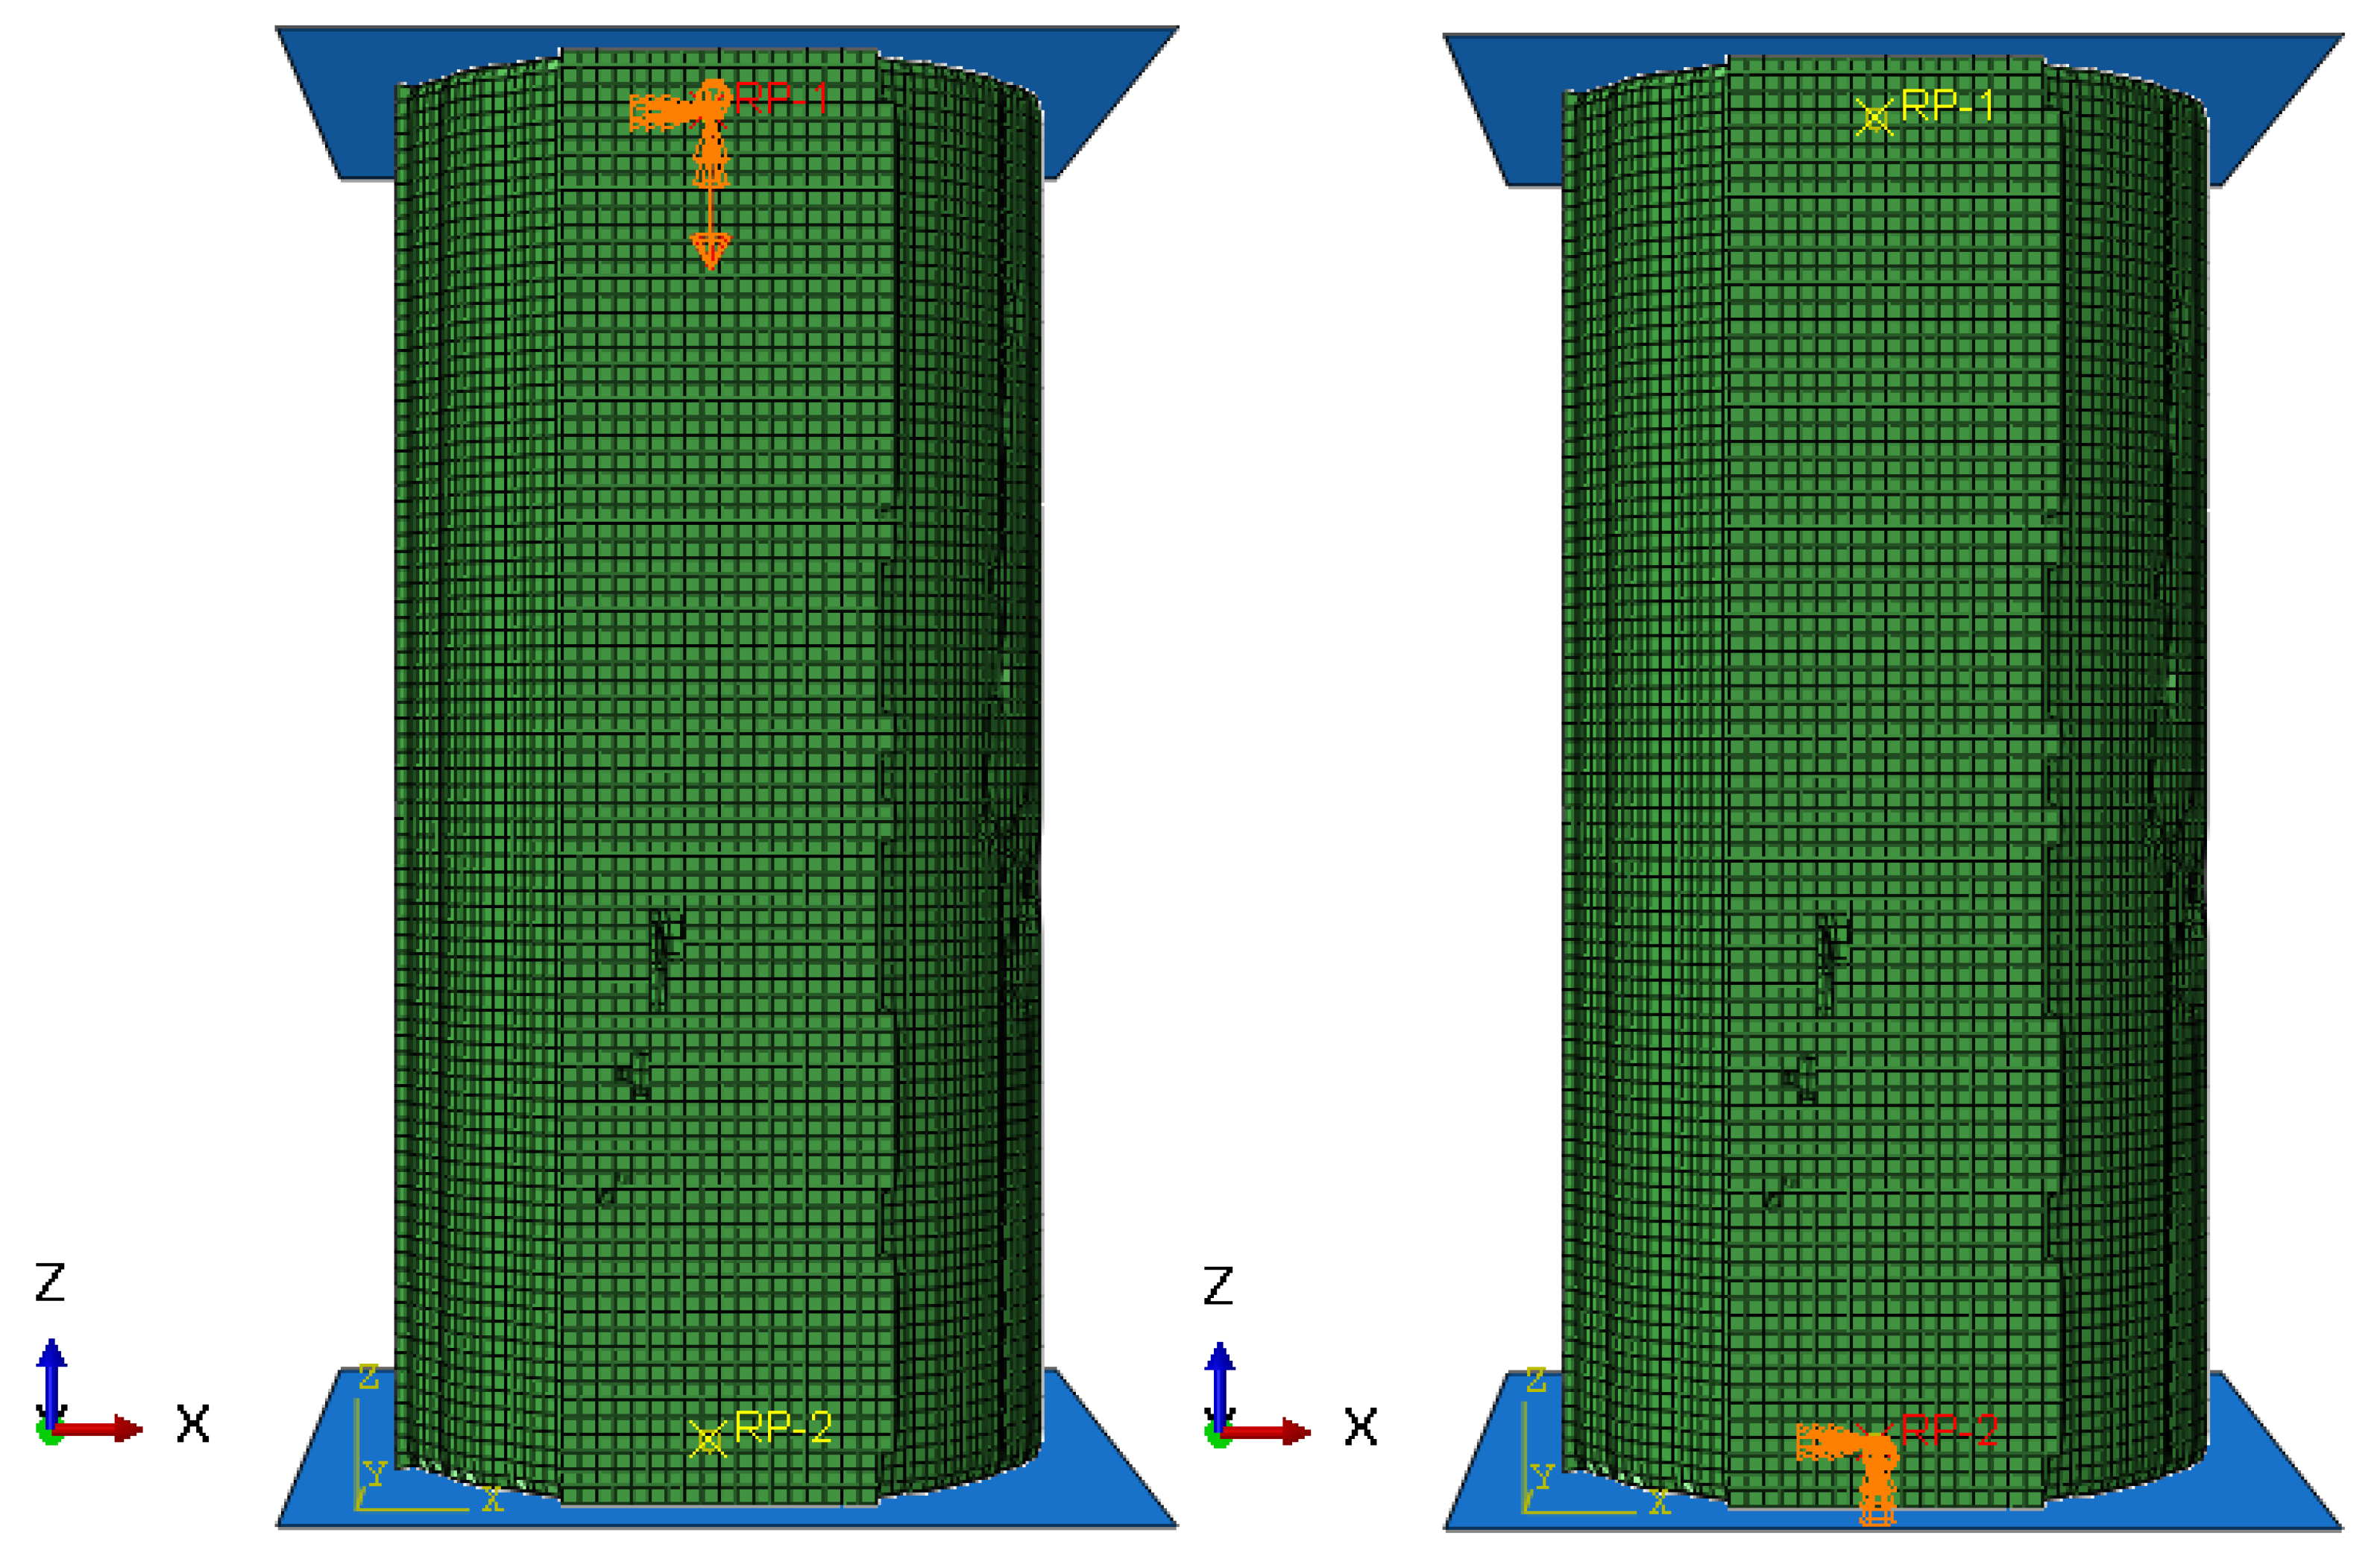
4. Numerical Simulation Test
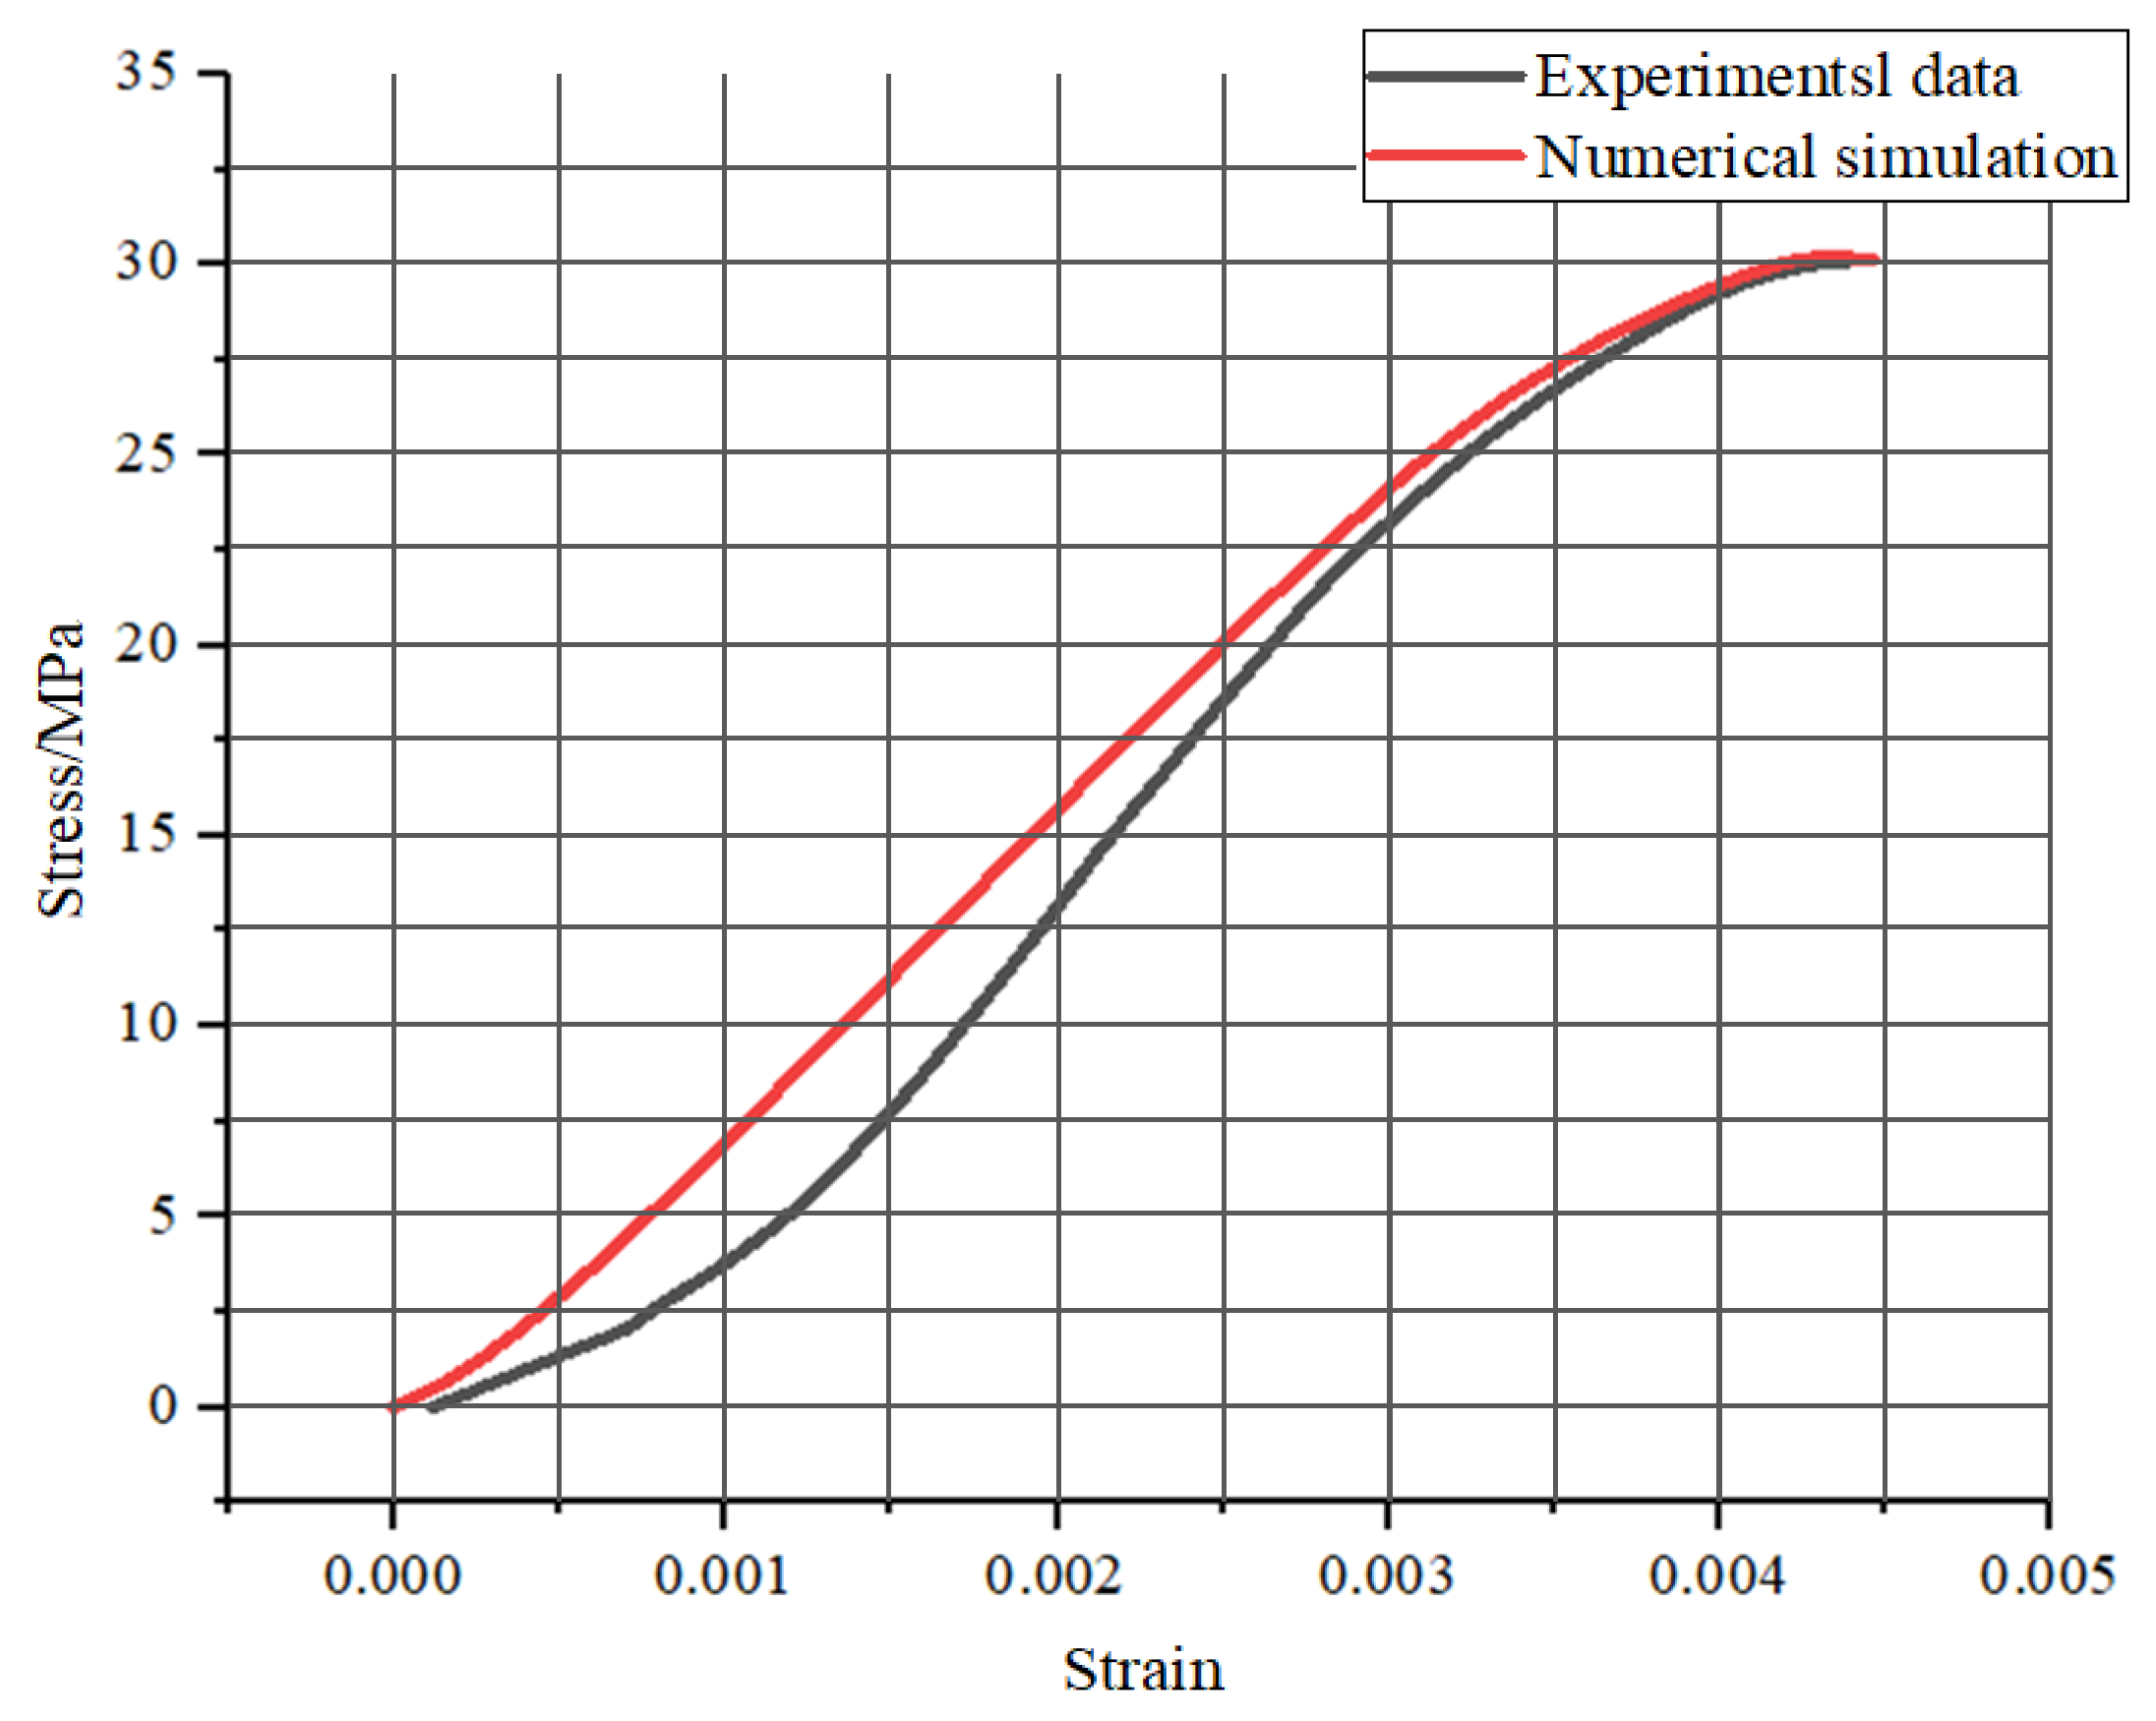
4.1. Model Validation
- (1)
- Initialization with experimental bulk modulus (K) and shear modulus (G);
- (2)
- Iterative adjustment of micromechanical parameters through conjugate gradient optimization;
- (3)
- Convergence validation using strain energy equivalence criteria;
- (4)
- The calibrated constitutive parameters (Table 3) govern the finite element formulation, which integrates two critical computational mechanics considerations.
- (1)
- Pre-peak: Tangent stiffness matching within 5% tolerance;
- (2)
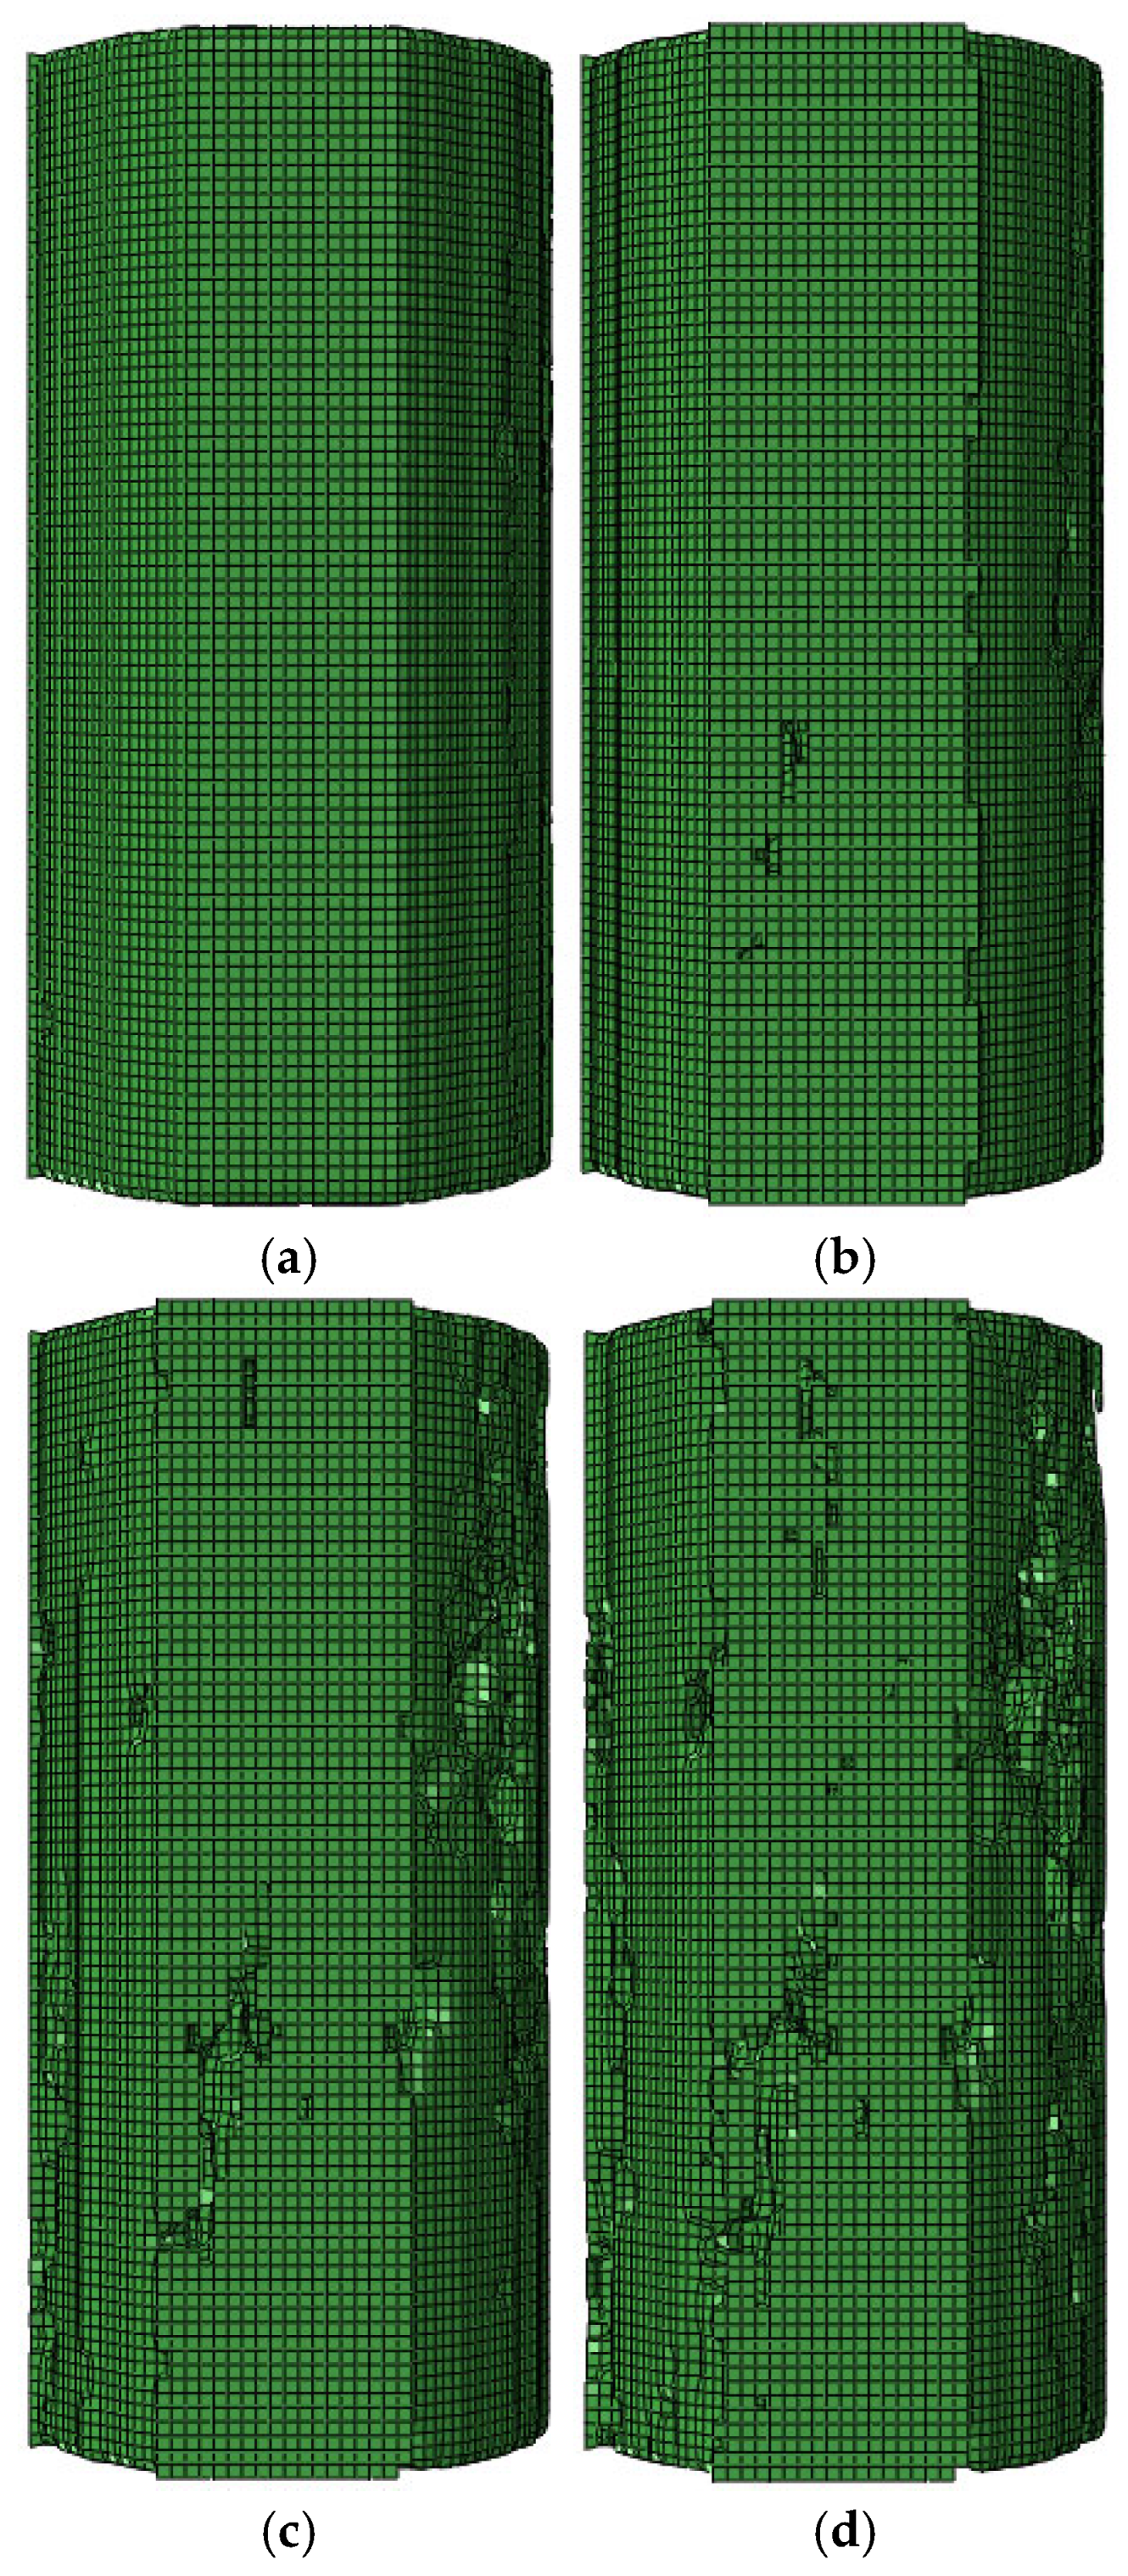
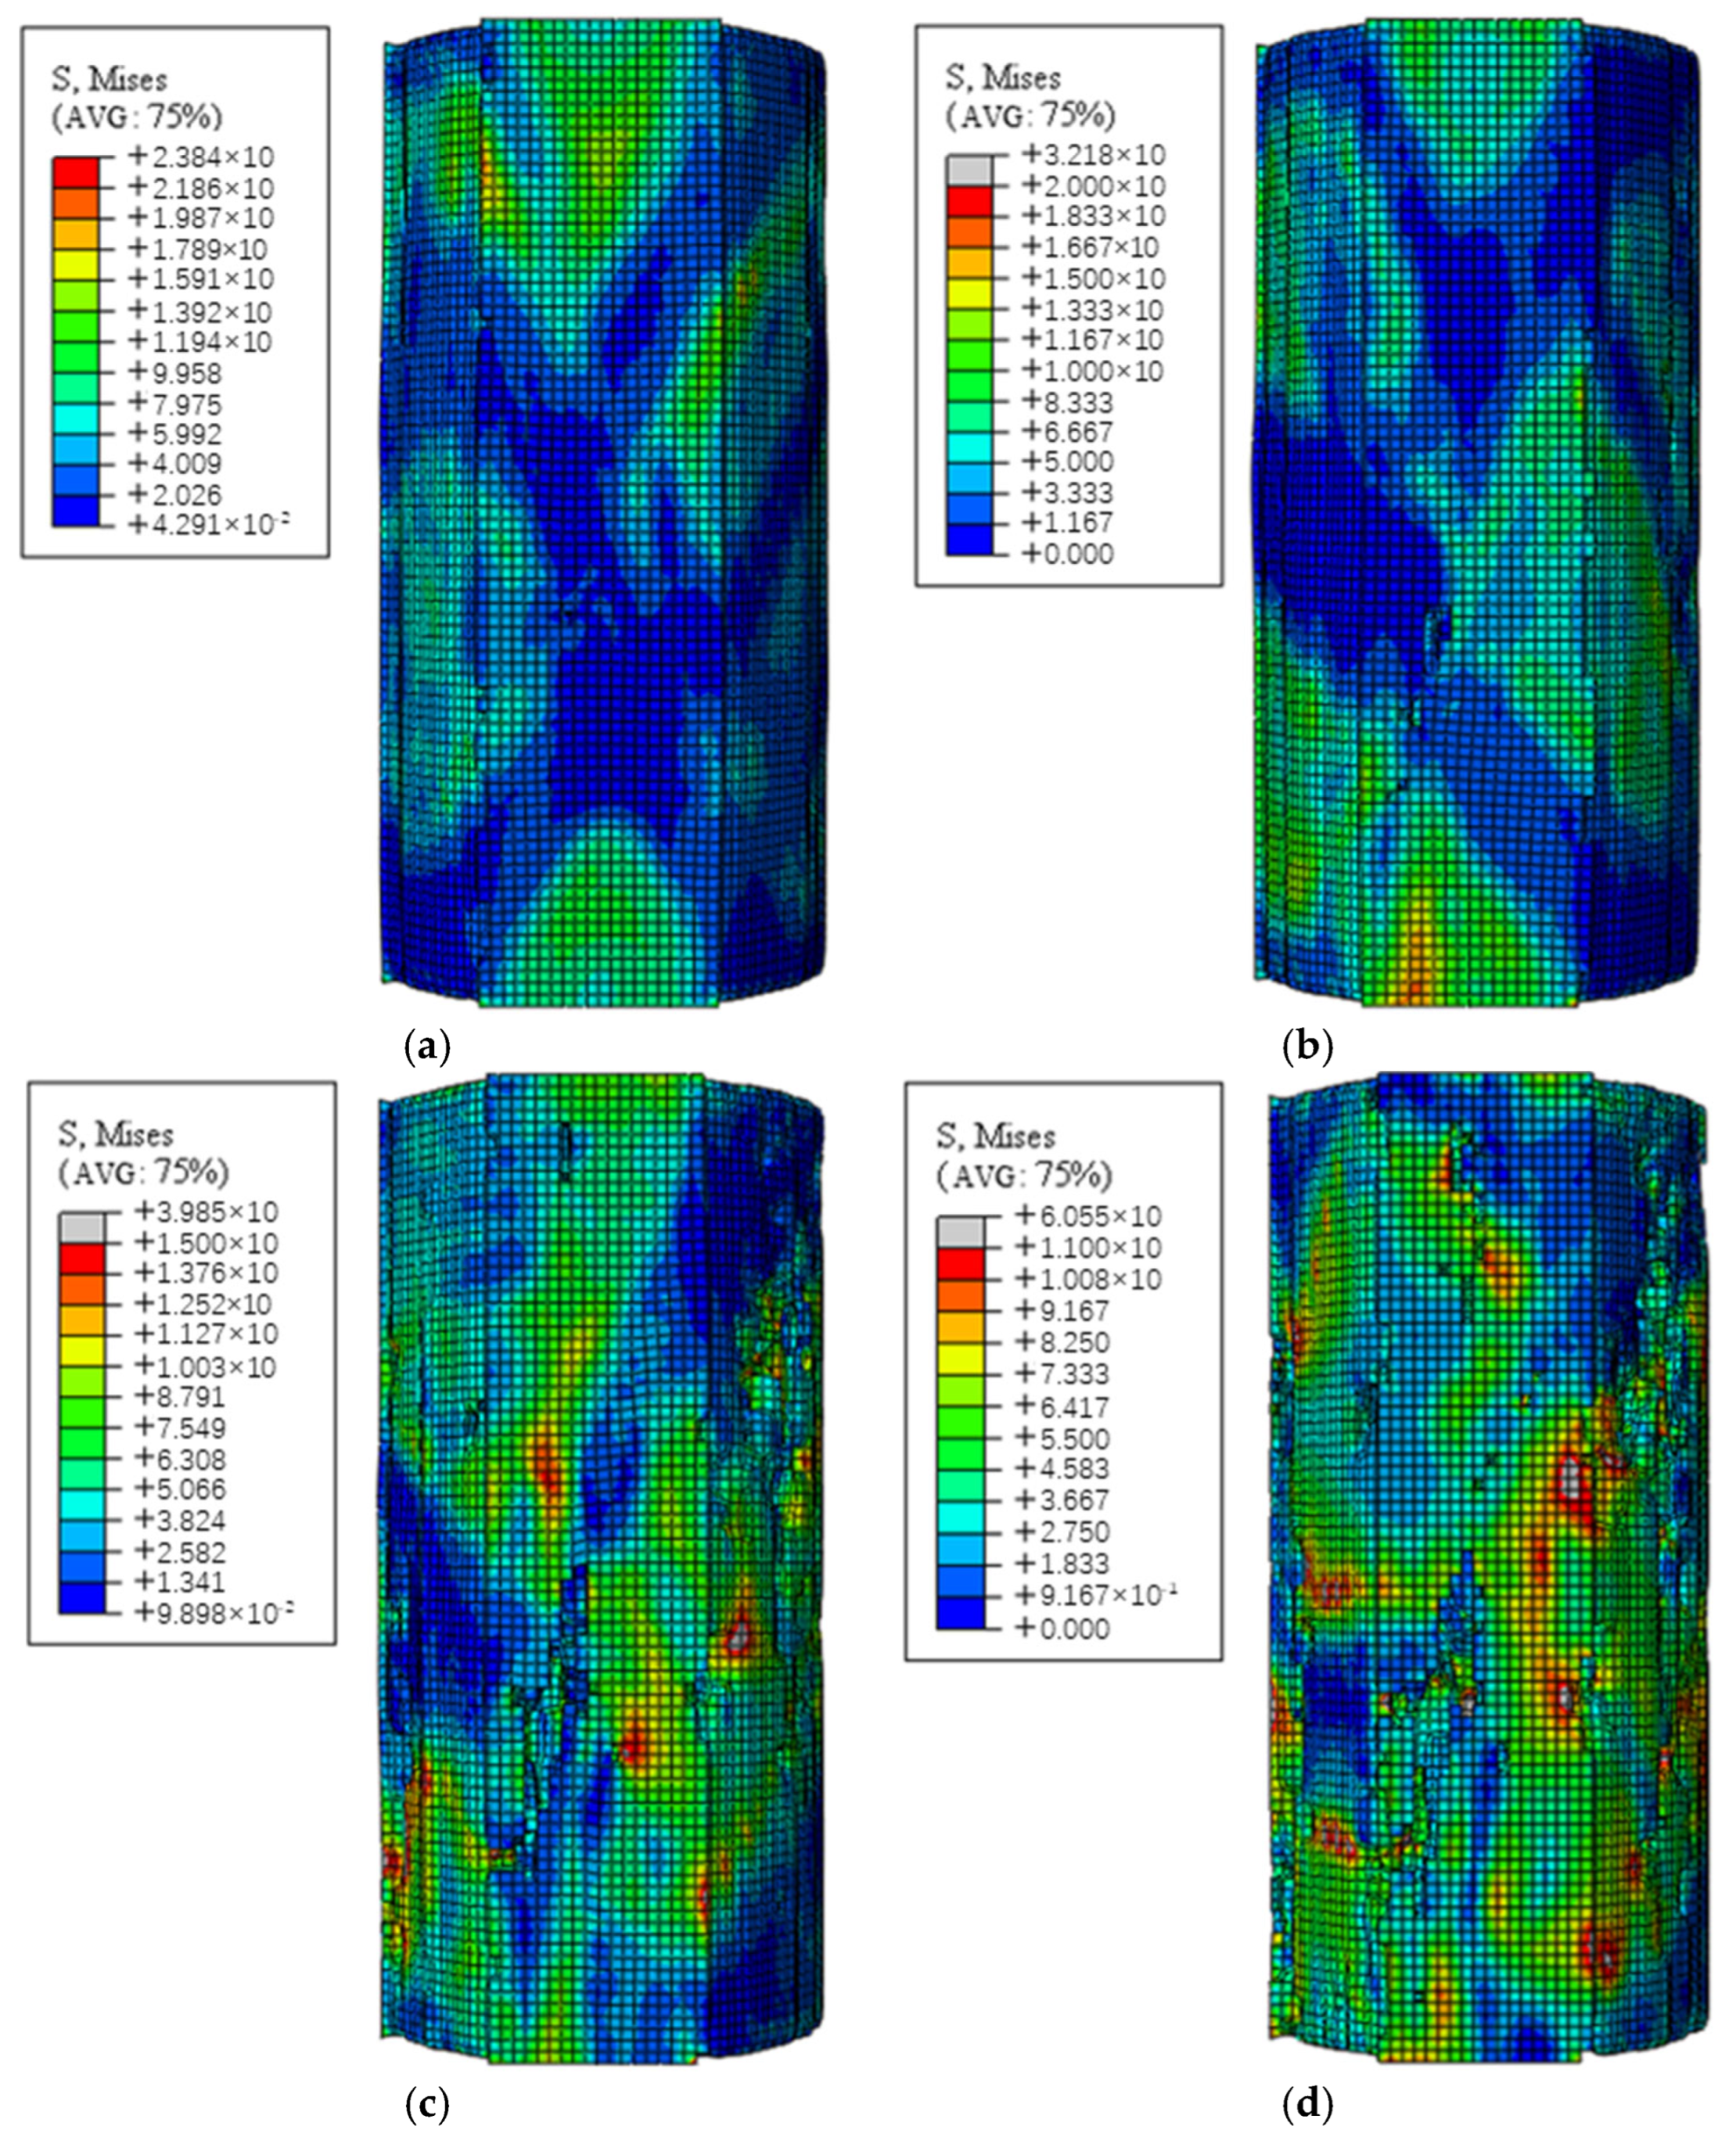
- Post-peak: Strain localization patterns mirroring experimental fracture propagation.
4.2. Different Porosity Model Test
5. Conclusions
- (1)
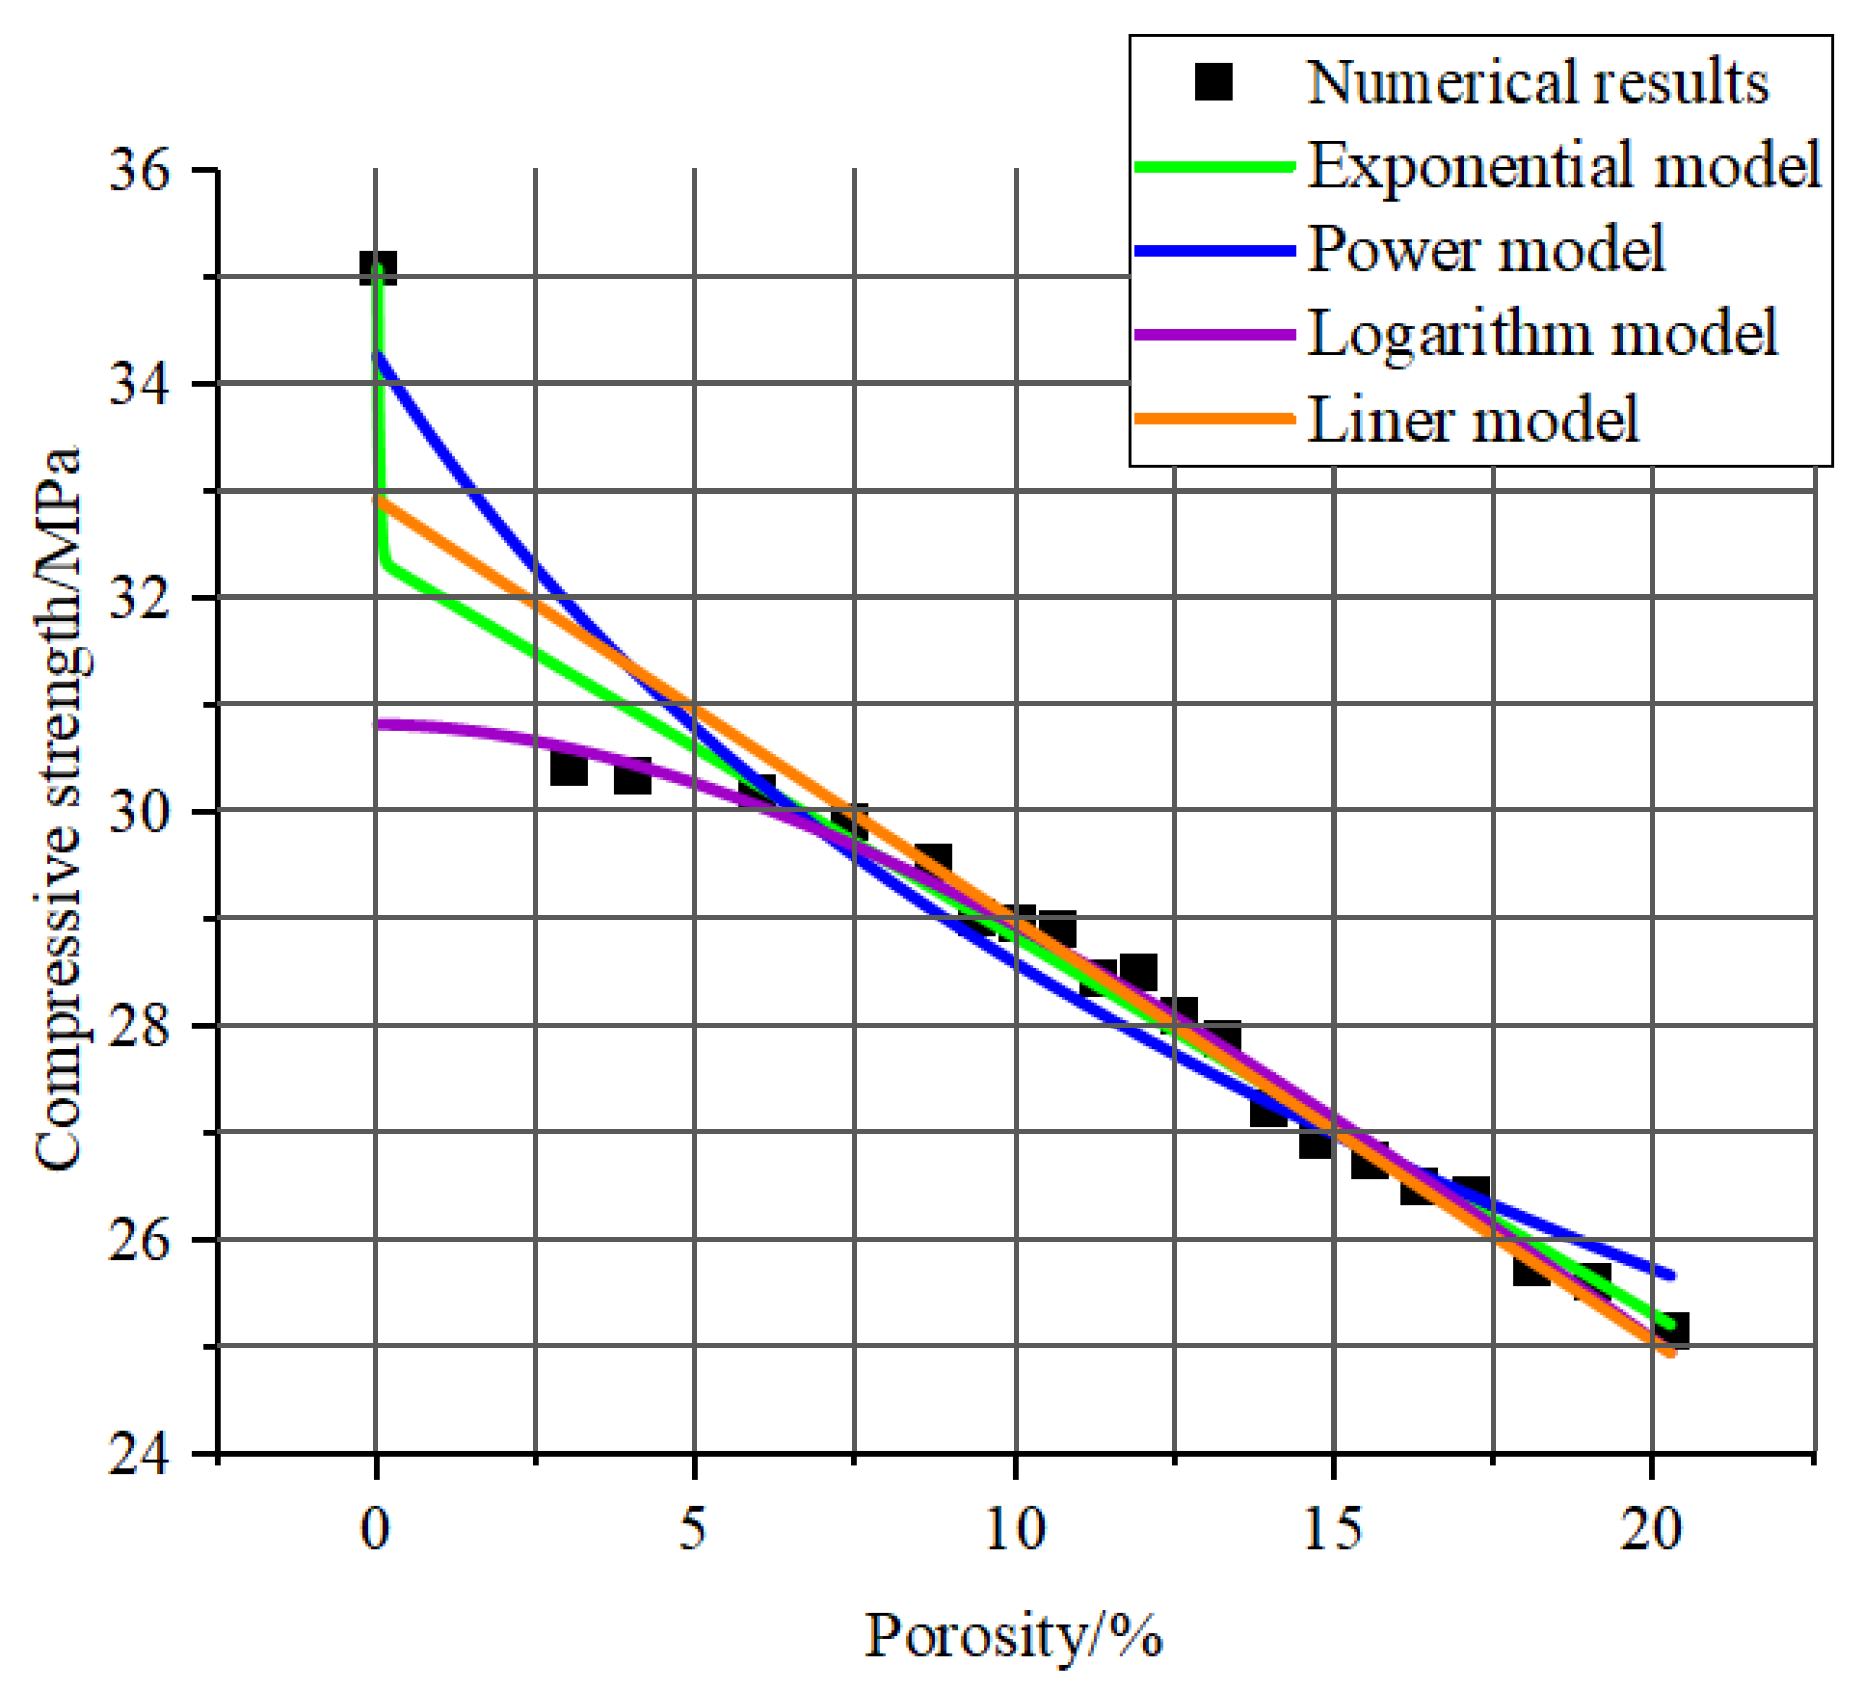
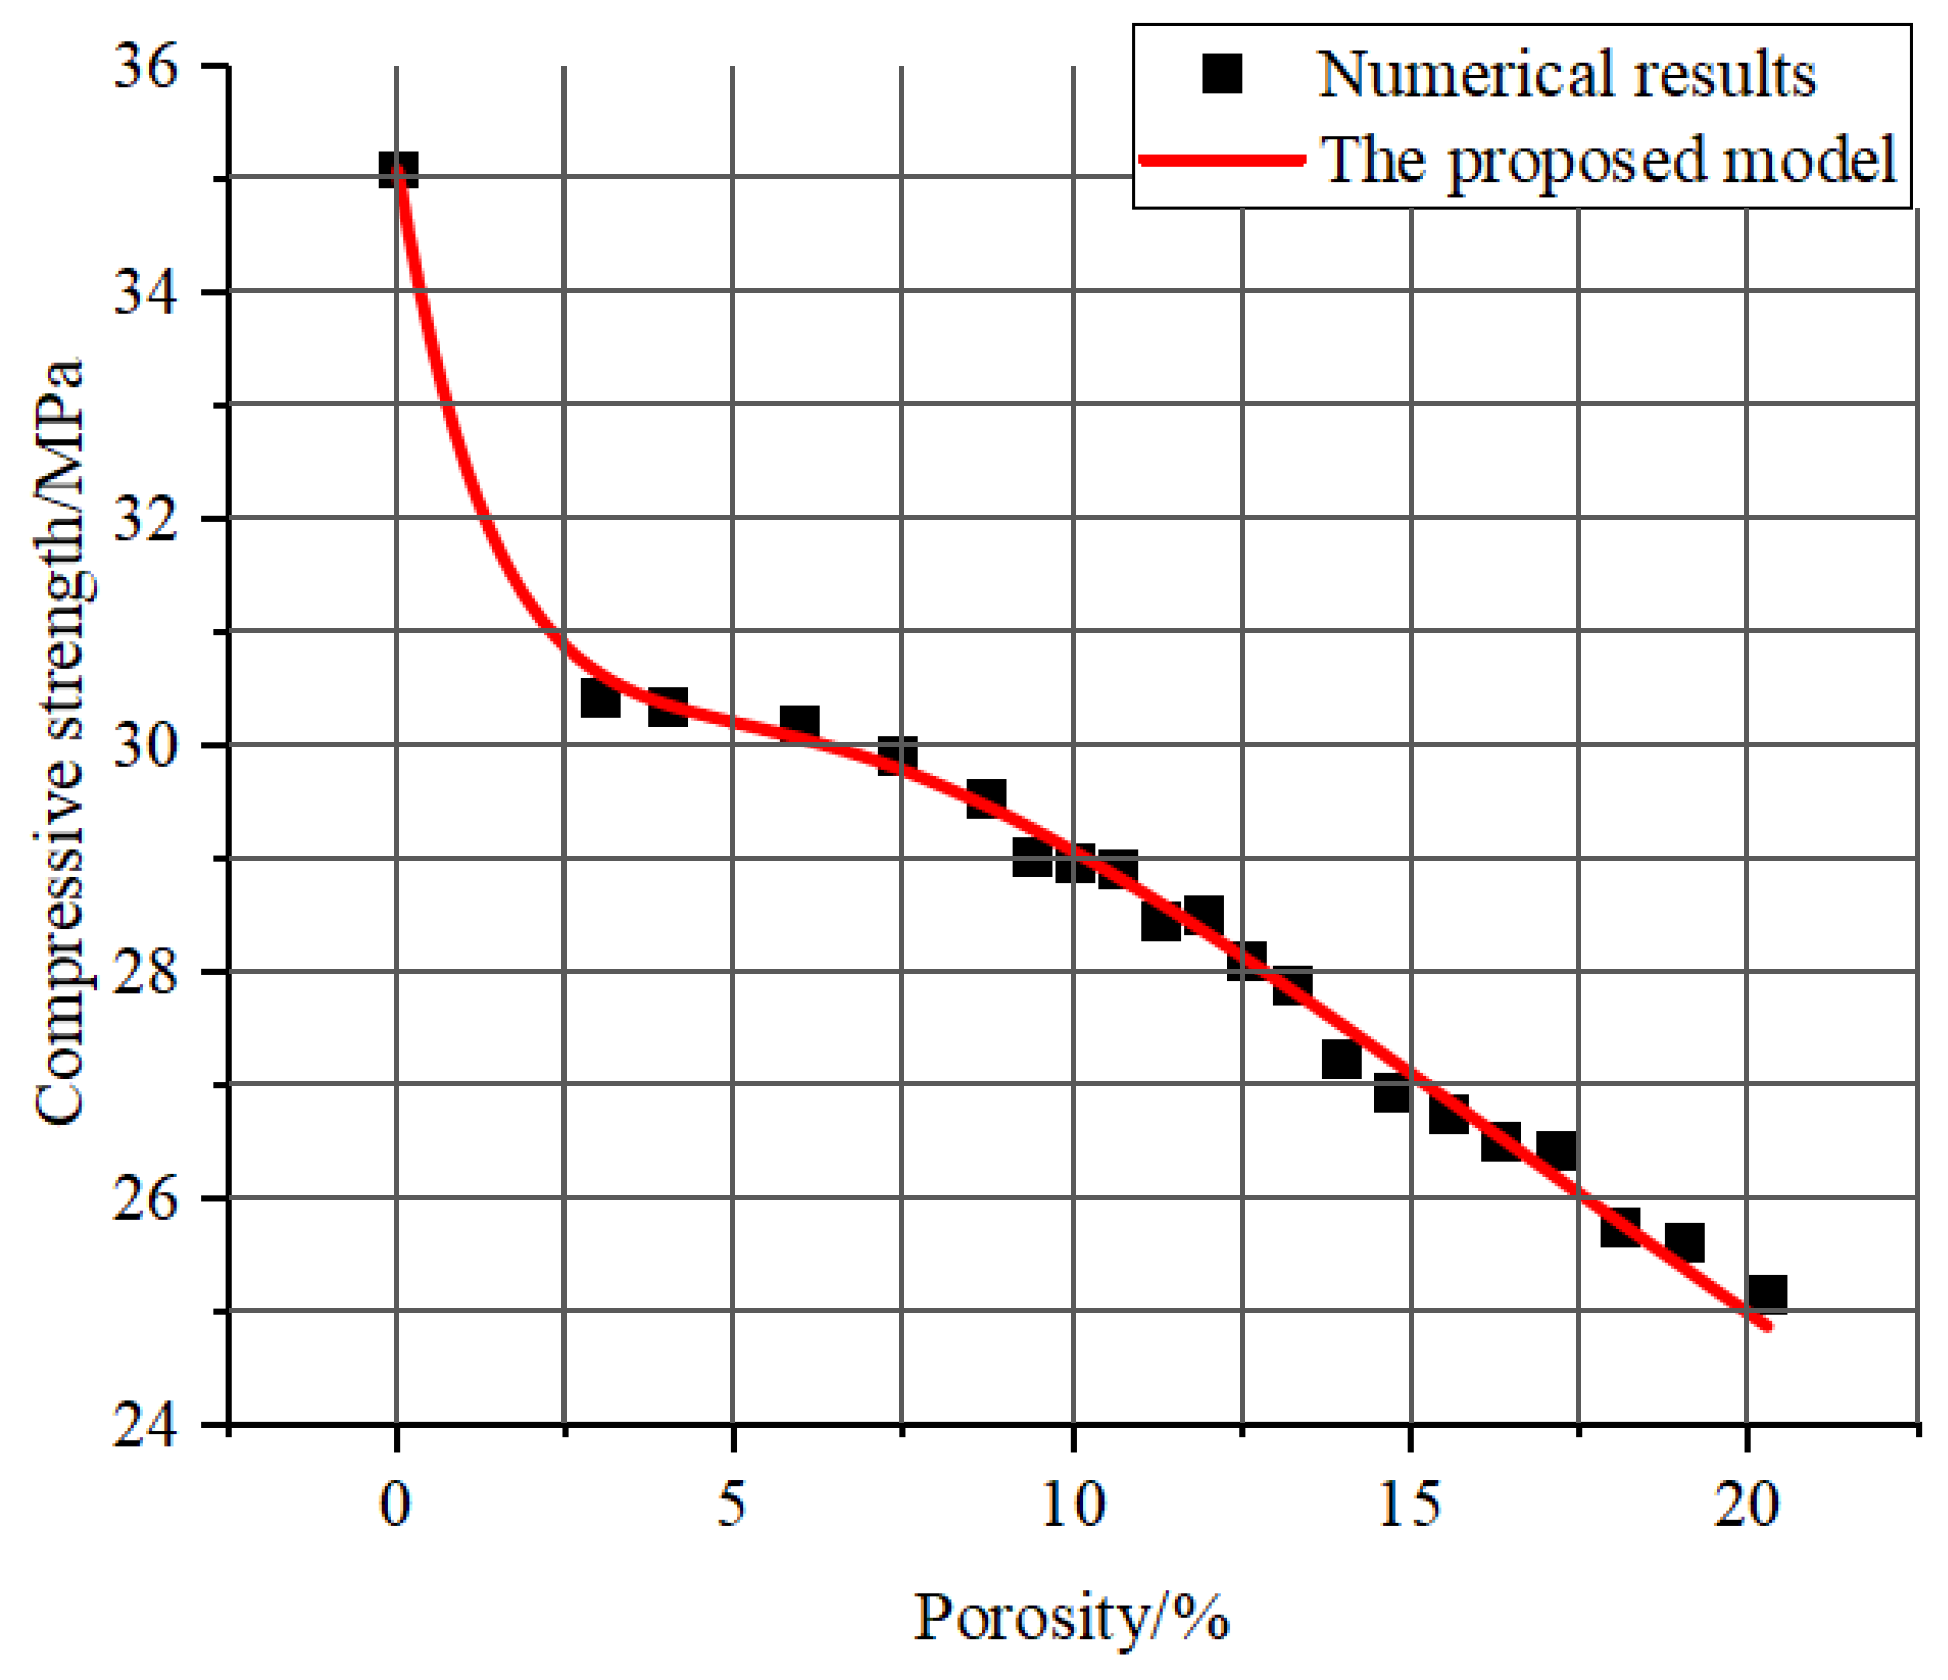
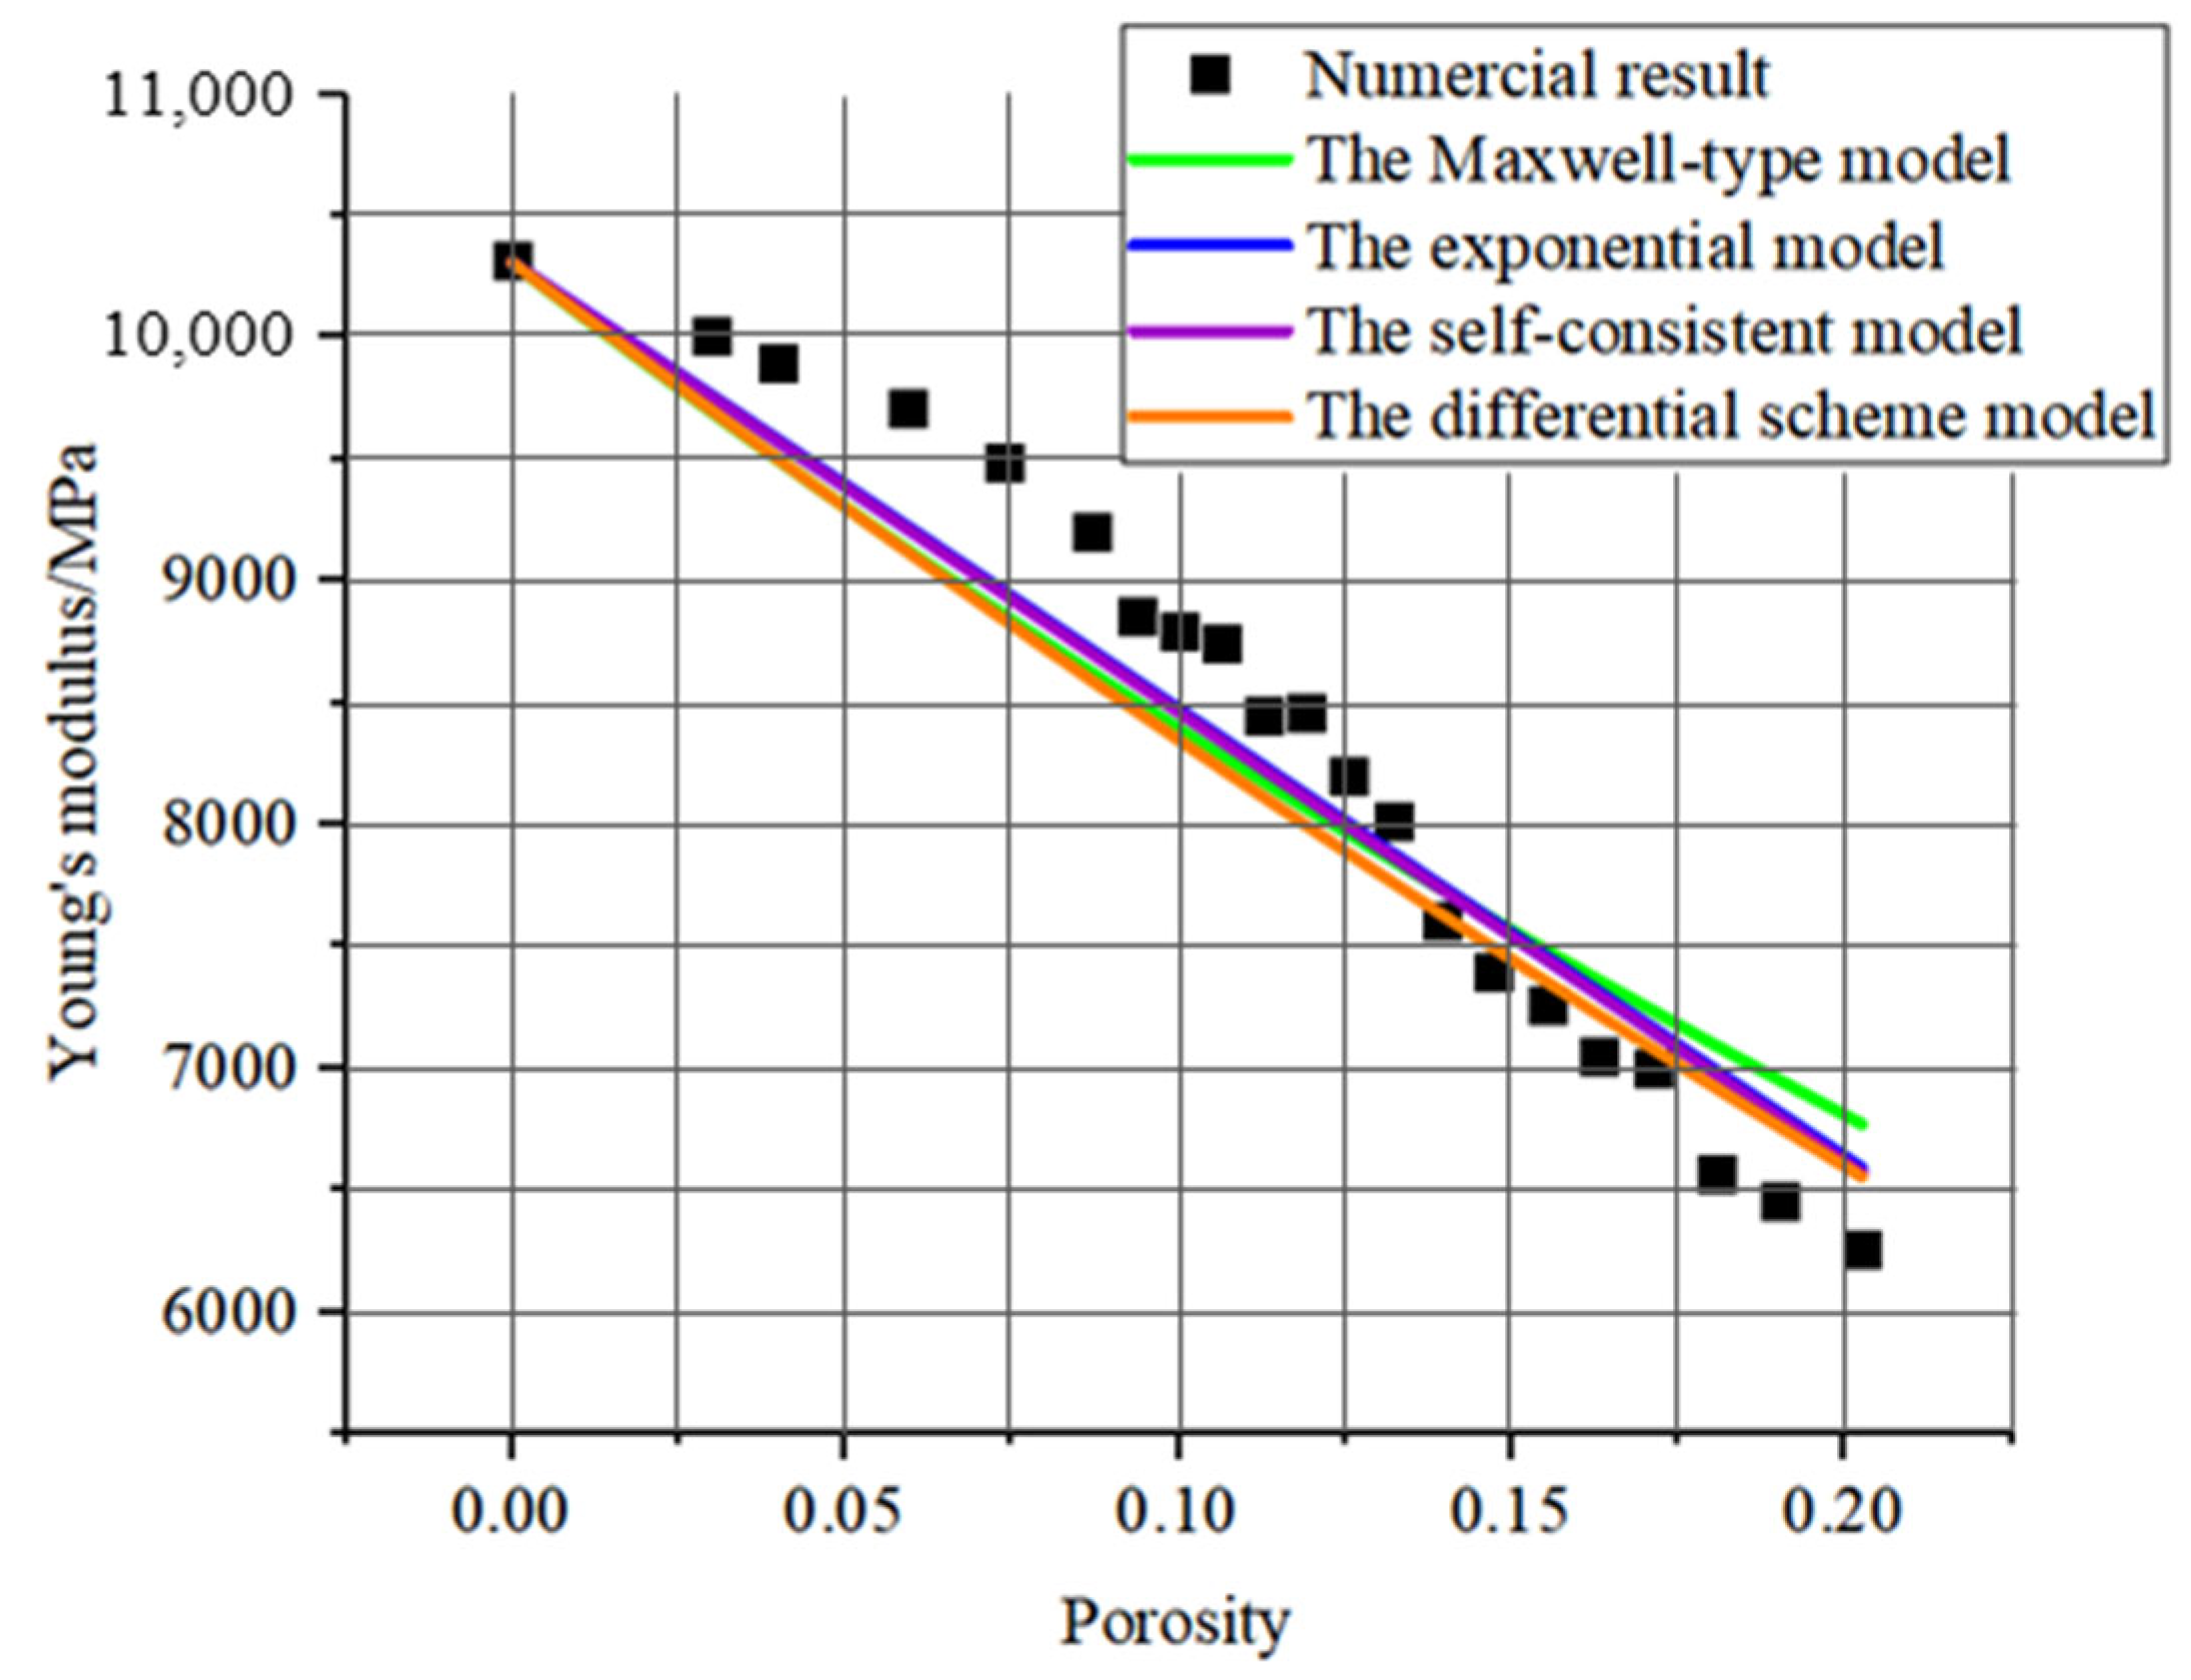
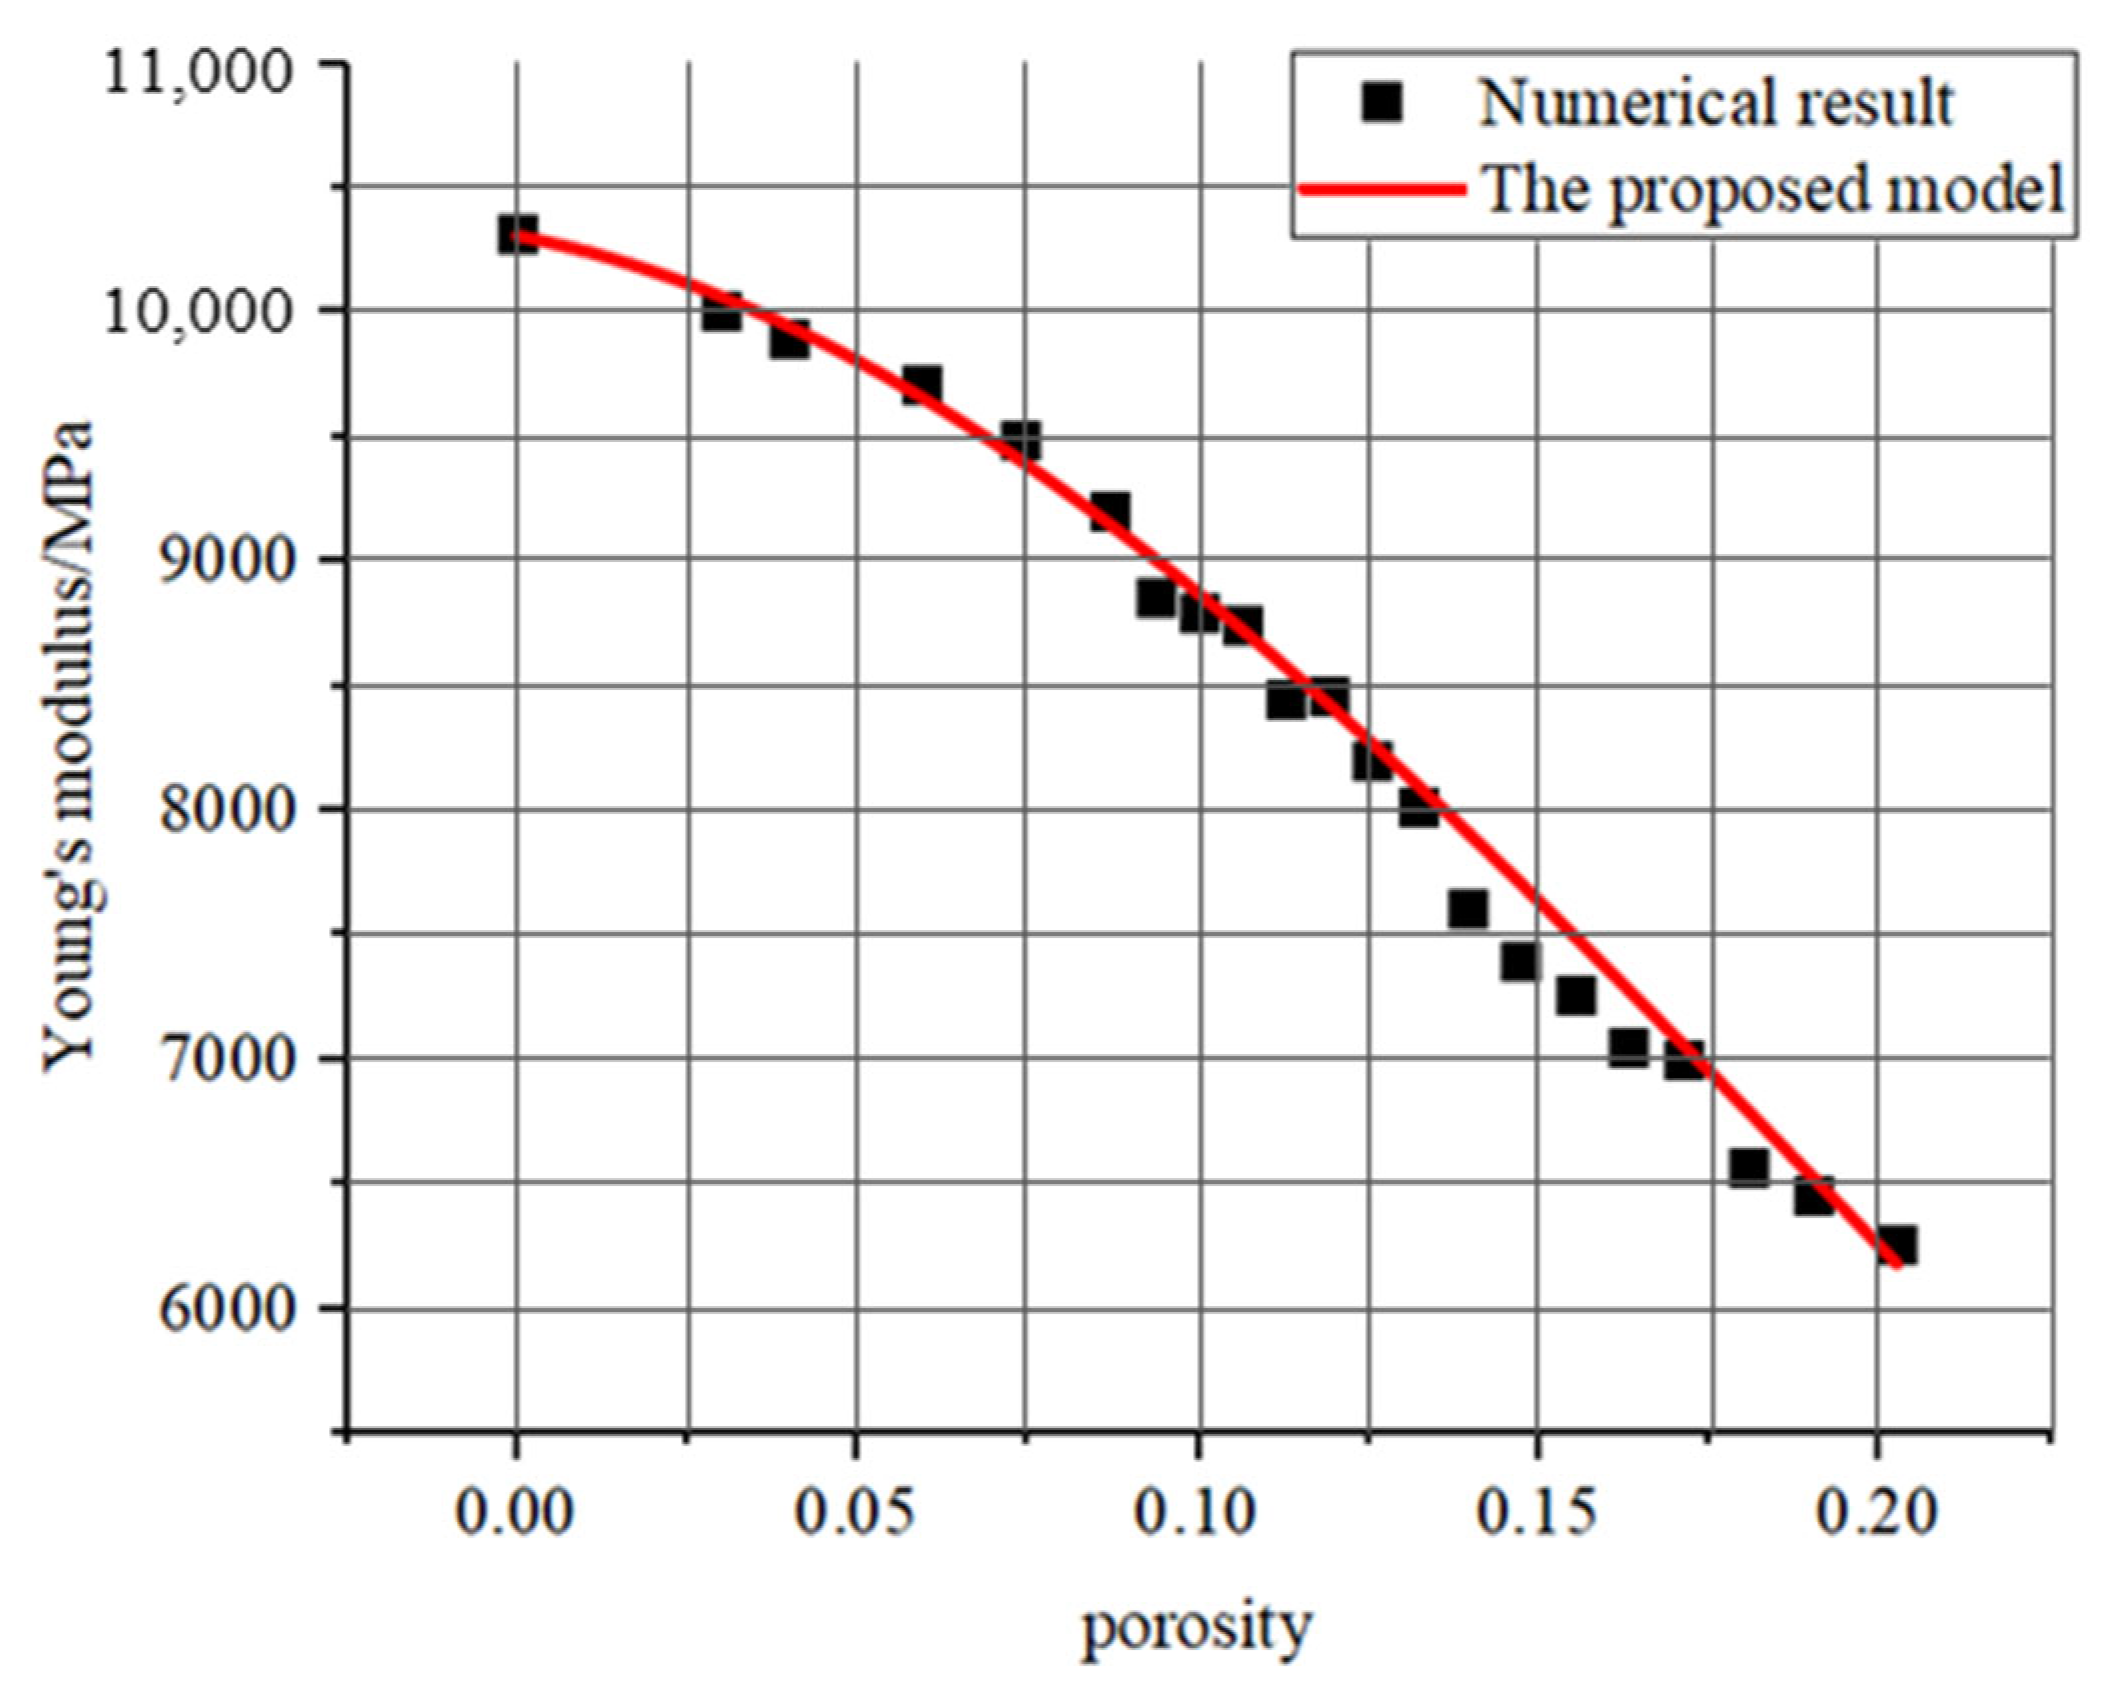
- Mechanical simulations conducted on reconstructed models with varying porosity levels reveal that increasing pore structure parameters leads to marked reductions in both compressive strength (27.8–58.3% decrease across test groups) and elastic modulus (34.1–61.5% decrease).
- (2)
- A novel mathematical framework developed for characterizing porosity–mechanical property relationships exhibited exceptional correlation coefficients exceeding 0.99 with simulation data, demonstrating superior predictive accuracy compared to conventional models.
Author Contributions
Funding
Institutional Review Board Statement
Informed Consent Statement
Data Availability Statement
Acknowledgments
Conflicts of Interest
References
- Chen, X.; Du, W.; Chen, L.; Ma, B.; Gong, S.; Jiang, H.; Wang, W. Mechanical Strength Decay Evaluation of Excavation Unloaded Rock Mass under Freeze-Thaw Conditions. Appl. Sci. 2022, 12, 12205. [Google Scholar] [CrossRef]
- Ding, C.; Xue, K.; Zhou, C. Deformation analysis and mechanism research for stratified rock and soil slope. Bull. Eng. Geol. Environ. 2024, 83, 300. [Google Scholar] [CrossRef]
- Discenza, M.E.; Martino, S.; Bretschneider, A.; Scarascia Mugnozza, G. Influence of joints on creep processes involving rock masses: Results from physical-analogue laboratory tests. Int. J. Rock Mech. Min. Sci. 2020, 128, 104261. [Google Scholar] [CrossRef]
- Kim, G.Y.; Kim, D.C. Comparison and correlation of physical properties from the plain and slope sediments in the Ulleung Basin, East Sea (Sea of Japan). J. Asian Earth Sci. 2001, 19, 669–681. [Google Scholar] [CrossRef]
- Meng, T.; Jianliang, P.; Feng, G.; Hu, Y.; Zhang, Z.; Zhang, D. Permeability and porosity in damaged salt interlayers under coupled THMC conditions. J. Pet. Sci. Eng. 2022, 211, 110218. [Google Scholar] [CrossRef]
- Nicksiar, M.; Martin, C.D. Crack initiation stress in low porosity crystalline and sedimentary rocks. Eng. Geol. 2013, 154, 64–76. [Google Scholar] [CrossRef]
- Heidari, M.; Khanlari, G.; Momeni, A.; Jafargholizadeh, H. The relationship between geomechanical properties and weathering indices of granitic rocks, Hamedan, Iran. Geomech. Geoengin. Int. J. 2011, 6, 59–68. [Google Scholar] [CrossRef]
- Mahmood, W.; Mohammed, A.; HamaHussein, S. Predicting mechanical properties and ultimate shear strength of gypsum, limestone and sandstone rocks using Vipulanandan models. Geomech. Geoeng. 2020, 15, 90–106. [Google Scholar] [CrossRef]
- Yousif, O.S.Q.; Karakouzian, M.; Rigby, D.B. Impacts of Void Existence on Mechanical Behavior of Tuff-like Lithophysal Material. Rock Mech. Rock Eng. 2021, 54, 1315–1330. [Google Scholar] [CrossRef]
- Cao, J.; Gao, J.; Nikafshan Rad, H.; Mohammed, A.S.; Hasanipanah, M.; Zhou, J. A novel systematic and evolved approach based on XGBoost-firefly algorithm to predict Young’s modulus and unconfined compressive strength of rock. Eng. Comput. 2022, 38, 3829–3845. [Google Scholar] [CrossRef]
- Fereidooni, D.; Karimi, Z. Predicting rock brittleness indices from simple laboratory test results using some machine learning methods. Geomech. Eng. 2023, 34, 697–726. [Google Scholar] [CrossRef]
- Zhou, X.P.; Xiao, N. A novel 3D geometrical reconstruction model for porous rocks. Eng. Geol. 2017, 228, 371–384. [Google Scholar] [CrossRef]
- Cherkasov, A.; Ananev, A.; Karsanina, M.; Khlyupin, A.; Gerke, K. Adaptive phase-retrieval stochastic reconstruction with correlation functions: Three-dimensional images from two-dimensional cuts. Phys. Rev. E 2021, 104, 035304. [Google Scholar] [CrossRef]
- Volkhonskiy, D.; Muravleva, E.; Sudakov, O.; Orlov, D.; Burnaev, E.; Koroteev, D.; Belozerov, B.; Krutko, V. Generative adversarial networks for reconstruction of three-dimensional porous media from two-dimensional slices. Phys. Rev. E 2022, 105, 025304. [Google Scholar] [CrossRef]
- ISO 17892-7:2017; Geotechnical Investigation and Testing—Laboratory Testing of Soil—Part 7: Unconfined Compression Test on Rocks. ISO: Geneva, Switzerland, 2017.
- Jia, R.Q.; Zhao, H. A fast algorithm for the total variation model of image denoising. Adv. Comput. Math. 2010, 33, 231–241. [Google Scholar] [CrossRef]
- Karimpouli, S.; Tahmasebi, P. Segmentation of digital rock images using deep convolutional autoencoder networks. Comput. Geosci. 2019, 126, 142–150. [Google Scholar] [CrossRef]
- Wang, Y.D.; Shabaninejad, M.; Armstrong, R.T.; Mostaghimi, P. Deep neural networks for improving physical accuracy of 2D and 3D multi-mineral segmentation of rock micro-CT images. Appl. Soft Comput. 2021, 104, 107185. [Google Scholar] [CrossRef]
- Minaee, S.; Boykov, Y.Y.; Porikli, F.; Plaza, A.J.; Kehtarnavaz, N.; Terzopoulos, D. Image Segmentation Using Deep Learning: A Survey. IEEE Trans. Pattern Anal. Mach. Intell. 2021, 44, 3523–3542. [Google Scholar] [CrossRef] [PubMed]
- He, C.H.; Liu, C. Fractal dimensions of a porous concrete and its effect on the concrete’s strength. Facta Univ. Ser. Mech. Eng. 2023, 21, 137. [Google Scholar] [CrossRef]
- Jaya, N.A.; Yun-Ming, L.; Cheng-Yong, H.; Abdullah, M.M.A.B.; Hussin, K. Correlation between pore structure, compressive strength and thermal conductivity of porous metakaolin geopolymer. Constr. Build. Mater. 2020, 247, 118641. [Google Scholar] [CrossRef]
- Li, X.; Bai, C.; Qiao, Y.; Wang, X.; Yang, K.; Colombo, P. Preparation, properties and applications of fly ash-based porous geopolymers: A review. J. Clean. Prod. 2022, 359, 132043. [Google Scholar] [CrossRef]
- Dey, S.; Kumar, V.V.P.; Goud, K.R.; Basha, S.K.J. State of art review on self compacting concrete using mineral admixtures. J. Build. Pathol. Rehabil. 2021, 6, 18. [Google Scholar] [CrossRef]
- Goswami, S.; Yin, M.; Yu, Y.; Karniadakis, G.E. A physics-informed variational DeepONet for predicting crack path in quasi-brittle materials. Comput. Methods Appl. Mech. Eng. 2022, 391, 114587. [Google Scholar] [CrossRef]
- Li, X.; Du, C.; Wang, X.; Zhang, J. Quantitative Determination of High-Order Crack Fabric in Rock Plane. Rock Mech. Rock Eng. 2023, 56, 5029–5038. [Google Scholar] [CrossRef]
- Kathavate, V.S.; Pawar, D.N.; Bagal, N.S.; Adkine, A.S.; Salunkhe, V.G. Micromechanics Based Models for Effective Evaluation of Elastic Properties of Reinforced Polymer Matrix Composites. Mater. Today Proc. 2020, 21, 1298–1302. [Google Scholar] [CrossRef]
- Yang, P.; Hu, N.; Guo, X.; Dong, L.; Chen, Y.; Guo, Z. An ultra-simple universal model for the effective elastic properties of isotropic 3D closed-cell porous materials. Compos. Struct. 2020, 249, 112531. [Google Scholar] [CrossRef]

| Density (kg/m3) | Young’s Modulus (GPa) | Poisson’s Ration | Cohesion (MPa) | Internal Friction Angle (°) | UCS (MPa) |
|---|---|---|---|---|---|
| 2501.14 | 9.727 | 0.330 | 27.718 | 12.675 | 30.084 |
| Net | Mean IoU | ACC |
|---|---|---|
| ResUNet | 90.10% | 96.44% |
| Density (kg/m3) | Young’s Modulus (GPa) | Poisson’s Ration | Cohesion (MPa) | Internal Friction Angle (°) |
|---|---|---|---|---|
| 2700 | 10 | 0.33 | 8 | 36 |
| Model | M1 | M2 | M3 | M4 | M5 | M6 | M7 | M8 | M9 | M10 |
|---|---|---|---|---|---|---|---|---|---|---|
| Porosity/% | 3.027 | 3.979 | 5.945 | 7.396 | 8.692 | 9.385 | 10.021 | 10.671 | 11.312 | 11.934 |
| Model | M11 | M12 | M13 | M14 | M15 | M16 | M17 | M18 | M19 | M20 |
| Porosity/% | 12.582 | 13.243 | 13.972 | 14.747 | 15.538 | 16.341 | 17.153 | 18.107 | 19.030 | 20.261 |
| Theoretical Model | Correlation Coefficient |
|---|---|
| Power model | 0.98852 |
| Exponential model | 0.97995 |
| Logarithm model | 0.93288 |
| Linear model | 0.91594 |
| Theoretical Model | Correlation Coefficient |
|---|---|
| The exponential model | 0.93281 |
| The self-consistent model | 0.93185 |
| The differential scheme model | 0.92357 |
| The Maxwell-type model | 0.89677 |
Disclaimer/Publisher’s Note: The statements, opinions and data contained in all publications are solely those of the individual author(s) and contributor(s) and not of MDPI and/or the editor(s). MDPI and/or the editor(s) disclaim responsibility for any injury to people or property resulting from any ideas, methods, instructions or products referred to in the content. |
© 2025 by the authors. Licensee MDPI, Basel, Switzerland. This article is an open access article distributed under the terms and conditions of the Creative Commons Attribution (CC BY) license (https://creativecommons.org/licenses/by/4.0/).
Share and Cite
Xiao, N.; Chen, J.-Q.; Qiu, X.; Huang, F.; Ling, T.-H. Study on the Relationship Between Porosity and Mechanical Properties Based on Rock Pore Structure Reconstruction Model. Appl. Sci. 2025, 15, 7247. https://doi.org/10.3390/app15137247
Xiao N, Chen J-Q, Qiu X, Huang F, Ling T-H. Study on the Relationship Between Porosity and Mechanical Properties Based on Rock Pore Structure Reconstruction Model. Applied Sciences. 2025; 15(13):7247. https://doi.org/10.3390/app15137247
Chicago/Turabian StyleXiao, Nan, Jun-Qing Chen, Xiang Qiu, Fu Huang, and Tong-Hua Ling. 2025. "Study on the Relationship Between Porosity and Mechanical Properties Based on Rock Pore Structure Reconstruction Model" Applied Sciences 15, no. 13: 7247. https://doi.org/10.3390/app15137247
APA StyleXiao, N., Chen, J.-Q., Qiu, X., Huang, F., & Ling, T.-H. (2025). Study on the Relationship Between Porosity and Mechanical Properties Based on Rock Pore Structure Reconstruction Model. Applied Sciences, 15(13), 7247. https://doi.org/10.3390/app15137247