1. Introduction
Coal is a solid combustible mineral formed by ancient plants buried underground and undergoing complex biochemical and physicochemical changes, mainly containing elements such as carbon, hydrogen, oxygen, nitrogen, and sulfur. It serves as an important energy source and chemical raw material. In recent years, due to the increasing demand for fossil fuels, the exploration and development of unconventional natural gas have garnered worldwide attention [
1]. Unlike conventional reservoirs, coal reservoirs are characterized by complex pore-fracture networks, high heterogeneity, and low porosity and permeability [
2]. The adsorption capacity of coal seams largely depends on their nanoporous structure [
3]. Therefore, the study of coal seams’ microscopic surface properties has become a focal topic in recent years. Current methods for studying pore structures mainly include fluid injection methods [
4,
5,
6] (such as mercury injection, nitrogen adsorption, carbon dioxide adsorption, and nuclear magnetic resonance) and scanning methods [
6,
7] (including optical microscopy, scanning electron microscopy, CT scanning, and atomic force microscopy or AFM). Scanning methods are applied more extensively due to their reduced sample damage, especially with the application of image segmentation techniques for pore-fracture identification in scanned images [
8]. Among these scanning methods, AFM has been widely used in various fields of scientific research, ranging from basic surface morphology characterization to material surface property analysis, from biochemistry [
9,
10] to materials science [
11,
12]. AFM has gradually evolved into an indispensable tool for nanoscience research. AFM can observe samples in air, vacuum, and liquids, detecting both conductor, semiconductor, and insulator surfaces with a spatial resolution as low as 0.1 nm and a vertical resolution as low as 0.01 nm, thus achieving atomic-scale resolution. Due to AFM’s precise characterization capabilities and ultra-high resolution, an increasing number of studies on coal and rock microscopic surface properties using AFM have been published in the last decade [
13].
Qiao et al. [
14] conducted two-dimensional and three-dimensional analyses of high-rank coal through AFM and HRTEM experiments, revealing that during the graphitization process, the matrix morphology tends to become more regular and smooth, with a decrease in the interlayer spacing of the carbon structure. Liu et al. [
15] conducted fractal analysis based on surface morphology observations and AFM surface roughness measurements, revealing that the fractal dimension of ultrafine coal powder increases with coal particle size. Xie et al. [
16] utilized AFM and SEM to analyze the surface microstructure of coal with varying degrees of tectonic deformation. They found that tectonic activity increases both the fractal dimension of pores on the coal sample surface and the number of pores. Yao et al. [
17] observed pore shapes and distributions in coal of different metamorphic grades using nanometer-resolution AFM, revealing that increased coal maturity leads to more regular nanopore morphology. Wu et al. [
18] found significant differences in pore parameters among coals of different ranks. AFM can not only measure pore parameters on coal surfaces but also provide in-depth analysis of pore surface roughness. Meanwhile, Gwyddion, a specialized image processing software, is primarily used for surface characterization and statistical analysis of pores and crystals in AFM imaging [
19]. When combined, they can obtain nanopore parameters such as pore count, average pore diameter, and facial porosity. In addition, AFM can measure coal’s nanoring parameters, which are ring structures within the coal’s two-dimensional plane and can be used to assess the uniformity of the material surface. Given the complexity of coal surfaces, traditional Euclidean geometry theory struggles to describe their heterogeneity, while fractal dimension can quantitatively characterize the complexity of pore structures. Since most AFM studies on the nanoscale pore structure of organic rocks focus on visual descriptions or semi-quantitative analyses [
16,
20], further analysis is needed to determine if there is a mathematical relationship between pore parameters, roughness, and fractal dimension in coal and its volatile matter content.
China’s coal and coalbed methane resources are undergoing varying degrees of exploration and evaluation within coal-bearing stratigraphic formations across different regions. In these exploration areas, the physicochemical properties of coal exhibit diversity. In this study, we collected coal samples of different ranks (i.e., with varying volatile matter content) from coalfields in Huainan, Anhui; Xingtai, Hebei; and Jincheng, Shanxi, among other locations. The purpose of this study is to observe the pore structure of coal samples with different volatile matter contents. The volatile matter of a coal sample refers to the gaseous substances released when the coal is heated under specified conditions in the absence of air and after correction for moisture. It is primarily composed of thermally unstable organics, including aliphatic hydrocarbons (such as methane and ethane), decomposition products of oxygen-containing functional groups (such as CO2, H2O, and phenols), heteroatomic compounds (such as H2S and NH3), and tar vapors. Firstly, high-resolution AFM is used for three-dimensional morphological observation of coal’s nanopores to obtain the spatial distribution of nanopores on the coal surface. Then, quantitative analysis of the coal surface is conducted using NanoScope Analysis and open-source Gwyddion software to obtain nanopore structure parameters and fractal dimensions. Nanopore structure parameters include pore count, facial porosity, average pore diameter, and shape factor. Combining the test results from SEM, we can more precisely characterize the complexity of pore surfaces on coal. Simultaneously, we study and analyze the correlation between coal sample volatiles and its pore parameters, roughness parameters, and fractal dimensions. By performing function fitting, we observe the relationship between these parameters and volatiles, leading to a core hypothesis: An increase in volatiles causes the nano-pore structure of coal to become coarser and more regular, reducing surface complexity. Through collaborative quantitative analysis using AFM (Atomic Force Microscope) and SEM, we verify the mathematical correlations between volatiles and pore parameters (number, pore size, shape factor), roughness (Ra, Rq, Rr), and fractal dimensions. This enables us to gain a clearer understanding of the relationship between coal sample volatiles and its physical properties and provides more accurate data support for further research on the occurrence, development, and utilization of coalbed methane.
2. Materials and Methods
2.1. Principle of Atomic Force Microscopy (AFM) Testing
Atomic Force Microscopy (AFM) is a high-resolution surface characterization technique based on the interaction forces between a probe and a sample. Its core principle involves detecting the intermolecular forces (such as van der Waals forces, electrostatic forces, or chemical bond forces) between a nanoscale probe at the end of a cantilever and the surface of the sample to achieve three-dimensional imaging of the surface morphology [
21]. The probe system of AFM is controlled by a piezoelectric ceramic scanner, which can precisely adjust the lateral (
x-
y axes) and vertical (
z-axis) displacements of the probe on the sample surface at the nanoscale [
22]. When the probe scans across the sample surface, the interaction force between the probe and the sample causes bending deformation of the cantilever. This deformation is reflected by a laser onto a photodiode detector and then converted into an electrical signal to reconstruct the surface topology [
23].
2.2. Preparation of Coal Samples
The coal sample preparation was conducted systematically based on the coal surface treatment method proposed by Drelich et al. [
24]. The coal samples were obtained from Huaibei in Anhui, Xingtai in Hebei, and Jincheng in Shanxi, specifically collected from the underground mining faces of coal mines. These samples underwent industrial analysis and maceral analysis, with the results presented in
Table 1. Three parallel sections are prepared for each coal sample to ensure data representativeness. During AFM/SEM analysis, five areas are randomly selected from each section for imaging to mitigate the influence of local heterogeneity. To prevent damage to the probe due to excessive undulations of the sample during AFM experiments, the distance between the probe and the tested sample was ensured to be maintained at the nanoscale. The coal samples were cut into slices with an area of approximately 1 cm
2, and their scanning and rear surfaces were finely milled until high smoothness was achieved. The samples were then inspected under an optical microscope at a scale of 50 × 50 μm to prevent the presence of artificial scratches on the sample surface. Subsequently, experiments were conducted using an AFM nanoscope produced by Digital Corporation (SPA-300HV) in Chiba, Japan.
2.3. AFM Image Processing
Image analysis was conducted using NanoScope Analysis v3.0 software. Each coal sample underwent at least three scans at randomly selected locations. The average values and standard deviations of parameters were calculated from these repeated measurements. Initially, preprocessing of the raw data involved using NanoScope Analysis v3.0 to apply “Flatten Order = 1” to eliminate the tilted background. Subsequently, the surface morphology and pore structure of coal samples with different roughness were observed in tapping mode, and a comparative analysis of the three-dimensional morphology of the coal samples was performed. For particle analysis, Gwyddion v2.62 software was utilized with the “Watershed Algorithm,” configured with parameters set to Grain Boundary = 0.2 and Minimum Grain Size = 4 px (corresponding to pore diameters > 2 nm). This allowed for the derivation of nanopore parameters of the coal, including the statistical distribution of average pore diameter, pore count, and surface porosity. Among these, due to the often irregular shapes of pores, pore diameter was represented by equivalent circle diameter (the diameter of a circle with an area equal to the pore area). Since conventional parameters have limitations and cannot fully characterize the surface microstructure of coal, this study incorporated unconventional parameters to observe the surface structural characteristics of coal more comprehensively. The unconventional parameters are defined as follows:
1. Surface Roughness Parameters
R
a is the most commonly used parameter to describe roughness. Average roughness (R
a) is defined as the average absolute deviation from the mean line over a sampling length of the surface roughness, as described in (1) [
25]:
Similarly, root-mean-square roughness (R
q) is defined as follows in (2):
z
mean in the above formulas is defined as follows in (3):
where N
x and N
y are the number of scan points on the
x-axis and
y-axis, respectively; z(i, j) is the height of point (i, j); and the average value of Z is the average height of all measured points.
R
sk is a dimensionless factor representing skewness, which characterizes the symmetry of image pixels around the average value. Its value is defined as shown in Formula (4):
R
ku is a dimensionless factor used to assess the shape of the data distribution around the average value. Its value is defined as shown in Formula (5):
2. Shape Factor
The shape factor (
ff) serves as a geometric parameter for quantitatively characterizing the degree of pore shape regularity. Defined based on the mathematical relationship between the cross-sectional area and perimeter of pores, it effectively reflects the boundary complexity of the nanopore structure. In the range of this parameter’s values, an ideal circular cross-section corresponds to the theoretical maximum value of
ff = 1.0, while a regular square cross-section yields
ff ≈ 0.785 (π/4). A decrease in the
ff value directly indicates an increase in the geometric irregularity of the pore contour, and changes in its magnitude provide a quantitative basis for assessing fractal features of pore edges. Its value is defined as shown in Formula (6) [
26]:
where S is the projected area of a single pore, and C is the perimeter of a single pore.
3. Nanoring Roughness
Nanoring roughness (R
r) is a quantitative indicator that characterizes the geometric deviation between the actual topography of the nanoring surface and edges and the ideal smooth state. This parameter is measured through the following process: Firstly, Nanoscope Analysis software is used to conduct quantitative statistics and individual average roughness measurements for nanorings of different designed diameters. Subsequently, arithmetic averaging is performed on the roughness data of all nanorings within the sample to obtain the comprehensive roughness index R
r, which characterizes the overall morphology of the sample. Its formula is shown in (7):
where N
i represents the number of nanorings of different expected diameters in the sample, and R
i represents the average roughness of nanorings of the corresponding expected diameter.
2.4. SEM Experiment
SEM images were acquired using a Cold Field Emission Scanning Electron Microscope. To obtain high-resolution images of coal surface morphology and avoid the charging effect of insulators, all coal samples underwent conductive treatment. Firstly, coal blocks were selected and prepared into small pieces of approximately 5 × 5 × 3 mm3 using a precision cutting machine (with the cutting direction parallel or perpendicular to the bedding plane). Subsequently, the sample surfaces were treated with argon ion polishing (at a low angle < 5° and low voltage < 5 kV) to minimize mechanical damage and obtain a flat, fresh observation surface, thereby exposing the true pore structure. SEM observations were conducted in high vacuum mode. The key parameter settings were: accelerating voltage of 3–10 kV (typically 5 kV), working distance of 5–10 mm, and the use of a low electron beam current (pA level) to minimize sample damage. The secondary electron detector (SE) was primarily used to acquire morphological information. The imaging process involved locating representative areas (such as vitrinite-rich zones) at low magnification and systematically acquiring high-resolution images of the selected fields of view at magnifications ranging from 500× to 50,000× (at least 3–5 fields of view per sample). The obtained SEM images were primarily used for qualitative analysis of the macro/micro morphological characteristics of coal samples with different volatile contents (such as groove undulations, bedding development, and surface compactness), as well as pore morphology, size distribution, abundance, connectivity, and fracture characteristics. These results were cross-verified with AFM analysis findings.
3. Results
3.1. Surface Morphology Analysis
3.1.1. Three-Dimensional Surface Analysis
The characterization of coal’s pore structure is crucial for studying its gas storage capacity, permeability, and chemical reactivity [
27]. Traditional characterization techniques, such as Scanning Electron Microscopy (SEM) and Mercury Intrusion Porosimetry (MIP), have significant limitations: SEM can only provide two-dimensional surface morphology information, while MIP infers pore structure through indirect calculations; both fail to achieve quantitative analysis of three-dimensional pore networks at the nanoscale [
28]. Atomic Force Microscopy (AFM) can achieve true three-dimensional morphology reconstruction with a vertical resolution of <1 nm through its unique probe-surface interaction mechanism, making it suitable for revealing the spatial connectivity and topological characteristics of micro/mesopores in coal. Compared to traditional methods, AFM does not require conductive coating of samples, thus avoiding the introduction of pore structure artifacts due to sample preparation. Meanwhile, AFM can achieve sub-nanometer resolution in atmospheric environments, providing the possibility for in-situ characterization. Although AFM technology still faces challenges, such as a single scan area typically limited to 100 × 100 µm
2, making it difficult to cover the macroscopic heterogeneous characteristics of coal samples; in addition, when the sample surface roughness (R
a) exceeds 500 nm, probe drift may lead to morphology distortion, which requires optimization of surface flatness through ultra-thin sectioning or ion polishing. Despite these challenges, the unique advantages of AFM in in-situ characterization of nanopores make it an important tool for improving the multi-scale analysis system of coal structure.
By constructing the three-dimensional morphology of coal samples, the pore morphology characteristics of the coal surface can be obtained. As shown in
Figure 1A, it exhibits the surface characteristics of the AH-1 coal sample. It can be observed that the surface of the AH-1 sample features rugged gullies, with the highest point reaching 103.2 nm and the lowest point reaching −82.6 nm, resulting in an altitude difference of 185.8 nm. Moreover, an obvious fence-like bedding structure can be observed on its surface, with pores appearing as sparse and irregular macropores. In
Figure 1B–D, the samples exhibit similar morphological structures, but the altitude differences decrease to 117.0 nm, 96.6 nm, and 69.0 nm, respectively, with the decrease in V
daf. In
Figure 1E, the fence-like bedding structure disappears, the surface tends to be smooth, and pores begin to show a trend of transitioning from irregular macropores to smooth micropores, with an altitude difference of 74.6 nm. In
Figure 1F, pores mainly appear as dense and regular micropores, the surface roughness decreases, and the altitude difference is only 14.2 nm, far lower than the 185.8 nm observed in the AH-1 sample.
3.1.2. Cross-Sectional Analysis of Different Samples
The quantitative characterization of the microstructure of coal reservoirs is a core scientific issue for optimizing unconventional natural gas development and greenhouse gas sequestration technologies. Based on the technical requirements for characterizing the nanoscale pore structure of coal rocks, atomic force microscopy (AFM) cross-sectional analysis provides key methodological support for revealing the heterogeneity of coal matrices. Compared with traditional two-dimensional surface morphology observation, cross-sectional analysis, through line scanning along a set vector path, can quantitatively analyze the three-dimensional topological characteristics of subsurface pores [
29]. Studies have shown that the vertical distribution of nanoscale pores in coal exhibits significant heterogeneity, and this structural characteristic directly affects the gas desorption kinetics process [
30]. Zhao et al. used AFM cross-sectional analysis to find a nonlinear relationship between the depth distribution gradient of vitrinite pores and methane adsorption capacity, revealing the control mechanism of pore geometric parameters on gas occurrence states [
31]. Clarkson et al. confirmed through multi-cross-sectional superimposition techniques that the tortuosity of effective percolation channels in coal is closely related to the local variation in pore size distribution, which cannot be captured by traditional two-dimensional images [
32]. In this study, two samples with significant differences in V
daf were selected for cross-sectional analysis to investigate their pore structural characteristics.
By conducting profile studies on the HB-1 and SX-4 samples (
Figure 2), we can observe that when V
daf is relatively high, the pores in coal are predominantly represented by a small number of large pores, as shown in
Figure 2B. Among them, the maximum pore width reaches 169.50 nm and the depth reaches 19.08 nm, classifying it as a macropore. The smallest pore width in the profile is 39.25 nm, with a pore depth of 9.40 nm, classifying it as a mesopore. When V
daf is relatively low, as seen in
Figure 2D, the pores are characterized by a large number of smaller pores. However, macropores with diameters exceeding 100 nm still exist, such as pore ① with a width of 109.19 nm and a depth of 5.95 nm. More commonly, there are mesopores with smaller pore diameters, with the smallest pore diameter in the cross-section being 13.10 nm and a depth of 4.45 nm. Comparing the profile analyses of the two samples, we find that when V
daf is high, the pore diameters are also larger, accompanied by deeper pore depths. However, when V
daf is low, although macropores with larger diameters still exist, their proportion significantly decreases, and the pore depths are also greatly reduced. There is a notable increase in the number of pores, which are primarily macropores and mesopores with smaller diameters.
3.2. Analysis of Surface Roughness
To further explore the impact of different coal volatiles on surface roughness, this study selected six coal samples with varying volatiles and calculated the surface roughness parameters (R
a, R
q) for each sample to quantitatively describe the structural characteristics of the coal surface. Meanwhile, to deeply analyze the evolution of coal surface properties, the roughness parameters (R
sk, R
ku) for all samples were also calculated, as shown in
Table 2.
Since the kurtosis of a Gaussian height distribution is 3, if R
ku < 3, the surface is relatively flat. If R
ku > 3, it indicates that the coal surface has more peaks and valleys, and the surface is relatively steep, suggesting a higher degree of pore and fissure development in the coal structure, with a more uneven distribution of pore sizes and shapes [
33]. Since the R
ku of all samples is greater than 3, it indicates that the surface profiles of the samples are not flat and contain many peaks and valleys, with the height values distributed near the reference plane and a relatively concentrated pore size distribution in the coal samples. Simultaneously, it was found that as the volatiles increase, the R
ku value also gradually increases, reflecting a further increase in the complexity of the pore structure. The R
sk value represents the asymmetry of the coal surface roughness profile. When R
sk = 0, the surface has an equal number of peaks and valleys, forming a flat profile. R
sk > 0 indicates that peaks are more prominent than valleys, whereas R
sk < 0 indicates that valleys are more prominent than peaks on the coal surface [
34]. According to the data in
Table 2, the R
sk values of most samples are less than 0, indicating that the number of valleys is greater than the number of peaks on the surfaces of most samples, while the R
sk value of sample SX-4 is greater than 0, indicating that the number of peaks is greater than the number of valleys on its surface.
The results of the surface roughness evaluation are presented in
Table 2. The R
a values of the coal samples ranged from 1.54 to 4.55 nm, while the R
q values varied between 1.98 and 5.83 nm. Additionally, the study found that the R
q values of all samples were greater than their corresponding R
a values. Liu et al. [
15] and Gadelmawla et al. [
35] also observed the same phenomenon, attributing it to the different sensitivities of these two indices to surface roughness. Specifically, R
q is more sensitive to surface roughness than R
a. When changes occur on the coal surface to a certain extent, R
q undergoes a greater degree of alteration, resulting in higher R
q values compared to R
a for all samples.
3.3. Analysis of Nanopore Structural Parameters
The nanopore structural parameters of the samples were analyzed using a combination of Nanoscope Analysis software and the open-source Gwyddion software [
36]. Roughness parameters were initially obtained through the roughness analysis feature in Nanoscope Analysis software and were subsequently used to derive pore parameters. However, for other nanopore structural parameters, the watershed method within the grain analysis tool of Gwyddion software was employed. The watershed method treats images as geographical landscapes and simulates a flooding process for image segmentation, enabling automatic identification of physical boundaries in complex images, making it particularly suitable for complex scenarios. By controlling the number of steps in grain positioning, the drop size, and the threshold value, followed by an inversion of height operations, the pore characteristics of each sample were efficiently and quantitatively analyzed.
Analysis of coal samples using the watershed method in Gwyddion software yielded the number of pores, average pore diameter, areal porosity, projected area of total pores, and boundary length of total projection. These values were further processed to obtain the required pore structural parameters, with specific numerical values presented in
Table 2. The number of pores in the samples ranged from 2249 to 5248, and the average pore diameter ranged from 8.34 nm to 18.65 nm. The areal porosity ranged from 3.79% to 11.36%, indicating variations due to changes in volatility. The shape factor ranged from 0.63 to 0.92, suggesting significant differences in the shapes of nanopores within the coal.
3.4. Fractal Dimension
This study obtained the fractal dimension of coal samples based on AFM surface topography images, the cubic counting method [
37,
38], the triangular prism method [
37], and the variance partition method [
39,
40]. The cubic counting method involves the following steps: A cubic lattice with a lattice constant I is superimposed onto the surface extended along the
z-axis. Initially, I is set to X/2 (where X is the length of the surface side), resulting in a lattice of eight cubes. Then, N represents the number of all cubes containing at least one pixel in the image. Subsequently, the lattice constant I is progressively reduced by multiples of 2, and this process is repeated until I equals the distance between two adjacent pixels. The slope of the plot of lgN versus lg(1/I) represents the fractal dimension D
f. The calculation is as follows:
In the formula: N is the number of lattices filling the AFM topography image, dimensionless; Df is the slope, i.e., the fractal dimension; I is the side length of the smallest cubic lattice for the fractal, in nm; and B is a coefficient, dimensionless.
The triangulation method, which bears a strong resemblance to the cubic counting method, operates as follows: The surface is overlaid with a grid of unit dimension I to ascertain the positions of multiple triangular vertices. For instance, when I = X/4, the surface is covered by 32 triangles of varying areas and tilt angles relative to the xy-plane. The areas of all triangles are calculated and summed to approximate the surface area S(I) corresponding to I. Subsequently, the grid size is continually halved, and the process is repeated until I corresponds to the distance between two adjacent pixels. At this point, the slope of the plot of lg(S(I)) versus lg(1/I) corresponds to Df − 2.
The variance partitioning method is grounded in the variance scale dependence of fractional Brownian motion. This variance-based approach divides the entire surface into square boxes of equal size and calculates the variance (power of the root mean square of heights) for a specific box size. The fractal dimension Df is assessed based on the slope β of the least squares regression line fitted to the data points in the log-log plot of variance, i.e., Df = 3 − β/2.
Due to the existence of different systematic errors among various fractal analysis methods, the fractal dimensions of each volatile coal sample based on the cube-counting method, triangulation method, and variance partition method were calculated separately. The data are presented in
Table 3. According to the three-dimensional analysis theory [
41,
42], the closer the fractal dimension is to 3, the more complex the pore shape; the closer it is to 2, the more regular the pore shape. The fractal results of different volatile coal samples using the cube-counting method are shown in
Figure 3, where the slope of the equation represents the fractal dimension. The surface fractal dimensions of the samples ranged from 2.162 to 2.284; for the triangulation method, the fractal dimensions ranged from 2.201 to 2.341; and for the variance partition method, the fractal dimensions ranged from 2.341 to 2.477.
3.5. Nanoring Analysis
The development degree of nanopores determines the adsorption capacity of coal for gases, and studying the nanoring structure in coal plays a significant role in understanding the pore structure on the coal surface. The nanoring parameters of the samples refer to the characteristics of annular pores in the sample dataset obtained through Nano Ring Analysis in AFM. By setting relevant parameters such as the expected diameter, threshold height, pitch, and type of height threshold, parameters such as the number of nanorings, roughness, and confidence score were obtained. The confidence score represents the degree of reliability of the analytical method for the obtained results. During nanoring analysis, nanoring structures with low confidence scores may be non-target particles resulting from image noise or scratches and should be excluded. In contrast, nanoring structures with high confidence scores are more likely to be the desired sample annular characteristics for the study. Therefore, this study only retains nanoring structures with confidence scores greater than 0.5 to enhance the reliability of the research results. Since nanoring analysis focuses on pore structures with an expected diameter of more than 10 nm, nanoring structural analysis was conducted on six different volatile matter samples at various expected diameters, ranging from 10, 20, 30, …, to 500 nm. The threshold height was set at 1 nm, the pitch in both X and Y directions was 600 nm, and the type of height threshold was set to the entire image. The results of the nanoring analysis are shown in
Table 4.
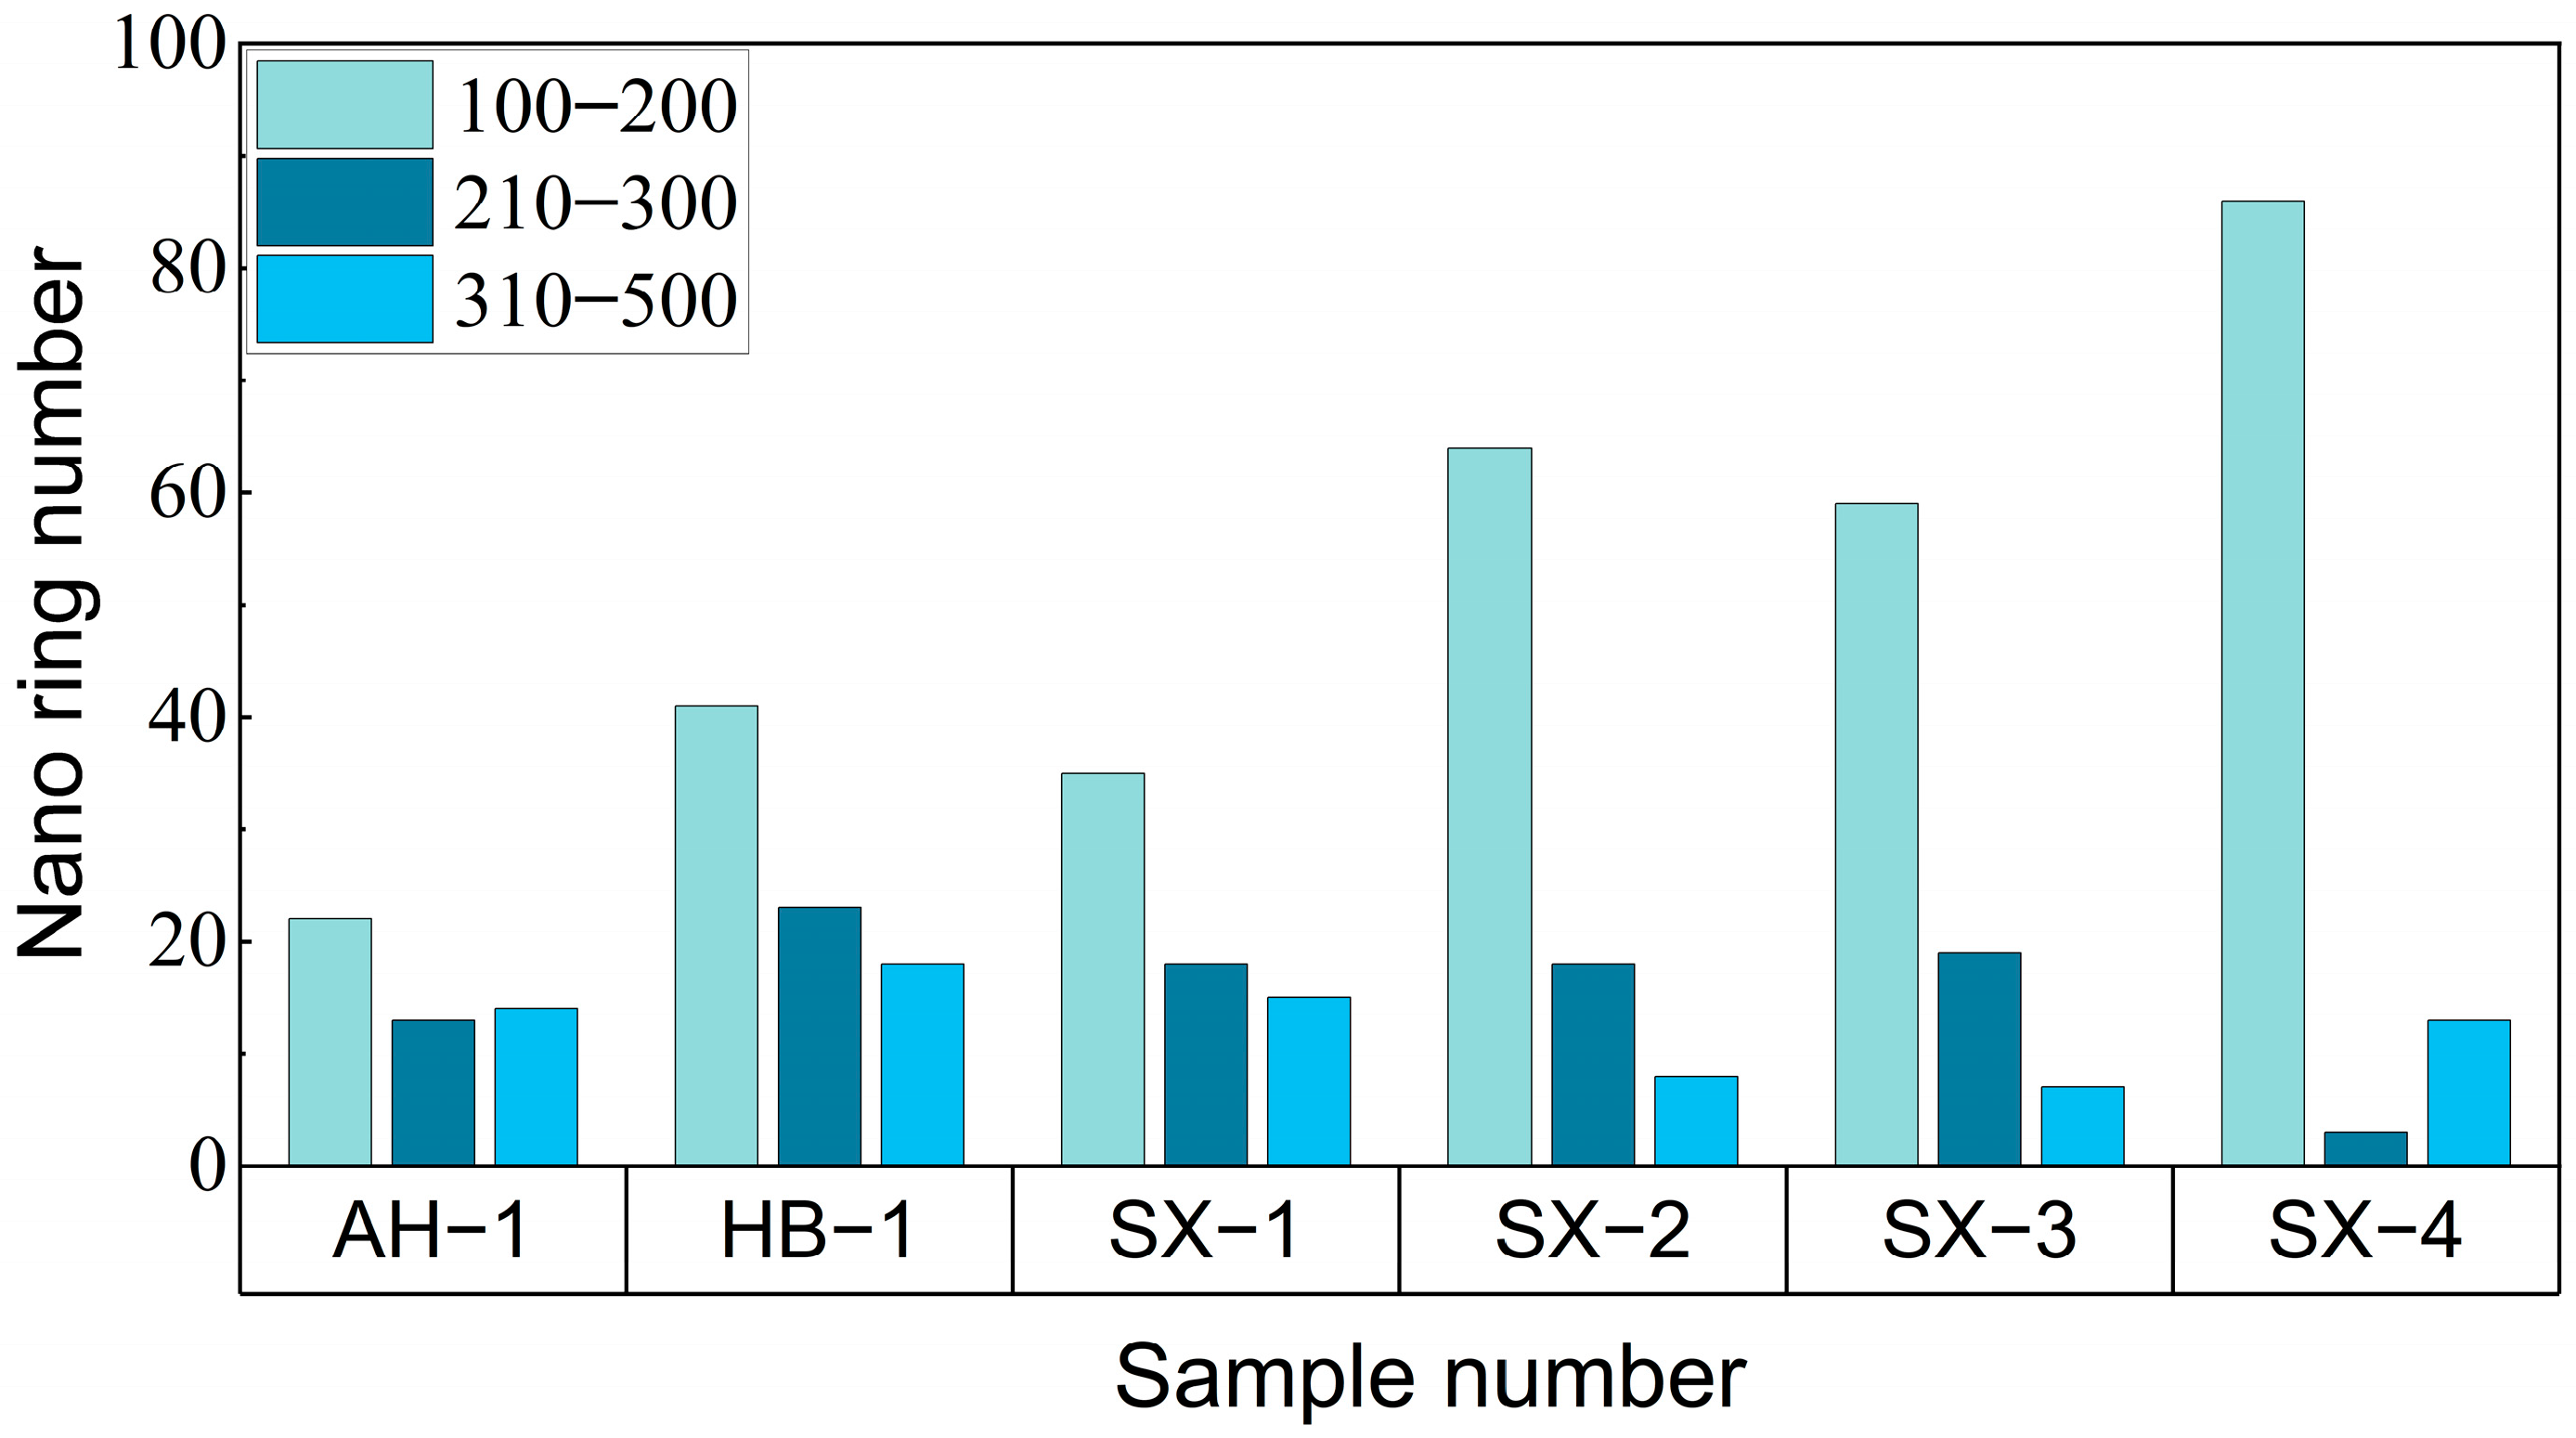
The number of nano-rings at different expected diameters in the samples varied with the volatile matter content of the coal samples. As shown in
Table 3, the total number of nano-rings in samples AH-1 to SX-4 ranged from 49 to 102. Additionally, the study plotted the distribution of nano-rings within each expected diameter range of the samples, as shown in
Figure 4.
The study found that the number of nanorings with expected diameters between 10 and 200 nm is significantly greater in low-volatile coal samples compared to high-volatile coal samples. The number of nanorings with diameters in the 210–300 nm range decreases compared to high-volatile coal samples, and a further decline is observed for nanorings with expected diameters in the 310–500 nm range. This is attributed to the fact that high-volatile coal has not undergone sufficient condensation polymerization, resulting in a coarser pore structure. The formation of nanorings is closely related to nanoscale pore structures. Low-volatile coal, with its developed pore structure, provides the space and necessary conditions for the formation of nanorings, leading to a significant increase in the number of smaller-diameter nanorings in low-volatile coal.
3.6. SEM Characterization of Pore Structure in Coal with Different Volatile Matters
Scanning Electron Microscopy (SEM) possesses high-resolution imaging capabilities and an advantage in surface morphology characterization, making it a crucial method for studying the pore structure of coal. As a complex porous medium, coal’s pore system, including matrix pores and fractures, has morphological, size, and connectivity characteristics that directly impact the occurrence and migration mechanisms of coalbed methane [
27]. SEM can provide high-definition two-dimensional images of pores ranging from micrometers to nanometers, intuitively revealing the geometric features and spatial distribution patterns of pores. For example, Zhou S.D. et al. [
43] observed a honeycomb-like organic matter pore network developed in medium-rank coal using field emission SEM, clarifying the correlation between pore morphology and the degree of thermal evolution. Compared with indirect characterization methods such as mercury injection and gas adsorption, SEM has the advantage of allowing targeted observation of specific microscopic areas and identifying pore genesis types (e.g., primary pores, secondary dissolution pores, etc.) [
44]. However, SEM technology also has certain limitations: Firstly, traditional SEM images provide two-dimensional cross-sectional information, making it difficult to quantitatively characterize the three-dimensional topological structure of pores [
45]. Secondly, during sample preparation, drying or coating processes may lead to microfracture expansion or pore collapse, introducing artificial artifacts. In this study, SEM was used to investigate the pore structure characteristics of coal samples with different volatile matters.
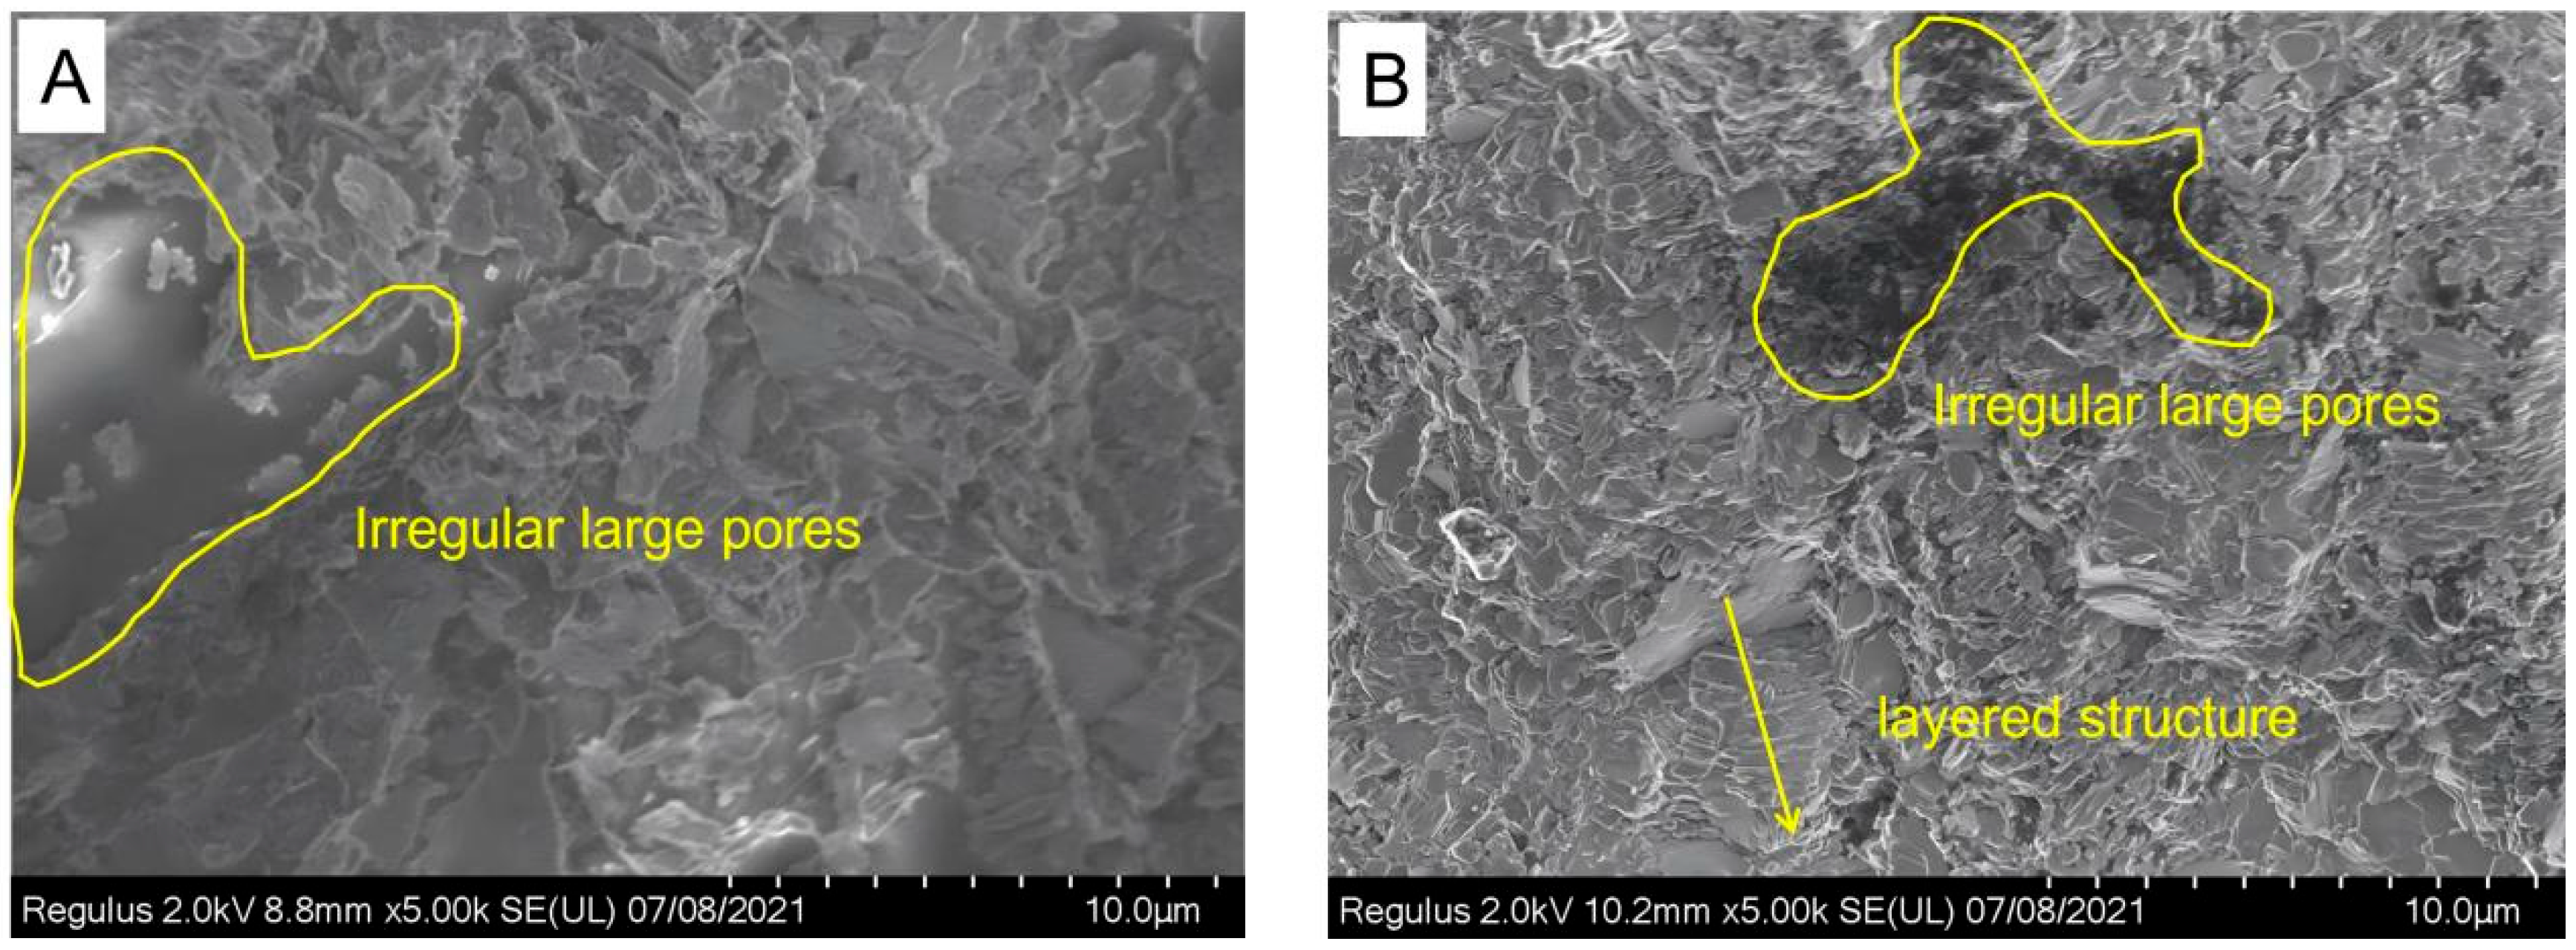
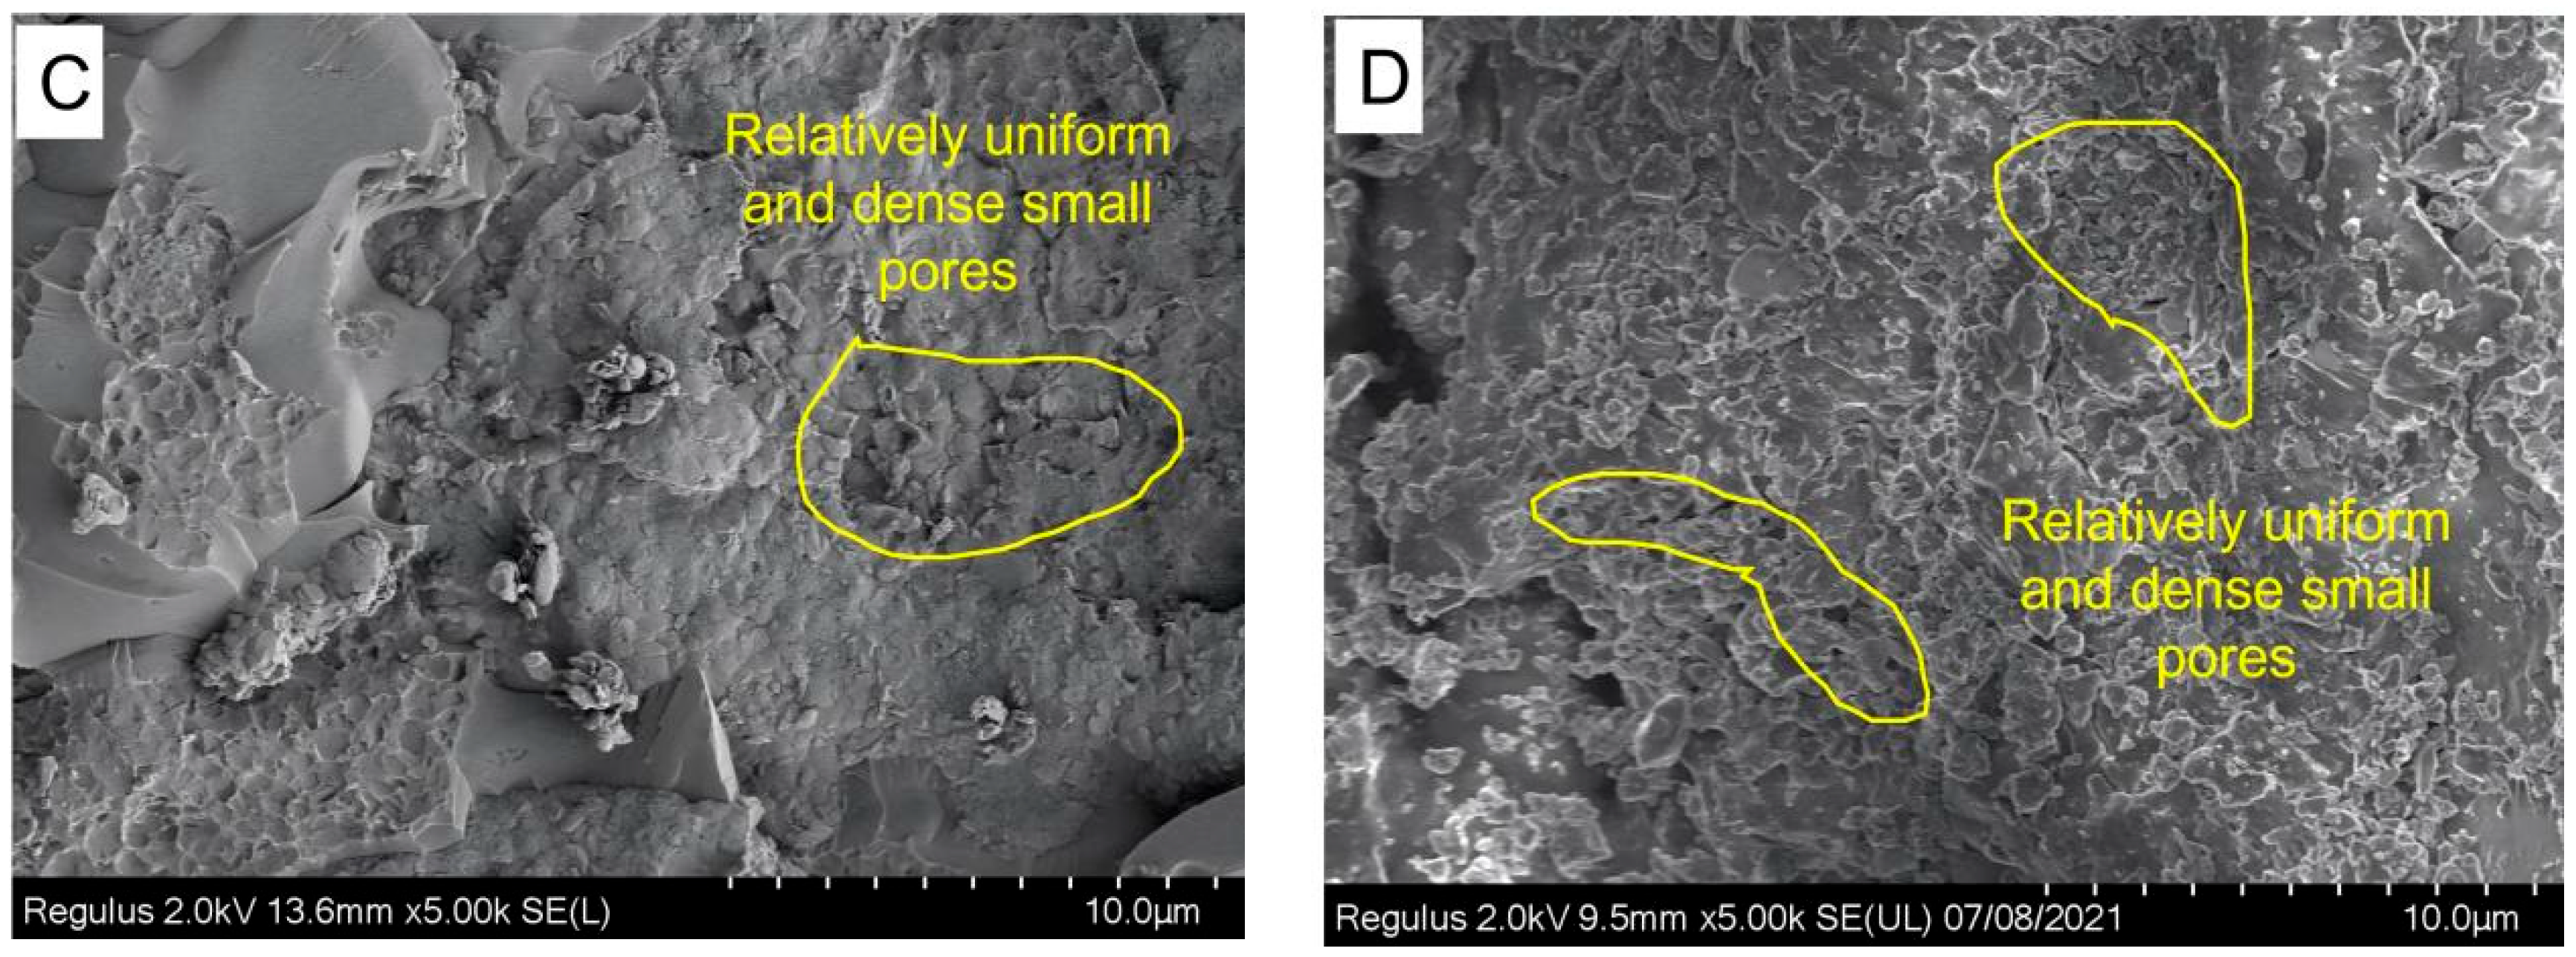
SEM images of the research samples reveal that when V
daf (volatile matter on a dry ash-free basis) is high, as shown in
Figure 5A,B, the coal structure appears loose with distinct bedding, accompanied by a small number of irregular pores of larger diameters on the surface alongside the loose bedding structure. Conversely, when V
daf is low, as depicted in
Figure 5C,D, the SEM images transition from a loose bedding structure to a dense structure, with the layered structure disappearing and numerous dense, regular small pores emerging on the surface. This suggests a clear correlation between the pore structure of coal samples and V
daf. Specifically, when V
daf is high, pores in the coal samples mainly appear as irregular macropores, independently and in small quantities. As V
daf decreases, the pore state in coal is completely opposite to that when V
daf is high, with pores tending towards smooth, regular shapes and appearing dense, resulting in a decrease in coal sample surface roughness. It can be observed that changes in V
daf have a revolutionary impact on coal pore structure and surface morphology, which aligns with previous studies using AFM to investigate coal pore structure, confirming the existence of the correlation between V
daf and coal pore structure identified through AFM experiments.
4. Discussion
4.1. Surface Morphology
The surface morphologies of coal samples with different volatile matters exhibit significant variations. As illustrated in
Figure 2, there is a clear positive correlation between the surface relief (height difference) of the coal samples and their V
daf. As the V
daf of the coal samples decreases, the surface relief also diminishes, leading to a reduction in surface roughness and the formation of a smoother surface morphology. Cross-sectional analysis of the samples reveals that coal with high volatile matter contains larger pores, whereas coal with low volatile matter exhibits numerous micropores. This indicates that as the volatile matter increases, pores in the coal merge to form larger pore structures. Simultaneously, it is observed that as V
daf decreases, the surface roughness of the coal decreases, rendering the surface relatively smoother. This phenomenon underscores the corresponding changes in pore structure with variations in V
daf.
Furthermore, an in-depth exploration of coal’s pore structure using SEM imaging of coal samples reveals a distinct correlation between pore structure and Vdaf. When Vdaf is high, the pore structure of coal samples appears as irregular and isolated macropores in small quantities. As Vdaf decreases, the pore state in coal is completely opposite to that observed at higher Vdaf values, with pores tending towards smoother, more regular shapes and occurring densely, resulting in a decrease in surface roughness of the coal samples. It is evident that changes in Vdaf exert a profound impact on the pore structure and surface morphology of coal, which aligns with findings from AFM studies of coal’s pore structure. This corroborates the existence of the correlation between Vdaf and coal pore structure as identified in AFM experiments.
4.2. Surface Roughness Parameter
Previous AFM research and analysis have indicated that the surface roughness of coal is influenced by multiple factors, including maceral type, particle size, and metamorphic grade. Liu et al. [
15] found that as the average particle size of coal increases, its surface roughness also increases. Wu et al. [
18] discovered that the surface roughness of coal varies with different metamorphic grades, with higher metamorphic grade coal having a smaller surface roughness than lower metamorphic grade coal. Morga R. [
46] found that different macerals within the same coal sample exhibit different surface roughnesses, with fusinite having a greater surface roughness than semifusinite. Additionally, the surface roughness of coal is also affected by changes in volatiles.
To further investigate the relationship between coal surface roughness and volatile matter, a correlation analysis was conducted between the roughness (R
a, R
q) of each sample and its volatile matter content (V
daf). As shown in
Figure 6, the surface roughness of the samples exhibited an identical upward trend with increasing volatile matter content. This is due to the variation in roughness caused by differences in volatile matter content among the coal samples. Coals with low volatile matter have a dense structure, lower porosity, and a smoother surface. In contrast, coals with high volatile matter have a loose structure and contain more micropores and fractures, leading to higher surface roughness. The reason for this phenomenon may be that as volatile matter increases, the unstable organic matter in coal also increases. This organic matter is prone to decomposition during oxidation or pyrolysis, escaping as gases. Coals with high volatile matter release larger volumes of gases more rapidly, exerting an impact on the coal surface and forming more porous structures, significantly increasing its surface roughness. Furthermore, coals with high volatile matter contain more inertinite microcomponents, while coals with low volatile matter are dominated by vitrinite. The porous structure of inertinite also contributes to increased surface roughness. In summary, an increase in volatile matter promotes pore development and alters the proportions of microcomponents, leading to an upward trend in surface roughness.
4.3. Nanopore Structural Parameters
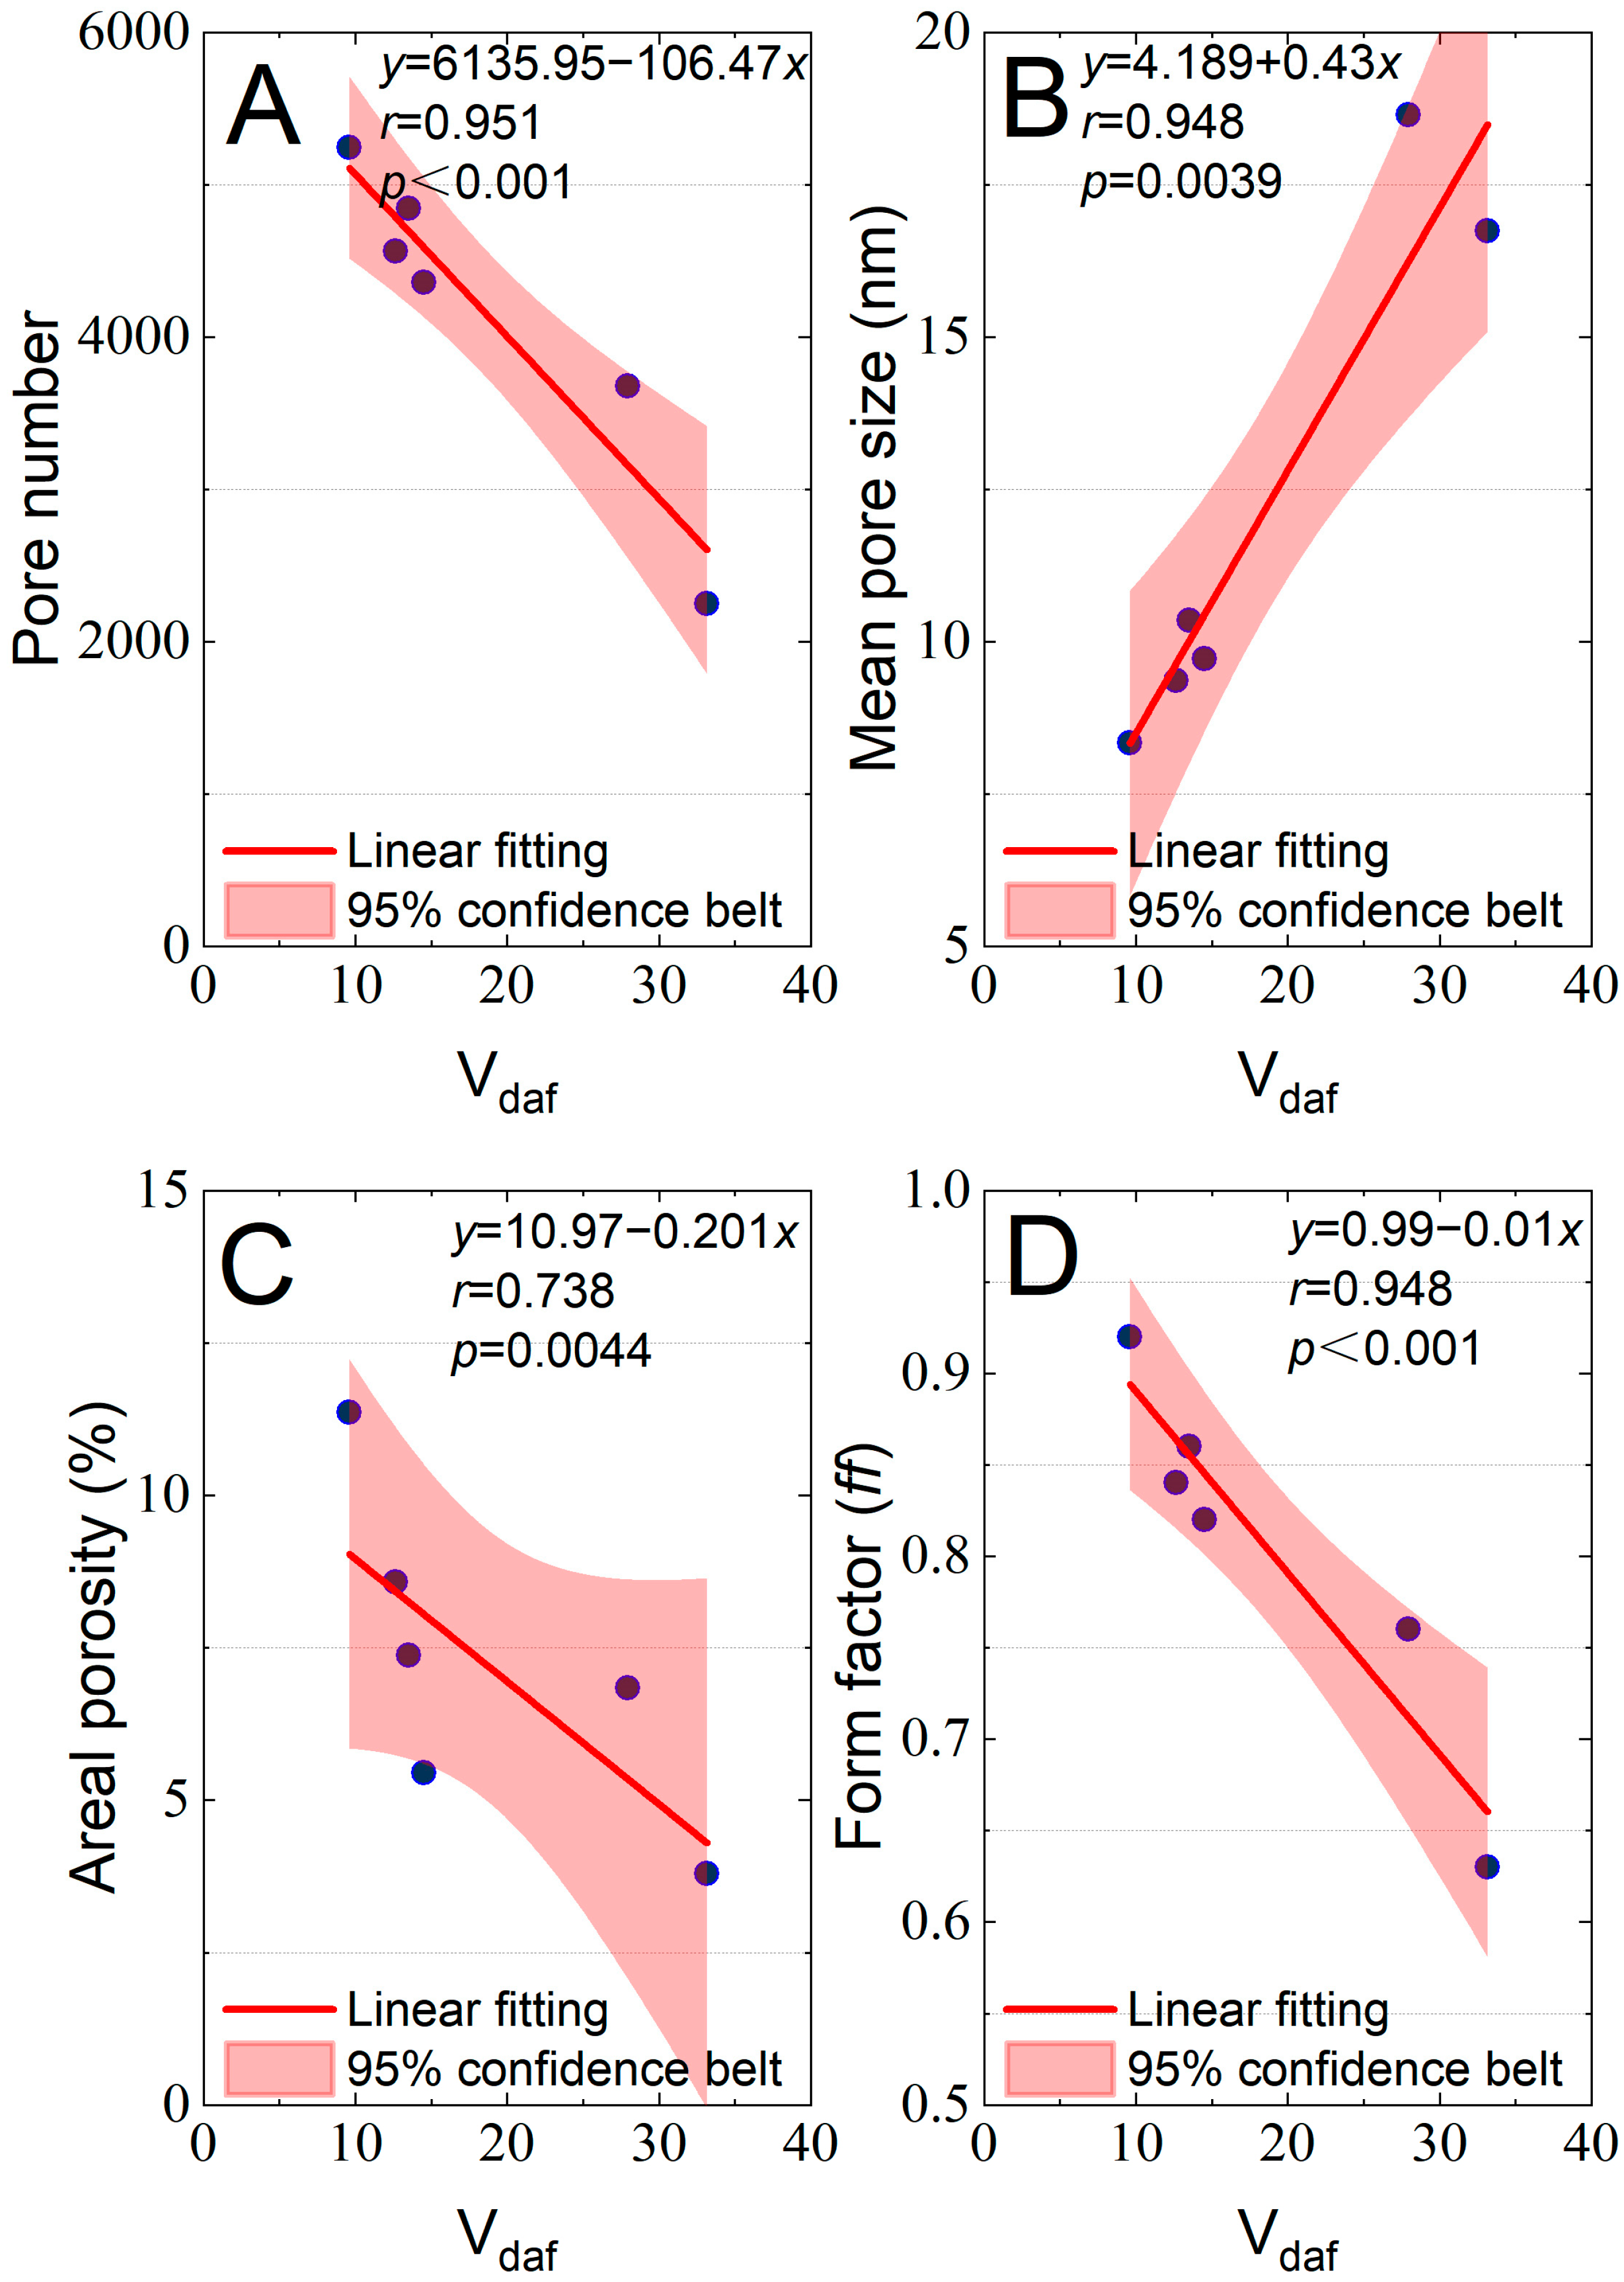
To further investigate the changes in the nanopore structural parameters of coal, linear fitting was performed between the nanopore parameters of coal and its volatile matter content. The fitting curves are shown in
Figure 7. Based on the variations in the pore structural parameters of the samples, the study found that as the volatile matter content of coal increases, the number of pores exhibits a linear decreasing trend (r = 0.951,
Figure 7A). This may be due to the production of a large amount of gas during the increase in volatile matter, which leads to the destruction of the walls of adjacent small pores, causing pore merging and a decrease in the number of pores. Simultaneously, the increase in volatile matter results in the closure of some tiny pores, further reducing the number of pores. Secondly, the average pore diameter exhibits an increasing trend with the increase in volatile matter (r = 0.948,
Figure 7B). The increase in volatile matter causes some adjacent pores to merge, leading to an increase in pore diameter. Additionally, small pores are less stable and are more prone to closure during the increase in volatile matter, while large pores are retained or even expanded due to their structural stability. The area porosity exhibits a decreasing trend with the increase in volatile matter (r = 0.738,
Figure 7C). When small pores merge into larger pores, the surface area decreases due to changes in geometry, resulting in a reduction in area porosity. Finally, the study found that the shape factor also exhibits a decreasing trend with the increase in volatile matter (r = 0.948, note: corrected from r = 948,
Figure 7D). The process of volatile matter increase leads to the escape of gas, making the pore edges rougher and increasing the shape complexity. Thus, coal samples with high volatile matter content have fewer pores and lower area porosity than those with low volatile matter content, while the average pore diameter shows an opposite trend. Meanwhile, the pores in coal samples with high volatile matter are more irregular.
4.4. Fractal Dimension Parameter
The fractal dimension, derived from the fractal theory in geometry, serves as a crucial parameter for describing the complexity and heterogeneity of pore structures in coal. Studying the fractal dimension of coal samples allows for further quantification of the roughness of pore surfaces and the complexity of their spatial distribution, reflecting the heterogeneity of the pore system. Previous research has shown that the fractal dimension of samples is influenced by numerous factors, including coal quality parameters, pore structure parameters, and metamorphic grade. Shao et al. [
47], when studying lignite from the Hailar Basin, found a positive correlation between the fractal dimension of coal pore surfaces and ash yield, as well as a “U”-shaped relationship with fixed carbon content. Lin et al. [
48], in their study of the fractal characteristics of adsorption pores in coal from the Fukang mining area in Xinjiang, discovered a negative correlation between the fractal dimension and pore diameter and a positive correlation with pore specific surface area and pore volume. Qin et al. [
49], taking the Xishan coalfield as their research object, analyzed the factors influencing the fractal dimension of coal samples and found that as metamorphic grade and burial depth increase, the fractal dimension of coal surfaces also increases, leading to a more complex pore surface.
To explore the extent to which volatiles affect the fractal dimension of coal samples,
Figure 8 illustrates the correlation between the fractal dimensions and the volatile content of the selected samples using different analysis methods. As the volatile content increases, the fractal dimensions exhibit a linear downward trend to varying degrees, indicating that as the volatile content increases, the morphology of nanopores tends to become more complex. High-volatile coals have larger average pores, predominantly macropores with a uniform scale and regular shape, sparse microcracks and nanopores, and poor pore connectivity, resulting in lower fractal dimensions. As volatiles escape, pores are compressed or reconstructed into branched channels, increasing the pore surface roughness and making the structure of pores at different scales more complex, leading to an increase in the fractal dimension.
4.5. Nanoring Parameter
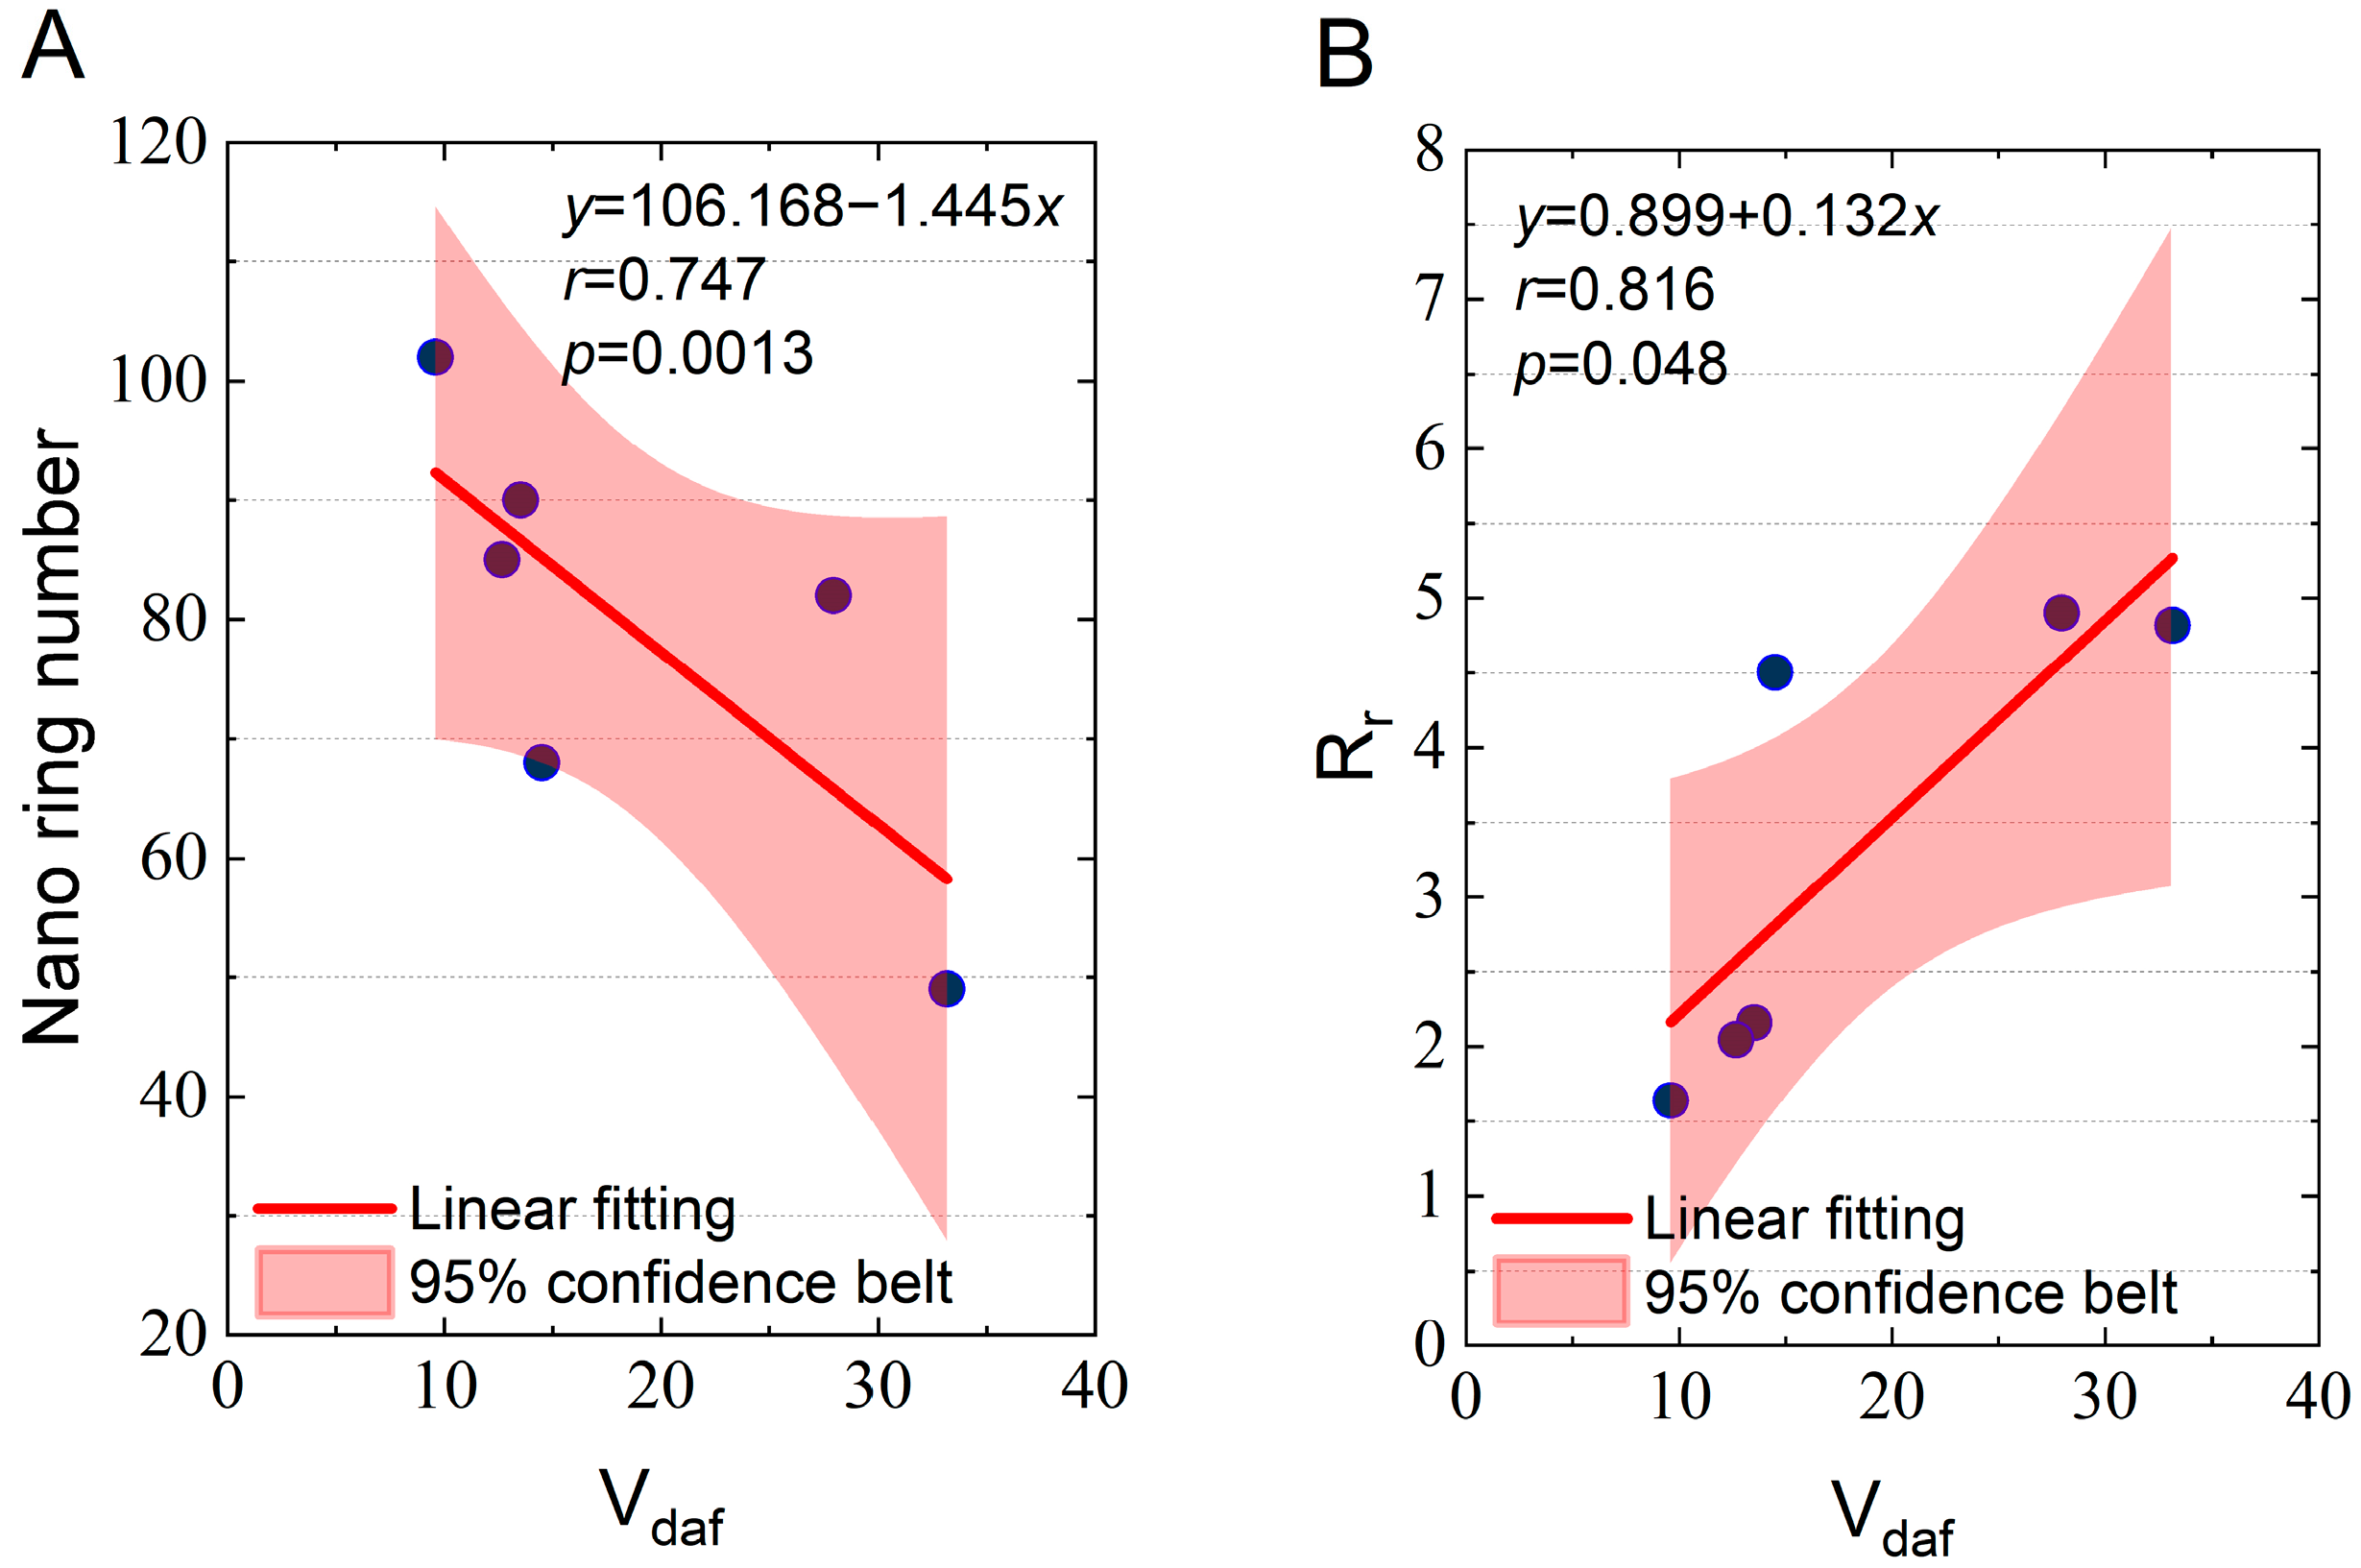
As the volatile matter decreased, there was a tendency for the number of nano-rings in the samples to increase. To further explore the correlation between volatile matter content and the number of nano-rings,
Figure 9A plots the correlation between volatile matter content and the number of nano-rings in the samples. With the decrease in volatile matter, the number of nano-rings exhibits a linear increase trend. Due to the presence of various nanoscale pores in coal, low-volatile coal has a more compact structure, allowing nano-rings to be densely distributed within a limited space, thus exhibiting a higher number of nano-rings. In contrast, high-volatile coal has a relatively unstable molecular structure and is prone to decomposition during heating, which disrupts the nano-ring structure, resulting in a relatively lower total number of nano-rings.
Additionally, to investigate the effect of coal volatility on nanoring roughness, the study analyzed and calculated the average roughness of nanorings for each sample across different expected diameter ranges. The nanoring roughness for each sample was obtained, and the results are presented in
Table 4. According to
Table 4, the nanoring roughness of the samples ranges from 1.639 to 4.903.
Figure 9B illustrates the correlation between sample volatility and nanoring roughness. As the volatility of the coal samples increases, the nanoring roughness exhibits a linear upward trend. This may be due to the decomposition of volatile matter within the samples during thermal evolution or oxidation, which produces gases and forms nanoscale pores, directly affecting the roughness of the nanorings on the coal surface. High-volatile coal, containing more hydrophilic groups, readily adsorbs water molecules and gases, leading to local spalling and further increasing surface irregularities and roughness.
5. Outlook
This study focuses on analyzing the nanoporous structure, surface roughness, and fractal characteristics of six coal samples with different volatile matter (Vdaf), revealing the correlation between volatile matter content and the microphysical properties of coal. The research indicates that volatile matter alters the surface morphology of coal samples. Additionally, it is found that there are varying degrees of correlation between volatile matter content and roughness, pore parameters, fractal dimension, and nano-ring parameters in coal samples. The research findings provide a direct scientific basis for detailed evaluation and efficient development of coalbed methane reservoirs: Low-volatile coal typically exhibits stronger gas adsorption capacity due to its higher porosity, more complex pore network, and larger specific surface area. In contrast, the larger pores developed in high-volatile coal may be more conducive to macroscopic gas migration. Clarifying the quantitative relationship between volatile matter and pore parameters aids in more accurately predicting gas content, adsorption capacity, and permeability of reservoirs of different coal ranks, thereby optimizing coalbed methane exploration and development. However, due to the limited number of samples in this study, a comprehensive investigation of the correlation between various volatile matter coal samples and their parameters was not feasible. Therefore, future research plans to expand the sample scope to include more diverse geological environments and different volatile matter samples and to deeply explore the relationships between volatile matter content and roughness, fractal dimension, pore parameters, and nano-ring parameters across various coal ranks. The aim is to more comprehensively reveal the correlation between volatile matter and microphysical properties.
6. Conclusions
The micro-pore structure of coal plays a crucial role in the storage and adsorption of coalbed methane. This study systematically reveals the regulation patterns of volatiles on the nano-pore structure, surface morphology, and fractal characteristics of coal through multi-scale characterization using AFM and SEM and establishes quantitative relationships between key parameters and volatiles. The specific conclusions obtained are as follows:
(1) Combining AFM surface morphology images with SEM technology, the study observed that volatiles have a decisive effect on the surface morphology and pore structure of coal. There is a significant positive correlation between the surface relief of coal samples and Vdaf (volatile matter on an air-dried, ash-free basis). High-volatile coal samples exhibit significant gully undulations on their surfaces, with pores dominated by irregular macropores and a loose bedding structure. SEM images show a loose structure with coarse pores. In contrast, low-volatile coal samples tend to have smooth surfaces, with pores mainly consisting of dense and regular small pores, and a compact bedding structure. SEM images show a dense structure with numerous regular small pores on the surface. This indicates that an increase in volatiles leads to a loosening of the coal structure and coarsening of pores, while a decrease in volatiles promotes structural densification and pore refinement.
(2) The surface roughness parameters Ra and Rq range from 1.54–4.55 nm to 1.98–5.83 nm, respectively. As the volatile content of coal samples increases, Ra and Rq exhibit the same linear upward trend. Additionally, the number of pores, area porosity, and shape factor of coal are negatively correlated with volatiles, attributed to gas impact during volatile exhalation damaging pore walls, leading to the merging of small pores and the closure of unstable micropores. In contrast, the average pore diameter shows a positive correlation, mainly due to the merging of small pores to form macropores and the preferential closure of less stable small pores, increasing the relative proportion of macropores. The differences in coal volatiles result in changes in its pore characteristics, which collectively affect the coal’s surface morphology, thereby increasing its roughness.
(3) Using the Gwyddion software, the study calculated the fractal dimension of each coal sample through three different fractal dimension calculation methods and found a negative correlation between the fractal dimension of coal samples and their volatiles. High-volatile coals have lower fractal dimensions due to a homogenization of pore sizes, while low-volatile coals exhibit higher structural complexity due to the coexistence of multi-scale pores.
(4) As a new indicator of pore evolution, the total number of nanorings shows a negative correlation trend with coal sample volatiles. Meanwhile, low-volatile coals have significantly more nanorings with diameters of 10–200 nm than high-volatile coal samples, suggesting that low-volatile coals are more likely to form regular nanorings due to their compact structure. The nanoring roughness shows a positive correlation trend with increasing volatiles, as gas escape and surface spallation during thermal evolution increase the roughness of high-volatile coals.
(5) Using advanced nanoscale characterization techniques and multi-parameter quantitative analysis, this study systematically elucidates the linear regulation mechanism of volatiles, as a core indicator of coal rank, on the nano-pore structure, morphology, and complexity of coal. It reveals changes in the pore structure of coal at different volatile contents, providing critical experimental evidence for refining theoretical models of coal pore evolution. Additionally, the study measures the fractal dimension of coal using multiple methods through Gwyddion software, providing reliable methodological conventions for studying the complexity of coal pore structures. Clarifying the quantitative relationships between volatiles and pore parameters aids in more accurately predicting the gas content, adsorption capacity, and permeability of different coal rank reservoirs, optimizing coalbed methane exploration and development. However, it is slightly regrettable that the number of samples in this study is relatively small, making it difficult to comprehensively reflect the correlation between volatile matter and pore parameters, roughness, and fractal dimension in coal samples. Furthermore, all samples in this study are anthracite, lacking samples from other coal ranks. Based on the current research progress, the authors believe that the following three directions are worth further exploration: (1) Real-time observation of the dynamic evolution of pores affected by volatile matter under in-situ temperature and pressure conditions; (2) Combining molecular simulations to reveal the microscopic mechanism of pore formation during organic matter pyrolysis; and (3) Extending the research to samples of different coal ranks to verify the universality of the observed patterns.


