Article

Regular Wave Effects on the Hydrodynamic Performance of Fine-Mesh Nettings in Sampling Nets

1
College of Marine Living Resource Sciences and Management, Shanghai Ocean University, Shanghai 201306, China
2
National Engineering Research Center for Oceanic Fisheries, Shanghai Ocean University, Shanghai 201306, China
3
Key Laboratory of Sustainable Exploitation of Oceanic Fisheries Resources, Shanghai Ocean University, Shanghai 201306, China
4
Key Laboratory of Exploitation of Ocean Fisheries Resources, Shanghai Ocean University, Shanghai 201306, China
*
Authors to whom correspondence should be addressed.
Appl. Sci. 2025, 15(13), 7229; https://doi.org/10.3390/app15137229
Submission received: 25 April 2025 / Revised: 30 May 2025 / Accepted: 18 June 2025 / Published: 27 June 2025

Abstract

Fine-mesh netting, with mesh dimensions of the order of a few millimeters, is widely used in sampling nets for the collection of larval and juvenile fishes. The wave force characteristics of fine-mesh netting significantly affect the operational performance of these nets. This study employed both wave tank experiments and numerical simulations to analyze the hydrodynamic performance of fine-mesh netting under varying wave conditions. A series of numerical simulations and particle image velocimetry (PIV) experiments were conducted to investigate the damping effects of fine-mesh netting on wave propagation. The results revealed that horizontal wave forces increased with both the wave period and wave height. When the wave period was held constant, the drag and inertial coefficients of the netting generally decreased as the Reynolds number and the Keulegan–Carpenter (KC) number increased. The wave transmission coefficients of the netting decreased as the wave height increased for the same wave period. However, at a constant wave height, the transmission coefficients initially increased and then decreased with the increasing wave period. The water particle velocity was significantly affected by the netting, with a notable reduction in velocity downstream of the netting at both the wave crest and trough phases. The simulation results and PIV measurements of the water particle velocity field distribution were in good agreement. This study provides important insights for the design and optimization of sampling nets.

1. Introduction

Fine-mesh netting, featuring mesh sizes from several millimeters down to micrometers, is commonly employed in the trawling of small fish species such as minnows, as well as in ichthyoplankton sampling efforts [1,2,3,4,5,6]. Unlike standard mesh netting [7,8,9,10], fine-mesh netting typically exhibits a higher solidity ratio—defined as the proportion of the projected area of the netting relative to its total enclosed area. Its hydrodynamic performance and filtration efficiency differ significantly from those of standard mesh netting [11,12,13,14,15,16]. Additionally, the stability and fuel consumption of sampling nets made from high-solidity-ratio netting are strongly influenced by the hydrodynamic characteristics of the material. Notably, fluctuations in the towing speed during sea trials have been observed to affect the depth stability of midwater sampling nets, leading to deviations from the desired operational depth [17]. In addition, prior studies have demonstrated that in square-mesh configurations, the filtration efficiency improves with the increasing towing velocity and decreasing solidity ratio [18]. These findings underscore the importance of a thorough understanding of the hydrodynamic performance of fine-mesh netting in optimizing the design and functional reliability of modern sampling nets.
Extensive research on the hydrodynamic performance of standard mesh-sized netting has primarily concentrated on structural parameters such as the solidity ratio, twine material, and the distinctions between knotted and knotless configurations [9,10,19,20,21]. In contrast, fine-mesh netting, due to its higher solidity ratio, generates significantly greater hydrodynamic resistance and gives rise to more intricate and turbulent flow structures in the surrounding fluid. Consequently, the hydrodynamic coefficient of fine-mesh netting is higher, and the velocity attenuation downstream of the netting is more pronounced compared to that of standard mesh netting in currents [11,14,15,16]. However, when fishing gear operates at the ocean surface, it is concurrently subjected to wave forces, which significantly affect its stability. Several studies have thus examined the influence of different wave types (e.g., regular, irregular, and extreme waves) and wave conditions (e.g., wave period, wave height, and wave steepness) on the hydrodynamic performance of netting [22,23,24,25,26,27,28,29,30,31]. For example, Lader et al. found that changes in the wave geometry did not necessarily show more pronounced effects on nets with higher solidity ratios compared to those with lower solidity ratios [23]. Furthermore, the horizontal force exerted by waves was approximately 10 times greater than the vertical force, and both forces increased with the solidity ratio of the netting [24]. The drag coefficient was observed to decrease with increasing Reynolds and Keulegan–Carpenter numbers [26,32]. In addition, the hydrodynamic performance of biofouled netting (with marine organisms such as hydroids attached, thereby increasing the solidity ratio) has been investigated under wave conditions. The results indicated that biofouling significantly increased the drag force, with a more pronounced effect on drag than on inertial force, causing the wave force on biofouled netting to be as much as 3.88 times greater than that on clean netting [28,33]. Despite its widespread application, the hydrodynamic behavior of fine-mesh netting—particularly clean netting with a high solidity ratio—under wave conditions has received limited scholarly attention. A comprehensive understanding of its hydrodynamic performance in wave environments is, therefore, essential, as it can inform the optimized design and structural refinement of sampling gear used in marine research and fisheries’ operations.
Numerous studies have investigated the hydrodynamic performance of netting through both physical experiments and numerical simulations. Numerical simulation methods are particularly favored for their cost-effectiveness and high precision [34,35,36]. In these simulations, netting models are often constructed based on various simplifying assumptions. For example, some models represent netting as a series of lumped masses points interconnected by massless springs [25,37], while others treat netting as porous media to explore the hydrodynamic behavior under wave conditions [33,38,39]. Furthermore, fluid–structure interaction models have been employed to integrate these approaches, enabling more comprehensive analyses. The establishment of a numerical wave tank is critical for examining wave forces on netting. Such wave tanks typically consist of three primary regions: the wave maker, the computational domain, and the wave absorber. The design precision of these components directly influences the accuracy of the simulation results [37,38]. Analytical and experimental studies have explored wave reflection and transmission by vertical netting to assess wave attenuation both upstream and downstream of the netting. For instance, Lader et al. found that netting with a higher solidity ratio leads to greater wave energy dissipation, particularly for longer waves [23]. Zhao et al. observed that the transmission coefficient remained constant with an increasing wave height but increased with longer wavelengths [38]. Bi et al. examined the damping effect of net cages on wave propagation across varying wave periods, revealing that the transmission coefficient inside a net cage was higher than that downstream of it [27]. Moreover, as the number of net cages increased, the wave transmission coefficient gradually decreased. Despite these contributions, the attenuation of waves downstream of fine-mesh netting remains poorly understood. Further research is necessary to fully comprehend the complex flow field around fine-mesh netting under wave conditions.
In this study, we examine the hydrodynamic performance of fine-mesh netting under various linear wave conditions by combining wave hydrodynamic experiments and numerical simulations. A porous media fluid model is employed to simulate fine-mesh netting in waves and the numerical results are validated against experimental data. The relationships between the drag and inertial coefficients and the Reynolds number and Keulegan–Carpenter number are systematically investigated. Additionally, a numerical analysis of wave elevation upstream and downstream of the netting is conducted, with the transmission coefficient utilized to evaluate wave attenuation downstream. The water particle velocity field distribution around the netting is analyzed using numerical simulations and particle image velocimetry (PIV) technology.

2. Material and Methods

2.1. Hydrodynamic Experiment of Fine-Mesh Nettings in a Wave Tank

2.1.1. Netting Models and Hydrodynamic Experimental Setup

Table 1 summarizes the structural characteristics of two fine-mesh nettings selected for hydrodynamic performance evaluation. Both nettings featured square mesh geometry and were fabricated from polyamide and Dyneema monofilaments. The average values of mesh bar length and twine diameter were derived from measurements of 10 individual mesh bars and 10 twine samples, respectively. The solidity ratio (Sn) was calculated using the expression S n = d 2 l d / l 2 , where l denotes the mesh bar length and d the twine diameter.
Hydrodynamic experiments were carried out in a wave tank (length: 65 m, width: 1 m, and water depth: 0.7 m) located at the Rudong Testing Facility, managed by the Fisheries Engineering Institute of the Chinese Academy of Fishery Sciences (see Figure 1). The bottom surface was constructed of smooth cement and the sidewalls were made of glass. To ensure the nettings remained in a stable equilibrium position during testing without the influence of horizontal constraints, they were suspended using two vertical bridle lines, each 0.95 m long. Additionally, four symmetrically placed bridle lines, each 0.58 m in length, were connected to the netting and attached to tension load cells installed on either side. These load cells, affixed to a 10 mm diameter support rod, had a measurement capacity of 20 N and a precision of 1%. A fixed horizontal spacing of 0.75 m between the support rod and the net ensured minimal interference with the flow field. Wave force data were collected at a sampling frequency of 50 Hz over a duration of 60 s, with each test condition repeated three times to reduce experimental uncertainty. The wave-induced force acting specifically on the netting was obtained by subtracting the baseline frame force from the total recorded load. Surface wave elevation at the netting location was monitored using a wave gauge (LYL-III, State Key Laboratory of Coastal and Offshore Engineering, Dalian University of Technology, Dalian, China), and wave conditions were verified for consistency prior to data acquisition. Throughout the experiments, the water temperature and density were maintained at approximately 20.3 °C and 998 kg/m3, respectively.

2.1.2. Wave Condition

A total of 12 wave conditions were designed for this experiment, encompassing 3 wave periods and 4 wave heights, as shown in Table 2. The wave heights ranged from 0.10 to 0.19 m, the wave periods from 1.3 to 2.3 s, and the corresponding wave lengths from 2.49 to 5.49 m. Consequently, the wave steepness ranged between 0.024 and 0.076.

2.1.3. Determination of the Hydrodynamic Coefficients

A total of 12 regular waves were employed to evaluate the hydrodynamic performance of the fine-mesh nettings. The wave characteristics were approximated using linear wave theory [22,40,41] and described in terms of the velocity potential (φ) and surface elevation (η):
φ = π H T k cosh k ( z + h ) cosh ( k h ) sin ( k x 2 π f t )
η = a cos k x 2 π f t = H 2 cos ( k x 2 π f t )
where a is the wave amplitude (a = H/2, H is wave height), f is frequency (the reciprocal of T, where T is wave period), k is the wave number (k = 2π/L, where L is wave length), h is water depth, z is the vertical position in the water column, and x is the horizontal position.
Therefore, the fluid element velocity at position x ( u x = φ x ) and its corresponding acceleration ( u x t ) were obtained:
u x = ( π H T ) cosh k ( z + h ) sinh k h cos ( k x 2 π f t )
u x t = ( 2 π 2 H T 2 ) cosh k ( z + h ) sinh k h sin ( k x 2 π f t )  
In this study, the horizontal wave force acting on the netting and the corresponding wave surface elevation were measured simultaneously. The Morison equation was applied to calculate the drag coefficient (CD) and inertia coefficient (CM) of the nettings under wave conditions. The hydrodynamic force (F) exerted on a submerged cylindrical element, whose diameter is small relative to the wavelength, is expressed as:
d F = d F D + d F M = d 1 2 C D ρ A u x u x + C M ρ V u x t
where CD and CM are drag and inertial coefficients, respectively, A is area projecting the vertical section, V is volume of the submerged cylinder, and ρ is fluid density.
The Reynolds number (Re) and Keulegan–Carpenter number (KC) are defined as:
R e = u m d / υ
K C = u m T / d
where um is the maximum horizontal velocity of the water element and υ is the kinematic viscosity.

2.2. PIV Measurement Experiment for Field Distribution Around the Netting

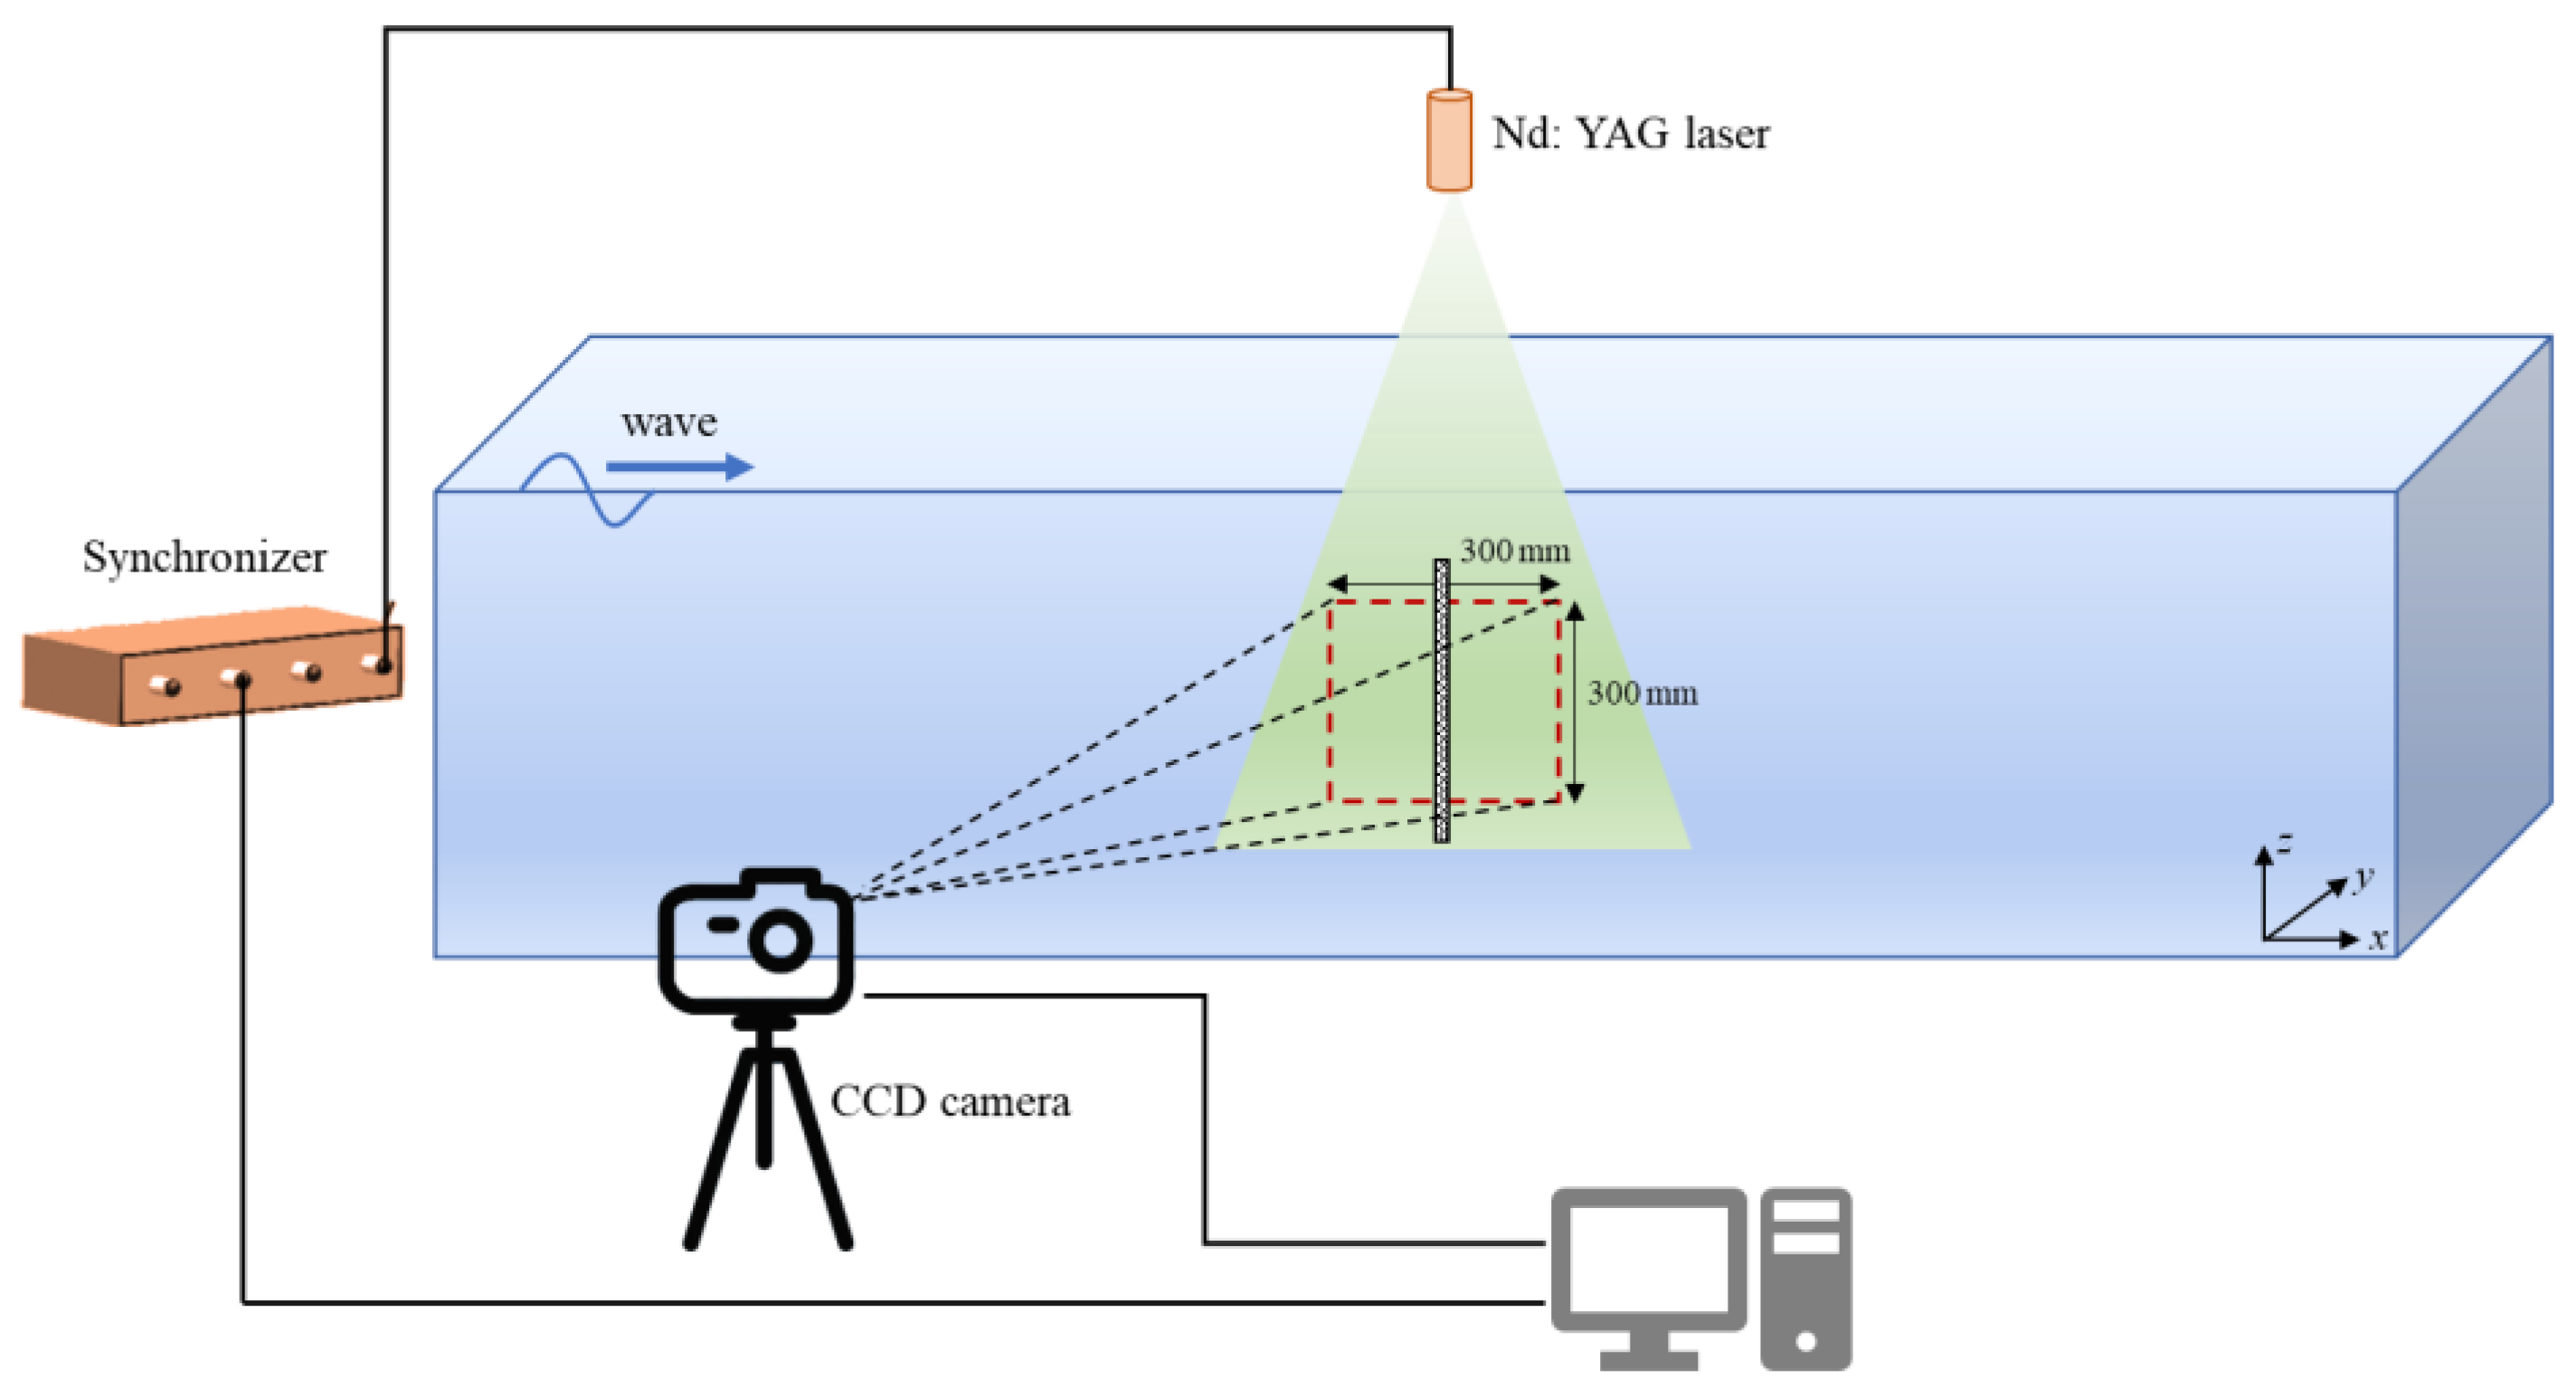
A schematic representation of the PIV system is provided in Figure 2. The experimental setup comprised a high-resolution CCD (charge-coupled device) camera (TSI POWERVIEW Plus 4MPE, TSI Incorporated, Shoreview, Minnesota, USA), a dual Nd:YAG laser, a synchronizer, an articulated optical arm, and a computer-based image acquisition and processing system [42,43]. To visualize the flow, polyvinyl chloride (PVC) tracer particles—chosen for their near-neutral buoyancy—were introduced into the flow field both upstream and downstream of the netting. These particles were assumed to accurately follow the fluid motion. The dual-pulsed Nd:YAG laser, with a wavelength of 532 nm and a maximum energy output of 200 mJ per pulse at a repetition rate of 14.5 Hz, generated a thin laser sheet oriented vertically through the central longitudinal plane of the netting. This laser sheet illuminated the tracer particles, enabling flow visualization in a 300 × 300 mm2 measurement area. The CCD camera, positioned orthogonally to the laser plane, recorded sequential images of the scattered light with a spatial resolution of 2360 × 1776 pixels2 and a frame rate of 5 Hz. The laser pulses and camera operation were precisely synchronized via a dedicated timing controller to ensure accurate capture of particle displacement between image pairs.
In the single-frame PIV measurements, two consecutive particle images were captured within a single frame and subsequently transmitted to a computer for post-processing using the INSIGHT 4G™ version 11.1.0 software. For each experimental condition, a total of 100 pairs of instantaneous particle images were sequentially acquired, enabling the calculation of time-averaged mean flow fields around the netting. During image analysis, interrogation windows measuring 64 × 64 pixels2 were employed, with a 50% overlap between adjacent windows to ensure adequate spatial resolution.

2.3. Numerical Simulation of the Netting Models

In this study, the fine-mesh netting is modeled as a porous medium within a three-dimensional numerical wave tank. Wave surface evolution is captured using the Volume of Fluid (VOF) method, which is well-suited for tracking free surfaces. The simulation framework is based on the Navier–Stokes equations, enabling the accurate generation and propagation of regular waves under various conditions [33,38,39,44,45].

2.3.1. Governing Equations

The flow is assumed to be unsteady, irrotational, and incompressible, with no surface tension. The governing equations include the mass continuity equation and the momentum equations, as described.
The continuity equation:
ρ u i x i = 0
The momentum equation:
ρ u i t + ρ ( u i u j ) x j = p x i + ρ g i + μ 2 u i x j 2 + 2 u j x i 2 + S i
where t is time; μ is fluid viscosity; ρ is fluid density; p is pressure; ui and uj are the volume-averaged velocity components; i, j = 1, 2, 3 (x, y, z); gi is the gravitational acceleration; and Si is the source term for the momentum equation.

2.3.2. Porous Media Model

The porous media fluid model is a theoretical approach used to represent the flow resistance induced by netting by introducing appropriate porous resistance coefficients. Outside the porous media region, the source term Si in the momentum equation is set to zero. Within the porous media region, however, Si is calculated using the following expression:
S i = j = 1 2 D i j μ u j + j = 1 2 C i j 1 2 ρ u j u j
D i j = D n 0 0 0 D t 0 0 0 D t
C i j = C n 0 0 0 C t 0 0 0 C t
where Dij and Cij are material matrices representing the viscous and inertial resistance coefficients, respectively. In these matrices, Dn and Cn are the normal resistance coefficients, while Dt and Ct denote the tangential resistance coefficients. The subscripts i and j correspond to the spatial directions x and y, respectively. This formulation incorporates both a linear term (viscous resistance) and a quadratic term (inertial resistance), consistent with Darcy’s law extended for porous media flows. The total hydrodynamic force acting on the netting consists of drag and lift components. The drag force (FD) acting on the netting panel is aligned with the water particle velocity in the x-axis direction, while the lift force (FL) acts perpendicular to it, along the y-axis. These forces are calculated using the following expressions:
F D = 1 2 ρ C D A u 0 2
F L = 1 2 ρ C L A u 0 2
where CD and CL are the drag and lift coefficients, respectively; A is the projected area of the netting; and u0 is the velocity of the upstream water particles.
Previous studies have demonstrated that, under wave conditions, the vertical force exerted on fishing nets is relatively minor compared to other hydrodynamic forces and can, therefore, be reasonably neglected [29]. When modeling the netting as a porous medium, the hydrodynamic force acting on it can be expressed as:
F = S i λ A
By substituting Equations (10) and (13) into this expression, the drag force acting on the porous medium can be derived:
F D = ( D n μ u + 1 2 C n ρ u u ) λ A
where λ is the thickness of the porous media, and a thickness of 20 mm was chosen in this study [17], and u is the water particles’ velocity inside the porous media. In this study, the porous media resistance coefficients were calculated based on the wave force data obtained during the wave tank experiments (Section 2.1) for each netting. These coefficients were derived using a polynomial regression method, which fits the measured wave forces from the experiments to the corresponding water particle velocities, as described by Equations (3), (5), and (16) (R2 > 0.9) (See Table 3).

2.4. Numerical Wave Tank

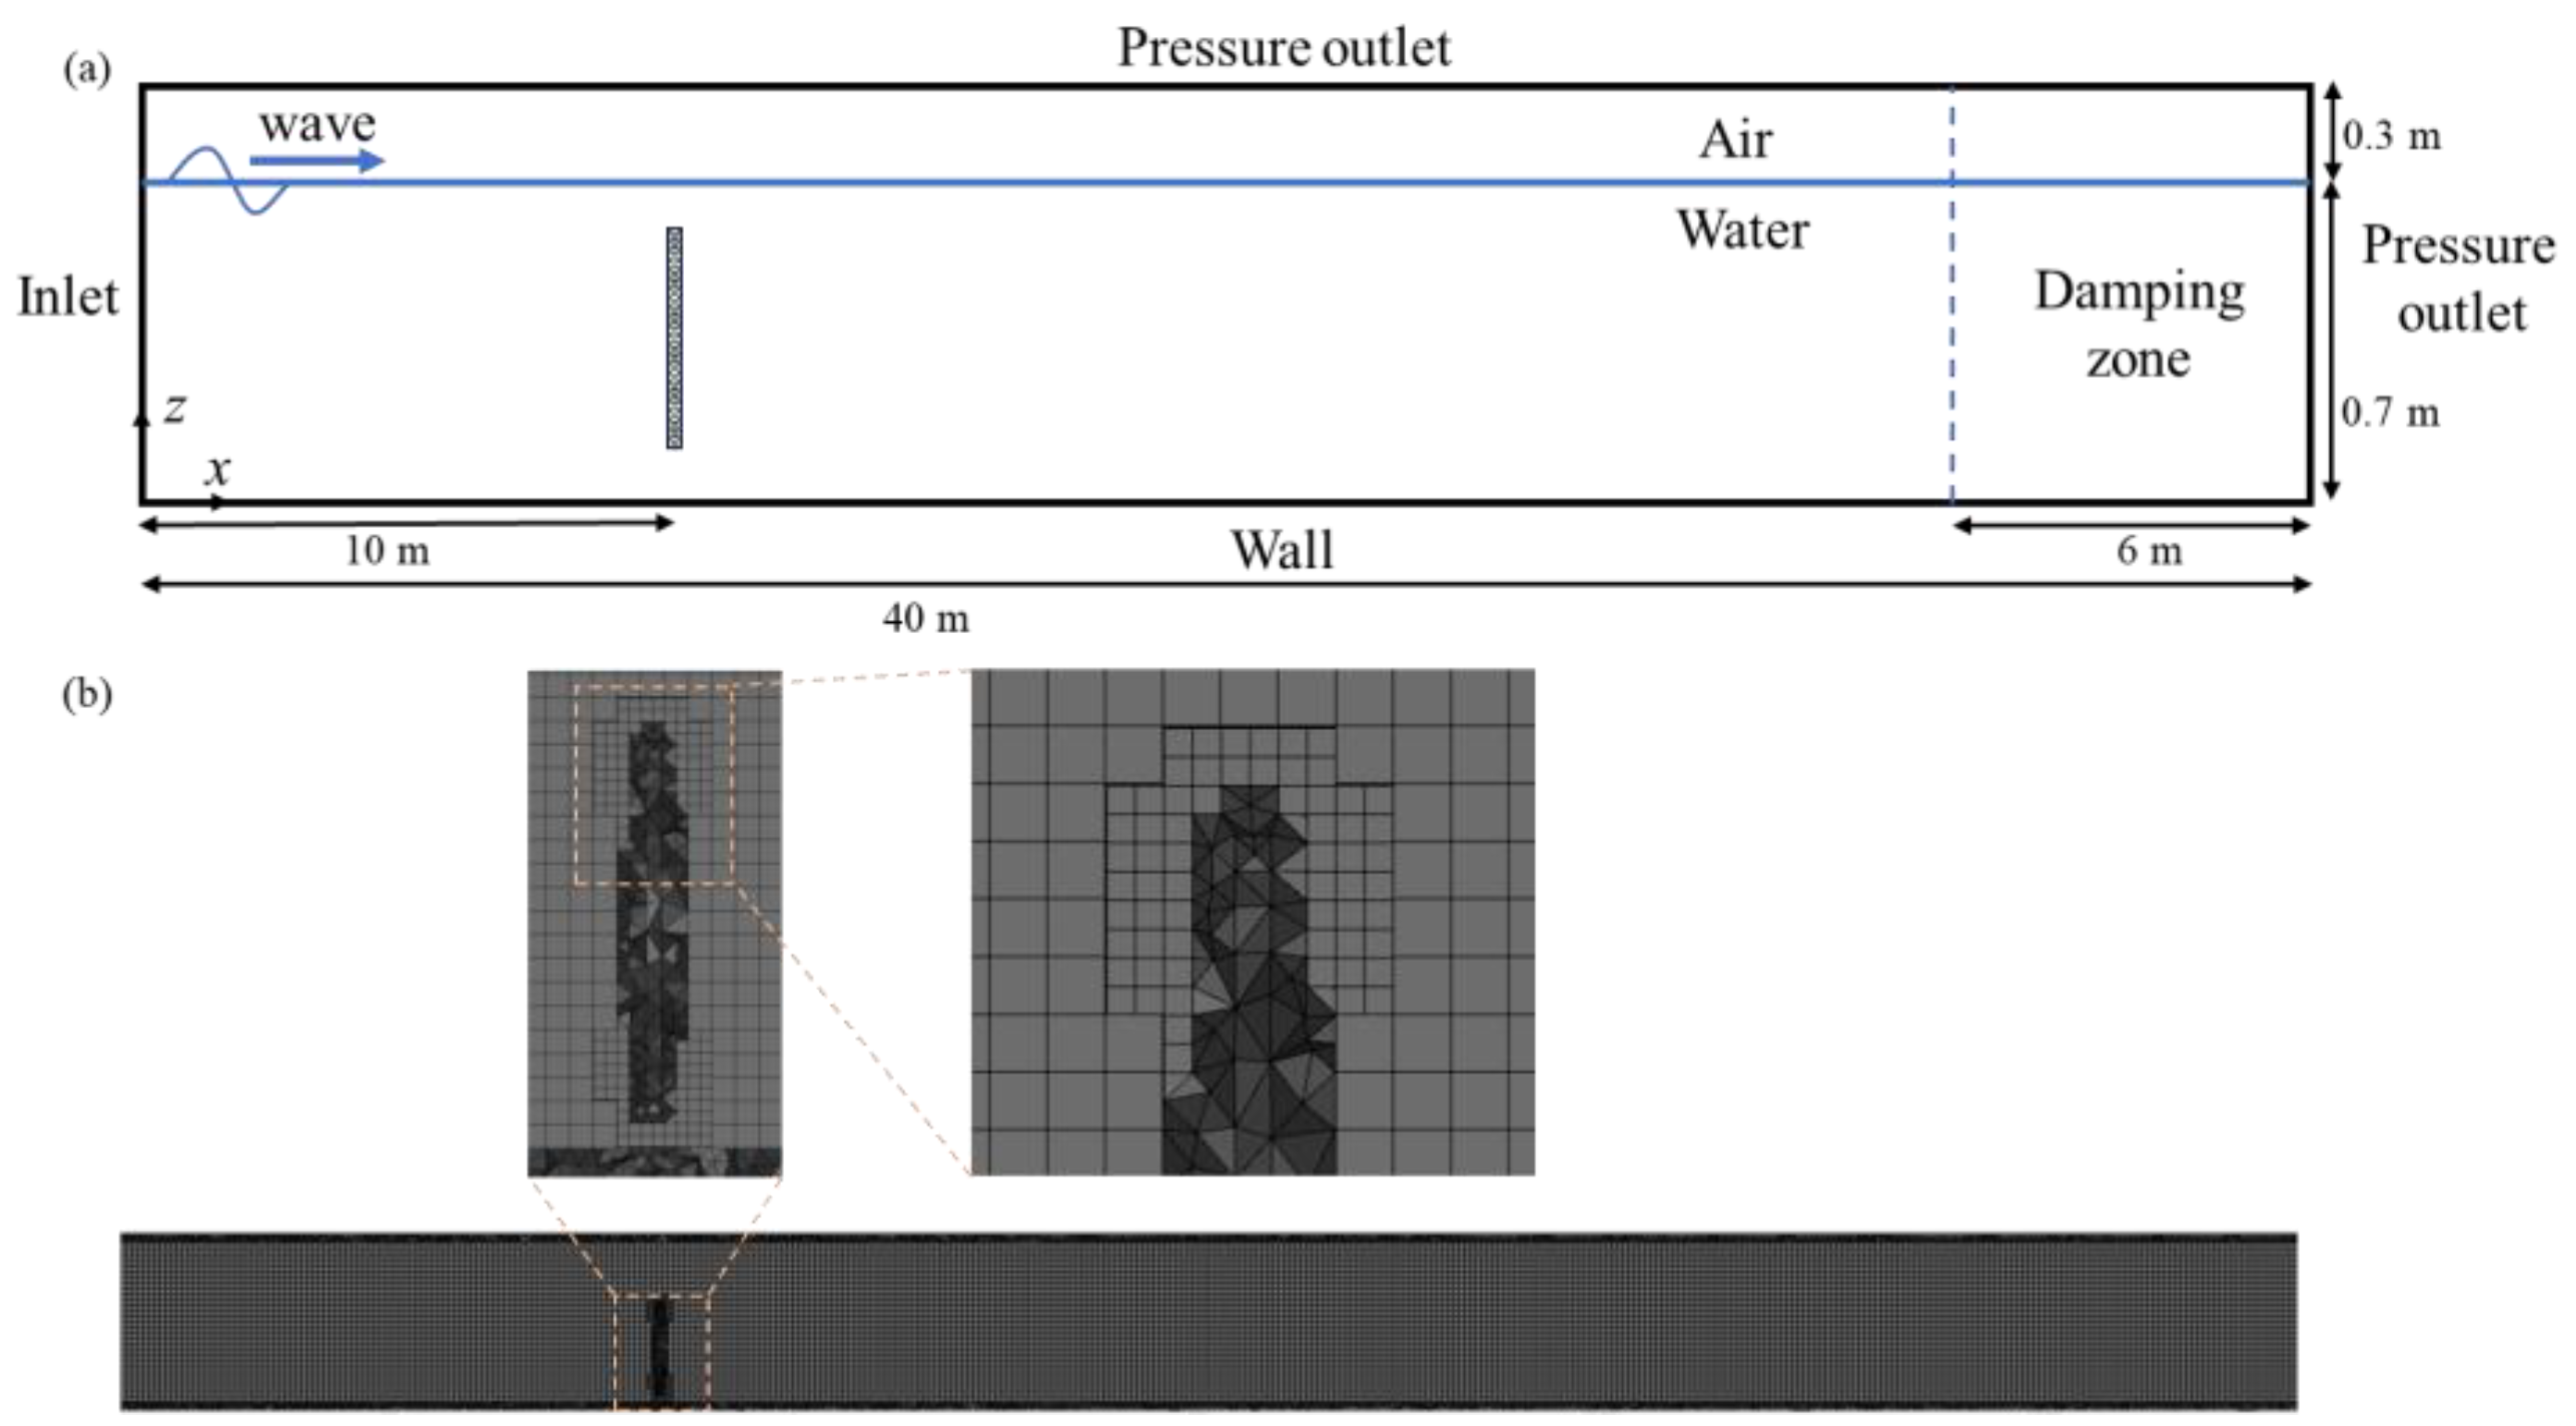
The numerical wave tank is configured to simulate both regular and irregular waves by applying a prescribed motion at the wave-generation boundary, implemented through an open-channel wave boundary condition. To reduce wave reflection and its potential influence on the flow field, a damping zone is placed at the downstream end of the tank (see Figure 3). The tank has dimensions of 40 m in length, 1 m in width, and 1 m in depth.

2.4.1. Wave Generation

In this study, the regular waves are generated using the wave generation boundary by the following equation for linear wave theory [40,45]:
η x , t = 1 g φ t = a cos ( k x ω t )
ω 2 = g k tanh ( k h )
where ω   ( = 2 π / T ) is the angular frequency of the wave and the wave number k satisfies the dispersion relation in Equation (18).
The velocity components under linear wave theory can be expressed as follows:
u x = φ x = g k a ω cosh k ( z + h ) cosh k h cos ( k x ω t )
u y = φ y = g k a ω cosh k ( z + h ) cosh k h sin ( k x ω t )
u z = φ z = g k a ω sinh k ( z + h ) cosh k h sin ( k x ω t )

2.4.2. Wave Absorption

To dissipate wave energy and suppress wave reflection at the downstream end of the tank, a damping zone is incorporated by introducing a source term into the momentum equations within the cell zone near the pressure outlet boundary. The source term (S) is as follows:
S = C 1 ρ w + 1 2 C 2 ρ w w f ( z ) f ( x )
where f ( x ) and f ( z ) are the damping function in the x and z direction, respectively. C1 and C2 are damping resistance, which are both equal 10 in this study.
The damping functions are as following:
f x = x x 0 x e x 0 2
f z = 1 z z f s z b z f s
where x0 and xe are the start and end position of the damping zone in the x direction, respectively, and zfs and zb are the free surface and bottom level along the vertical direction along gravity. To evaluate the effectiveness of wave absorption, wave elevations within the damping zone were monitored at various positions. The results indicate that nearly all wave energy is dissipated before reaching the end of the wave tank (See Section 2.4.4).

2.4.3. Boundary Conditions and Solution Algorithm for the Numerical Wave Tank

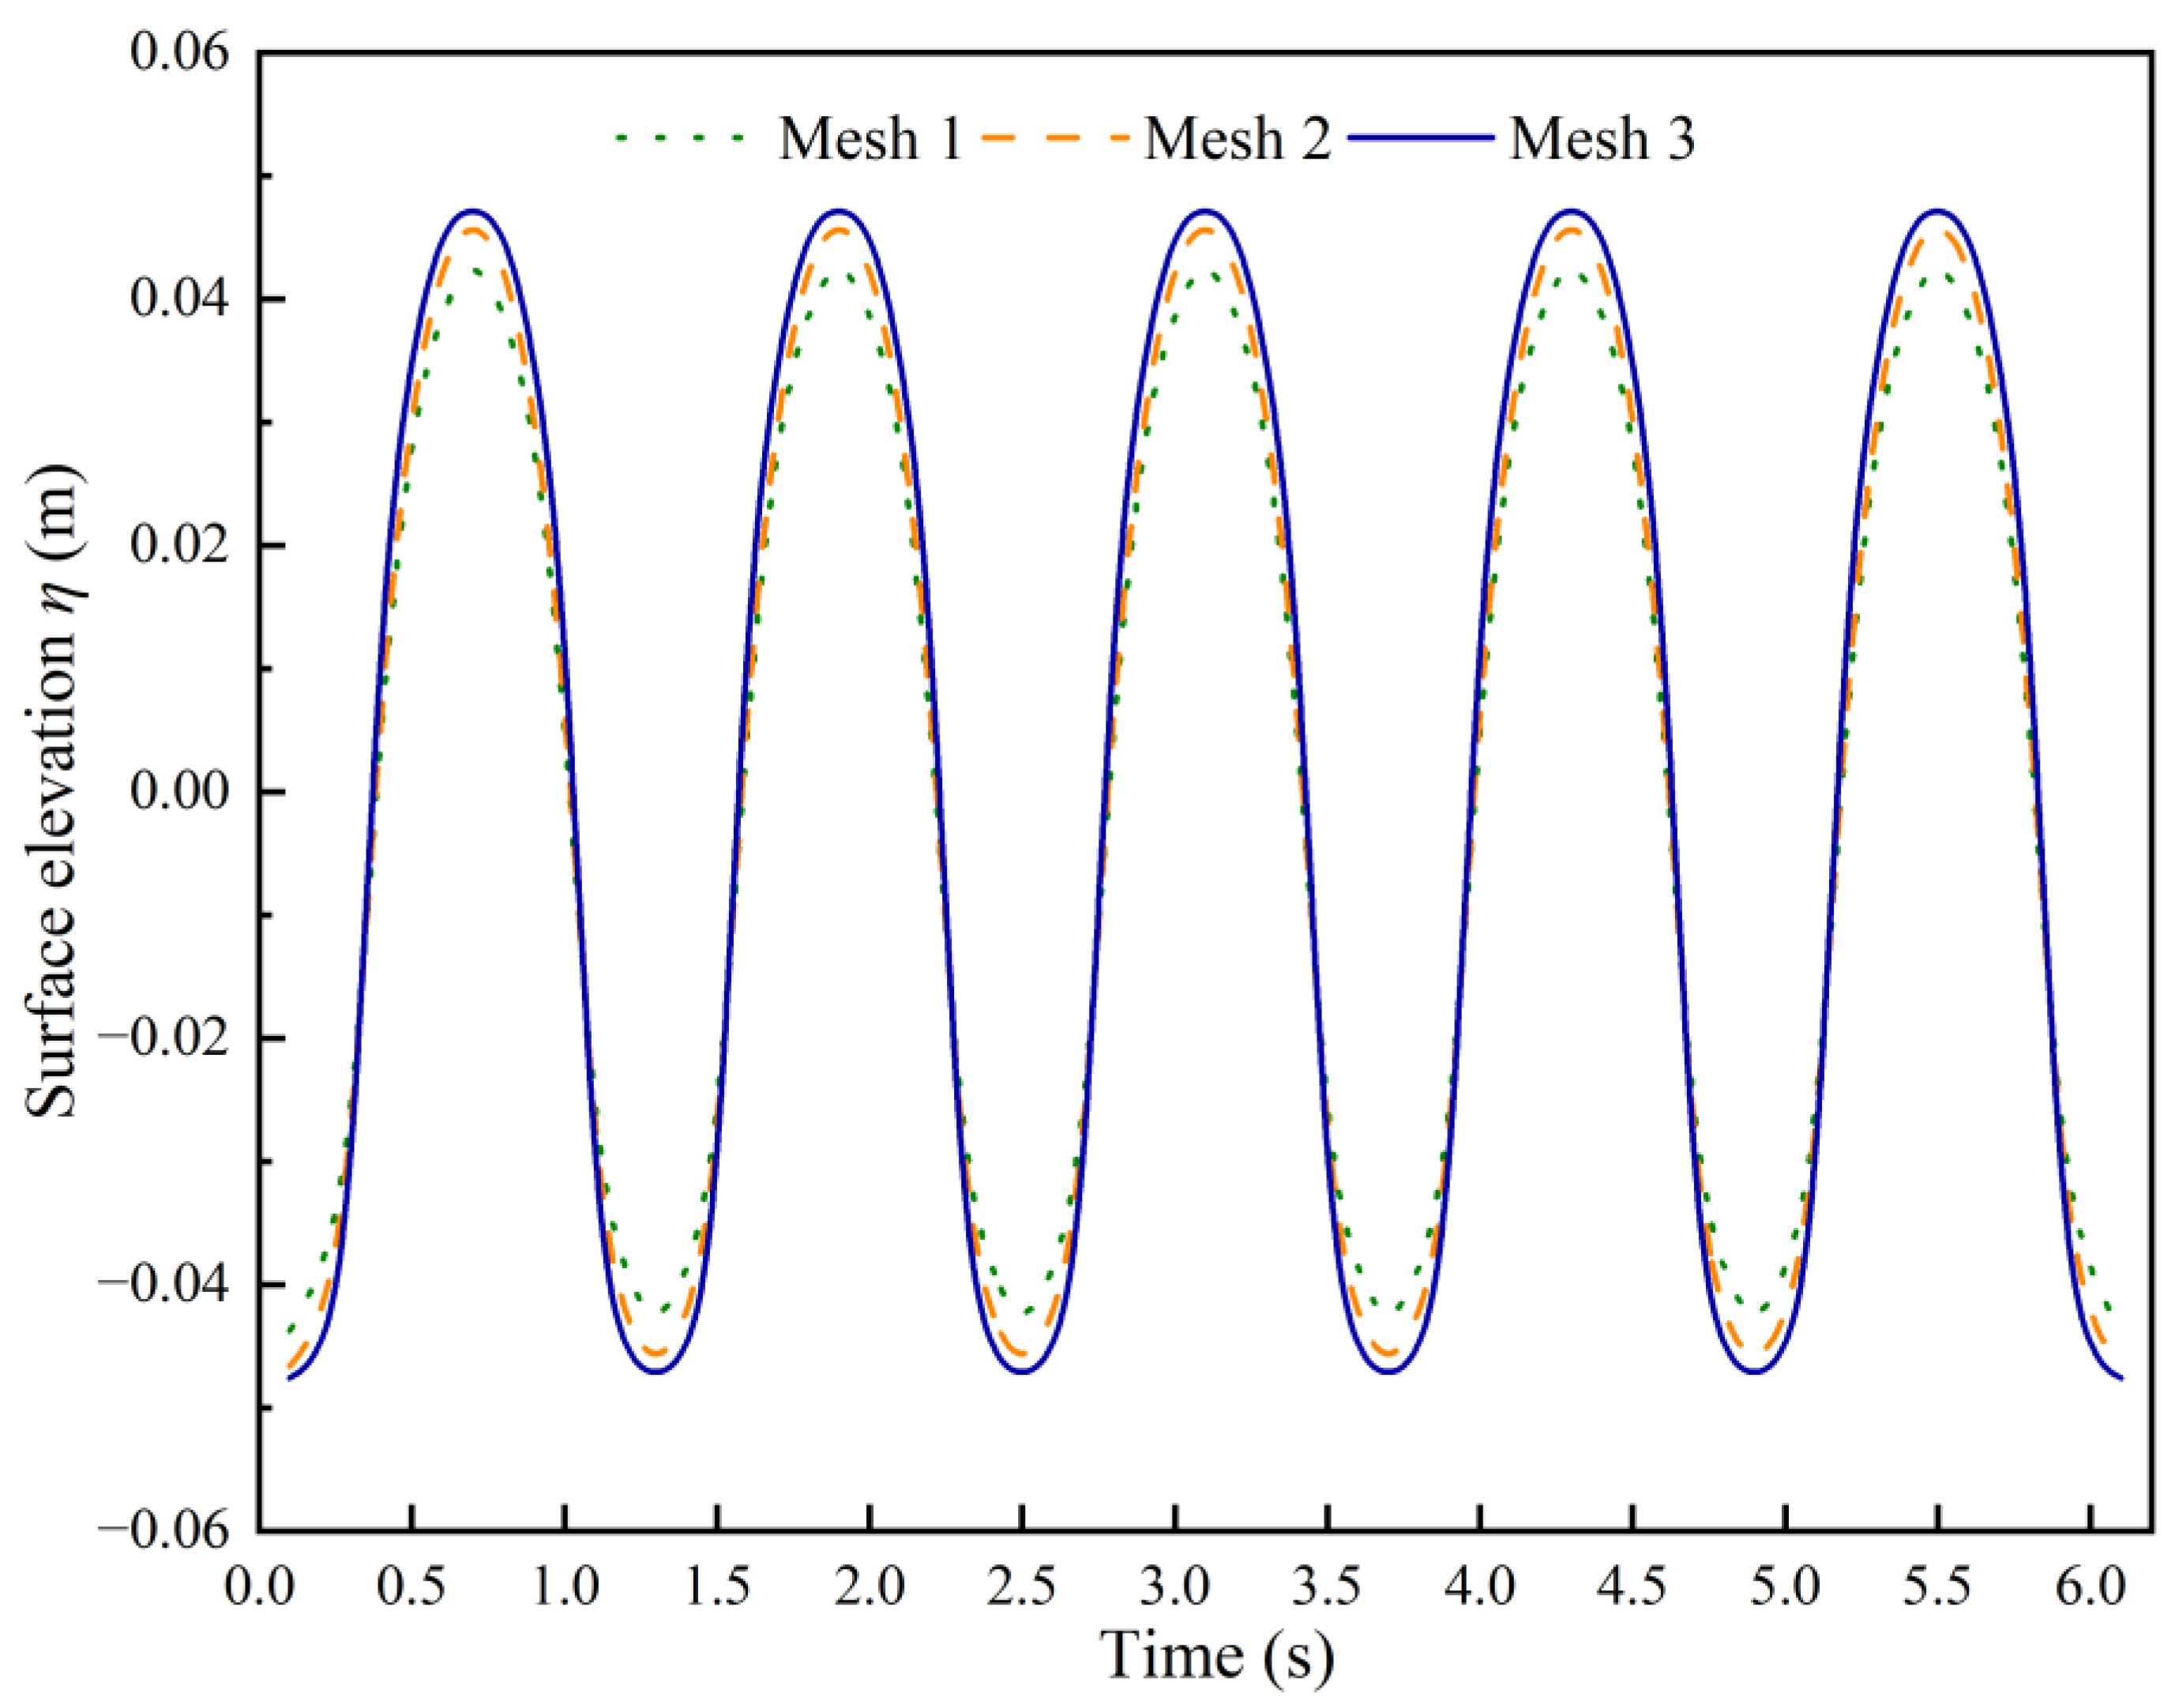
The numerical simulation of the wave tank was developed and solved using the finite volume method within ANSYS FLUENT 2022 R1. Figure 3a depicts the computational domain along with the specified boundary conditions. The netting is positioned 10 m downstream from the inlet, which is defined by a velocity-inlet boundary condition. Pressure-outlet boundary conditions are applied at both the outlet and the upper boundaries of the tank, while the bottom and sidewalls are treated as no-slip walls. To minimize wave reflections, a 6 m long damping zone was implemented at the downstream end of the domain. Figure 3b presents the mesh configuration, which employed poly-hexcore-structured grids to balance computational efficiency and accuracy. A mesh independence study was performed to assess wave surface elevation at T = 1.3 s and H = 0.10 m (see Table 4). The results demonstrated that Mesh 3 offered adequate accuracy and was thus selected for all subsequent simulations (see Figure 4). The computational domain consists of approximately 2.1 × 10⁶ grids, with a maximum grid size of 30 mm and a minimum grid size of 4 mm. An unsteady, pressure-based solver was employed to achieve a converged solution. Pressure–velocity coupling was accomplished using the PISO algorithm. Second-order upwind schemes were applied for discretizing pressure, momentum, turbulent kinetic energy, and turbulent dissipation rate.

2.4.4. Validation of the Numerical Wave Tank

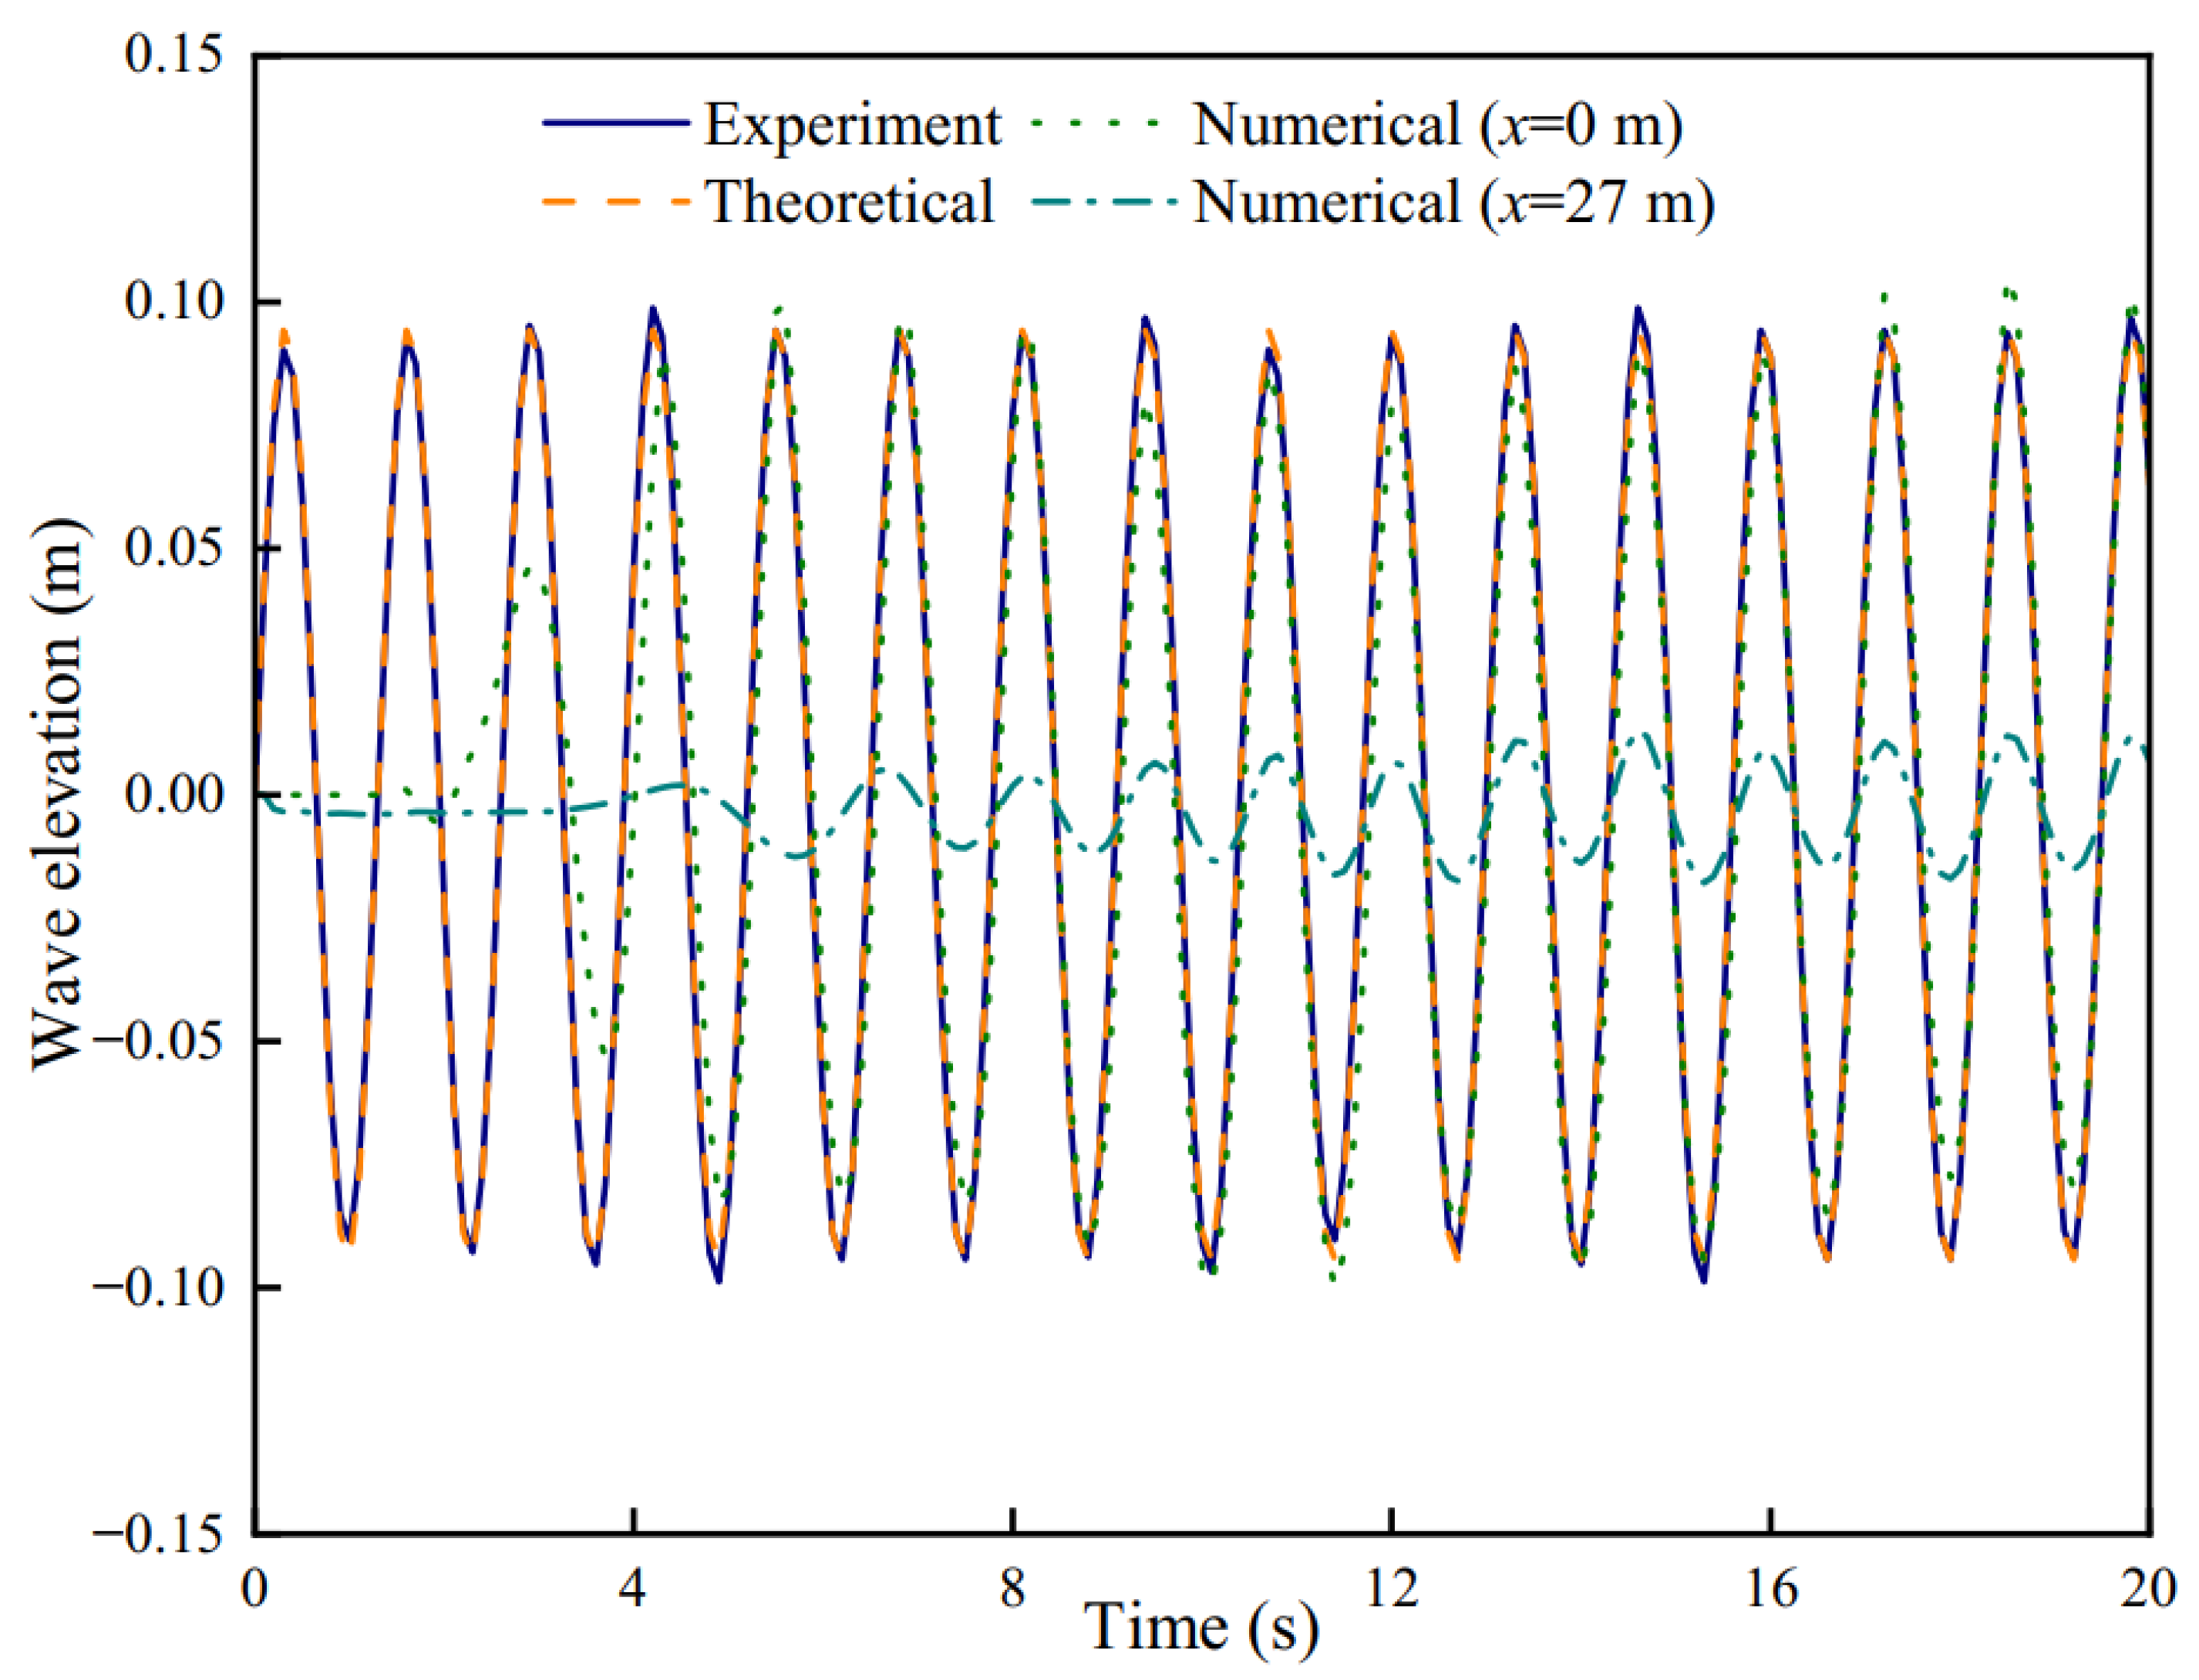
Figure 5 illustrates the time series of wave elevation in the numerical wave tank, comparing the simulation results with both experimental and theoretical values. After approximately 4 s, the wave elevation at the numerical monitoring point (x = 0 m) aligns well with both experimental and theoretical values. The numerical data at x = 27 m correspond to the location of the damping zone. These results confirm that the wave elevations are consistent across different positions within the tank. The generated waves maintain stability in both space and time, providing a reliable foundation for simulating the wave field around the netting.
The wave transmission coefficient (CT) is employed to quantitatively measure the wave propagation effect of the netting on the wave field. The transmission coefficient is defined as followed [33,38]:
C T = H t H i
where Ht is the wave height downstream of the netting and Hi is the wave height upstream of the netting. In this study, these were the wave height values at x = 5 m and x = −5 m positioned in numerical results, respectively.

3. Results

3.1. Hydrodynamic Force on Fine-Mesh Nettings in Waves

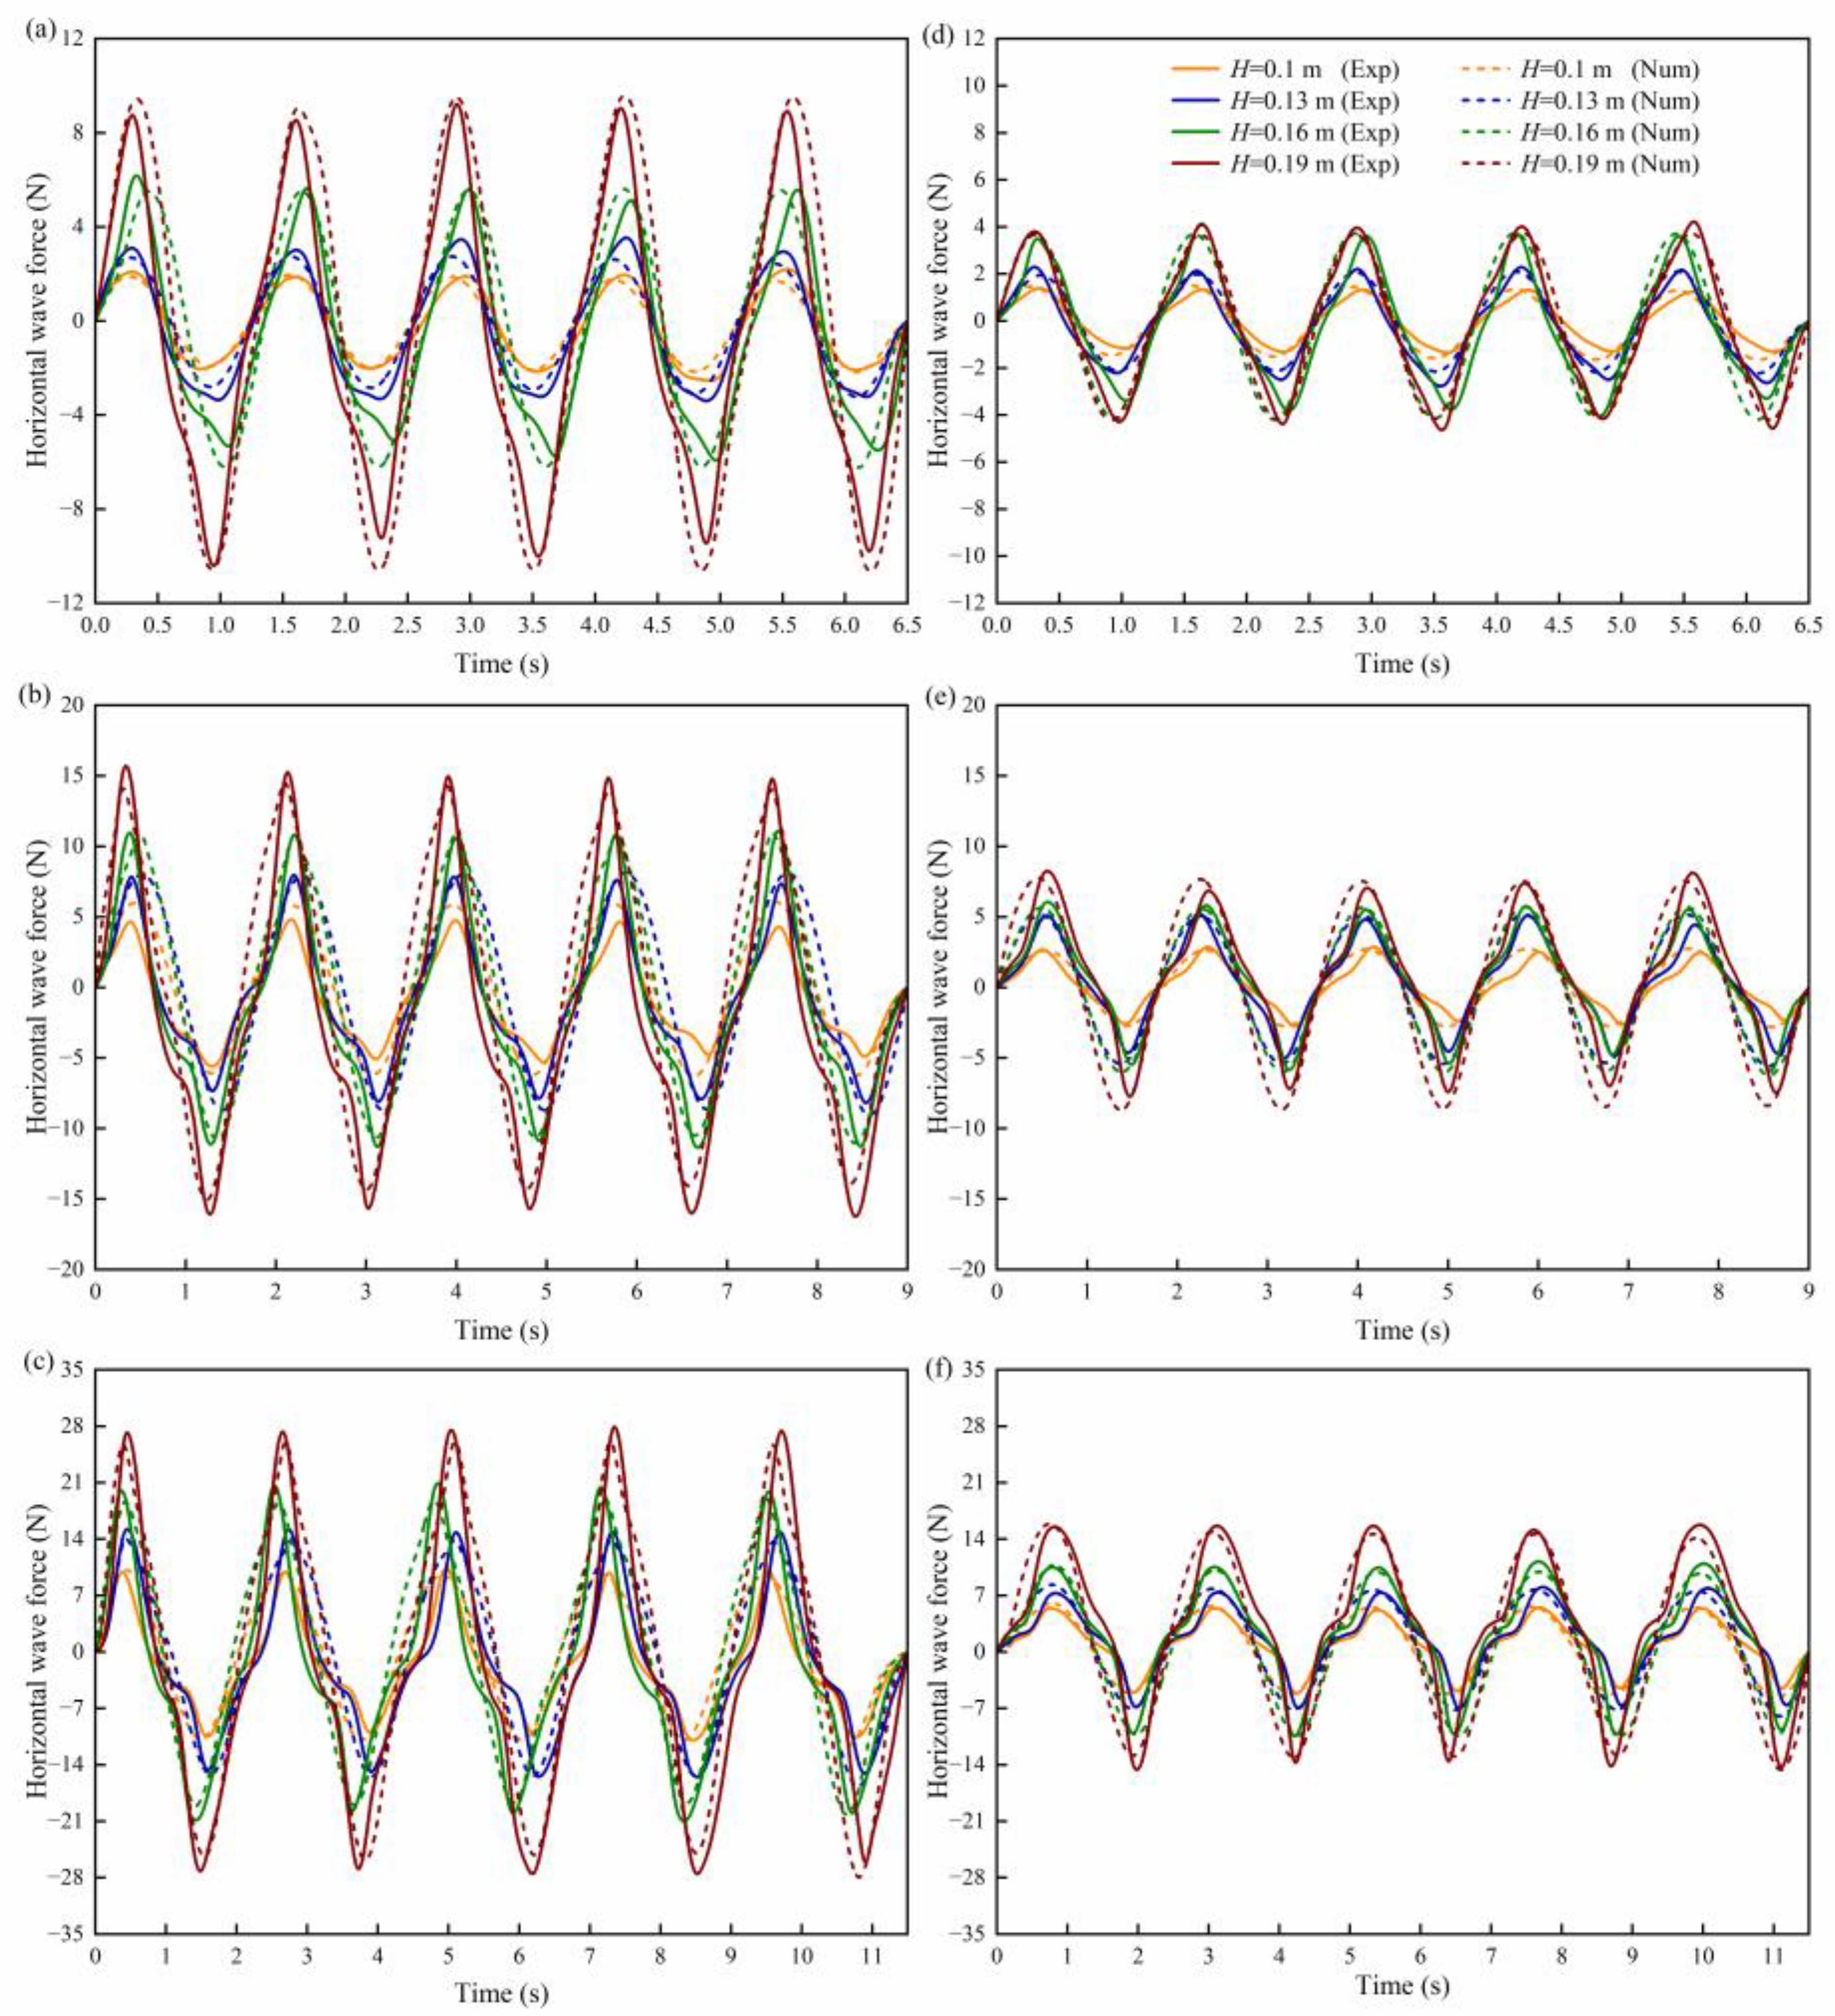
The experimental and numerical values of the horizontal wave forces on the nettings under various wave conditions are presented in Figure 6. The horizontal wave forces increase with longer wave periods for all nettings, reaching a maximum at a wave period of 2.3 s. Similarly, horizontal wave forces increase with greater wave heights, with the maximum force observed at a wave height of 0.19 m. For Net 1, the experimental and numerical mean peak wave force values at a wave height of 0.19 m were as follows: 9.90 N and 9.80 N at a wave period of 1.3 s, 16.61 N and 15.48 N at a wave period of 1.8 s, and 28.12 N and 27.47 N at a wave period of 2.3 s, respectively. For Net 2, the corresponding values were 5.28 N and 3.82 N at a wave period of 1.3 s, 7.73 N and 7.67 N at a wave period of 1.8 s, and 15.66 N and 14.90 N at a wave period of 2.3 s, respectively. Overall, the mean peak wave force of Net 1 was consistently greater than that of Net 2 across all wave conditions. Furthermore, the experimental and numerical wave force values for the nettings showed good agreement under the tested wave conditions, validating the accuracy of the numerical model.

3.2. Hydrodynamic Coefficients of Fine-Mesh Nettings in Waves

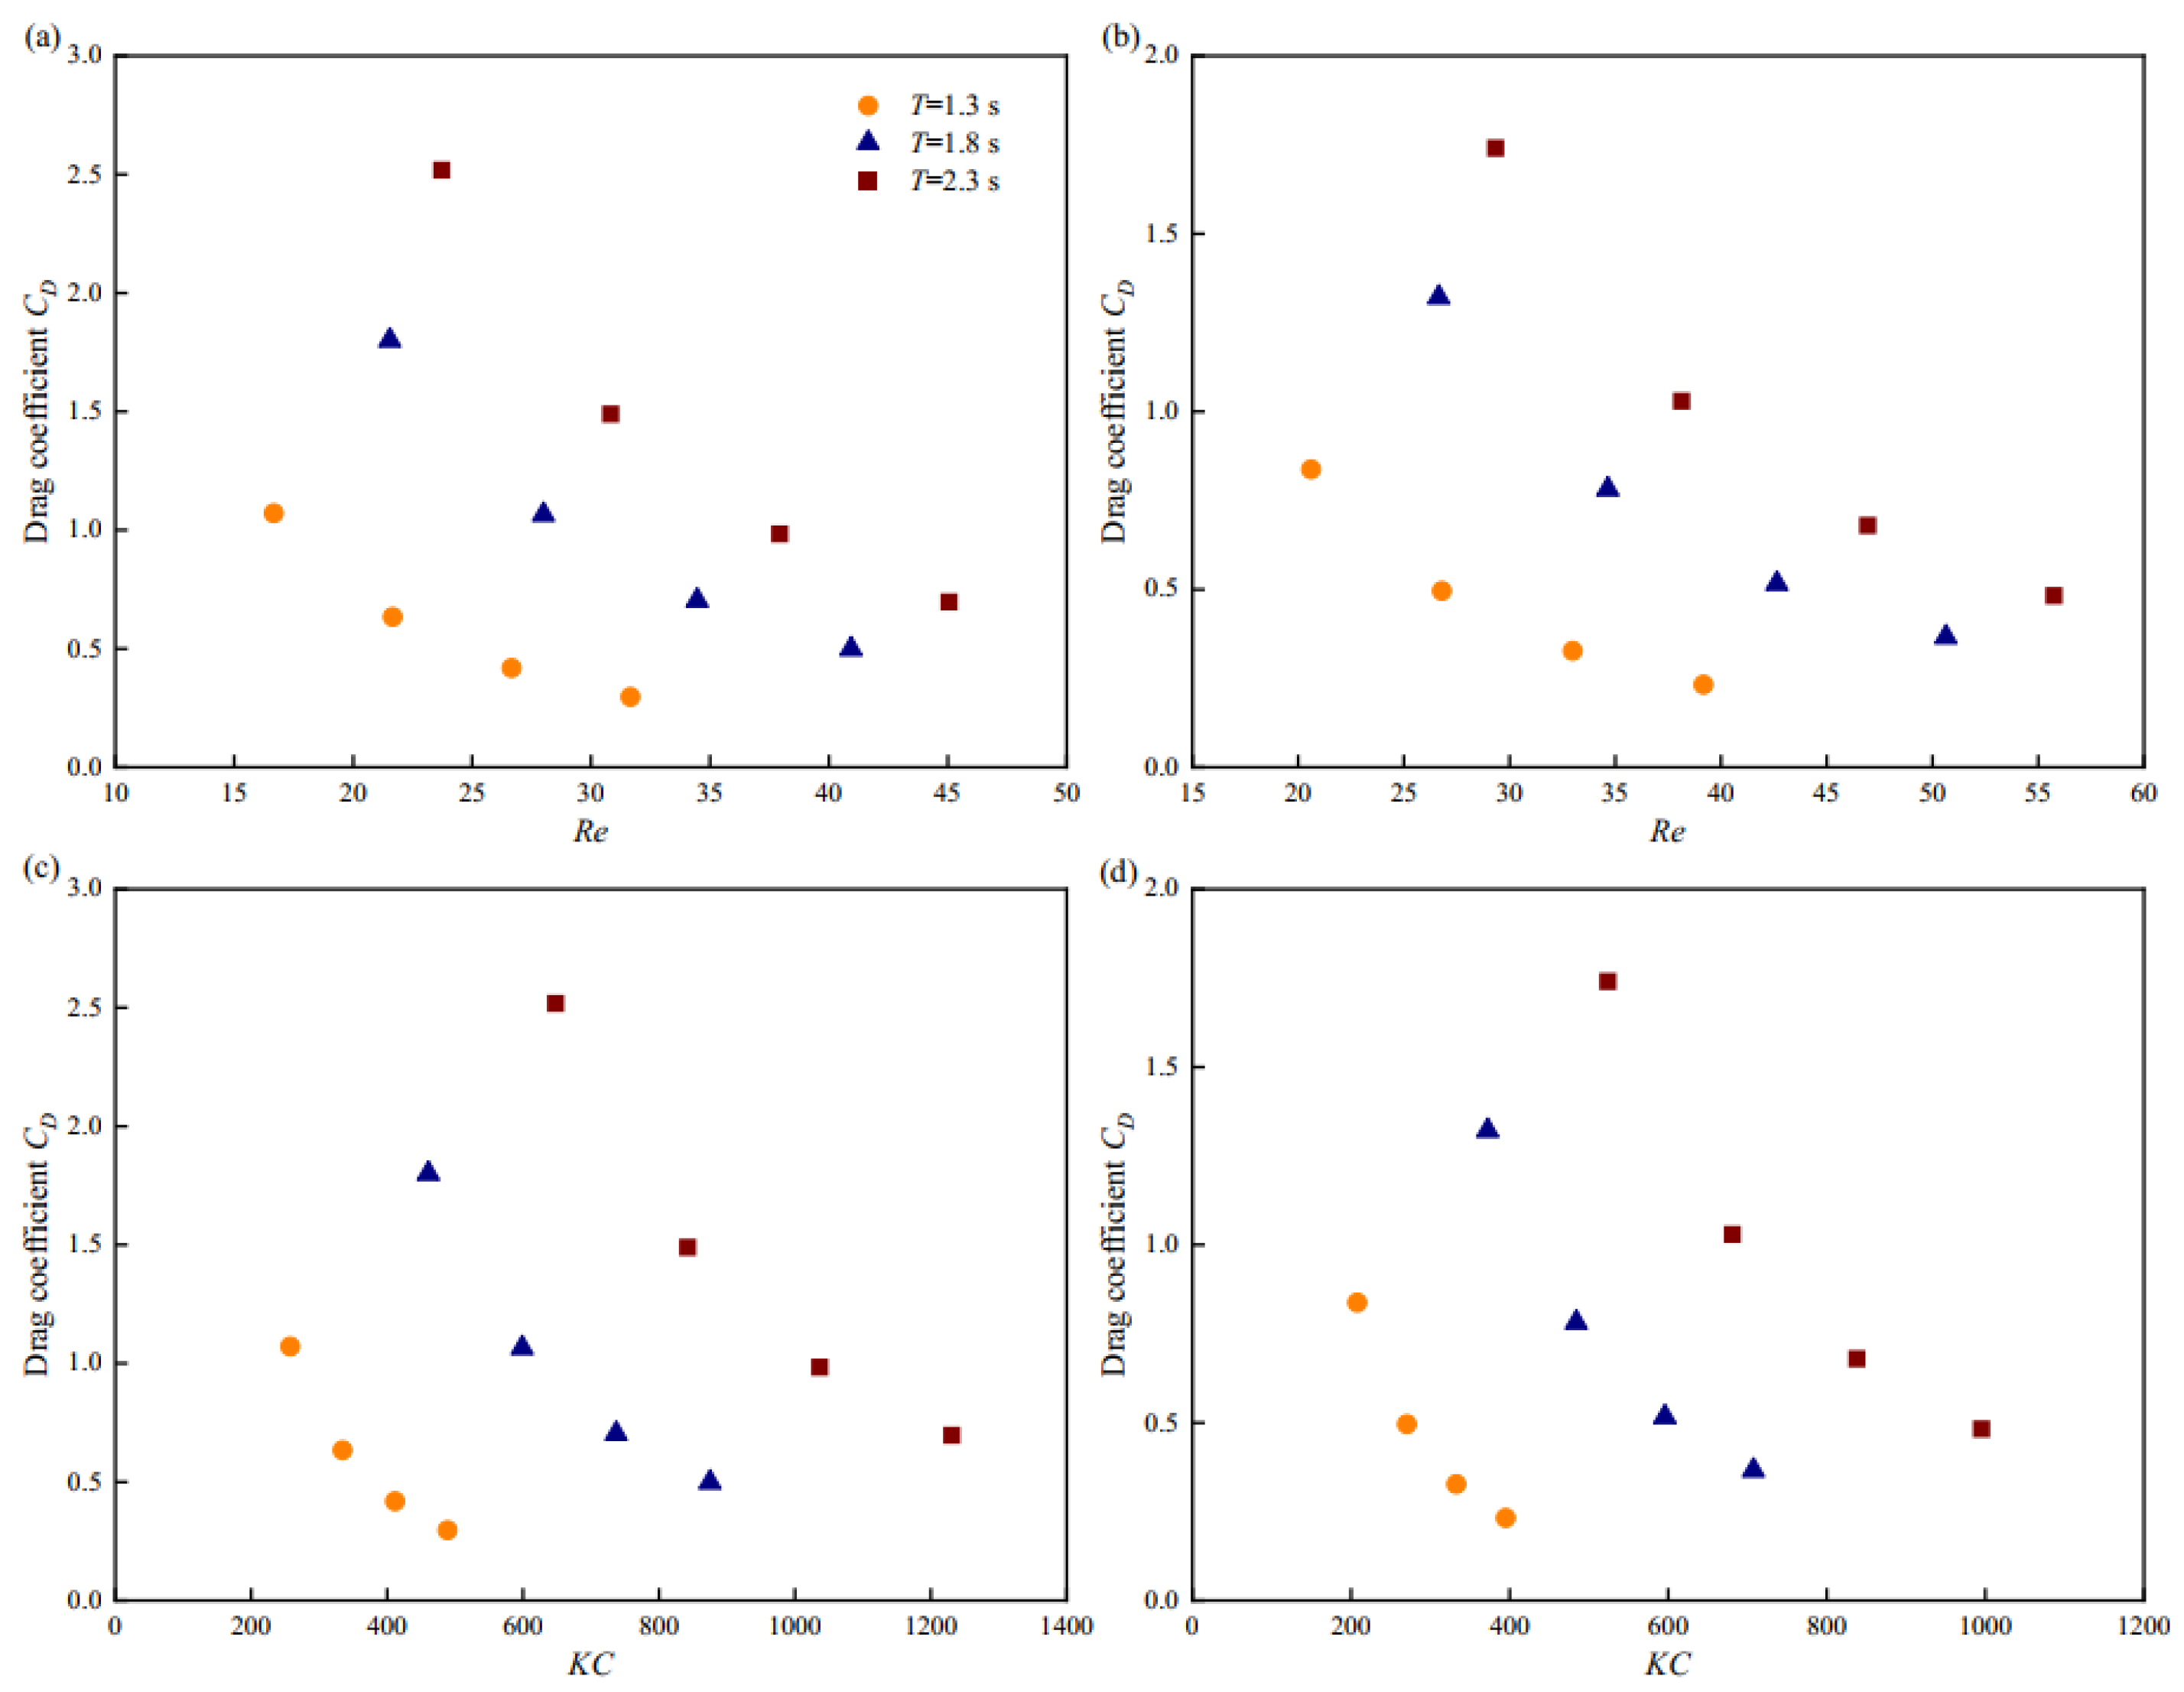
Figure 7 presents the drag coefficients of the fine-mesh nettings as a function of the Reynolds number and KC number under different wave conditions. The Reynolds number ranged from 16.66 to 55.73, while the KC number varied between 208.04 and 1230.92. For Net 1, the maximum drag coefficient of 2.52 was observed at a wave period of 2.3 s and a wave height of 0.1 m (Re = 23.71; KC = 647.85), while the minimum drag coefficient of 0.3 occurred at a wave period of 1.3 s and a wave height of 0.19 m (Re = 31.66; KC = 489). For Net 2, the maximum drag coefficient of 1.74 was recorded at a wave period of 2.3 s and a wave height of 0.1 m (Re = 29.33; KC = 523.68), and the minimum drag coefficient of 0.23 was measured at a wave period of 1.3 s and a wave height of 0.19 m (Re = 39.17; KC = 395.28). When the wave period was held constant, the drag coefficients for both nettings generally decreased with increasing Reynolds and KC numbers. Additionally, the drag coefficient of Net 1 was consistently higher than that of Net 2 under the same wave conditions.
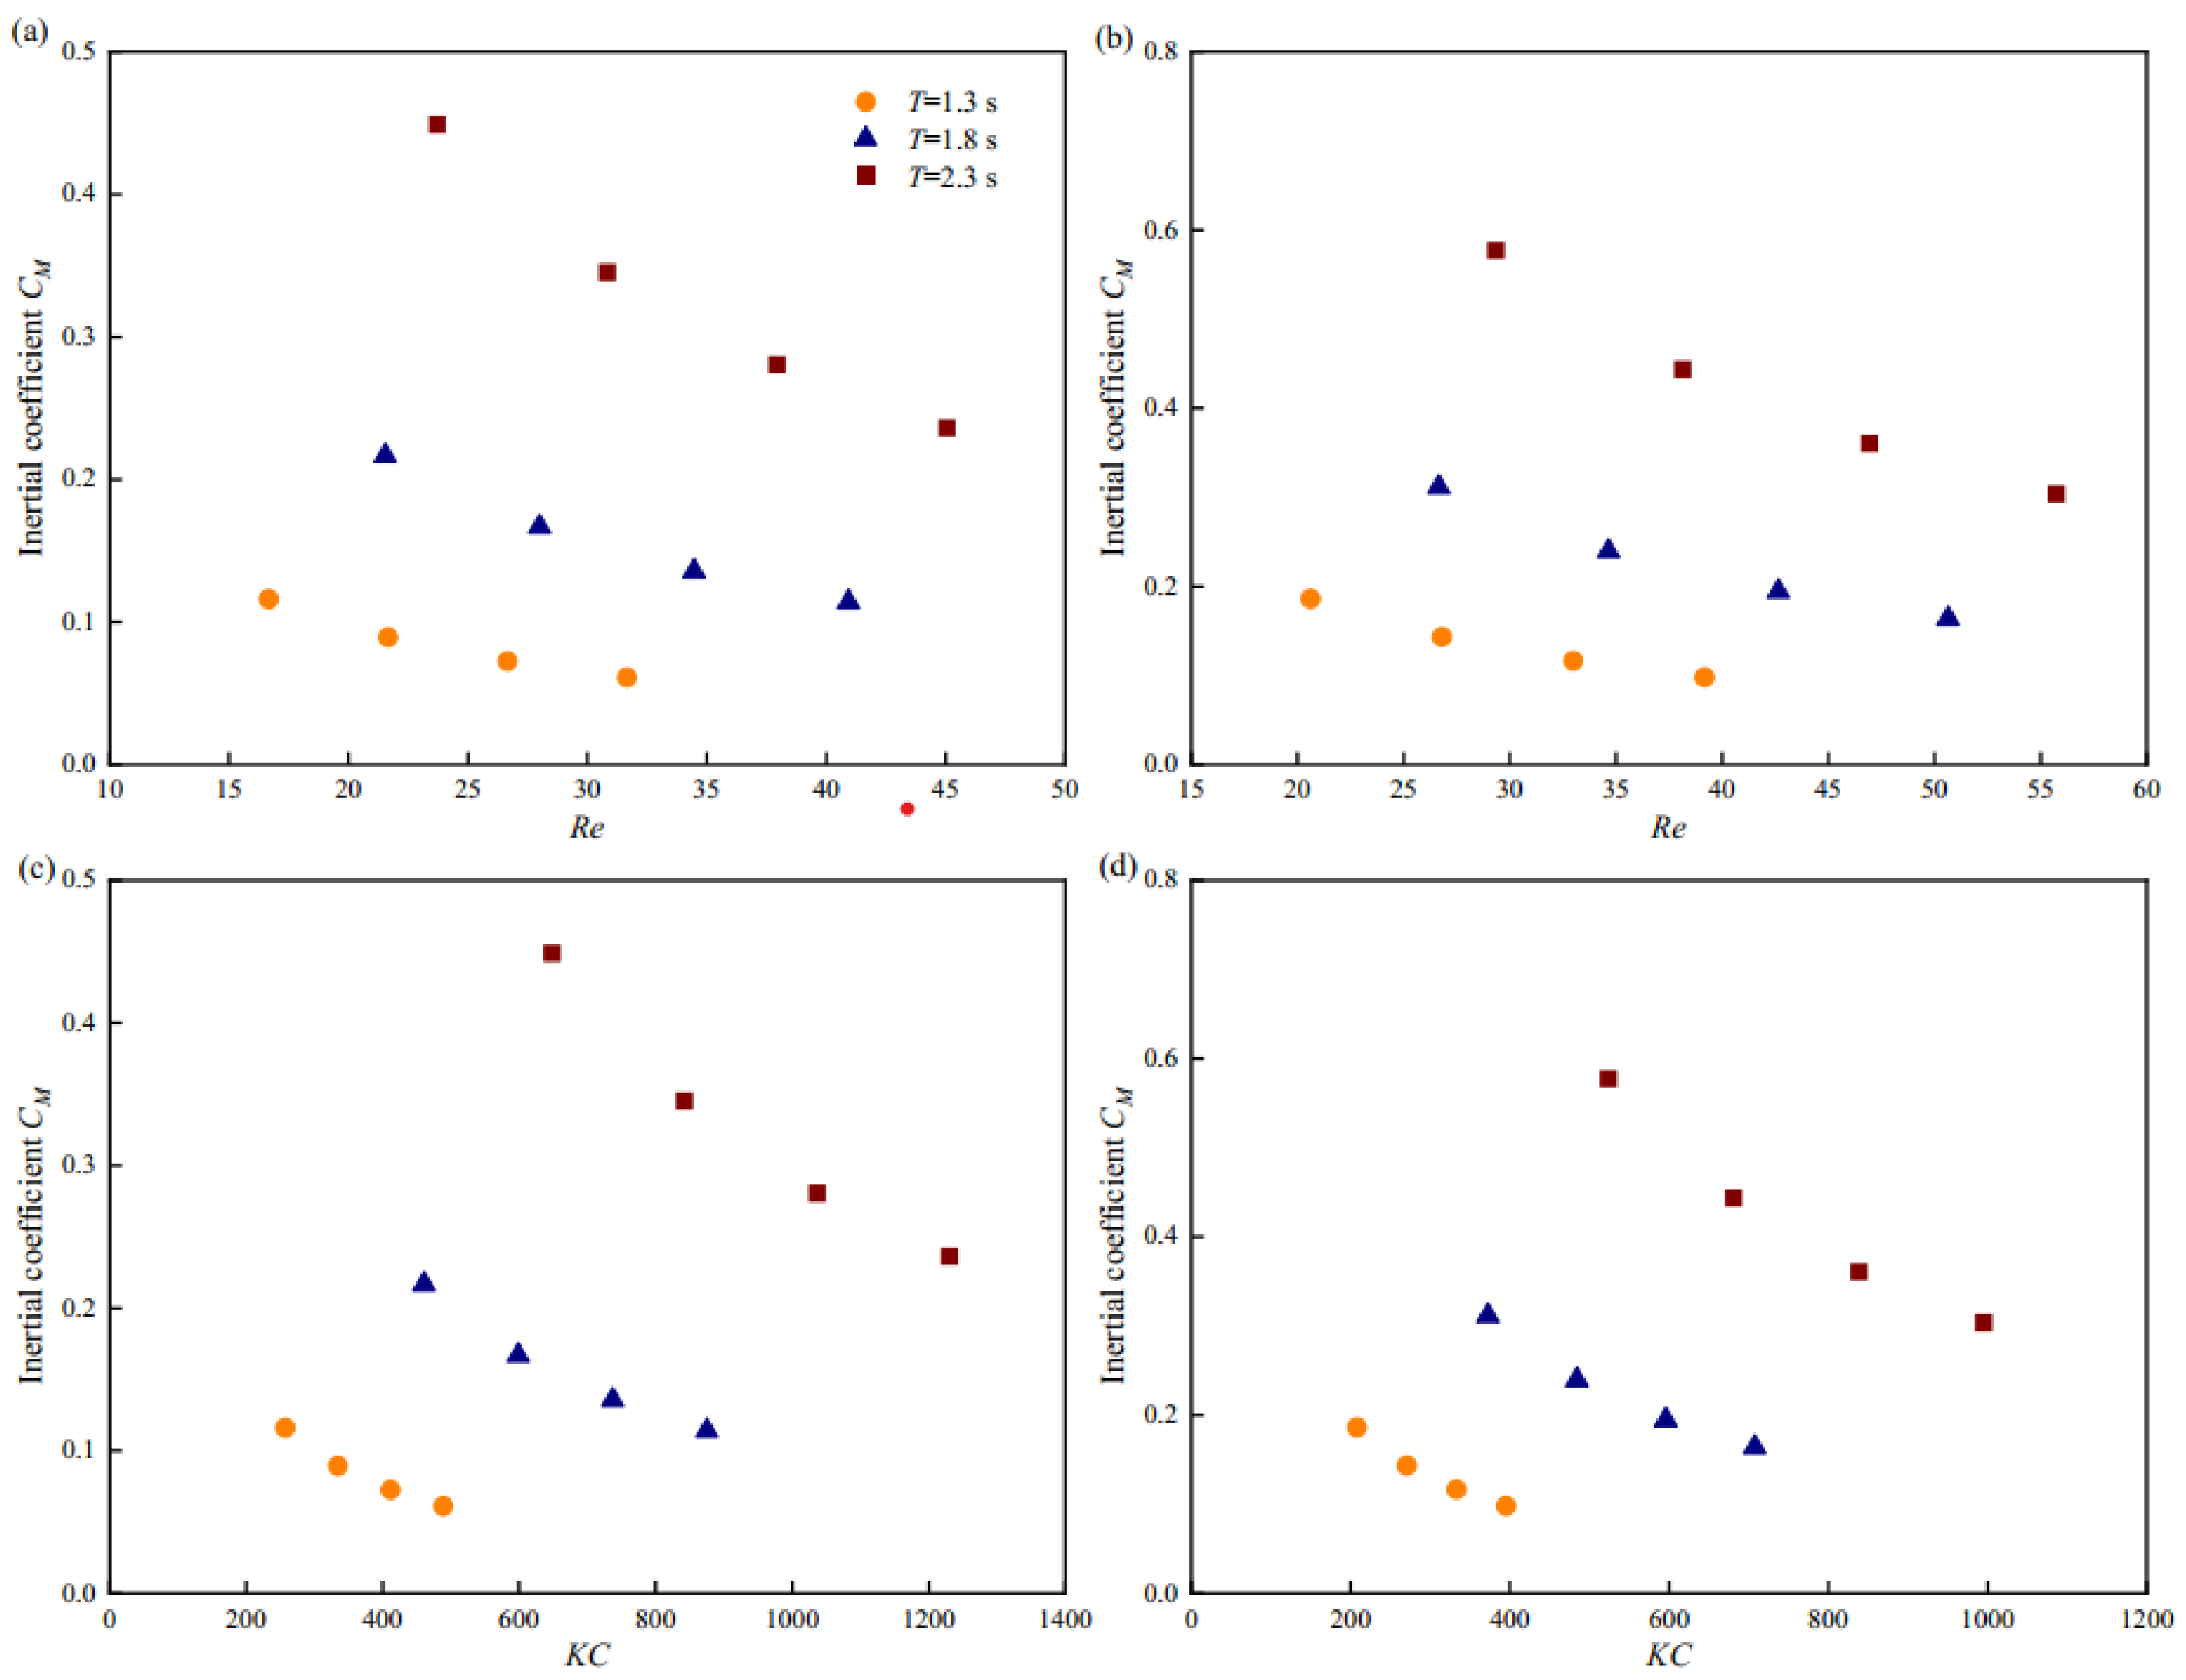
Figure 8 illustrates the inertial coefficients of the fine-mesh nettings as a function of the Reynolds and KC numbers in different wave conditions. The maximum inertial coefficient for Net 1 was 0.45 at a wave period of 2.3 s and a wave height of 0.1 m, while the minimum was 0.06 at a wave period of 1.3 s and a wave height of 0.19 m. For Net 2, the maximum inertial coefficient of 0.58 occurred at a wave period of 2.3 s and a wave height of 0.1 m, while the minimum value of 0.1 was observed at a wave period of 1.3 s and a wave height of 0.19 m. Similar to the drag coefficients, when the wave period was held constant, the inertial coefficients for both nettings generally decreased with increasing Reynolds and KC numbers. Furthermore, the inertial coefficient of Net 2 was higher than that of Net 1 under the same wave conditions.

3.3. Wave Attenuation Downstream of Fine-Mesh Nettings Under Different Wave Conditions

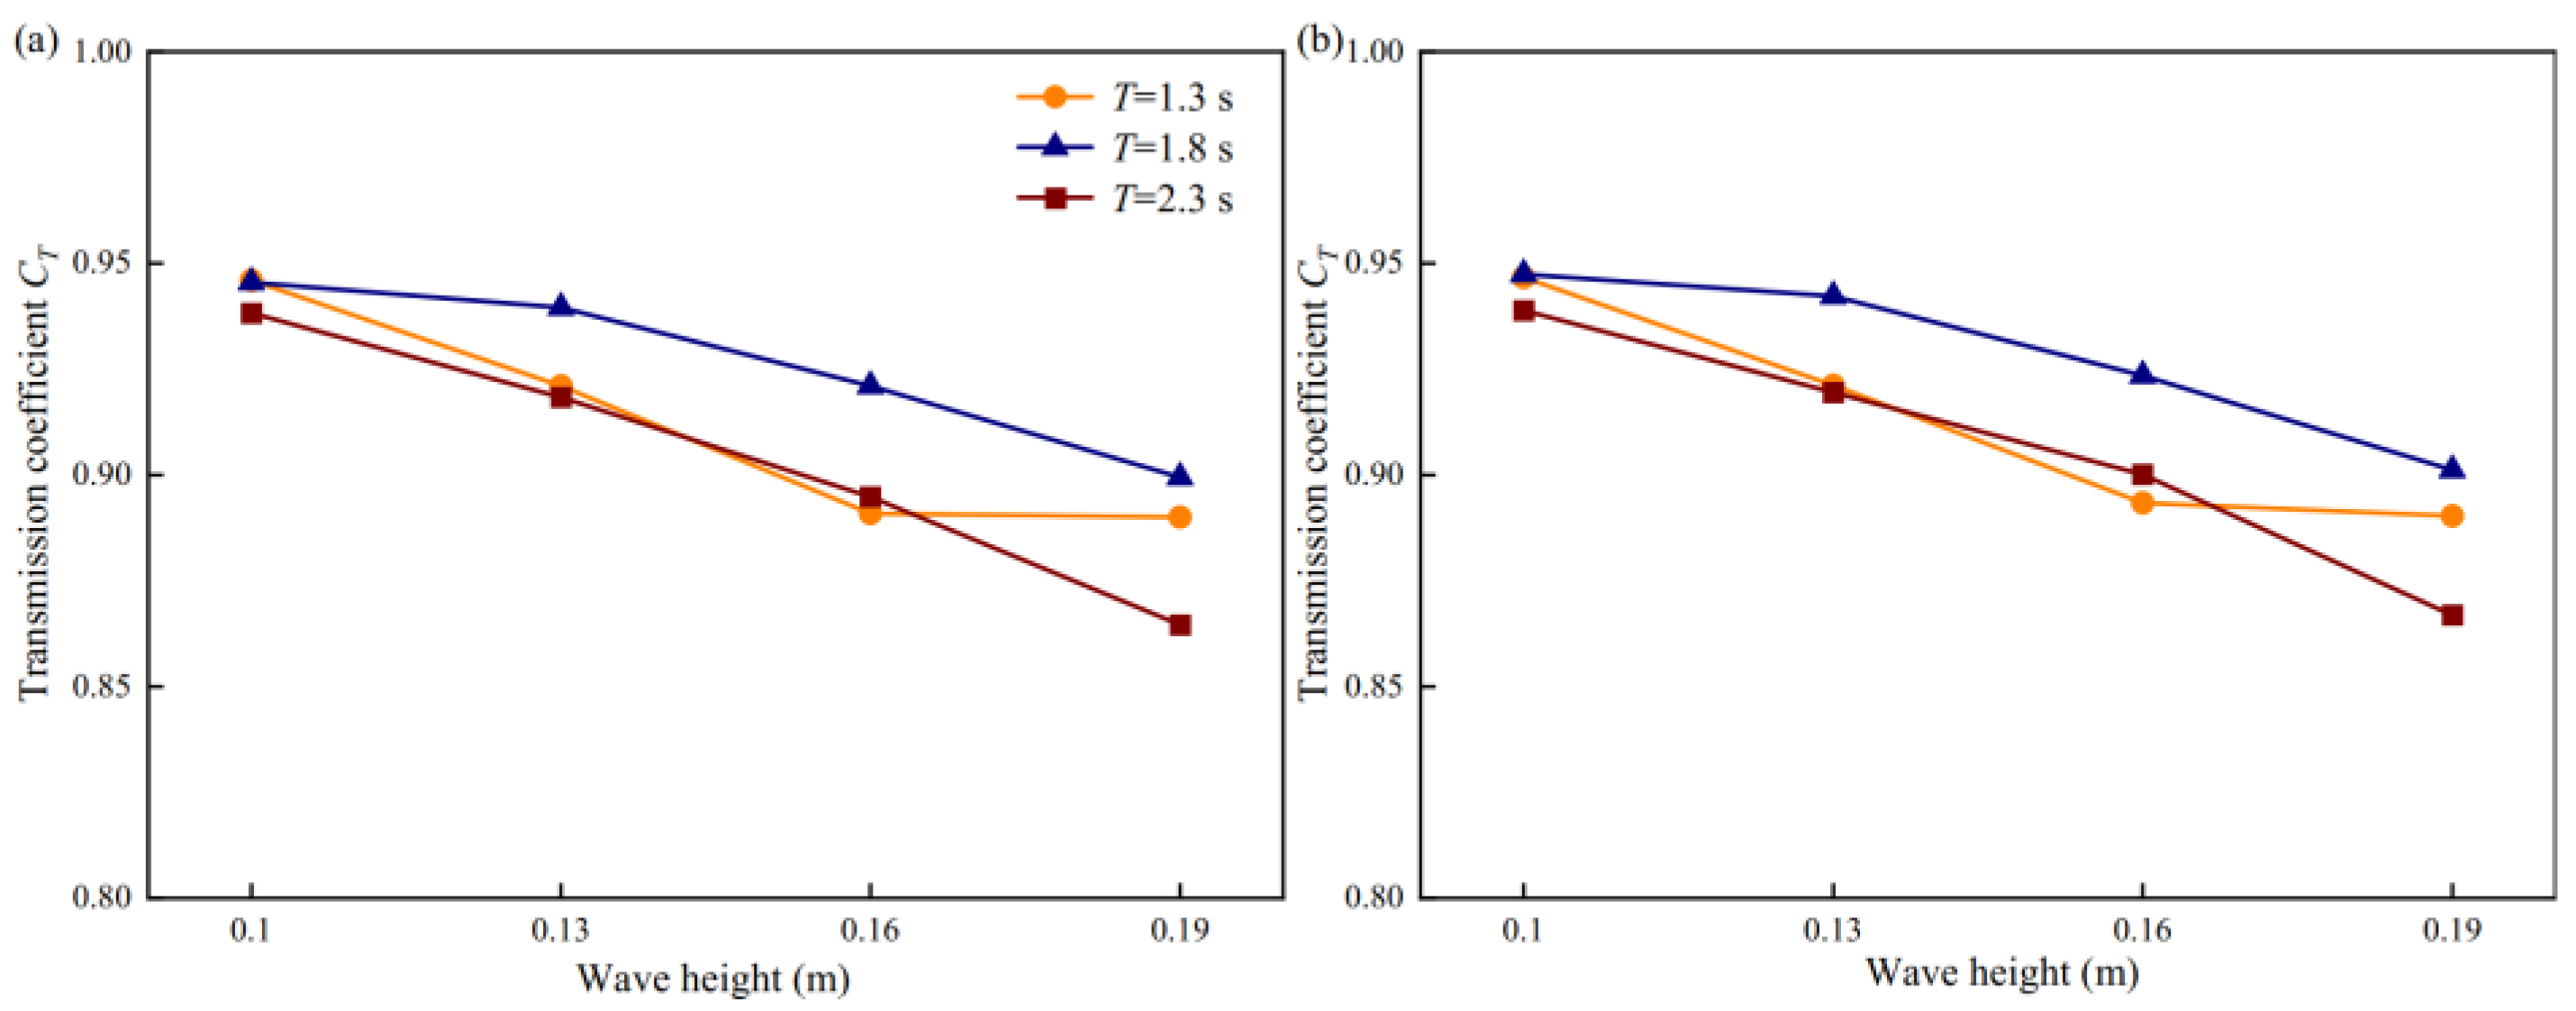
The wave transmission coefficients of the nettings under various wave conditions are presented in Figure 9 and Figure 10. Figure 9 illustrates the wave transmission coefficients of the nettings for different wave heights at various wave periods. The coefficients generally decreased as the wave height increased in the same wave period for all nettings. The maximum transmission coefficient for Net 1 was 0.946, observed at both a wave period of 1.3 s and 1.8 s and a wave height of 0.1 m. For Net 2, the maximum transmission coefficient was 0.947, observed at a wave period of 1.8 s and a wave height of 0.1 m. Figure 10 shows the transmission coefficients of the nettings for various wave periods at different wave heights. These coefficients initially increased and then decreased with the increasing wave period at the same wave height. Notably, the wave transmission coefficient for Net 2 was consistently higher than that of Net 1 under the same wave conditions.
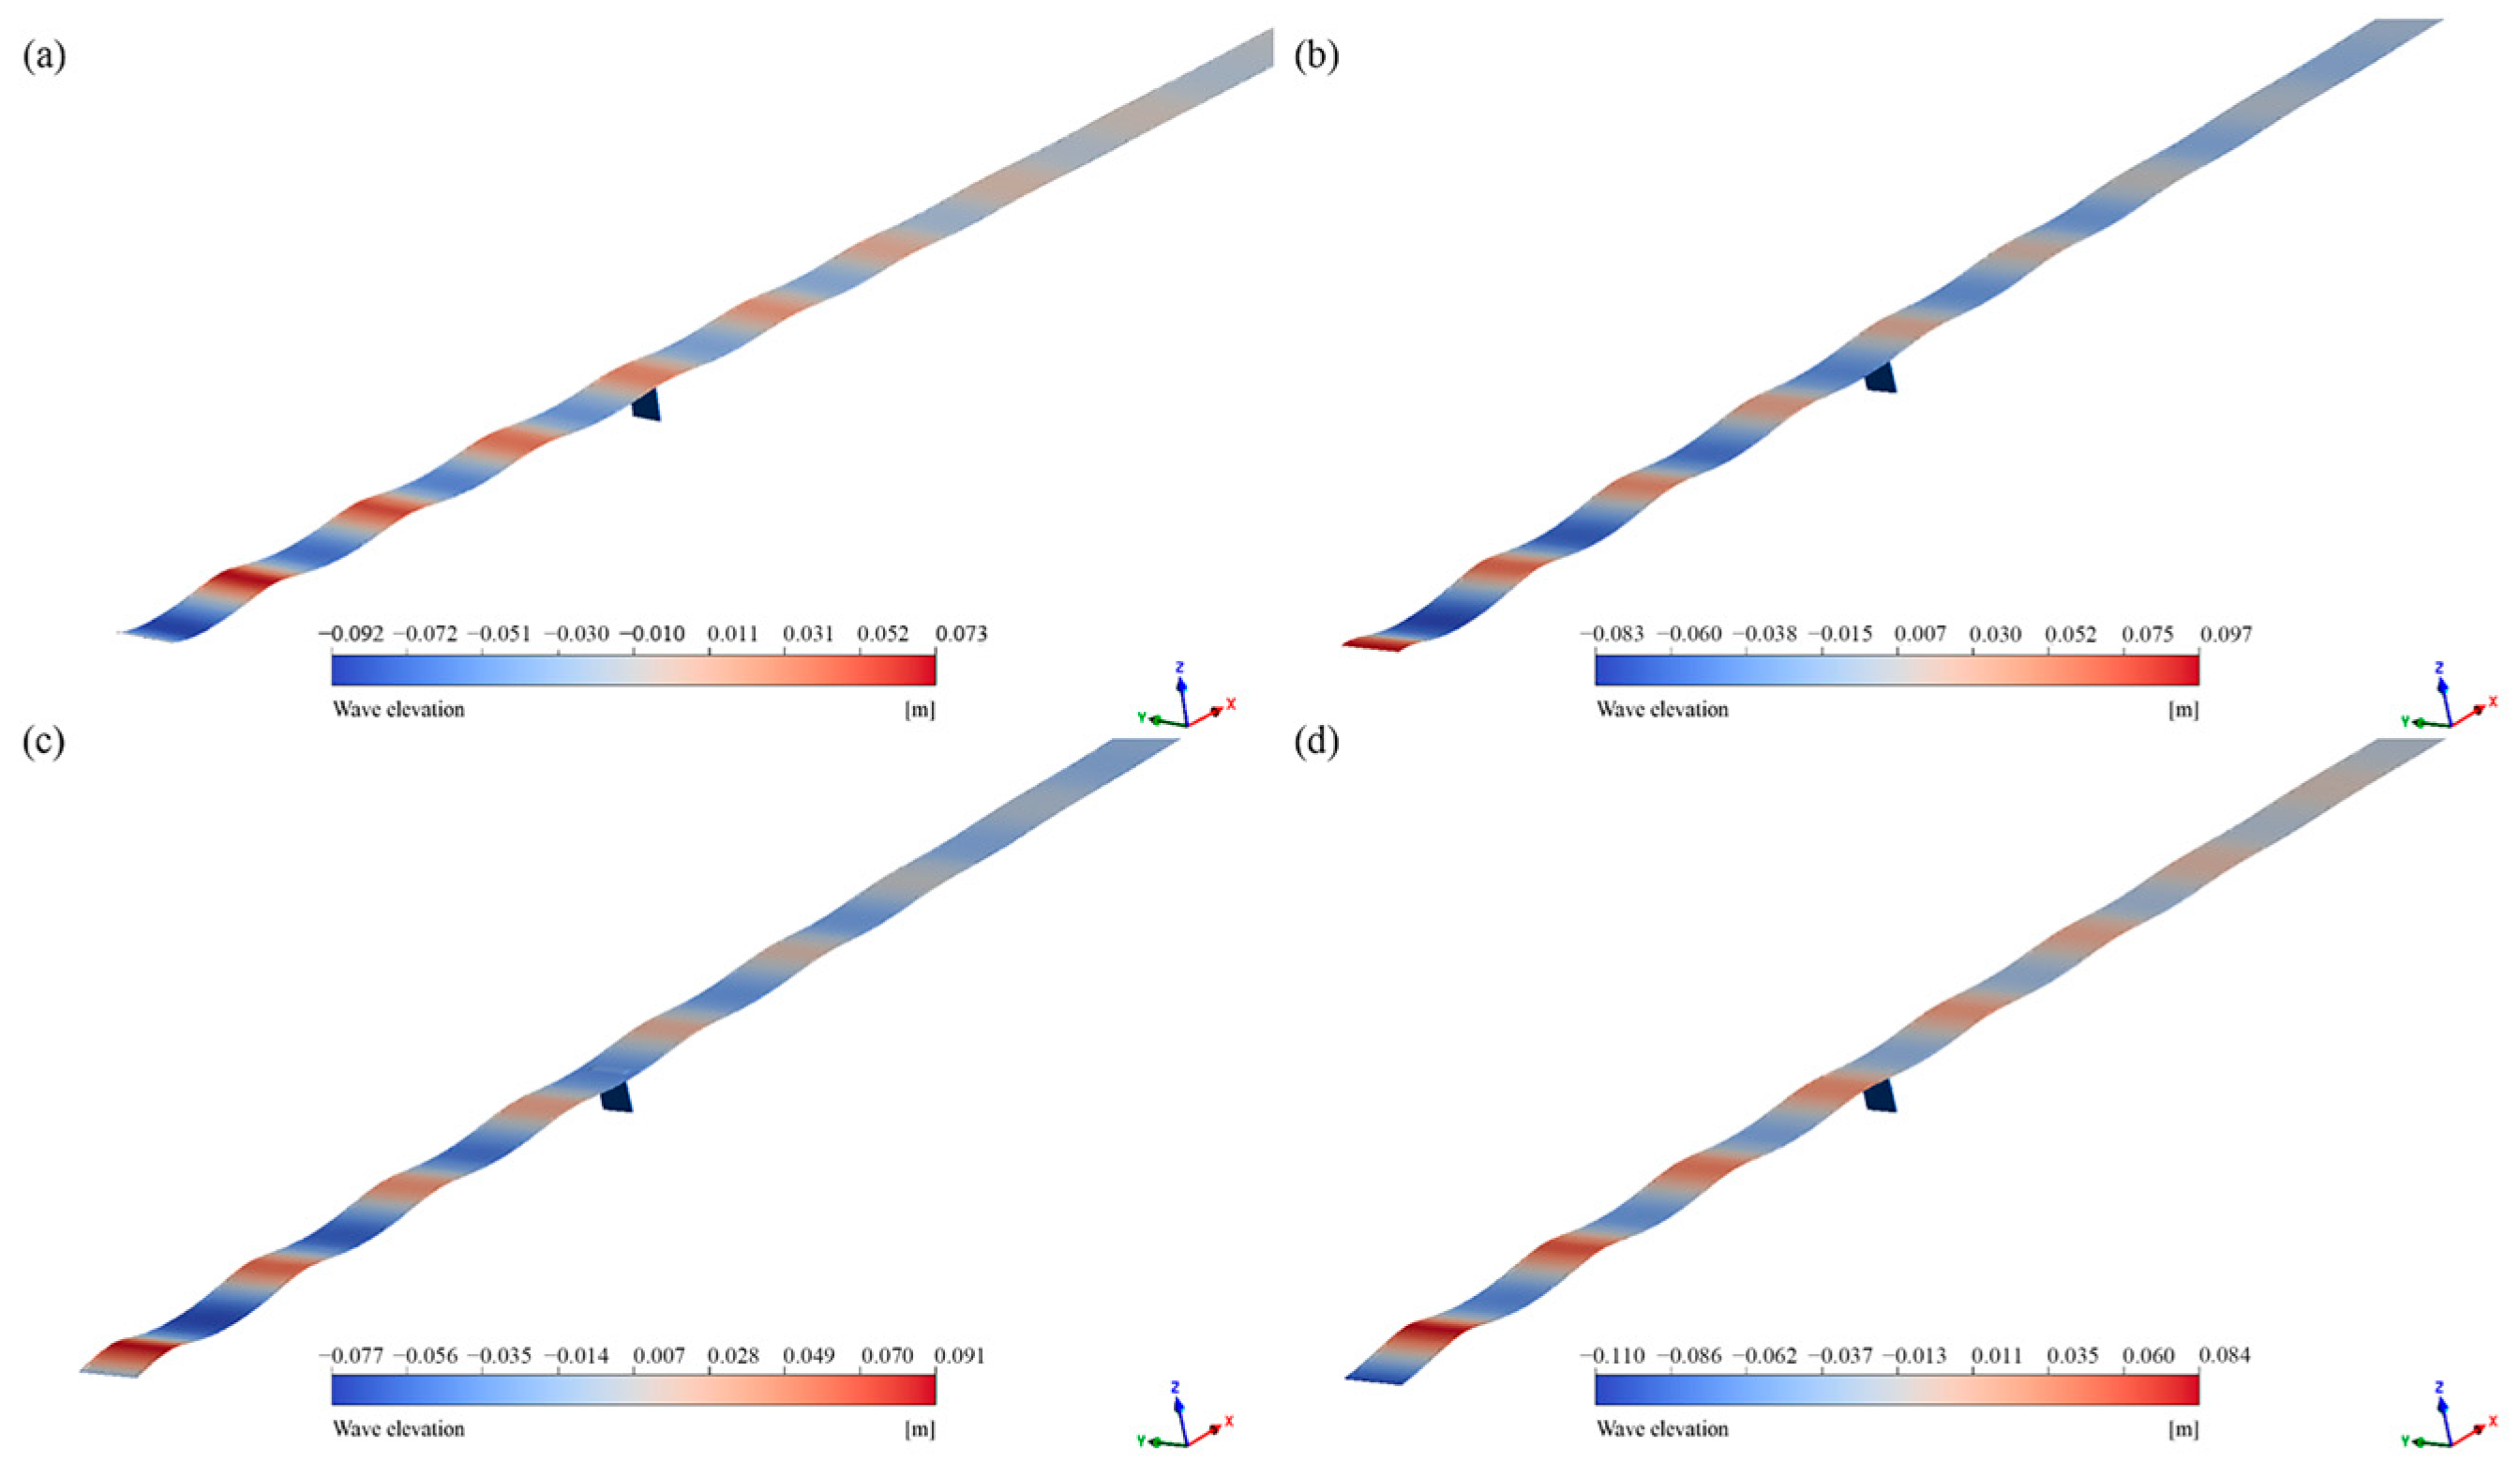
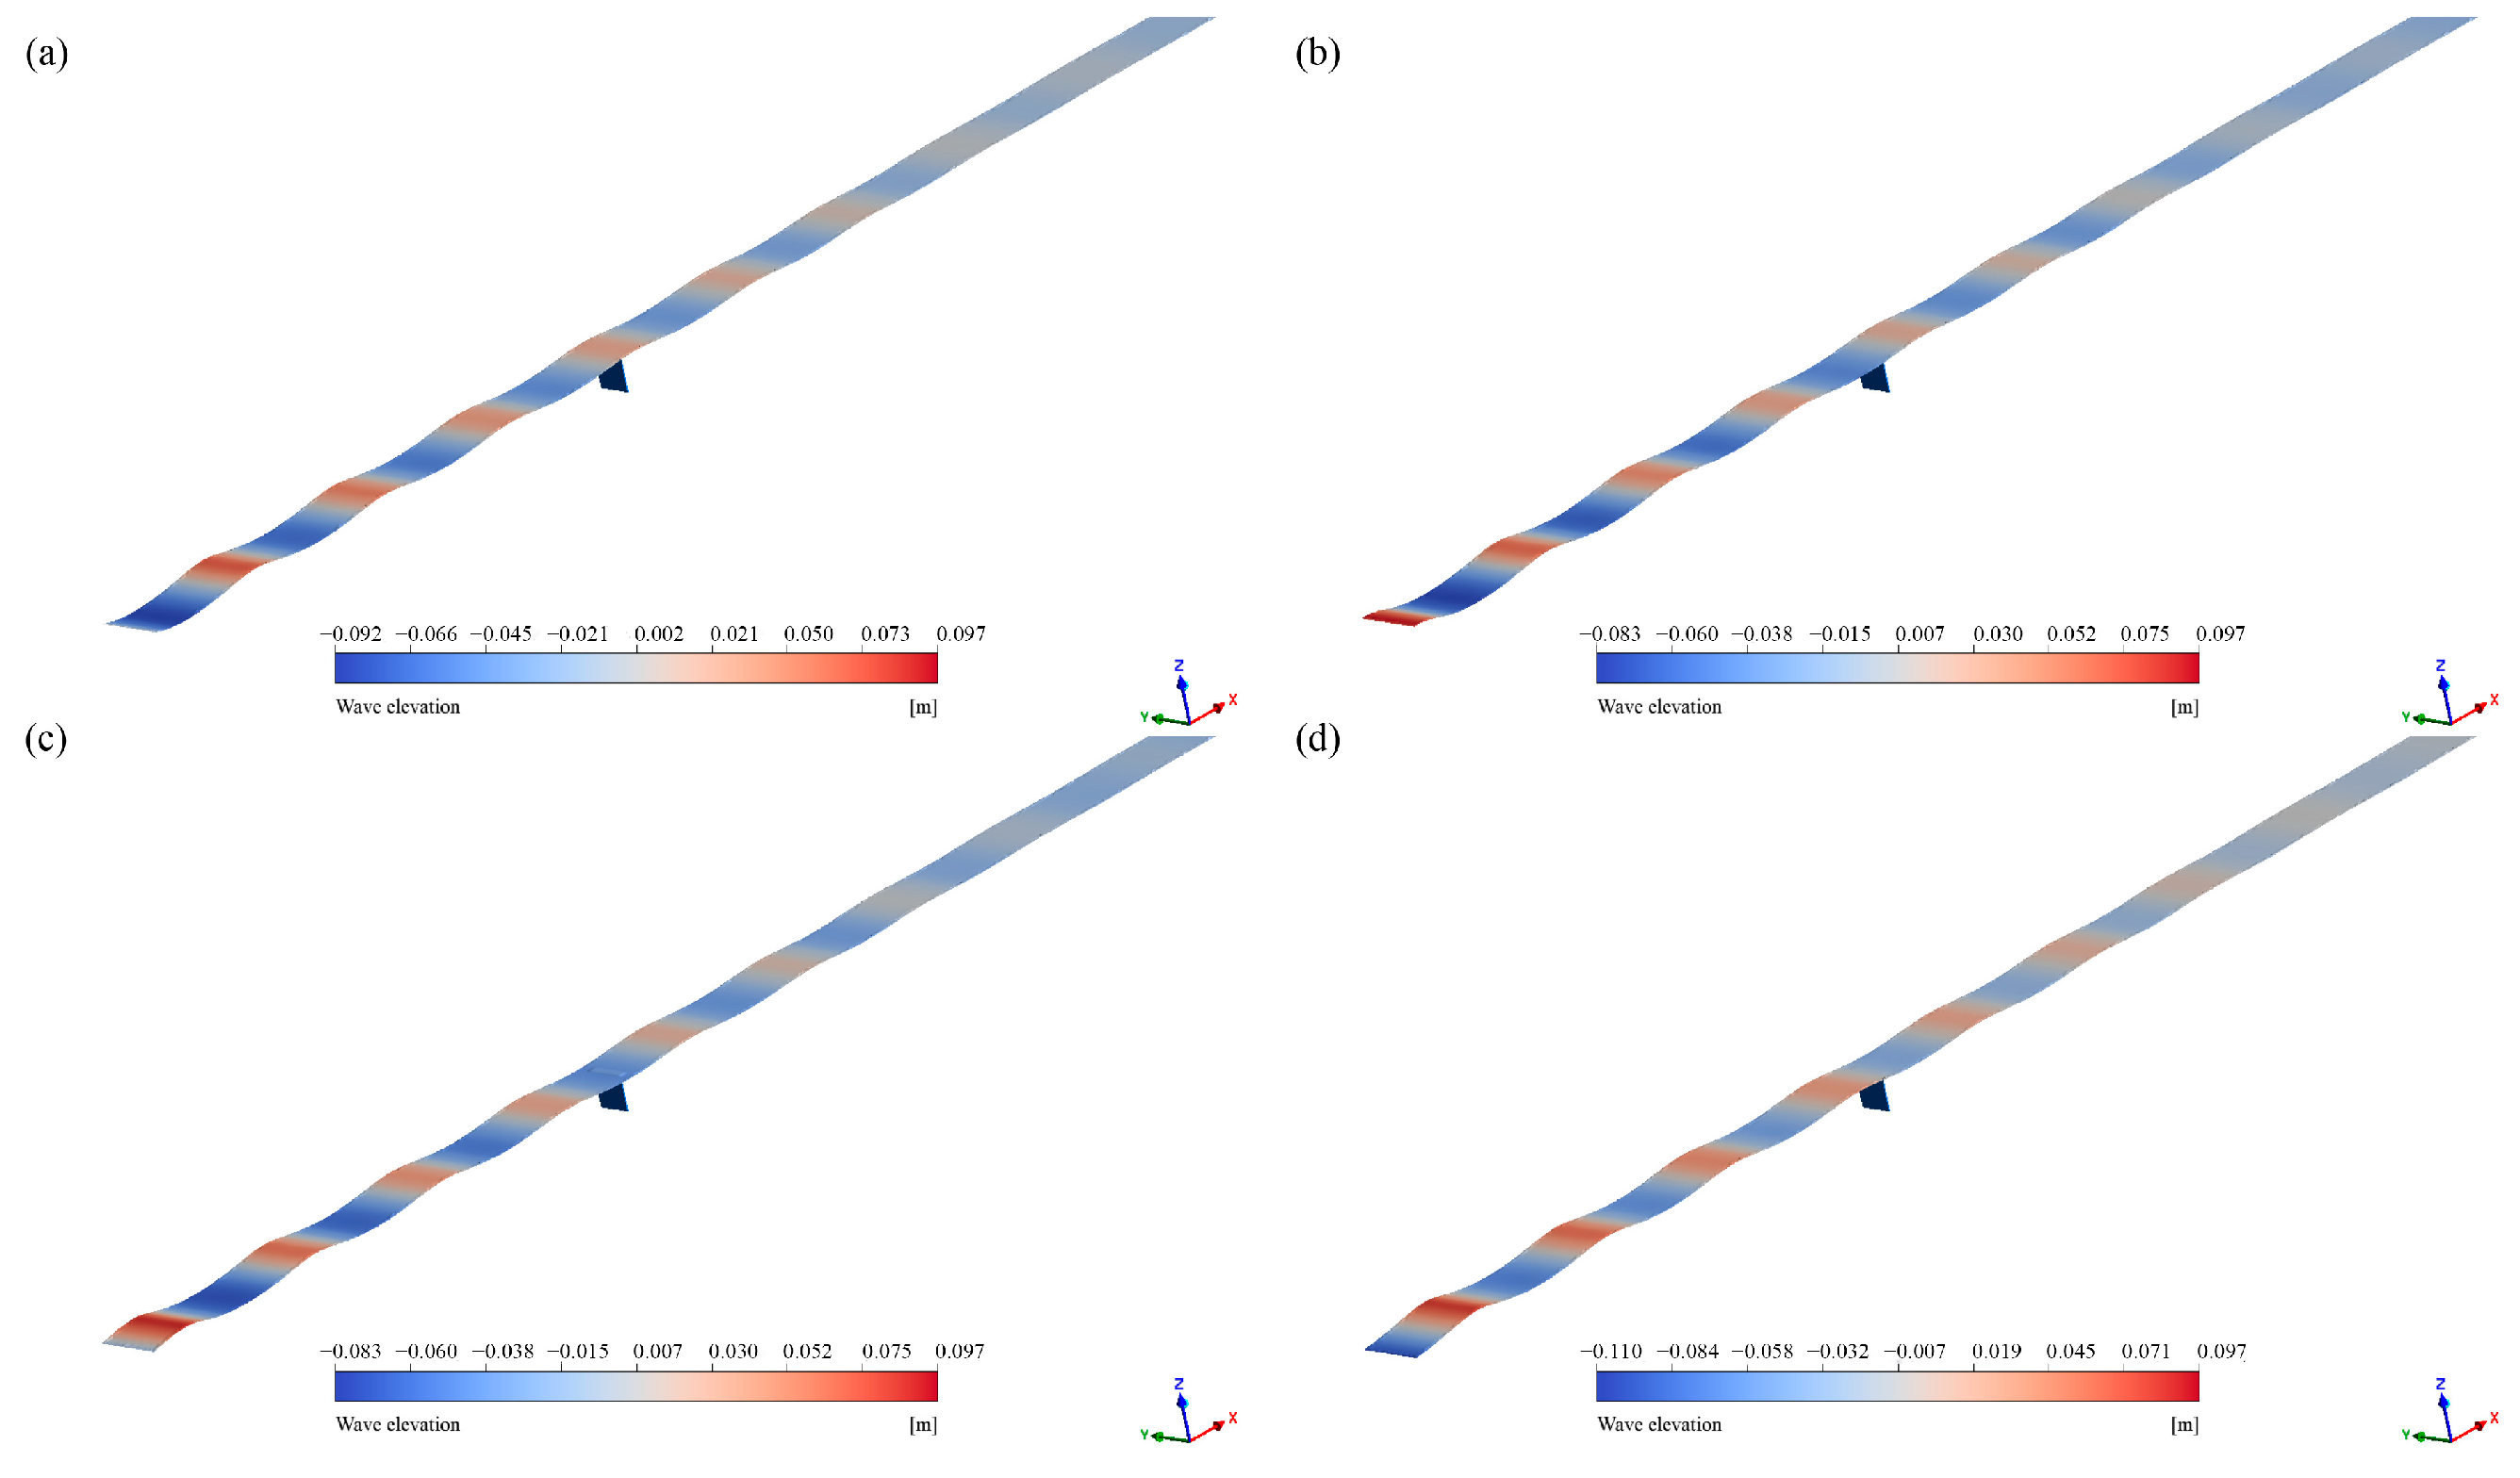
The wave elevation in the transient field for nettings at a wave period of 1.3 s and a wave height of 0.19 m at different phases is shown in Figure 11 and Figure 12 for Net 1 and Net 2, respectively. As waves propagate through the nettings, both the wave crest and trough diminish due to the damping effect of the nettings. The attenuation in the wave amplitude becomes more pronounced when the phase reaches 3T/4. Conversely, the attenuation is minimal at the phase of T/4. Furthermore, the downstream wave amplitude attenuation for Net 2 is smaller than that for Net 1, owing to its smaller solidity ratio. Overall, the wave fields upstream and downstream of the netting are significantly altered compared to those of an undisturbed wave field.

3.4. Water Particle Velocity Field Distribution of the Fine-Mesh Nettings

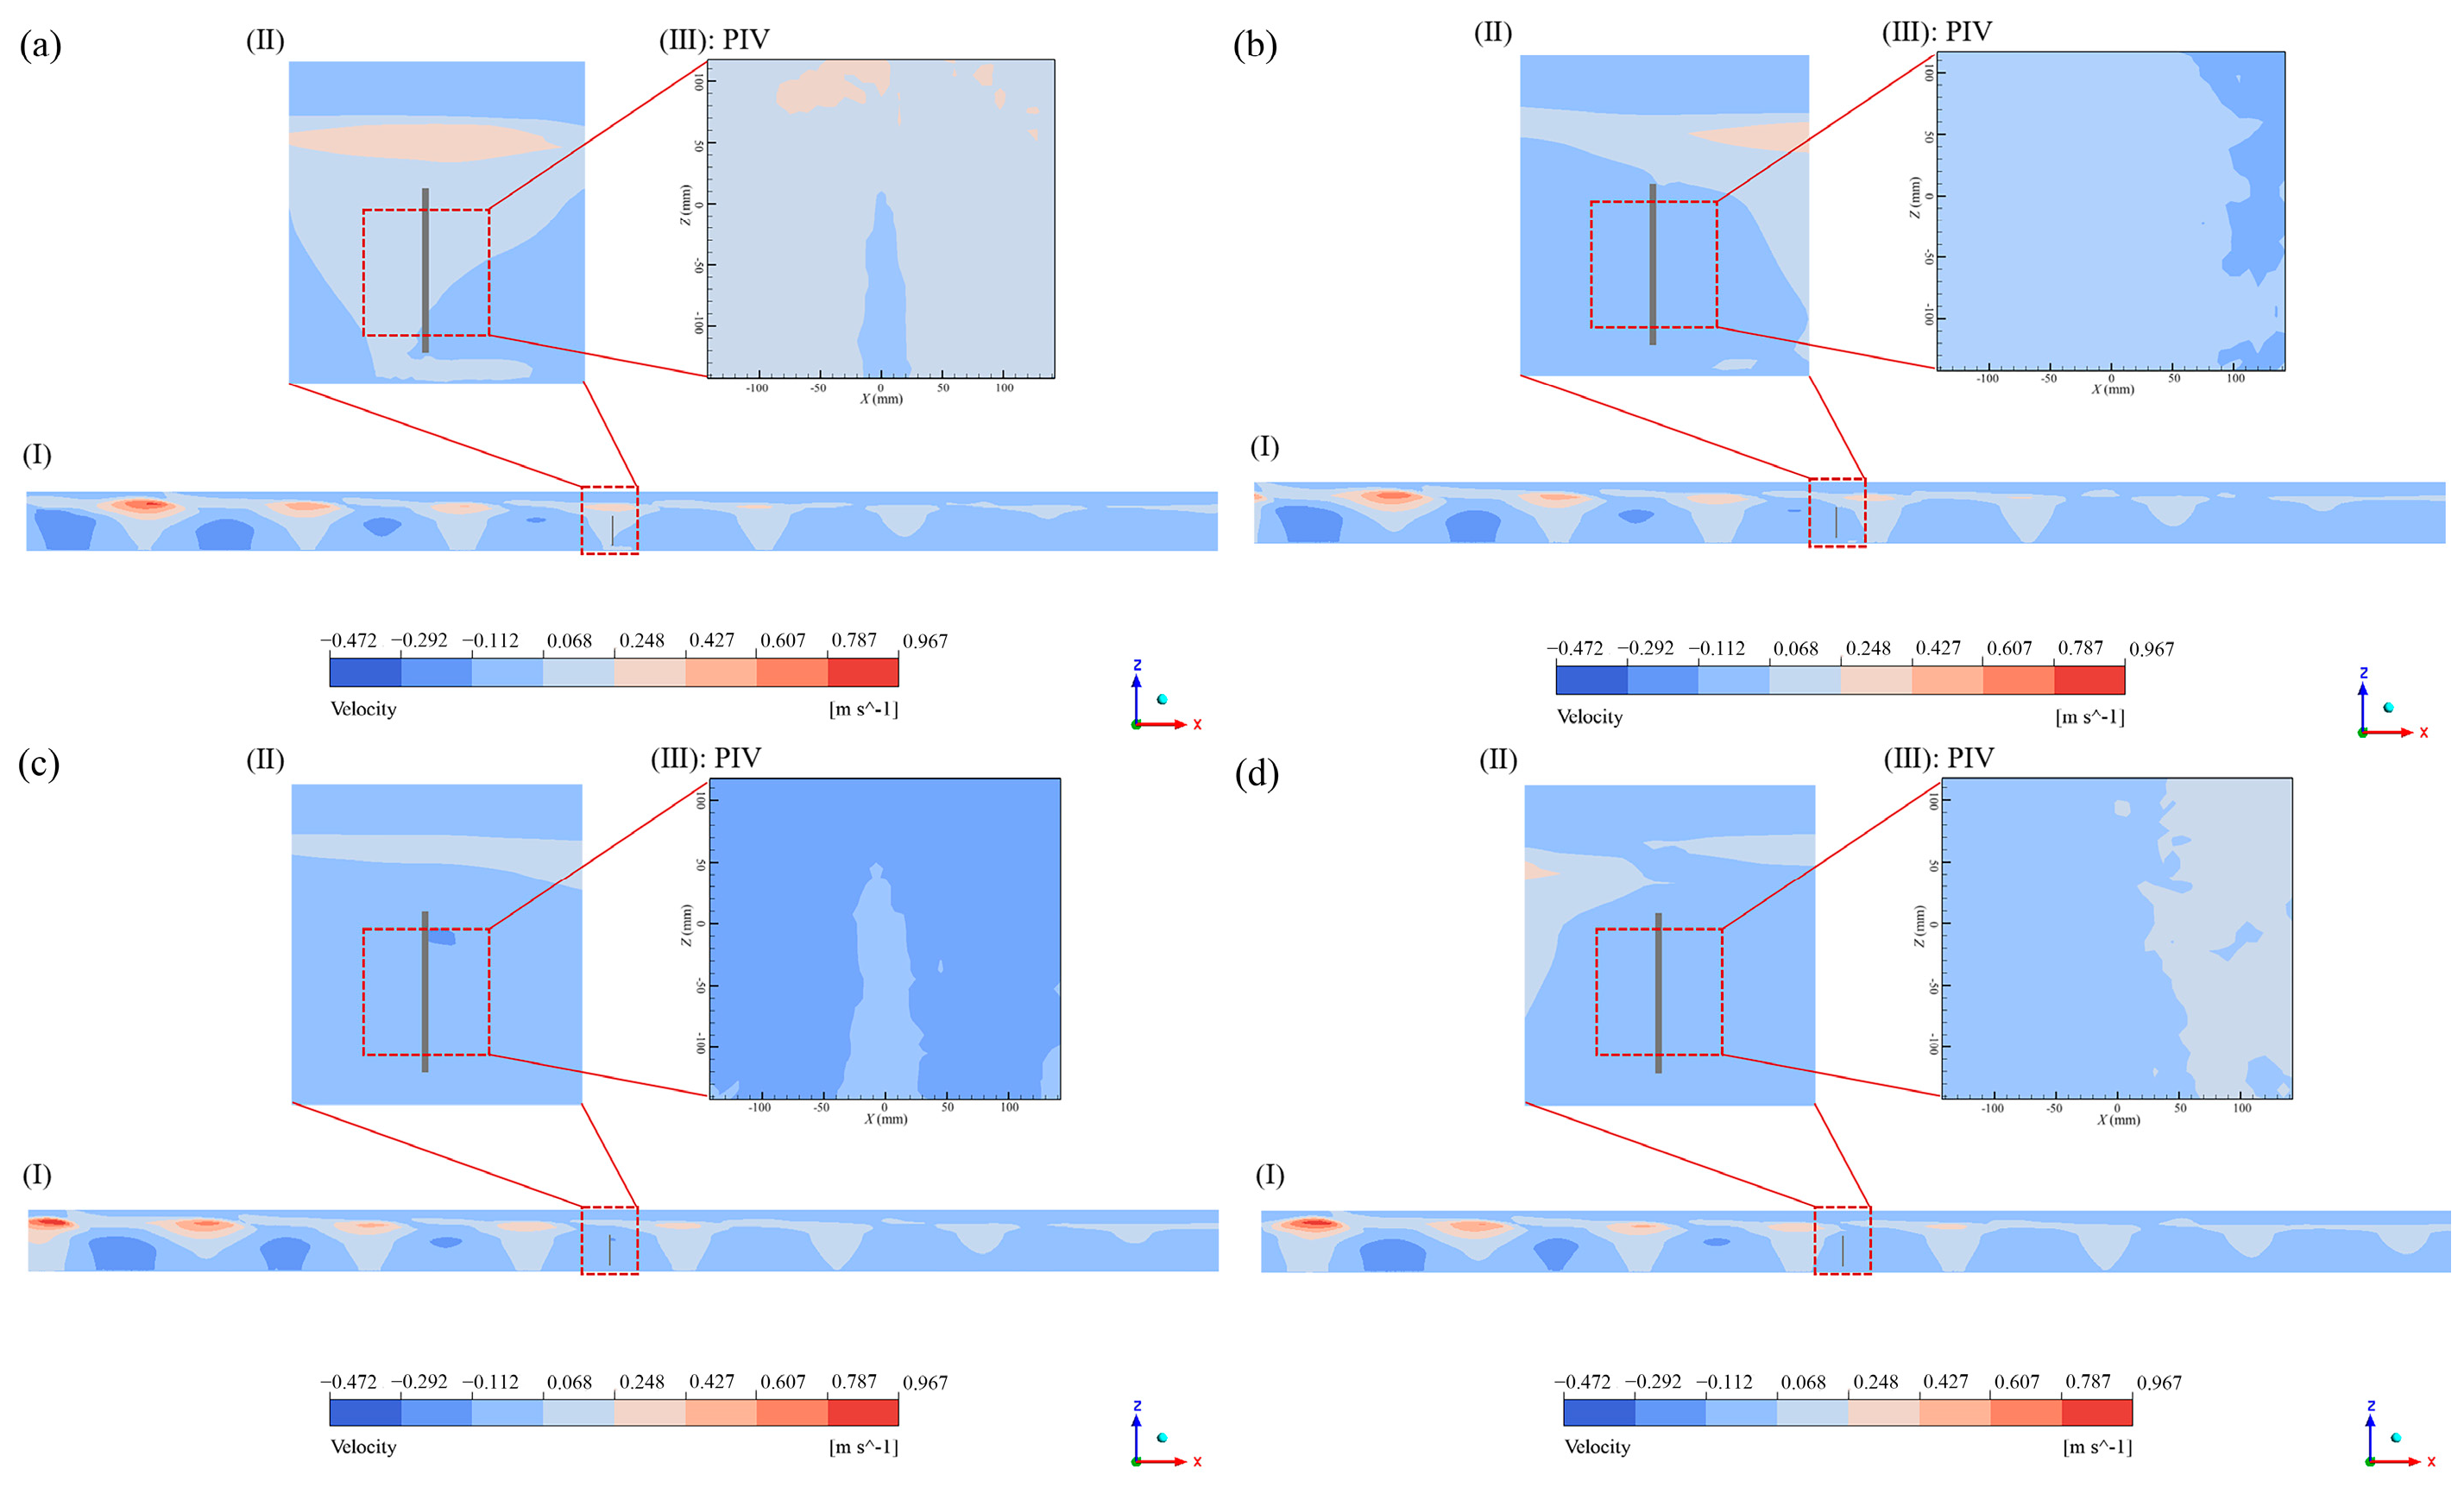
The distribution of the water particle velocity field around the nettings is shown in Figure 13 and Figure 14 for Net 1 and Net 2, respectively. The velocity field is presented as the water particle velocity distribution in the x axis direction in the xz plane, with the position of the netting located at x = 0 m, as measured by the PIV. The water particle velocity is significantly influenced by the presence of the nettings, with a noticeable decrease in velocity downstream of the nettings. This effect is most pronounced at both the wave crest and wave trough, compared to other phases. Specifically, the water particle velocity around the nettings is greater at the wave phase of T/4 (wave crest) than at other wave phases, and it reaches its minimum at the wave phase of 3T/4 (wave trough). The water particle velocity around Net 2 is higher than that around Net 1 at both wave phases. Overall, the simulation results of the water particle velocity field distribution are in good agreement with the PIV measurement results.

4. Discussion

The hydrodynamic performance of fine-mesh netting under various linear wave conditions was investigated through a combination of wave tank experiments and numerical simulations. In the wave environment, the horizontal force acting on the netting was significantly greater than the vertical force, consistent with previous studies suggesting that vertical forces may be neglected [24,28,29]. Therefore, only the horizontal forces exerted on the fine-mesh netting were considered in this study. The overall trend of the experimental data for horizontal force was found to be in good agreement with the simulation results (See Figure 6). Small discrepancies in the peak values and phase of the wave force can be attributed to the fact that the netting was fixed with bridle lines during the wave tank experiments. This setup allowed for slight oscillations of the netting under wave actions, which were not accounted for in the numerical simulations. In this study, the drag coefficient of both fine-mesh nettings generally decreased with an increasing Reynolds number and KC number, which is consistent with findings from previous studies [26,28,29,32]. However, the variation of the inertia coefficient contrasts with previous studies. In our results, the inertia coefficient decreased as both the Reynolds number and KC number increased (see Figure 8). Liu et al. reported a slight decrease in the inertia coefficient with an increasing Reynolds number and KC number, but the trend was less pronounced [26]. Similarly, Bi et al. found no clear relationship between the inertia coefficient and either the Reynolds number or KC number when studying biofouled netting [28]. Conversely, Dong et al. observed an increase in the inertia coefficient with rising KC numbers [29]. These discrepancies may be attributed to differences in the netting materials and solidity ratios. In contrast to previous studies that used standard mesh-sized netting, the netting in this study had varying solidity ratios, which could affect the inertia coefficient. Additionally, the inertia coefficient was found to be much smaller than the drag coefficient, consistent with the findings of Zhao et al. [25]. This disparity is likely due to the relatively small twine diameter compared to the wave height, rendering drag the dominant force in wave–netting interactions and diminishing the contribution of inertial effects. Notably, the drag coefficient for Net 1 was higher than that for Net 2 (see Figure 7), consistent with previous observations that associate higher drag coefficients with increased solidity ratios [29]. In this study, the hydrodynamic coefficients were validated under regular wave conditions. However, in the more complex conditions of open-sea environments, the nonlinear wave–structure interactions, flow unsteadiness, and dynamic deformation of the netting may lead to deviations from the simplified flow assumptions underlying the porous media approach [31,37,39]. These factors can alter the effective resistance experienced by the netting. Therefore, further research incorporating irregular wave conditions and fully coupled fluid–structure interaction models is recommended to enhance the applicability of the present hydrodynamic coefficients to realistic ocean environments.
Wave attenuation through fine-mesh netting was investigated using a numerical model that combines the porous media model with a numerical wave tank. The results demonstrate a significant damping effect of fine-mesh netting on wave propagation (see Figure 9 and Figure 10). Wave transmission coefficients decrease with the increasing wave height at a constant wave period, and nettings with a higher solidity ratio exhibit more pronounced wave attenuation. These findings align with previous studies [23,27,33,38]. This behavior can be attributed to the increase in the water particle velocity with the rising wave height, which leads to higher wave forces at a constant wave period. The increased wave force results in a stronger interaction between the wave and the netting, thereby enhancing the wave attenuation effect. However, the wave transmission coefficients initially increase and then decrease with the increasing wave period for fine-mesh nettings at the same wave height (See Figure 10). Zhao et al. found that wave transmission coefficients increase with longer wave periods [38], while Bi et al. reported that, for a single net cage, transmission coefficients increase initially and then decrease with the wave period [27]. In contrast, for multiple net cages, the transmission coefficients continue to increase with the wave period. Bi et al. observed no significant statistical difference in the wave transmission coefficients for three similar wave periods [33]. These discrepancies may stem from the relatively large wave periods considered in this study (all greater than 1 s), where waves do not pass directly through the center of the netting. As a result, the damping effect is more pronounced when the wave trough interacts with the netting during wave propagation, particularly at higher wave periods. Additionally, the wave transmission coefficient is strongly influenced by the attack angle of the netting [38]. Future studies could further investigate the damping effects of varying attack angles under different wave conditions.
Developing a numerical model of the netting is crucial for accurately simulating its hydrodynamic behavior under wave conditions. In this study, the small mesh size of the fine-mesh netting would require an extremely high number of computational elements, resulting in impractically long simulation times. To overcome this limitation, a porous media approach was adopted to represent the fine-mesh netting. The porous resistance coefficients were determined by fitting the experimental wave force data obtained from wave tank tests. The simulated wave forces, based on these fitted coefficients, showed good agreement with the experimental measurements (see Figure 6). Previous studies have employed various numerical models to investigate the hydrodynamic performance of nettings in waves, including the porous media model [27,33,38,39] and lumped mass models [25,32,37]. Each of these models has its advantages and limitations. For instance, the porous media model offers computational efficiency and is effective in capturing the overall resistance and flow characteristics through net panels [25,27,33]. However, it does not resolve the detailed geometry of individual twines and, therefore, cannot capture the localized tension, relative velocity, or oscillation between individual twines [37,39]. This simplification affects the interpretation of the flow energy distribution by smoothing out small-scale vortical structures, turbulence near twine surfaces, and wake interactions. As a result, localized flow features such as acceleration, separation, and energy dissipation in the near-net region are not explicitly captured. To address this, one-way or two-way fluid–structure interaction methods have been widely applied to analyze the interaction between fluid and netting in waves [37]. However, simulating fine-mesh netting presents challenges for traditional CFD methods due to the complexity of modeling, resulting in substantial computational costs. The mesh grouping method presents an effective approach by representing multiple actuals mesh with a single equivalent fictitious mesh, thereby maintaining consistent hydrodynamic forces on the fine-mesh netting before and after grouping [17]. This technique shows significant potential for exploring the hydrodynamic performance of fine-mesh netting under wave conditions, as well as for future investigations into tension distribution and flow fields between individual twines.
The distribution of the water particle velocity field around the fine-mesh nettings was investigated through both numerical simulations and particle image velocimetry (PIV) measurements in this study. Compared to the undisturbed wave field, the effects of the nettings on the water particle velocity distribution were substantial. The simulation results for the water particle velocity field were in good agreement with the PIV measurement results (see Figure 13 and Figure 14). Additionally, the horizontal motion of the netting was identified as a key factor influencing the wave energy under varying wave conditions. The horizontal motion response of the netting increased linearly with both the solidity ratio of the netting and the wave height [28]. PIV technology has become a powerful and sophisticated tool for studying fluid–structure interaction problems, providing valuable insights into complex turbulent flows, particularly those around moving interfaces. Druault et al. [46,47] introduced an advanced experimental methodology that enables the post-processing of PIV images to determine the fluid–structure interface and measure velocities, thereby tracking the local motion and deformation of the interface. In future research, the degree of deformation of the fine-mesh netting could be further analyzed using PIV image post-processing techniques under varying wave conditions.

5. Conclusions

In this study, the hydrodynamic performance of fine-mesh nettings used in sampling nets was investigated under a range of wave conditions through a combination of wave tank experiments and numerical simulations. A series of simulations were performed to evaluate the damping effects of fine-mesh netting on wave propagation across varying wave periods and heights. Additionally, the distribution of the water particle velocity fields around the nettings was analyzed using both numerical results and PIV measurements. The main conclusions are summarized as follows:
(1)
The horizontal wave forces increased with both the wave period and wave height for all nettings. The maximum experimental and numerical peak values of the wave force were 28.12 N and 27.47 N for Net 1, and 15.66 N and 14.90 N for Net 2, respectively, at a wave height of 0.19 m and a wave period of 2.3 s.
(2)
When the wave period was held constant, the drag and inertial coefficients for both nettings generally decreased with increasing Reynolds and KC numbers. The maximum drag and inertial coefficients for Net 1 were 2.52 and 0.45, respectively, and for Net 2, 1.74 and 0.58, respectively, at a wave period of 2.3 s and a wave height of 0.1 m.
(3)
The wave transmission coefficients of the nettings decreased with an increasing wave height at constant wave periods. However, the coefficients increased initially and then decreased as the wave period increased at constant wave heights. As waves propagate through the netting, both the wave crest and trough are diminished due to the damping effect of the netting. Additionally, the downstream wave amplitude attenuation was smaller for Net 2 than for Net 1 due to the smaller solidity ratio of Net 2.
(4)
The water particle velocity was significantly affected by the presence of the nettings, with the downstream velocity decreasing notably at both the wave crest and wave trough. The simulation and PIV measurement results for the water particle velocity field distribution were in good agreement.

Author Contributions

Z.L.: Conceptualization, Data curation, Writing—review and editing. C.Z.: Funding acquisition, Methodology. F.H.: Supervision, Conceptualization. R.W.: Conceptualization, Funding acquisition. Y.W.: Data curation, Formal analysis. S.G.: Data curation, Formal analysis. All authors have read and agreed to the published version of the manuscript.

Funding

This research was funded by National Key R&D Program of China (2023YFD2401301, 2023YFD2401305, 2024YFD2400705) and Luo Zhaorao Undergraduate Scientific Innovation Fund (A1-2004-25-201306).

Institutional Review Board Statement

Not applicable.

Informed Consent Statement

Not applicable.

Data Availability Statement

The data presented in this study are available in article.

Conflicts of Interest

The authors declare that they have no conflicts of interest. All authors declare that there are no other competing interests.

References

  1. Sameoto, D.D.; Jaroszynski, L.O.; Fraser, W.B. Bioness, a new design in multiple net zooplankton samplers. Can. J. Fish. Aquat. Sci. 1980, 37, 722–724. [Google Scholar] [CrossRef]
  2. Dimmler, W.; Klindt, H. A new electronic system for the rectangular midwater trawl (RMT). Mar. Biol. 1990, 107, 345–348. [Google Scholar] [CrossRef]
  3. Dunn, J.; Mitchell, R.B.; Urquhart, G.G.; Ritchie, B.J. LOCHNESS-a new multi-net midwater sampler. ICES J. Mar. Sci. 1993, 50, 203–212. [Google Scholar] [CrossRef]
  4. Baker, A.d.C.; Clarker, M.R.; Harris, M.J. The N.I.O. combination net (RMT 1+8) and further developments of rectangular midwater trawls. J. Mar. Biol. Assoc. UK 1973, 53, 167–184. [Google Scholar] [CrossRef]
  5. Engås, A.; Skeide, R.; West, C.W. The ‘MultiSampler’: A system for remotely opening and closing multiple codends on a sampling trawl. Fish. Res. 1997, 29, 295–298. [Google Scholar] [CrossRef]
  6. Methot, R.D. Frame trawl for sampling pelagic juvenile fish. Calcofi. Rep. 1986, 27, 267–278. [Google Scholar]
  7. Kristiansen, T.; Faltinsen, O.M. Modelling of current loads on aquaculture net cages. J. Fluid Struct. 2012, 34, 218–235. [Google Scholar] [CrossRef]
  8. Klebert, P.; Lader, P.; Gansel, L.; Oppedal, F. Hydrodynamic interactions on net panel and aquaculture fish cages: A review. Ocean Eng. 2013, 58, 260–274. [Google Scholar] [CrossRef]
  9. Imai, T. Basic studies on the plane net set into the flowing water-IV. Comparative study of hydrodynamic resistance on knotted and knotless nettings. Bull. Jap. Soc. Sci. Fish. 1979, 45, 1277–1282. [Google Scholar] [CrossRef]
  10. Moe-Føre, H.; Endresen, P.C.; Norvik, C.; Lader, P. Hydrodynamic loads on net panels with different solidities. J. Offshore Mech. Arctic Eng. 2021, 143, 051901. [Google Scholar] [CrossRef]
  11. Wang, G.; Martin, T.; Huang, L.Y.; Bihs, H. An improved screen force model based on CFD simulations of the hydrodynamic loads on knotless net panels. Appl. Ocean Res. 2022, 118, 102965. [Google Scholar] [CrossRef]
  12. Nonoda, T. On the resistance of plane minnow netting. Bull. Japan. Soc. Sci. Fish. 1969, 35, 1151–1156. [Google Scholar] [CrossRef]
  13. Gjøsund, S.H.; Enerhaug, B. Flow through nets and trawls of low porosity. Ocean Eng. 2010, 37, 345–354. [Google Scholar] [CrossRef]
  14. Kumazawa, T.; Hu, F.X.; Kinoshita, H.; Tokai, T. Hydrodynamic characteristics of plane minnow netting made of high strength polyethylene (Dyneema). Nippon Suisan Gakk. 2012, 78, 180–188. [Google Scholar] [CrossRef]
  15. Shimizu, H.; Mizukami, Y.; Kitazawa, D. Experimental study of the drag on fine-mesh netting. Aqua. Eng. 2018, 81, 101–106. [Google Scholar] [CrossRef]
  16. Gjøsund, S.H. Simplified approximate expressions for the boundary layer flow in cylindrical sections in plankton nets and trawls. Open J. Mar. Sci. 2012, 2, 66–69. [Google Scholar] [CrossRef]
  17. Liu, Z.Q.; Hu, F.X.; Wan, R.; Zhang, T.Z.; Wang, Y.C.; Guo, S.J.; Zhou, C. Evaluating the hydrodynamic characteristics and shape configuration of fine-mesh nettings for sampling nets. Ocean Eng. 2024, 312, 119143. [Google Scholar] [CrossRef]
  18. Breddermann, K. Filtration Performance of Plankton Nets Used to Catch Micro- and Mesozooplankton; Rostocker Meerestechnische Reihe; Shaker Verlag GmbH: Düren, Germany, 2017; Volume 12, ISBN 103844054057. [Google Scholar]
  19. Grimaldo, E.; Herrmann, B.; Kostak, E.; Brinkhof, J. Understanding the effect of design parameters on the filtration efficiency of trawls intended for commercial harvesting of zooplankton. Ocean Eng. 2023, 288, 116141. [Google Scholar] [CrossRef]
  20. Takagi, T.; Suzuki, K.; Hiraishi, T. Modeling of net for calculation method of dynamic fishing net shape. Fish. Sci. 2002, 68, 1857–1860. [Google Scholar] [CrossRef]
  21. Tang, M.F.; Dong, G.H.; Xu, T.J.; Zhao, Y.P.; Bi, C.W.; Guo, W.J. Experimental analysis of the hydrodynamic coefficients of net panels in current. Appl. Ocean Res. 2018, 79, 253–261. [Google Scholar] [CrossRef]
  22. Song, W.H.; Liang, Z.L.; Cui, H.F.; Huang, L.Y.; Zhao, F.F.; Zhu, L.X.; Chen, B.H. Experimental study on the effect of horizontal waves on netting panels. Fish. Sci. 2006, 72, 967–976. [Google Scholar] [CrossRef]
  23. Lader, P.F.; Olsen, A.; Jensen, A.; Sveen, J.K.; Fredheim, A.; Enerhaug, B. Experimental investigation of the interaction between waves and net structures-Damping mechanism. Aqua. Eng. 2007, 37, 100–114. [Google Scholar] [CrossRef]
  24. Lader, P.F.; Jensen, A.; Sveen, J.K.; Fredheim, A.; Enerhaug, B.; Fredriksson, D. Experimental investigation of wave forces on net structures. Appl. Ocean Res. 2007, 29, 112–127. [Google Scholar] [CrossRef]
  25. Zhao, Y.P.; Li, Y.C.; Dong, G.H.; Gui, F.K.; Wu, H. An experimental and numerical study of hydrodynamic characteristics of submerged flexible plane nets in waves. Aqua. Eng. 2008, 38, 16–25. [Google Scholar] [CrossRef]
  26. Liu, L.L.; Kinoshita, T.; Wan, R.; Bao, W.G.; Itakura, H. Experimental investigation and analysis of hydrodynamic characteristics of a net panel oscillating in water. Ocean Eng. 2012, 47, 19–29. [Google Scholar] [CrossRef]
  27. Bi, C.W.; Zhao, Y.P.; Dong, G.H.; Cui, Y.; Gui, F.K. Experimental and numerical investigation on the damping effect of net cages in waves. J. Fluids Struct. 2015, 55, 122–138. [Google Scholar] [CrossRef]
  28. Bi, C.W.; Chen, Q.P.; Zhao, Y.P.; Su, H.; Wang, X.Y. Experimental investigation on the hydrodynamic performance of plane nets fouled by hydroids in waves. Ocean Eng. 2020, 213, 107839. [Google Scholar] [CrossRef]
  29. Dong, G.H.; Tang, M.F.; Xu, T.J.; Bi, C.W.; Guo, W.J. Experimental analysis of the hydrodynamic force on the net panel in wave. Appl. Ocean Res. 2019, 87, 233–246. [Google Scholar] [CrossRef]
  30. Xu, T.J.; Dong, G.H.; Tang, M.F.; Liu, J.; Guo, J.W. Experimental analysis of hydrodynamic forces on net panel in extreme waves. Appl. Ocean Res. 2021, 107, 102495. [Google Scholar] [CrossRef]
  31. Zhang, Y.M.; Bi, C.W.; Feng, L.; Huang, L.Y. Hydrodynamic response analysis of the aquaculture net under the combined action of irregular waves and currents. Ships Offsh Struct. 2024, 19, 1–17. [Google Scholar] [CrossRef]
  32. Dong, S.C.; You, X.X.; Hu, F.X. Effects of wave forces on knotless polyethylene and chain-link wire netting panels for marine aquaculture cages. Ocean Eng. 2020, 207, 107368. [Google Scholar] [CrossRef]
  33. Bi, C.W.; Zhao, Y.P.; Dong, G.H.; Xu, T.J.; Gui, F.K. Numerical study on wave attenuation inside and around a square array of biofouled net cages. Aqua. Eng. 2017, 78, 180–189. [Google Scholar] [CrossRef]
  34. Tsukrov, I.; Eroshkin, O.; Fredriksson, D.; Swift, M.R.; Celikkol, B. Finite element modeling of net panels using a consistent net element. Ocean Eng. 2003, 30, 251–270. [Google Scholar] [CrossRef]
  35. Li, Y.C.; Zhao, Y.P.; Gui, F.K.; Teng, B. Numerical simulation of the hydrodynamic behavior of submerged plane nets in current. Ocean Eng. 2006, 33, 2352–2368. [Google Scholar] [CrossRef]
  36. Lee, C.W.; Kim, Y.B.; Lee, G.H.; Choe, M.Y.; Lee, M.K.; Koo, K.Y. Dynamic simulation of a fish cage system subjected to currents and waves. Ocean Eng. 2008, 35, 1521–1532. [Google Scholar] [CrossRef]
  37. Chen, H.; Christensen, E.D. Development of a numerical model for fluid-structure interaction analysis of flow through and around an aquaculture net cage. Ocean Eng. 2017, 142, 597–615. [Google Scholar] [CrossRef]
  38. Zhao, Y.P.; Bi, C.W.; Liu, Y.X.; Dong, G.H.; Gui, F.K. Numerical simulation of interaction between waves and net panel using porous media model. Eng. Appl. Comput. Fluid Mech. 2014, 8, 116–126. [Google Scholar] [CrossRef]
  39. Chen, H.; Christensen, E.D. Numerical simulation of wave interaction with moving net structures. In Proceedings of the ASME 2015 34th International Conference on Ocean, Offshore and Arctic Engineering, St. John’s, NL, Canada, 31 May–5 June 2015. [Google Scholar] [CrossRef]
  40. Dean, R.G.; Dalrymple, R.A. Water Wave Mechanics for Engineers and Science; World Scientific Publishing: Singapore, 1991. [Google Scholar] [CrossRef]
  41. Sriram, V.; Schlurmann, T.; Schimmels, S. Focused wave evolution using linear and second order wavemaker theory. Appl. Ocean Res. 2015, 53, 279–296. [Google Scholar] [CrossRef]
  42. Bi, C.W.; Zhao, Y.P.; Dong, G.H. Experimental investigation of the reduction in flow velocity downstream from a fishing net. Aqua. Eng. 2013, 57, 71–81. [Google Scholar] [CrossRef]
  43. Bouhoubeiny, E.; Germain, G.; Druault, P. Time-resolved PIV investigations of the flow field around cod-end net structures. Fish. Res. 2011, 108, 344–355. [Google Scholar] [CrossRef]
  44. Wang, B.; Wang, X.L.; Gao, S.; Qiao, D.S.; Li, Y.; Deng, Z.R.; Ou, J.P. Numerical simulation of hydrodynamic forces acting on curved shape trash intercepting net in nuclear power plant under regular waves. China Ocean. Eng. 2024. [Google Scholar] [CrossRef]
  45. Yadav, S.S.; DebRoy, P. Generation of stable linear waves in shallow water in a numerical wave tank. J. Appl. Fluid Mech. 2022, 15, 537–549. [Google Scholar] [CrossRef]
  46. Druault, P.; Germain, G.; Facq, J.V. PIV measurements combined with the motion tracking technique to analyze flow around a moving porous structure. J. Fluids Struct. 2015, 56, 190–204. [Google Scholar] [CrossRef]
  47. Druault, P.; Germain, G. Analysis of hydrodynamics of a moving trawl codend and its fluttering motions in flume tank. Eur. J. Mech. B/Fluids. 2016, 60, 219–229. [Google Scholar] [CrossRef]
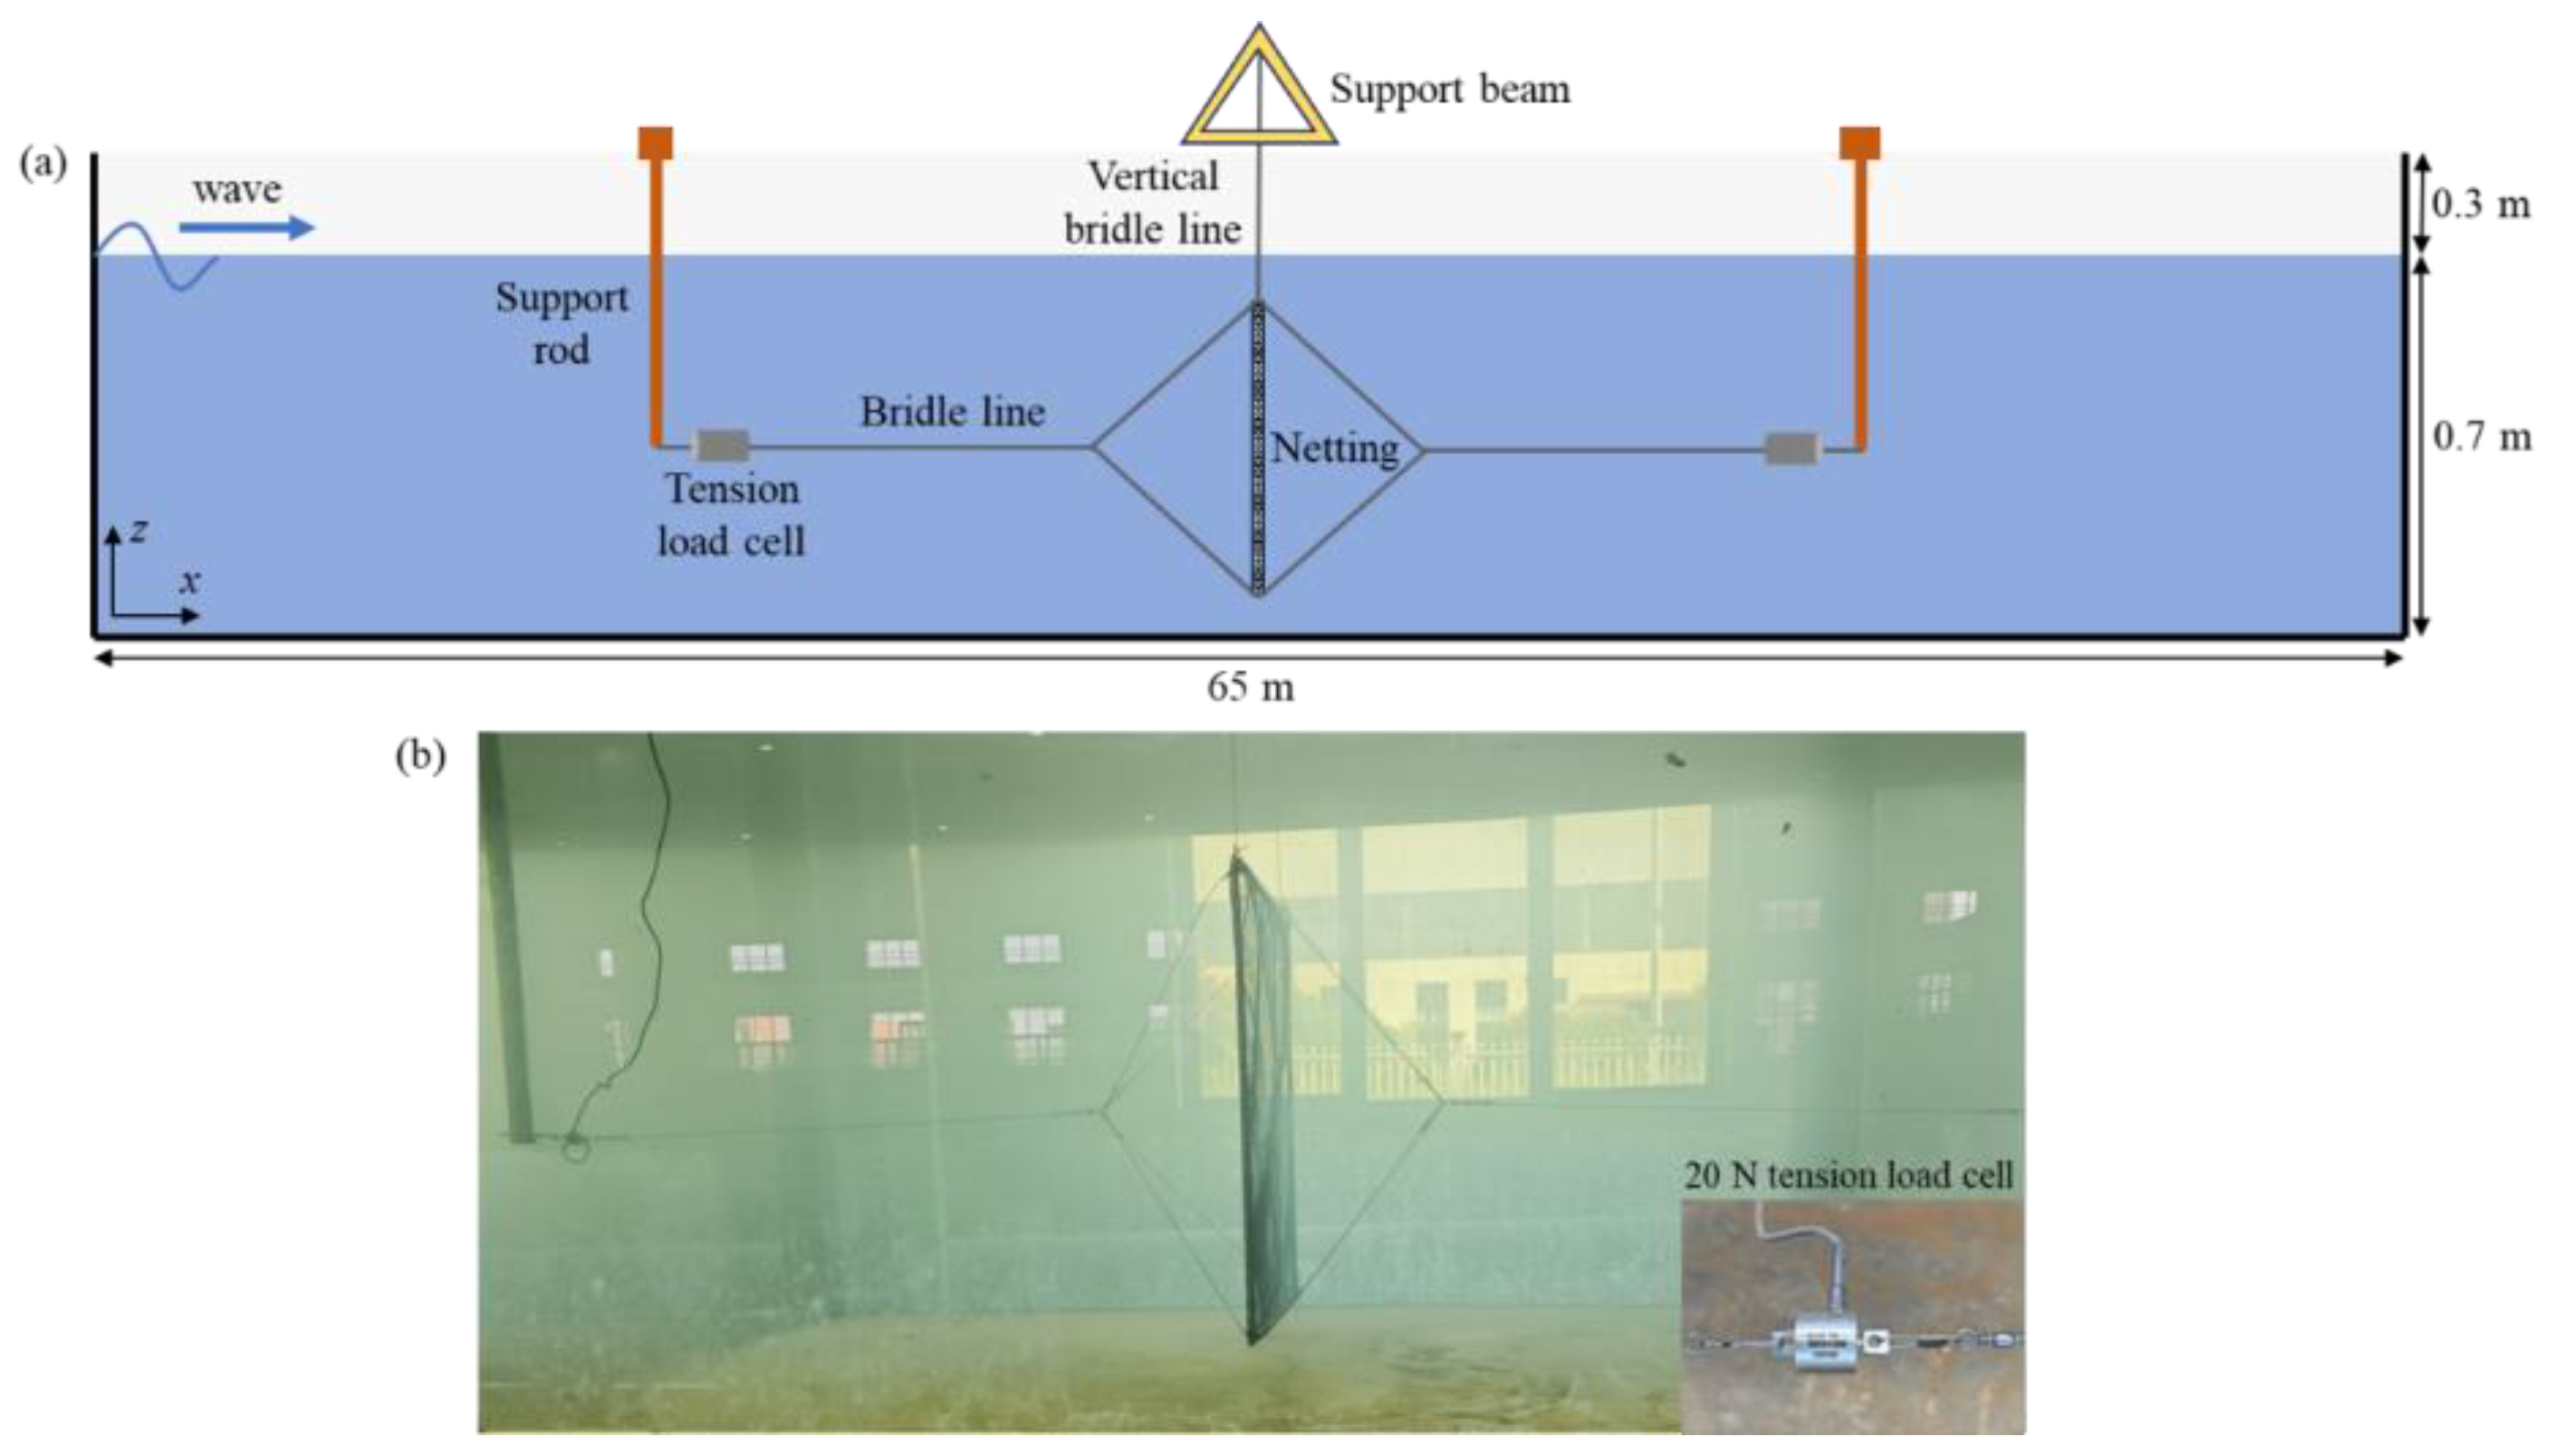
Figure 1. Schematic illustration of the hydrodynamic experimental setup for fine-mesh netting in a wave tank: (a) experimental setup and (b) the netting model.
Applsci 15 07229 g001
Figure 2. Schematic diagram of the PIV measurement experiment setup in the wave tank.
Applsci 15 07229 g002
Figure 3. Schematic of the numerical wave tank: (a) computational domain and boundary conditions, and (b) mesh grid configuration.
Applsci 15 07229 g003
Figure 4. Surface elevation for the mesh independence analysis at T = 1.3 s and H = 0.10 m.
Applsci 15 07229 g004
Figure 5. Comparison of wave elevations from numerical simulations, experimental measurements, and theoretical values.
Applsci 15 07229 g005
Figure 6. Horizontal wave forces of the nettings with various wave periods and wave heights: left: Net 1, right: Net 2; (a,d): T = 1.3 s, (b,e): T = 1.8 s; (c,f): T = 2.3 s.
Applsci 15 07229 g006
Figure 7. Relationship between drag coefficient, Reynolds number, and KC number of the nettings under different wave periods: (a,c) for Net 1, (b,d) for Net 2.
Applsci 15 07229 g007
Figure 8. Relationship between inertial coefficient, Reynolds number, and KC number of the nettings under different wave periods: (a,c): for Net 1, (b,d) for Net 2.
Applsci 15 07229 g008
Figure 9. Wave transmission coefficients of the nettings for different wave heights at various wave periods: (a) Net 1; (b) Net 2.
Applsci 15 07229 g009
Figure 10. Wave transmission coefficients of the nettings for different wave periods at various wave heights: (a) Net 1; (b) Net 2.
Applsci 15 07229 g010
Figure 11. Wave elevation upstream and downstream of Net 1 under the wave condition: T = 0.13 s, H = 0.19 m, (ad): T/4, T/2, 3T/4, and T, respectively.
Applsci 15 07229 g011
Figure 12. Wave elevation upstream and downstream of Net 2 under the wave condition: T = 0.13 s, H = 0.19 m, (ad): T/4, T/2, 3T/4, and T, respectively.
Applsci 15 07229 g012
Figure 13. Water particle velocity field distribution of Net 1. Wave condition: T = 0.13 s, H = 0.19 m; (ad): T/4, T/2, 3T/4, and T, respectively. (I)–(III): Global view of the numerical tank, local view around the netting in numerical simulation, and PIV measured around the netting, respectively.
Applsci 15 07229 g013
Figure 14. Water particle velocity field distribution of the Net 2. Wave condition: T = 0.13 s, H = 0.19 m; (ad): T/4, T/2, 3T/4, and T, respectively. (I)–(III): Global view of the numerical tank, local view around the netting in numerical simulation, and PIV measured around the netting, respectively.
Applsci 15 07229 g014
Table 1. Structural parameters of fine-mesh nettings.
Netting No.MaterialsNetting Outline Area (m)Mesh Bar Length l (mm)Twine Diameter d (mm)Solidity Ratio Sn
Net 1PA0.5 × 0.50.5050.2910.82
Net 2Dyneema0.5 × 0.51.9500.3600.34
Table 2. Wave parameters of the wave cases for the hydrodynamic experiment.
Wave Case No.Wave Period T (s)Wave Height H (m)Wave Length L (m)Wave Steepness H/L
11.30.102.490.040
21.30.132.490.052
31.30.162.490.064
41.30.192.490.076
51.80.104.030.025
61.80.134.030.032
71.80.164.030.040
81.80.194.030.047
92.30.105.490.018
102.30.135.490.024
112.30.165.490.029
122.30.195.490.035
Table 3. Porous media resistance coefficients under different wave cases.
Wave Period T (s)Wave Length L (m)Net 1Net 2
DnCnDnCn
1.32.498,814,75828.165,848,00019.44
1.84.0310,850,00047.796,476,00022.23
2.35.4914,910,00051.188,328,00023.89
Table 4. Mesh independence analysis for surface elevation at T = 1.3 s and H = 0.1 m.
MeshMesh QualityMaximum Grid Size (mm)Minimum Grid Size (mm)Total Elements
1Coarse5051,035,819
2Medium4051,265,828
3Fine3042,149,106
Disclaimer/Publisher’s Note: The statements, opinions and data contained in all publications are solely those of the individual author(s) and contributor(s) and not of MDPI and/or the editor(s). MDPI and/or the editor(s) disclaim responsibility for any injury to people or property resulting from any ideas, methods, instructions or products referred to in the content.