1. Introduction
Antenna measurements play a critical role in the framework of antenna characterization, since they allow one to examine the real-world performance of the antenna under test (AUT) and ensure that it meets the specified requirements and standards for the planned application in its intended environment. In particular, numerous approaches are used for obtaining the AUT far-field (FF) pattern and are generally divided in FF and near-field (NF) methods.
Although FF methods allow for the direct determination of the AUT FF parameters of interest, they exhibit several downsides. First, the well-known FF condition, which requires a minimum distance from the probe antenna to the AUT, must be satisfied. Obviously, especially when dealing with electrically large antennas, this requirement necessitates the use of very large measurement facilities, usually making it impossible to characterize the AUT indoor. Furthermore, due to the long measurement distances required, it may be necessary to perform FF measurements outdoor, thus heavily influencing the accuracy of the results due to the unavoidable impact of external factors, such as environmental reflections and/or weather conditions. This led, during last decades, to the development of NF measurements techniques [
1,
2,
3,
4,
5,
6,
7,
8,
9,
10]. In particular, these techniques allow one to bypass the requirement on the minimum separating distance so that the acquisition can be accomplished in a climate- and electromagnetic-controlled environment of the measurement facility [
7], the anechoic chamber. More specifically, NF measurements generally require the collection of the NF data for two orthogonal polarizations of the antenna field on a geometrical surface enclosing the AUT, which depends on the specific measurement facility and fixes the corresponding scanning method to be implemented. In particular, these approaches are usually classified in spherical, cylindrical, and planar NF scans, with the acquisition taking place on a sphere, a cylinder, or a plane, respectively. Following the collection of the samples, the NF data are manipulated using ad hoc NF/FF transformation (NF/FFT) techniques, which allow one to obtain the FF pattern of the AUT by properly post-processing the samples depending on the specific geometrical surface on which they are acquired.
Spherical NF (SNF) methods [
11,
12,
13,
14,
15,
16,
17,
18,
19,
20,
21,
22,
23,
24,
25,
26,
27,
28,
29,
30] are the most accurate ones, providing for the determination of the entire FF pattern of the AUT without introducing any truncation error. They rely, save for those based on the source reconstruction method [
17,
21], on a modal expansion of the field on the measuring sphere, the so-called spherical wave expansion (SWE), afterward a proper spherical NF/FFT technique is performed. However, SNF measurements can be very time consuming, thus entailing high related costs, since the amount of NF data, in particular when dealing with electrically large AUTs, can become huge.
This is why, nowadays, the scientific community pays so much attention to the development of novel NF techniques that address the problem of reducing the high number of required samples, such as the non-redundant (NR) representations theory [
31], compressive sensing [
27,
29], or adaptive sampling [
26]. In particular, among these, the NR sampling representations of the electromagnetic (EM) fields [
31] stand out due to their unique features. Indeed, by utilizing the spatial band-limitation properties of the EM field [
32], these techniques allow for a significant reduction in the number of samples needed to effectively reconstruct the near field radiated by the AUT or, equivalently, the voltage collected by a non-directive probe [
16,
24], whose spatial bandwidth is almost the same of the AUT field one [
33]. In particular, by properly choosing a rotational surface modeling the AUT, the NR representations require the acquisition of only a minimum number of samples, substantially coincident with the number of degrees of freedom of the field [
34]. In this way, it is possible to exploit all and only the available independent information of the problem at hand, resulting in a considerable reduction in terms of computational complexity and measurement time that, otherwise, would be pointlessly lengthy. In addition, these techniques not only outperform the standard spherical NF/FFT technique in terms of required number of NF samples and acquisition time but also allow one to exactly determine the highest order spherical harmonic involved in the SWE of the field [
16].
Then, after gathering the samples at the positions fixed by the NR sampling, which are non-equally spaced, the probe voltage value, at each point on the scan sphere and, hence, at the positions imposed by the traditional SNF sampling theory too, can be retrieved by using a 2-D Optimal Sampling Interpolation (OSI) expansion. This makes it possible to perform the standard NF/FFT technique to obtain the antenna FF pattern.
Following the idea firstly proposed by Yaccarino et al. [
35], a further saving of measurement time can be obtained by performing the acquisition on-the-fly and employing continuous and synchronized motions of the probe and antenna positioners. Such an idea has led to the development of NF/FFT techniques exploiting innovative spiral scans. Also in this case, the use of NR sampling representations allows for a huge reduction in the spiral turns and sampling points, resulting in additional time savings. The case of a spherical modeling of the AUT was initially addressed by choosing the spiral step, which determines the number of spiral turns, coincident with the sampling step required for the interpolation on a meridian of the sphere [
10]. Then, the use of the unified theory of spiral scans for non-spherical AUTs [
36] has allowed for the subsequent extension to the cases of elongated and quasi-planar AUTs [
10].
Unfortunately, particular positionings of the antenna on the supporting brackets, as well as the mechanical constraints of the NF measurement system and/or its unusual configuration, could impede the mounting of the AUT in such a way that its center coincides with that of the measurement sphere (onset mounting). When these shortcomings occur, the number of NF data necessary for the classical spherical NF/FFT significantly increases because of the well-known minimum sphere rule [
15], thus leading to a consequent growth of the related acquisition time and costs.
Foged et al. addressed this problem by proposing a modified version of the SWE, wherein the spherical waves are computed with respect to the center of the (offset) coordinate system of the antenna, rather than with respect to the measurement sphere center [
37,
38]. In [
39], the developed approach allowed to minimize the number of coefficients involved in the SWE of the field, highly reducing the number of required measurement points, but entailing a high computational cost, since it requires to directly solve a linear equation system via an explicit matrix inversion. This drawback has been tackled in [
40], where an iterative inversion technique has been employed to highly lower the required computational time. Even so, although remarkably reducing the number of necessary NF data in the offset case, the amount of samples required when employing these techniques still remains slightly greater than that in the onset case.
The goal of this work is to provide an experimental validation of NR spherical spiral scannings for offset-mounted elongated AUTs, effectively modeled by a prolate spheroid or a rounded cylinder (namely, a cylinder ended with two hemispheres), whose effectiveness has already been numerically proved in [
41,
42], respectively. These NR spherical spiral scannings represent the extension to the offset case of the corresponding ones [
10] for the onset case and allow the accurate reconstruction of the far field of offset mounted long AUTs, by requiring only a minimum amount of samples, equal to that required by the NR onset case.
The experimental test campaign was carried out at the Antenna Characterization Laboratory of the UNIversity of SAlerno (UNISA), which houses a roll-over-azimuth SNF measurement facility. The results reported in
Section 3 also prove the effectiveness and usefulness of the proposed technique from a practical standpoint, since it requires over 85% fewer samples compared to the classical SNF scanning, thus entailing a huge saving of measurement time.
The article is organized as follows. The state of the art is reviewed in
Section 1, wherein the rationale for addressing the problems associated with an offset-mounted antenna is also provided. In
Section 2, this issue is appropriately formalized, and an efficient OSI expansion, enabling the accurate determination of the probe voltage at each point on the spherical measuring surface from an NR number of its samples, is developed. In
Section 3, the conducted laboratory proofs assess the efficiency of the approach and of the associated NF/FFT technique. Finally,
Section 4 draws conclusions.
2. NR Representation of the Probe Voltage on the Spiral
An NR representation of the voltage collected by a small non-directive probe on a suitable spiral, which wraps a sphere of radius
d in the NF region of an offset-mounted long AUT, is developed in this Section.
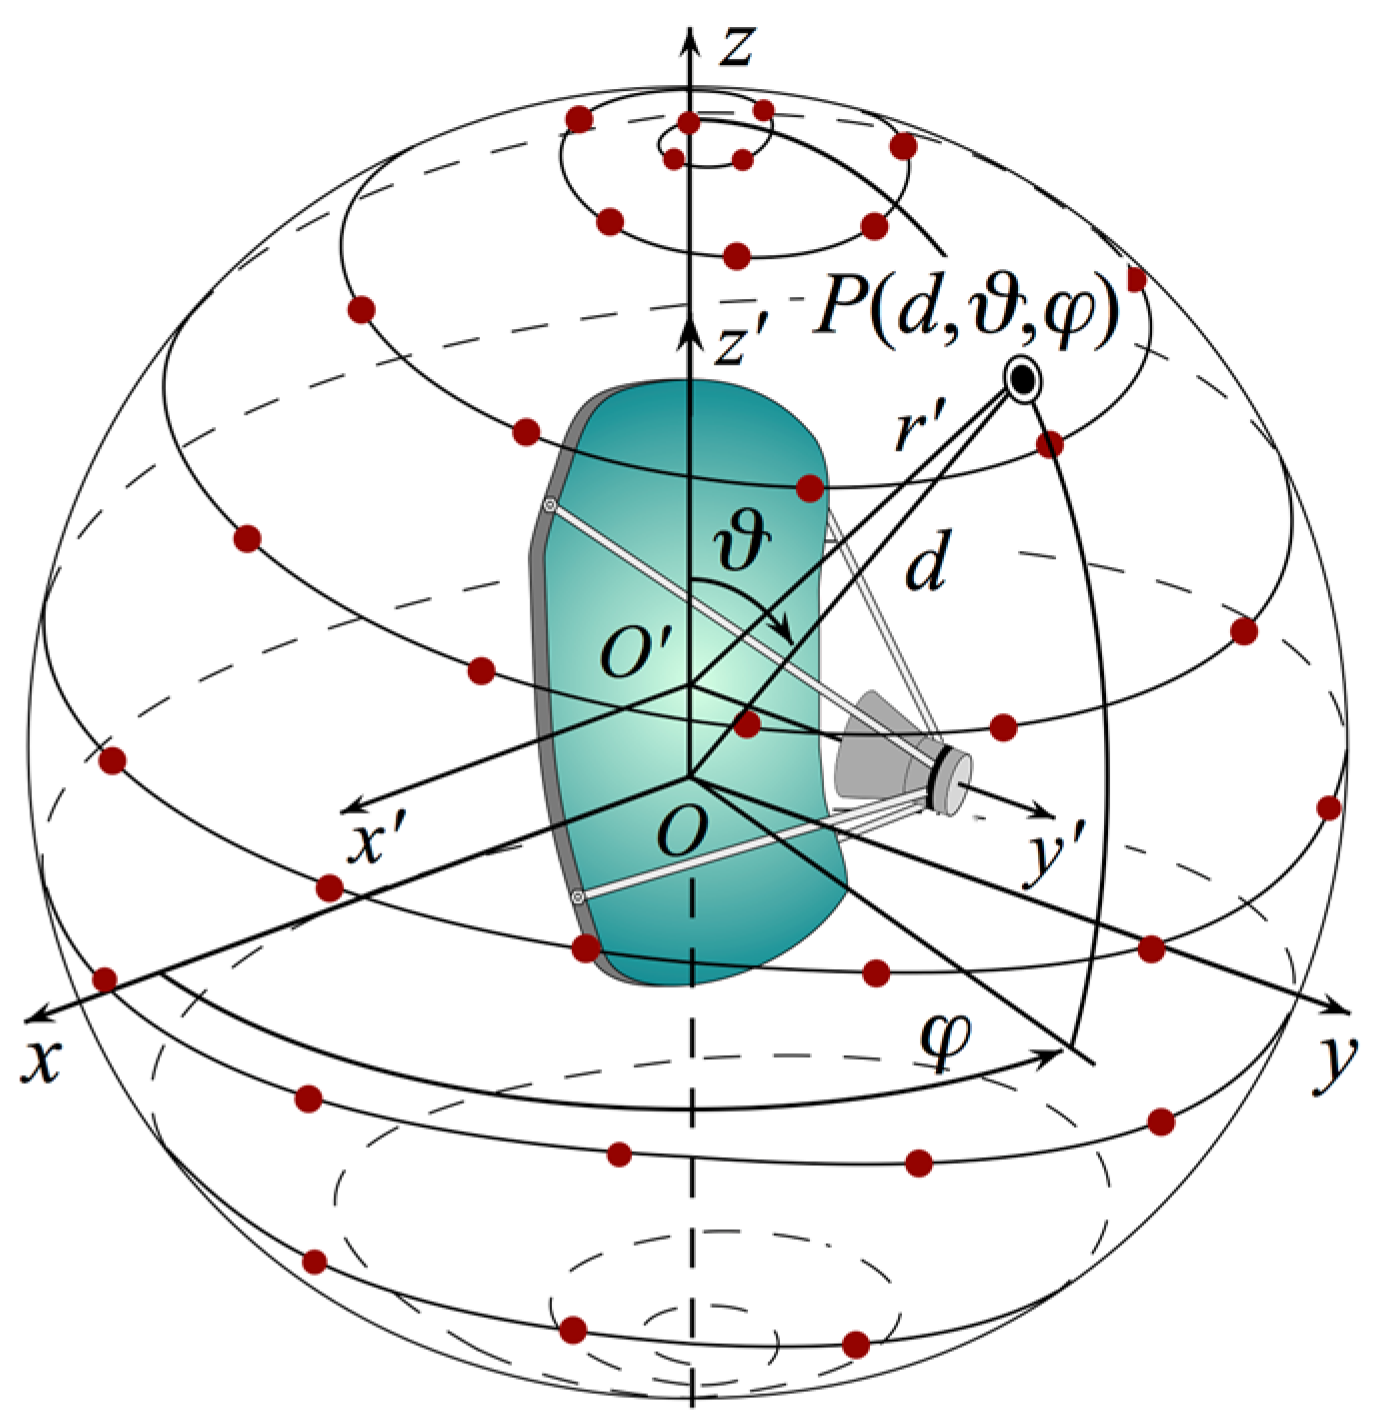
Figure 1 showcases the geometry of the problem at hand.
Let us consider two different spherical coordinate systems , whose origin O corresponds to the center of the scanning spherical surface M (onset coordinate system), and (offset coordinate system), whose origin O’ coincides with the center of the offset-mounted AUT and is obtained by shifting, by a distance , O on the z′-axis, which coincides with the z-axis.
It is worthwhile to highlight that specifies the generic observation point on the sphere, while is introduced for developing a suitable NR sampling representation of the probe voltage.
Furthermore, since the sampling locations are determined in the reference system
S′, they must be properly expressed in the reference system of interest, namely,
S. The following expressions provide the relationship between the respective sets of coordinates:
As stated in [
33], the voltage detected by a non-directive probe has the same effective spatial bandwidth of the AUT field. Thus, it is a spatially quasi-bandlimited function and can be effectively represented by a bandlimited function. In particular, to obtain an NR representation of the voltage
V on the sphere, an optimal parameter, say
η, must be defined in order to describe any observation curve on the sphere. Furthermore, an optimal phase factor
must be extracted from the voltage expression, thus obtaining the so-called “reduced voltage”:
where
is the voltage
or
is detected by the probe or by the rotated probe.
When is approximated with a bandlimited function, the approximation error, which exhibits step-like behavior, becomes negligible when the bandwidth exceeds a critical value . Therefore, the error can be controlled by choosing the bandwidth of the approximating function equal to , with being an enlargement bandwidth factor generally chosen slightly larger than one when dealing with electrically large AUTs.
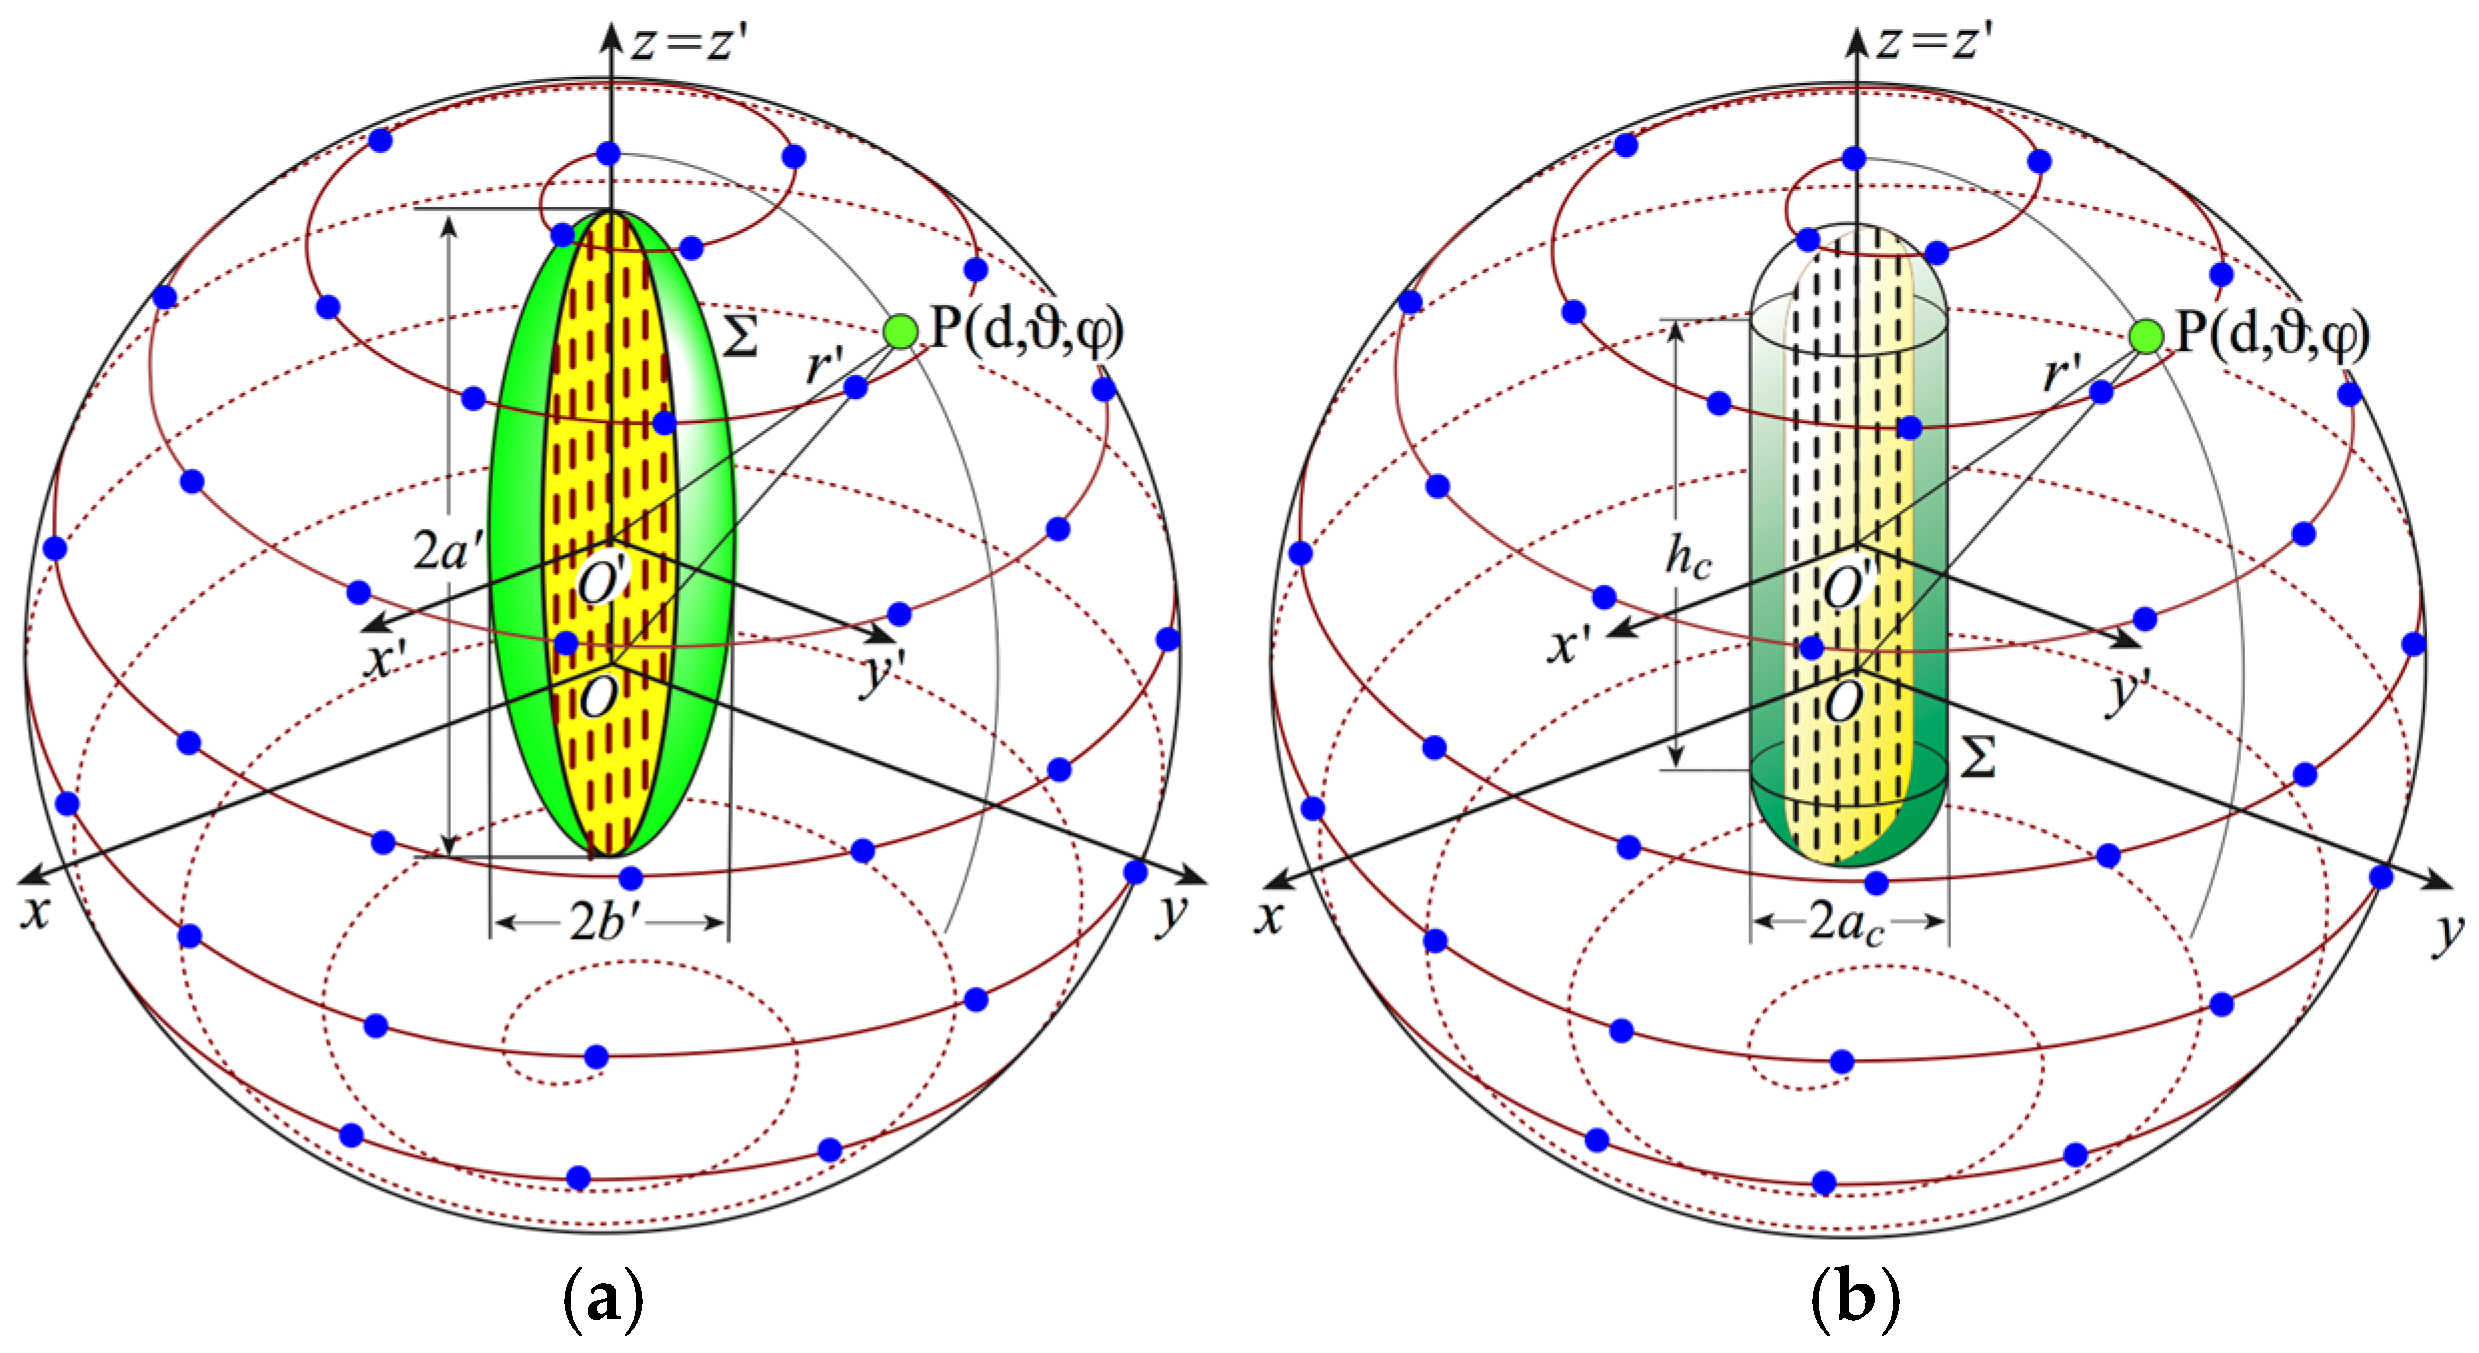
The number of samples required to effectively represent the voltage depends on the area of the surface Σ modeling the AUT. Therefore, the considered offset-mounted antenna can be modeled by a rotational surface that, in order to best fit the elongated AUT geometry, could be a prolate spheroid of minor and major semi-axes equal to
and
(see
Figure 2a), or a so-called rounded cylinder (see
Figure 2b), i.e., a cylinder of radius
and height
ended into two hemispheres. The prolate spheroid represents a more appropriate choice when the AUT is irregularly shaped and has a maximum in the middle of its transverse section. Otherwise, the rounded cylinder represents a better solution.
Thus, by properly taking advantage of the unified theory of spiral scannings for non-volumetric AUTs [
36], it is possible to devise an NR voltage representation on the measurement spherical surface
M from a minimum number of samples gathered on an appropriate spiral wrapping of this sphere.
In order to determine the spiral trajectory, the spiral wrapping Σ is projected onto the scan sphere M. The spiral step is chosen to be equal to the sample spacing required for interpolating the NF data on any meridian of the sphere M, which still represents a meridian curve in the offset coordinate system .
According to [
31,
36], the spatial bandwidth when considering a meridian curve is:
where
is the curve obtained as the intersection between Σ and the meridian plane containing the observation point
P,
is its length, and
is the wavelength. The related optimal parameter and optimal phase function are obtained as:
where
and
are the distances from
P to the tangency points
and
on
, respectively, and
and
are the corresponding arclength abscissas.
It is important to highlight that the parameters in (5), (6), and (7) depend on the specific choice of the modeling surface Σ.
When a prolate spheroid (see
Figure 2a) is chosen as the suitable modeling surface,
and the corresponding expressions of (5), (6), and (7) are [
10]:
where
is the second kind elliptic integral;
is the eccentricity of the ellipse, attained as the intersection between a meridian plane and Σ; 2
f is the focal distance;
and
are the corresponding elliptic coordinates; and
are the distances between
P and the foci of the ellipse.
On the other hand, when the chosen modeling surface is represented by a rounded cylinder (see
Figure 2b),
. Accordingly:
Regarding the parameter
η and the phase function
ψ, they can be determined by substituting, in (6) and (7), the involved geometrical parameters
and
, whose expressions change depending on the tangency points position. Their explicit expressions are reported in
Appendix A.
The parametric equations of the spiral, attained by projecting the spiral that wraps Σ on the measurement sphere through the curves at
, are [
36]:
where
is the angular parameter that describes the spiral and
,
.
, and
. Moreover,
is the oversampling factor, and
represents the integer part function. Notably, the spiral angle
, in contrast to the zenithal angle
, can be negative. Concerning the NR representation on the scan spiral, in accordance with [
36], the bandwidth
is equal to
times the arclength of the spiral that wraps Σ from pole to pole, the parameter
ξ is equal to
times the curvilinear abscissa of the projecting point lying on the spiral enfolding Σ, and the corresponding phase function
γ coincides with
ψ.
The probe voltage at each point
on the sphere can then be recovered from an NR number of its samples on the spiral by employing the 2-D OSI expansion [
36]:
More specifically,
is the number of the closest retained samples,
,
and:
Moreover:
is the OSI function and:
are, respectively, the Tschebyscheff sampling function and the Dirichlet function [
31,
36], with
being the
-degree Tschebyscheff polynomial.
It is important to stress that, in order to precisely interpolate the voltage in close proximity of the poles ( and ), a higher value of the enlargement bandwidth factor , related to the representation on the spiral, must be adopted to prevent a significant increase in the band-limitation error in those regions, due to the fact that, nearby the poles, a small variation of the optimal parameter ξ corresponds to very large changes of the angular parameter describing the spiral.
3. Experimental Validation
The developed NR NF/FFT techniques have been experimentally validated at the UNISA Antenna Characterization Laboratory. In such a facility, an anechoic chamber (8 m × 5 m × 4 m) is available for NF and FF measurements, depending on the FF distance requirements. The chamber is paneled with pyramidal absorbers, which guarantee, in the X band, a background noise level of less than −40 dB. A vertical scanner and three turntables equip a versatile NF measurement system (see
Figure 3), which allows one to execute NF measurements with planar-spiral, helicoidal, and spherical-spiral scans, besides those with plane-polar, cylindrical, and spherical scans. The vectorial network analyzer ANRITSU 37247C by Anritsu Corporation, Kanagawa, Japan, is used to perform accurate amplitude and phase measurements. A further turntable, allowing direct FF measurements of AUTs whose sizes are small in terms of wavelength, or of radar cross section measurements of electrically small targets, is also available.
The AUT employed in the experimental proofs is a resonant slotted waveguide array, working at 10 GHz, obtained by cutting eight slots with rounded ends in the large walls of a tapered rectangular waveguide. It is fed using a coaxial to rectangular waveguide transition and has been mounted so that its axis coincides with the z one and its large walls are parallel to the x = 0 plane. Moreover, an open-ended WR90 rectangular waveguide is employed as a probe.
The MI-3000 software by NSI-MI Technologies, Atlanta, GE, USA, which implements the traditional spherical NF/FFT technique [
15], is used to evaluate the FF patterns from both the directly acquired massive NF data and those obtained by interpolating the NR NF samples. Furthermore, for both experimental test scenarios, the AUT is shifted along the
z-axis by a distance
of 5.37λ.
3.1. Prolate Spheroidal Modeling
A few experimental results, which prove the efficacy of the NR NF/FFT with spherical spiral scanning for offset-mounted elongated AUTs modeled by a prolate spheroid, are shown in this subsection.
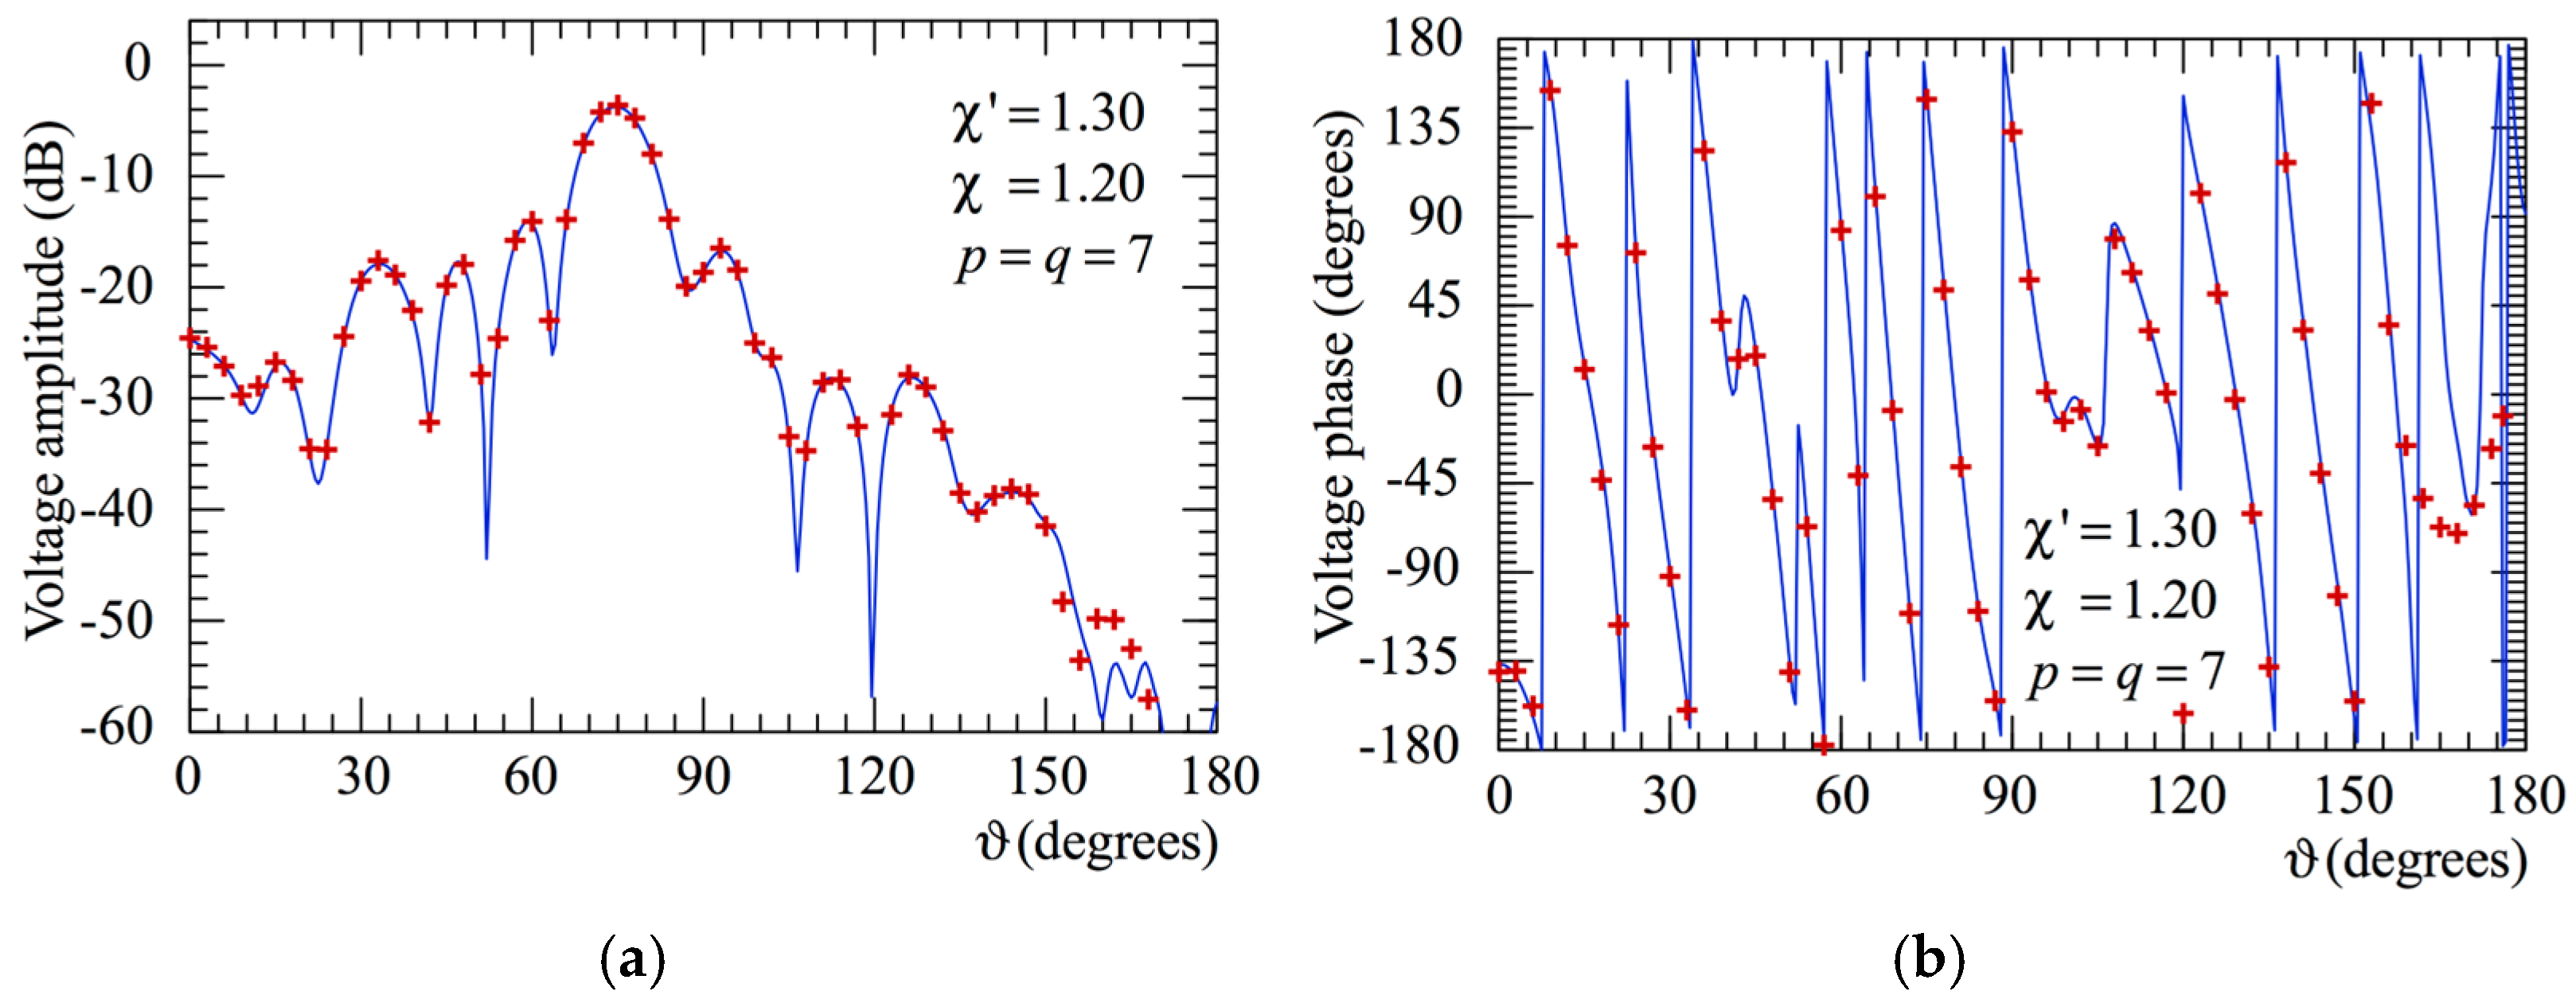
The prolate spheroid considered to model the AUT has major and minor semi-axes equal to 6 λ and 1 λ, respectively. The probe voltages have been acquired on a sphere of radius d = 20 λ, and the reconstructions shown here have been attained by choosing ′ = 1.30, = 1.20, and p = q = 7. It is noteworthy that, as previously stated, to avoid the local growth of the band-limitation error, the factor ′ has been properly augmented in the region of the spiral identified by the 20 samples close to each of the poles, thus acquiring some extra samples.
To prove the validity and precision of the 2-D OSI expansion (13), the amplitudes and the phases of the reconstructed voltage
on the meridians at
φ = 0° and
φ = 90° are compared with those of the directly acquired one on the same meridians in
Figure 4 and
Figure 5, respectively. As can be observed, the attained recoveries are very good everywhere and degrade only in the zones characterized by very low voltage levels (about −50 dB and below), wherein the remaining reflections from the anechoic chamber walls and the noise tend to contribute to the reconstruction error. The FF cuts at
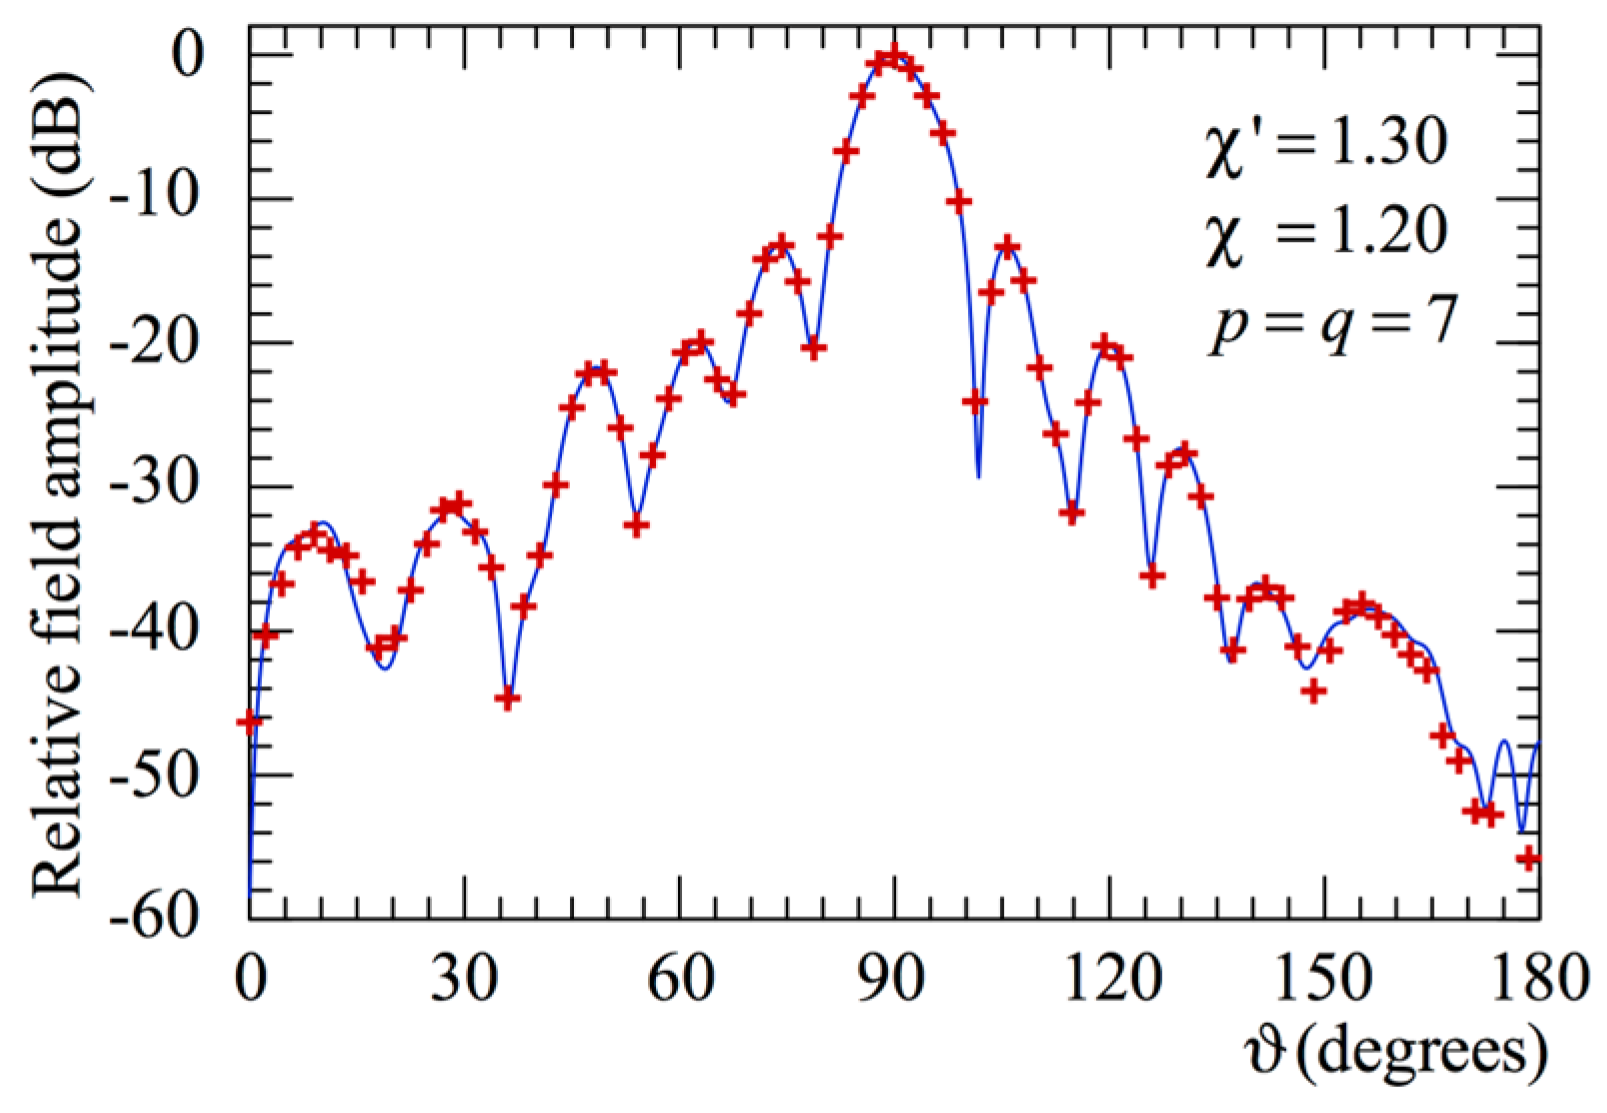
φ = 0° and
= 90°, obtained from the NR NF samples, are compared in
Figure 6 with those (references) attained from the data directly acquired on the NF spherical grid prescribed by the standard NF/FFT [
15]. Lastly, for completeness, the comparison relevant to the FF cut at
φ = 90° is reported in
Figure 7. As can be observed, also the FF reconstructions are accurate, demonstrating the efficacy of the devised NF/FFT technique with spherical spiral scanning for offset-mounted long antennas.
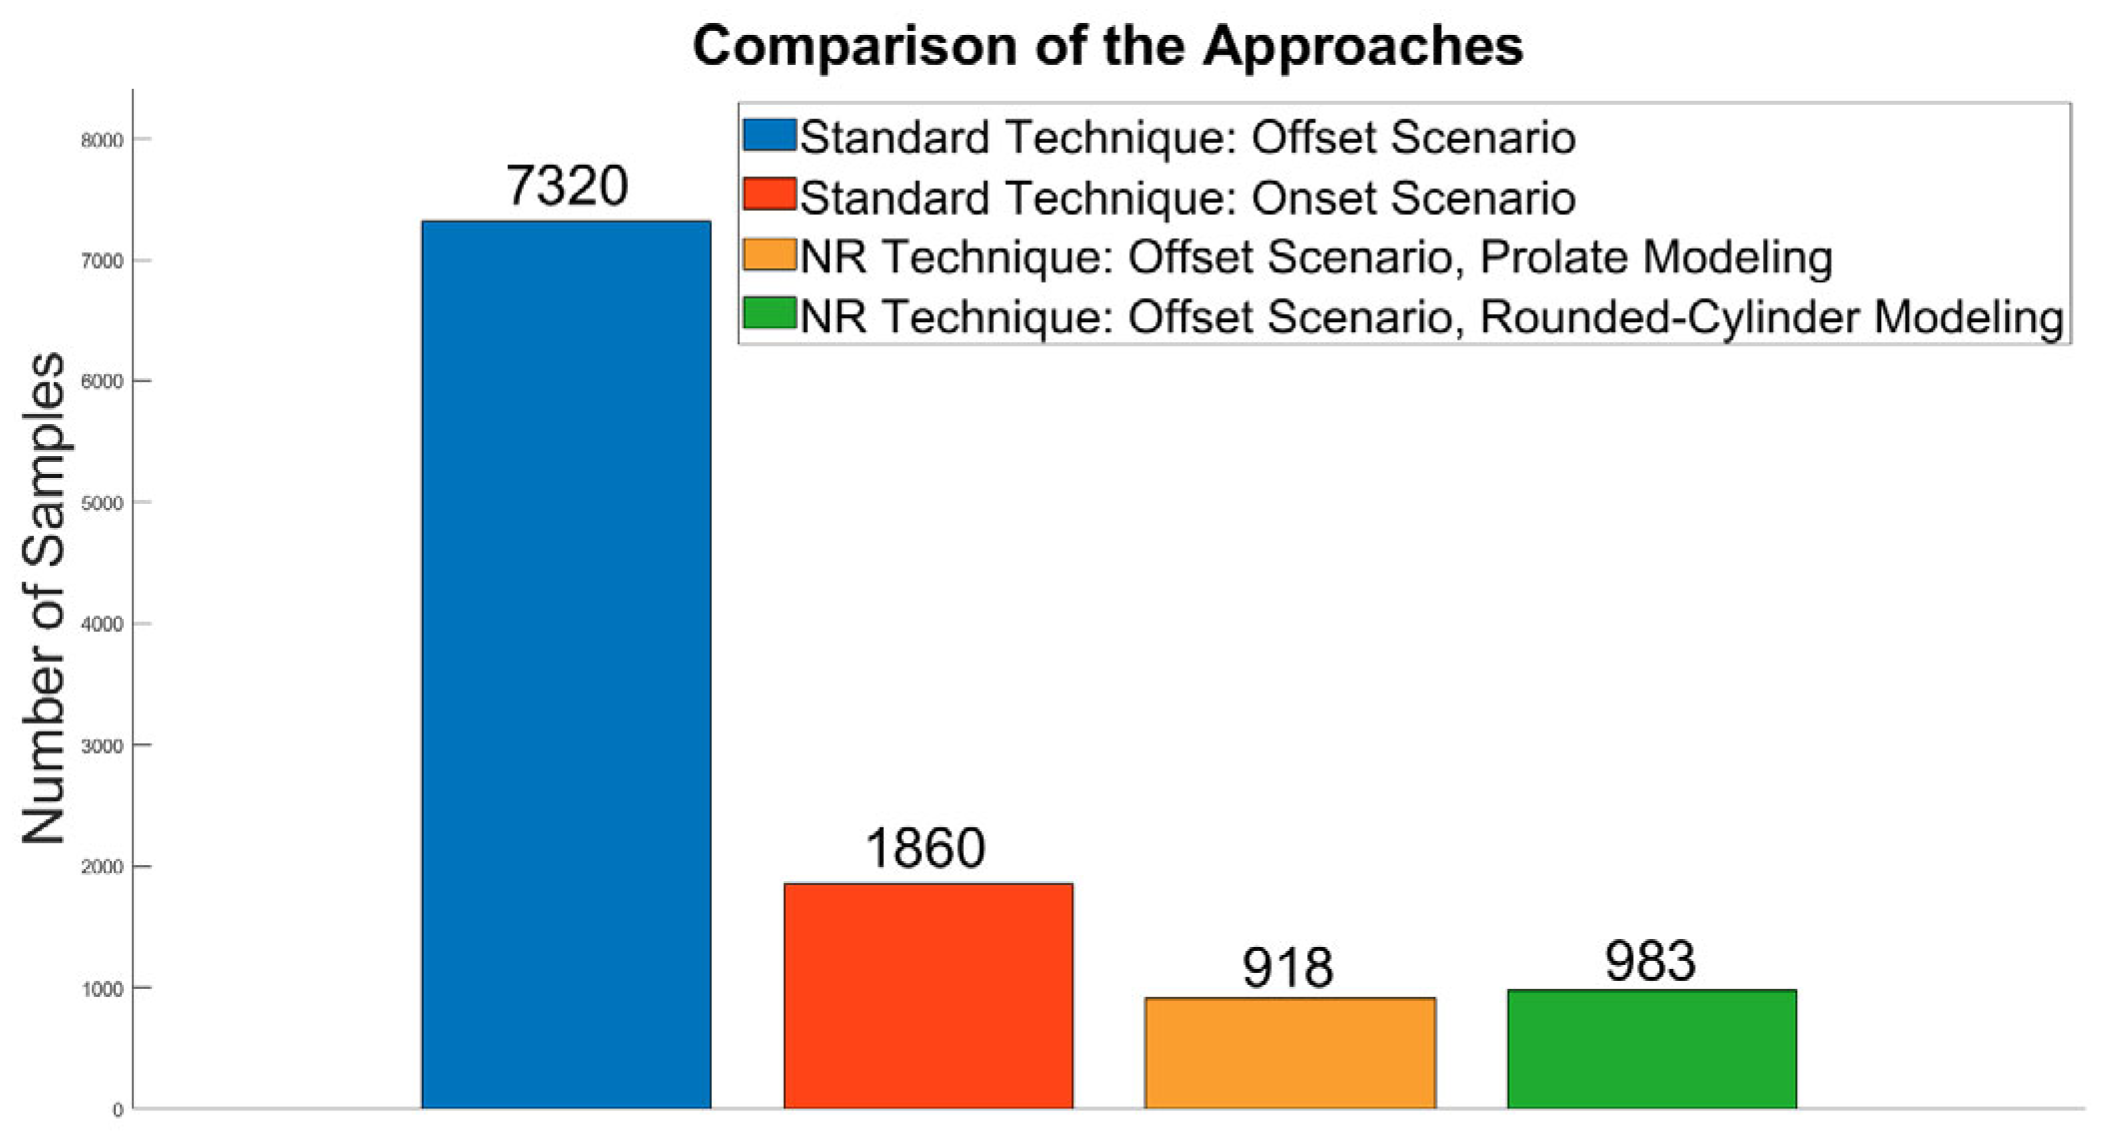
It is worthwhile stressing that the number of utilized NR samples is 918 (comprehensive of the 160 extra samples nearby the poles), way lower than those 1860 and 7320 required by the MI software, which implements the classical NF/FFT [
15] in the onset and offset mounting cases, respectively.
3.2. Rounded Cylinder Modeling
The experimental results involving the rounded cylinder modeling are reported in this subsection.
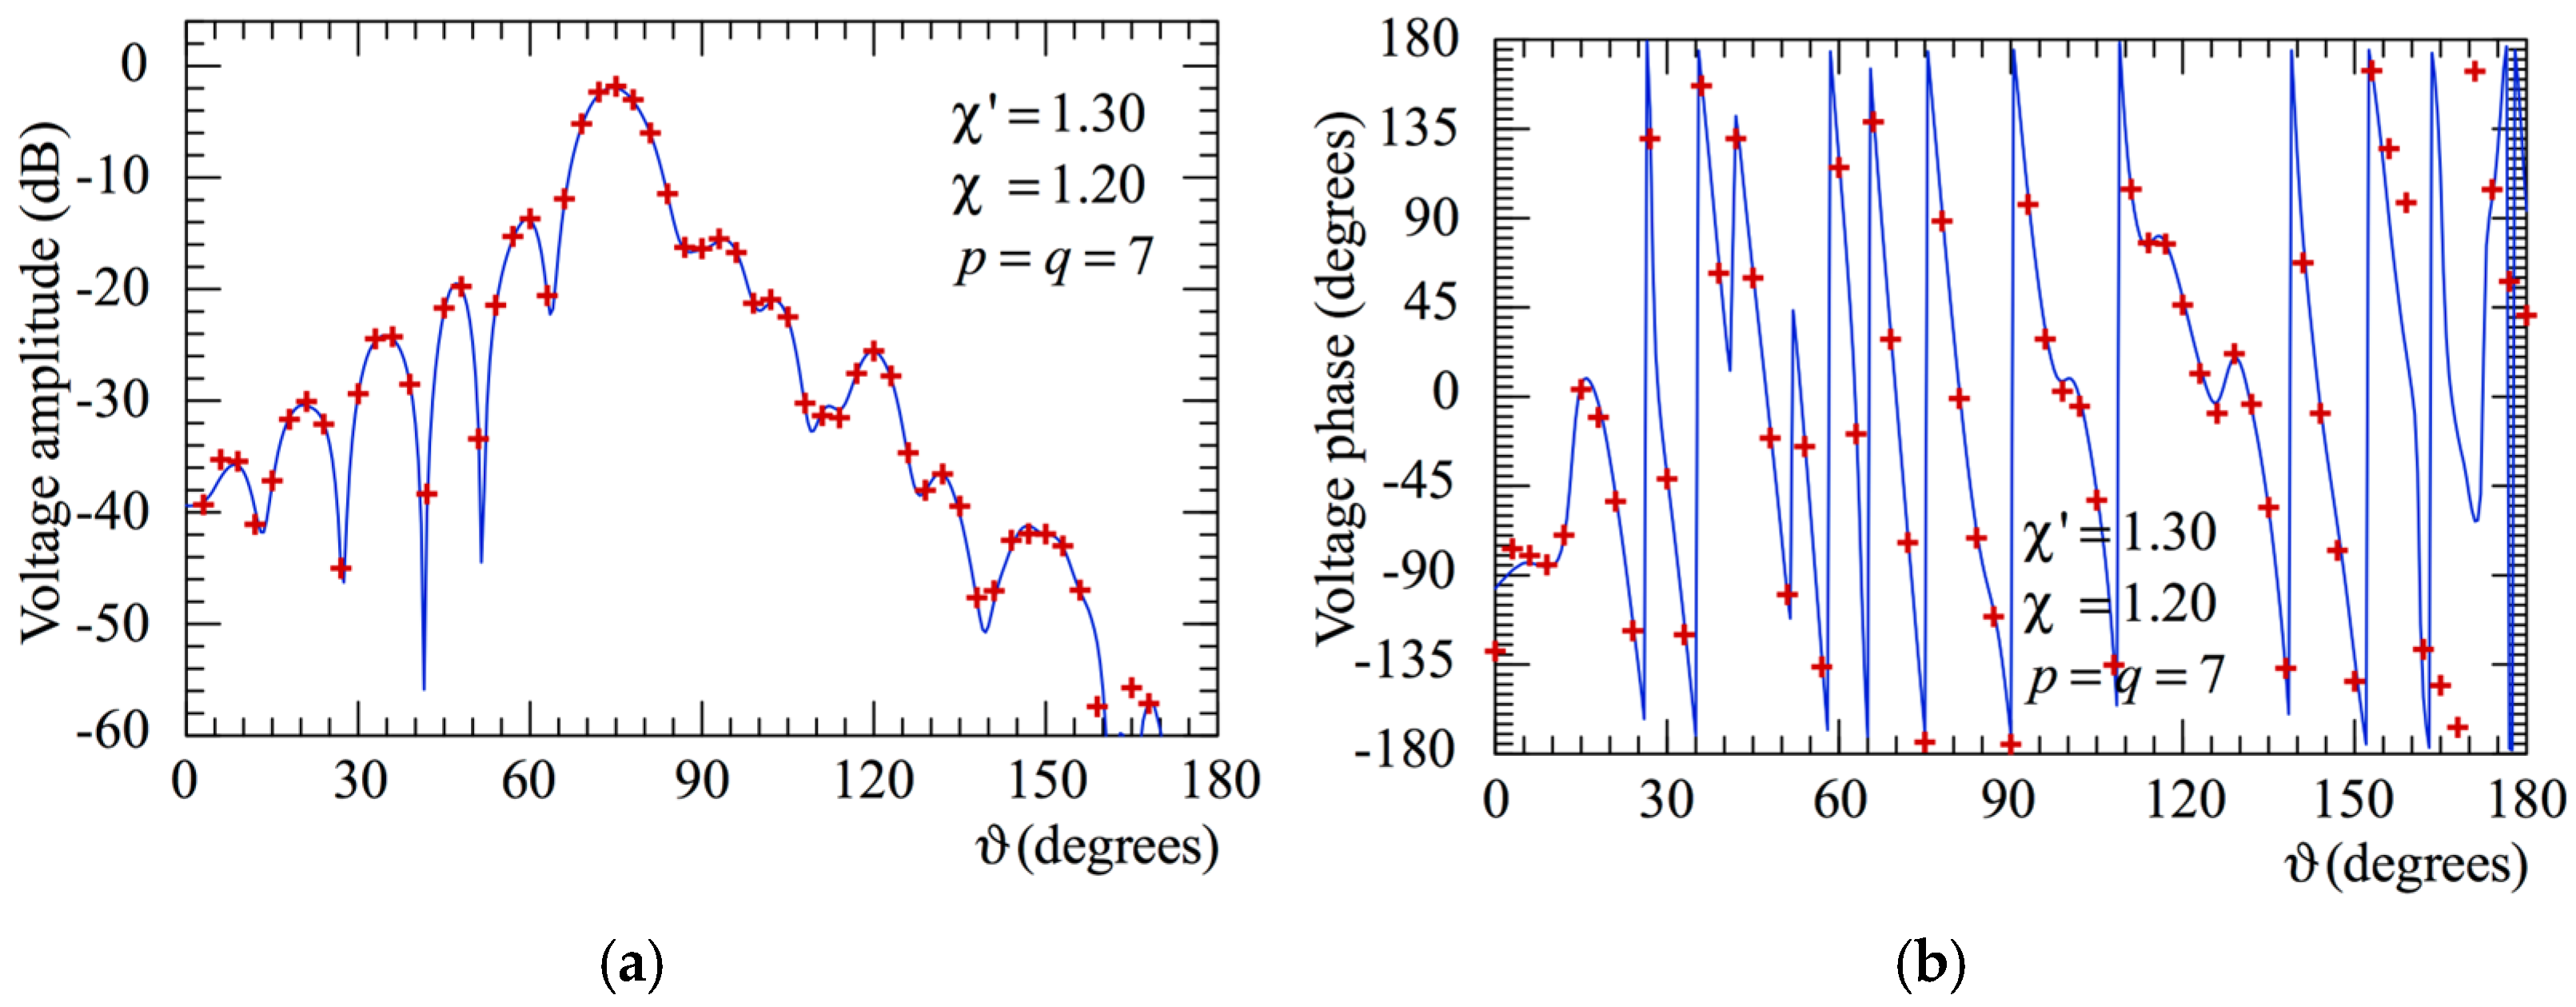
The geometrical parameters of the rounded cylinder considered to model the antenna are = 10 λ and = 0.85 λ. The probe voltages have again been acquired on a spherical surface of radius d = 20 λ, and the shown reconstructions have still been attained by choosing ′ = 1.30, = 1.20, and p = q = 7. Also, in such a case, the factor ′ has been suitably augmented in the region of the spiral wherein the 20 samples close to each of the poles are located.
The amplitudes and the phases of the recovered voltage
on the meridians at
φ = 0° and
φ = 90° are compared with those of the directly measured one on the same meridians in
Figure 8 and
Figure 9. The same comments made on the reconstructions reported in
Figure 4 and
Figure 5, relevant to the prolate modeling case, hold. The FF cuts at
φ = 0° and
= 90°, obtained from the NR NF samples, are then compared in
Figure 10 with those (references) obtained from the data directly measured on the NF grid for the standard NF/FFT [
15]. At last, for completeness, the comparison relevant to the FF cut at
φ = 90° is reported in
Figure 11. Also, in such a case, the FF recoveries are precise, thus proving the effectiveness of the NR NF/FFT with spherical spiral scanning for offset-mounted long AUTs adopting a rounded cylinder for modeling the antenna.
The number of employed NR NF data in this case is 983 (comprehensive of the 160 extra samples nearby the poles), much lower than those 1860 and 7320 necessary for the traditional NF/FFT [
15] in the onset and offset mounting cases, respectively.
For reader’s convenience, the bar graph comparing the numbers of samples required by the various approaches is shown in
Figure 12.


 ,
, 


