1. Introduction
The reclamation of post-mining areas, a mandatory responsibility of mining operators, requires the development of suitable strategies for reusing both open-pit and underground excavations.
For open-pit mines, reclamation is often focused on creating water reservoirs for recreational purposes. However, in the case of hard rock quarries, where steep and high rock slopes predominate, reclamation pathways must be adapted to the site’s specific characteristics. Accordingly, reclamation in such settings often emphasises natural landscape restoration, landscape-recreational functions, and educational and geotouristic opportunities.
When properly executed, the urban and spatial transformation of post-mining sites may significantly enhance their visual and functional value. However, for quarries intended for public access, ensuring safe usage conditions is essential, thus making slope stability a critical design and management concern. This issue is particularly challenging due to the need to account for previous mining-induced disturbances, the integrity of the rock mass, and the long-term stability of the slopes. Furthermore, it is vital to minimise the risks associated with slope failures and rockfalls to protect the public and prevent potential injuries.
The present study focuses on the former quarry of thick-bedded limestones with chert nodules, historically referred to as “Twardowski’s School”, and later redeveloped into Bednarski Park. Quarrying operations at this site date back to medieval times and officially ceased in 1884, although extraction in the southeastern section continued for a short period thereafter [
1]. On 19 July 1896, the former quarry was officially transformed into a municipal park, subsequently named Bednarski Park. Given its current recreational and public functions, ensuring the geotechnical stability of the rock slopes is a fundamental requirement to guarantee safe long-term use and public access.
Geological structures and joint systems are key factors influencing the stability and quality of rock masses [
2,
3,
4,
5,
6,
7,
8,
9,
10,
11,
12,
13,
14,
15]. This research indicates that the orientation of geological joint sets reduces the rock mass strength, with steeply dipping features contributing most significantly to this effect [
16,
17,
18,
19]. When multiple sets of discontinuities with varying orientations are present within the rock mass, their precise characterisation becomes crucial for assessing slope stability, as these features directly influence the potential failure mechanisms and loss of stability. Therefore, the accurate identification and reconstruction of joint orientations, as well as comprehensive characterisation, are fundamental for reliable rock slope stability analysis [
15,
20,
21,
22,
23,
24]. At the same time, it is essential to recognise the substantial uncertainty involved in determining the joint parameters. Several authors have emphasised this issue [
25], suggesting that confidence intervals should be assigned to discontinuity properties rather than using fixed numerical values.
In numerical stability assessments, discontinuities are mostly considered indirectly by implementing the Hoek–Brown failure criterion for fractured rock masses [
11,
19,
26,
27,
28,
29,
30,
31,
32,
33]. This approach treats the rock mass as a continuous medium with appropriately modified strength properties. When the Geological Strength Index (GSI) classification is applied, the parameters required for the Hoek–Brown criterion can be derived. These parameters are usually converted into Mohr–Coulomb parameters for practical calculations. However, such an approach does not account for the layered discontinuities or the specific orientations of joint systems. Consequently, while stability conditions may be assessed, the predicted failure mechanisms may differ significantly from those observed, particularly in terms of the actual geometry of the slip surface. Kinematic analysis is an alternative method that facilitates the identification of failure mechanisms (such as wedge, toppling, or planar failures) within selected areas. This empirical approach focuses on predicting potential failure types based on the physical characteristics of the material, slope geometry, and geological structures, often utilising stereographic projections [
34,
35].
This paper presents calculations that combine advanced numerical analyses with realistic representations of rock slope failure mechanisms by explicitly incorporating discontinuity systems into the numerical models. To describe the behaviour of soils and rocks, the Mohr–Coulomb and Hoek–Brown constitutive models are used, with discontinuities explicitly incorporated into the rock mass. Joints are separated from each other by intact rock material (rock bridges). The joint is represented by normal and shear stiffness between two planes that may come into contact with each other. The joint constitutive model is the generalisation of the Coulomb friction law. Both shear and tensile failure are considered.
This enabled the identification of actual failure mechanisms and the accurate calculation of stability indices using a single computational tool. The analyses were conducted as part of a comprehensive geological, geotechnical, and geomechanical expert study of the rock walls in the former quarry in Wojciech Bednarski Park. This study was commissioned in connection with the construction works planned within the scope of the park’s revitalisation project [
36].
2. Objective of the Analysis and Study Area Location
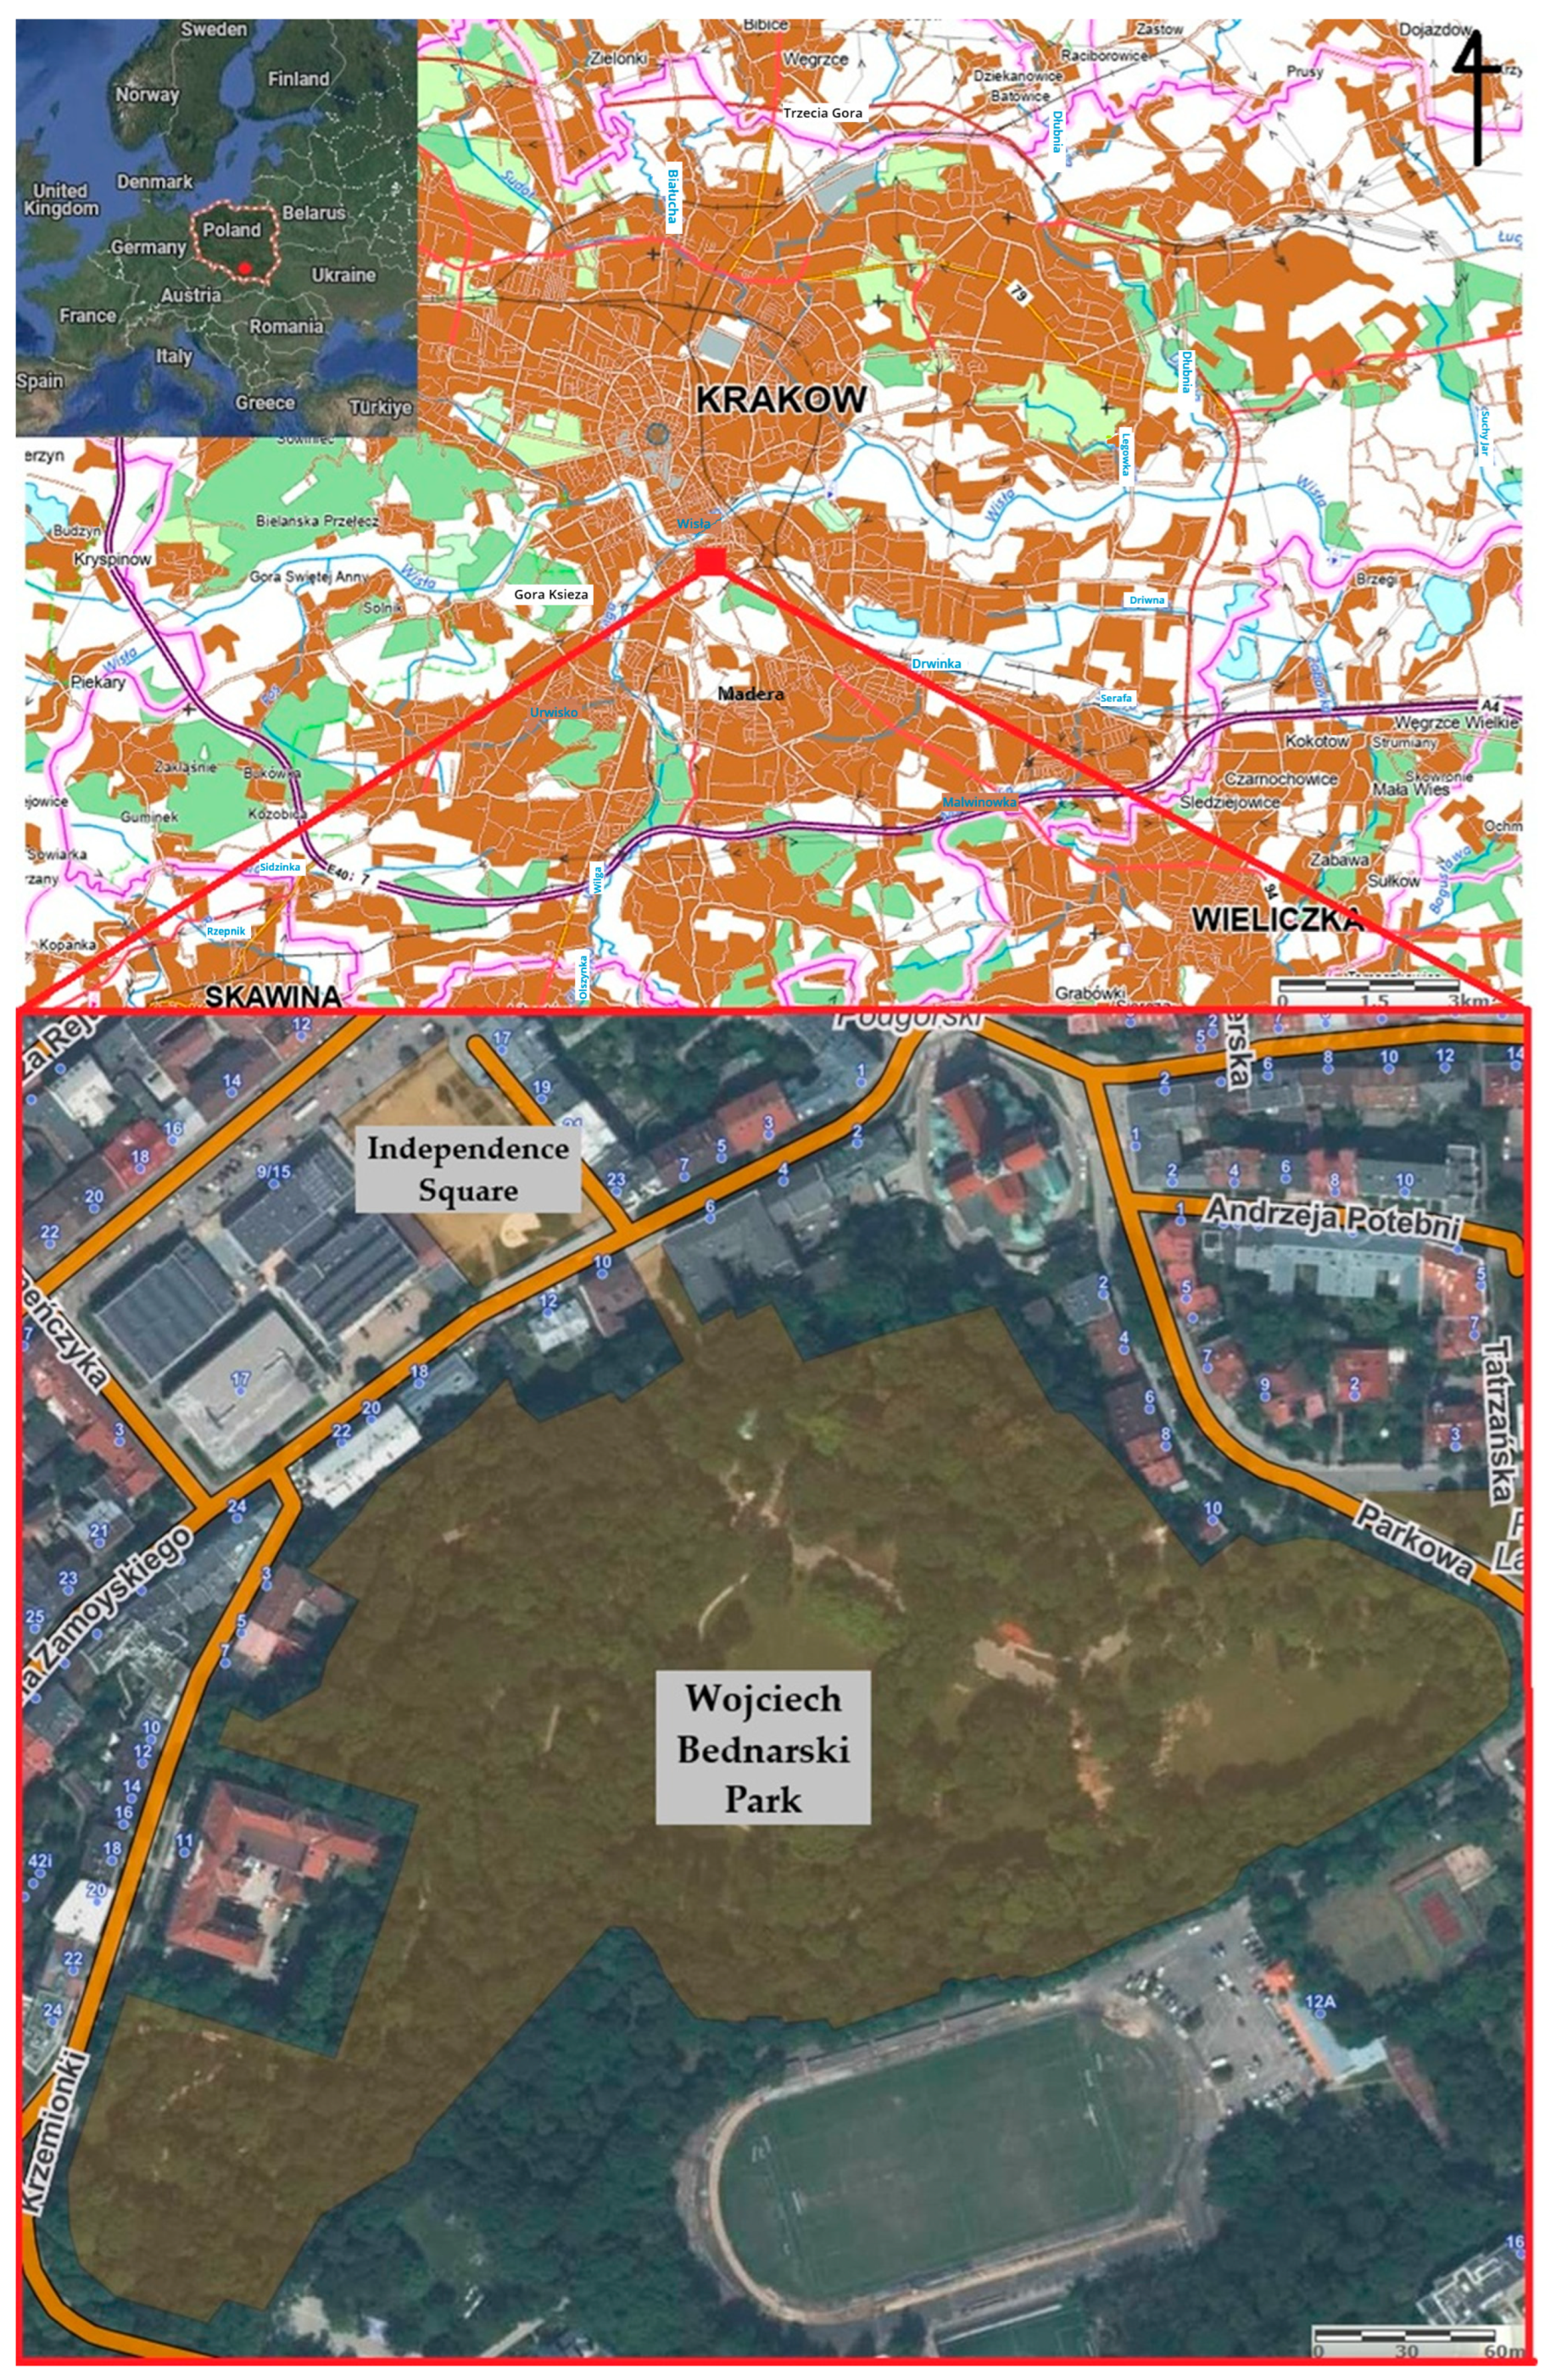
A stability assessment of selected rock slope sections was conducted as part of the revitalisation project for Wojciech Bednarski Park in Kraków (
Figure 1). The primary objective of this analysis was to identify areas requiring stabilisation measures and to propose appropriate recommendations for each designated section to ensure the safe public use of the park. Given that the analysed rock walls were characterised by numerous joint sets and fault zones, often accompanied by tectonic breccias, it was decided to incorporate the observed discontinuity sets into the stability assessment. To achieve this, a comprehensive inventory of the rock slopes and outcrops within Bednarski Park was carried out, including an evaluation of the weathering degree of the rock mass, joint mapping on exposed surfaces, the documentation of detached blocks (defining their potential impact range), and the delineation of slope segments with similar geological and geomechanical characteristics.
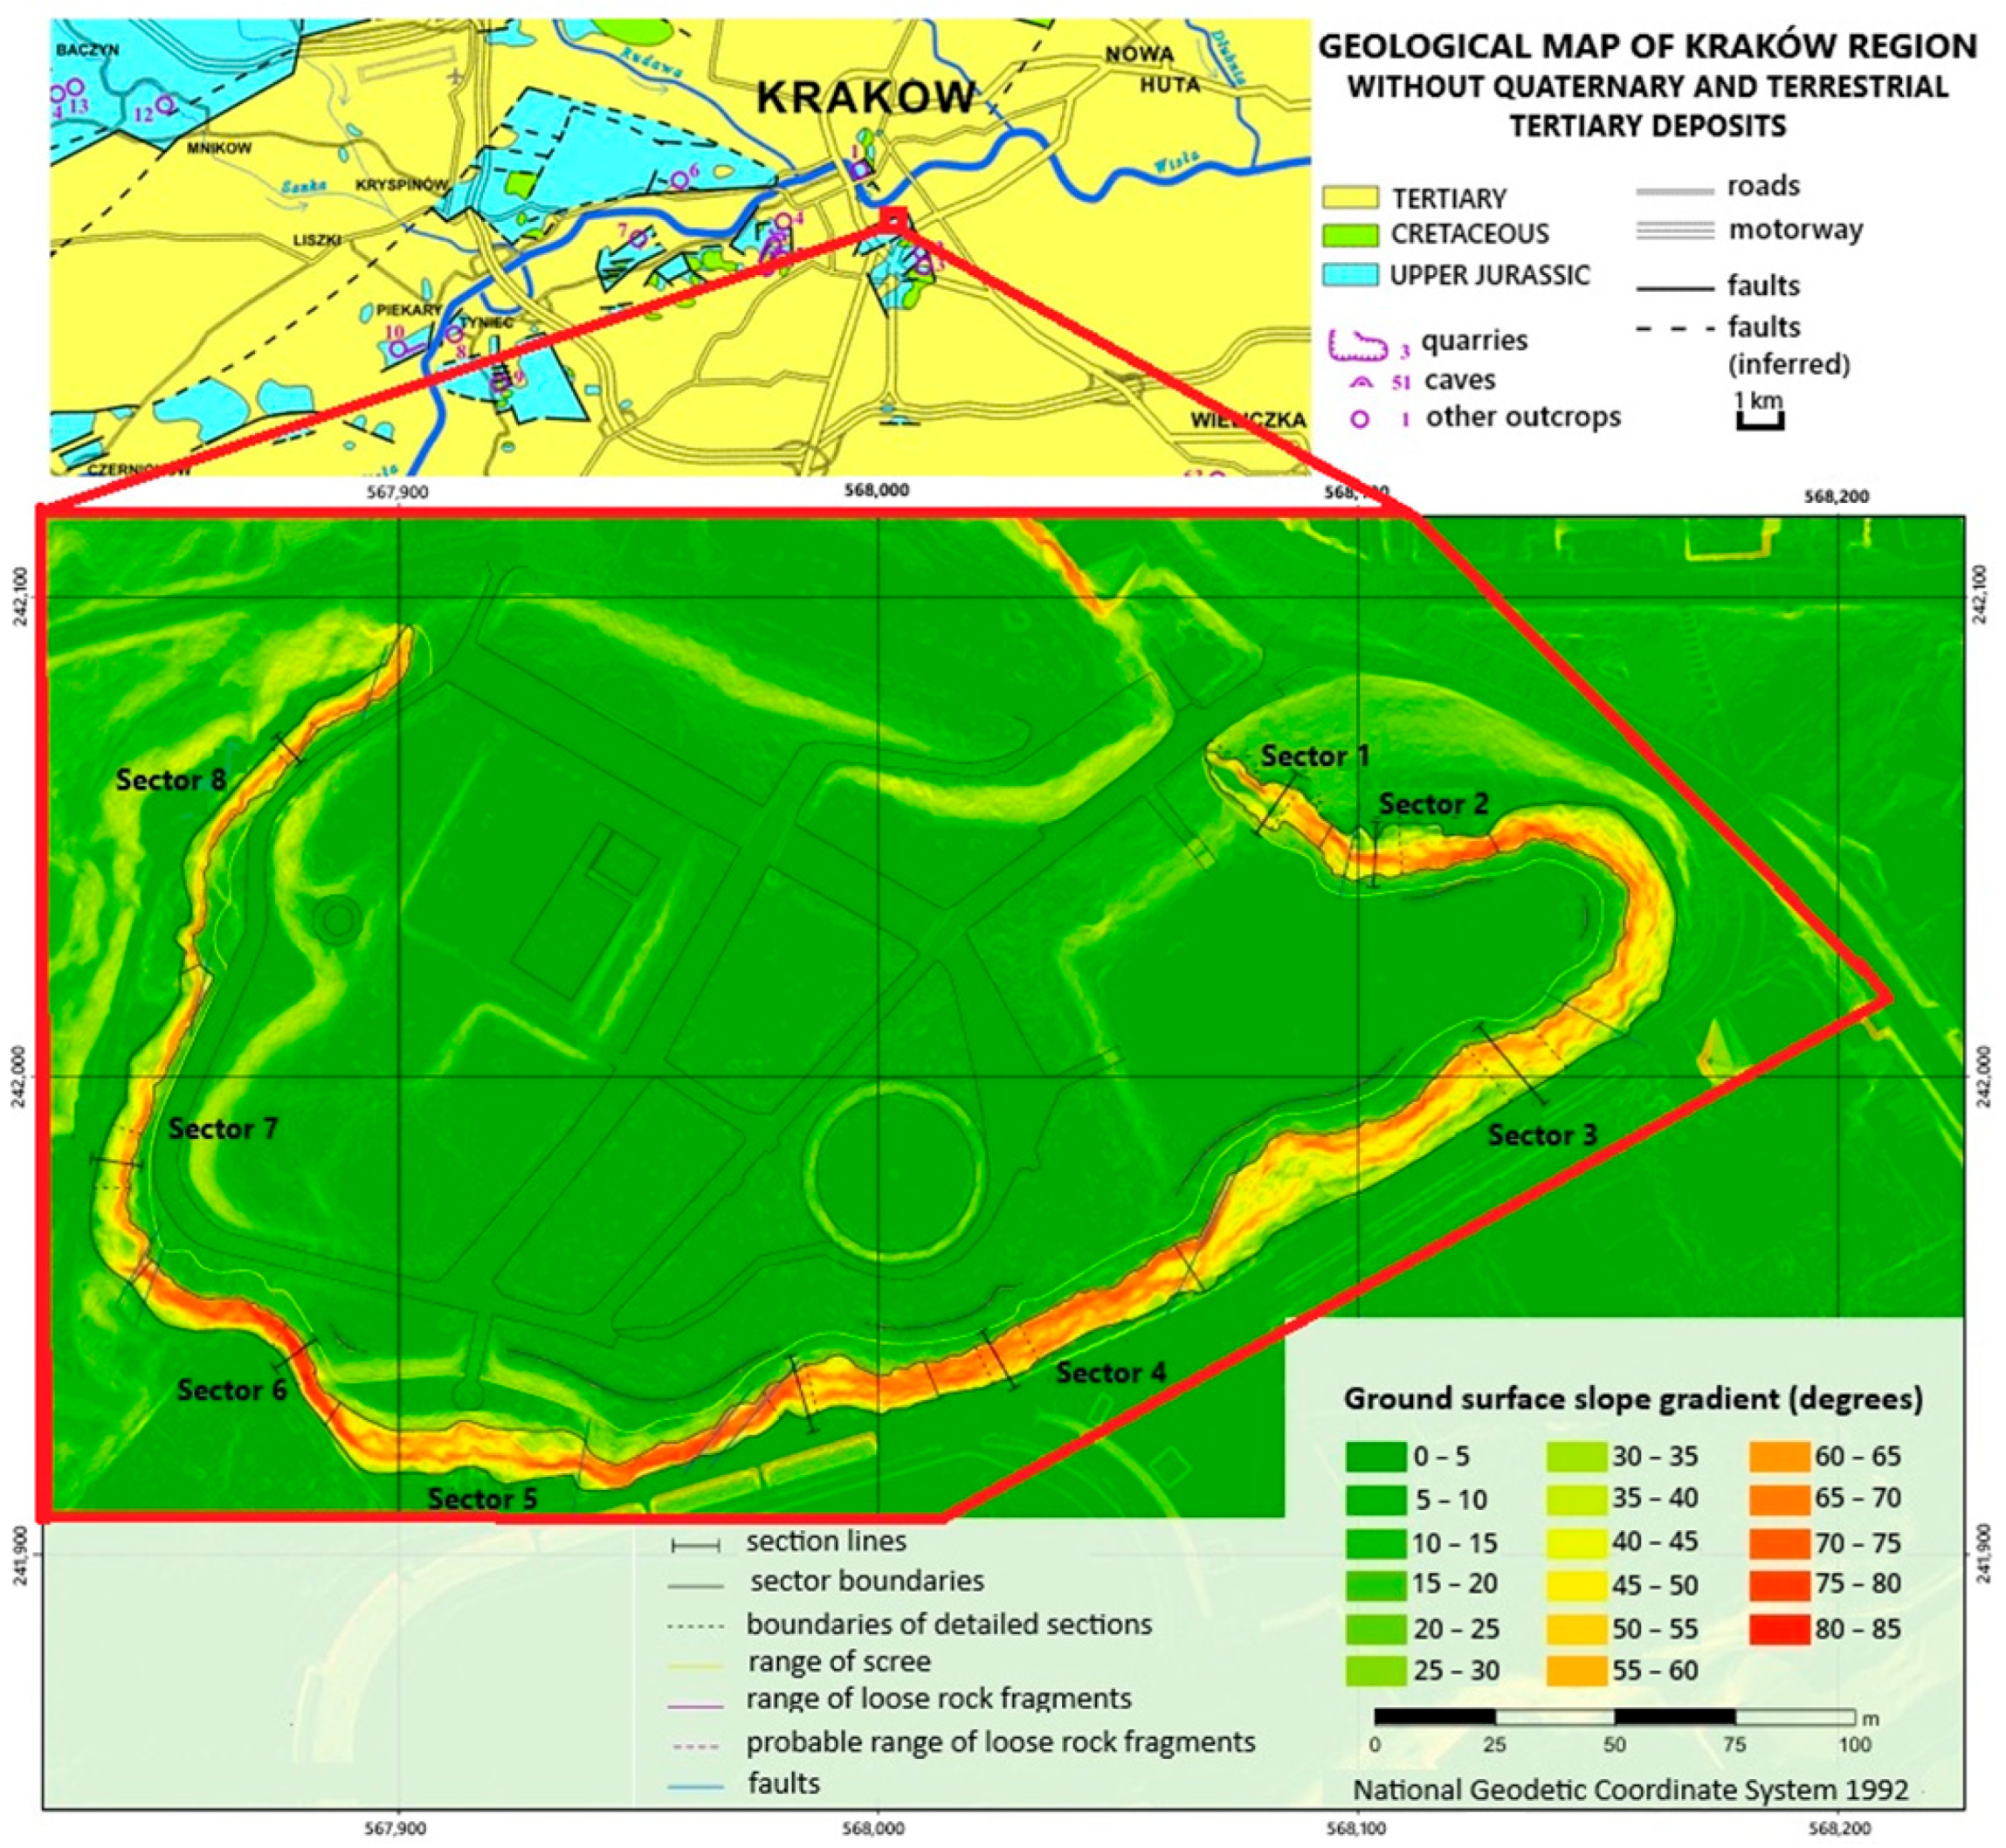
Eight sectors were defined (
Figure 2) based on several factors, including slope height, the presence of an inclined weathered cover above the rock wall, the distribution of joint sets, the occurrence of loosely attached rock fragments (of up to several centimetres in size), and unstable rock blocks exceeding 0.2 m within the wall. These sectors were also classified according to the degree of weathering of the rock mass. In the subsequent stage, detailed stability analyses were conducted for each of the selected sectors.
3. Geology
The study area is geologically situated within the Carpathian Foredeep, which borders other major structural units—the Silesian–Kraków Monocline to the north and the Miechów Trough, as well as the Carpathians, to the south [
40,
41,
42,
43]. Wojciech Bednarski Park is situated within the Podgórze Horst, one of several tectonic horsts in the Kraków region, which is separated from adjacent tectonic grabens by faults. Upper Jurassic deposits dominate the lithological composition of these tectonic horsts. In the Kraków area, the Upper Jurassic strata reach a thickness of approximately 250 m and generally include both massive and bedded facies. These sediments are part of microbial–sponge megafacies [
44,
45]. The bedded limestones commonly contain chert nodules and are generally developed as pelitic–bioclastic deposits, bioclastic grainstones, and microbial–sponge biostromes (e.g., [
44,
45,
46,
47]). The presence of silicified Upper Jurassic deposits is common in the Kraków area [
42,
44,
45,
48,
49].
The slopes of the former quarry within Wojciech Bednarski Park in Kraków are composed of rocks overlain by a weathered mantle. Exposed in the rock walls are thick-bedded and medium-bedded Upper Jurassic limestones with chert nodules, which often emphasise the bedding planes. These limestones dip gently to the east at approximately 2°. The quarry slopes exhibit considerable variability in height, inclination, degree of weathering, and vegetation cover. The slope heights range from approximately 1 m to 16.6 m, with inclinations typically between 44° and 70°. Locally, vertical rock walls and occasional overhangs are observed. The rock faces are characterised by numerous joint sets and faults, often accompanied by tectonic breccias. At the top of the limestone sequence lies a weathered mantle (clayey rubble) with a thickness reaching up to approximately 3.0 m, overlain by quaternary cohesive soils (sandy clays and clayey sands) in a stiff plastic consistency state. Loose rock blocks and debris are present on the surface of the weathered material.
Mass wasting processes, including rockfalls and creep of the weathered mantle, have been observed on the quarry slopes within Bednarski Park. Numerous fresh detachment marks—indicated by lighter colouration than on the surrounding rock—are visible on the walls, evidencing recent block falls and rock debris movement. The accumulated material forms talus cones at the base of the slopes, extending along their entire length (approximately 630 m). A significant geohazard is represented by the creeping of the weathered cover over the bedrock along the inclined slopes above the rock walls. This creeping process may result in displacements of several centimetres per year in the near-surface weathered layer.
Figure 3,
Figure 4,
Figure 5 and
Figure 6 present selected sections of the rock walls in the analysed sectors, including 3D visualisations generated based on a 0.25 m resolution LiDAR-derived Digital Terrain Model (DTM) [
50].
4. Characterisation of the Fracture Network
A dense network of fractures is an essential factor contributing to the detachment of rock fragments from the quarry walls within Bednarski Park. Particularly unfavourable are fractures whose surfaces are parallel or nearly parallel to the exposed rock faces, with spacing typically not exceeding several tens of centimetres. Often, the inclination of the rock wall corresponds closely to the dip of these parallel fractures. Such structural arrangements pose a significant risk of the relatively shallow sliding of individual rock blocks and deeper, structurally controlled slope failures.
As part of the investigation, a detailed characterisation of the fracture network was conducted for each defined sector (
Figure 2). The fractures were classified into distinct joint sets (A–E), and stereographic projections of these sets were generated (
Figure 7—example projections for Sector 1). The field investigations and joint set classification were conducted based on the guidelines of the PN-EN ISO 14689 standard [
51].
To incorporate joint sets into the numerical analyses, the orientation parameters of each joint set (dip direction, dip angle, and spacing) were averaged, as determined through detailed mapping within each sector (
Figure 7). The averaging process was applied to discontinuities that exhibited similar dip directions and dip angles to ensure representative values for modelling purposes. The summarised orientation parameters of the joint sets are presented in
Table 1.
5. Mechanical Parameters of the Rock Mass and Discontinuity Sets
The strength parameters of the limestone rock mass were determined based on the following assumptions:
Geological Strength Index (GSI) of 100;
Hoek–Brown constant mi equal to 9;
Disturbance factor D equal to 0.8;
Modulus ratio MR of 900;
Unit weight of 25.11 kN/m
3 [
52,
53];
Average uniaxial compressive strength ranging from 26.2 MPa to 35.1 MPa (determined based on Schmidt hammer rebound values);
Slope height ranging from 7 m to 18 m (depending on the sector).
The parameters for weathered limestone were determined analogously, except that the average compressive strength of the fractured zone (9.2 MPa, based on rebound index measurements) and a unit weight of 24.13 kN/m
3 [
52,
53] were used.
The determined parameters of the limestone rock mass are summarised in
Table 2.
Given that the analysed rock mass is highly fractured, the computations incorporated the discontinuity systems identified through geological mapping (
Table 1). The strength parameters of the discontinuities (cohesion and internal friction angle) were assigned based on the type of infill observed (
Table 1). If multiple types of infill occurred within a given discontinuity set, the parameters corresponding to the predominant infill type were applied in the analysis. The following infill types and parameter estimation methods were adopted:
Humus—parameters were derived from those of silty clay reported in the geological report [
42], with a reduction factor of 0.6 applied to compute design values;
Karst breccia/karst—the parameters were determined assuming a Geological Strength Index (GSI) of 20, a wall height specific to the given sector, a material constant mi of 9, a disturbance factor D of 0.8, a modulus ratio MR of 900, a unit weight of 24.13 kN/m3, and the average compressive strength of the fracture zone characteristic of the respective sector;
Silica—the parameters were determined assuming a GSI of 100, the sector-specific wall height, a material constant mi of 9, a disturbance factor D of 0.8, a modulus ratio MR of 900, a unit weight of 25.11 kN/m3, and the average compressive strength of the fracture zone specific to the given sector;
No infill—parameters were based on the internal friction angle determined for the intact rock mass and reduced using coefficients dependent on aperture and roughness, as defined in PN-EN ISO 14689 [
51]:
0.95 for ‘partly open + rough’;
0.85 for ‘moderately wide/open + rough’;
0.75 for ‘wide + rough’;
0.80 for ‘partly open + smooth’;
0.70 for ‘moderately wide/open + smooth’;
0.60 for ‘wide + smooth’.
For these joints, cohesion was assumed to be zero.
The calculated strength parameters of the discontinuity zones are summarised in
Table 3.
The parameters of the soil layers considered in the analysis (gravelly sand, crushed stone, silty clay with cobbles, cobbles with medium and clayey sand, limestone debris, and weathered soils/weathered rock) were adopted based on the geological report [
52].
Given that the geological report [
52] provides characteristic parameter values determined following the PN-81/B-03020 standard [
54], material partial factors were additionally applied (γ
m = 0.9 for cohesion and internal friction angle, γ
m = 1.1 for unit weight). The resulting geotechnical parameters are summarised in
Table 4.
6. Assumptions for Computational Cross-Sections—Geometry and Geotechnical Stratigraphy
The geometry of the selected cross-sections was developed based on a hillshade-visualised Digital Terrain Model (DTM) generated from a LiDAR-derived point cloud obtained in 2017 [
50].
The geological structure and stratigraphic layering were determined using borehole logs from the geological report [
52], the geotechnical documentation [
53], and results from geological field mapping. Due to the limited borehole coverage in the study area, the thickness of the weathered layer was estimated based on field observations, and may differ from the actual values.
The developed computational cross-sections are presented in
Figure 8 and
Figure 9.
7. Classification of Slope Instability Hazard Levels and Description of the Calculation Method
The stability condition of the slopes was assessed using the following classification of landslide hazard levels [
55]:
FS ≥ 1.5—landslide occurrence is highly unlikely.
1.3 ≤ FS ≤ 1.5—landslide occurrence is unlikely.
1.0 ≤ FS ≤ 1.3—landslide occurrence is probable.
FS < 1.0—landslide occurrence is highly probable.
In engineering practice, a factor of safety (FS) greater than 1.5 is generally considered acceptable. However, since the analysed area constitutes a public space used by numerous city residents, a minimum FS of 1.5 was adopted as the threshold for safe conditions. A significantly higher safety level is recommended for large public gatherings and mass events, with a suggested FS exceeding 2.0.
Stability calculations were performed using a finite element method (FEM)-based programme dedicated to two-dimensional (2D) slope stability analysis. The factor of safety was determined using the shear strength reduction (SSR) technique [
56,
57,
58,
59,
60]. This method modifies the soil or rock mass as an elastic–plastic medium ruled by an associated or non-associated flow rule. The Coulomb–Mohr failure criterion was applied to define the yield surface for the cases analysed. In this context, the SSR method involves simultaneously reducing the internal friction angle (through tangent reduction) and cohesion. The SSR method enables the identification of the potential slip surface at the location where the limit state is first reached. Additional assumptions are introduced into the analysis to capture the progression of failure mechanisms and trace the subsequent development of slip surfaces.
For all calculation scenarios, displacement boundary conditions were applied by restricting horizontal displacements along the model’s sides and both horizontal and vertical displacements along the model’s base. Based on the analyses conducted, the slope factor of safety (FS) values were determined.
8. Simulation Results and Discussion
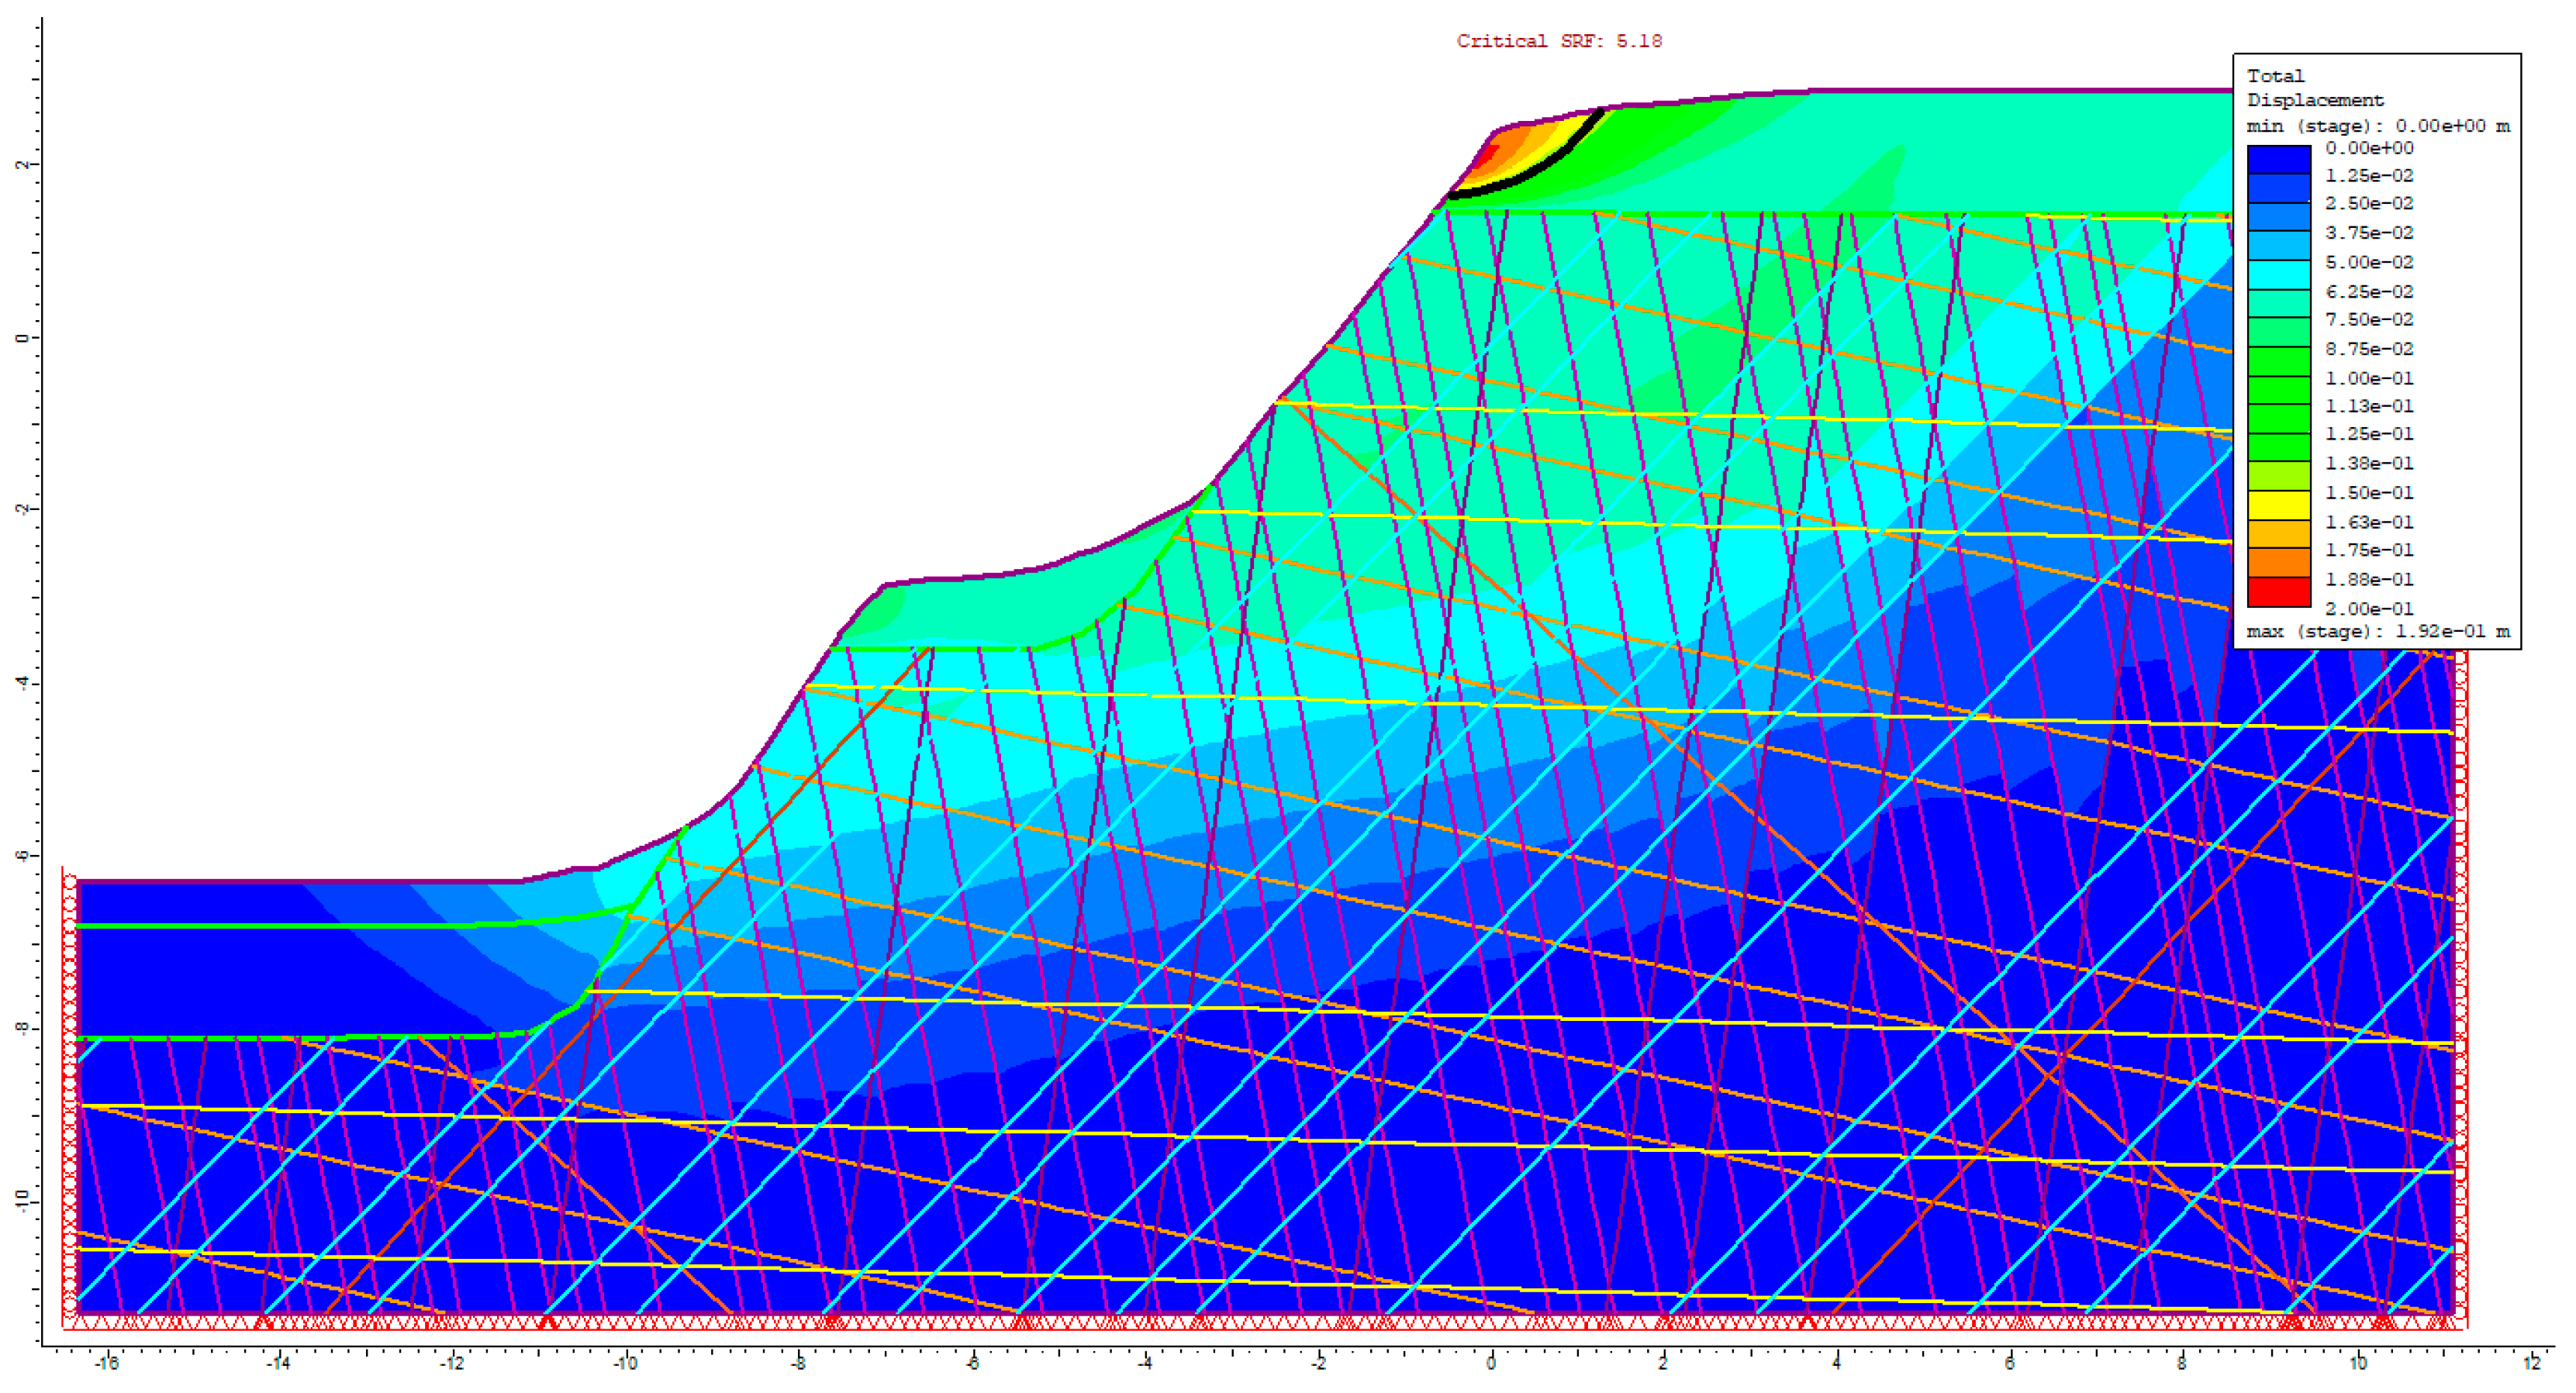
The calculations performed for the cross-section located in Sector 1 identified a potential slip surface within the weathered layers. However, the obtained factor of safety significantly exceeds the minimum safety threshold of 1.50, reaching a value of 5.18, indicating that the occurrence of landslides in Sector 1 is highly unlikely. Nevertheless, despite the high factor of safety, the possibility of the local detachment of smaller rock fragments or larger rock blocks cannot be entirely ruled out, particularly following winter periods or after intense or prolonged rainfall. The calculated factor of safety and the corresponding slip surface are presented in
Figure 10.
The slope stability calculations performed for Sector 2 yielded a factor of safety of 2.99. This value similarly indicates a very low probability of landslide occurrence, confirming stable and safe conditions. The potential slip surface was identified within the weathered material layers. Although the analysis returned a high factor of safety, the possibility of local block detachment or shallow debris slides in adverse conditions (such as spring thaw, prolonged heavy rainfall, or freeze–thaw cycles) cannot be entirely ruled out.
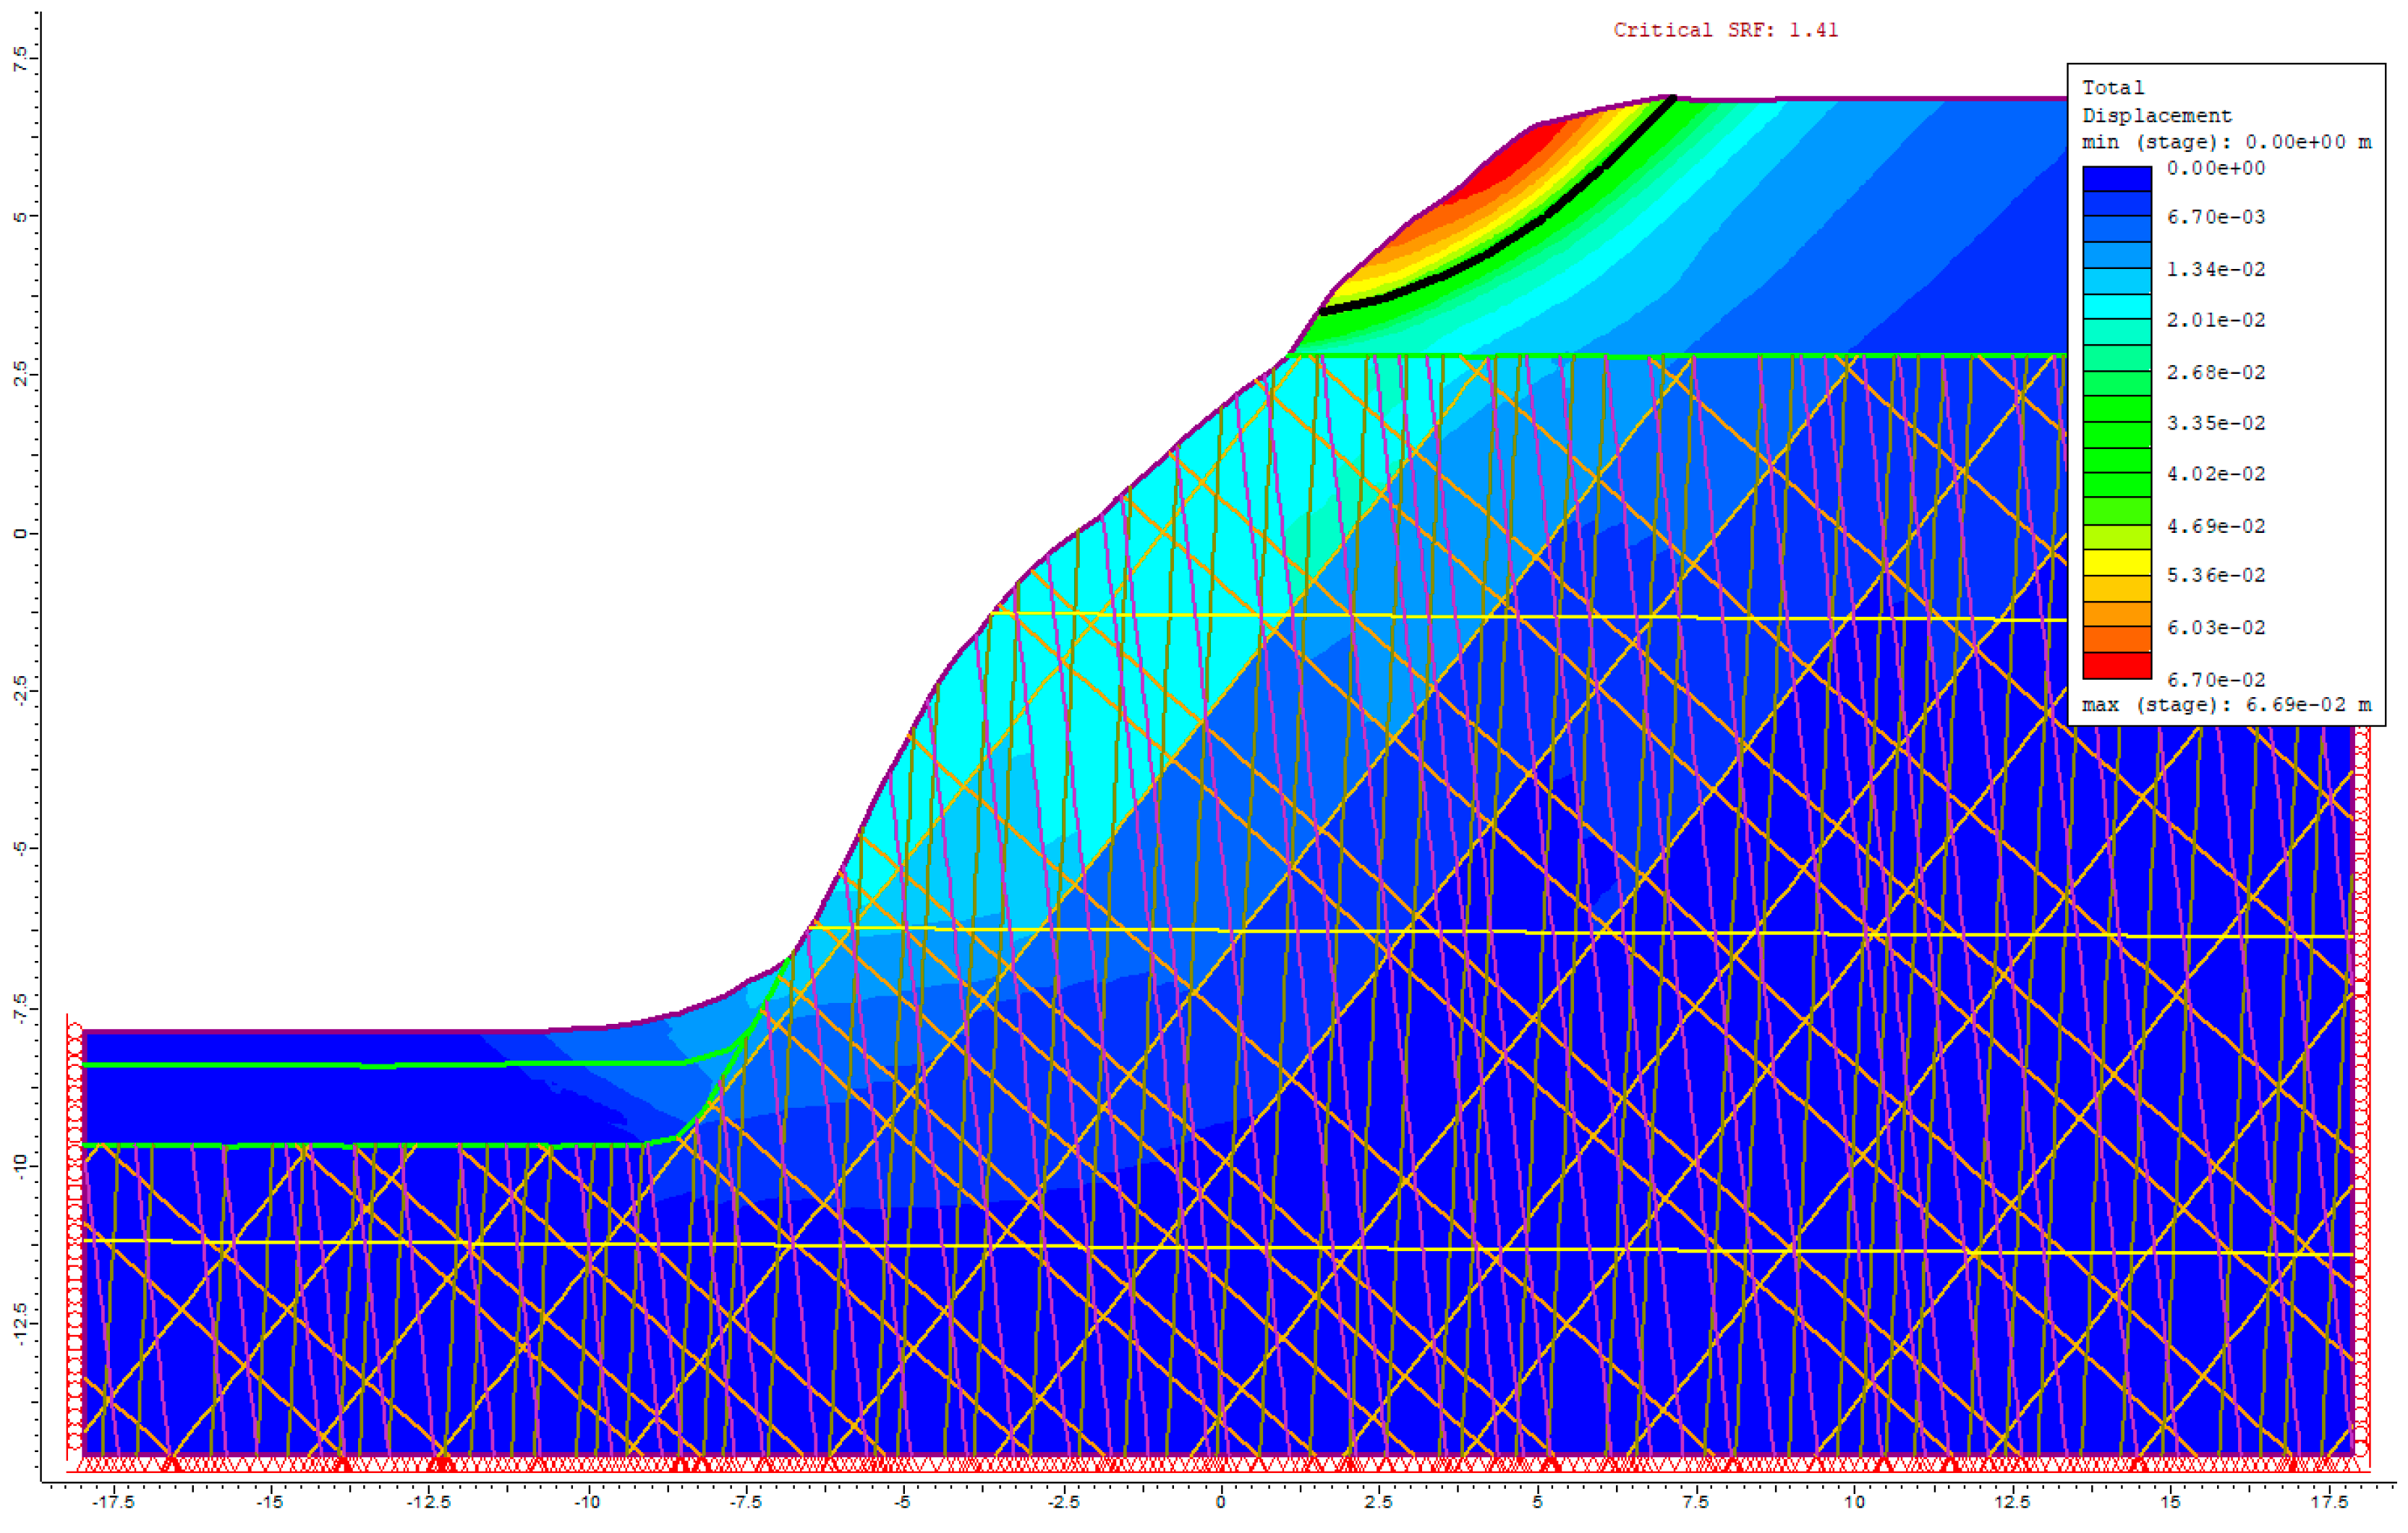
The calculation results for Sector 3 indicate a low probability of landslide occurrence, with a factor of safety of 1.41. The potential slip surface is located within the weathered layers. However, this factor of safety is lower than the accepted threshold for safe conditions (1.50).
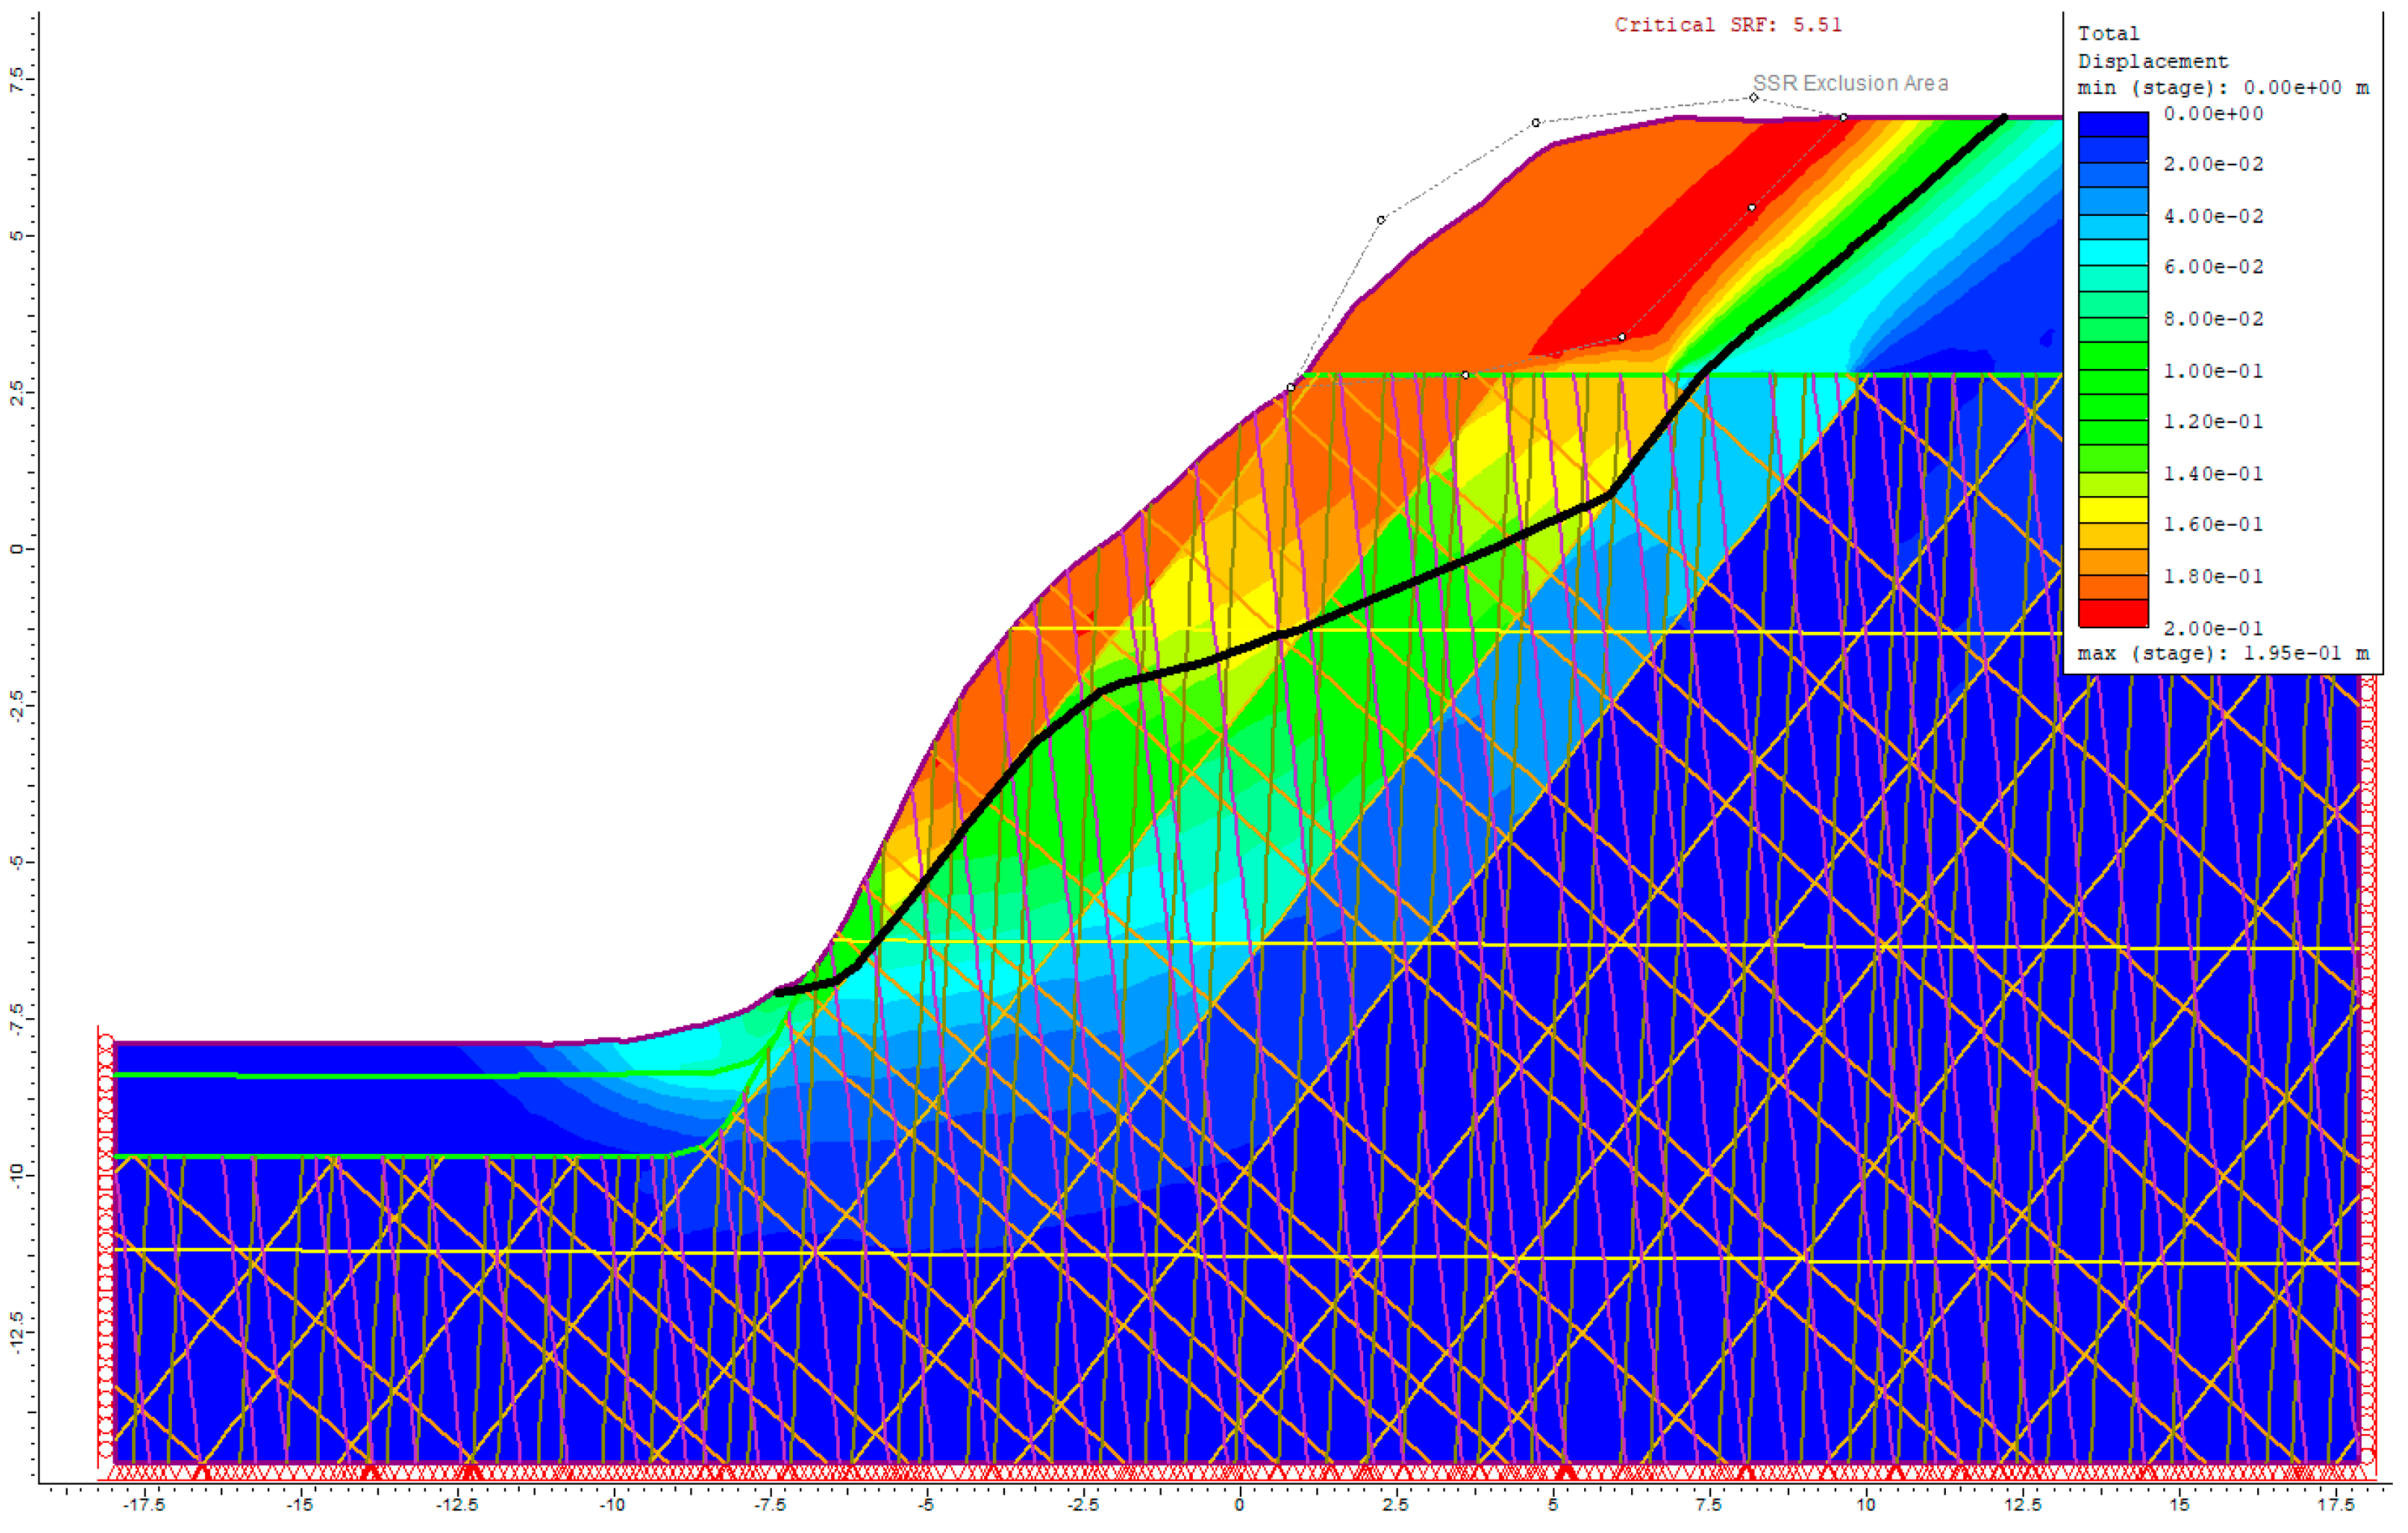
Given the FS value below 1.50 and the slip surface extending into the rock layers, additional calculations were carried out for Sector 3, excluding the weathered slope material. This analysis yielded a factor of safety of 5.51, indicating that landslide occurrence under these conditions is highly unlikely.
The calculated factor of safety values and the corresponding slip surfaces are presented in
Figure 11 and
Figure 12.
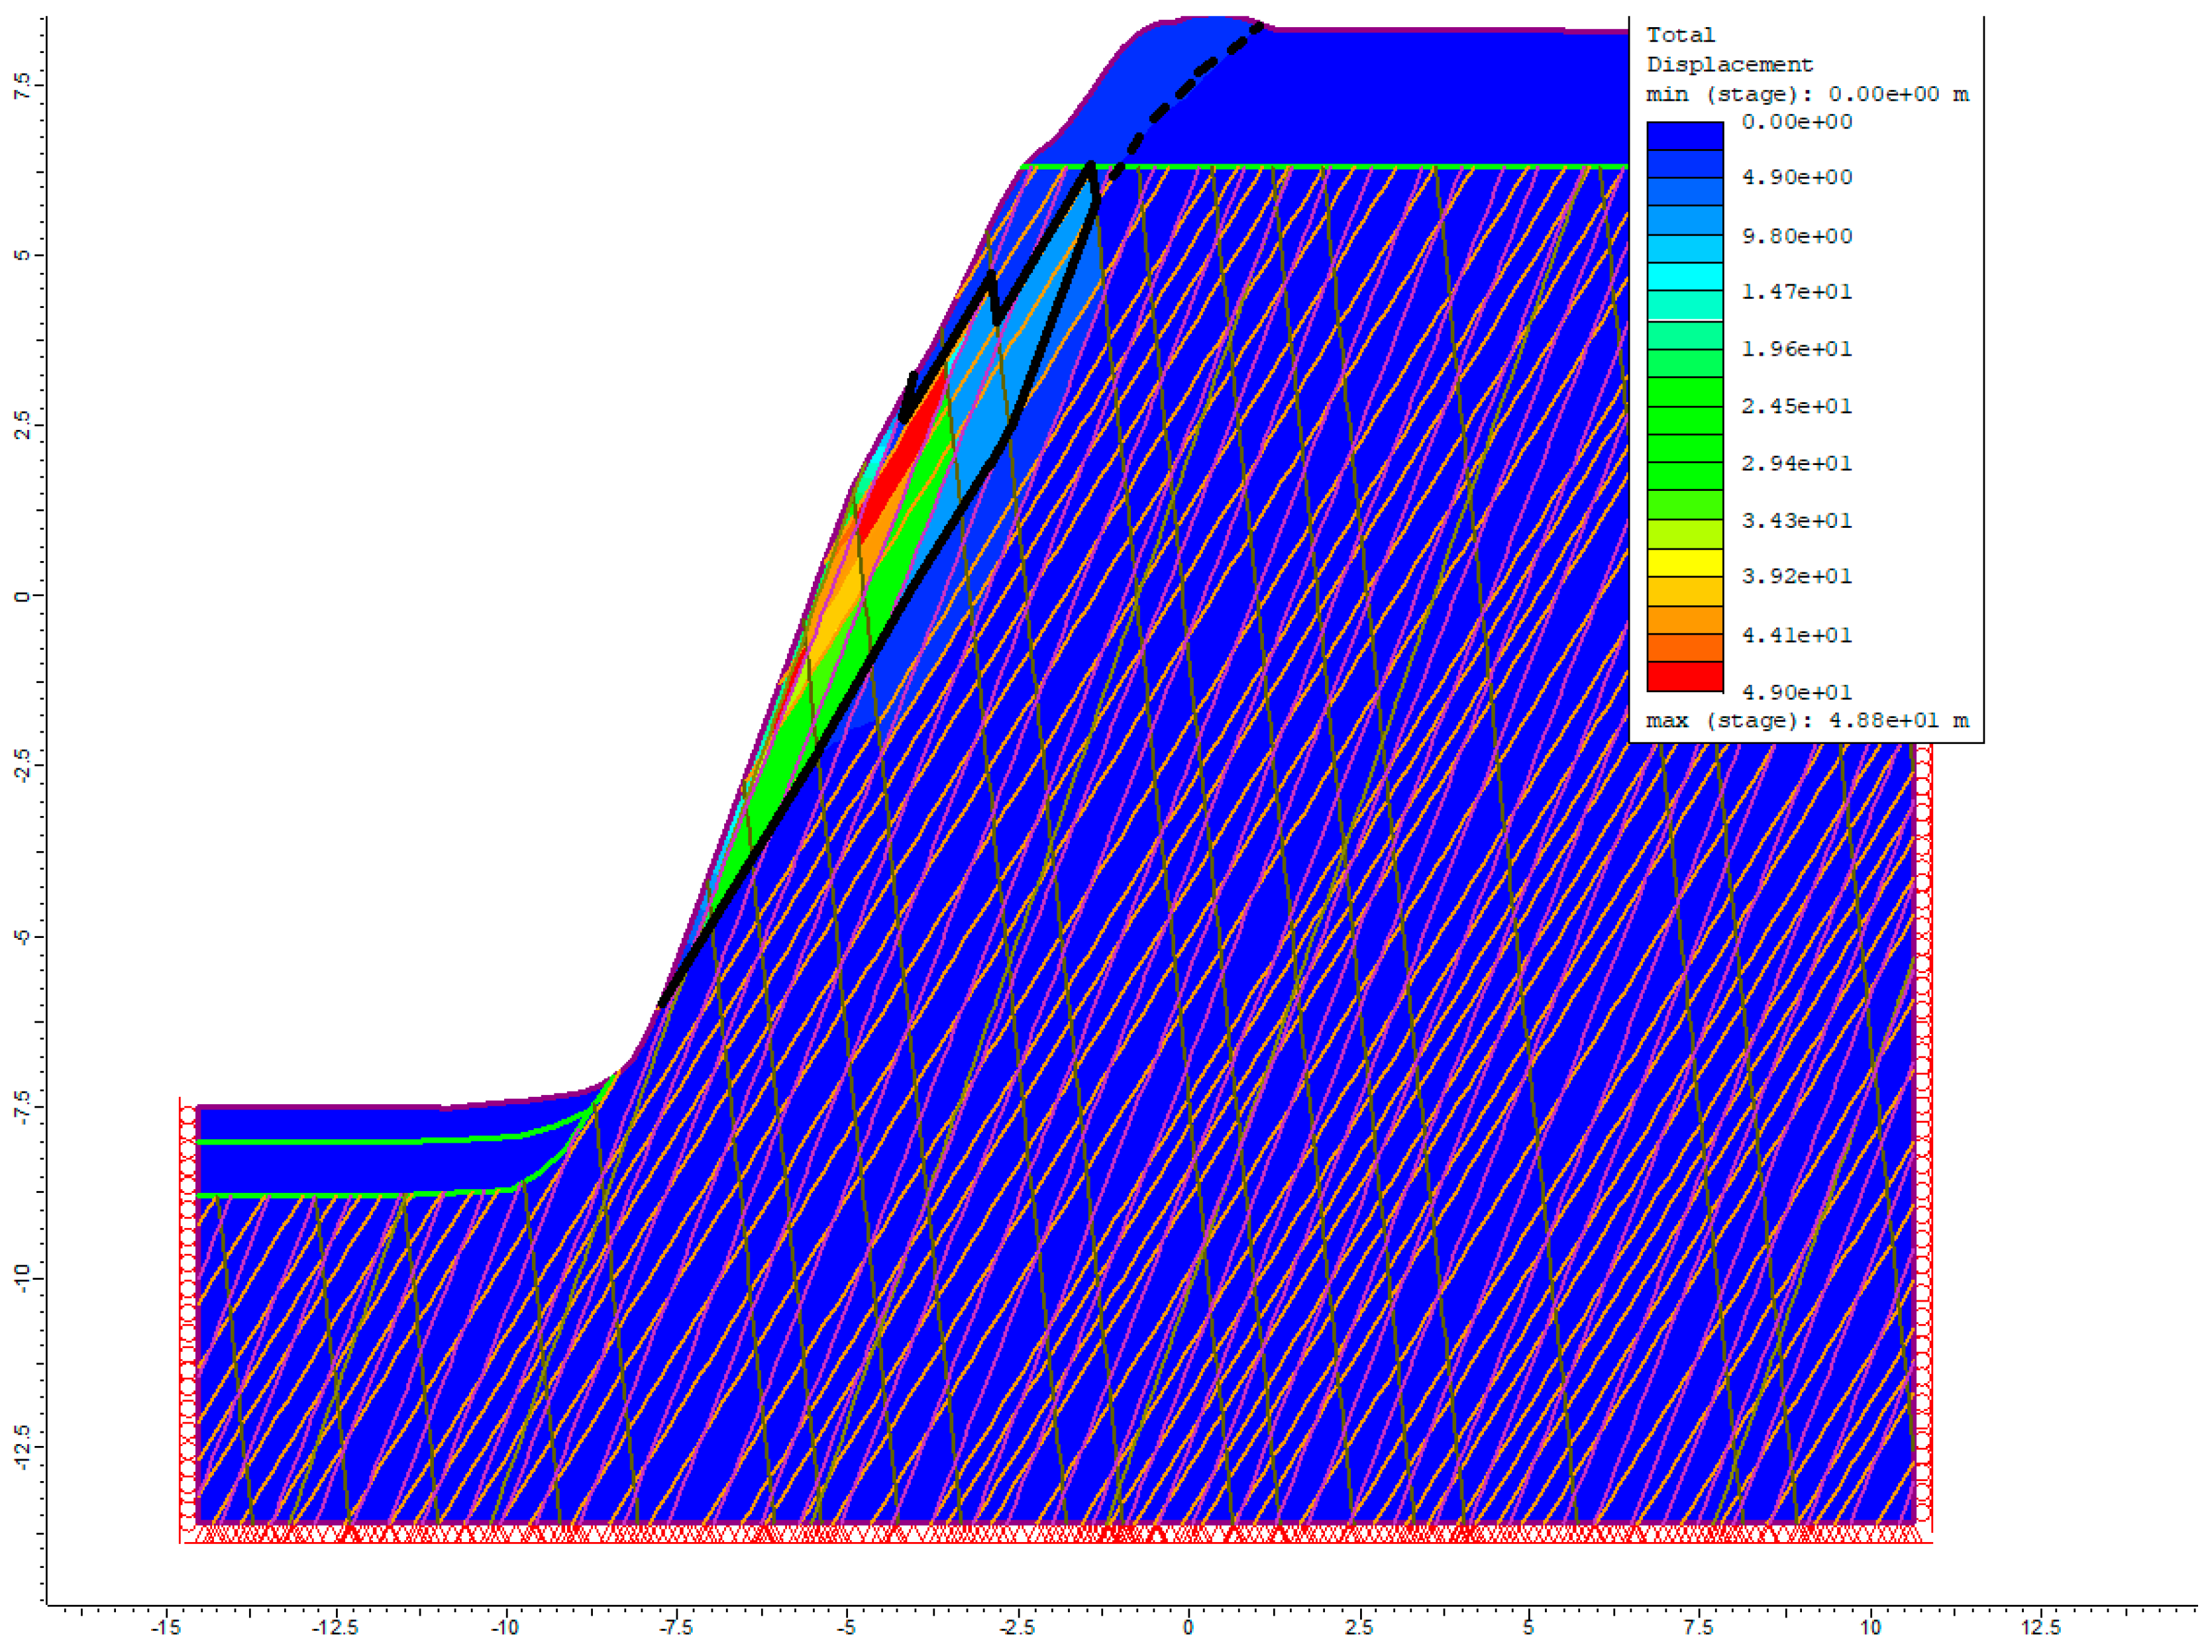
The identified slip surface for Sector 4, corresponding to the lowest calculated factor of safety, is located approximately at the mid-height of the rock wall (
Figure 13). Based on the stability analysis, there is a very high probability of landslide occurrence in this sector. The calculated factor of safety was so low that no numerical value could be assigned (FS << 1.0). This result is attributed to the modelled joint network and the failure mechanism, which involves the detachment and sliding of rock blocks occurring along the intersections of discontinuities, where immediate block separation and collapse are initiated.
The stability analysis results indicate the presence of unstable rock blocks and active slope failure processes in Sector 4. These findings are consistent with field observations obtained during the geological mapping campaign.
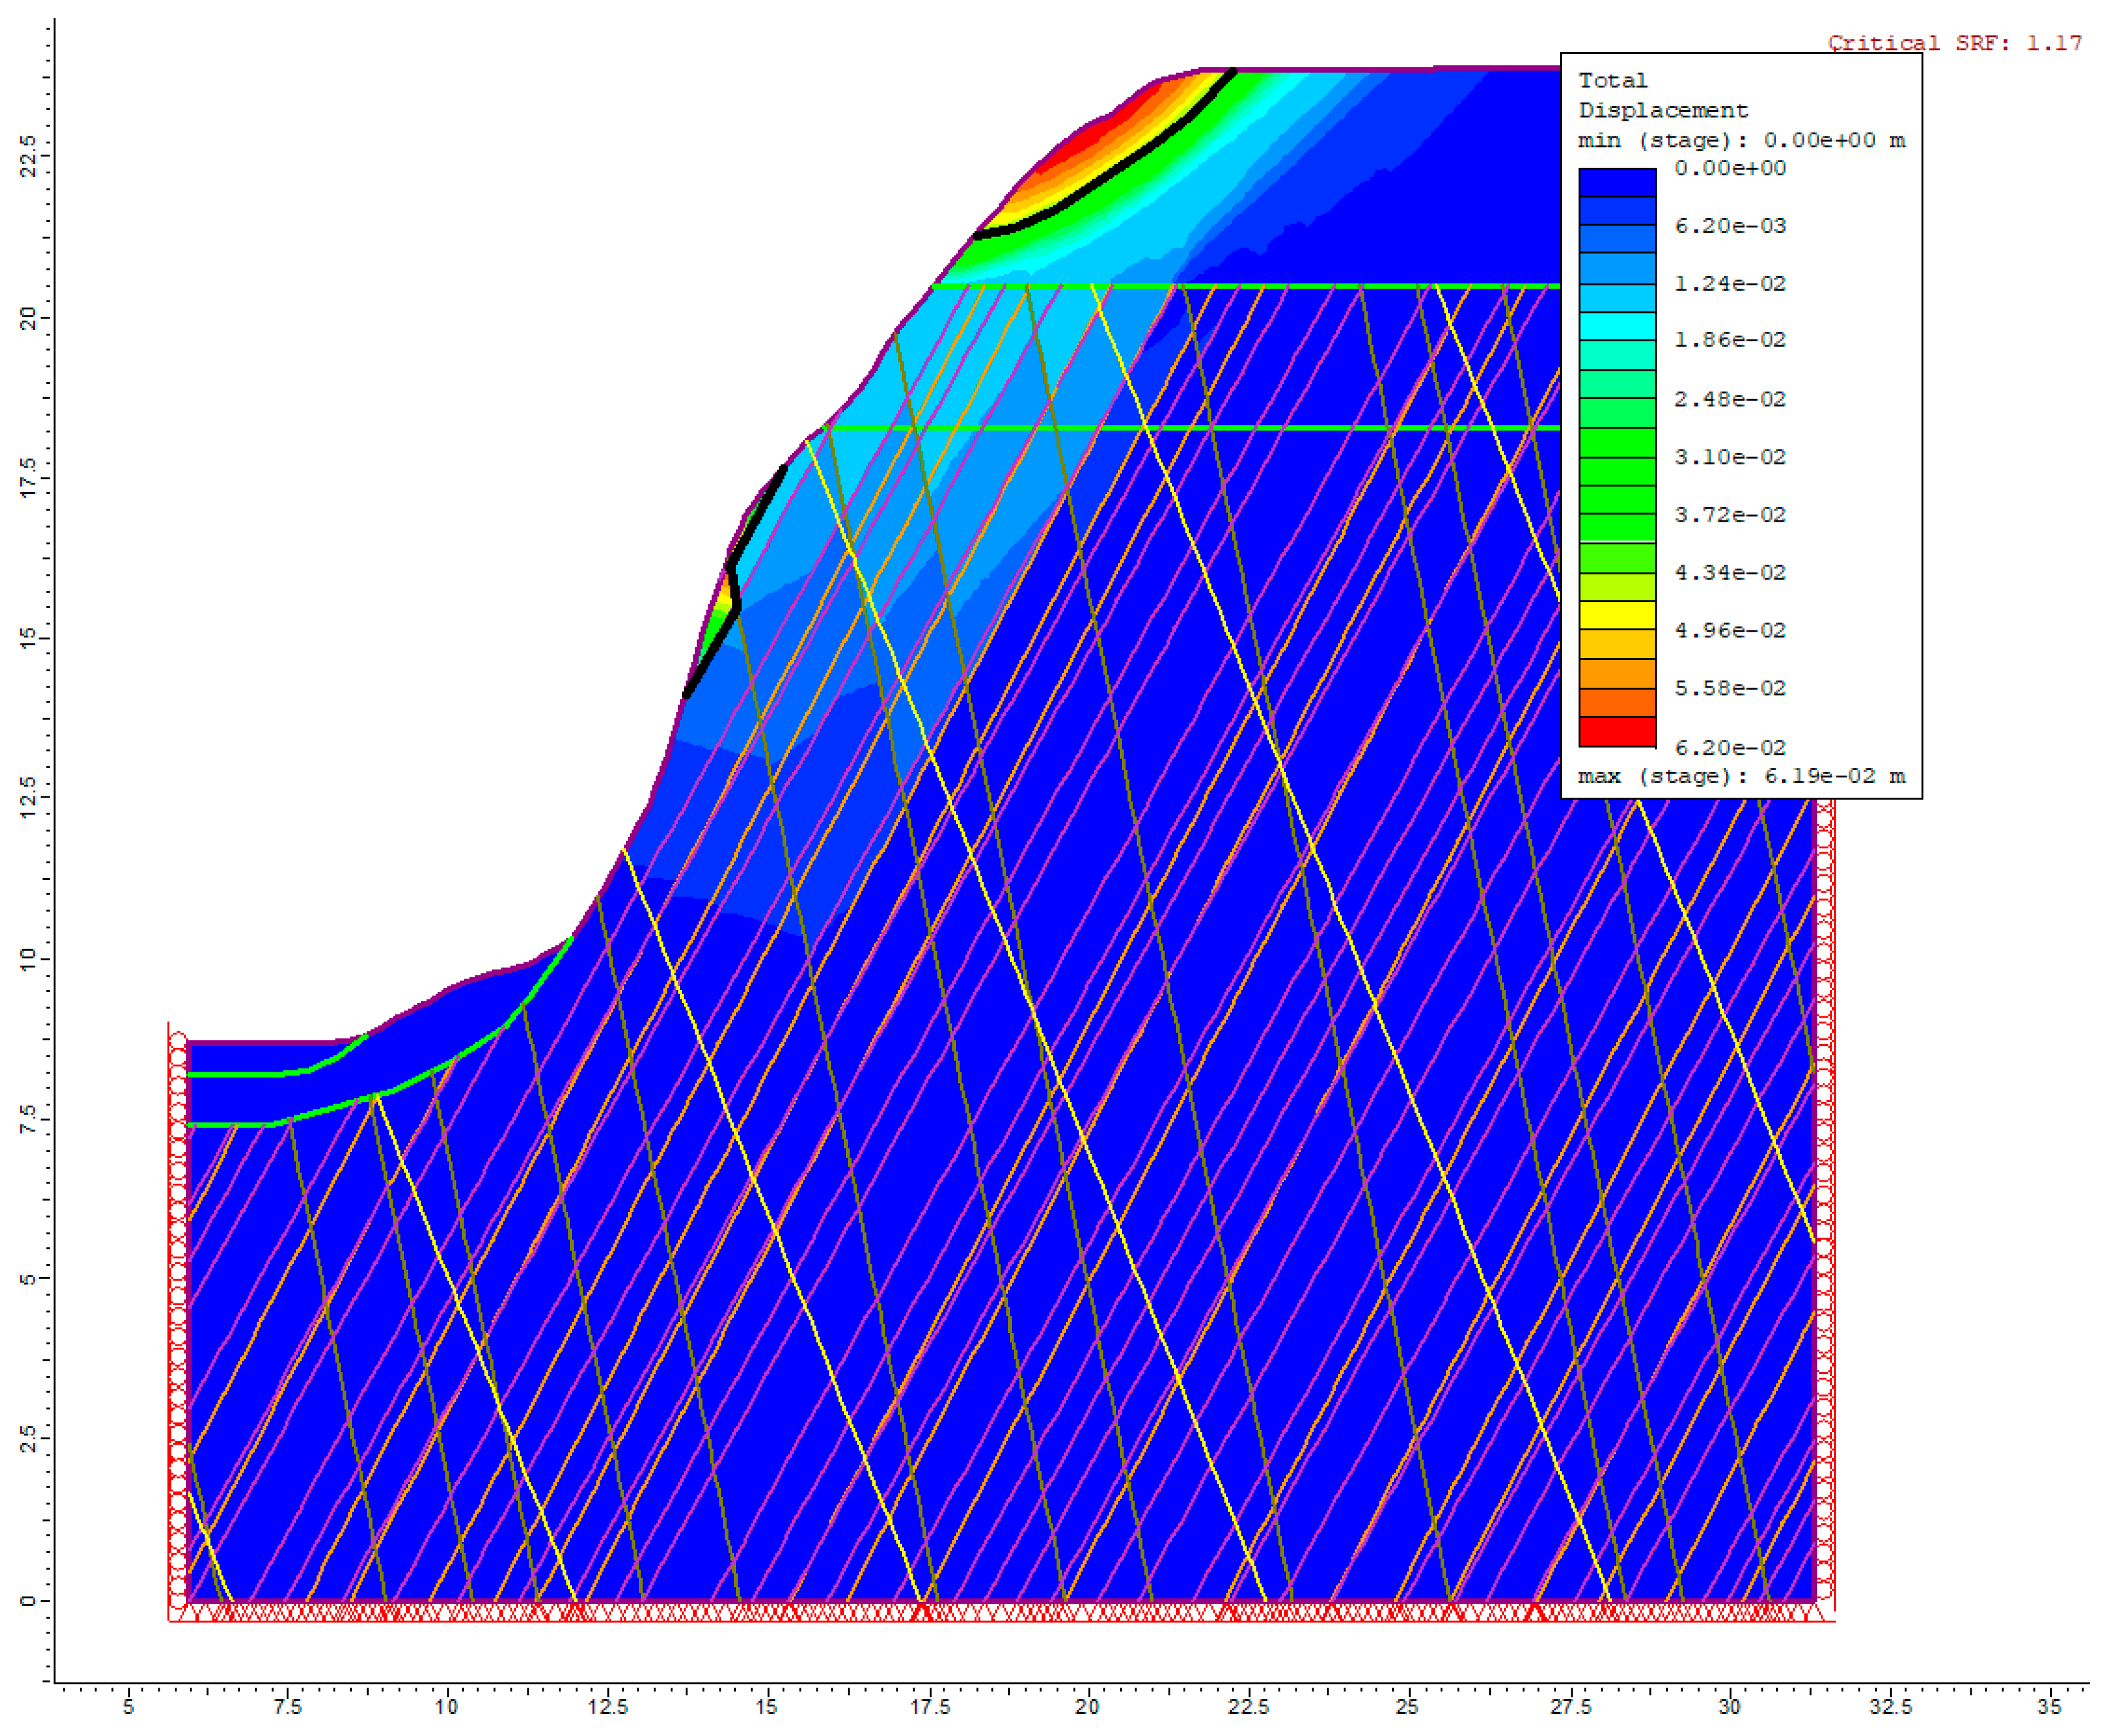
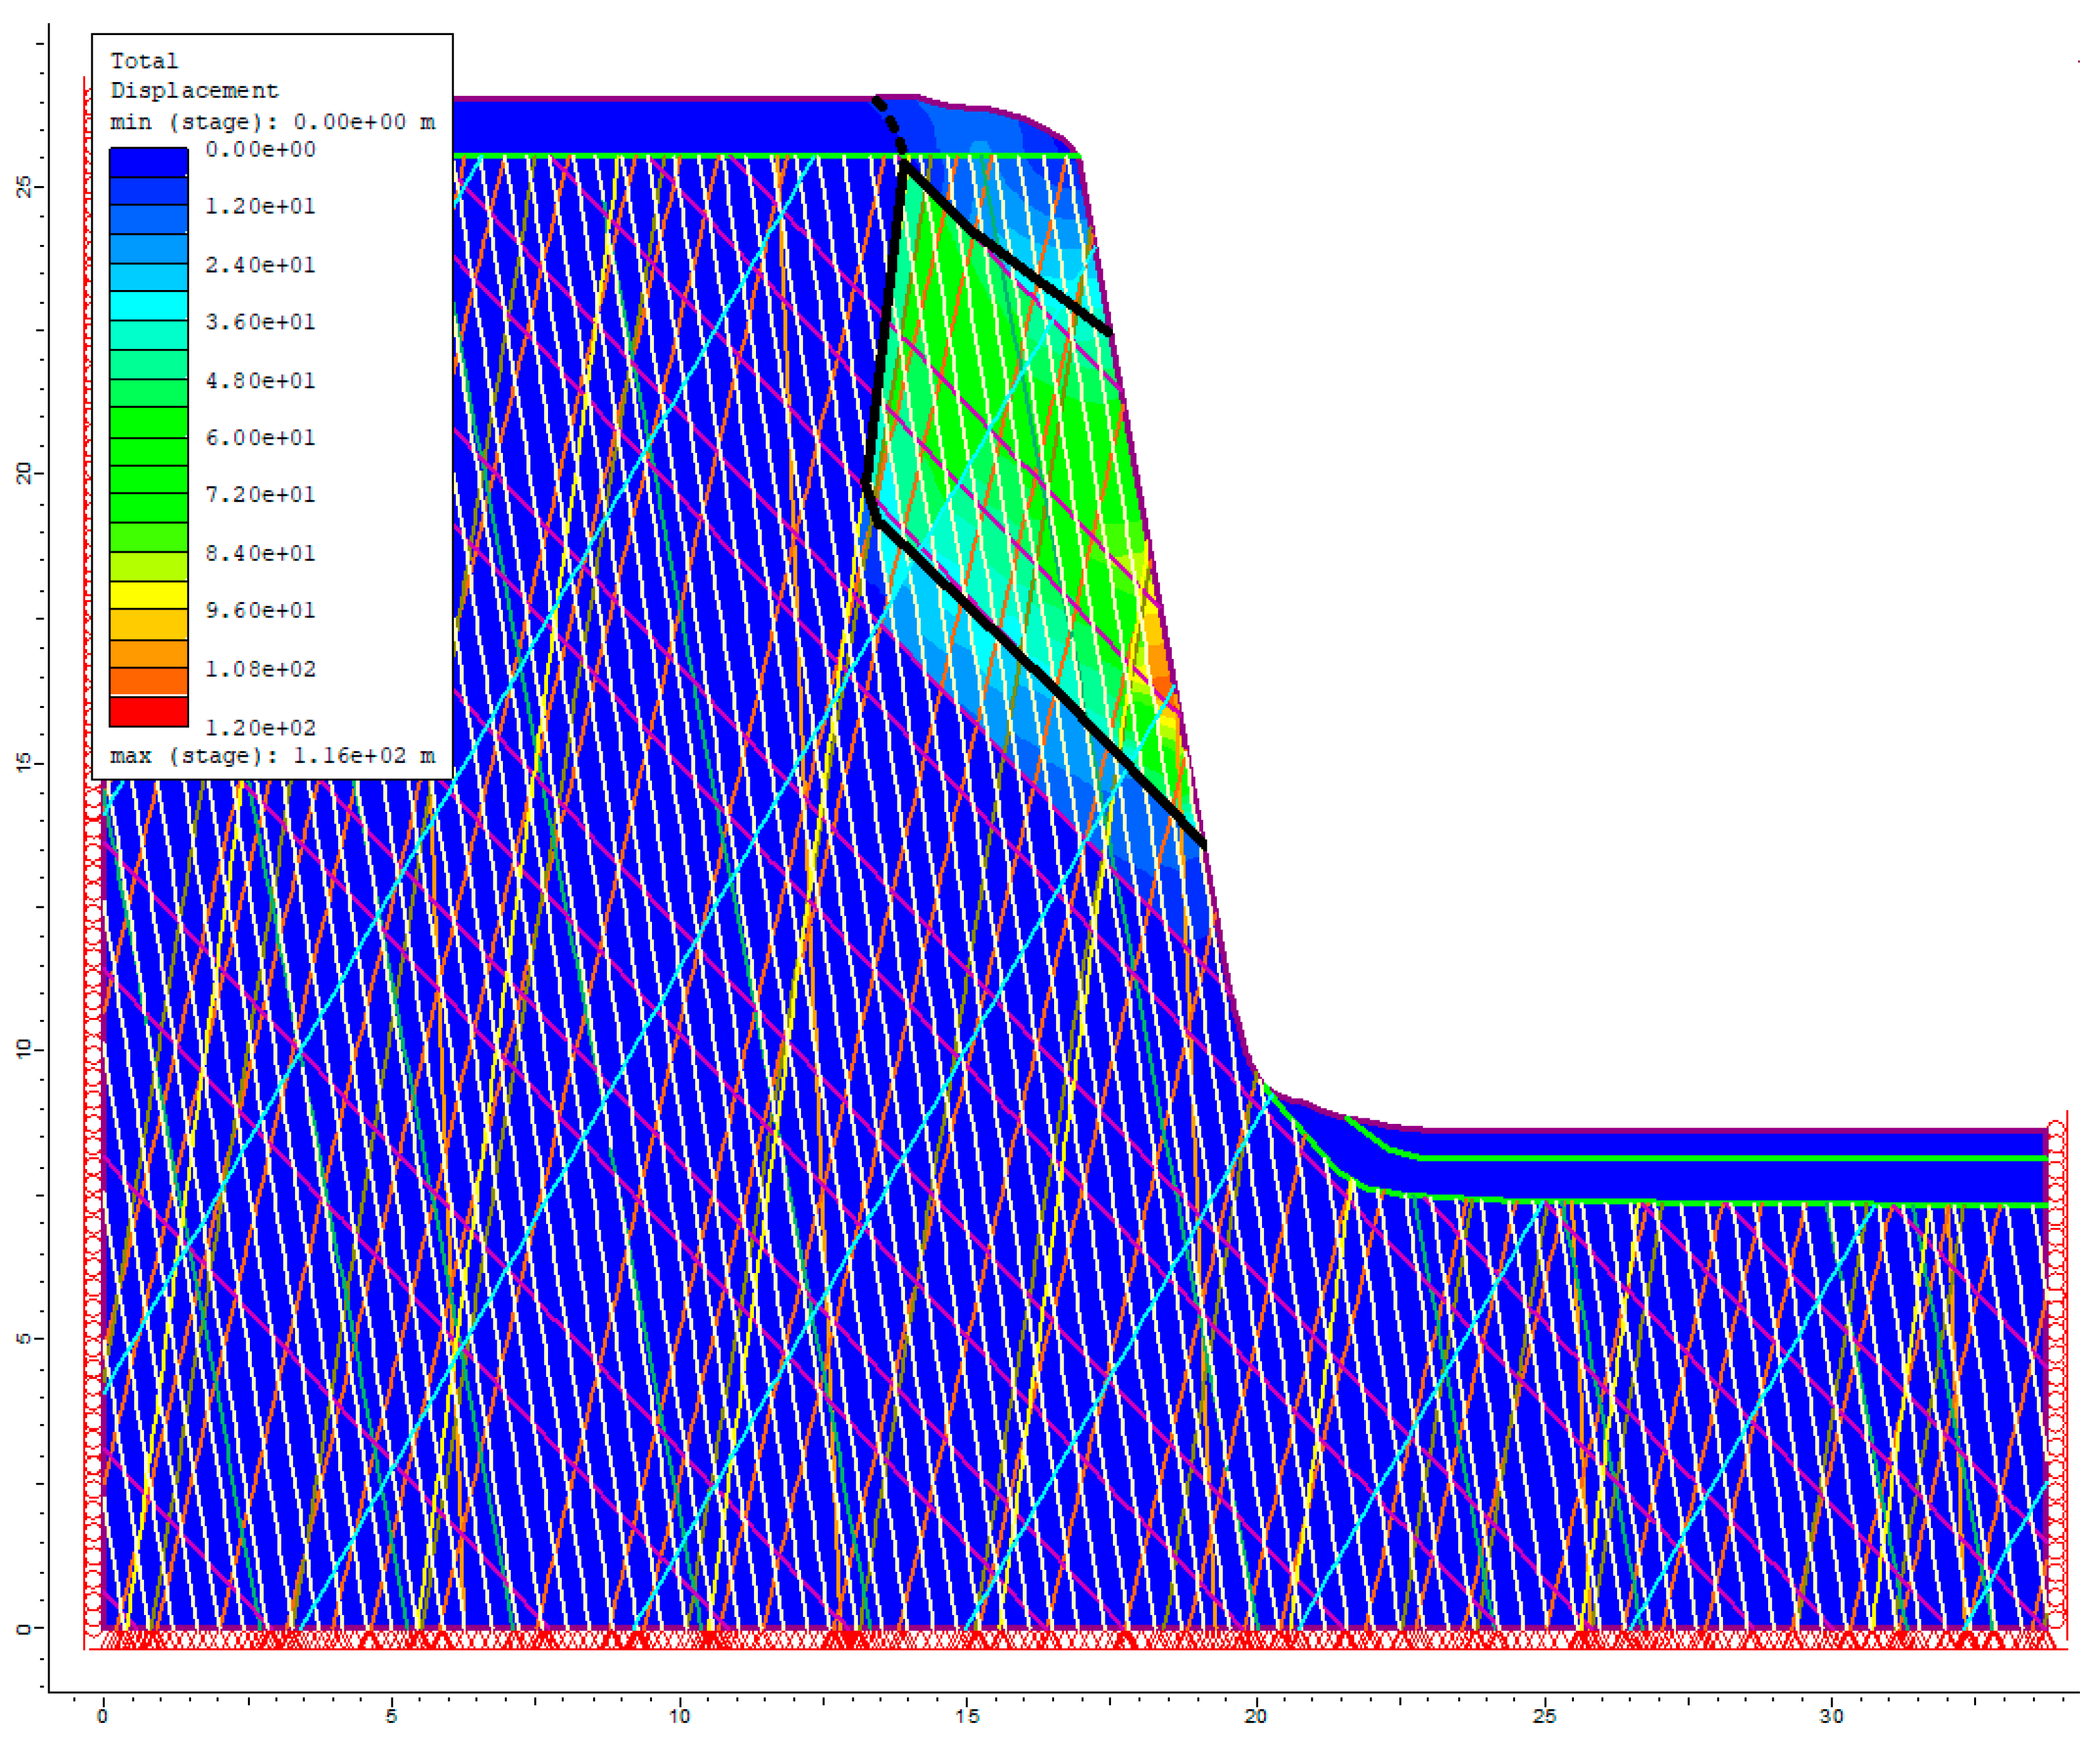
The analysis conducted for Sector 5 yielded a factor of safety of 1.17, which indicates a probable occurrence of landslides within this sector. The potential slip surface extends through the weathered layers and across the mid-section of the rock wall, where unstable rock blocks have been identified. Field mapping data further supports this condition.
The calculated factor of safety and the corresponding slip surface are presented in
Figure 14.
The obtained factor of safety (FS << 1.0) for Sector 6 indicates the presence of unstable rock blocks, which, under the assumed joint network configuration, are susceptible to sliding, thus explaining the very low FS value. The potential slip surface is in the upper portion of the slope. Based on the analysis results, it can be concluded that Sector 6 is characterised by unstable rock blocks that are likely to initiate slope instability processes, including sliding and rockfall. The identified slip surface is presented in
Figure 15.
The stability analysis for Sector 7 was conducted under two scenarios:
When the slope above the rock wall is composed of debris, the calculated safety factor of 1.60 indicates a very low probability of landslide occurrence. However, when the slope is composed of weathered material, the resulting factor of safety of 1.20 suggests probable landslide occurrence in Sector 7. In both cases, the potential slip surface is located within the weathered/debris layers; however, in the debris scenario, individual blocks exhibiting localised slip surfaces were also identified.
The lithology and shear strength parameters of the layers overlying the rock wall should be verified through detailed field investigations and laboratory testing.
The stability analysis for Sector 8 (similarly to Sector 7) was performed under two scenarios: (i) the slope located above the rock wall composed of debris material (as per [
52]), and (ii) the slope composed of weathered material, consistent with the assumptions used in the other cross-sections.
The calculated factor of safety for both scenarios involving the weathered layer and the debris layer exceeds a value of 2.0, indicating that the occurrence of landslides in Sector 8 is highly unlikely. However, the possibility of local rockfalls and minor slides cannot be entirely excluded. The potential slip surface is within the weathered material and/or debris layers.
9. Conclusions
Based on the literature review, field investigations, and stability analyses, the following conclusions can be drawn:
The use of FEM-based numerical stability analyses incorporating the actual structure of the rock mass—specifically its discontinuities (joints, fractures, and bedding planes)—enabled a reliable representation of the real geological conditions, which are fundamental in determining slope failure mechanisms;
The accurate representation of real conditions, particularly the joint system geometry, facilitated the identification of actual failure mechanisms (e.g., Sectors 3, 4, and 6—inter-block displacement driven by the configuration of joint sets; Sectors 5 and 7—the combination of circular slip surfaces in weathered layers with block dislocation in the rock mass);
FEM numerical slope stability calculations with explicitly modelled discontinuity networks not only allowed for the identification of realistic failure mechanisms, but also produced accurate values of stability indicators;
The landslide hazard levels across the analysed sectors can be summarised as follows:
Sector 1—Landslide occurrence is highly unlikely (FS > 1.50);
Sector 2—Landslide occurrence is highly unlikely (FS > 1.50);
Sector 3—Landslide occurrence is unlikely, but the safety condition is not satisfied (FS < 1.50);
Sector 4—Active slope failure processes are occurring, including rockfalls of unstable blocks and deeper structural slides. The safety condition is not satisfied (FS < 1.50);
Sector 5—Landslide occurrence is probable (sliding, rockfalls of unstable blocks, and creep of weathered cover). The safety condition is not satisfied (FS < 1.50);
Sector 6—Unstable blocks trigger slope failure processes (shallow block slides and deeper structural slides). The safety condition is not satisfied (FS < 1.50);
Sector 7—If the slope above the rock wall consists of debris material, landslide occurrence is highly unlikely (FS > 1.50). However, if weathered material is assumed, landslide occurrence becomes probable (creep of weathered cover and shallow block slides), and the safety condition is not satisfied (FS < 1.50);
Sector 8—If the slope consists of debris material, landslide occurrence is highly unlikely (FS > 1.50). If weathered material is assumed, landslide occurrence also remains highly unlikely (FS > 1.50).
Slip surface locations varied across the sectors: in four sectors, the slip surface was confined to weathered layers (Sectors 1, 2, 3, and 8). In two cases, the slip surface extended through the rock wall and weathered layers (Sectors 5 and 7). In two sectors, the slip surface was located entirely within the rock mass (Sectors 4 and 6);
Local rockfalls and shallow slides cannot be excluded, even in sectors classified as stable. Ongoing weathering processes and adverse atmospheric conditions, such as heavy and prolonged rainfall or freeze–thaw cycles, may trigger these phenomena;
In sectors where the factor of safety is below 1.50, remedial measures must be undertaken to improve the slope stability conditions;
To ensure the safe public use of the site, hazard and protective buffer zones must be established to separate visitors from dangerous areas. Furthermore, additional stabilisation measures, including rockfall protection meshes and anchoring systems, are recommended to allow full access to the quarry walls;
The calculations indicate unstable conditions for Sectors 4 and 6. Failure to implement protective measures may lead to progressive failure processes and significant damage within the upper and middle parts of the slopes.
It should be emphasised that detailed field investigations and laboratory testing are necessary to verify the lithology and strength parameters of the weathered layers, debris material, and limestones used in the calculations. Moreover, the minimal number of boreholes—including only two penetrating the weathered layers—necessitated assumptions regarding the thickness and boundary between the rock mass and the weathered materials. As a result, the adopted assumptions may differ from the actual geological conditions. Therefore, it is recommended that site characterisation be refined further.
In the subsequent stages of research, a detailed rockfall analysis is planned to delineate safety buffer zones, ensuring the safe use of Bednarski Park. Additionally, to accurately represent the actual block configuration and its three-dimensional geometry, including the orientation of edges, fracture surfaces, and displacement directions, 3D numerical modelling will also be carried out.
Author Contributions
Conceptualization, M.K. and A.S.; methodology, M.K., P.O. and M.W.; software, M.K., P.O. and M.W.; validation, M.K., M.C. and A.S.; formal analysis, M.K. and A.S.; investigation, M.K., P.O. and M.W.; resources, M.K., M.C. and A.S.; data curation, M.K.; writing—original draft preparation, M.K.; writing—review and editing, M.K., M.C., A.S., P.O. and M.W.; visualisation, M.K., P.O. and M.W.; supervision, M.C.; project administration, A.S.; funding acquisition, M.C. All authors have read and agreed to the published version of the manuscript.
Funding
This research received no external funding.
Institutional Review Board Statement
Not applicable.
Informed Consent Statement
Not applicable.
Data Availability Statement
The original contributions presented in the study are included in the article; further inquiries can be directed to the corresponding author.
Acknowledgments
The authors would like to thank Robert Kaczmarczyk for estimating mechanical rock properties and providing some geological descriptions, and Andrzej Świąder for his contribution to the mapping work.
Conflicts of Interest
The authors declare that they have no conflicts of interest.
References
- Górecki, J.; Sermet, E. The Quarries of Kraków—An Undervalued Heritage. In The History of Mining—Part of Europe’s Cultural Heritage; Zagożdżon, P.P., Madziarz, M., Eds.; Oficyna Wydawnicza Politechniki Wrocławskiej: Wroclaw, Poland, 2010; Volume 3, pp. 123–138. (In Polish) [Google Scholar]
- Horino, F.G.; Ellickson, M.L. A Method for Estimating the Strength of Rock Containing Planes of Weakness; U.S. Department of the Interior, Bureau of Mines: Washington, DC, USA, 1970; pp. 1–29.
- Goodman, R.E. Introduction to Rock Mechanics, 2nd ed.; John Wiley and Sons: New York, NY, USA, 1989. [Google Scholar]
- Adler, P.M.; Thovert, J.-F. Fractures and Fracture Networks, 1st ed.; Springer: Dordrecht, The Netherlands, 1999; pp. 1–431. [Google Scholar]
- Jing, L. A review of techniques, advances and outstanding issues in numerical modelling for rock mechanics and rock engineering. Int. J. Rock Mech. Min. Sci. 2003, 40, 283–353. [Google Scholar] [CrossRef]
- Johari, A.; Fazeli, A.; Javadi, A.A. An Investigation into Application of Jointly Distributed Random Variables Method in Reliability Assessment of Rock Slope Stability. Comput. Geotech. 2013, 47, 42–47. [Google Scholar] [CrossRef]
- Bonilla, S.; Viviana, S.; Luc, D.; Frederic, V. DEM analysis of rock bridges and the contribution to rock slope stability in the case of translational sliding failures. Int. J. Rock Mech. Min. Sci. 2015, 80, 67–78. [Google Scholar] [CrossRef]
- Li, Z.; Wang, J.; Li, L.; Wang, L.; Liang, R.Y. A Case Study Integrating Numerical Simulation and GB-InSAR Monitoring to Analyse Flexural Toppling of an Anti-Dip Slope in Fushun Open Pit. Eng. Geol. 2015, 197, 20–32. [Google Scholar] [CrossRef]
- Gu, D.; Huang, D. A Complex Rock Topple-Rock Slide Failure of an Anaclinal Rock Slope in the Wu Gorge, Yangtze River, China. Eng. Geol. 2016, 208, 165–180. [Google Scholar] [CrossRef]
- Ning, Y.; Zhang, G.; Tang, H.; Shen, W.; Shen, P. Process Analysis of Toppling Failure on Anti-Dip Rock Slopes Under Seismic Load in Southwest China. Rock Mech. Rock Eng. 2019, 52, 4439–4455. [Google Scholar] [CrossRef]
- Wang, L.; Chen, W.; Tan, X.; Tan, X.; Yang, J.; Yang, D.; Zhang, X. Numerical investigation on the stability of deforming fractured rocks using discrete fracture networks: A case study of underground excavation. Bull. Eng. Geol. Environ. 2020, 79, 133–151. [Google Scholar] [CrossRef]
- Xie, S.; Lin, H.; Chen, Y.; Yong, R.; Xiong, W.; Du, S. A damage constitutive model for shear behaviour of joints based on determination of the yield point. Int. J. Rock Mech. Min. Sci. 2020, 128, 104269. [Google Scholar] [CrossRef]
- Wei, S.; Li, Y.; Shang, Y.; Sun, Y.; Li, K. Stability analysis of fractured rock mass around underground excavations based on a three-dimensional discrete fracture network. Environ. Earth Sci. 2022, 81, 65. [Google Scholar] [CrossRef]
- Wang, R.; Zheng, Y.; Chen, C.; Zhang, W. Theoretical and Numerical Analysis of Flexural Toppling Failure in Soft-Hard Interbedded Anti-Dip Rock Slopes. Eng. Geol. 2023, 312, 106923. [Google Scholar] [CrossRef]
- Li, M.; Xiu, Z.; Han, J.; Meng, F.; Wang, F.; Ji, H. Characterization and Stability Analysis of Rock Mass Discontinuities in Layered Slopes: A Case Study from Fushun West Open-Pit Mine. Appl. Sci. 2024, 14, 11330. [Google Scholar] [CrossRef]
- Bukowska, M.; Kidybiński, A. Impact of natural features of the rockmass on its strength determined by penetrometric and laboratory methods. Res. Rep. Min. Environ. 2002, 1, 23–34. (In Polish) [Google Scholar]
- Zhang, C.; Amagu, A.C.; Kodama, J.; Sainoki, A.; Ogawa, S.; Umeda, C.; Fujii, Y.; Fukuda, D. Numerical Analysis of the Impact of Fault and Weak Rock Formation on Mining-Induced Deformation of Rock Slope. IOP Conf. Ser. Earth Environ. Sci. 2021, 861, 032087. [Google Scholar] [CrossRef]
- Zhang, C.; Clement, A.A.; Kodama, J.-I.; Sainoki, A.; Fujii, Y.; Fukuda, D.; Wang, S. Effect of the Connectivity of Weak Rock Zones on the Mining-Induced Deformation of Rock Slopes in an Open-Pit Mine. Sustainability 2024, 16, 5974. [Google Scholar] [CrossRef]
- Nkanyane, F.; Sengani, F.; Rapholo, M.T.D.; Skrzypkowski, K.; Zagórski, K.; Zagórska, A.; Rokita, T. The Effects of Strata Orientation and Water Presence on the Stability of Engineered Slopes Using DIPS and FLAC/Slope: A Case Study of Tubatse and Fetakgomo Engineered Road Slopes. Appl. Sci. 2024, 14, 9838. [Google Scholar] [CrossRef]
- Chang, L. Behavior of Jointed Rock Masses: Numerical Simulation and Lab Testing. Ph.D. Thesis, Technische Universität Bergakademie Freiberg, Freiberg, Germany, 17 August 2017. [Google Scholar]
- Li, M.; Yue, Z.; Ji, H.; Xiu, Z.; Han, J.; Meng, F. Numerical Analysis of Interbedded Anti-Dip Rock Slopes Based on Discrete Element Modelling: A Case Study. Appl. Sci. 2023, 13, 12583. [Google Scholar] [CrossRef]
- Wang, F.; Meng, F.; Wang, S.; Xiu, Z. Quantifying the Morphology of Rock Joints and Updating the JRC-JCS Criterion Considering the Asperity Distribution. Geomech. Geophys. Geo-Energy Geo-Resour. 2024, 10, 152. [Google Scholar] [CrossRef]
- Mehrishal, S.; Kim, J.; Song, J.-J.; Sainoki, A. A Semi-Automatic Approach for Joint Orientation Recognition Using 3D Trace Network Analysis. Eng. Geol. 2024, 332, 107462. [Google Scholar] [CrossRef]
- Wang, Y.; Zhou, J.; Chen, Q.; Chen, J.; Zhu, C.; Li, H. Automatic interpretation of geometric information of discontinuities and its influence on the stability of highly-jointed rock slopes. J. Rock Mech. Geotech. Eng. 2024; in press. [Google Scholar] [CrossRef]
- Lyman, G.; Poropat, G.V.; Elmouttie, M. Uncertainty in rock mass jointing characterisation. In SHIRMS 2008: Proceedings of the International Symposium on Hydrogeology and Rock Mechanics; Potvin, Y., Carter, J., Dyskin, A., Jeffrey, R., Eds.; Australian Centre for Geomechanics: Perth, Australia, 2008; pp. 121–134. [Google Scholar] [CrossRef]
- Hoek, E.; Brown, E.T. Empirical strength criterion for rock masses. J. Geotech. Eng. Div. 1980, 106, 1013–1035. [Google Scholar] [CrossRef]
- Hoek, E.; Carranza-Torres, C.; Corkum, B. Hoek-Brown failure criterion edition. Proc. NARMS Tac Conf. 2002, 1, 267–273. [Google Scholar]
- Hoek, E.; Brown, E.T. The Hoek–Brown failure criterion and GSI—2018 edition. J. Rock Mech. Geotech. Eng. 2019, 11, 445–463. [Google Scholar] [CrossRef]
- Hammah, R.; Yacoub, T.; Corkum, B.; Curran, J. The practical modelling of discontinuous rock masses with finite element analysis. In Proceedings of the 42nd U.S. Rock Mechanics Symposium (USRMS), San Francisco, CA, USA, 29 June—2 July 2008; American Rock Mechanics Association: Westminster, CO, USA, 2008; pp. 1–8. [Google Scholar]
- Xu, J.; Wang, X.; Xie, P.; Wang, R.; Du, D. Effect of Rock Mass Disturbance on Stability of 3D Hoek–Brown Slope and Charts. Buildings 2024, 14, 114. [Google Scholar] [CrossRef]
- Rehman, Z.U.; Hussain, S.; Tahir, M.; Sherin, S.; Mohammad, N.; Dasti, N.; Raza, S.; Salman, M. Numerical modelling for geotechnical assessment of rock mass behaviour and performance of support system for diversion tunnels using optimised Hoek-Brown parameters. Min. Miner. Depos. 2022, 16, 1–8. [Google Scholar] [CrossRef]
- Abbas, N.; Li, K.; Emad, M.; Fissha, Y.; Ali, M.; Ghribi, W.; Gamil, Y.; Ikeda, H. Enhancing tunnel stability in the Himalayas: Empirical design support through numerical modelling. J. Eng. 2024, 2024, e12369. [Google Scholar] [CrossRef]
- Zvarivadza, T. Numerical Modelling Application in the Management of Deep Mining Excavation Stresses: An Illustrative Study. Mining 2023, 3, 731–754. [Google Scholar] [CrossRef]
- Menegoni, N.; Giordan, D.; Perotti, C. An Open-Source Algorithm for 3D Rock Slope Kinematic Analysis (ROKA). Appl. Sci. 2021, 11, 1698. [Google Scholar] [CrossRef]
- Perozzo, M.; Menegoni, N.; Foletti, M.; Poggi, E.; Benedetti, G.; Carretta, N.; Ferro, S.; Rivola, W.; Seno, S.; Giordan, D.; et al. Evaluation of an innovative, open-source and quantitative approach for the kinematic analysis of rock slopes based on UAV based Digital Outcrop Model: A case study from a railway tunnel portal (Finale Ligure, Italy). Eng. Geol. 2024, 340, 107670. [Google Scholar] [CrossRef]
- Cała, M.; Tajduś, A.; Słomka, T.; Piestrzyński, A.; Wendorff, M.; Stopkowicz, A.; Olchowy, P.; Świąder, A.; Kaczmarczyk, R.; Kolano, M.; et al. Preparation of a Detailed Geological, Geotechnical, and Geomechanical Expert Report on the Rock Walls of the Former Quarry in Wojciech Bednarski Park in Connection with Construction Works as Part of the Revitalization of Bednarski Park; AGH University of Krakow: Krakow, Poland, 2021. Research Project; Unpublished work. (In Polish) [Google Scholar]
- Google Maps. Available online: https://www.google.pl/maps (accessed on 5 May 2025).
- Geoportal Maps. Available online: https://mapy.geoportal.gov.pl (accessed on 22 June 2025).
- Gradziński, R. Geological Map of Kraków Region Without Quaternary and Terrestrial Tertiary Deposits 1:100 000. ING PAN 2009. Available online: https://www.ing.pan.pl/muzeum-geologiczne/tytul-domyslny (accessed on 11 June 2025).
- Dżułyński, S. Tektonika południowej części Wyżyny Krakowskiej (Tectonics of the southern part of the Kraków Upland). Acta Geol. Polon. 1953, 3, 325–440. (In Polish) [Google Scholar]
- Alexandrowicz, S.W. Budowa geologiczna okolic Tyńca (Geological structure of the Tyniec area). Biul. Inst. Geol. 1960, 152, 5–93. (In Polish) [Google Scholar]
- Gradziński, R. Przewodnik geologiczny po okolicach Krakowa (Geological guide to the Krakow area). Wydaw. Geol. Warszawa 1972, 334. (In Polish) [Google Scholar]
- Rutkowski, J. Objaśnienia do Szczegółowej Mapy Geologicznej Polski w Skali 1:50000 Arkusz Kraków (973); Państwowy Instytut Geologiczny: Warsaw, Poland, 1993; pp. 5–46. (In Polish)
- Matyszkiewicz, J. Microfacies, sedimentation and some aspects of diagenesis of Upper Jurassic sediments from the elevated part of the Northern peri-Tethyan shelf: A comparative study on the Cracow–Wieluń Upland and the northern part of the Polish Jura Chain. Facies 1997, 36, 1–111. [Google Scholar]
- Matyszkiewicz, J. Microfacies, sedimentation and some aspects of diagenesis of Upper Jurassic sediments from the elevated part of the Northern peri-Tethyan Shelf: A comparative study on the Lochen area (Schwäbische Alb) and the Cracow area (Cracow-Wielun Upland, Poland). Berl. Geowiss. Abh. 1997, E 21, 1–111. [Google Scholar]
- Matyszkiewicz, J. Sedimentation and diagenesis of the Upper Oxfordian cyanobacterial-sponge limestones in Piekary near Kraków. Ann. Soc. Geol. Polon. 1989, 59, 201–232. [Google Scholar]
- Krajewski, M.; Olchowy, P. Upper Jurassic bedded limestones and early diagenetic dolomitised limestones in the light of mineralogical, geochemical and sedimentological studies; Kraków area, Poland. Minerals 2021, 11, 462. [Google Scholar] [CrossRef]
- Matyszkiewicz, J. Epigenetic silification of the Upper Oxfordian limestones in the vicinity of Kraków. Ann. Soc. Geol. Polon. 1987, 57, 59–87. [Google Scholar]
- Kochman, A.; Kozłowski, A.; Matyszkiewicz, J. Epigenetic siliceous rocks from the southern part of the Kraków-Częstochowa Upland (Southern Poland) and their relation to Upper Jurassic early diagenetic chert concretions. Sed. Geol. 2020, 401, 105636. [Google Scholar] [CrossRef]
- Główny Urząd Geodezji i Kartografii (GUGiK). Numeryczny Model Terenu (NMT)—Dane LiDAR, Projekt ISOK; Geoportal (Main Office of Geodesy and Cartography (GUGiK). Digital Terrain Model (DTM)—LiDAR Data, ISOK Project; Geoportal). Available online: https://www.geoportal.gov.pl/ (accessed on 15 November 2021).
- PN-EN ISO 14689:2018; Rozpoznanie i Badania Geotechniczne—Oznaczanie, Opis i Klasyfikowanie Skał. (Geotechnical Investigation and Survey—Identification, Description, and Classification of Rocks). ISO: Geneva, Switzerland, 2018.
- Różański, P.; Łopuszyńska, M. Geological Opinion for the Recognition of Soil and Groundwater Conditions in the Area of the Planned Revitalization and Modernization of Wojciech Bednarski Park on Plot no. 437/4 in Kraków; Geoprofil: Krakow, Poland, 2018. Unpublished work. (In Polish) [Google Scholar]
- Płoskonka, J.; Wilk, M.; Kurczab, A. Geotechnical-Engineering Documentation for the Revitalisation Project of Wojciech Bednarski Park in Kraków; BGG GEOSERVICE: Krakow, Poland, 2019. Unpublished work. (In Polish) [Google Scholar]
- PN-81/B-03020; Grunty Budowlane. Posadowienie Bezposrednie. Obliczenia Statyczne i Projektowanie. (Building Soils. Shallow Foundations. Static Calculations and Design). Polish Committee for Standardization: Warsaw, Poland, 2013.
- Nowacki, J.; Naborczyk, J.; Petrasz, J.; Sala, A. Instrukcja Obserwacji i Badań Osuwisk Drogowych (Manual for the Observation and Investigation of Road Landslides); Generalna Dyrekcja Dróg Publicznych, Wydawnictwo Print: Krakow, Poland, 1999. (In Polish)
- Dawson, E.M.; Roth, W.H. Slope stability analysis with FLAC. In FLAC and Numerical Modelling in Geomechanics; Bilaux, D., Rachez, X., Detournay, C., Hart, R., Eds.; A.A. Balkema Publishers: Rotterdam, The Netherlands, 1999; pp. 3–9. [Google Scholar]
- Griffiths, D.V.; Lane, P.A. Slope stability analysis by finite elements. Geotechnique 1999, 49, 387–403. [Google Scholar] [CrossRef]
- Cała, M.; Flisiak, J. Slope stability analysis with FLAC and limit equilibrium methods. In FLAC and Numerical Modelling in Geomechanics; Bilaux, D., Rachez, X., Detournay, C., Hart, R., Eds.; A.A. Balkema Publishers: Rotterdam, The Netherlands, 2001; pp. 111–114. [Google Scholar]
- Cała, M. Convex and concave slope stability analyses with numerical methods. Arch. Min. Sci. 2007, 52, 75–89. [Google Scholar]
- Cała, M.; Kowalski, M.; Stopkowicz, A. The three-dimensional (3D) numerical stability analysis of the Hyttemalmen open-pit. Arch. Min. Sci. 2014, 59, 609–620. [Google Scholar] [CrossRef]
Figure 1.
Location of Wojciech Bednarski Park (source: Europe map [
37], Kraków city map [
38], and Wojciech Bednarski Park map [
38]).
Figure 1.
Location of Wojciech Bednarski Park (source: Europe map [
37], Kraków city map [
38], and Wojciech Bednarski Park map [
38]).
Figure 2.
Location of the sectors (upper map: Geological Map of Kraków Region without quaternary and terrestrial tertiary deposits [
39], lower map: designated cross-sections against the classified slope gradient [
36]).
Figure 2.
Location of the sectors (upper map: Geological Map of Kraków Region without quaternary and terrestrial tertiary deposits [
39], lower map: designated cross-sections against the classified slope gradient [
36]).
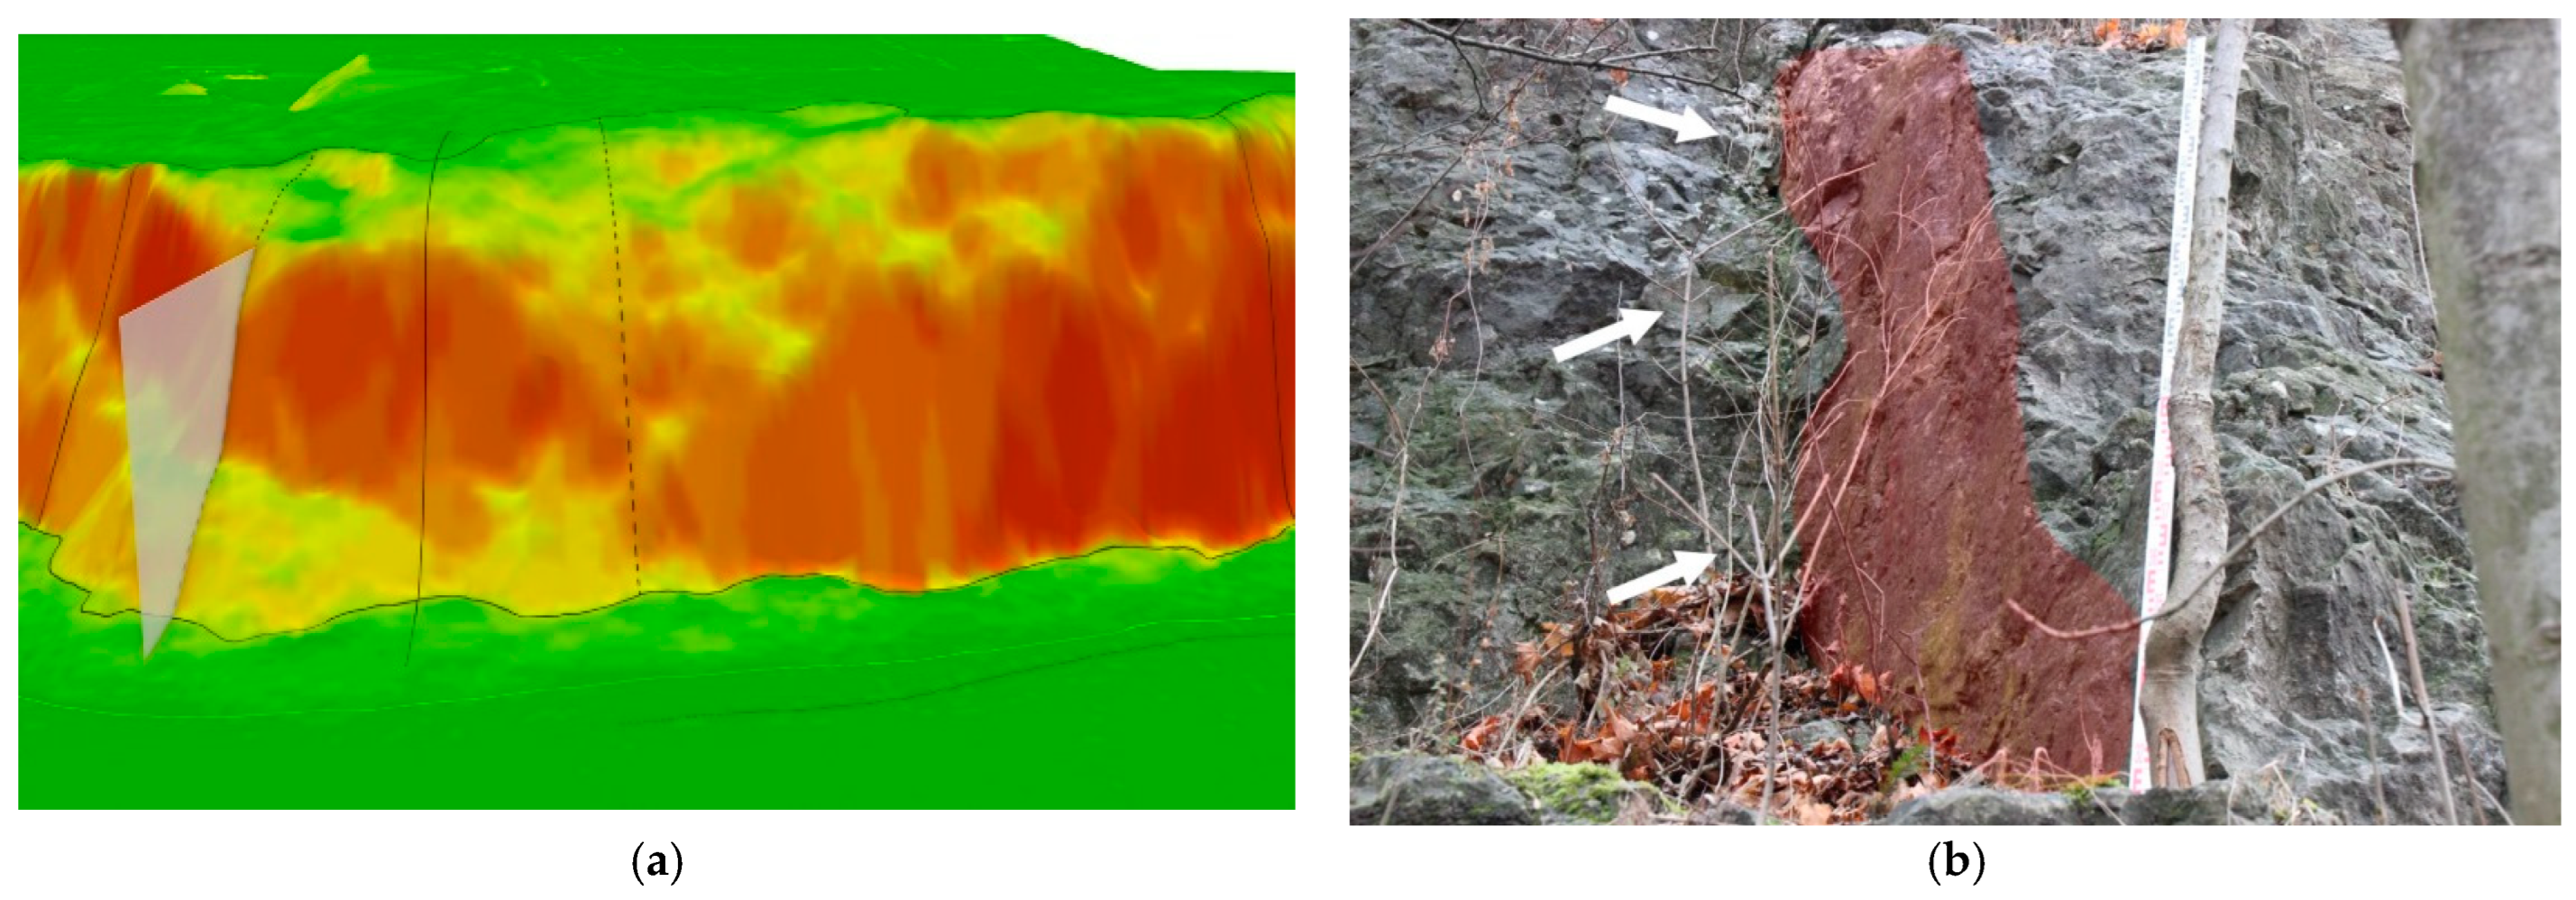
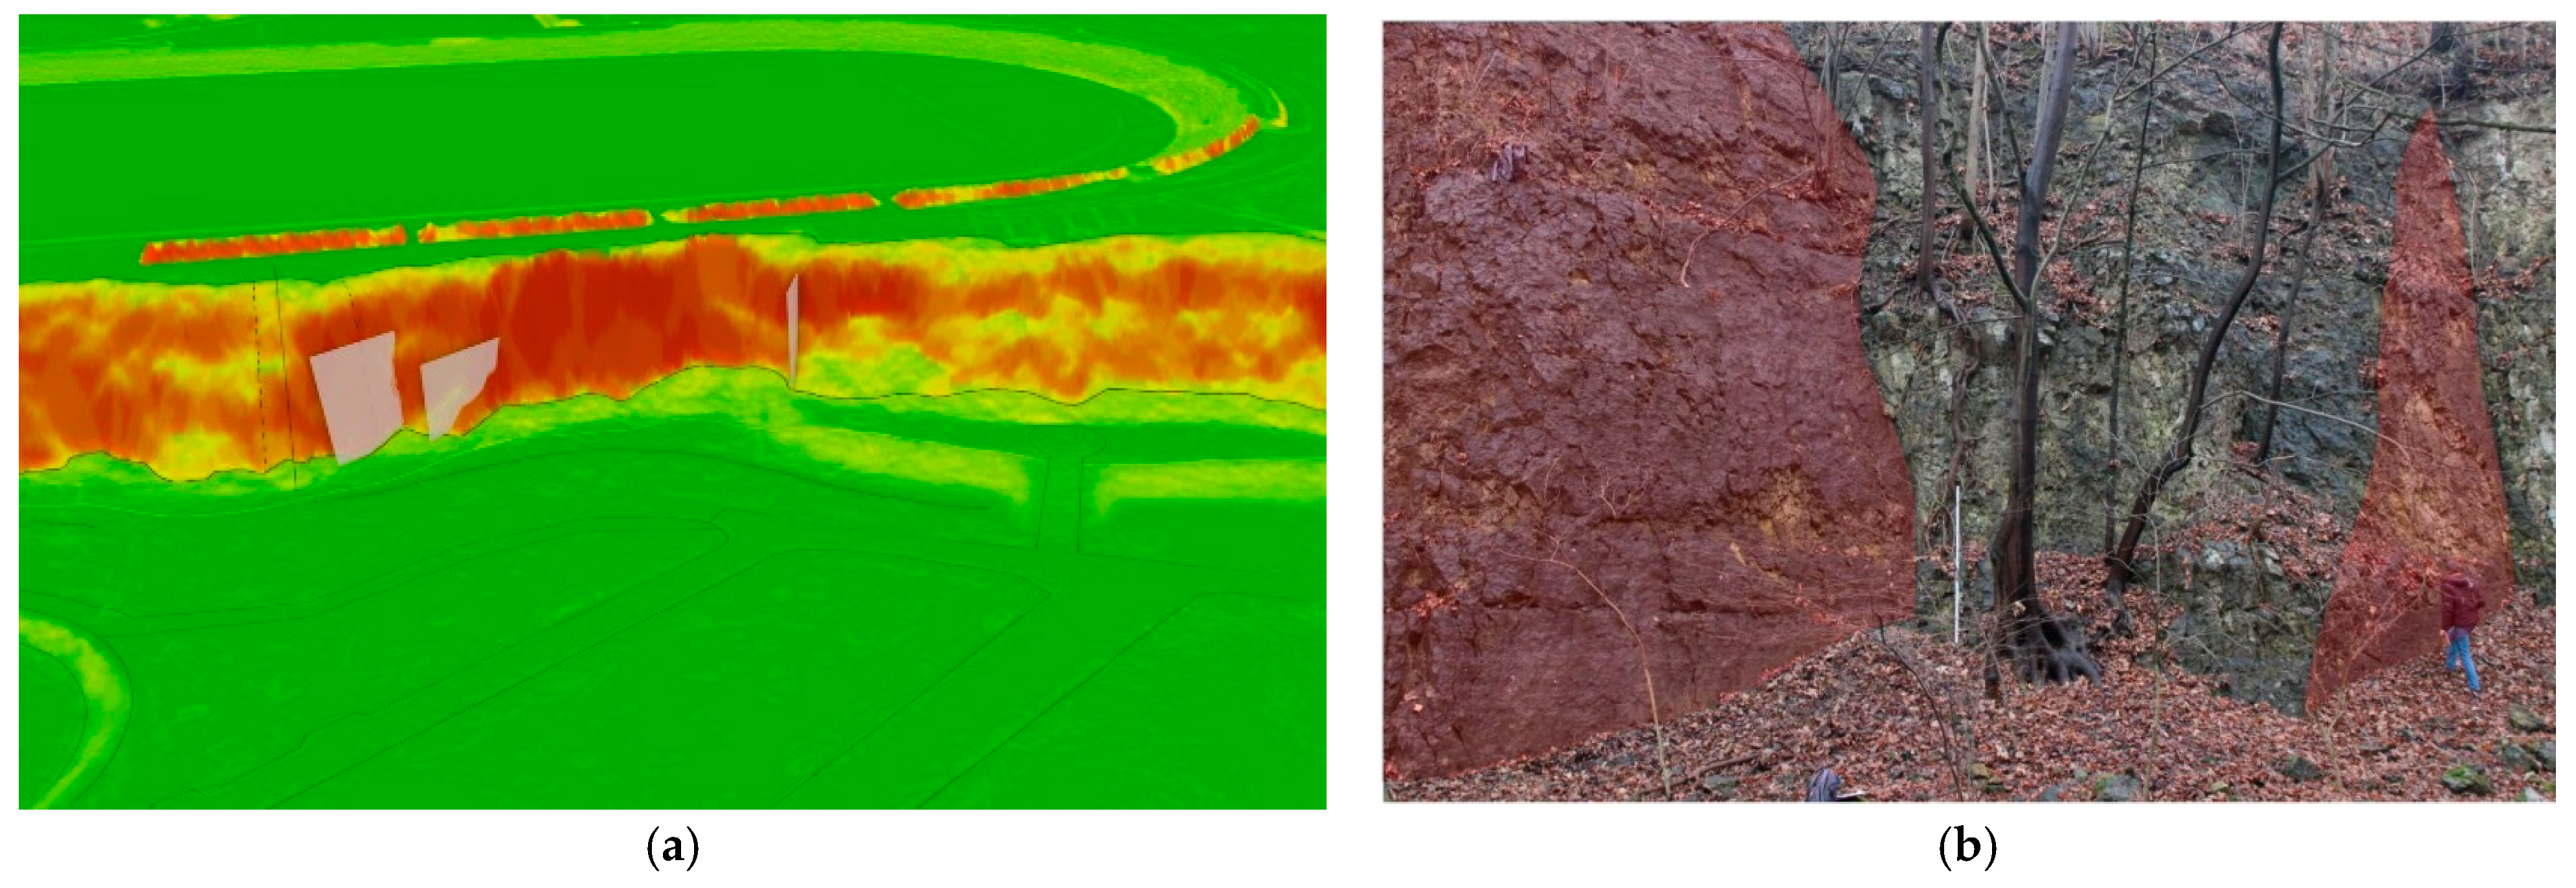
Figure 3.
Sector 2: (
a) 3D view of the Sector 2 slope generated based on a 0.25 m resolution LiDAR Digital Terrain Model (DTM) with a draped surface slope gradient. Transparent plates mark fault locations. Other symbols are as explained in the legend of
Figure 2; (
b) fragment of the Sector 2 slope. Fault surface (red transparent area) (attitude parameters: 283/88) with adjacent fault breccia (indicated by arrows). Levelling rod shown for scale (2 m length) (50°02′30.8″ N 19°57′05.7″ E).
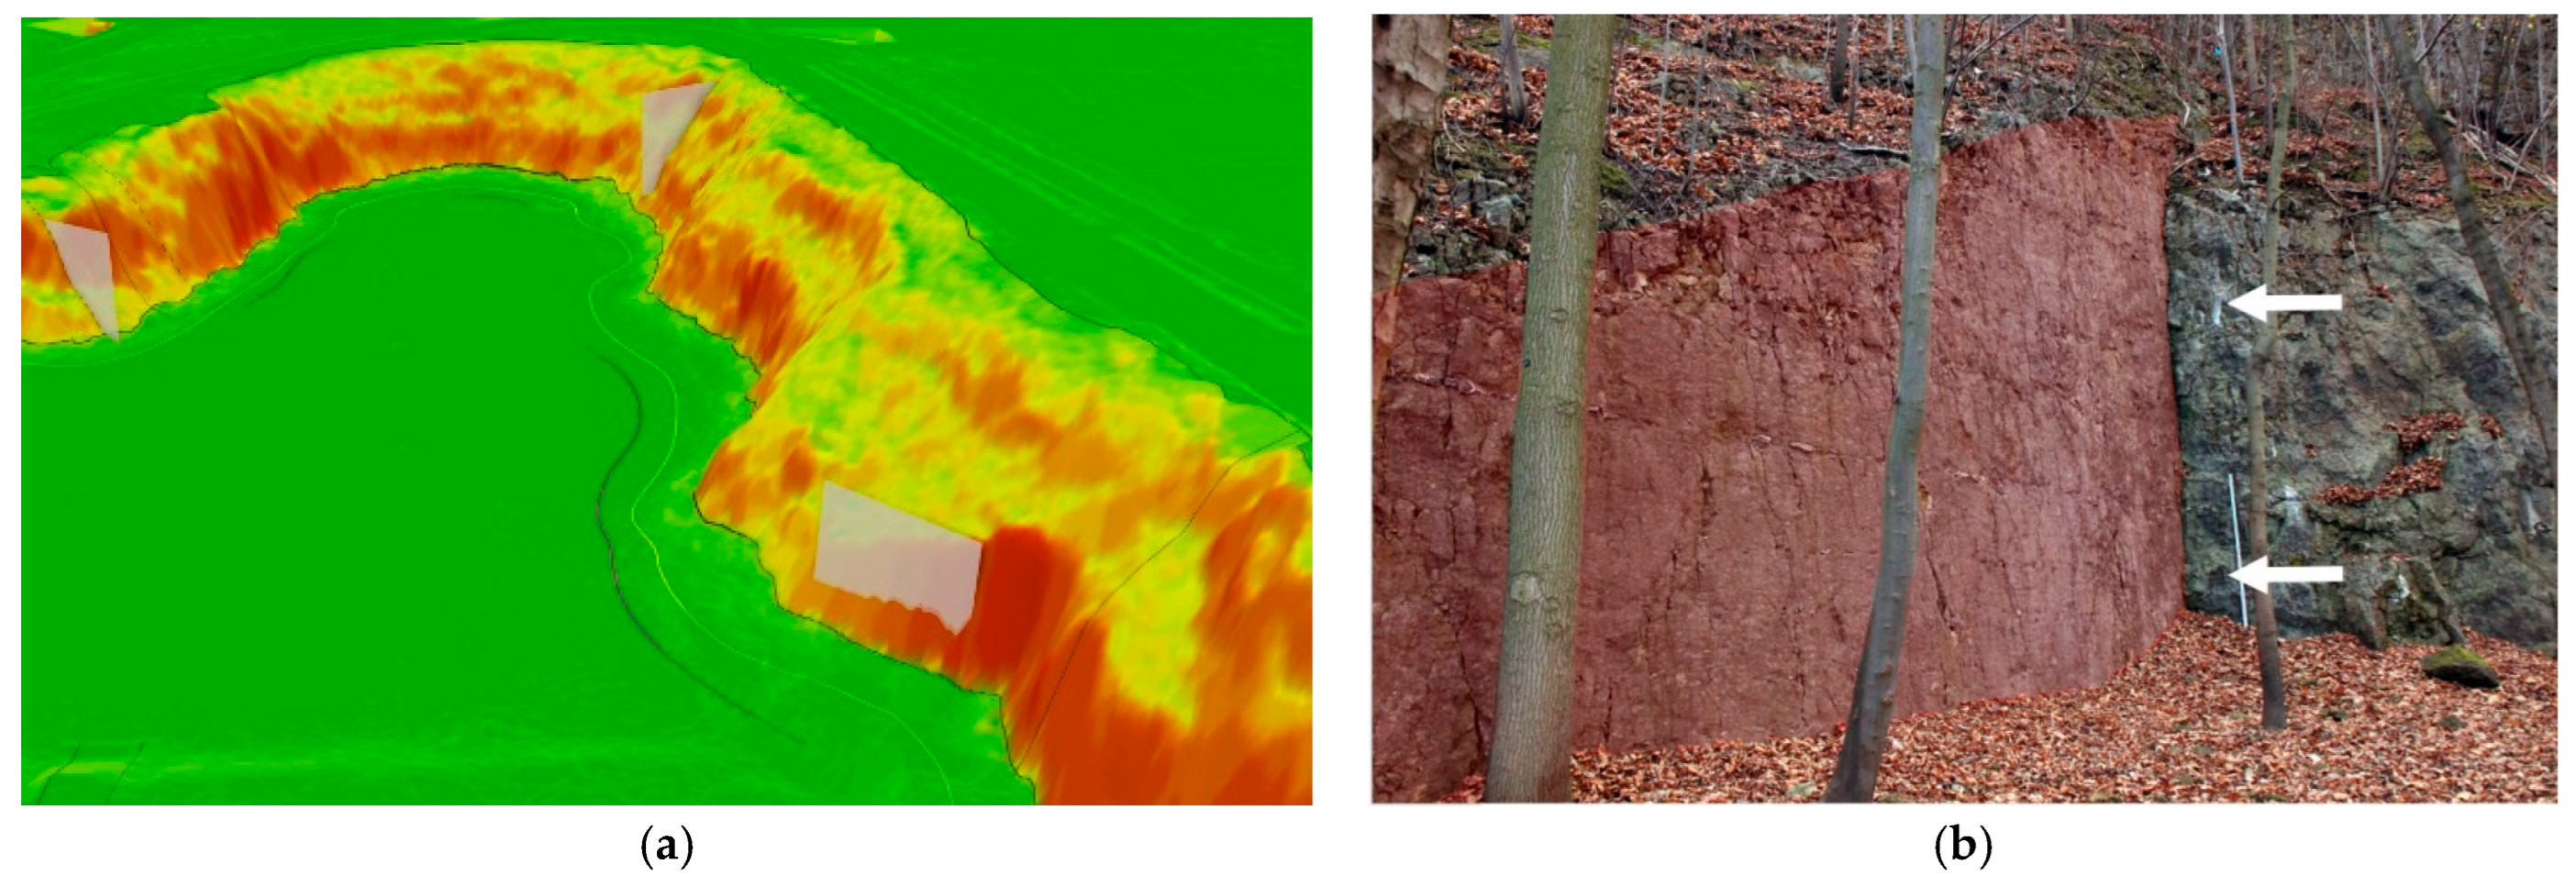
Figure 4.
Sector 3: (
a) 3D view of the Sector 3 slope generated from a 0.25 m resolution LiDAR Digital Terrain Model (DTM) with a draped surface slope gradient. Transparent plates indicate faults. Other symbols are explained in the legend of
Figure 2; (
b) fragment of Sector 3. Fault (red transparent area) (attitude parameters: 283/84) with adjacent fault breccia (indicated by arrows). Levelling rod shown for scale (2 m length). (50°02′28.8″ N 19°57′04.5″ E).
Figure 5.
Sector 5: (
a) 3D view of the Sector 5 slope generated from a 0.25 m resolution LiDAR Digital Terrain Model (DTM) with a draped surface slope gradient. Transparent plates indicate faults. Other symbols are explained in the legend of
Figure 2; (
b) fragment of Sector 5. Fault surfaces (red transparent areas) (attitude parameters: 296/73—left fault and 298/85—right fault). The area between and to the right of the faults consists of fault breccia—levelling rod shown for scale (2 m length) (50°02′27.3″ N 19°56′57.6″ E).
Figure 6.
Sector 7: (
a) 3D view of the Sector 7 slope generated from a 0.25 m resolution LiDAR Digital Terrain Model (DTM) with a draped surface slope gradient. Transparent plates mark the locations of faults. Other symbols are explained in the legend of
Figure 2; (
b) slope fragment of Sector 7. Red transparent area—fault with attitude parameters 284/88. The red contour line serves as a scale indicator (contour length 2 m) (50°02′29.5″ N 19°56′51.8″ E).
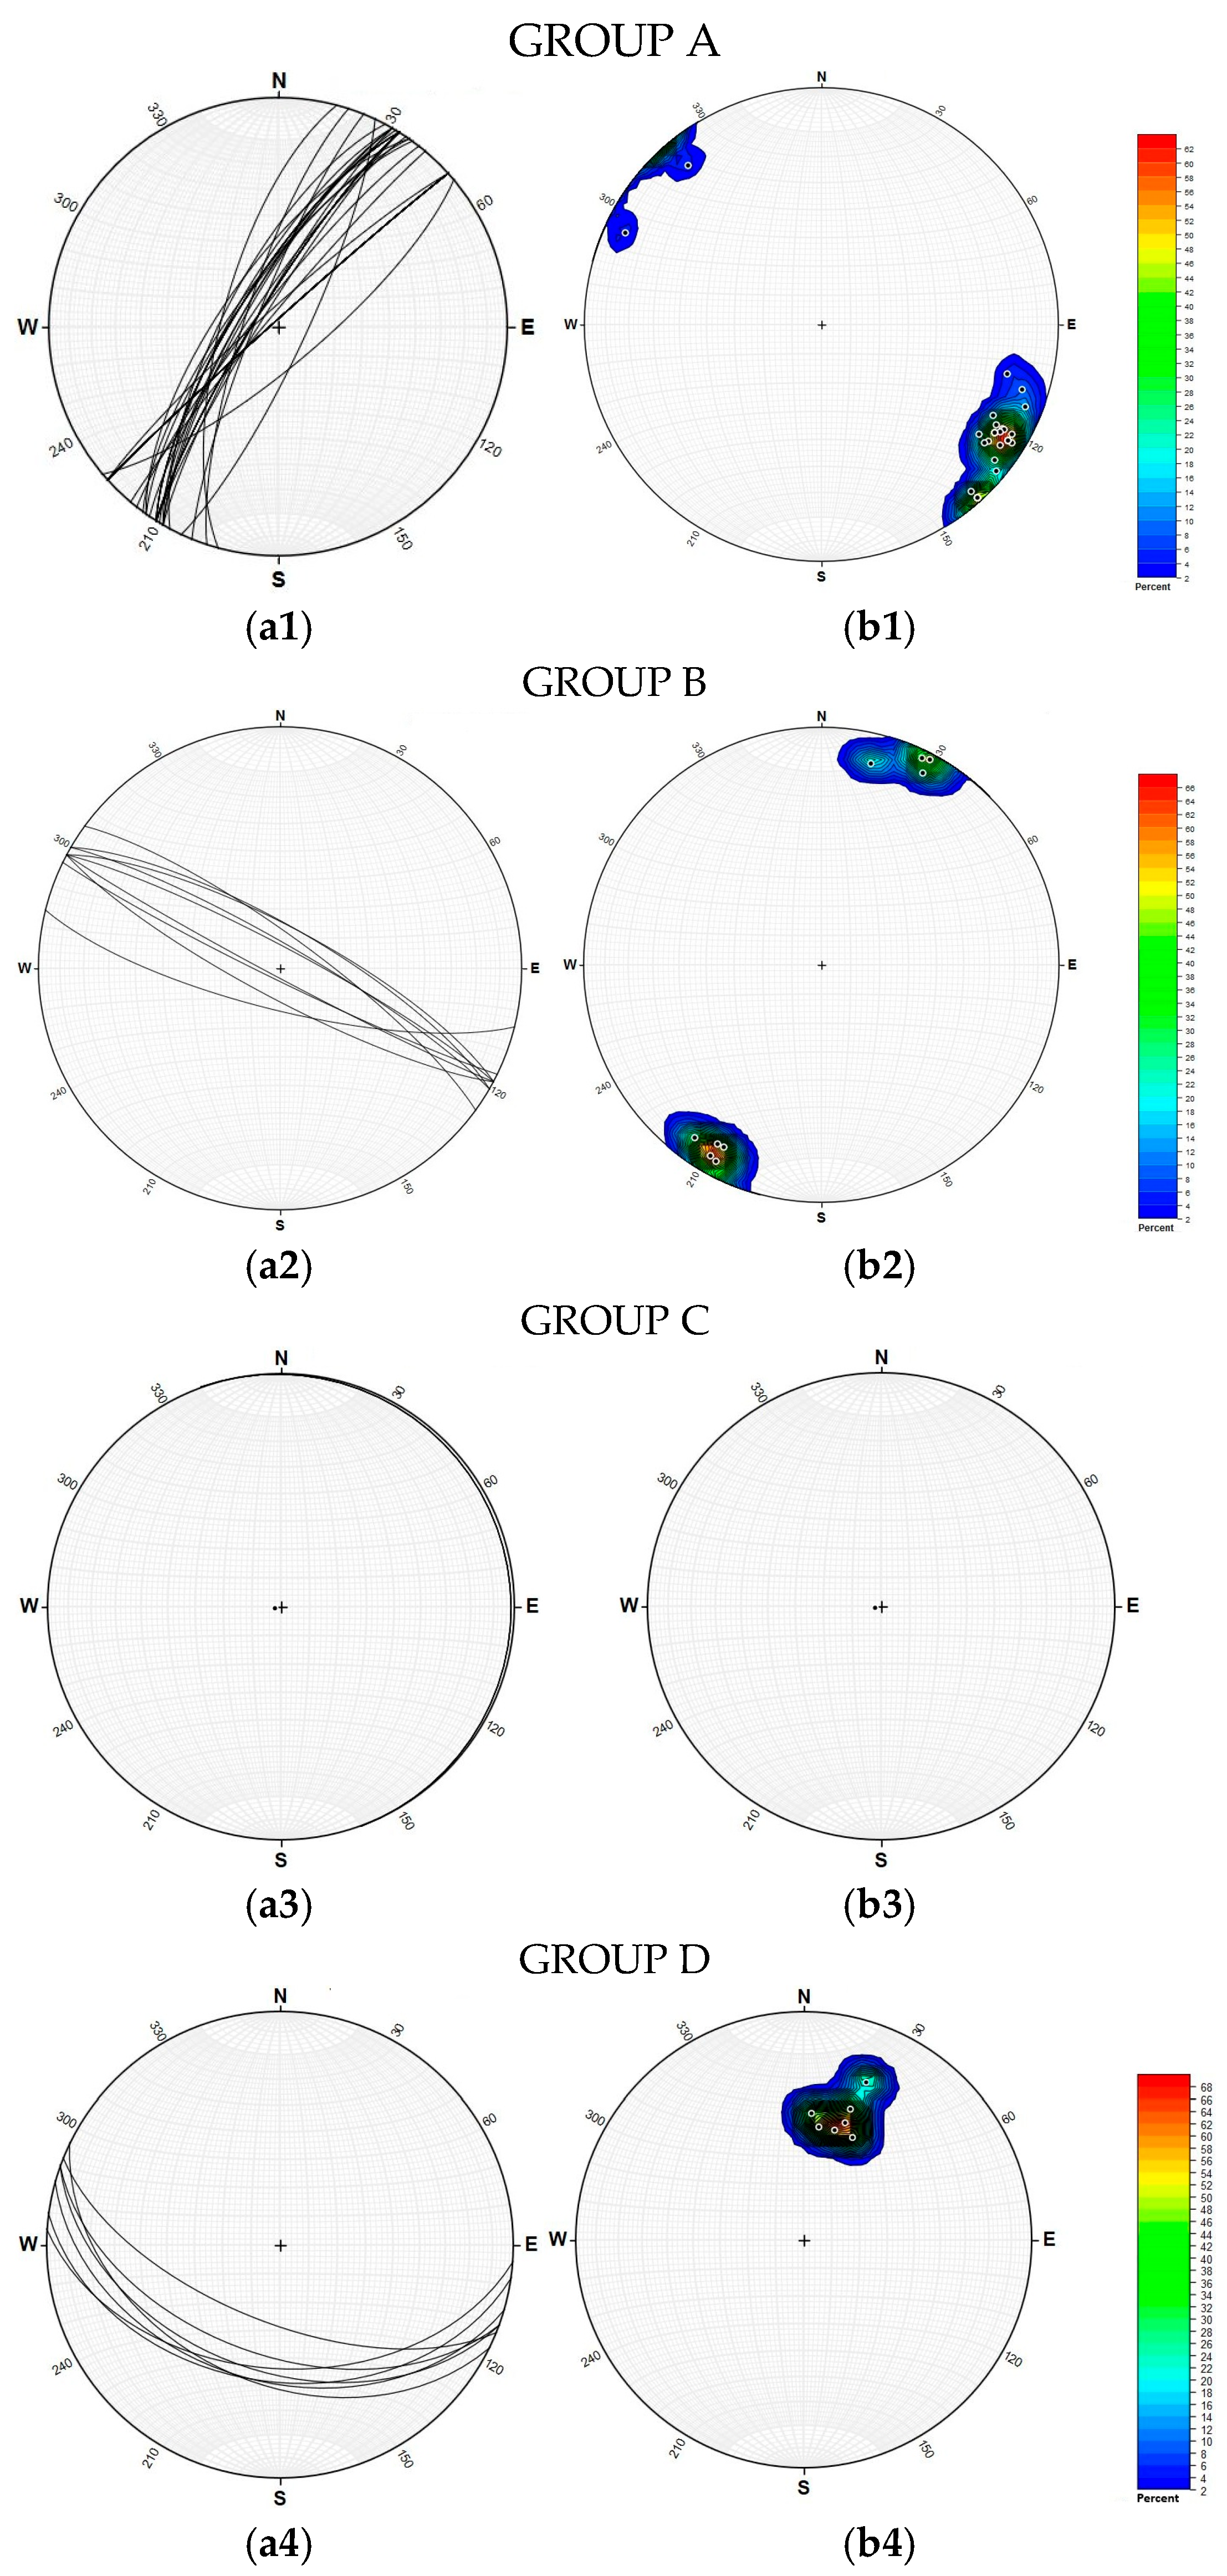
Figure 7.
Stereographic projections of the identified joint systems—Sector 1: (a1–a4) stereographic projection onto the lower hemisphere; (b1–b4) intersection points of normal to joint surfaces with the lower hemisphere (pole projection).
Figure 7.
Stereographic projections of the identified joint systems—Sector 1: (a1–a4) stereographic projection onto the lower hemisphere; (b1–b4) intersection points of normal to joint surfaces with the lower hemisphere (pole projection).
Figure 8.
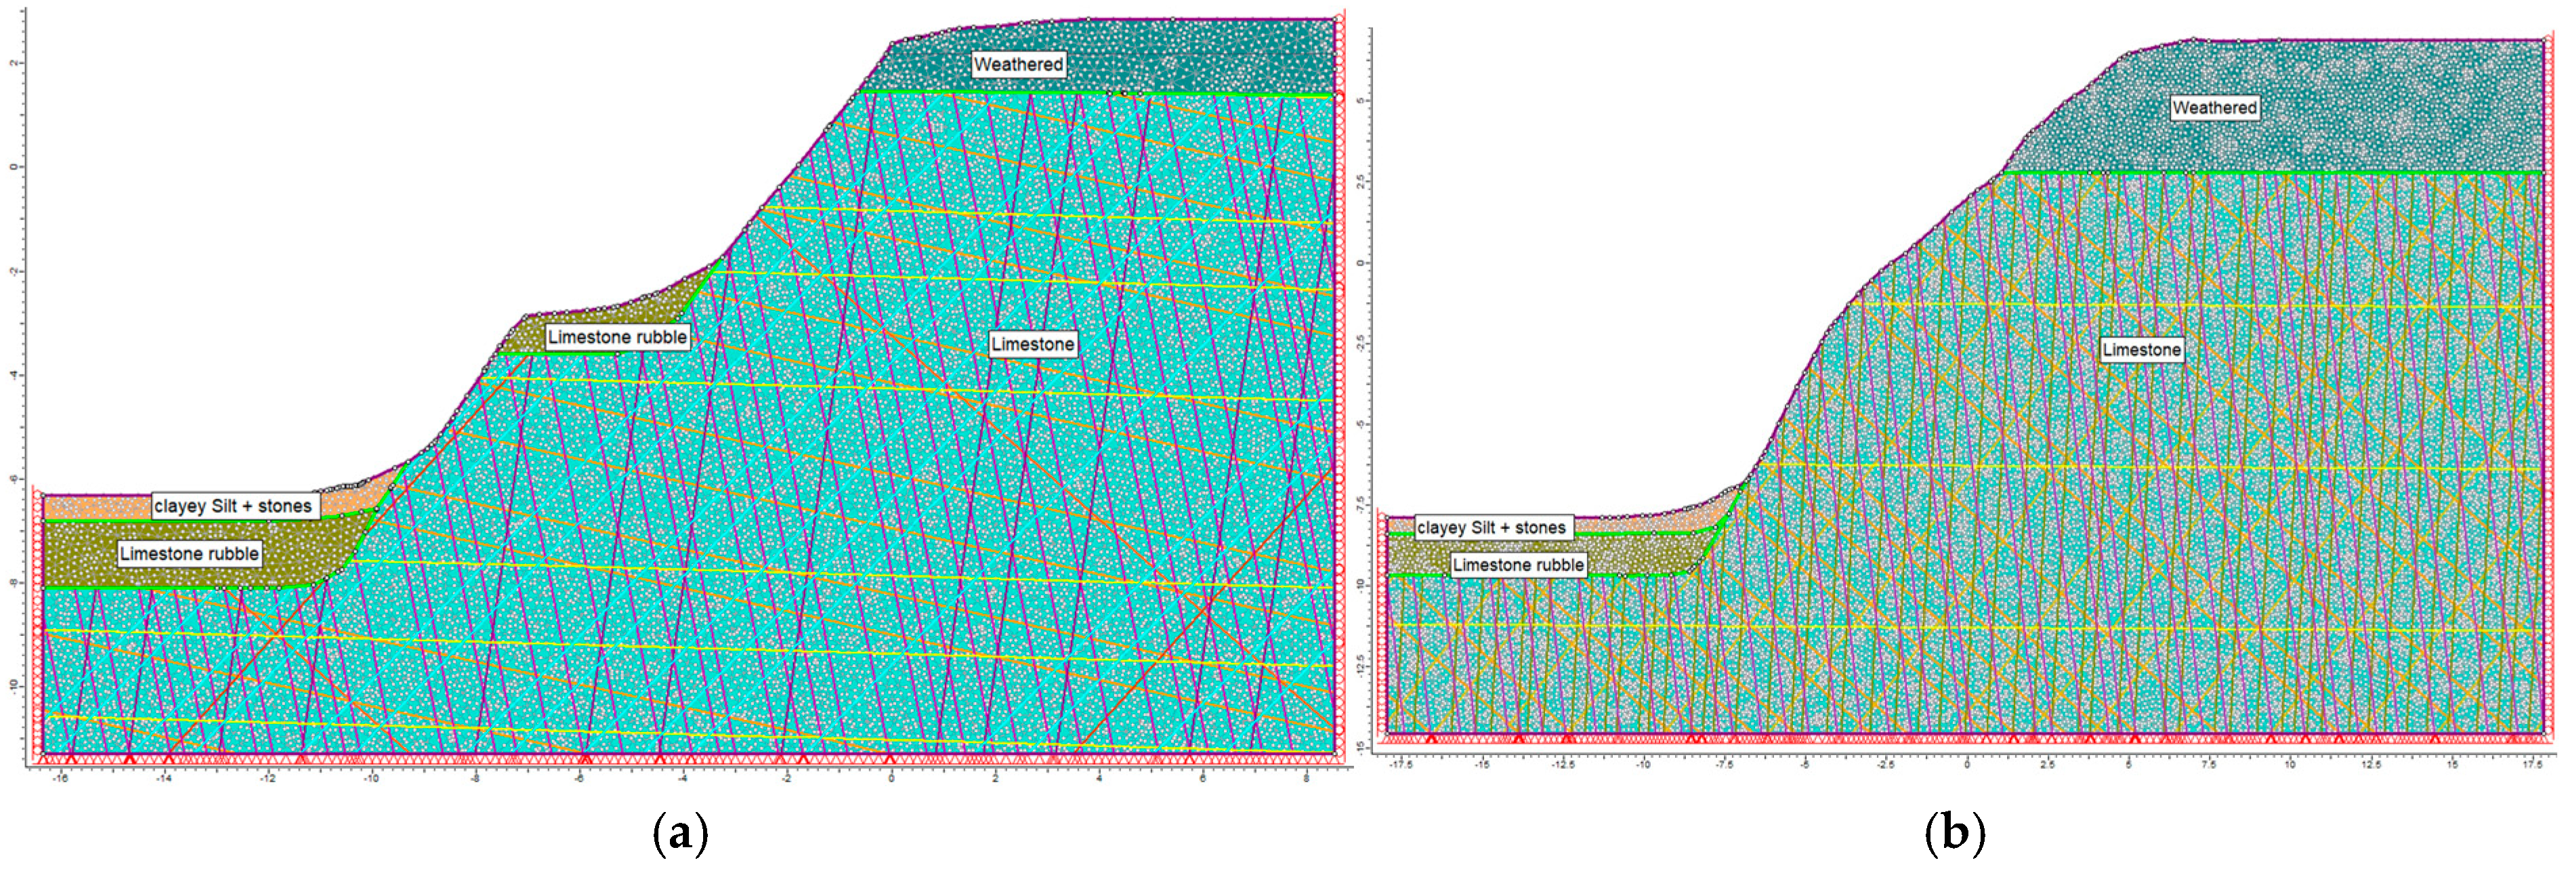
Computational models (a) Sector 1—cross-section 1 (joint group: orange line—A1, dark orange line—A2, brown line—A3, purple line—B1, dark purple line—B2,—yellow line—C, and light blue line—D); (b) Sector 3—cross-section 3 (joint group: orange line—A1, light orange line—A2, olive line—B, purple line—C, and yellow line—D).
Figure 8.
Computational models (a) Sector 1—cross-section 1 (joint group: orange line—A1, dark orange line—A2, brown line—A3, purple line—B1, dark purple line—B2,—yellow line—C, and light blue line—D); (b) Sector 3—cross-section 3 (joint group: orange line—A1, light orange line—A2, olive line—B, purple line—C, and yellow line—D).
Figure 9.
Computational models (a) Sector 4—cross-section 4 (joint group: orange line—A, dark green line—B1, olive line—B2, and purple line—C); (b) Sector 5—cross-section 5 (joint group: orange line—A, olive line—B, purple line—C, and yellow line—D); (c) Sector 6—cross-section 6 (joint group: light orange line—A1, orange line—A2, olive line—B1, green line—B2, purple line—C, yellow line—D1,—pale yellow line—D2, and light blue line—E).
Figure 10.
The slip surface for Sector 1, identified via the total displacement distribution, has a factor of safety (FS) of 5.18.
Figure 10.
The slip surface for Sector 1, identified via the total displacement distribution, has a factor of safety (FS) of 5.18.
Figure 11.
The slip surface for Sector 3, identified via the total displacement distribution, has a factor of safety (FS) of 1.41.
Figure 11.
The slip surface for Sector 3, identified via the total displacement distribution, has a factor of safety (FS) of 1.41.
Figure 12.
The slip surface for Sector 3 was identified based on the total displacement distribution; the weathered slope was excluded from the calculations, resulting in a factor of safety (FS) of 5.51.
Figure 12.
The slip surface for Sector 3 was identified based on the total displacement distribution; the weathered slope was excluded from the calculations, resulting in a factor of safety (FS) of 5.51.
Figure 13.
The slip surface for Sector 4 identified via the total displacement distribution; FS << 1.0.
Figure 13.
The slip surface for Sector 4 identified via the total displacement distribution; FS << 1.0.
Figure 14.
The slip surface for Sector 5 identified via the total displacement distribution; FS = 1.17.
Figure 14.
The slip surface for Sector 5 identified via the total displacement distribution; FS = 1.17.
Figure 15.
The slip surface for Sector 6 identified via the total displacement distribution; FS << 1.0.
Figure 15.
The slip surface for Sector 6 identified via the total displacement distribution; FS << 1.0.
Table 1.
Averaged orientation parameters of discontinuity sets for the designated sectors.
Table 1.
Averaged orientation parameters of discontinuity sets for the designated sectors.
| Sector | Joint
GROUP | Mean Dip Direction
[°] | Mean Dip Angle
[°] | Mean Spacing [m] | Min/Max Spacing [m] | Standard Deviation of Spacing
[m] | Infill |
|---|
| 1 | A1 | 306 | 81 | 0.76 | 0.10/3.00 | 0.744 | none |
| A2 | 115 | 80 | 12.16 | - | - | breccia |
| A3 | 140 | 76 | 12.92 | - | - | none |
| B1 | 30 | 79 | 0.47 | 0.24/0.81 | 0.200 | humus |
| B2 | 204 | 82 | 1.13 | 0.30/2.65 | 1.080 | humus |
| C | 70 | 2 | 1.28 | 0.70/2.90 | 0.940 | silica |
| D | 197 | 47 | 0.74 | 0.20/0.50 | 0.800 | none |
| 2 | A | 283 | 80 | 0.89 | 0.25/2.40 | 0.620 | none |
| B1 | 25 | 83 | 0.88 | 0.60/1.46 | 0.400 | humus |
| B2 | 205 | 88 | 1.11 | 0.43/2.14 | 0.740 | none |
| C1 | 357 | 85 | 6.00 | - | - | none |
| C2 | 2 | 83 | 0.76 | 0.70/0.84 | 0.058 | none |
| D | 70 | 2 | 3.50 | 2.30/4.70 | 1.200 | silica |
| 3 | A1 | 220 | 79 | 0.82 | 0.30/2.69 | 0.800 | none |
| A2 | 41 | 83 | 1.27 | 0.07/4.53 | 1.530 | none |
| B | 320 | 87 | 0.53 | 0.25/0.80 | 0.280 | none |
| C | 68 | 88 | 0.66 | 0.43/0.89 | 0.230 | none |
| D | 306 | 81 | 0.76 | 0.10/3.00 | 0.744 | none |
| 4 | A | 312 | 60 | 0.31 | 0.10/0.70 | 0.190 | none |
| B1 | 102 | 86 | 1.01 | 0.40/2.30 | 0.640 | none |
| B2 | 270 | 80 | 2.60 | 0.40/7.00 | 3.110 | none |
| C | 341 | 69 | 0.55 | 0.45/0.65 | 0.071 | none |
| 5 | A | 34 | 72 | 0.62 | 0.10/3.40 | 0.770 | humus |
| B | 238 | 87 | 1.24 | 0.43/2.20 | 0.590 | none |
| C | 287 | 73 | 0.54 | 0.24/0.92 | 0.230 | none |
| D | 140 | 70 | 5.00 | - | - | none |
| 6 | A1 | 20 | 88 | 6.50 | - | - | none |
| A2 | 208 | 78 | 0.93 | 0.47/1.33 | 0.340 | none |
| B1 | 276 | 83 | 2.00 | 0.80/3.20 | 1.200 | none |
| B2 | 110 | 84 | 2.50 | 1.20/5.10 | 1.840 | karst breccia |
| C | 344 | 72 | 1.09 | 0.18/2.90 | 0.940 | none |
| D1 | 260 | 83 | 5.00 | - | - | none |
| D2 | 60 | 81 | 0.42 | 0.30/0.53 | 0.020 | karst breccia |
| E | 308 | 81 | 5.00 | - | - | none |
| 7 | A1 | 22 | 83 | 2.50 | 0.55/4.60 | 1.660 | karst breccia |
| A2 | 3 | 85 | 3.41 | 0.36/9.17 | 4.070 | none |
| B | 302 | 81 | 0.44 | 0.15/1.10 | 0.230 | none |
| C | 50 | 75 | 0.86 | 0.20/1.70 | 0.510 | none |
| D | 70 | 2 | 0.54 | 0.36/0.74 | 0.140 | none |
| 8 | A1 | 264 | 76 | 5.00 | - | - | none |
| A2 | 110 | 87 | 0.37 | 0.20/0.50 | 0.100 | none |
| B1 | 16 | 76 | 4.00 | - | - | karst breccia |
| B2 | 349 | 79 | 0.39 | 0.20/0.80 | 0.210 | karst breccia |
| C | 297 | 49 | 1.60 | 1.40/1.80 | 0.200 | karst breccia |
| D | 211 | 73 | 1.73 | 0.80/3.40 | 1.050 | karst breccia |
Table 2.
Mechanical properties of the limestone rock mass.
Table 2.
Mechanical properties of the limestone rock mass.
| Properties | Sector 1 | Sector 2 | Sector 3 | Sector 4 | Sector 5 | Sector 6 | Sector 7 | Sector 8 |
|---|
| Unit weight [kN/m3] | 25.11 | 25.11 | 25.11 | 25.11 | 25.11 24.13 1 | 25.11 | 25.11 | 25.11 |
| Cohesion [MPa] | 6.522 | 6.057 | 5.313 | 4.867 | 5.202 1.709 1 | 6.429 | 7.341 | 5.741 |
| Angle of internal friction [°] | 50.589 | 50.529 | 50.413 | 50.329 | 50.394 50.495 1 | 50.578 | 50.678 | 50.483 |
| Uniaxial compressive strength [MPa] | 35.1 | 32.6 | 28.60 | 26.2 | 28.0 9.2 1 | 34.6 | 39.5 | 30.9 |
| Tensile strength [MPa] | 3.900 | 3.622 | 3.178 | 2.911 | 3.111 1.022 1 | 3.844 | 4.389 | 3.433 |
Table 3.
Mechanical parameters of fracture fillings.
Table 3.
Mechanical parameters of fracture fillings.
| Properties | None | Humus | Breccia | Karst Breccia | Silica |
|---|
| Cohesion [kPa] | - | 11.61 | 29.00 | 30.00—Sector 6
19.00—Sector 7
17.00—Sector 8 | 9127—Sector 1
12,905—Sector 2
7489—Sector 3 |
Angle of internal
friction [°] | 25.197–45.530 1 | 8.790 | 29.091 | 19.677—Sector 6
24.846—Sector 7
24.846—Sector 8 | 50.820—Sector 1
50.998—Sector 2
50.692—Sector 3 |
Table 4.
Mechanical parameters of soil layers.
Table 4.
Mechanical parameters of soil layers.
| Parameters | Gravelly Sand and
Crushed Stone | Silty Clay with Cobbles | Cobbles with Medium and Clayey Sand and
Limestone Debris | Weathered Rock |
|---|
| Unit weight [kN/m3] | 19.96 | 23.74 | 21.04 | 20.35 |
| Cohesion [kPa] | - | 19.35 | 2.00 1 | - |
Angle of internal
friction [°] | 38.04 | 14.65 | 35.60 | 37.06 2 |
| Disclaimer/Publisher’s Note: The statements, opinions and data contained in all publications are solely those of the individual author(s) and contributor(s) and not of MDPI and/or the editor(s). MDPI and/or the editor(s) disclaim responsibility for any injury to people or property resulting from any ideas, methods, instructions or products referred to in the content. |
© 2025 by the authors. Licensee MDPI, Basel, Switzerland. This article is an open access article distributed under the terms and conditions of the Creative Commons Attribution (CC BY) license (https://creativecommons.org/licenses/by/4.0/).


