1. Introduction
In the DC transmission project, due to the hysteresis effect of the silicon steel sheet, there is remanence in the core of the converter transformer [
1,
2,
3]. When the converter transformer core is in a deep saturation state, the excitation inductance of the converter transformer will decrease sharply, and finally a inrush current of up to several times the rated current will be generated [
4,
5,
6]. At the same time, compared with the power transformer, due to the larger capacity of the converter transformer and the higher level of remanence, the amplitude of the inrush current is higher and the attenuation is slower. Because the force generated by the inrush current acting on the winding will cause severe vibration of the converter transformer and its components, there is a risk of misoperation of the protection equipment and damage to the converter transformer device [
7,
8,
9]. Therefore, it is of great significance to study the inrush current of the converter transformer and the vibration of the converter transformer components to reduce the damage to the converter transformer and improve its reliability.
Most of the existing research focuses on the identification of magnetizing the inrush current [
10,
11] and suppression [
12,
13,
14,
15] strategies, as well as obtaining the vibration characteristics of the transformer under rated operating conditions for transformer-fault diagnosis. Zhu, X. [
16] of Shandong University separated the vibration sources of the converter transformer as the vibration signals of the winding and the core through the blind source separation algorithm of the vibration signal, and realized the feature extraction of the signal based on the variational mode decomposition feature extraction method and the adaptive decomposition algorithm. Wang, Z. [
17] of North China Electric Power University and others analyzed the vibration signal through horizontal and vertical thresholds, which can effectively judge the defects of transformer over-excitation, core clamp loosening, core multi-point grounding and DC bias. Based on the analysis of the vibration mechanism of the transformer, Wang, H. [
18] of Shenyang University of Technology obtained the electromagnetic distribution inside the transformer and the vibration characteristics of the core and winding under no-load and load-short-circuit conditions by finite element simulation. At present, there is a lack of relevant research on the time–frequency characteristics of magnetizing the inrush current, that is, the vibration characteristics of each component of the converter transformer under the magnetizing inrush current, and it is impossible to effectively evaluate the vibration of the converter transformer components caused by the magnetizing inrush current.
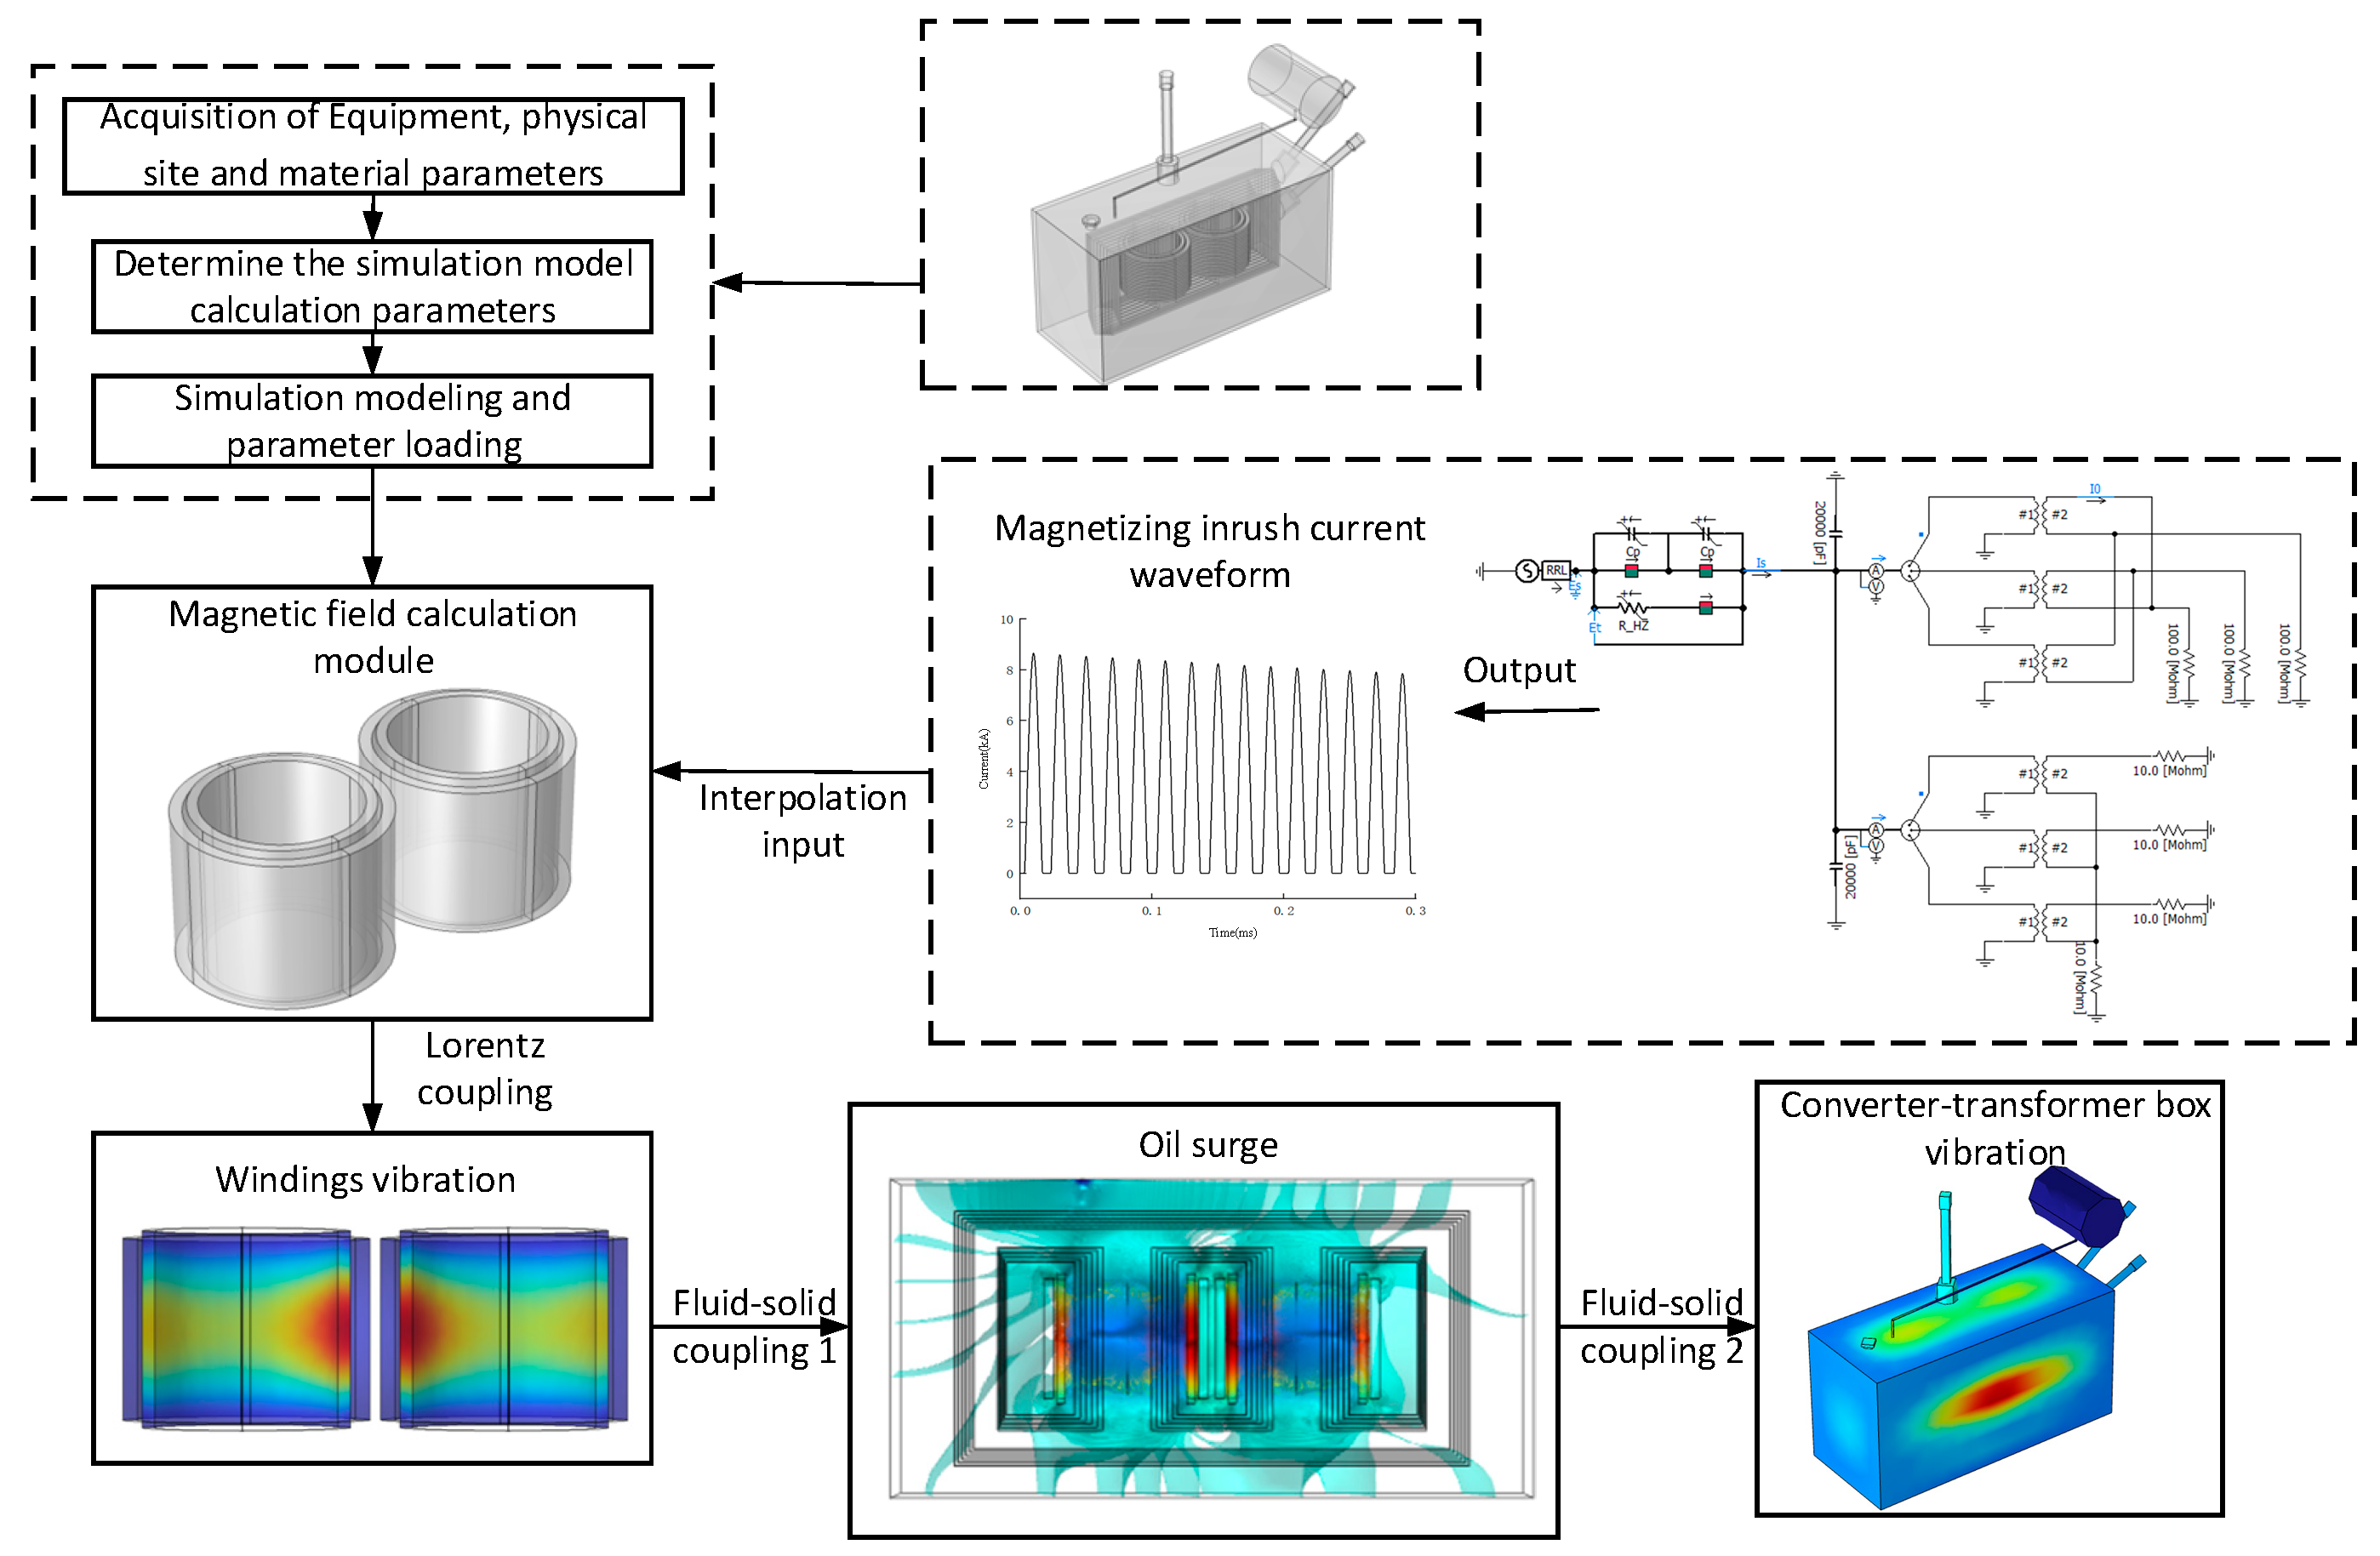
Aiming to address the above problems, this paper studies the generation of the inrush current of the converter transformer and its time–frequency characteristics under various working conditions by constructing the equivalent electromagnetic transient model of Dongfang Converter Station. Based on the finite element simulation model under the coupling of electromagnetic-force-flow multi-physical fields, the time–frequency characteristics of the vibration of some components of the converter transformer under the action of magnetizing inrush current are studied. The finite element simulation model of electromagnetic-force-flow multi-physical field coupling was established by COMSOL Multiphysics 6.0. The advantages of this method are as follows: (1) through multi-physical field coupling, the interaction mechanism of electromagnetic field-structure field-flow field under transient excitation of the inrush current is accurately reflected; (2) based on the synchronous solution of Maxwell’s equations, solid mechanics equations and fluid control equations, the electromagnetic force vibration of winding caused by the inrush current can be quantitatively analyzed and (3) the transmission path of vibration energy and the distribution law of the key frequency band are revealed economically and efficiently, which provides a theoretical basis for the design of transformer anti-inrush vibration. The research results can provide a basis for the threshold research of the inrush current, can further improve the reliability of converter transformers, and can make them operate safely and stably.
2. Generation of Converter Transformer Inrush Current and Its Time–Frequency Characteristics
2.1. Generation Mechanism of No-Load Inrush Current
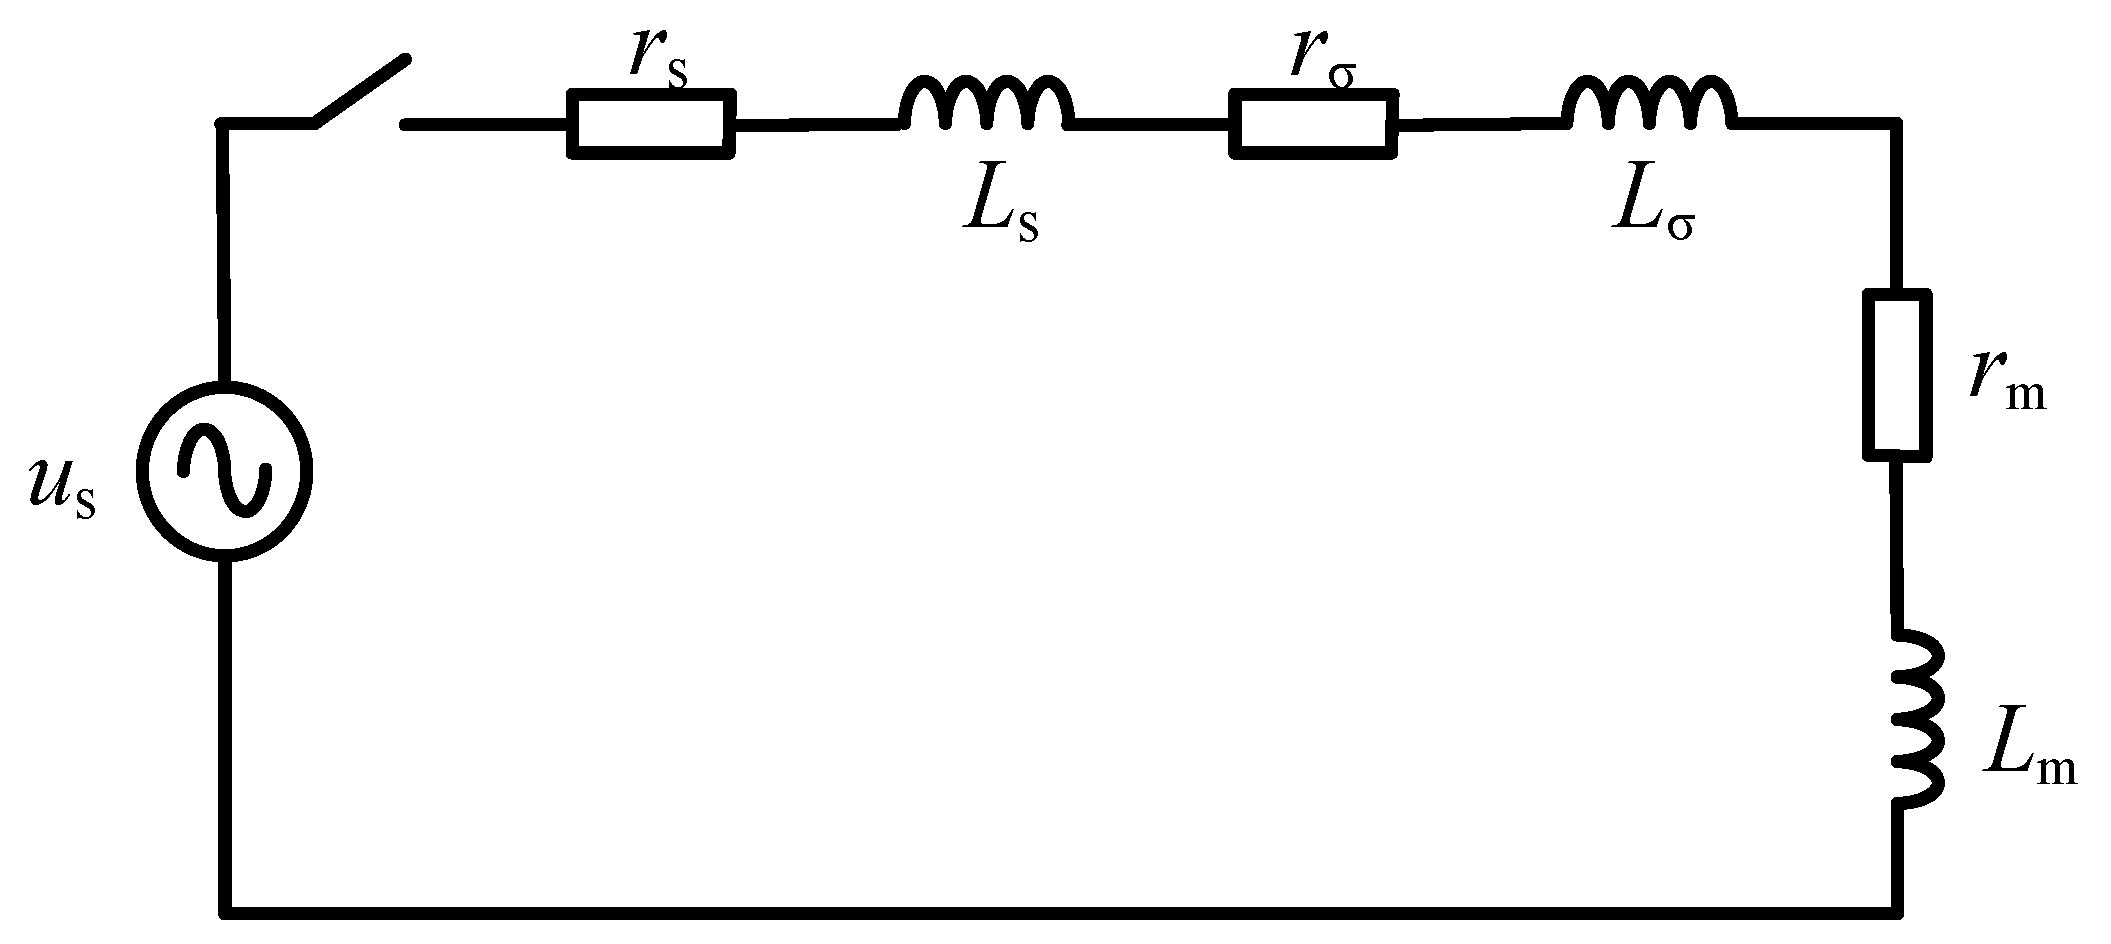
Due to the deep saturation of the core during the closing of the converter transformer, the excitation impedance is reduced, resulting in an internal inrush current. The no-load closing equivalent circuit of the converter transformer is shown in
Figure 1. The mechanism of the magnetizing inrush current is as follows:
rs and
Ls are the resistance and inductance of the AC power supply;
rσ and
Lσ are the resistance and inductance of the primary side of the converter transformer and
rm and
Lm are the excitation resistance and excitation inductance of the converter transformer. Suppose the power supply voltage is
us(
t) =
Umsin(
ωt +
θ), the total resistance of the circuit is
r =
rs +
rσ +
rm, the total inductance of the circuit is
L =
Ls +
Lσ +
Lm, and the circuit satisfies Formula (1).
In the formula, i is the excitation current; t is the closing time of converter transformer; um is the amplitude of the power supply voltage and ω is the angular velocity of the converter transformer under power frequency. When the saturation degree of the core deepens, both xm and rm decrease with the saturation of the magnetic circuit. Since rm = 2πfLm, L and r decrease. Since us is constant, the value of the excitation current i will rise sharply.
When the core of the converter transformer is unsaturated, the relationship between the flux linkage
and the excitation current
is
. By using Kirchhoff’s voltage law, we can obtain
In the formula,
is the excitation flux linkage, and its expression is
;
is the closing angle of the converter transformer;
is the residual magnetism inside the core of the converter transformer;
ω is the power frequency angular velocity;
θ is the circuit;
L is the total inductance of the circuit; and
r is the total resistance of the circuit. Because the reactance inside the circuit is much larger than the resistance, and when the closing angle
φ = 90°, Equation (2) is
The magnetization curve is approximately regarded as two straight lines connected, and the formula of the amplitude of the excitation current is
In the formula, Ψs is the flux linkage corresponding to the knee point; Φm is the excitation flux; Φr is the remanence of iron core; Φs is the knee-point flux; and N is the number of coil turns.
2.2. Time–Frequency Characteristic Analysis of Magnetizing Inrush Current
2.2.1. Peak Feature
Since
r is much smaller than
ωL, and the time to calculate the first waveform is short, the attenuation effect of the inrush current under the first waveform is ignored. When the magnetic flux reaches the maximum value, that is, the magnetic flux is 2
Ψmcos
θ +
Ψr, the inrush current reaches the peak value at this time, and the expression of the peak value of the first current waveform of the inrush current is
Considering the attenuation of the inrush current with time, the expression of the peak value of the inrush current is
By controlling the closing angle and the remanence, the inrush current waveform under different working conditions can be obtained. At the same time, the amplitude of the inrush current can be adjusted by suppressing the closing angle and the remanence, so as to avoid the equipment damage caused by the excessive amplitude of the inrush current.
2.2.2. Breaking Angle Characteristics
In a cycle, when entering the saturation zone, the instantaneous value of the inrush current will rise sharply. The inrush current is between
θ1 and
θ2 on the way. At this time, the expression of the disconnection angle
θ is
In the unsaturated zone, only the excitation current with a small amplitude can be ignored, that is, the excitation current generated by the converter transformer in the unsaturated state
is ≈ 0. Substituting the instantaneous value of the current to 0, we can get
By solving the above equation, we can obtain
Substituting Formulas (9) and (10) into (8), the expression of the breaking angle can be obtained:
The main cause affecting the inrush current breaking angle is the size of the closing angle. When cosθ is larger, the breaking angle is smaller. In addition to the closing angle, the core remanence also has a certain effect, but its influence is small.
2.2.3. Fading Characteristic
After the converter transformer is closed, the time constant
τ of the inrush current attenuation is expressed as
It can be concluded that the decay time of the inrush current is related to the ratio of total reactance to total resistance in the converter transformer.
2.2.4. Frequency Domain Characteristics
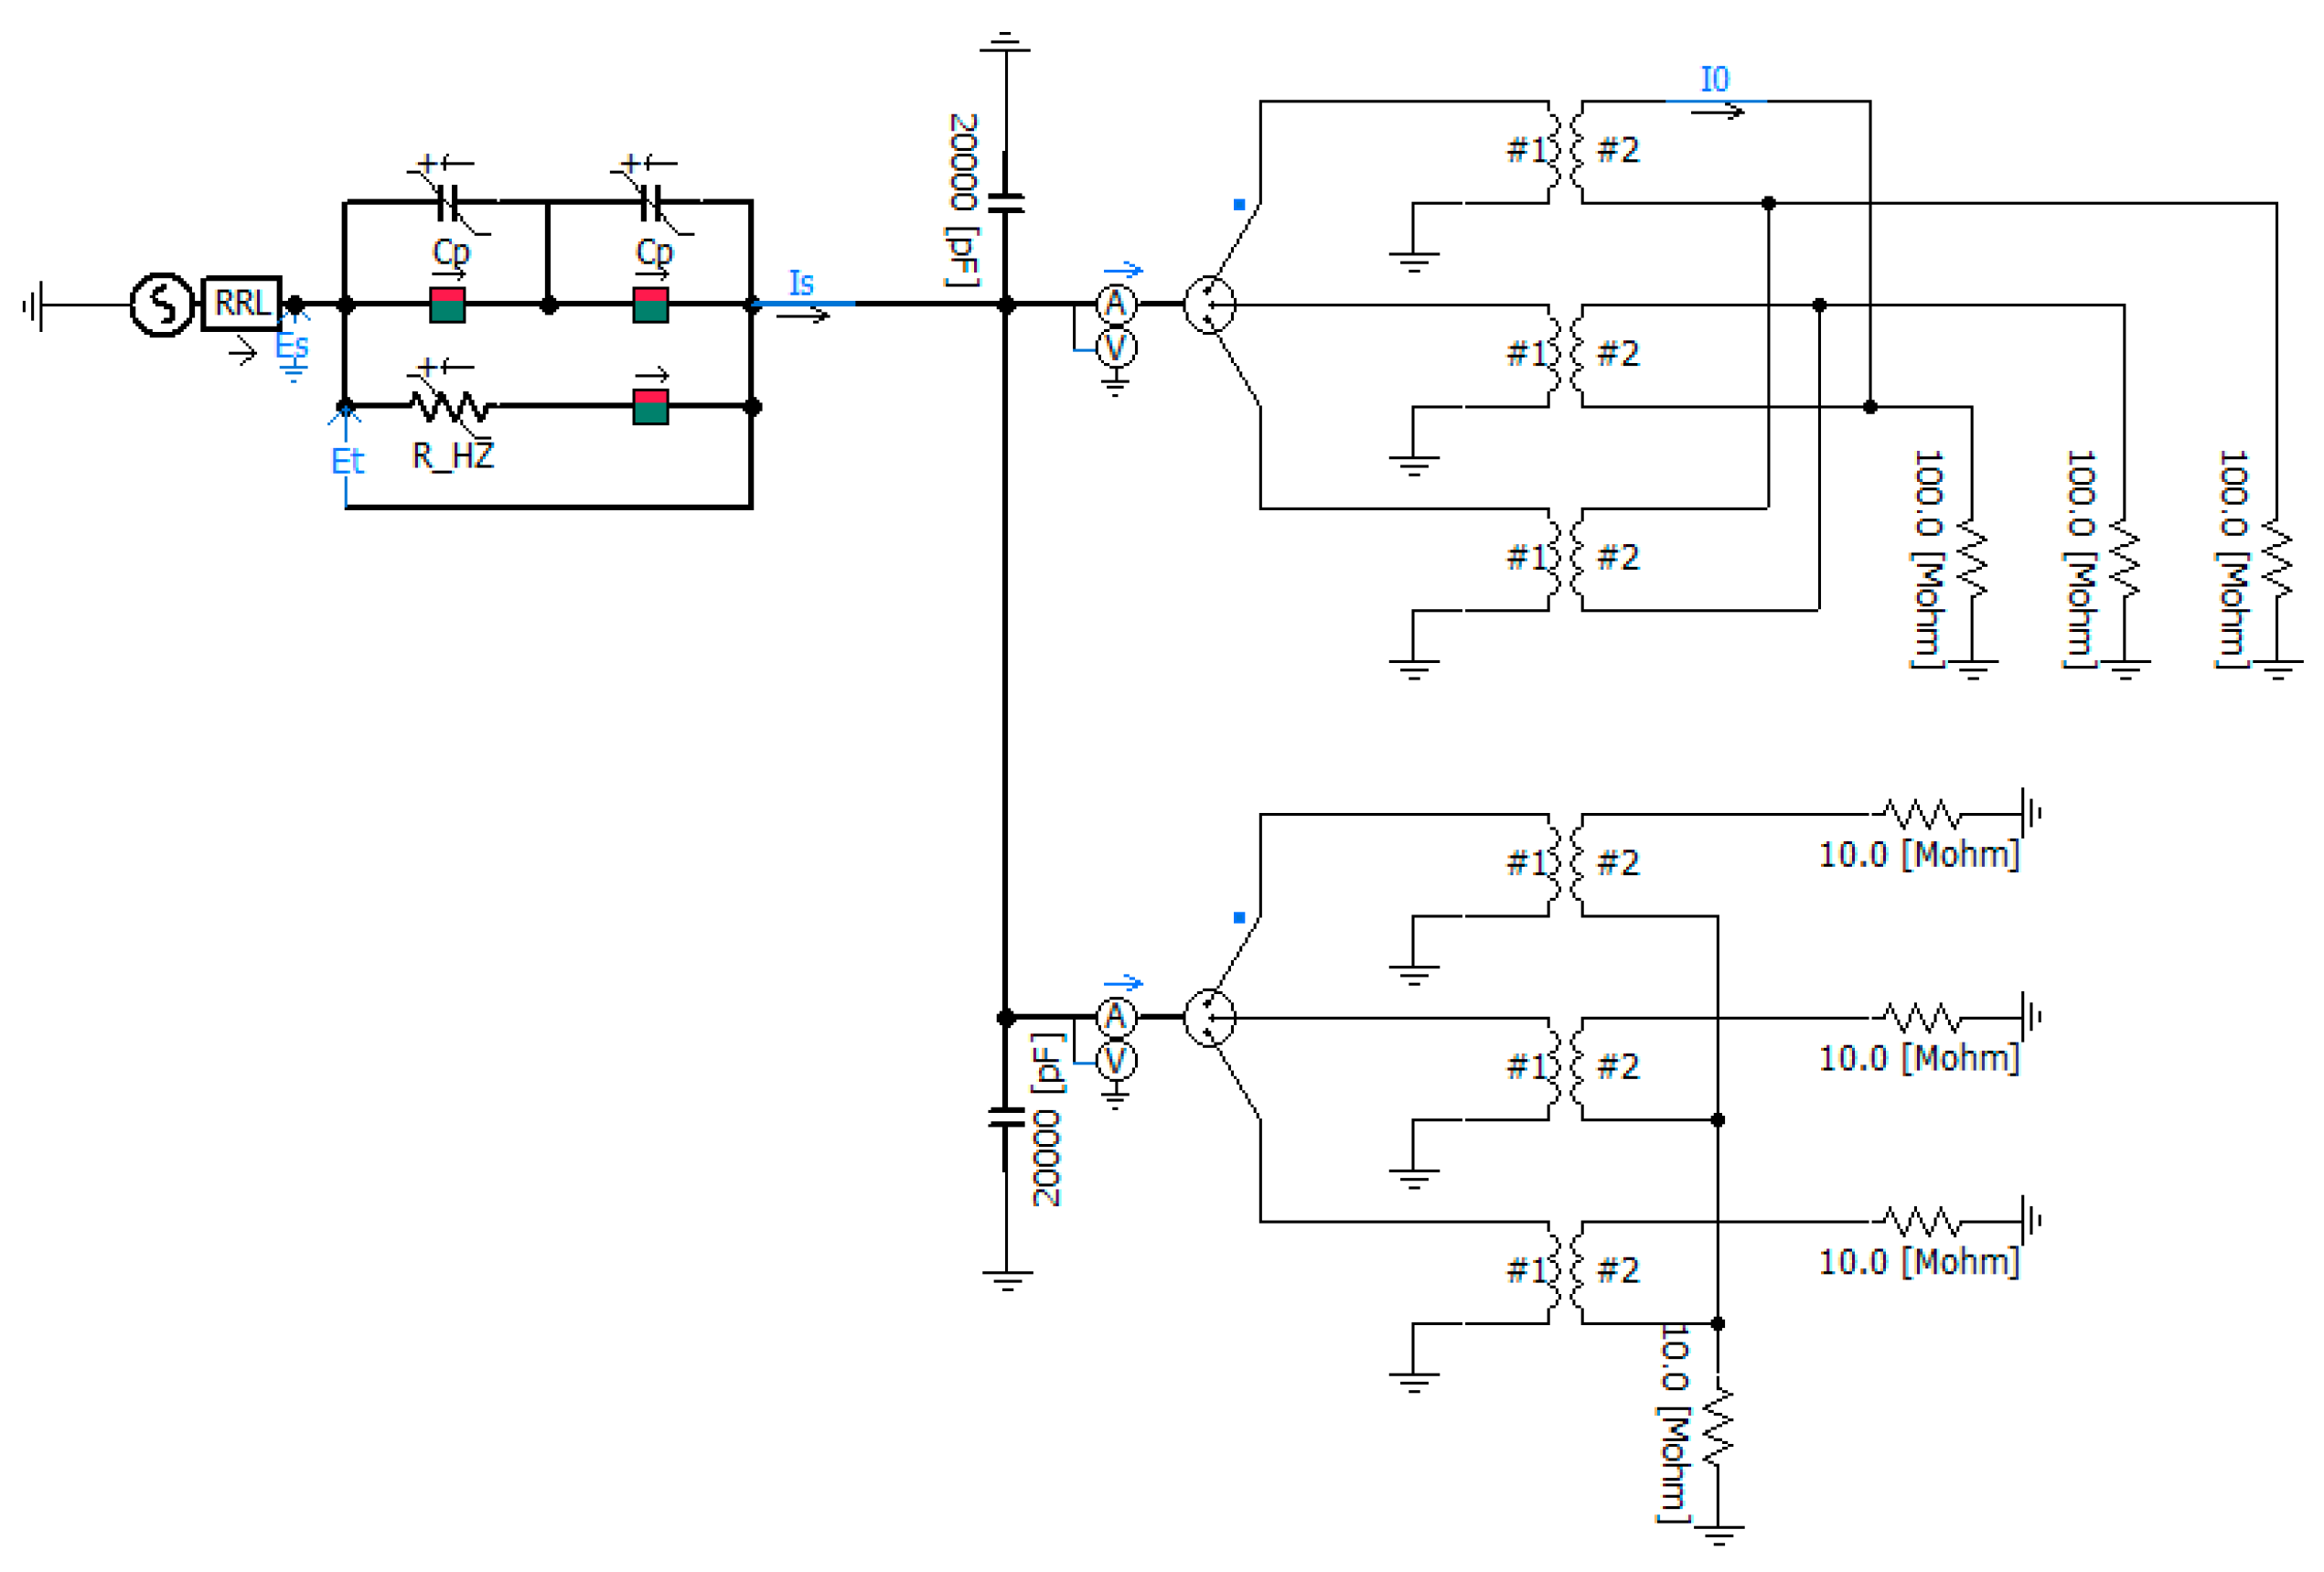
The equivalent circuit of the inrush current based on the conventional DC converter station of Dongfang Converter Station based on PSCAD is shown in
Figure 2. The specific simulation parameters are shown in
Table 1.
The working conditions are as follows: (1) the closing angle is 0°, and the remanence is 0.8 p.u.; (2) the closing angle is 0°, and the remanence is 0.2 p.u.; (3) the closing angle is 30°, and the remanence is 0.8 p.u.; (4) the closing angle is 30°, and the remanence is 0.2 p.u.; (5) the closing angle is 60°, and the remanence is 0.8 p.u. and (6) the closing angle is 60° and the remanence is 0.2 p.u. The main frequency of the inrush current of the converter transformer is concentrated in the range of 0–500 Hz, and the inrush current is mainly concentrated at 50 Hz, as is its frequency doubling component, except the DC component, for which the main frequency is 50 Hz. The current components and their contents under different working conditions are shown in the following
Table 2 and
Table 3.
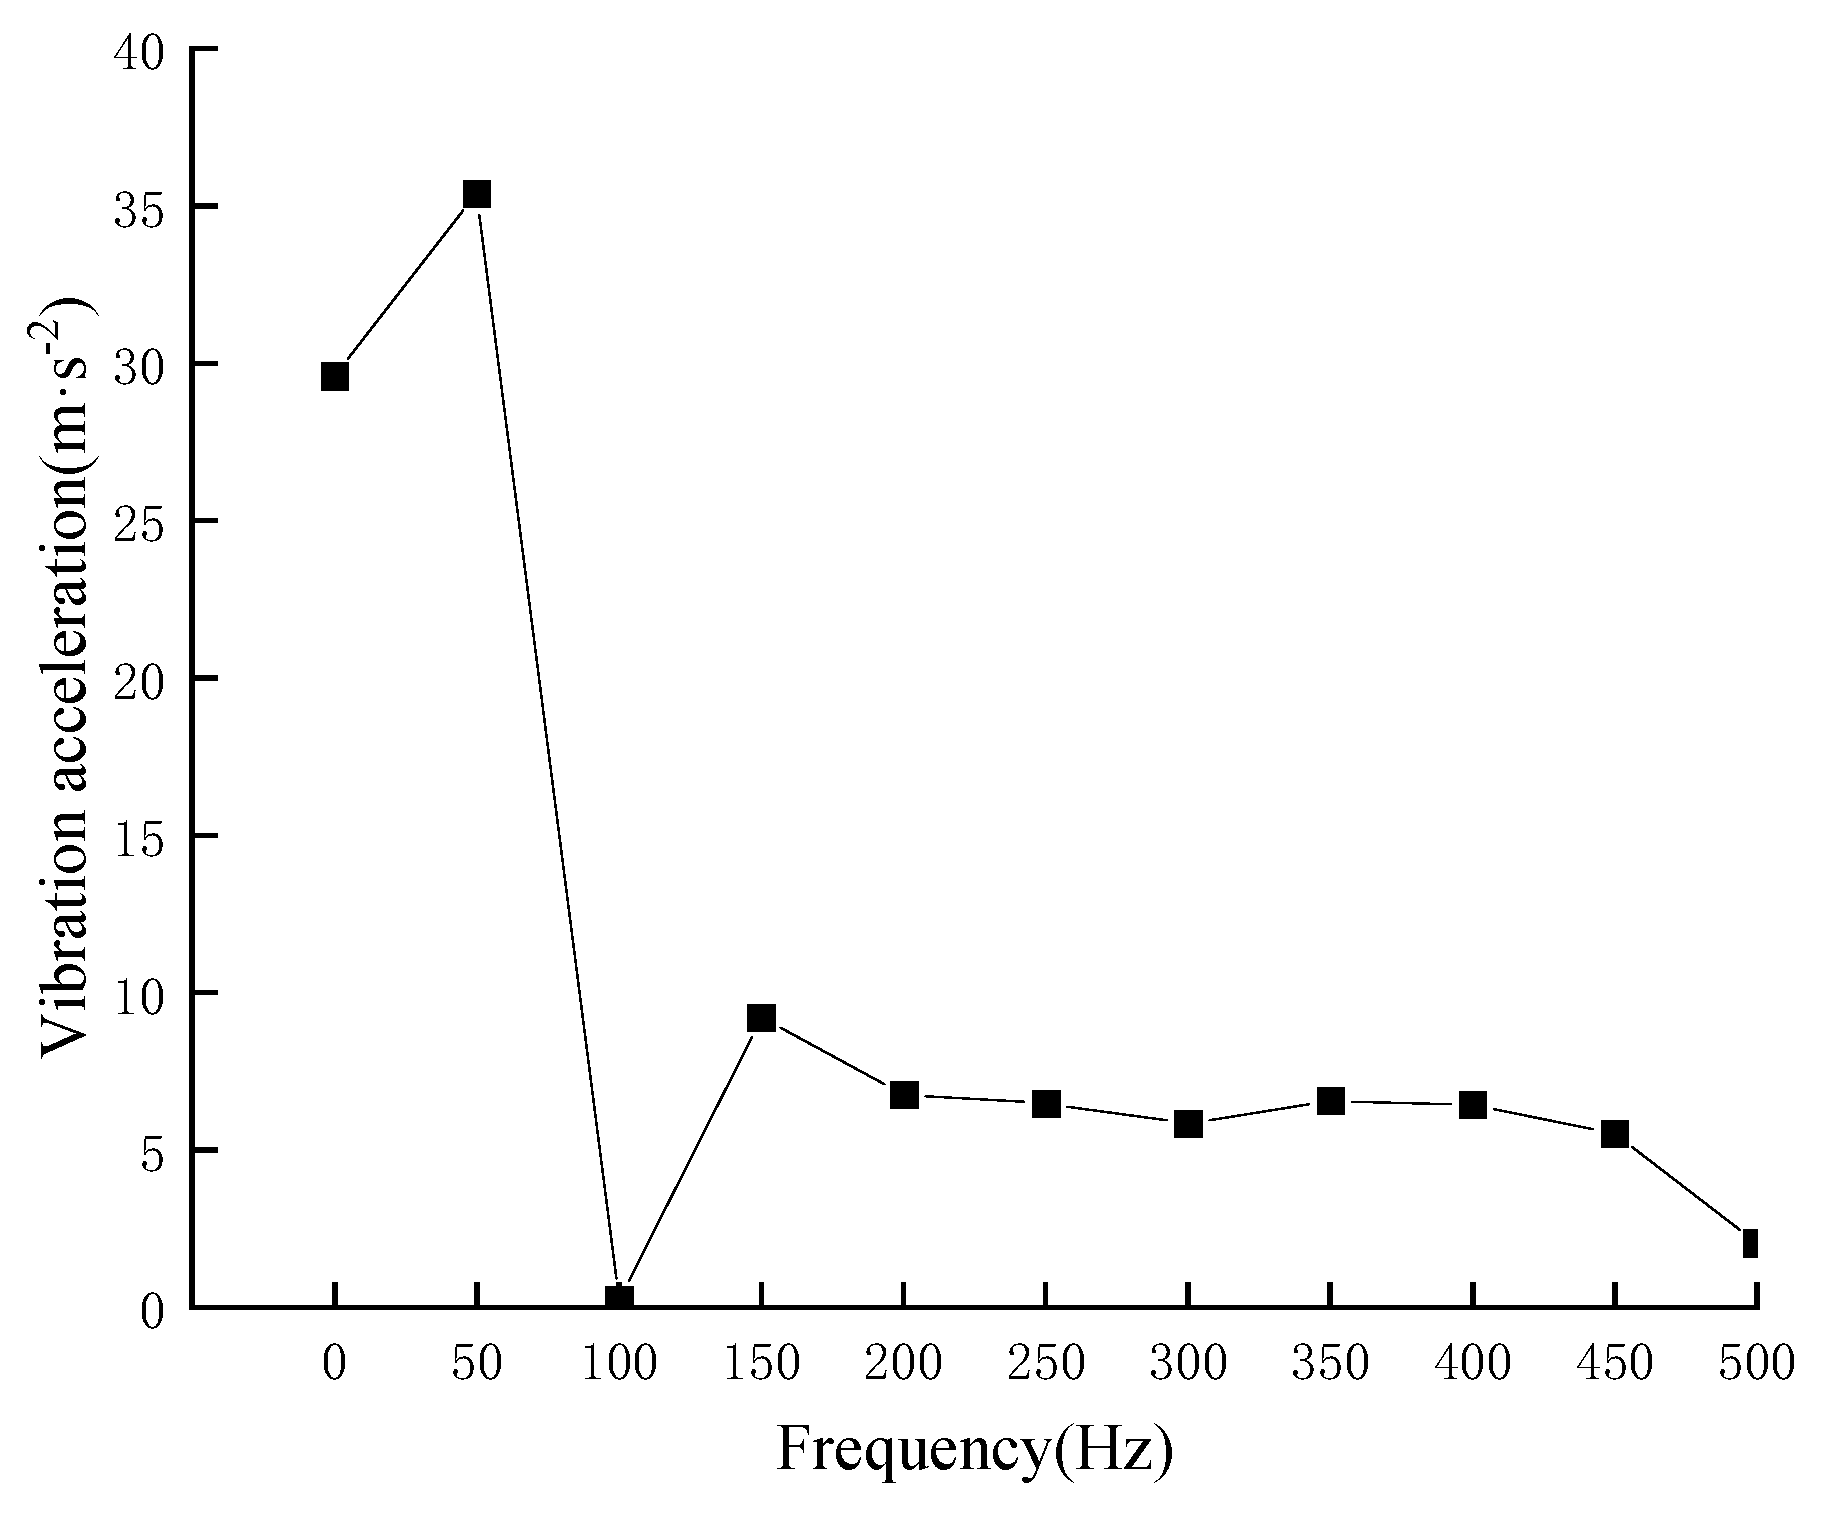
From the results, it can be seen that for the spectrum under different working conditions, as the amplitude of the inrush current increases, the current component at the fundamental frequency (50 Hz) will also increase. The DC component accounts for about 50–70% of the fundamental component, and in addition to the main frequency, other frequency doublings are affected by factors such as current amplitude and remanence, and it is difficult to judge their size by single-factor characteristics. When the harmonic is more than eight times (400 Hz), the content is less than 5%.
3. Analysis of Internal Vibration Signal Transmission Mechanism of Converter Transformer
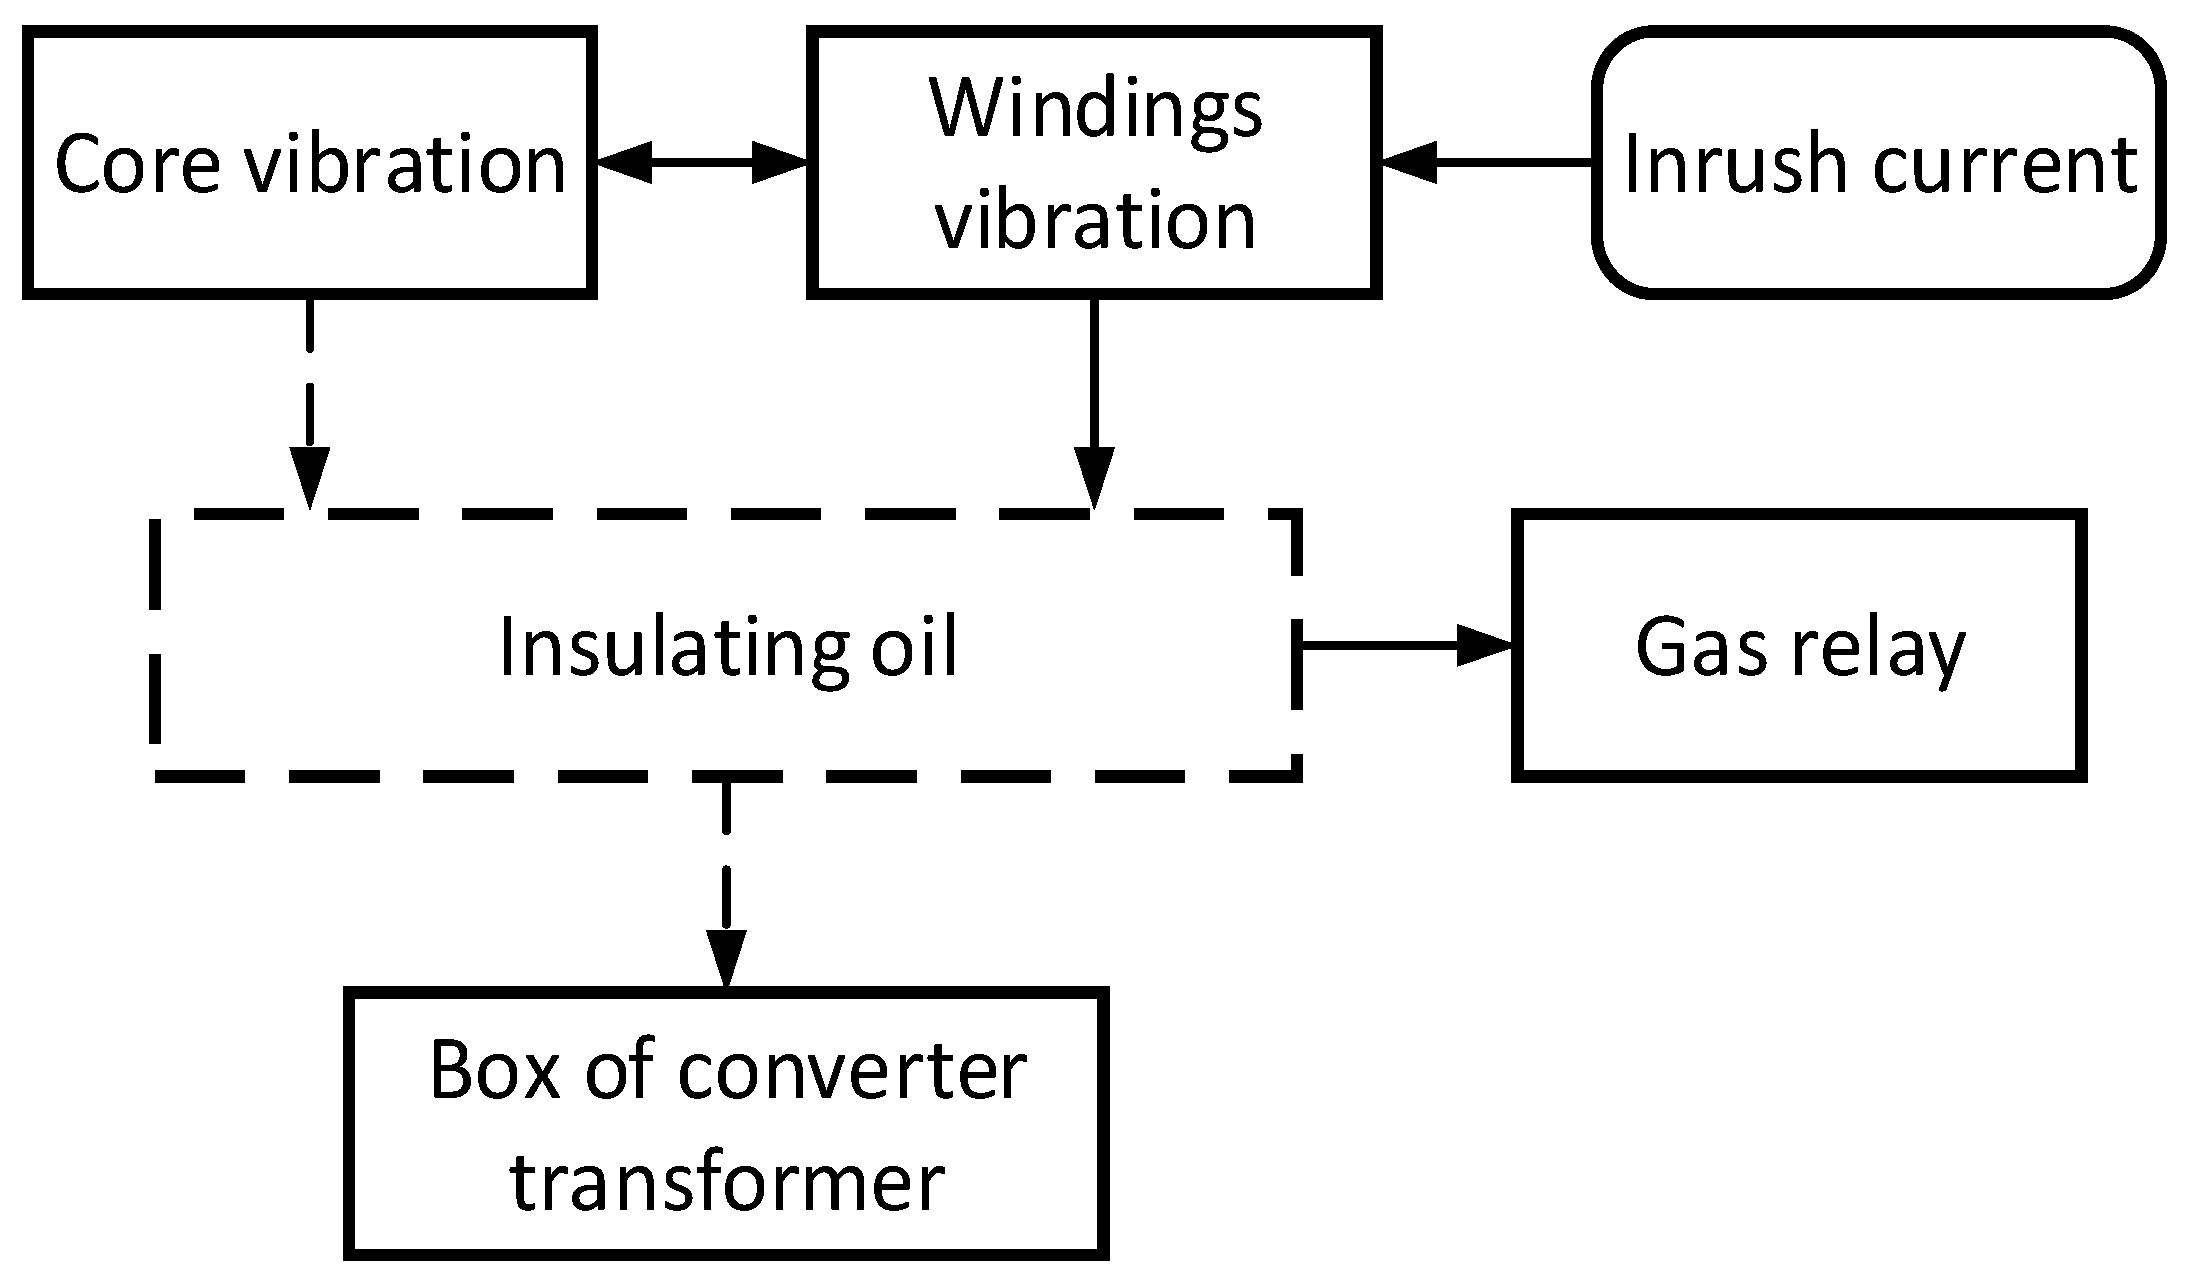
3.1. The Process of Vibration Signal Transmission
As shown in
Figure 3, the main object of the inrush current generated at the time of closing is the winding of the converter transformer. Under the action of the inrush current, the winding bears a severe electrodynamic force, which in turn causes vibration. The signal generated by the winding vibration is transmitted to the surface of the converter transformer by means of the medium of insulating oil [
19,
20]. At the same time, the core vibrates due to the influence of the winding vibration, its own electromagnetic force and the magnetostrictive phenomenon. The vibration is transmitted to the surface of the box through connecting parts and insulating oil. However, compared with the influence of the winding vibration on the surface of the box, the effect of core vibration is relatively weak [
21].
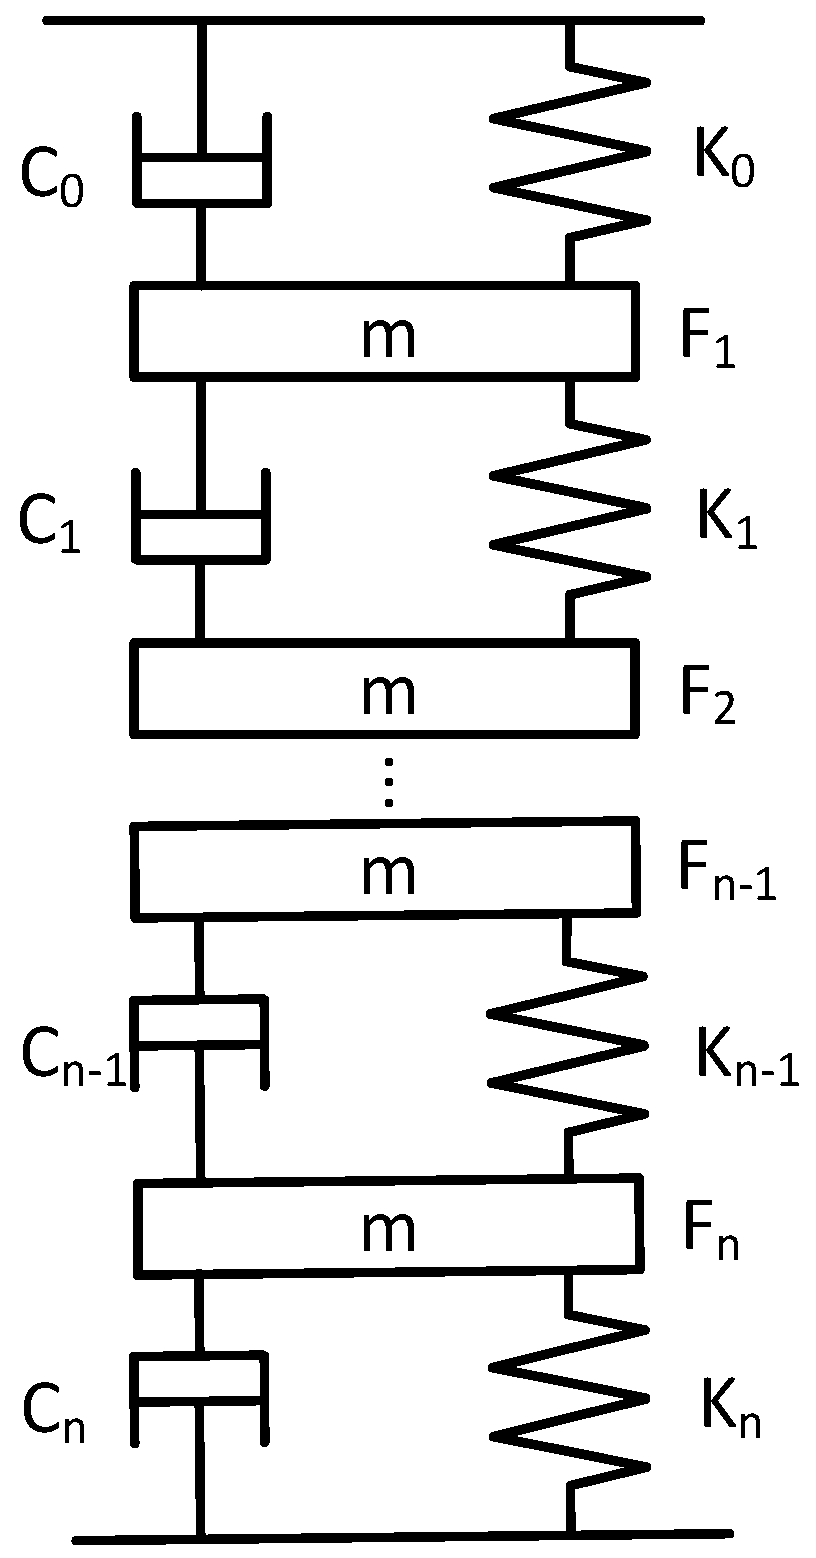
3.2. Vibration Mechanism of Converter-Transformer Winding
When affected by the inrush current, the converter-transformer winding is based on the principle of electromagnetic induction and it vibrates violently due to the force generated by the induction. The structure of the disc-type coil is generally used in the converter transformer. For its axial vibration, the mass-spring-damping model can be used for analysis [
22,
23]. In detail, the winding wire cake can be regarded as a rigid body with the same mass, and the pad between the winding and the connecting line can be equivalent to an ideal spring.
Figure 4 shows the equivalent model of the axial vibration of the winding.
K is the stiffness coefficient of the metal wire and the pad,
c is the damping coefficient between the pad and the insulating oil, and
m is the mass of each wire cake. It is assumed that the displacement of each wire cake is the same under the action of electric force. In this case, the axial vibration of the winding conforms to the following equation:
Among the terms, C is the damping coefficient matrix between the pad and the insulating oil, F is the Lorentz force matrix of the winding pancake, M is the mass matrix of the converter-transformer winding pancake, g is the gravity acceleration, K is the stiffness coefficient matrix of the winding pancake and x is the displacement matrix generated by the force of the winding pancake.
The magnetic induction intensity
B1 of the leakage magnetic field is
Among the terms, k is the proportional coefficient of the leakage flux density and winding current.
The electrodynamic force
F of the converter-transformer winding under the action of magnetizing inrush current is
Among the terms, R is the winding radius. Substituting F into Equation (14), the second derivative of x is obtained, and the winding acceleration is
In the formula, ω0 and A are constants related to the winding parameters: , .
4. Construction of Electromagnetic-Force-Flow Coupling Platform for Converter Transformer
In this study, the simulation experiment was carried out based on COMSOL Multiphysics 6.0 simulation software. The excitation inrush current waveform output by PSCAD electromagnetic transient simulation was used as the excitation of the winding coil of the converter transformer to obtain the vibration characteristics of some components of the converter transformer under the excitation inrush current.
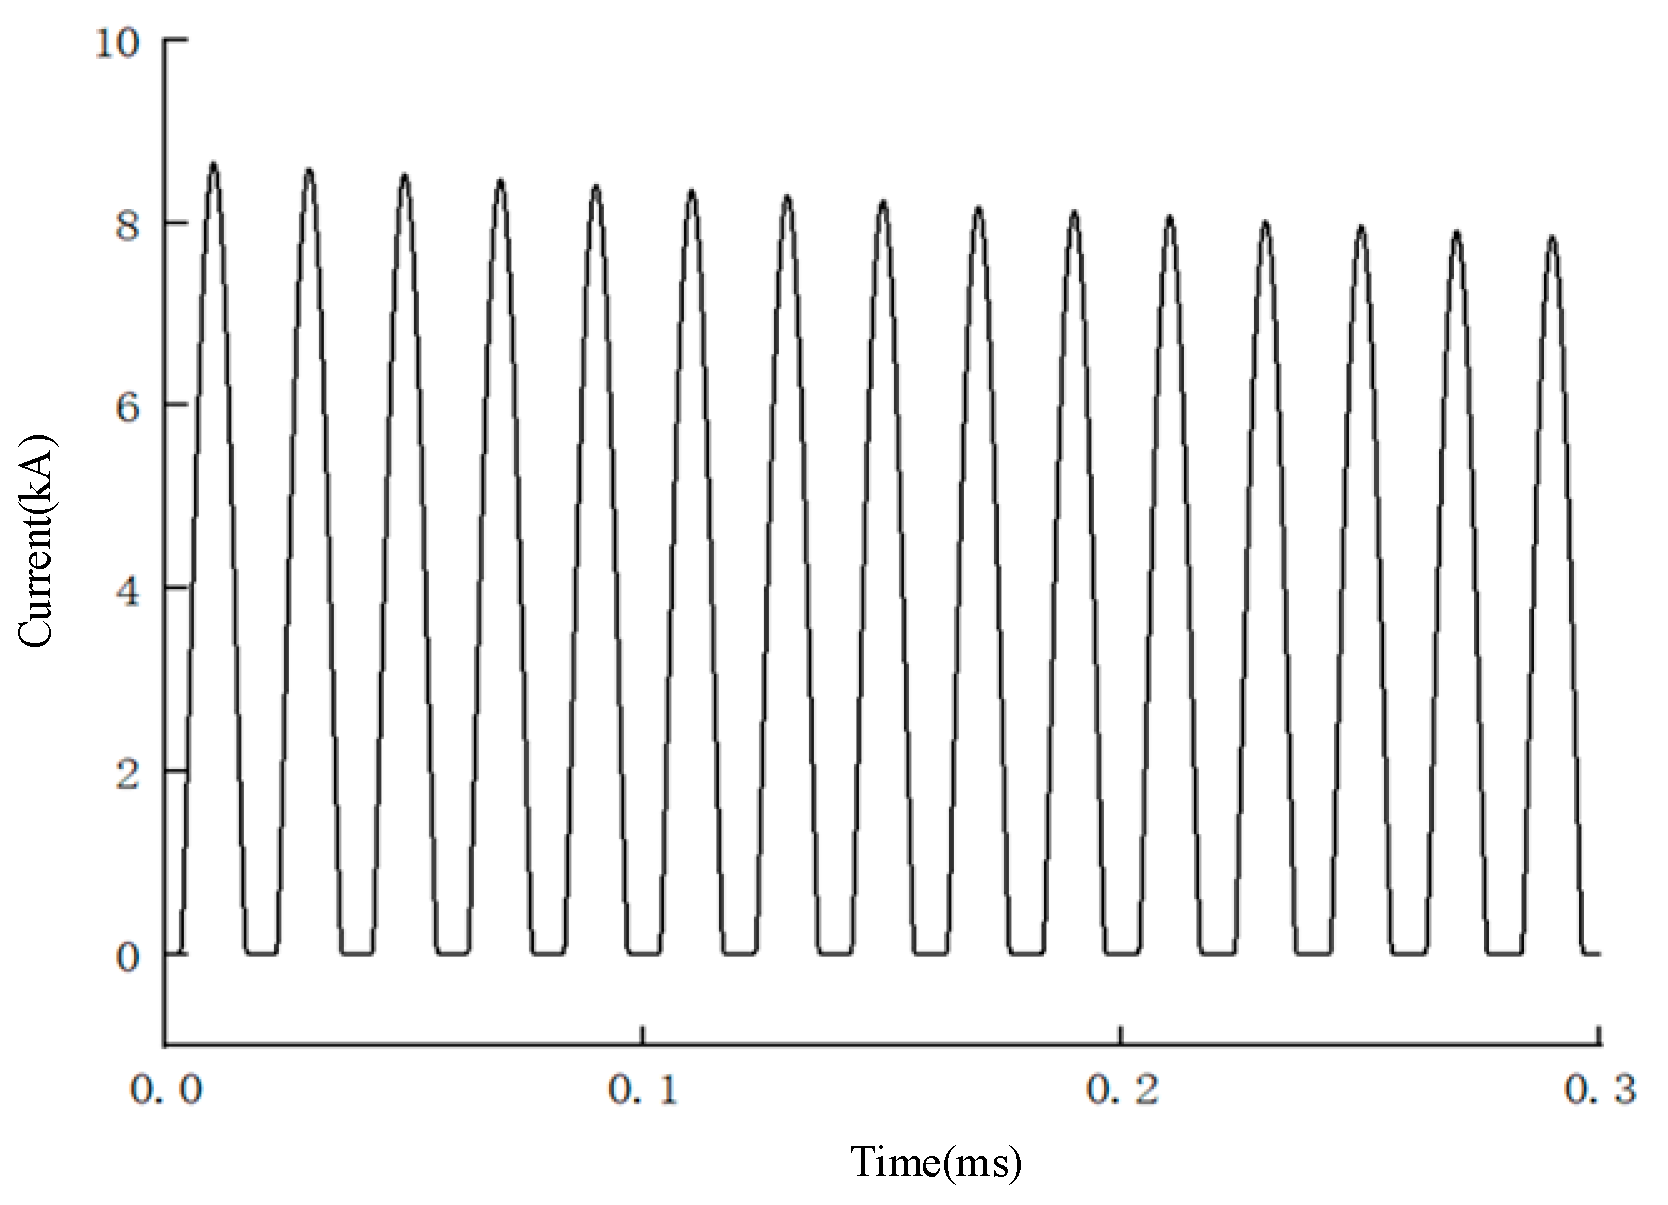
4.1. The Electromagnetic-Force-Flow Multi-Field Simulation Model Was Built
When the converter transformer is switched off, the core remanence is usually not higher than 0.8 times of the initial remanence. Based on this situation, the worst working condition was selected in the simulation experiment to carry out the research. The working condition was set to the closing angle of 0° and the residual magnetism to 0.8 p.u. With the help of an electromagnetic transient simulation experiment, the waveform of the inrush current under this condition was obtained, as shown in
Figure 5. In the future, this inrush current waveform will be used as the excitation source to study the winding vibration of the converter transformer [
24,
25,
26].
In this study, a refined model of the converter transformer was built, including pancake winding, a stacked core, outlet pipe and its oil pillow, pressure release valve, network side and valve-measuring casing. The geometric model was built as shown in
Figure 6 and the front view is shown in
Figure 7.
The finite element simulation model of the converter transformer was established, and the specific parameters are shown in the following
Table 4.
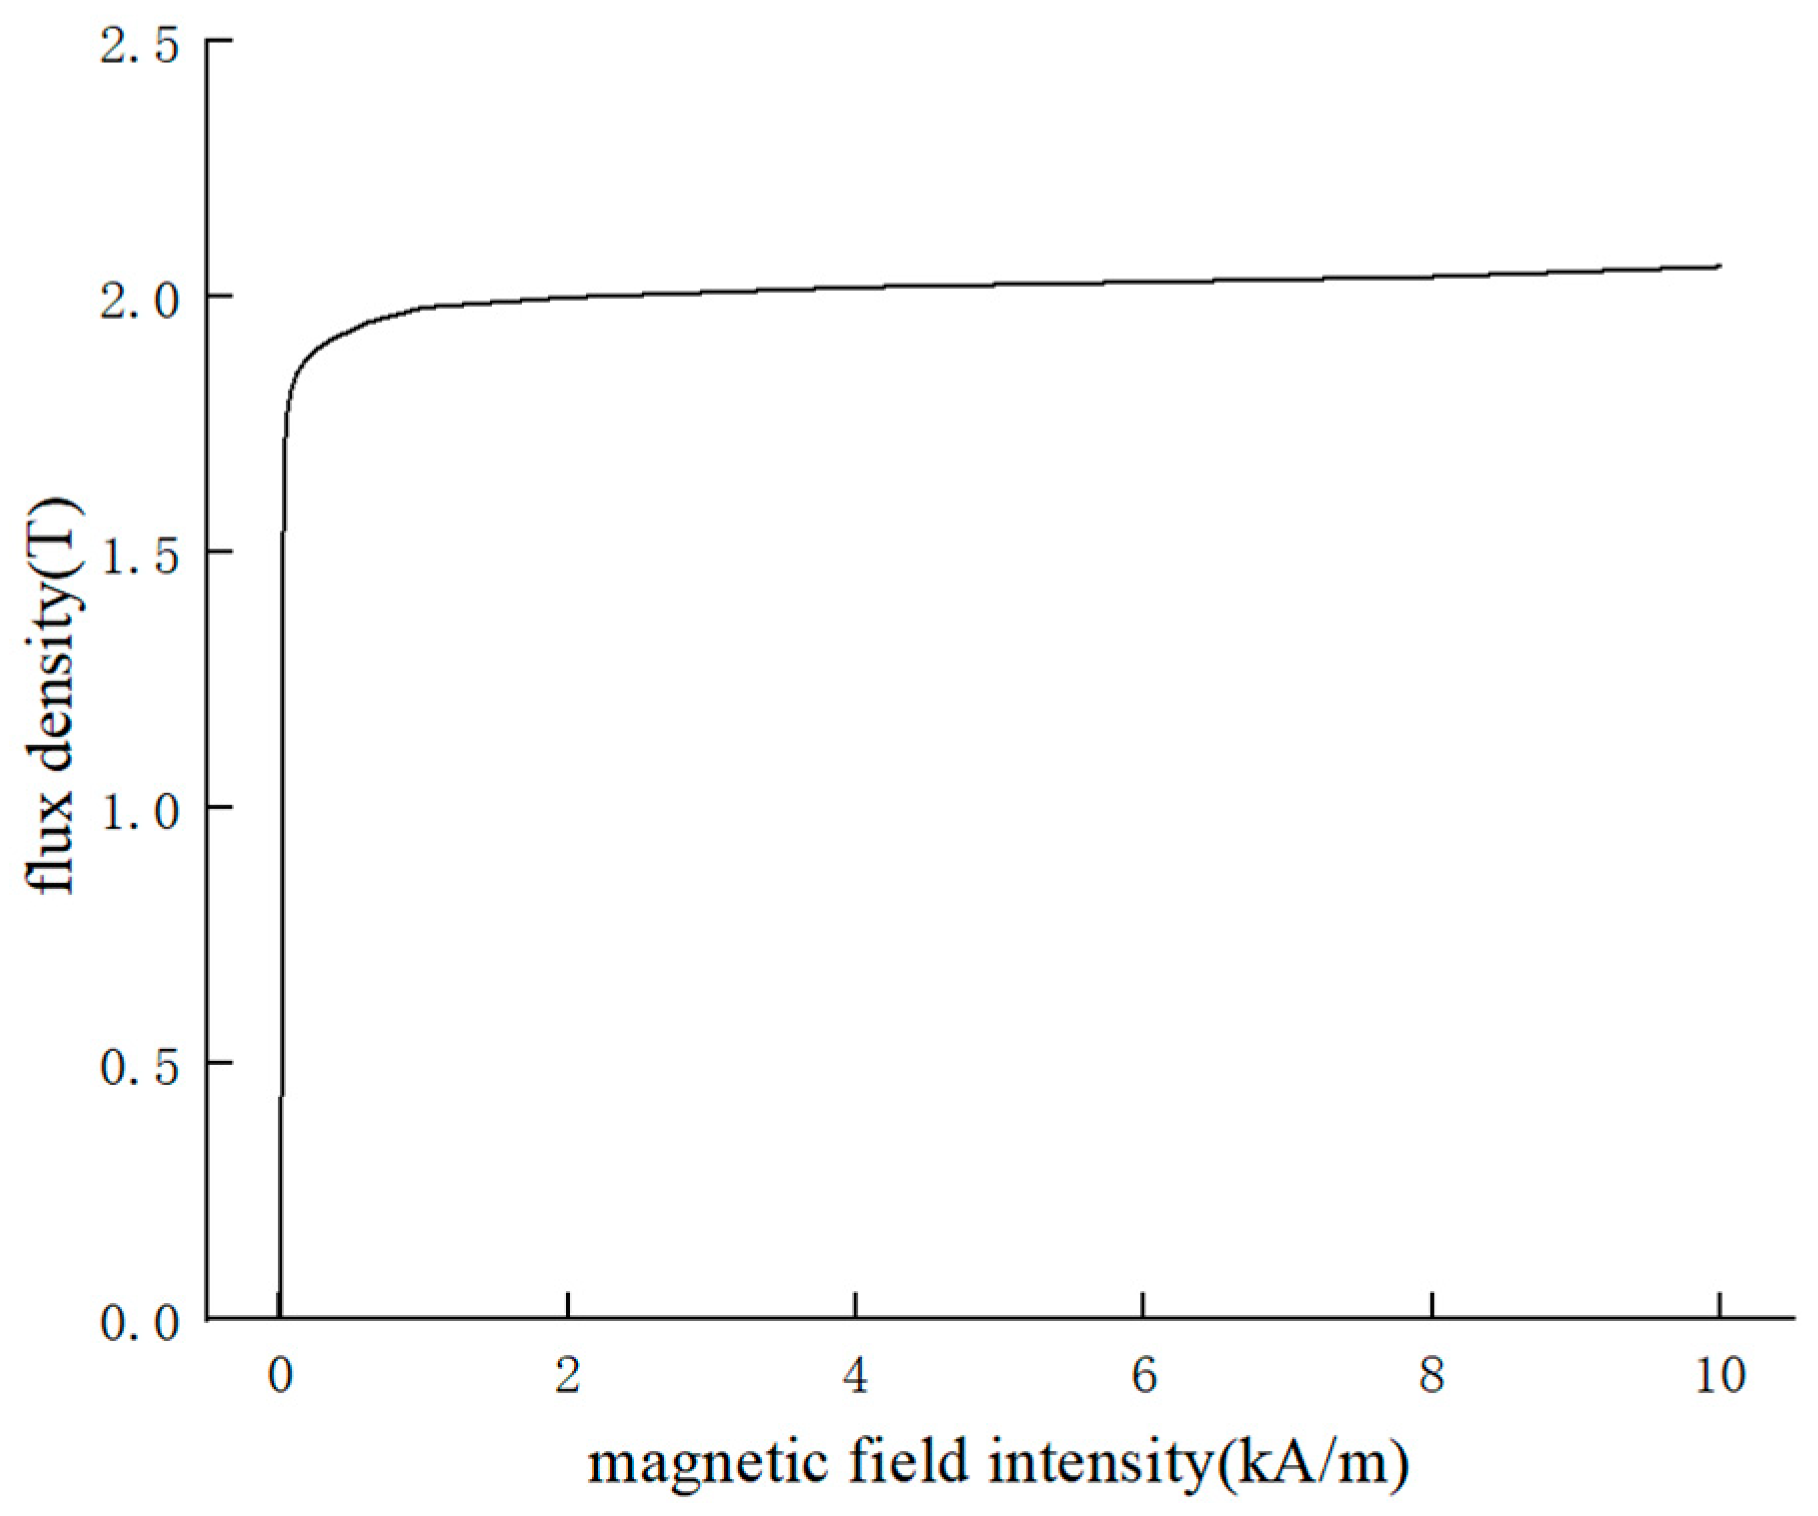
The excitation characteristic curve of the core of the converter transformer, i.e., the B-H curve, is shown in
Figure 8.
4.2. Oil Flow Rate Through the Gas Relay Under Inrush Current
- (1)
Input Settings
Based on the PSCAD electromagnetic simulation results, the waveform was set as the winding excitation source by interpolation. The wire model in the winding cake was uniform multi-turn, the coil type was set to value, the coil excitation was set to current, and the coil current input interpolation was set. The specific physical field setting process is shown in
Figure 9.
- (2)
Winding vibration
The vibration of the winding wire cake was realized by Lorentz coupling, and the coupling interface of the winding wire cake was set to magnetic field and solid mechanics, respectively. By applying a magnetizing inrush current to the winding under different working conditions, the process of vibration of the winding under the electromagnetic force under the corresponding working conditions could be obtained;
- (3)
Winding vibration drove oil-flow surging
The oil-flow surge inside the converter transformer was realized by adding a fluid-solid coupling field to the winding wire cake. The winding wire-cake coupling interface was set to laminar flow and solid mechanics 1, respectively, and the fixed geometric coupling type was set to velocity transfer to the fluid;
- (4)
Oil-flow surge forced the converter transformer core and box vibration.
The oil flow in the converter transformer underwent an oil-flow surge due to the vibration of the winding, and the oil flow impacted the core and the box body to cause vibration. Therefore, the iron core and the box body and the other components were set to solid mechanics 2. The fluid–solid coupling was set again, and the interfaces were set to laminar flow and solid mechanics 2, respectively. The fixed geometric coupling type was set to the fluid load on the structure.
4.3. The Establishment of Electromagnetic-Force-Flow Coupling Relationship
According to the actual closing conditions of the converter transformer, the current amplitude of the inrush current was calculated, and the current was applied to the winding coil of the converter transformer as the excitation source. The current density
Je in the winding can be obtained by using Formula (18).
In the formula,
Je is the current vector density of the winding;
it is the instantaneous value of the magnetizing inrush current flowing through the winding; and
S is the sectional area of the winding wire. The equation of the unit micro-element on the winding subjected to the electric force
Fv under the excitation current is shown in Formula (19).
In the formula,
Fv is the electric force of the winding micro-element under the inrush current and
B is the magnetic induction intensity. When the winding is in a balanced state, the sum of the gradient of the internal stress and the external applied force is zero. Only considering the influence of the electric force on the winding, the internal force of the winding should meet the balance equation as shown in Equation (20).
The relationship between the local velocity
u2 and the average velocity
utr transmitted by the vibration signal generated by the winding in the oil reflects the distribution of the velocity in the fluid, which is considered to satisfy Equation (21).
The motion of insulating oil satisfies the momentum conservation equation. The left term represents the acceleration of insulating oil, the right term represents the contribution of oil flow pressure gradient and viscous force and the external force
Fo also affects the acceleration of insulating oil. The specific equations are shown in Equations (22) and (23).
In the formula, ρ is the density of insulating oil; u is the speed of insulating oil in the box and tubing; p is the pressure of insulating oil; I is the unit matrix, K is the stiffness matrix and μ is the dynamic viscosity coefficient of insulating oil.
At the same time, the internal insulating oil of the converter transformer also satisfies the mass conservation equation, that is, the density of the insulating oil multiplied by the divergence of its flow velocity is zero, which means that when the insulating oil flows, the mass will not be created or disappeared, and will only be redistributed inside the box and tubing. The specific equation is shown in Equation (24).
Considering the influence of pressure and fluid flow on the stiffness of the equipment, the expression of the force
FA applied by the fluid to the converter-transformer component is shown in Equation (25).
In the formula, FA represents the force of fluid on solid; n is a normal vector.
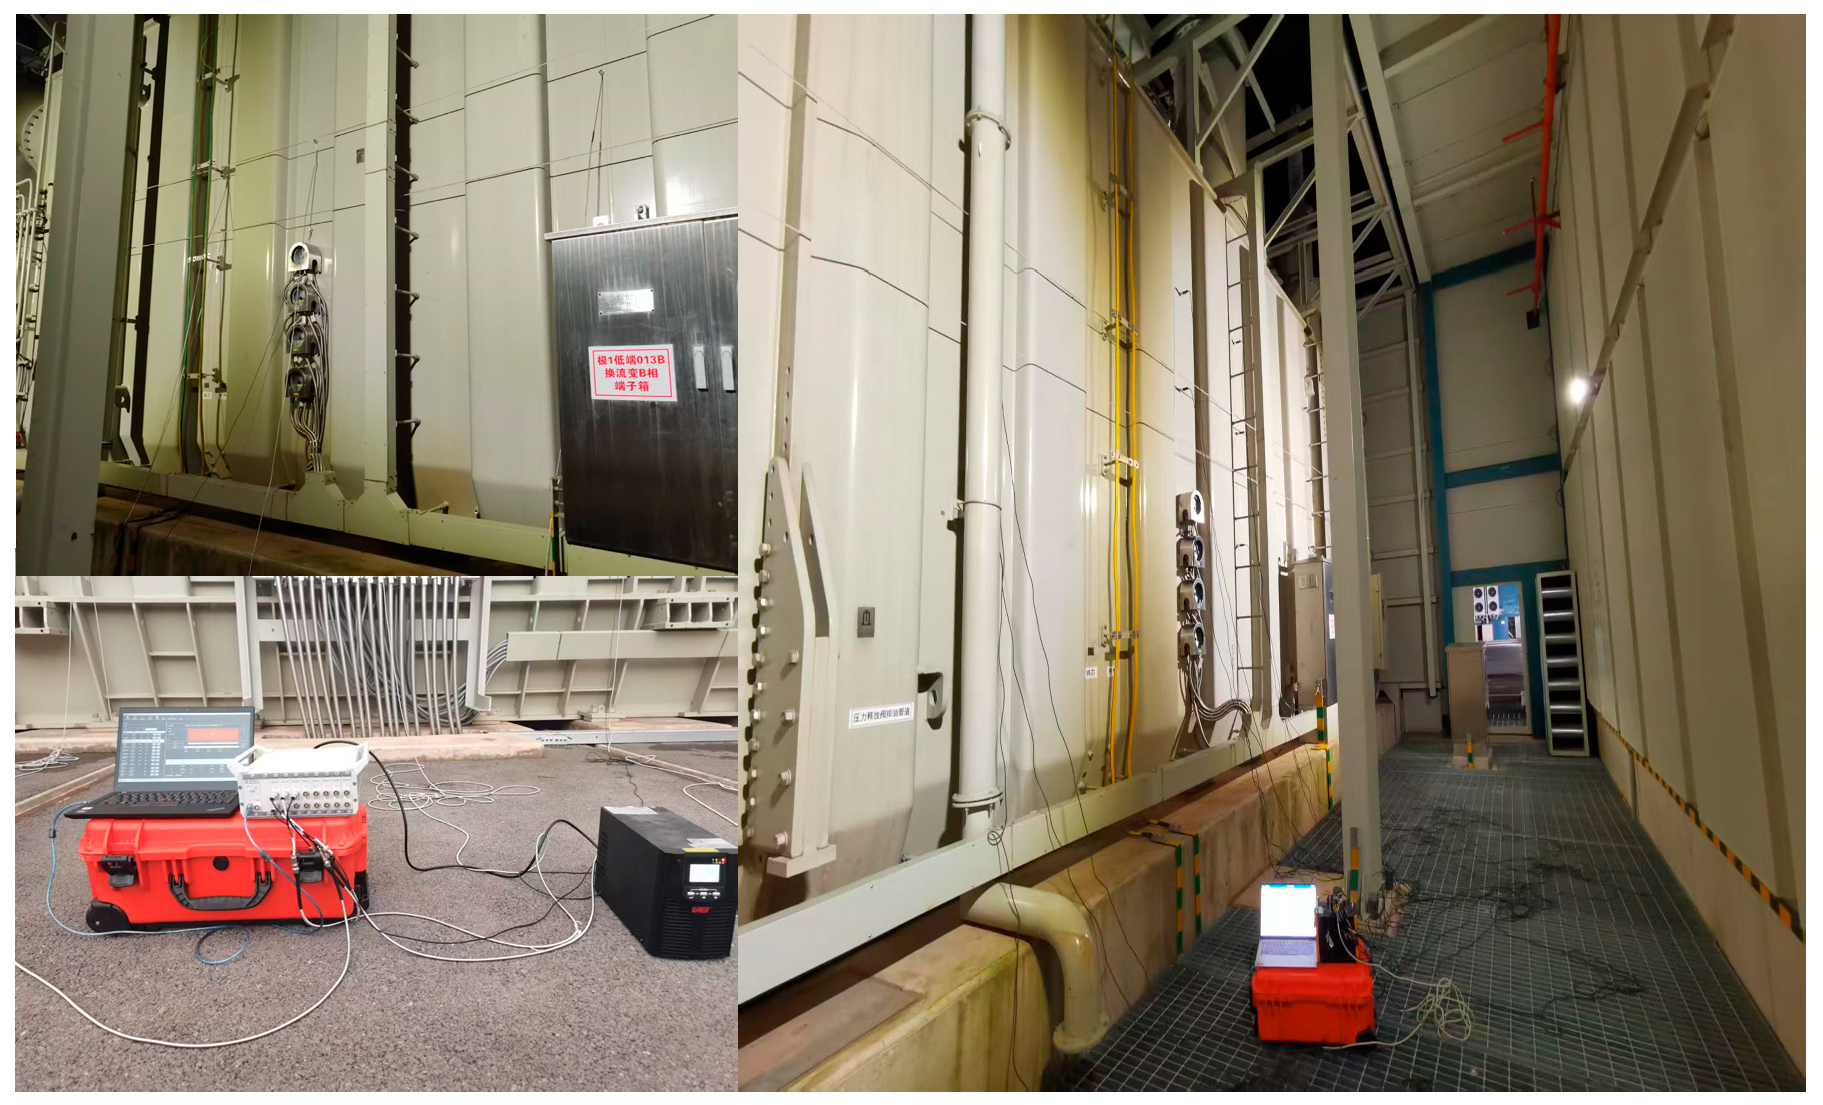
5. Vibration Experimental Verification of Converter Transformer
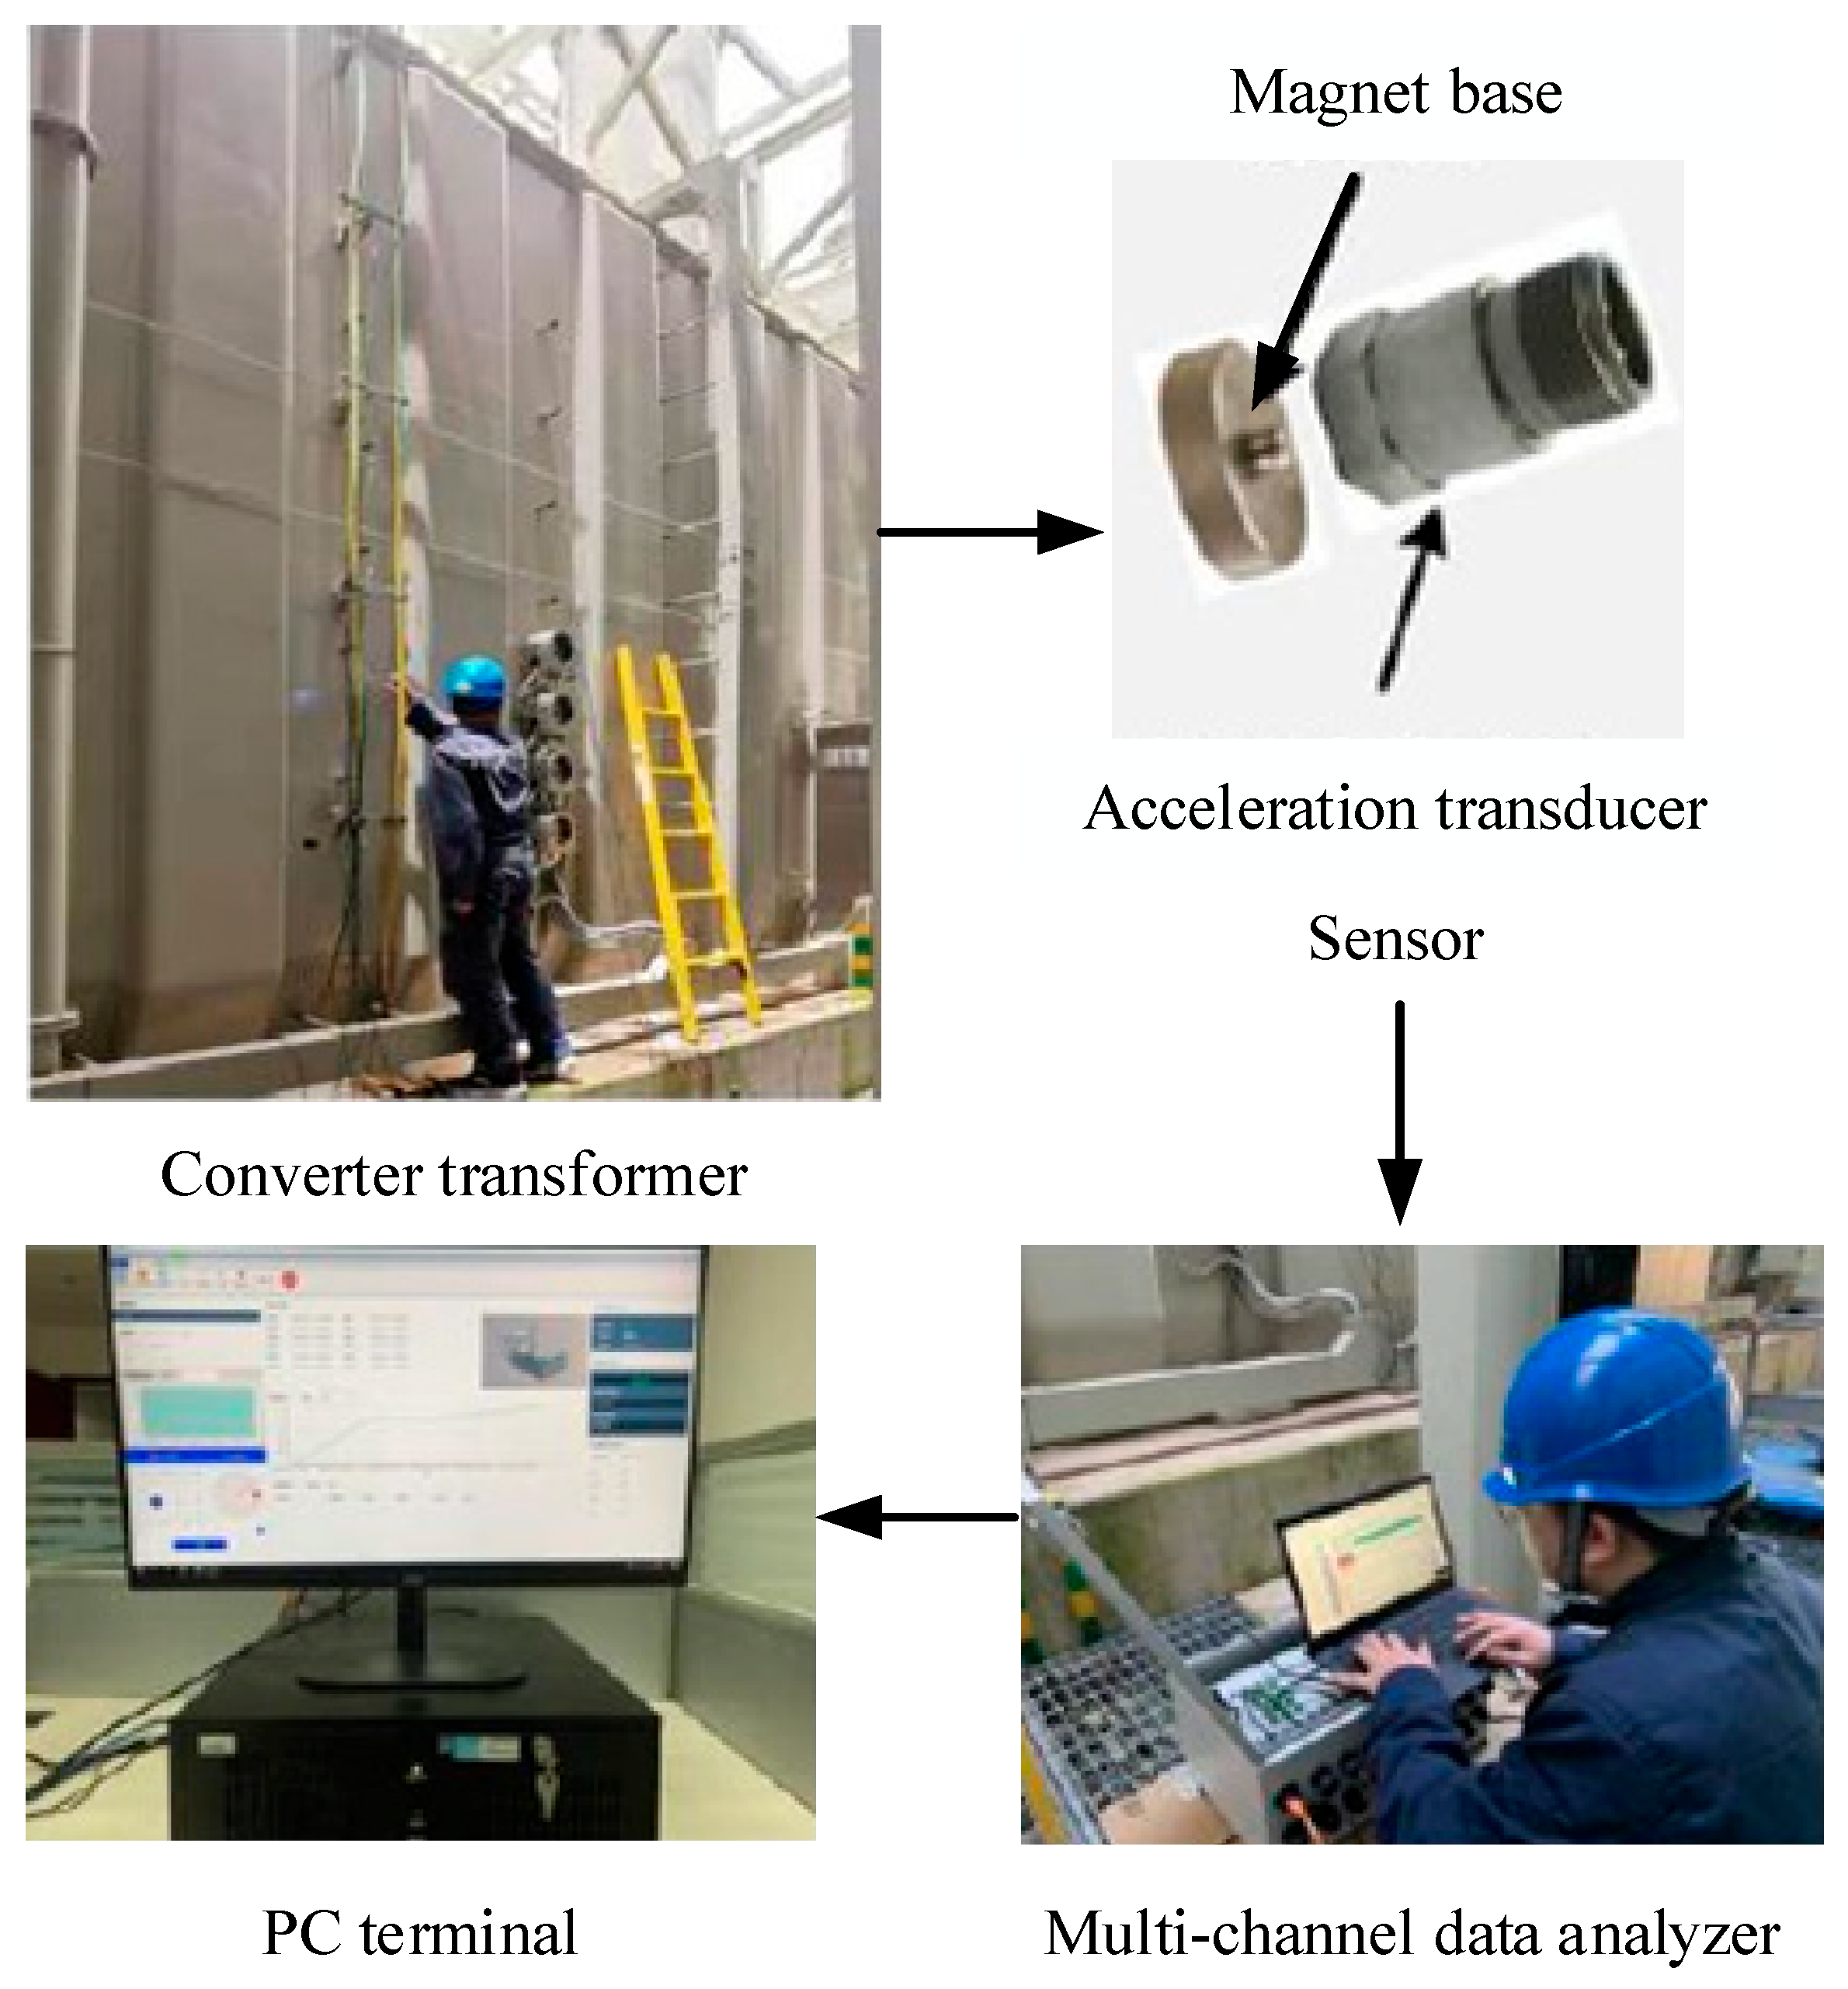
The converter-transformer vibration-measurement-test platform was built as shown in
Figure 10. The acceleration sensor was arranged on the surface of the converter-transformer box, and the vibration signal of the converter-transformer box was converted into the voltage signal. The voltage signal was collected by the data-acquisition device, and the data was transmitted to the user through the USB cable.
In this experiment, a 1A314E piezoelectric acceleration sensor with a sampling frequency of 50 kHz was used. The axial sensitivity was installed on the wall of the converter-transformer box. The data acquisition instrument adopted the AY5922D signal test and analysis system. Its analysis device includes signal conversion, signal amplification, electromagnetic interference and power supply functions. It can store the vibration signal collected by the experiment on the user side, and post-process the signal through the analysis software. The specific process is shown in
Figure 11.
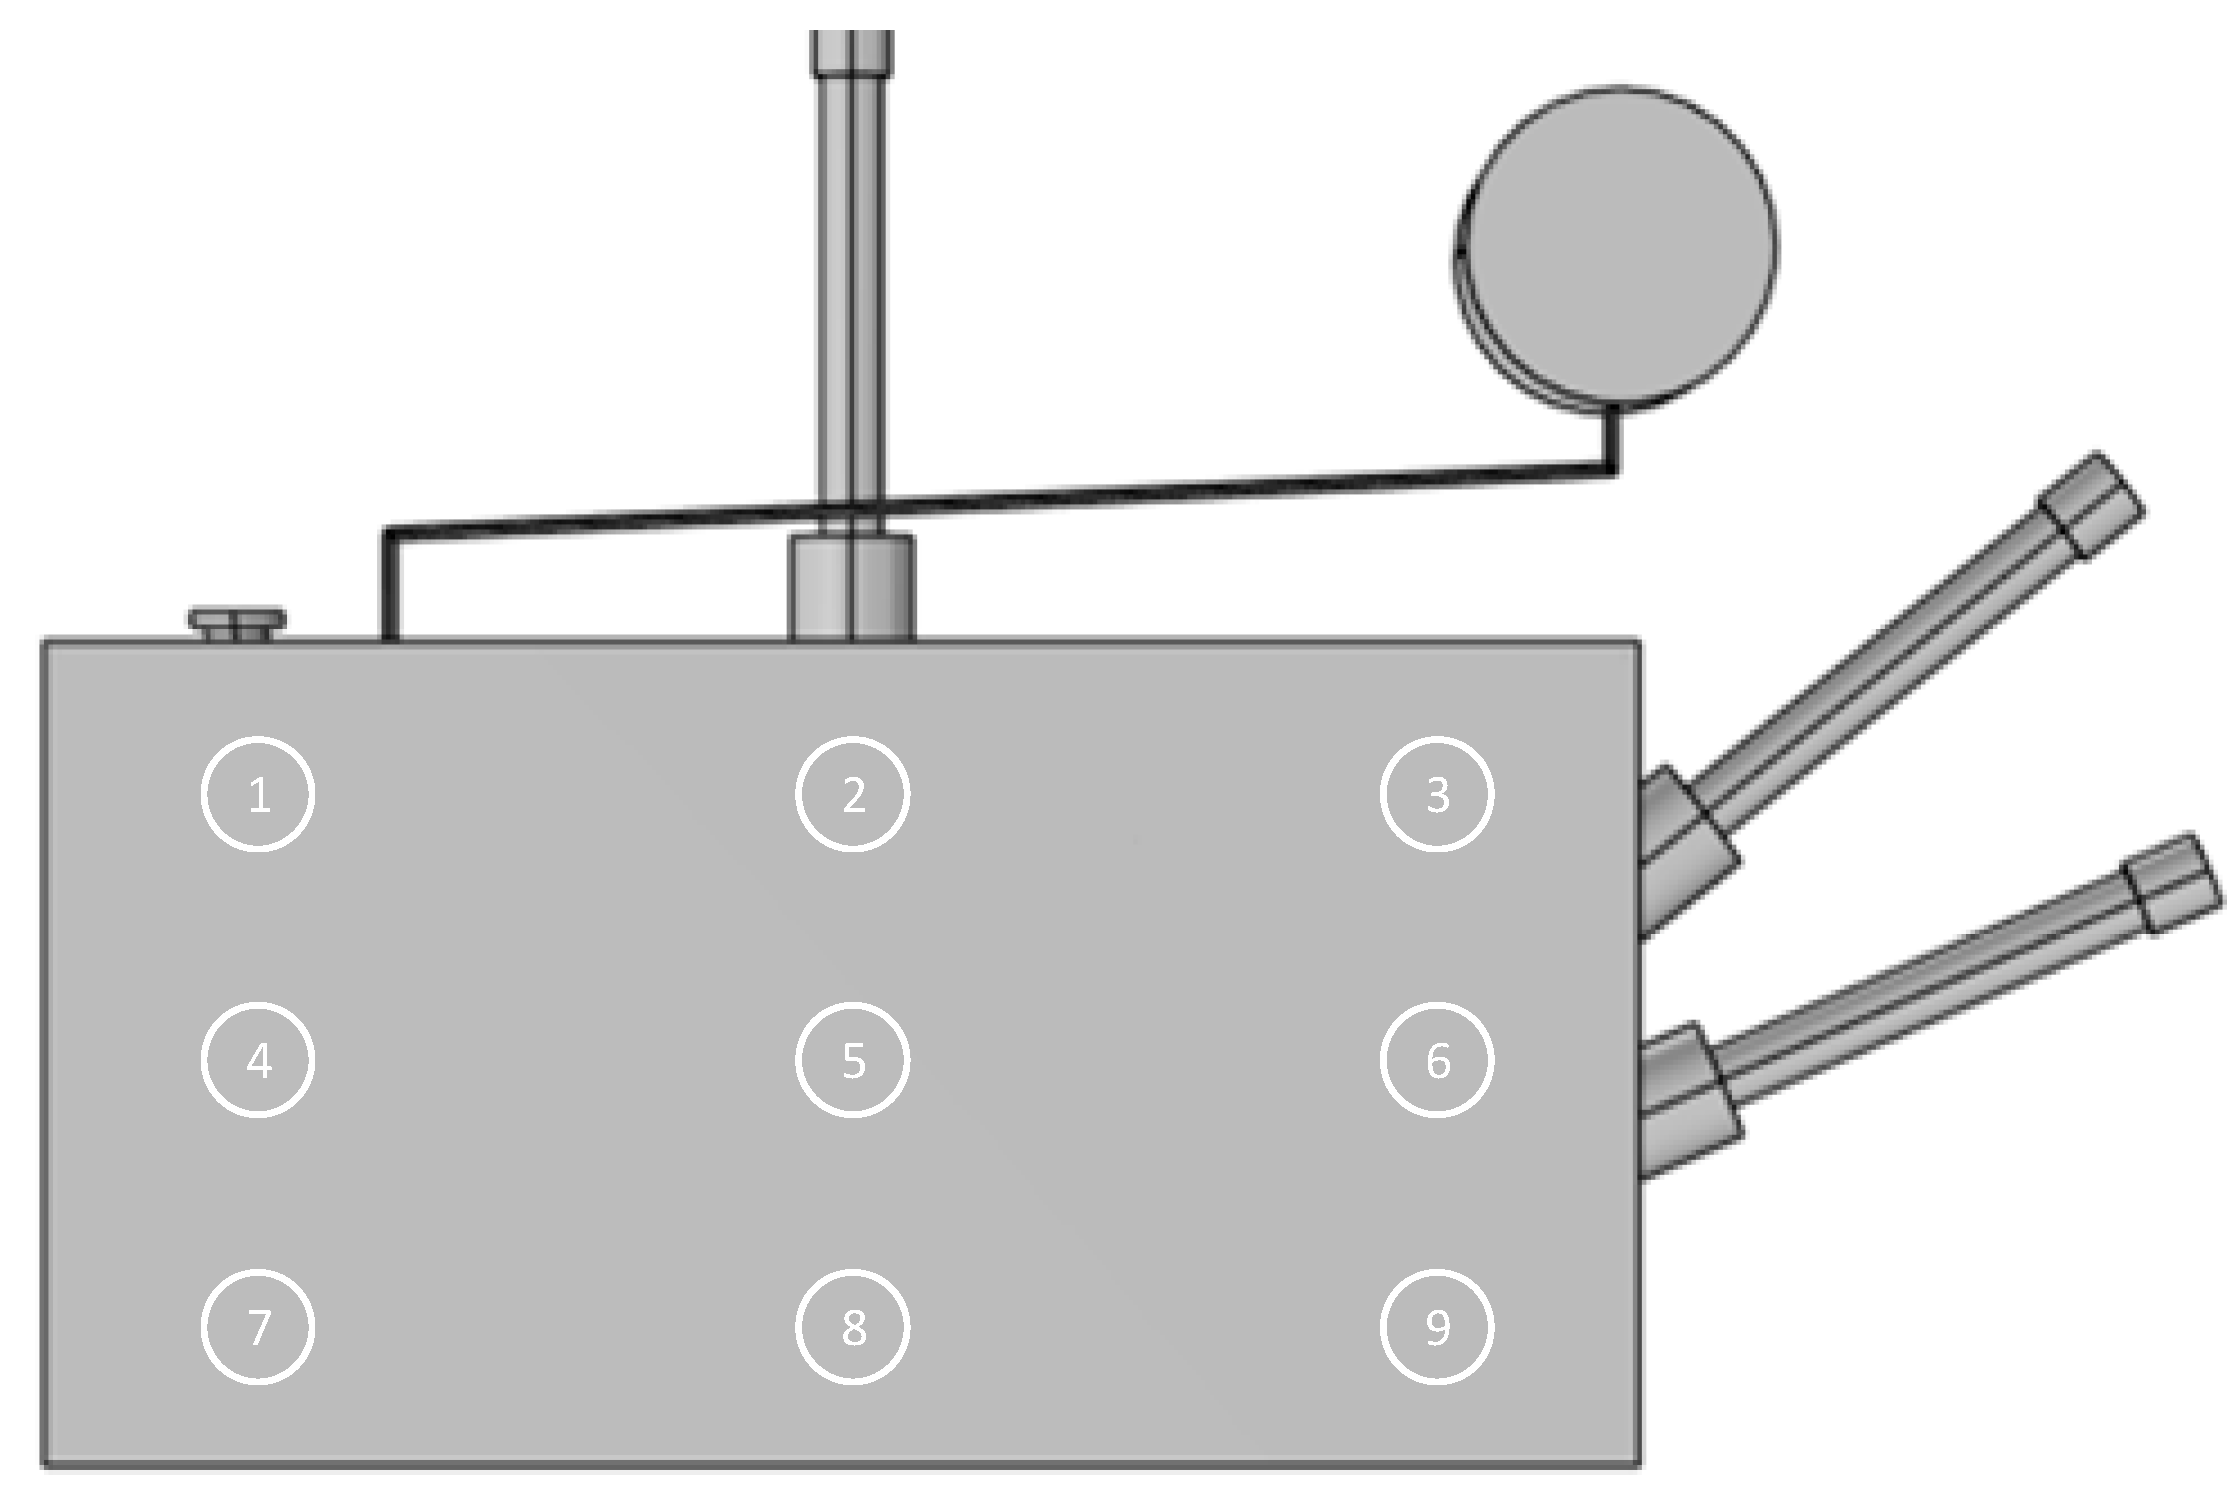
The 1–6 measuring points of the vibration sensor were symmetrically distributed along the center line of the converter-transformer box, as shown in
Figure 12. The vibration intensity of the converter-transformer box under the load current of 1470 A was measured, that is, the peak value of vibration acceleration at different measuring points.
In the
Figure 12, 1–6 refers to the position of different measuring points. The vibration acceleration at the same measuring point was obtained by introducing a 1470 A current into the grid-side winding of the simulation test. The experimental and simulation results are shown in
Table 5.
The vibration-acceleration deviation between the simulation test and the actual converter transformer-box vibration value is less than 7.6%. Since the vibration under the inrush current cannot be accurately measured in the actual working conditions, this finite element simulation model can be used as the main basis for studying the vibration characteristics of the converter transformer under the inrush current.
6. Analysis of Vibration Characteristics of Some Components of Converter Transformer
Considering the worst case in the actual working conditions, when the closing angle is 0° and the inrush current under the condition of 0.8 p.u. remanence is introduced into the winding, the corresponding vibration characteristics are obtained.
6.1. Analysis of Winding Vibration Characteristics
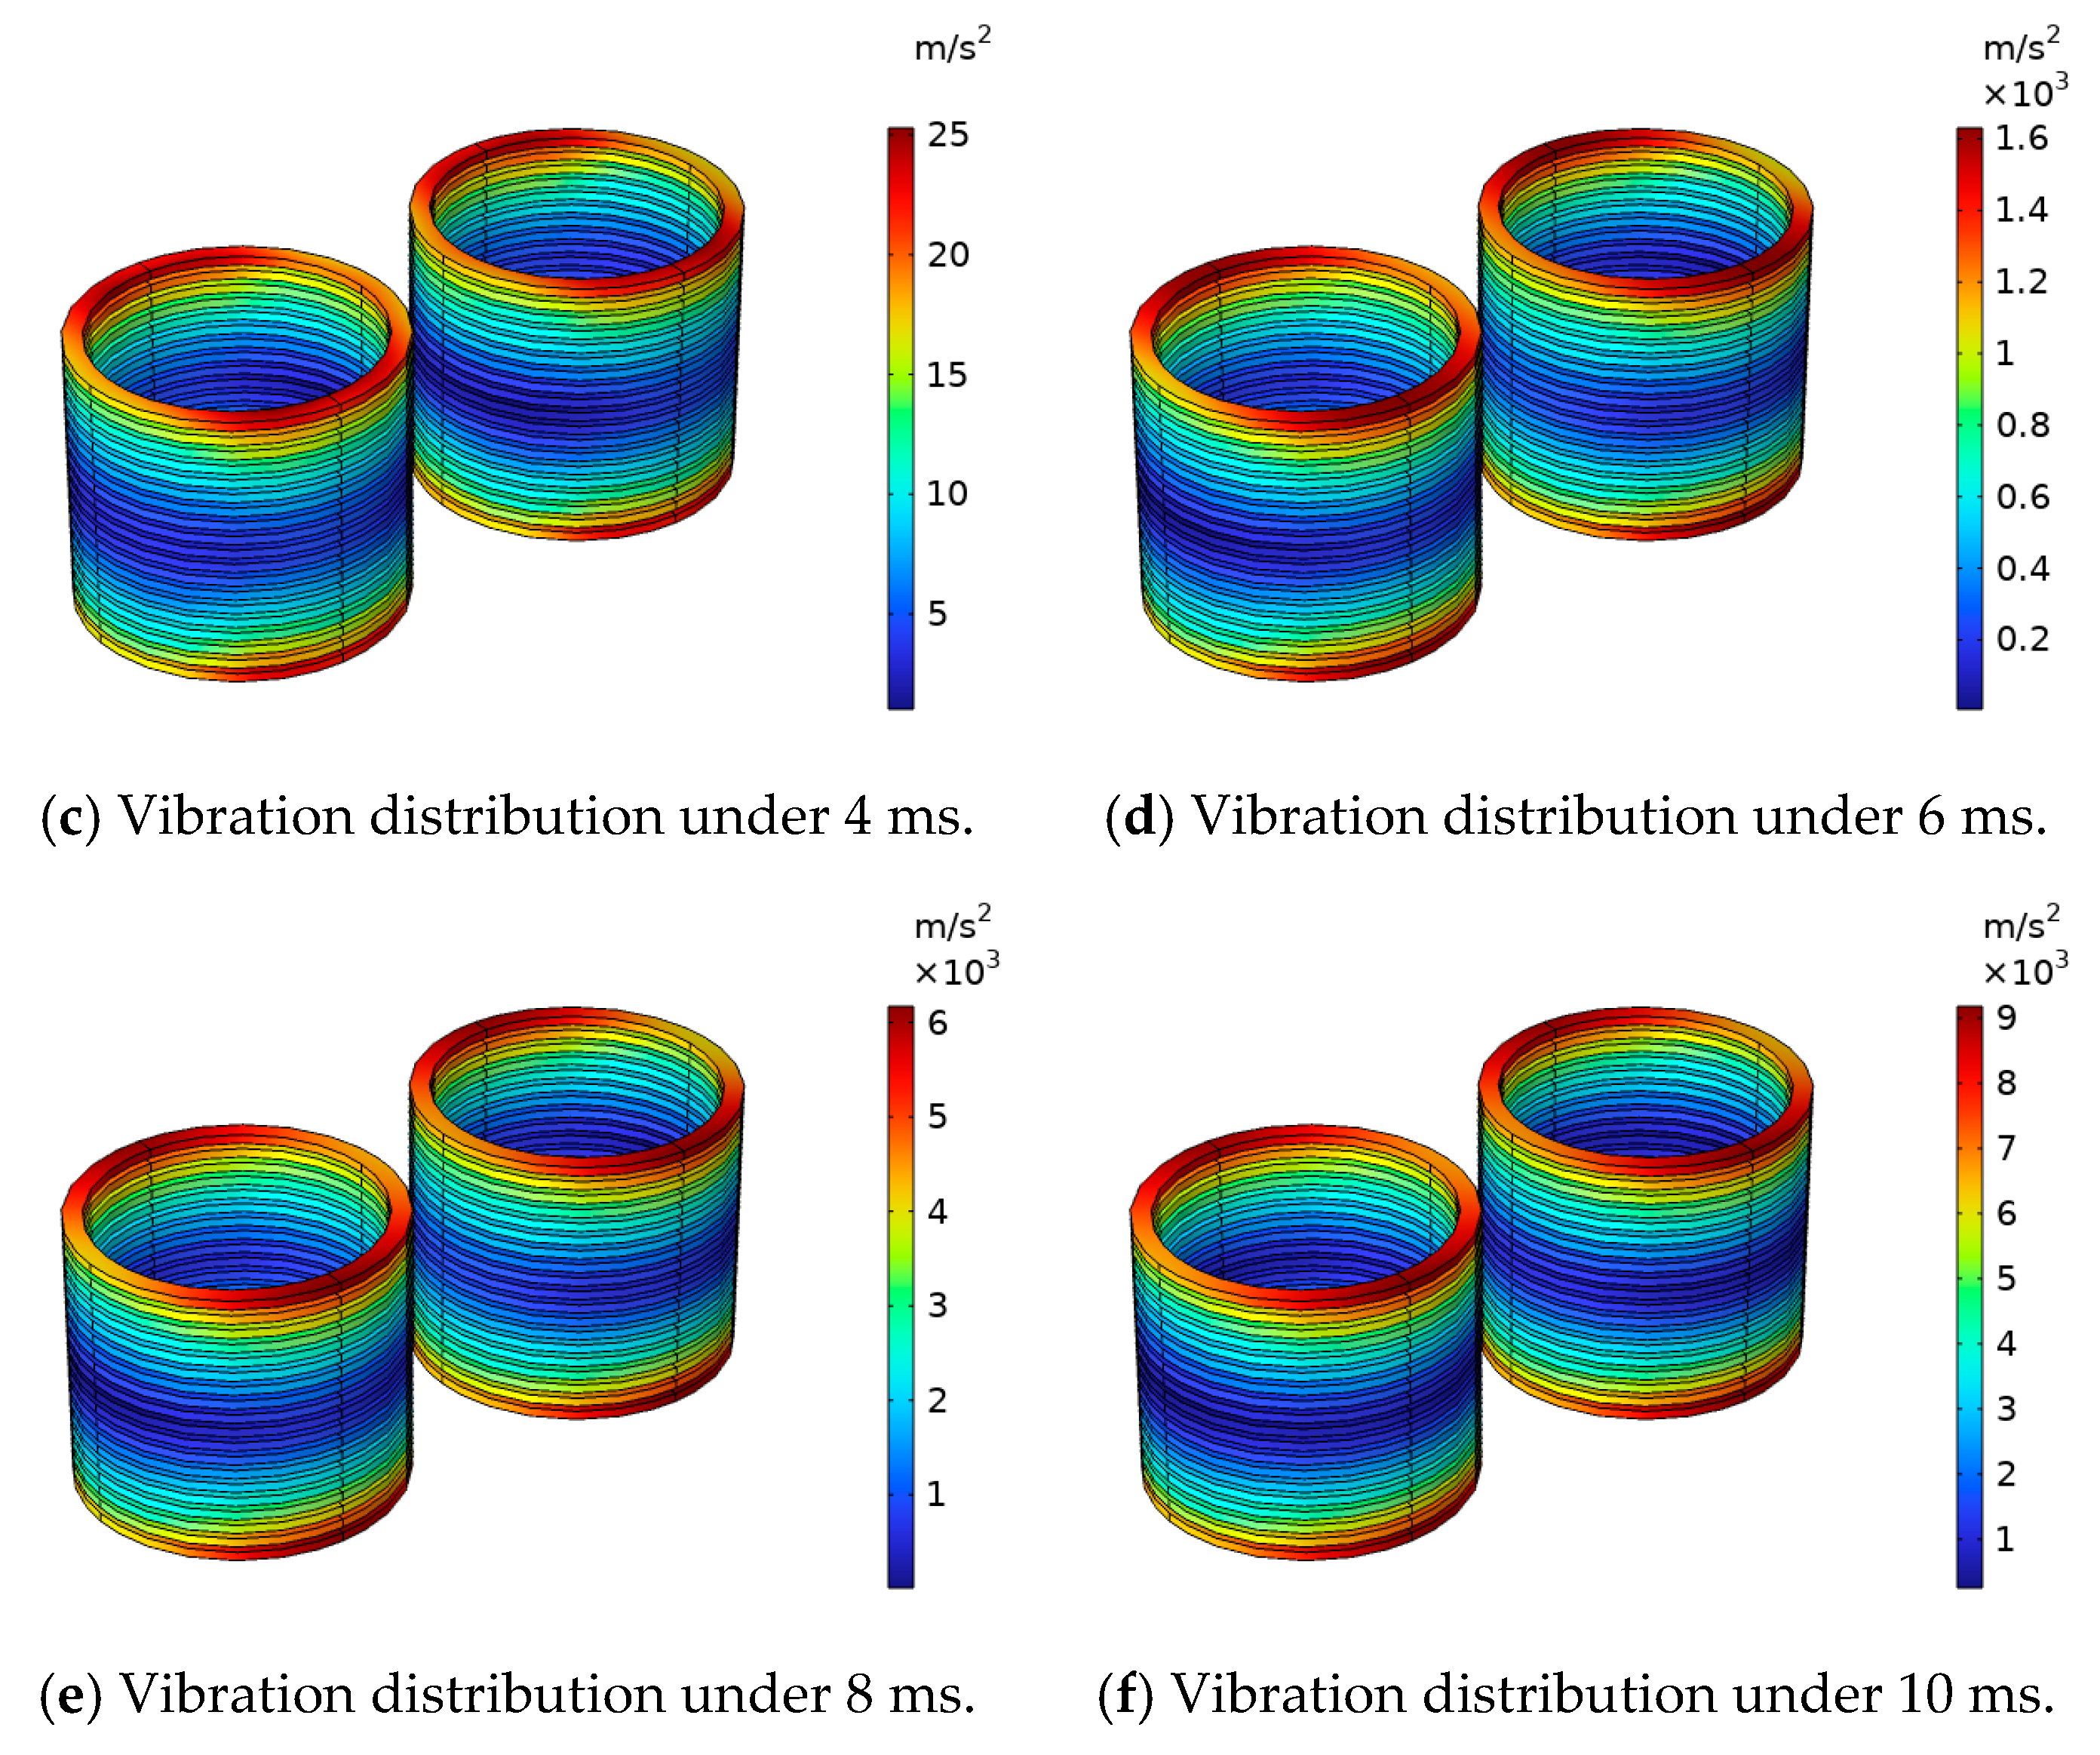
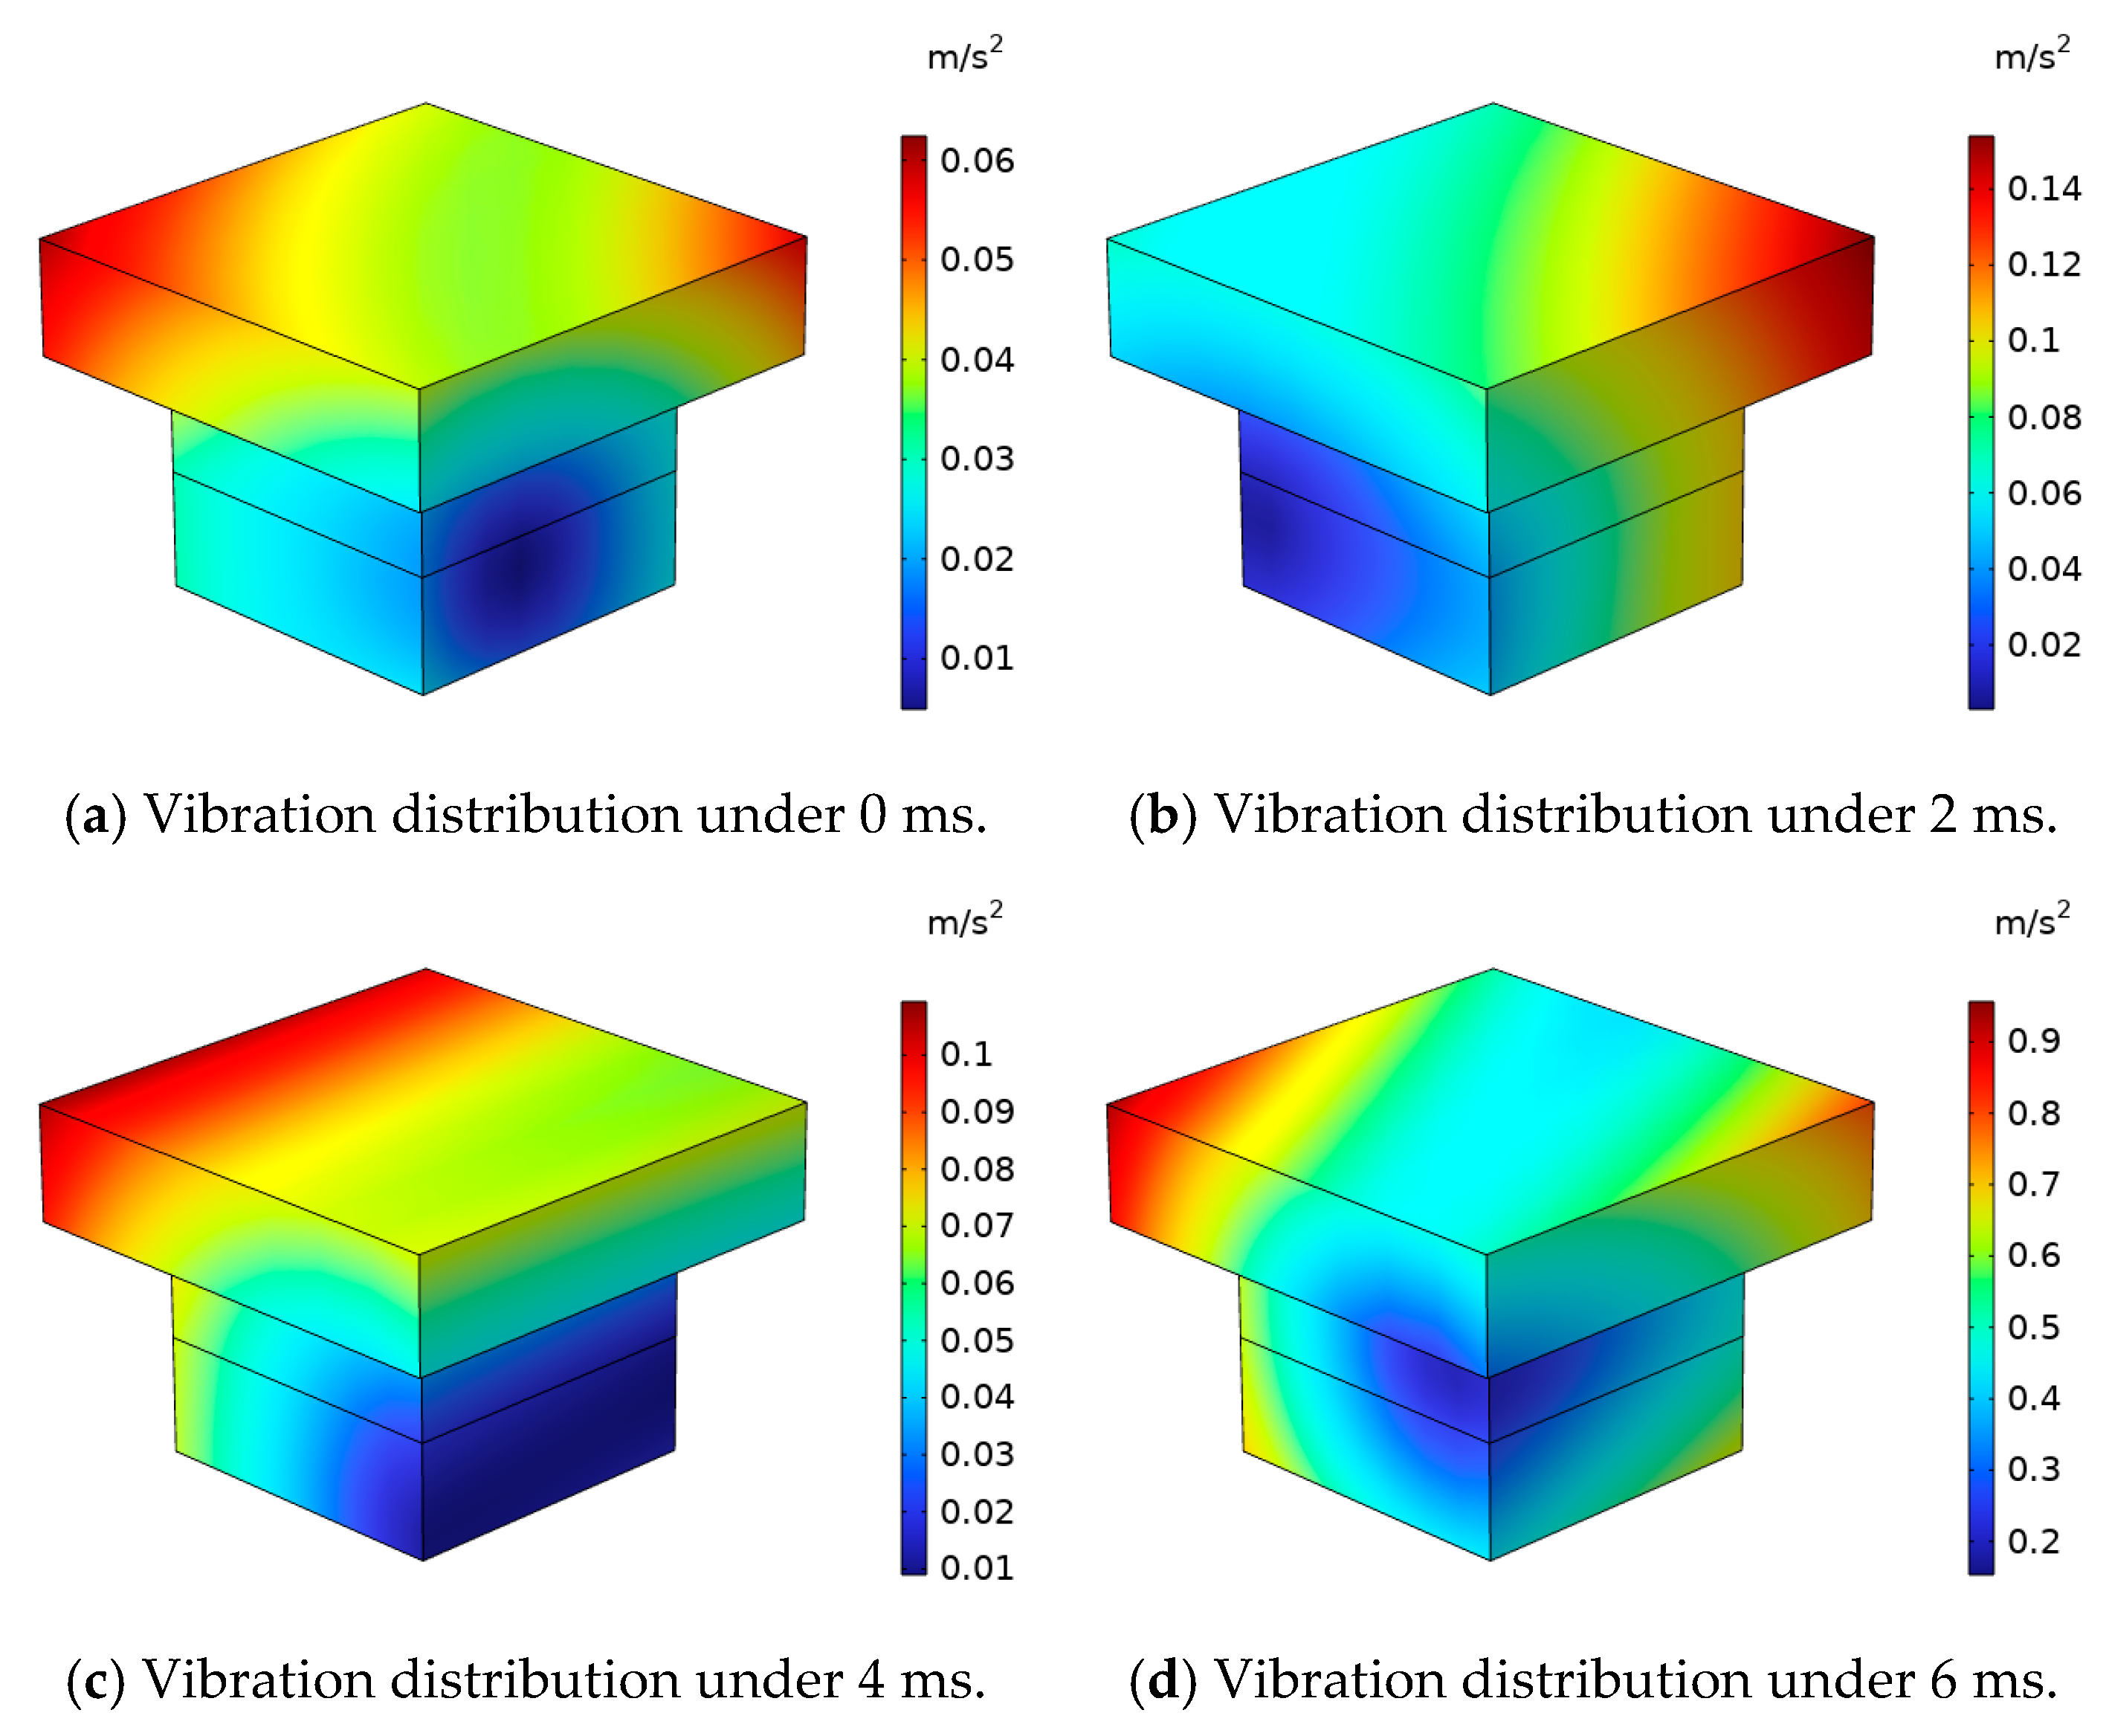
The acceleration distribution cloud diagram of the converter-transformer winding under the action of the inrush current is shown in
Figure 13. From the experimental results, it can be seen that as the current increases, the vibration acceleration of the winding also increases, and the acceleration of the winding reaches the maximum when the current reaches the peak. The maximum vibration amplitude of the upper and lower ends of the winding can reach 5.99 × 10
3 m/s
2 when the inrush current reaches the peak, that is, 10 ms, while the vibration acceleration in the middle of the winding is small, only 583 m/s
2. For the same horizontal plane, the vibration acceleration of the middle part of the upper and lower ends of the winding is about 42% larger than that of the two sides of the winding, while the vibration acceleration of the two sides of the winding in the middle region is about 44% larger than that of the middle part of the winding.
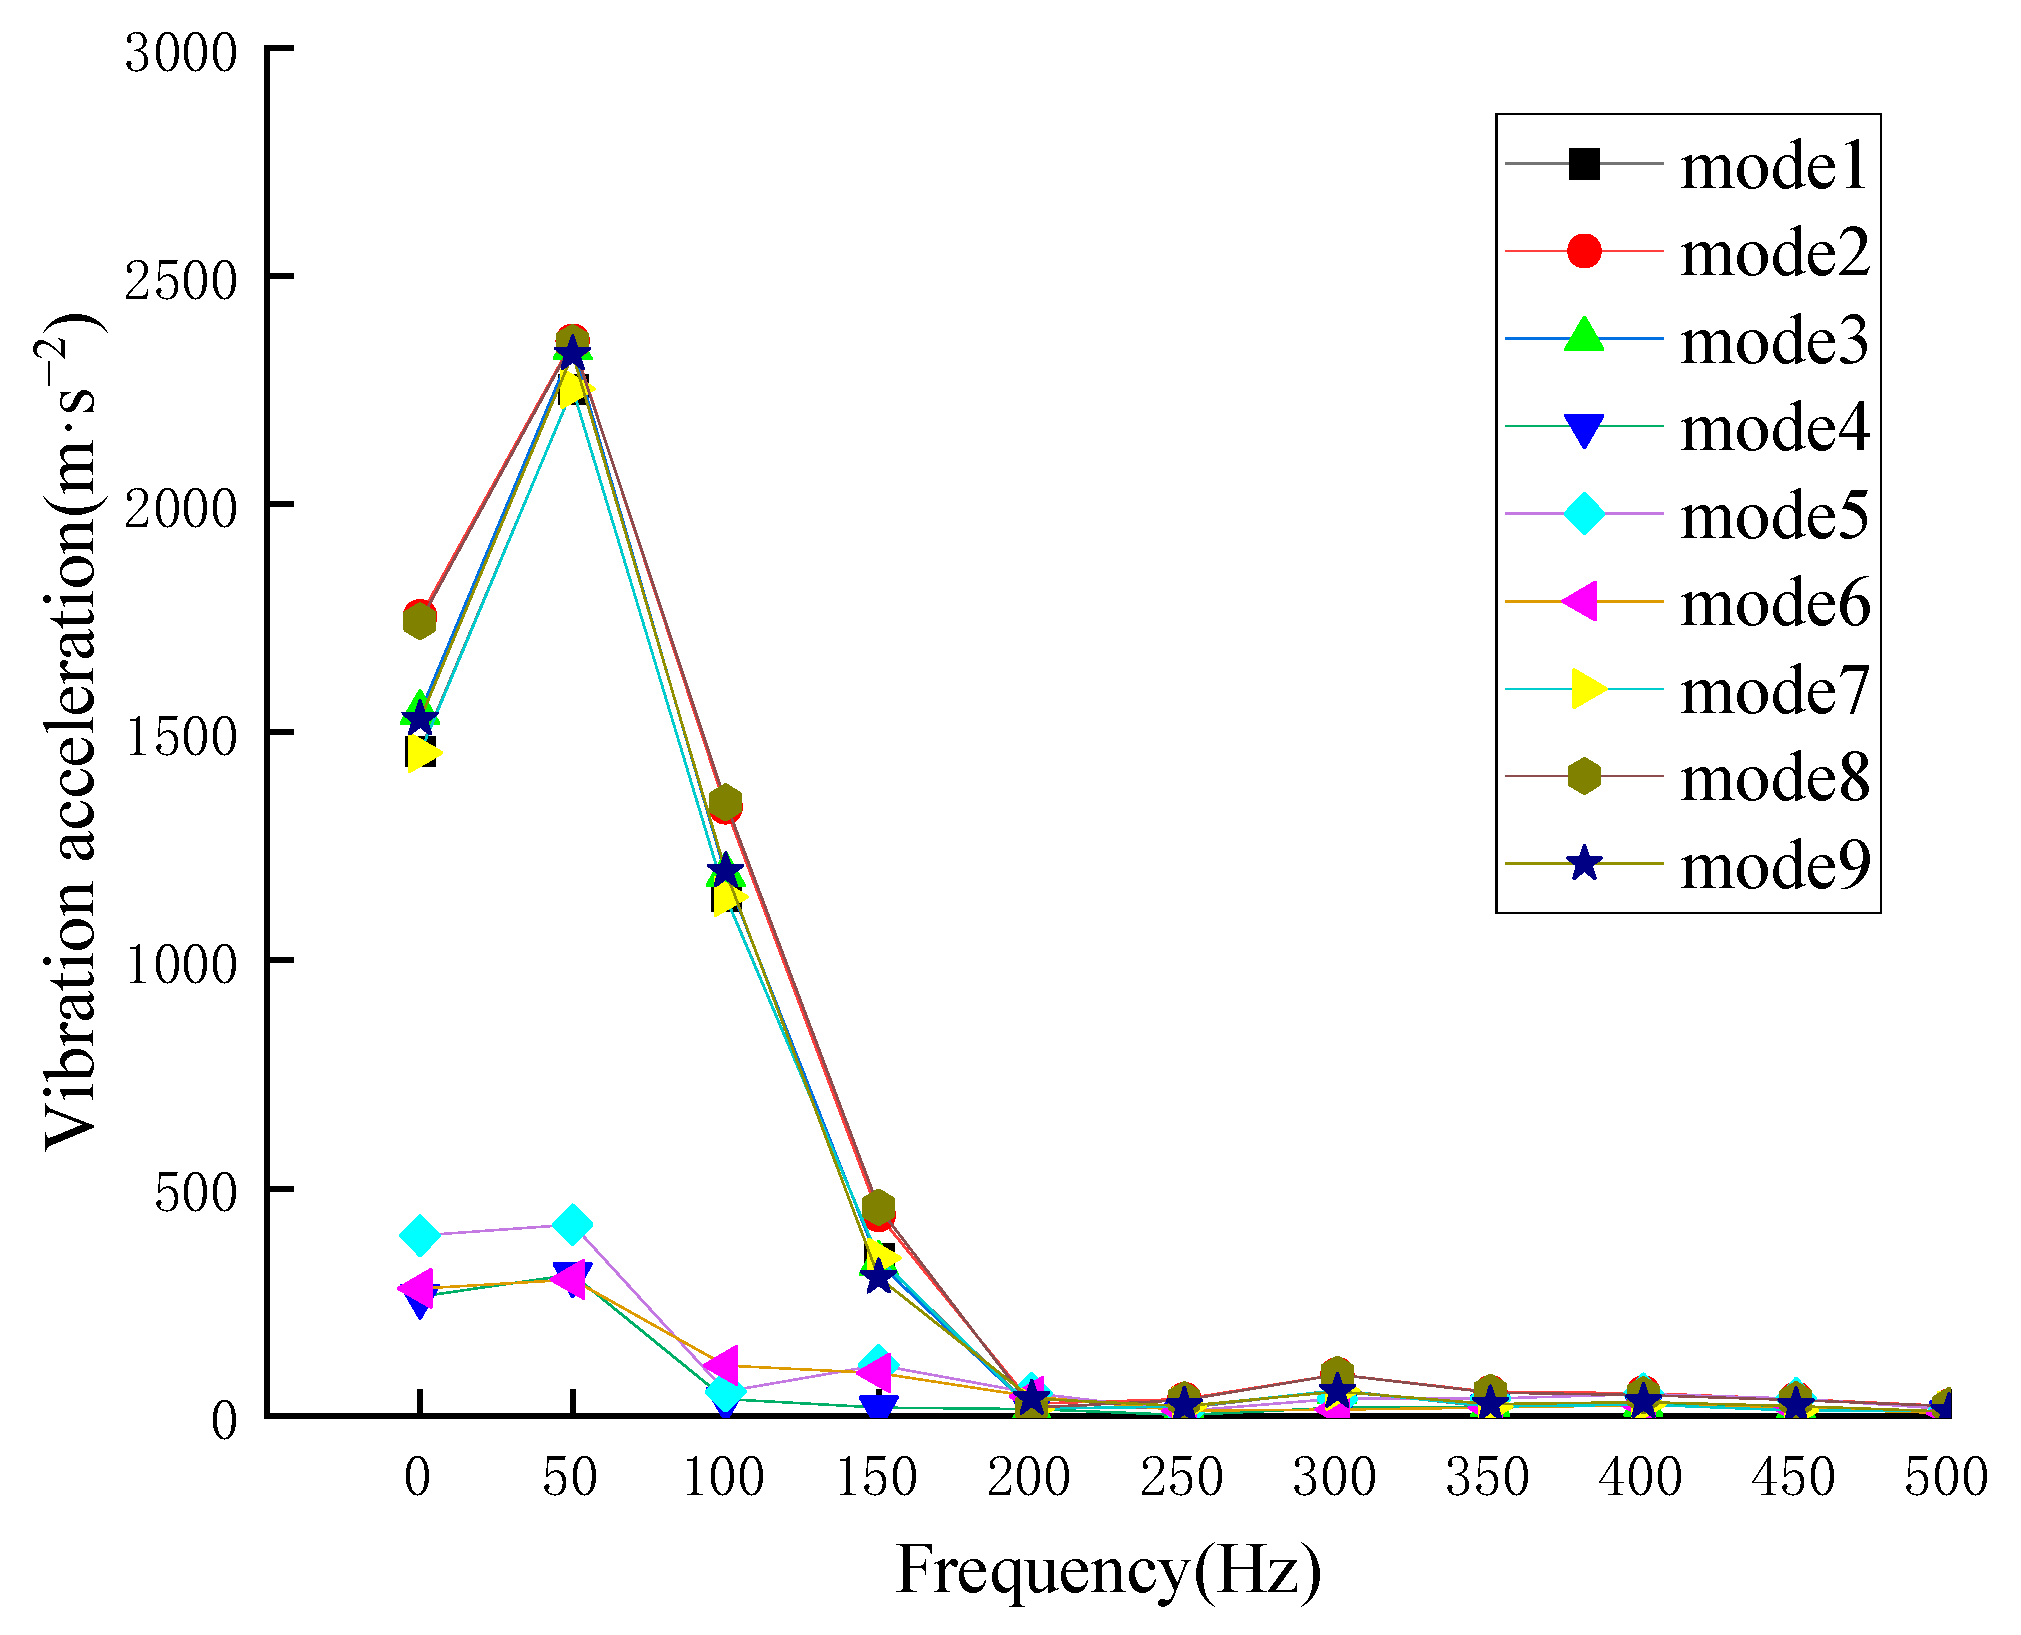
In the
Figure 14, 1–9 are the positions of different measuring points in the winding. According to the point position in the figure, the acceleration characteristics at different point positions were obtained and the time–frequency conversion was performed to obtain the content of different frequencies of acceleration at each point of the winding, as shown in
Figure 15. It can be seen from the simulation results that the acceleration ratio of each frequency at the points (1, 2, 3, 7, 8, 9 points) where the winding acceleration is greatly affected by the inrush current is consistent with the distribution of the input inrush current, but the DC component in the middle area of the winding (4, 5, 6 points) has a larger ratio and a smaller second harmonic content.
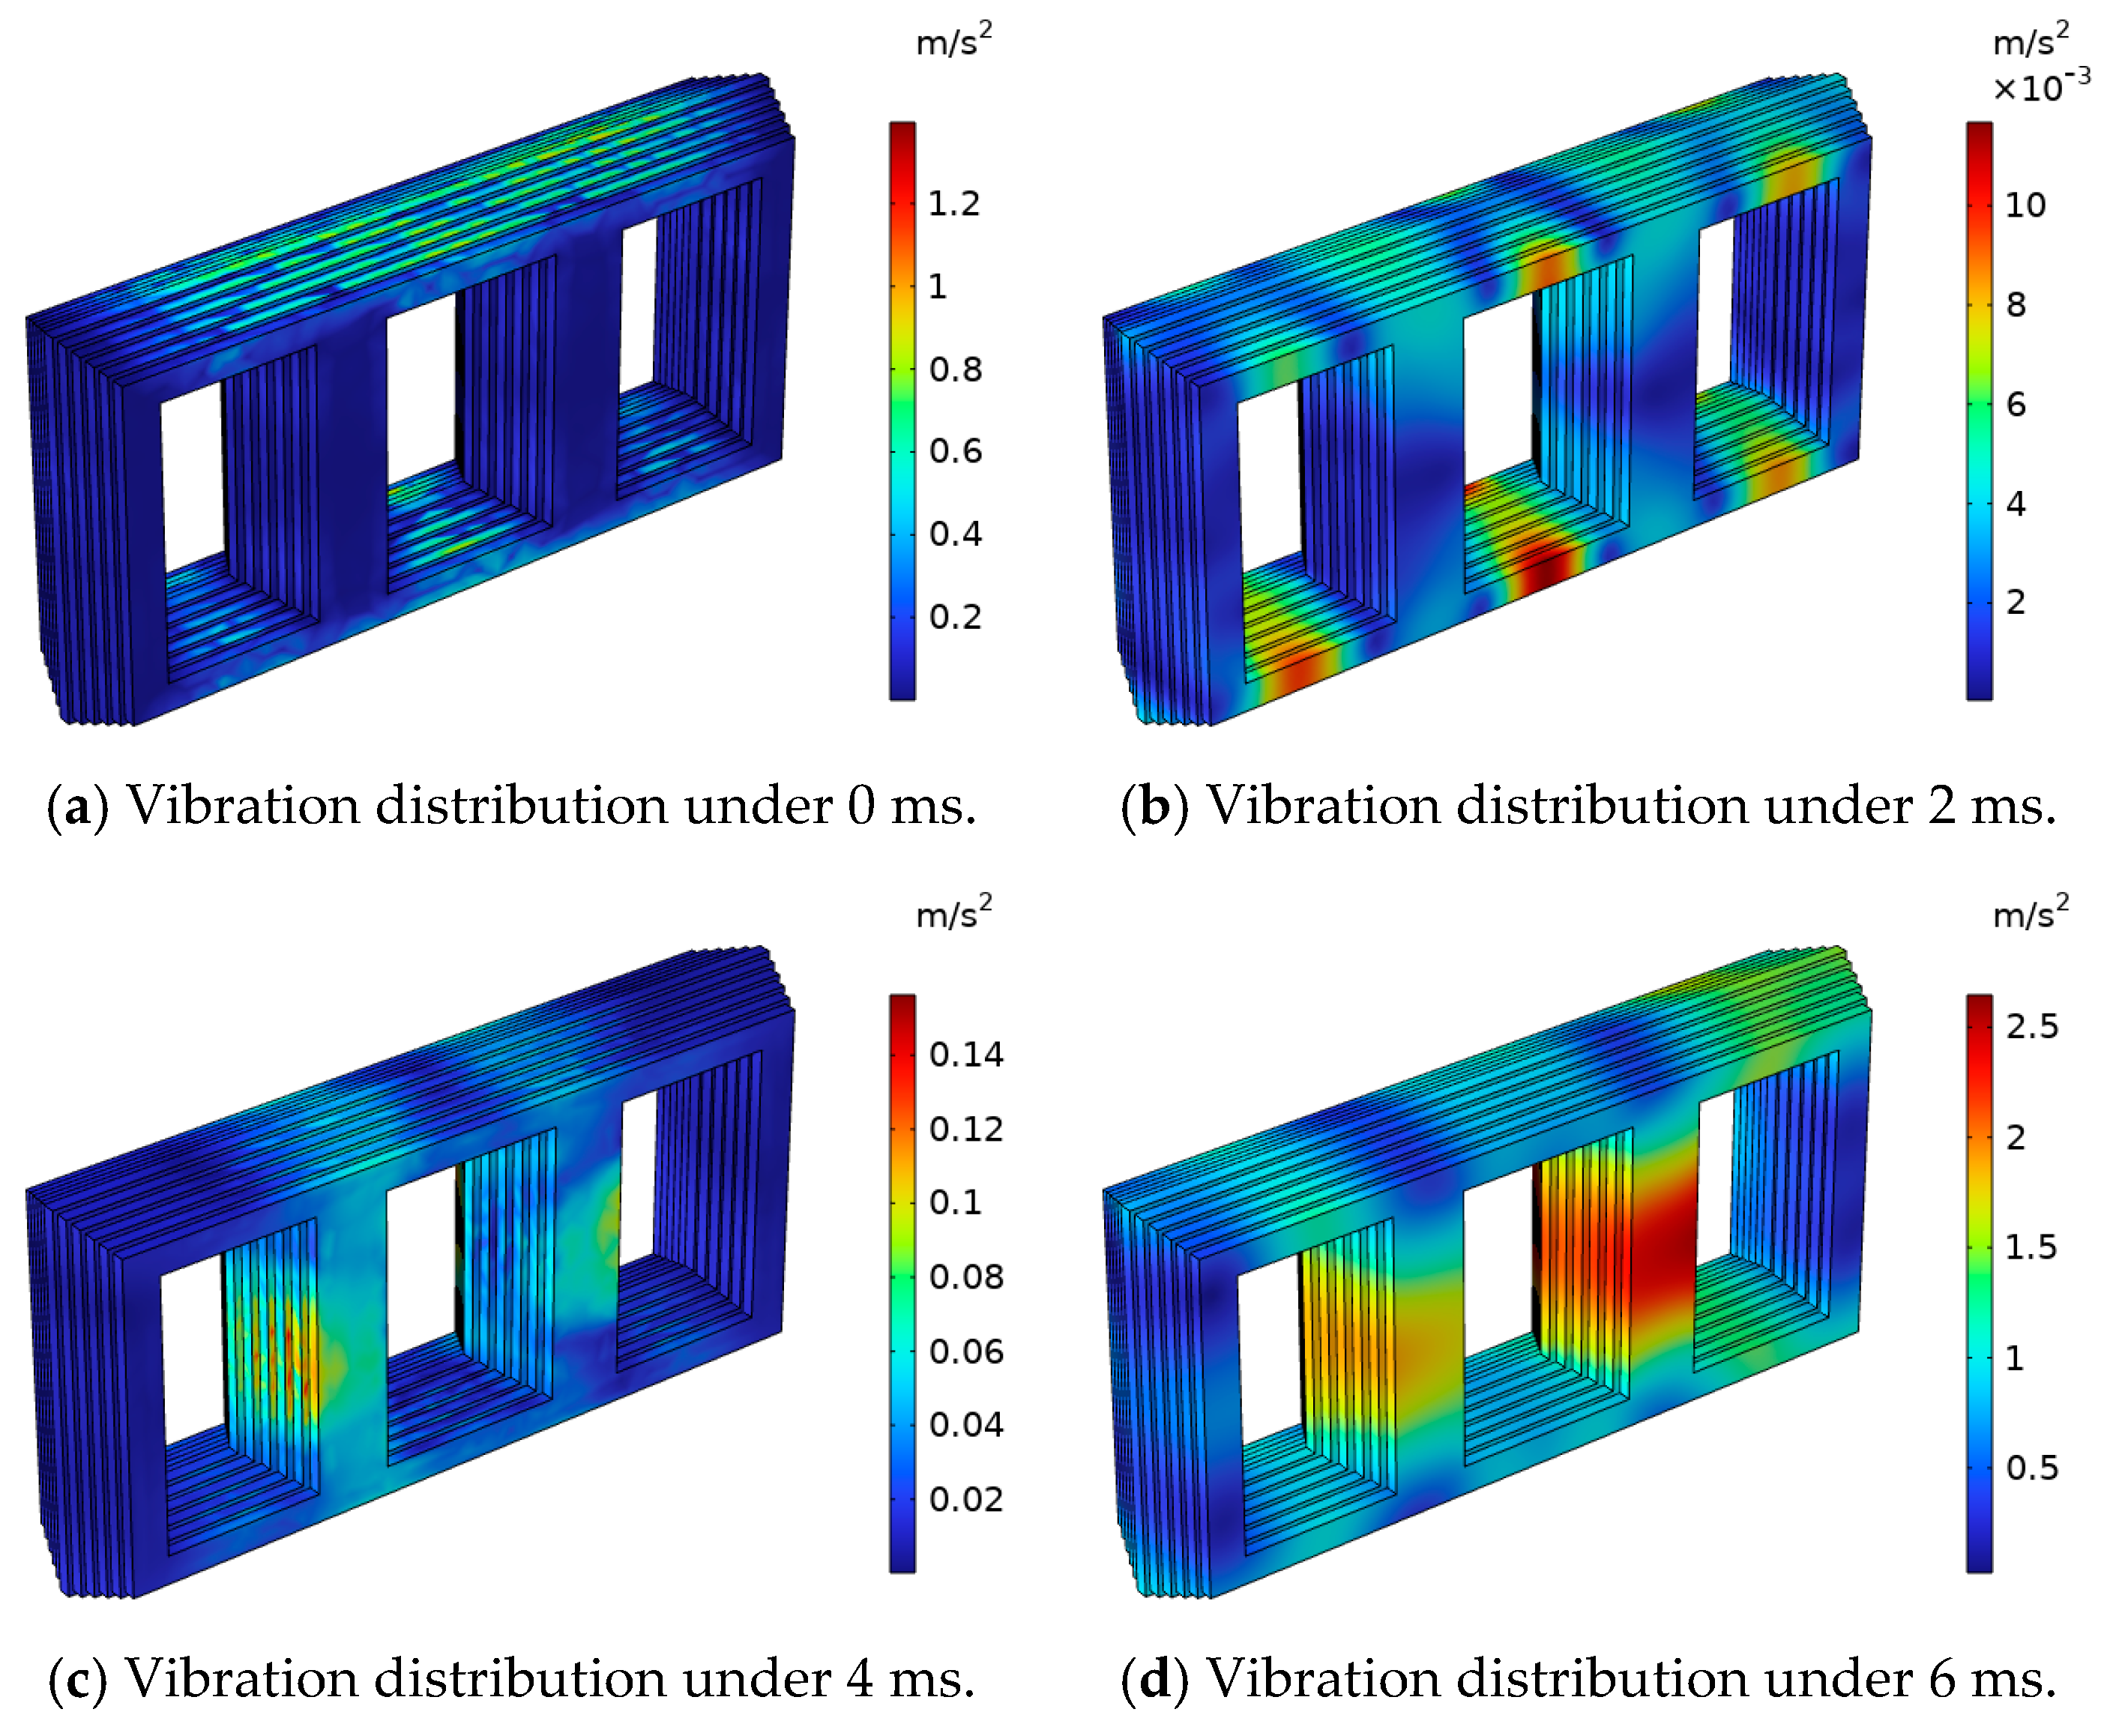
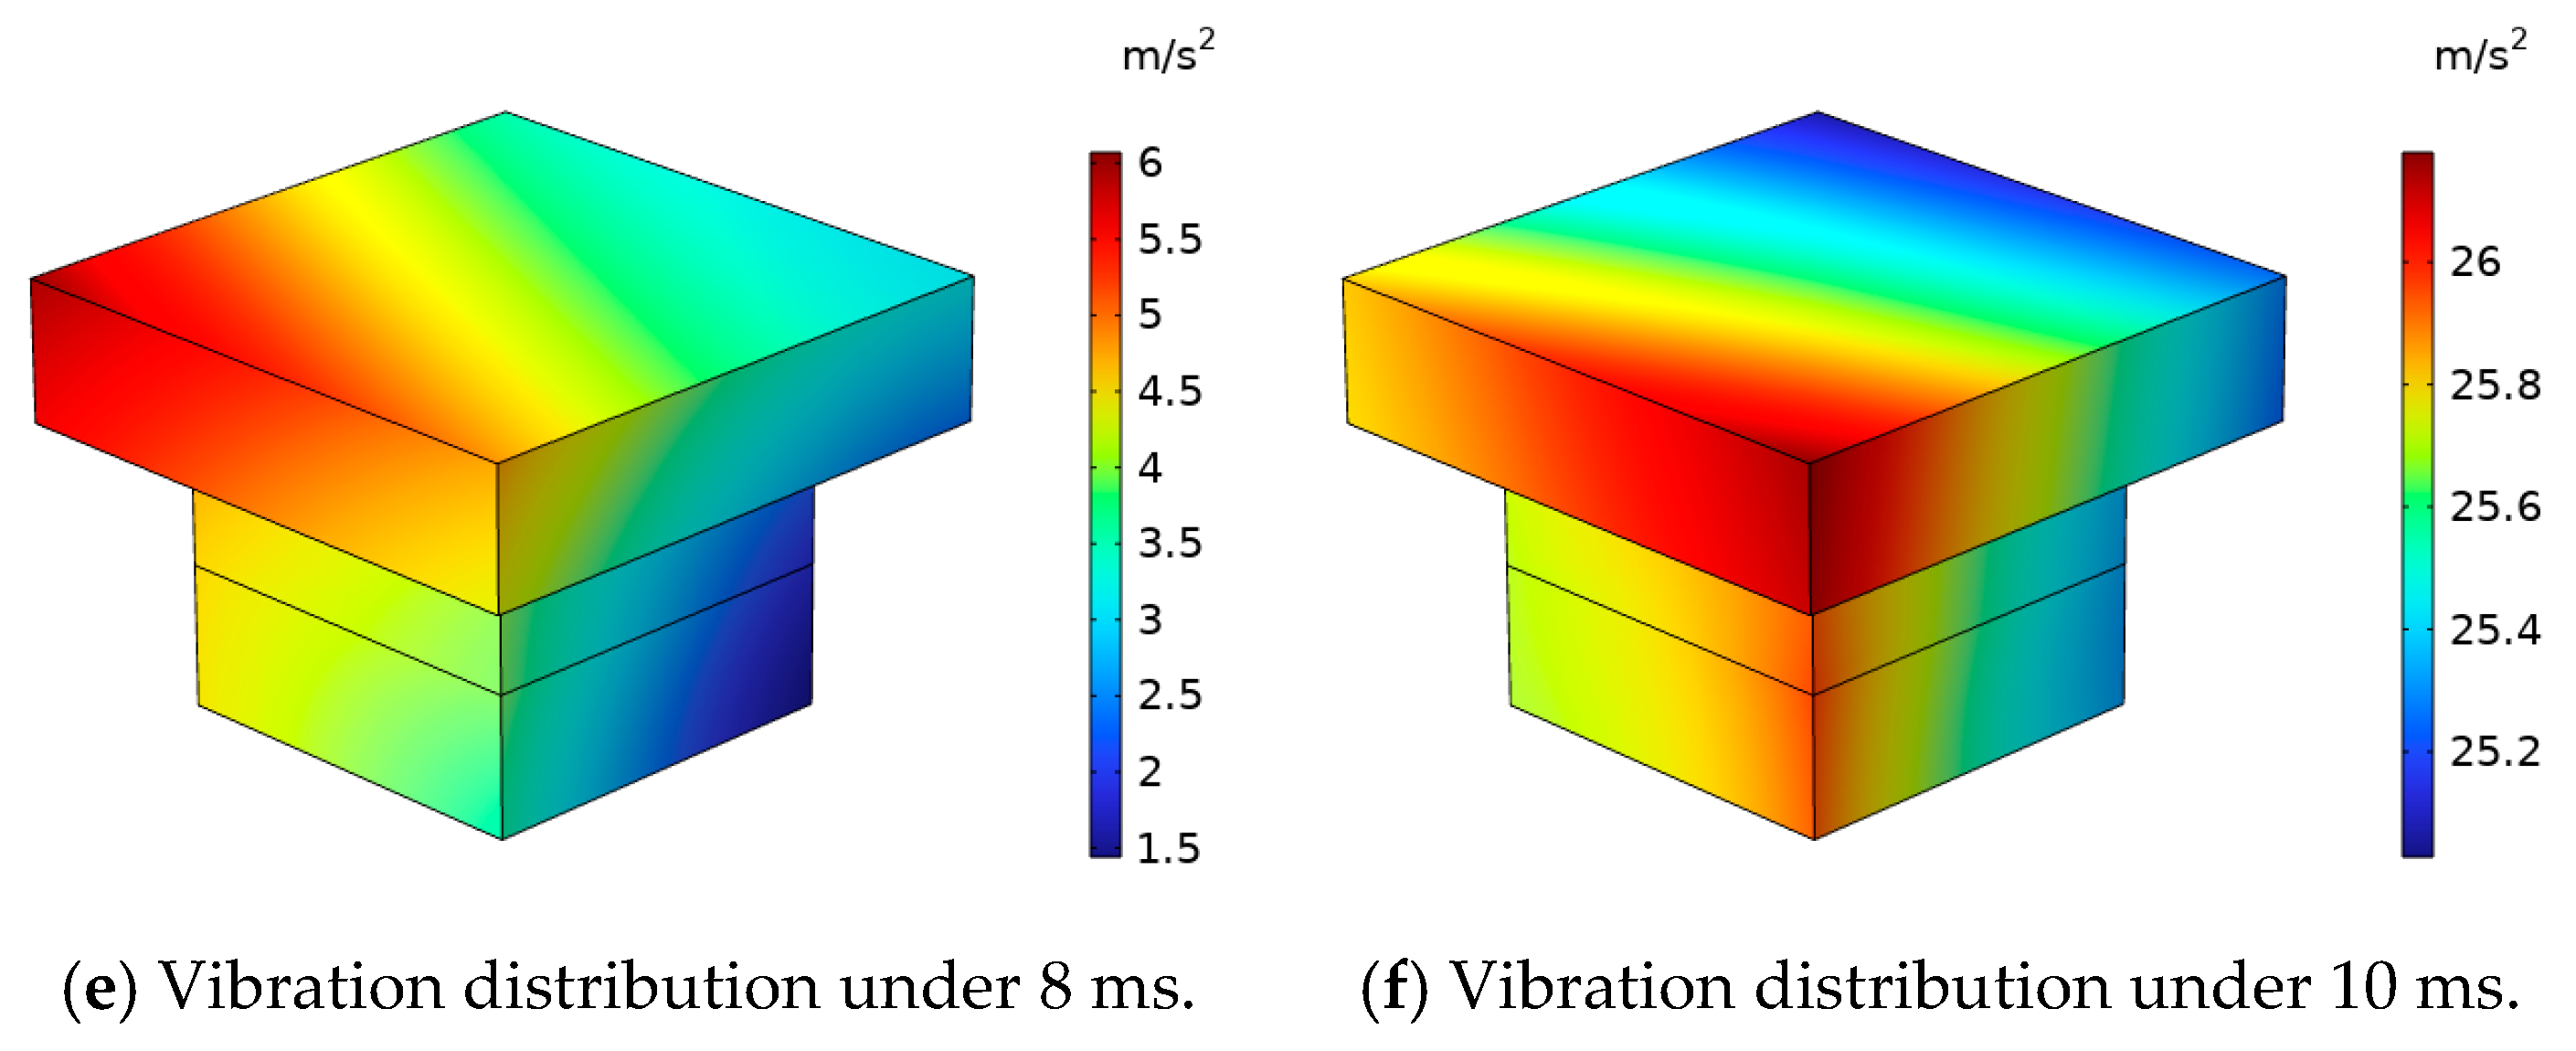
6.2. Vibration Characteristics Analysis of Iron Core
The vibration of the core during the excitation of the inrush current is due to the influence of the winding vibration and the ferromagnetic material itself. It can be seen from
Figure 16, the maximum acceleration of the core is about 4 m/s
2. Compared with the effect of the inrush current on the winding, the vibration acceleration of the core is much smaller than that of the winding.
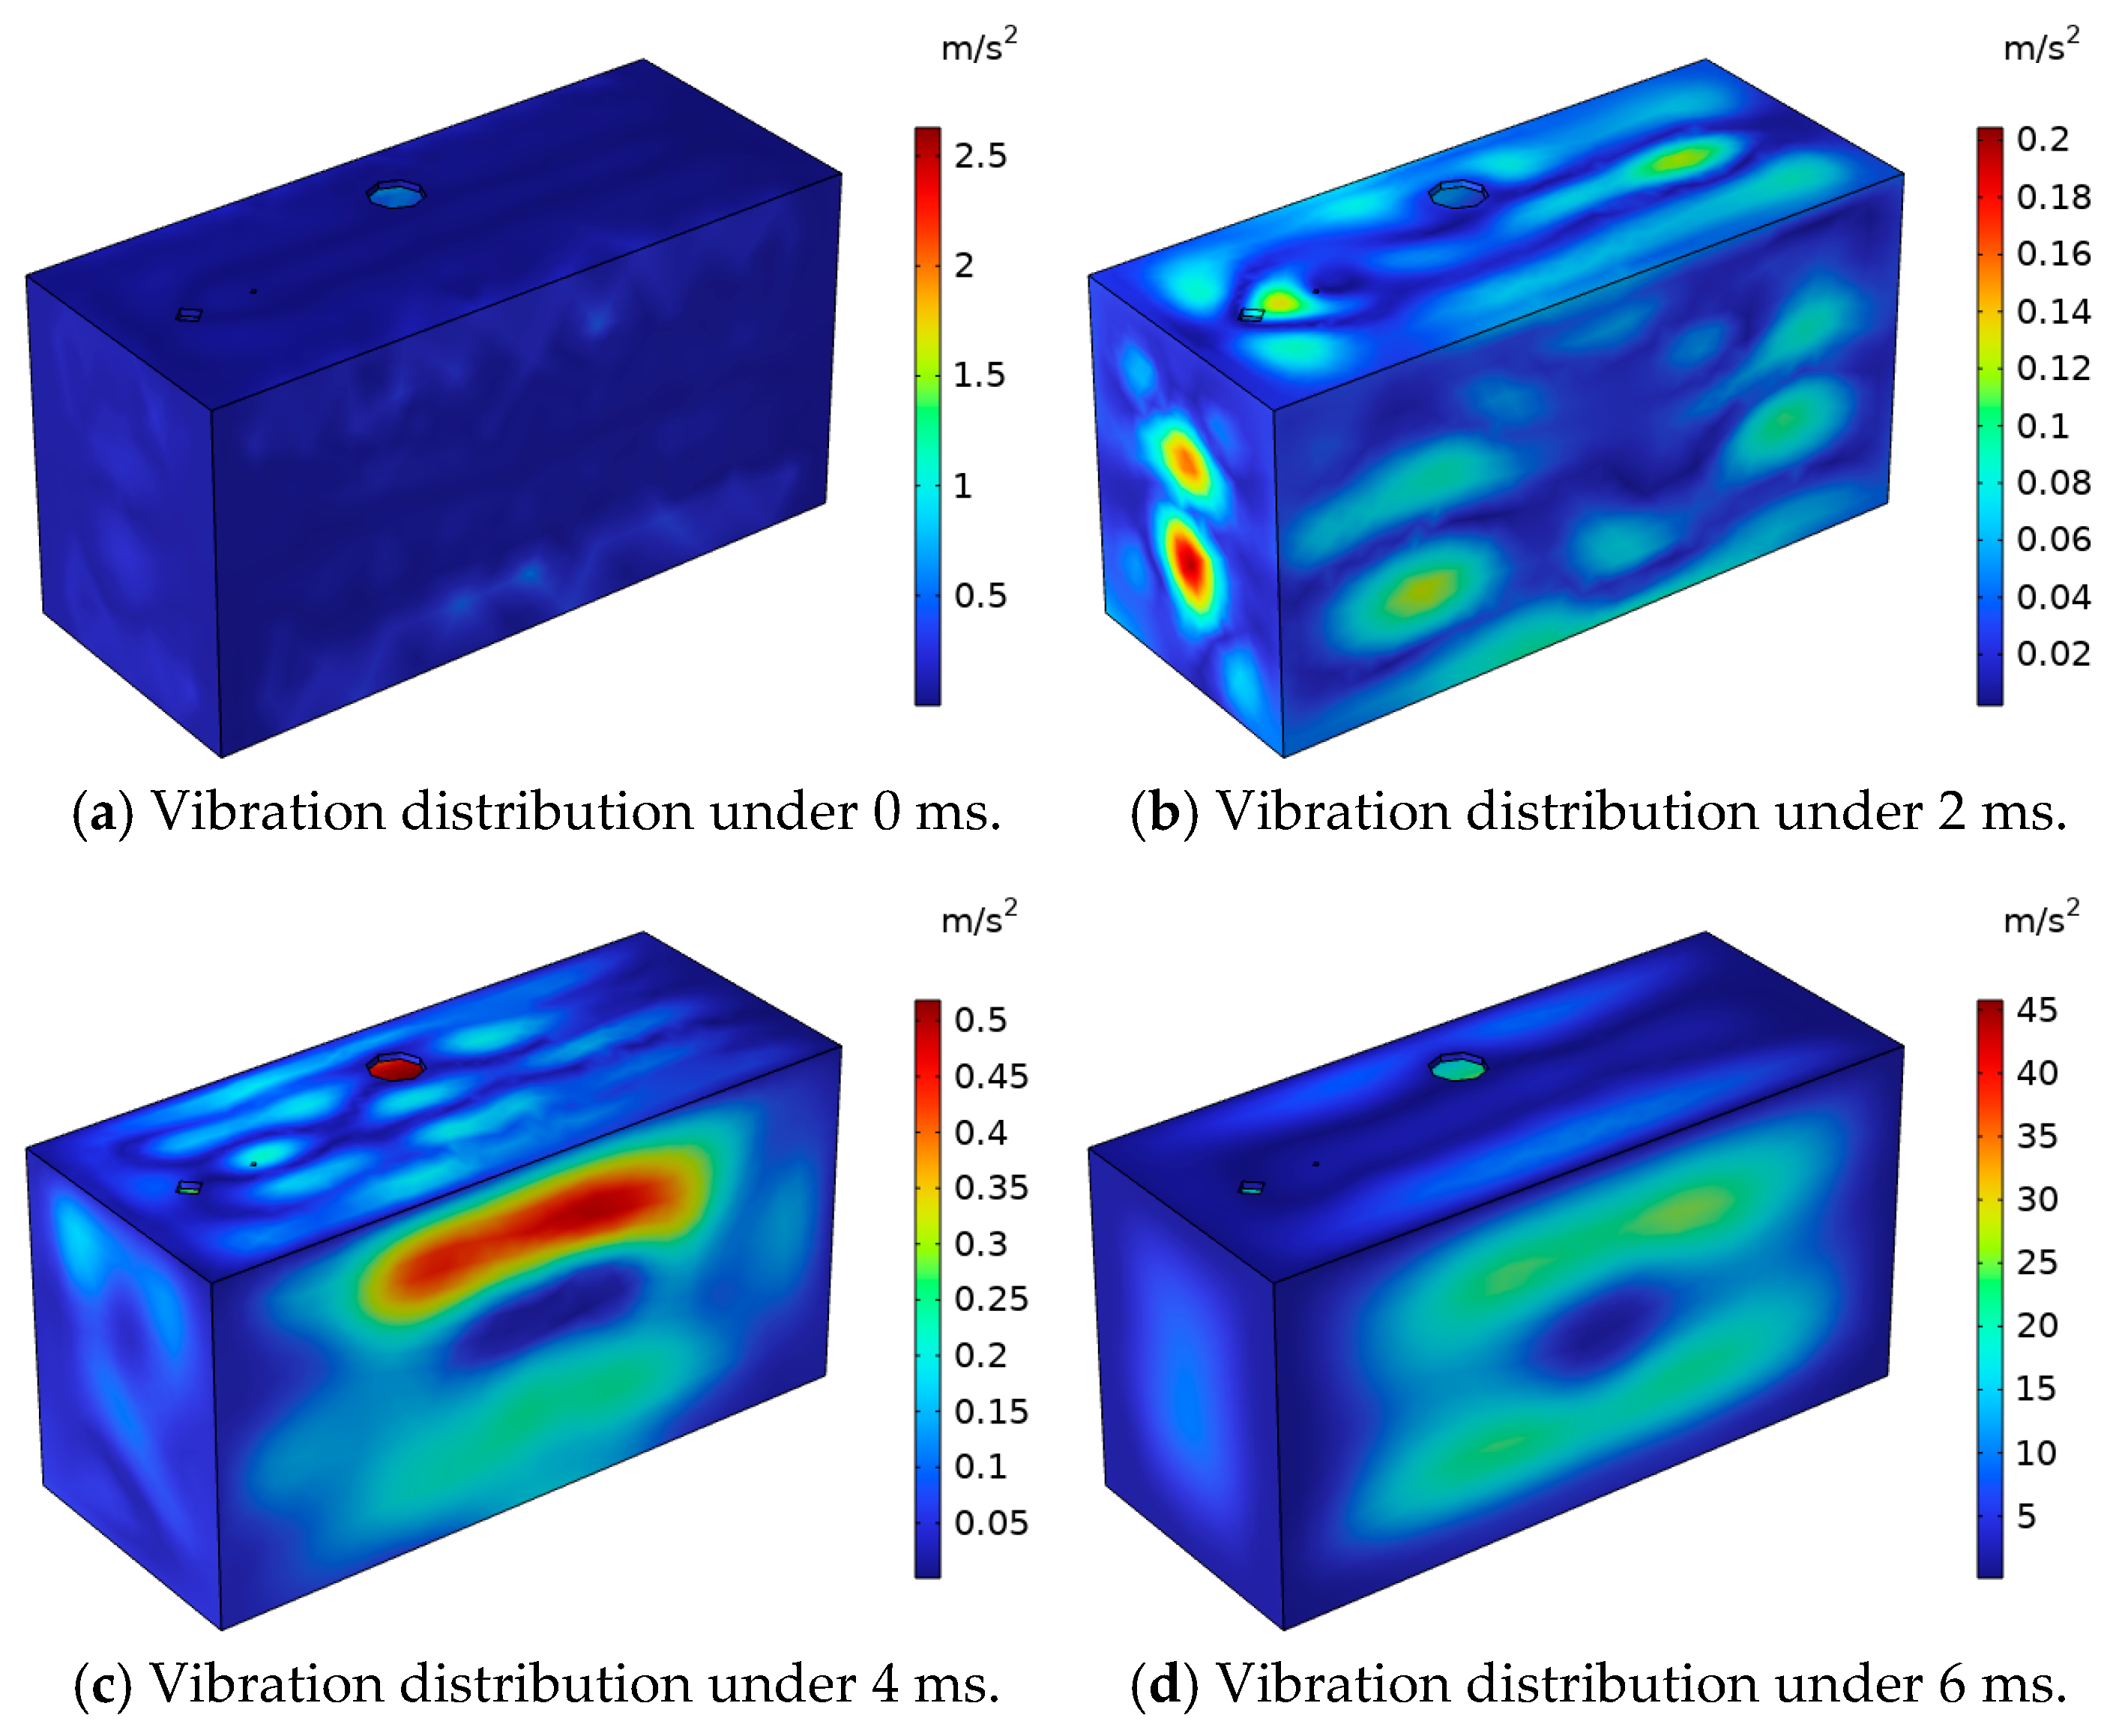
6.3. Vibration Characteristics of Converter-Transformer Box Surface
When the converter-transformer winding has an excitation inrush current, the acceleration distribution on the surface of the converter transformer box is shown in
Figure 17. In the process of vibration-signal transmission, the vibration signal of the winding acts on the surface of the box through the insulating oil, and the acceleration of the box increases with time in the first cycle. At the same time, the maximum acceleration area of the box surface is mainly concentrated in the middle of the box surface and the middle of the bottom. The maximum acceleration of the box surface can reach 211.83 m/s
2, and the maximum acceleration of the bottom can reach 304.95 m/s
2.
The distribution of measuring points on the surface of the converter transformer box is shown in
Figure 18. We set 1–9 points for observation respectively. The content of each frequency component of the acceleration at different points of the box is shown in
Figure 19. The experimental results show that the vibration signal on the surface of the box contains a large number of DC and 50 Hz and their frequency-doubling components. The difference between the DC component and the fundamental wave is about 20%, and the high-order harmonic content at different points is quite different. The content of 100 Hz and 150 Hz is greater than 50%, and the high-order harmonic content is relatively small.
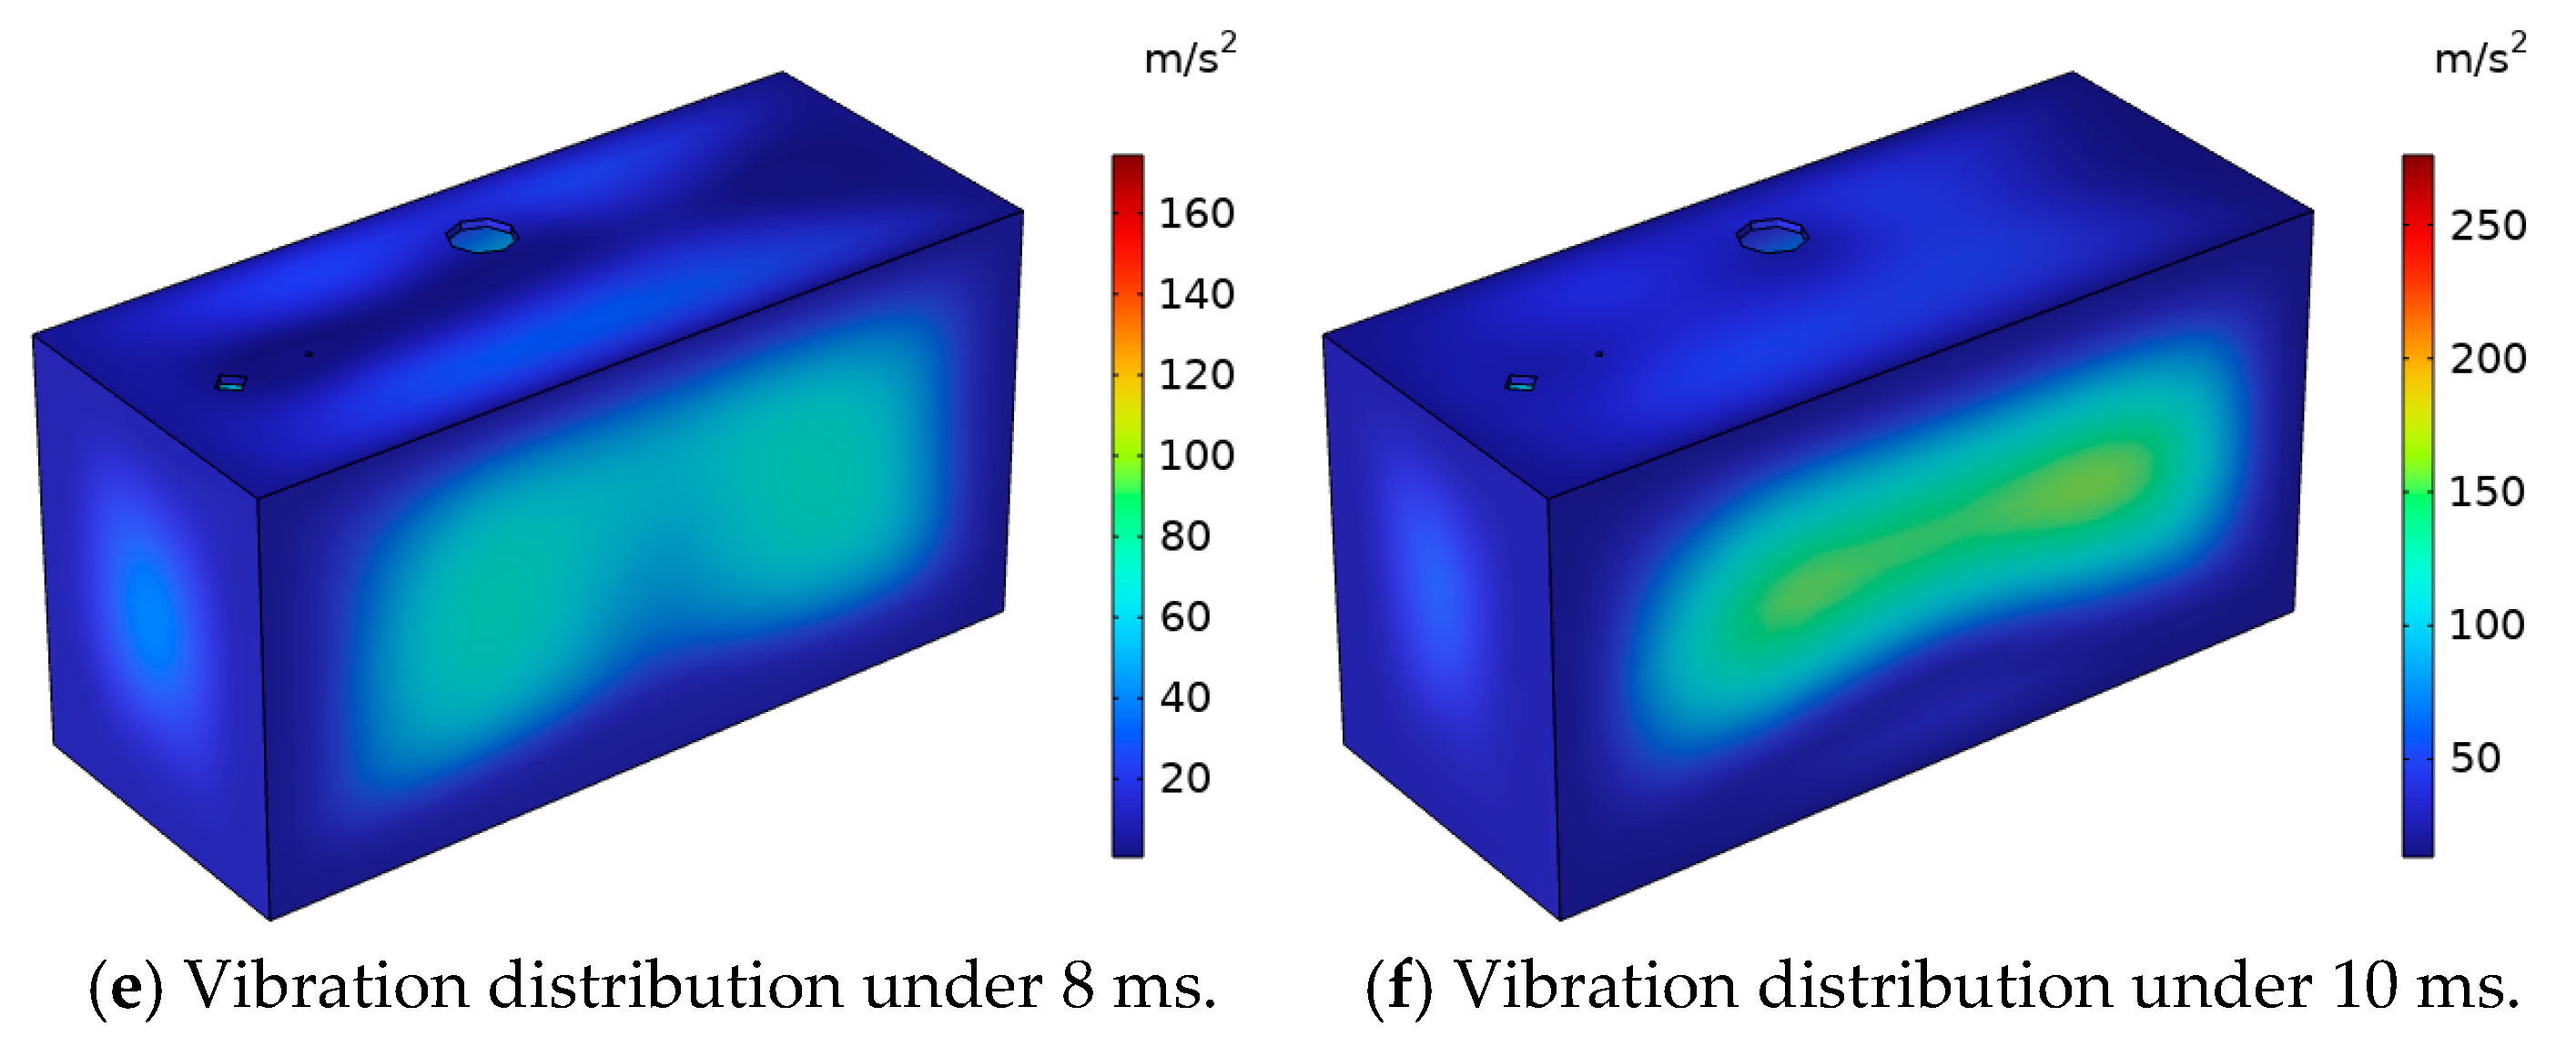
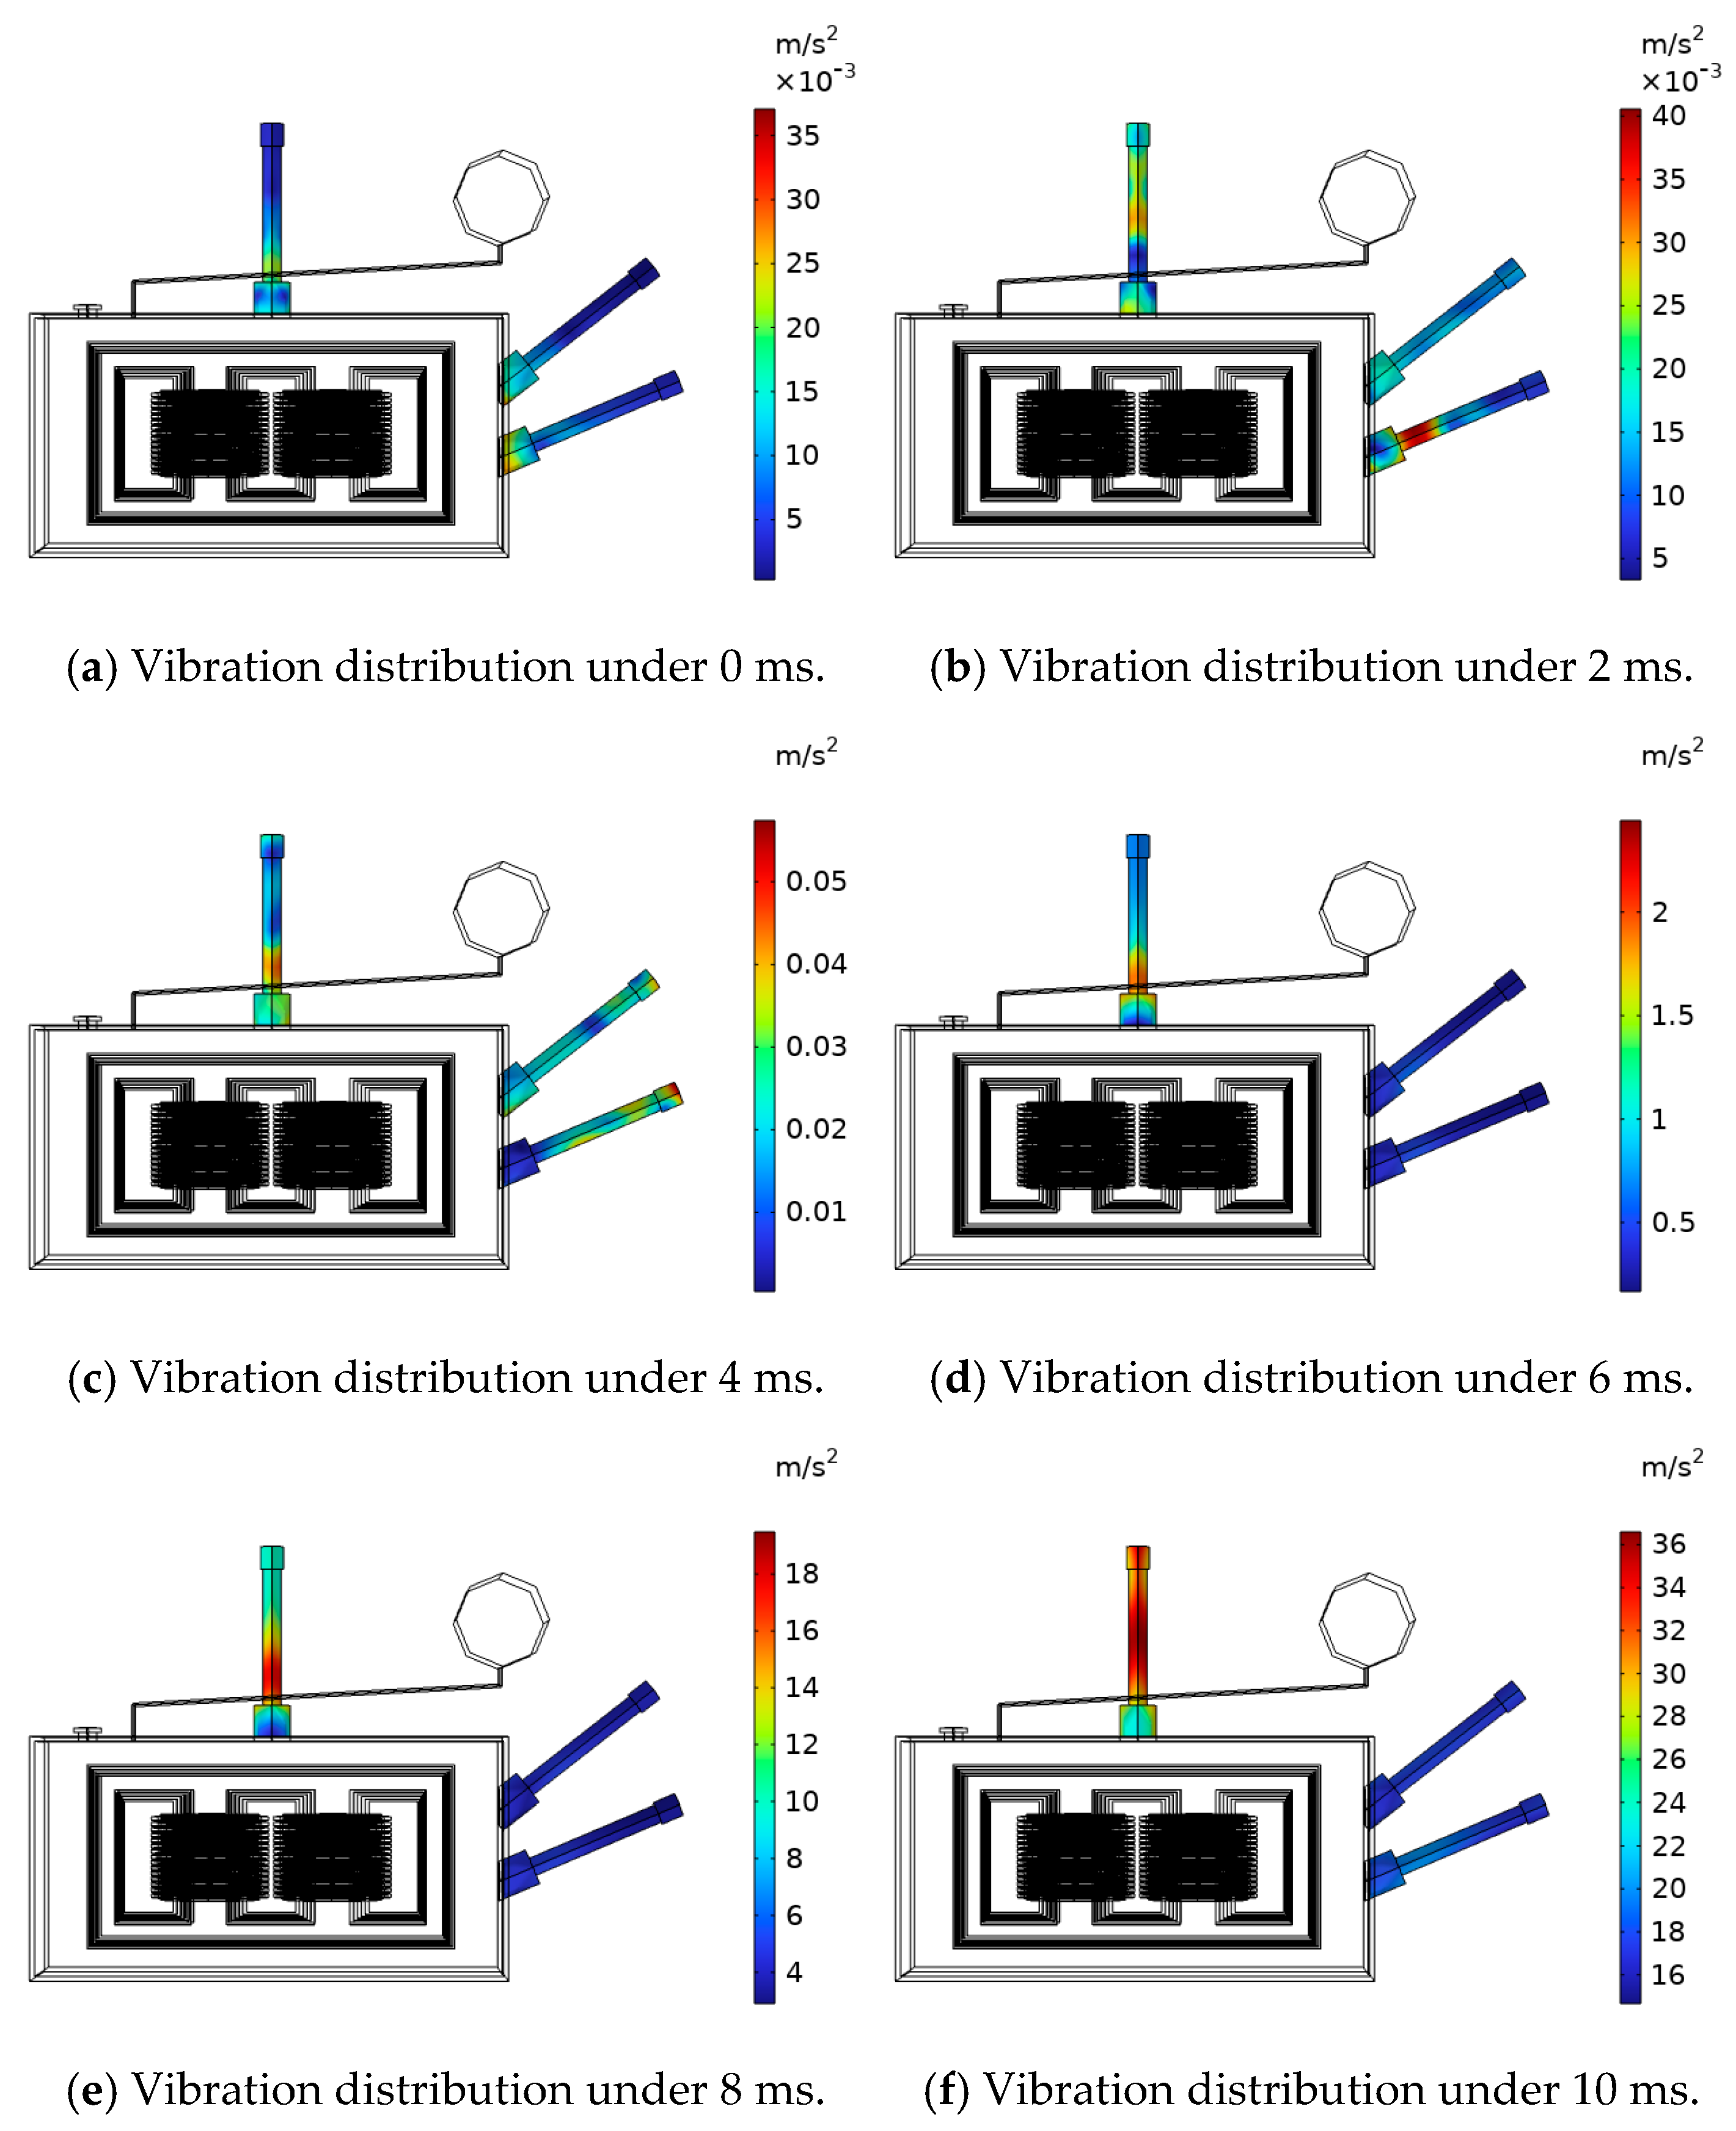
6.4. Vibration Characteristics of Tubing and Gas Relay
The vibration cloud diagram of the tubing at different times is shown in
Figure 20. The vibration spectrum at the gas relay is shown in
Figure 21 The time–frequency conversion of the tubing vibration at the gas relay was carried out to obtain the distribution of the tubing at different frequencies of the gas relay, as shown in the table. The fundamental component (50 Hz) reaches 7.01 m/s
2. At the same time, it contains a large number of DC components and 50 Hz frequency-doubling components, of which the DC component content reaches 66.0%, and the second harmonic reaches 49.2%. When the vibration signal is transmitted to the gas relay along the tubing, if the natural frequency of the internal baffle of the gas relay is the same as the vibration frequency, the baffle of the gas relay will deflect, and there is a risk of misoperation.
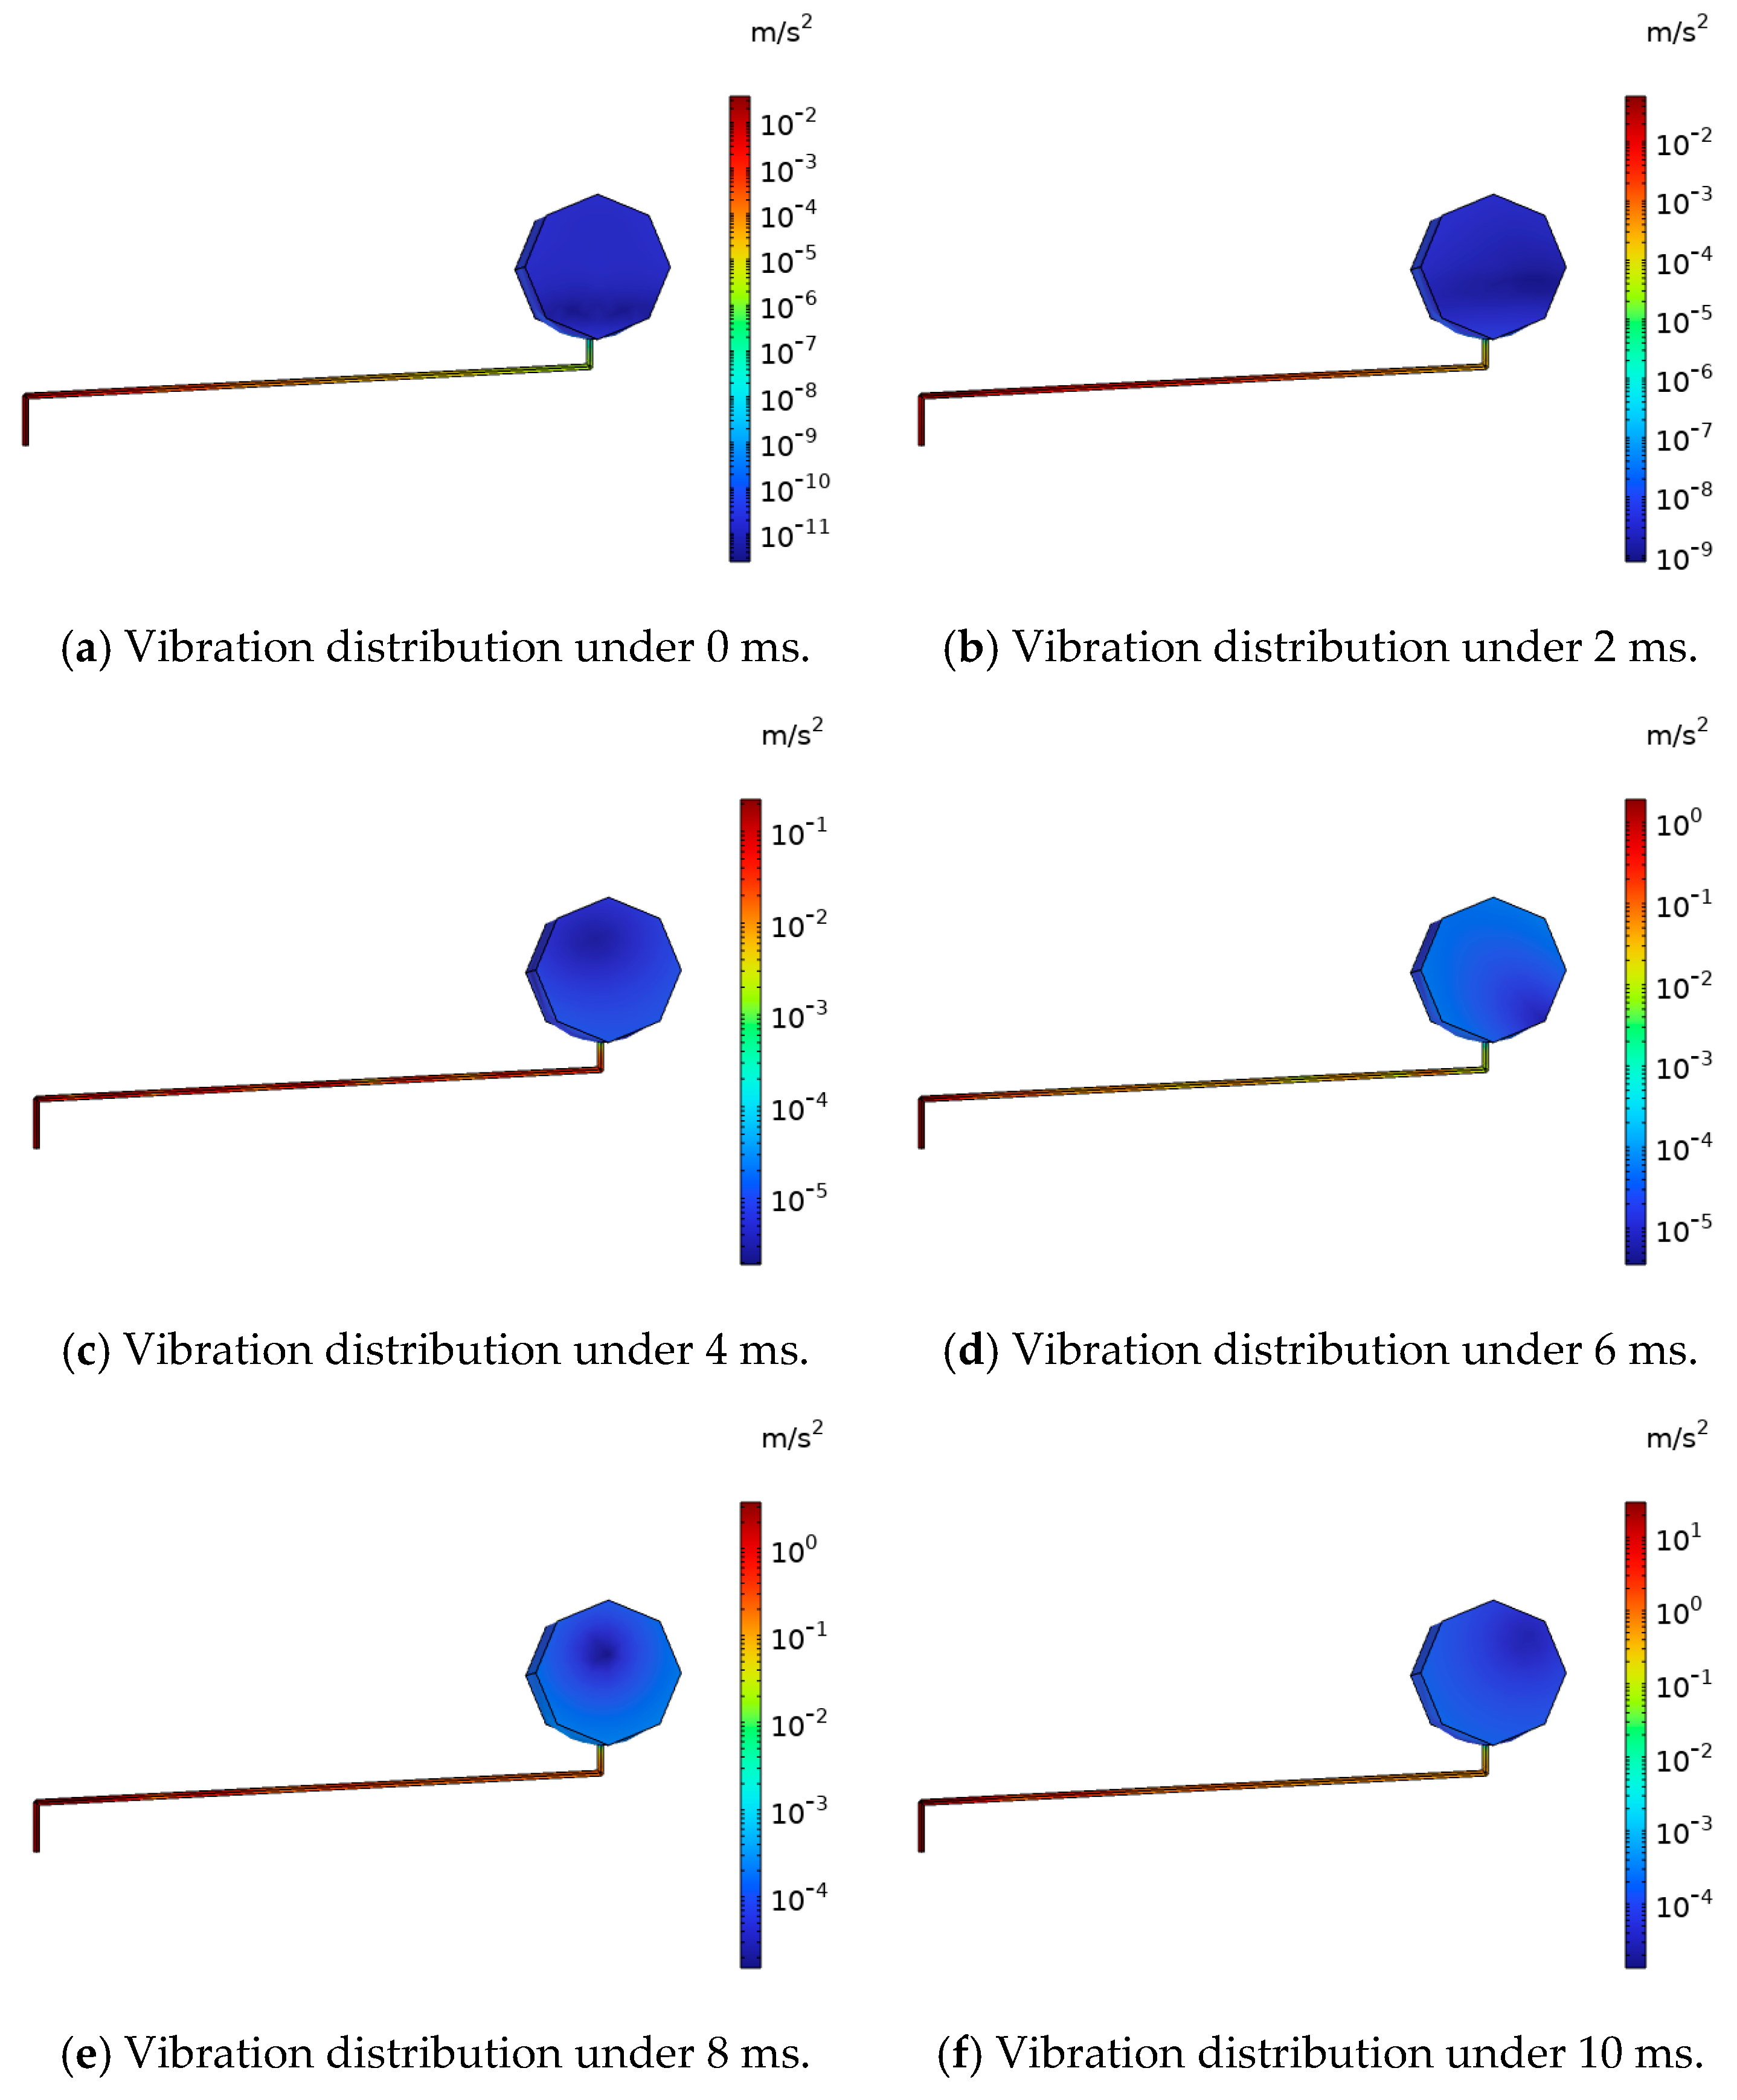
6.5. Vibration Characteristics Analysis of Pressure-Relief Valve
The vibration cloud diagram and vibration spectrum at the pressure relief valve are shown in
Figure 22 and
Figure 23. The experimental results show that the vibration trend of the pressure-relief valve is consistent with the vibration trend of the box, and the vibration amplitude gradually increases in the first cycle. For the pressure relief valve itself, the vibration amplitude at the top of the pressure-relief valve is slightly larger than that at the side. The maximum vibration acceleration of the pressure-relief valve can reach about 27.8 m/s
2 at 20 ms.
The vibration of the pressure-relief valve contains a large number of DC components and 50 Hz frequency-doubling components, of which the DC component contains a rate of 83.6%, the third harmonic contains a rate of about 26.0% and the higher harmonic contains a lower rate, less than 20% of the fundamental wave. Similar to the gas relay, when the natural frequency of the pressure-release valve is the same as that of the pressure-release valve and exceeds a certain content, the pressure-release valve has the risk of misoperation.
6.6. Analysis of Casing Vibration Characteristics
The acceleration-distribution cloud diagram of the converter-transformer bushing under the inrush current is shown in
Figure 24. From the experimental results, it can be seen that under the action of the inrush current, the vibration acceleration of the grid-side bushing at the top of the converter transformer is greater than that of the valve-side bushing on the side. This is because the vibration amplitude at the top of the converter-transformer box is greater than the vibration amplitude on the side. For 20 ms, the maximum vibration point of the network side casing is located in the middle area of the casing, and the maximum acceleration can reach about 147.7 m/s
2. The maximum vibration point of the valve side casing is located in the rising part of the casing, and the acceleration is about 62.5 m/s
2.
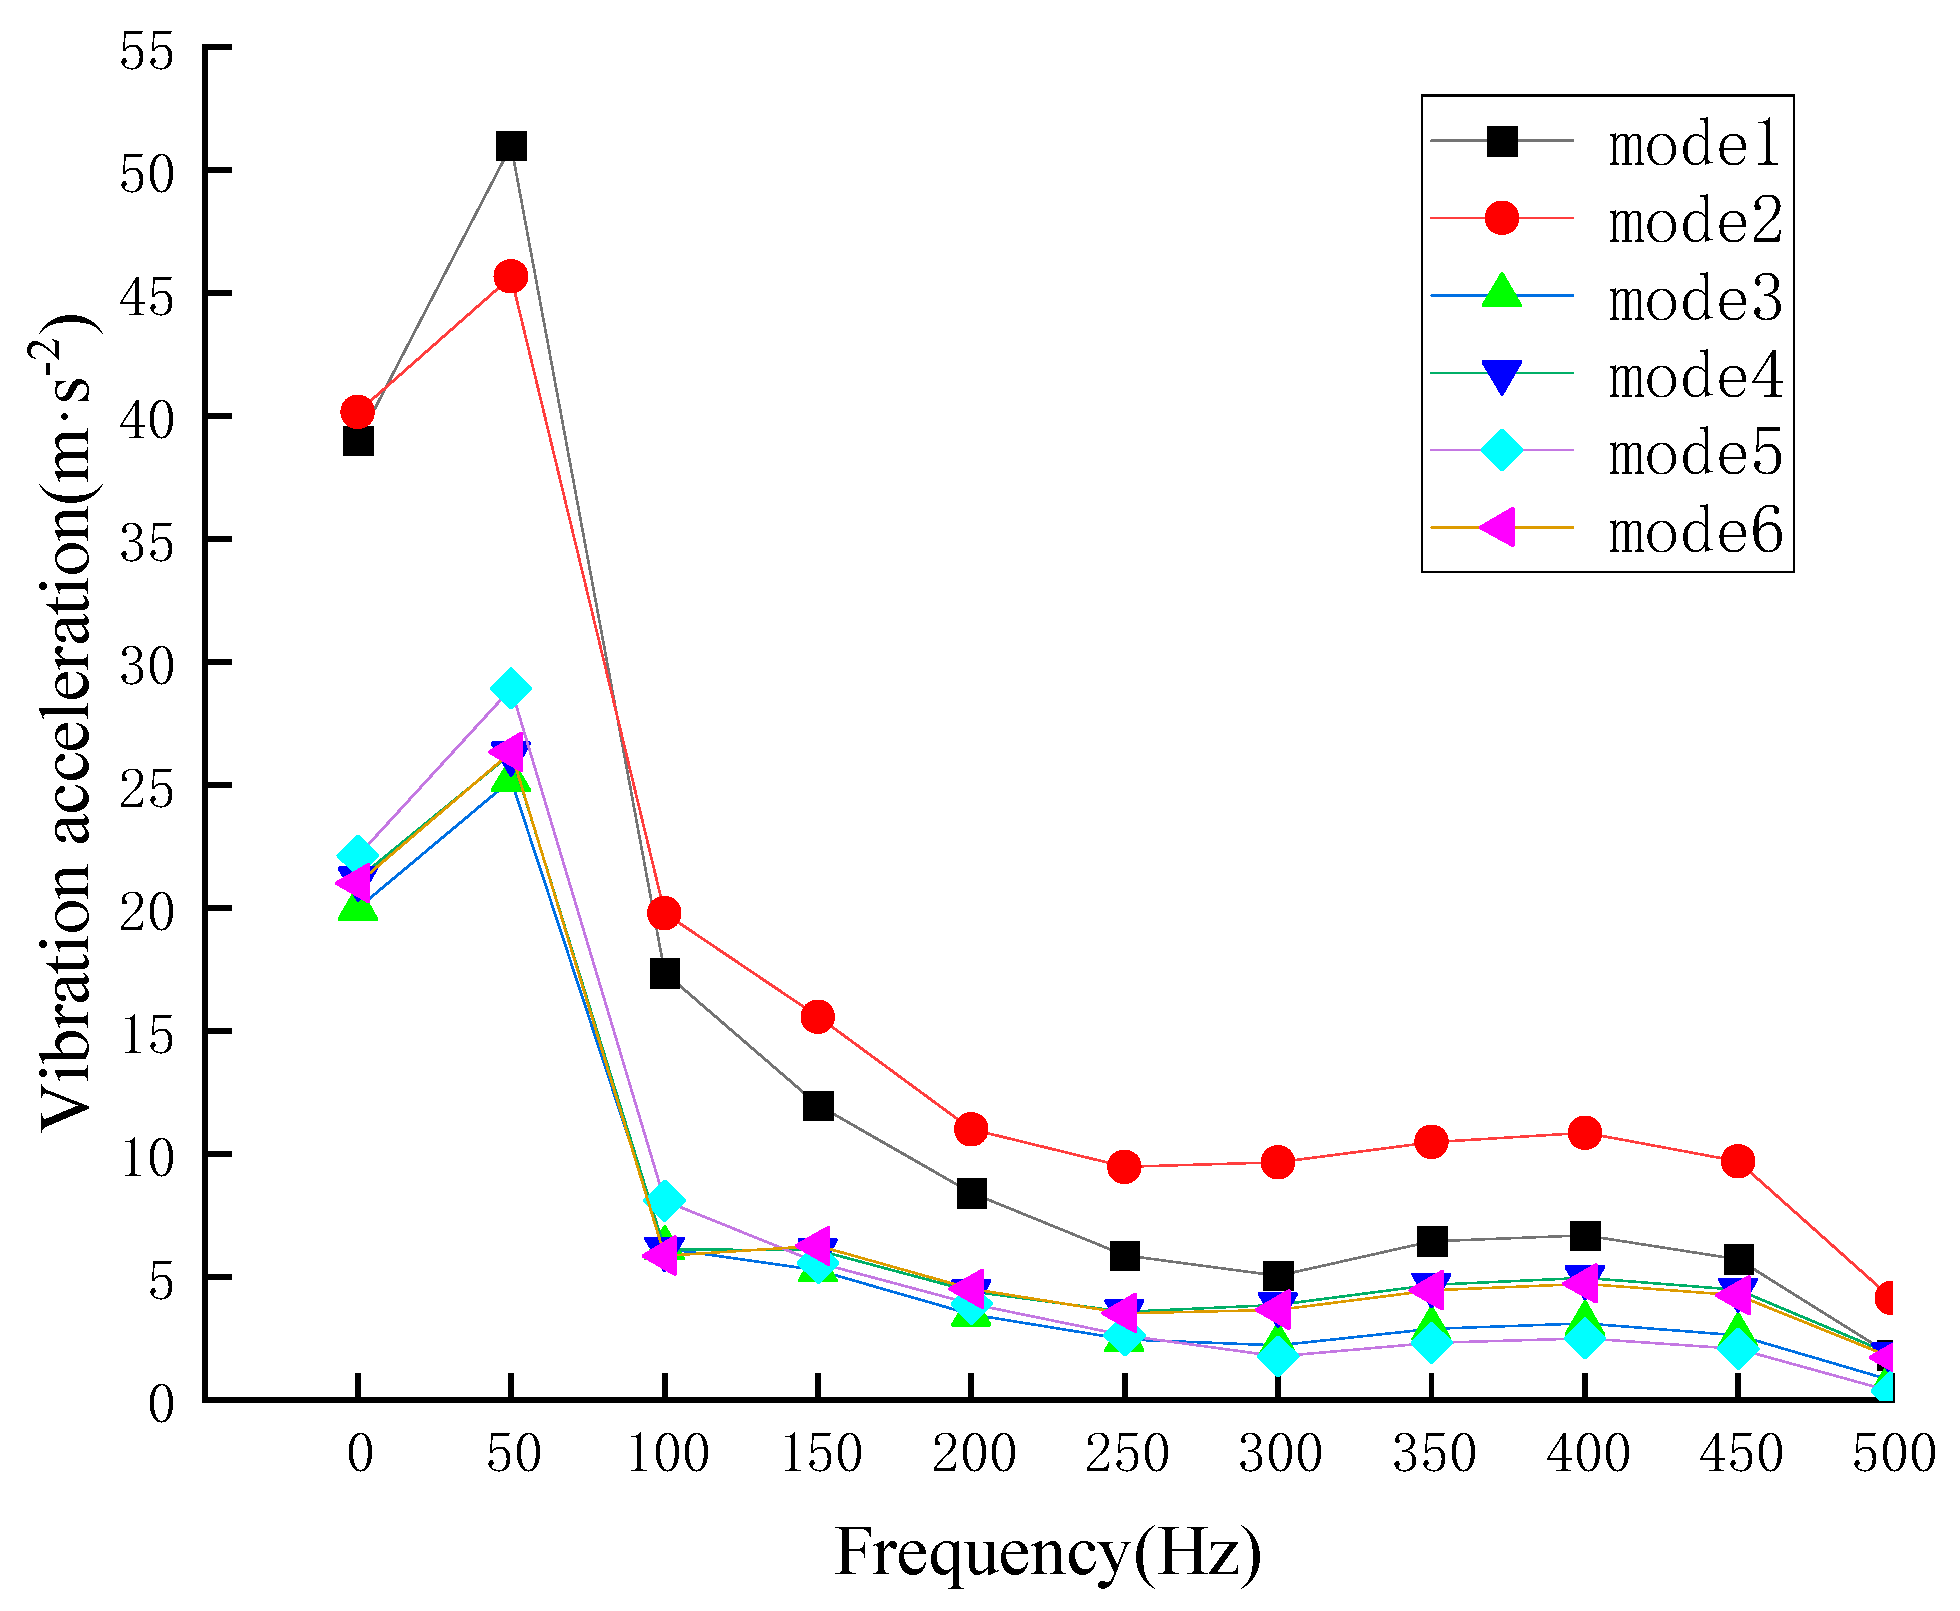
The vibration–frequency distribution of the selected points on the grid side and the valve casing is shown in
Figure 25. The main frequency of the casing vibration is 50 Hz, and the amplitudes at different points are 50.99 m/s
2, 45.66 m/s
2, 25.20 m/s
2, 26.27 m/s
2, 28.92 m/s
2 and 26.33 m/s
2, respectively. In addition to the main frequency, it contains a large number of DC components. The DC component of the vibration acceleration at different points contains about 80% of the main frequency content, and the acceleration contains a small amount of 50 Hz frequency-doubling component.
7. Conclusions
In this paper, the vibration source and vibration path of a converter transformer under a magnetizing inrush current are analyzed, and the mathematical relationship between the vibration mechanism of converter-transformer winding under a magnetizing inrush current is deduced. The finite element simulation model of electromagnetic-force-flow multi-physical field coupling is established by COMSOL, which can efficiently simulate the complex vibration characteristics of a converter transformer under an inrush current. By building a finite-element simulation platform for a electromagnetic-force-flow coupling simulation model, the vibration characteristics of the converter transformer core, winding, converter-transformer box surface, tubing, pressure-relief valve and bushing under the action of a magnetizing inrush current were analyzed, respectively. The time–frequency analysis of the converter-transformer winding, box, tubing, pressure-relief valve, bushing and other components was carried out, and the following conclusions were obtained:
(1) With the increase of current, the vibration acceleration of the winding also increases, and the acceleration of the winding reaches the maximum when the current reaches the peak. When the inrush current reaches the peak, the vibration acceleration in the middle area of the winding is small. For the same horizontal plane, the vibration acceleration of the middle part of the upper and lower ends of the winding is greater than the acceleration on both sides of the winding, and the vibration acceleration of the winding on both sides of the winding in the middle area is greater than the acceleration of the middle part of the winding. At the point where the winding acceleration is greatly affected by the inrush current, the acceleration content at each frequency is consistent with the distribution of the input inrush current, but the DC-component content in the middle region of the winding is larger and the second harmonic content is smaller. Compared with the effect of the inrush current on the winding, the vibration acceleration of the core is much smaller than that of the winding;
(2) In the process of vibration signal transmission, the vibration signal of the winding acts on the surface of the box through the insulating oil, and the acceleration of the box increases with time in the first cycle. The surface vibration signal of the box contains a large number of DC and 50 Hz and their frequency-doubling components. Among them, the difference between the DC component and the fundamental wave is about 20%, and the difference of the high-order harmonic content rate at different points is large. The content rate of 100 Hz and 150 Hz is more than 50%, and the high-order harmonic content rate is relatively small;
(3) In the first cycle, the vibration amplitude of the tubing increases gradually, and its fundamental component (50 Hz) reaches 7.01 m/s2. At the same time, it contains a large number of DC components and frequency doubling components of 50 Hz, among which the DC component content reaches 66.0%, and the second harmonic reaches 49.2%. When the vibration signal is transmitted to the gas relay along the tubing, if the natural frequency of the internal baffle of the gas relay is the same as the frequency of the vibration, the gas relay baffle will deflect and there is a risk of misoperation;
(4) The vibration trend of the pressure-relief valve is consistent with the vibration trend of the box, and the vibration amplitude gradually increases in the first cycle. The fundamental component (50 Hz) reaches 35.4 m/s2. At the same time, the vibration of the pressure-relief valve contains a large number of DC components and a frequency doubling component of 50 Hz. Among them, the DC component content reaches 83.6%, and the third harmonic content is about 26.0%. Similar to the gas relay, when the natural frequency of the pressure-release valve is the same as that of the pressure-release valve and exceeds a certain content, the pressure-release valve has the risk of misoperation;
(5) Under the action of the inrush current, the vibration acceleration of the grid-side bushing at the top of the converter transformer is greater than that of the valve-side bushing at the side. This is because the vibration amplitude of the top of the converter-transformer box is greater than that of the side. The main frequency of the casing vibration is 50 Hz, and the amplitudes at different points are 50.99 m/s2, 45.66 m/s2, 25.20 m/s2, 26.27 m/s2, 28.92 m/s2 and 26.33 m/s2, respectively. In addition to the main frequency, it contains a large number of DC components. The DC component of the vibration acceleration at different points contains about 80% of the main frequency content, and the acceleration contains a small amount of the 50 Hz frequency-doubling component.
Author Contributions
Conceptualization, J.L. and Z.Z.; methodology, J.D. and Z.P.; software, H.W.; validation, W.H.; formal analysis, W.H. and Y.Y.; investigation, W.H.; resources, J.L.; data curation, J.D.; writing—original draft preparation, J.L.; writing—review and editing, Z.Z., W.H. and Y.Y.; visualization, Z.P.; supervision, Z.Z., H.W. and H.Z.; project administration, J.L.; funding acquisition, J.L. All authors have read and agreed to the published version of the manuscript.
Funding
This paper is supported by the China Southern Power Grid Program: (CGYKTXM20220310).
Institutional Review Board Statement
Not applicable.
Informed Consent Statement
Not applicable.
Data Availability Statement
Data are contained within the article.
Conflicts of Interest
Authors Jinzhuang Lv, Jun Deng, Zhicheng Pan, Heng Wu and Haibin Zhou were employed by the company China Southern Power Grid. The remaining authors declare that the research was conducted in the absence of any commercial or financial relationships that could be construed as a potential conflict of interest. The authors declare that this study received funding from the China Southern Power Grid. The funder had the following involvement with the study: the selection of the topic, the revision of the article and the supervision of the article.
References
- Mahtani, K.; Granizo, R.; Guerrero, J.; Platero, C. Detection of faulty energizations in high voltage direct current power cables by analyzing leakage currents. Electronics 2024, 13, 4120. [Google Scholar] [CrossRef]
- Liu, J.; Zhao, B.; Xu, M. Analysis and handling of line protection maloperations caused by distribution network excitation inrush current. Power Energy 2024, 45, 450–454. [Google Scholar]
- Gao, L.; Zhao, J.; Zhang, M. Study on modeling of saturated transformer and analysis of excitation inrush current based on dynamic harmonic domain. Shanxi Electr. Power 2024, 60–66. [Google Scholar] [CrossRef]
- Huo, C.; Yang, Y. A review of research progress on residual magnetism detection methods for power transformer cores. IEEE Sens. J. 2024, 24, 7636–7645. [Google Scholar] [CrossRef]
- Zhao, X.; Lv, F. Improved phase selection closing strategy based on DC magnetizing circuit. High Volt. Appar. 2024, 60, 18–26. [Google Scholar] [CrossRef]
- Sanati, S.; Ahmadi, S.; Sanaye, P. An innovative harmonic-based approach for inrush current detection in low-loss transformers. IET Gener. Transm. Distrib. 2024, 18, 1303–1316. [Google Scholar] [CrossRef]
- Ren, Y.; Liu, C.; Wang, Y. Fast demagnetization method for power transformers combined with residual flux measurement. Int. J. Electr. Power Energy Syst. 2025, 164, 110431. [Google Scholar] [CrossRef]
- Zhao, S.; Xing, W. A neural network-based scheme for inrush current diagnosis of power transformer. In Proceedings of the 18th Annual Conference of China Electrotechnical Society, ACCES 2023, Nanchang, China, 15 September 2023. [Google Scholar] [CrossRef]
- Wang, C.; Ke, Y.; Shu, R.; Zhao, H.; Chen, Z. Research on electromagnetic and mechanical characteristics of typical high impedance transformers under excitation inrush current conditions. Mech. Electr. Eng. Technol. 2024, 53, 208–212. [Google Scholar] [CrossRef]
- Li, G.; Wang, J.; Tang, Q.; Zhang, Y.; Liu, S. Automatic identification method for excitation inrush current in power transformers based on wavelet theory. Electron. Des. Eng. 2024, 32, 31–35. [Google Scholar] [CrossRef]
- Li, F.; Dong, Y.; Han, Z.; Li, F. Fast Identification Scheme and Verification of Transformer Grounding Fault Inrush Current. Tech. Autom. Appl. 2025, 44, 124–126. [Google Scholar] [CrossRef]
- Xiao, P.; Zhang, H.; Du, Z.; Hao, Z.; Zhao, P.; Shen, X. Research on phase selection closing suppression method of exciting inrush current of UHV converter transformer. High Volt. Appar. 2023, 59, 146–153+162. [Google Scholar] [CrossRef]
- Liu, G. Research on the method of suppressing the excitation inrush current of ship transformer by port shore power. Electr. Tool 2024, 6–10+24. [Google Scholar] [CrossRef]
- Song, J. Research on the Mechanism and Suppression Strategy of Transformer Magnetizing Inrush Current. Master’s Thesis, Southwest University of Science and Technology, Mianyang, China, 2024. [Google Scholar] [CrossRef]
- Tarafdar-Hagh, M.; Muttaqi, K.; Taghizad-Tavana, K.; Nojavan, S.; Abdi, M. Application of Saturated Core Transformer as Inrush Current Limiter. SSRN 2024, 9, 100677. [Google Scholar] [CrossRef]
- Zhu, X. Research on Blind Source Separation of Vibration Signal and State Identification Method of Converter Transformer. Master’s Thesis, Shandong University, Jinan, China, 2023. [Google Scholar]
- Wang, Z. Transformer Iron-Core State Detection and Diagnosis Method Based on Vibration Signal. Master’s Thesis, North China Electric Power University, Beijing, China, 2022. [Google Scholar] [CrossRef]
- Wang, H. Research and Simulation Analysis on Vibration Characteristics of Iron Cores and Winding of Power Transformer. Master’s Thesis, Shenyang University of Technology, Shenyang, China, 2022. [Google Scholar] [CrossRef]
- Nitu, M.; Nicolae, L.; Dina, L.; Mircea, P. Power Transformer Inrush Current Analysis: Simulation, Measurement and Effects. Appl. Sci. 2024, 14, 10926. [Google Scholar] [CrossRef]
- Wu, W. Inrush Current Characteristics Analysis and Differential Protection Research of Converter Transformer in UHVDC Transmission System. Master’s Thesis, Northeast Electric Power University, Jilin, China, 2023. [Google Scholar]
- Jing, M. Research on Recognition Method of Transformer Magnetizing Inrush Current Based on EO Optimized ELM. Master’s Thesis, Xi’an University of Science and Technology, Xi’an, China, 2021. [Google Scholar] [CrossRef]
- Liu, S. Study on the Influence of Harmonic and DC Bias on the Vibration Characteristics of Converter Transformer. Master’s Thesis, Shandong University, Jinan, China, 2023. [Google Scholar]
- Lv, J.; Zhang, Z.; Deng, J.; Pan, Z.; Wu, H.; He, W. Study on vibration and oil flow characteristics of gas relay in converter transformer caused by inrush current. Adv. Technol. Electr. Eng. Energy 2024, 43, 46–55. [Google Scholar] [CrossRef]
- Xie, J. Analysis of Multi-Physical Vibration Mechanism and Characteristics of Oil-Immersed Transformer. Master’s Thesis, North China Electric Power University, Beijing, China, 2023. [Google Scholar] [CrossRef]
- Xiao, R. Research on State Recognition Method of Converter Transformer Based on Vibration Signal. Master’s Thesis, Chongqing University, Chongqing, China, 2022. [Google Scholar] [CrossRef]
- Peng, W. Research on Magnetizing Inrush Current Characteristics and Identification Method of Converter Transformer. Master’s Thesis, Tianjin University, Tianjin, China, 2022. [Google Scholar] [CrossRef]
Figure 1.
Single-phase converter transformer no-load closing circuit diagram.
Figure 1.
Single-phase converter transformer no-load closing circuit diagram.
Figure 2.
Electromagnetic simulation circuit diagram of the actual converter station.
Figure 2.
Electromagnetic simulation circuit diagram of the actual converter station.
Figure 3.
Transmission process of vibration signal.
Figure 3.
Transmission process of vibration signal.
Figure 4.
Equivalent model of winding axial vibration.
Figure 4.
Equivalent model of winding axial vibration.
Figure 5.
Inrush current waveform under 0° remanent magnetization of 0.8 p.u. at closing angle.
Figure 5.
Inrush current waveform under 0° remanent magnetization of 0.8 p.u. at closing angle.
Figure 6.
Converter-transformer simulation geometry model.
Figure 6.
Converter-transformer simulation geometry model.
Figure 7.
Forward view of simulation geometric model of converter transformer.
Figure 7.
Forward view of simulation geometric model of converter transformer.
Figure 8.
Excitation curve of converter transformer.
Figure 8.
Excitation curve of converter transformer.
Figure 9.
Converter-transformer vibration simulation test flow.
Figure 9.
Converter-transformer vibration simulation test flow.
Figure 10.
Construction of converter-transformer vibration-test platform.
Figure 10.
Construction of converter-transformer vibration-test platform.
Figure 11.
Converter-transformer vibration-test process.
Figure 11.
Converter-transformer vibration-test process.
Figure 12.
Vibration-measurement-point distribution of converter transformer.
Figure 12.
Vibration-measurement-point distribution of converter transformer.
Figure 13.
Vibration distribution of converter-transformer windings.
Figure 13.
Vibration distribution of converter-transformer windings.
Figure 14.
Converter-transformer winding measurement-point distribution.
Figure 14.
Converter-transformer winding measurement-point distribution.
Figure 15.
Vibration–frequency distribution of converter-transformer windings.
Figure 15.
Vibration–frequency distribution of converter-transformer windings.
Figure 16.
Vibration distribution of converter-transformer core.
Figure 16.
Vibration distribution of converter-transformer core.
Figure 17.
Vibration distribution of converter-transformer housing.
Figure 17.
Vibration distribution of converter-transformer housing.
Figure 18.
Converter-transformer housing measuring-point distribution.
Figure 18.
Converter-transformer housing measuring-point distribution.
Figure 19.
Converter-transformer housing vibration–frequency distribution.
Figure 19.
Converter-transformer housing vibration–frequency distribution.
Figure 20.
Converter-transformer tubing vibration distribution.
Figure 20.
Converter-transformer tubing vibration distribution.
Figure 21.
Vibration–frequency distribution at gas relay of converter transformer.
Figure 21.
Vibration–frequency distribution at gas relay of converter transformer.
Figure 22.
Converter-transformer pressure-relief-valve vibration distribution.
Figure 22.
Converter-transformer pressure-relief-valve vibration distribution.
Figure 23.
Converter-transformer pressure-relief-valve vibration–frequency distribution.
Figure 23.
Converter-transformer pressure-relief-valve vibration–frequency distribution.
Figure 24.
Vibration distribution of converter-transformer bushing.
Figure 24.
Vibration distribution of converter-transformer bushing.
Figure 25.
Vibration–frequency distribution of converter transformer bushing.
Figure 25.
Vibration–frequency distribution of converter transformer bushing.
Table 1.
Electromagnetic simulation parameter settings.
Table 1.
Electromagnetic simulation parameter settings.
| Parameter | Value |
|---|
| Converter transformer capacity | 237.4 MVA |
| Frequency | 50 Hz |
| Grid side/valve side voltage | 303.12 kV/93.07 kV |
| Hollow reactance | 0.2 p.u. |
| Magnetizing current | 0.084% |
| Leakage reactance | 0.16 p.u. |
Table 2.
Current components under different working conditions.
Table 2.
Current components under different working conditions.
| Harmonic | Mode 1 | Mode 2 | Mode 3 | Mode 4 | Mode 5 | Mode 6 |
|---|
| fundamental wave | 3.280 | 1.776 | 2.986 | 1.455 | 2.106 | 0.622 |
| DC component | 2.285 | 1.065 | 2.011 | 0.849 | 1.300 | 0.337 |
| 2nd harmonic | 0.926 | 0.963 | 0.990 | 0.876 | 1.018 | 0.482 |
| 3rd harmonics | 0.232 | 0.212 | 0.158 | 0.285 | 0.117 | 0.301 |
| 4th harmonic | 0.101 | 0.131 | 0.155 | 0.060 | 0.180 | 0.131 |
| 5th harmonic | 0.103 | 0.105 | 0.081 | 0.116 | 0.064 | 0.011 |
| 6th harmonic | 0.025 | 0.021 | 0.042 | 0.029 | 0.063 | 0.043 |
| 7th harmonic | 0.013 | 0.056 | 0.046 | 0.042 | 0.040 | 0.045 |
| 8th harmonic | 0.015 | 0.008 | 0.015 | 0.036 | 0.026 | 0.020 |
| 9th harmonic | 0.017 | 0.029 | 0.026 | 0.006 | 0.027 | 0.006 |
| 10th harmonic | 0.014 | 0.015 | 0.010 | 0.024 | 0.010 | 0.018 |
Table 3.
Current content under different working conditions (%).
Table 3.
Current content under different working conditions (%).
| Harmonic | Mode 1 | Mode 2 | Mode 3 | Mode 4 | Mode 5 | Mode 6 |
|---|
| DC component | 69.7 | 60.0 | 67.3 | 58.4 | 61.7 | 54.2 |
| 2nd harmonic | 28.2 | 54.2 | 33.2 | 60.2 | 48.3 | 77.5 |
| 3rd harmonics | 7.1 | 11.9 | 5.3 | 19.6 | 5.6 | 48.4 |
| 4th harmonic | 3.1 | 7.4 | 5.2 | 4.1 | 8.5 | 21.1 |
| 5th harmonic | 3.1 | 5.9 | 2.7 | 8.0 | 3.0 | 1.8 |
| 6th harmonic | 0.8 | 1.2 | 1.4 | 2.0 | 3.0 | 6.8 |
| 7th harmonic | 0.4 | 3.2 | 1.5 | 2.9 | 1.9 | 7.2 |
| 8th harmonic | 0.5 | 0.5 | 0.5 | 2.5 | 1.2 | 3.2 |
| 9th harmonic | 0.5 | 1.6 | 0.8 | 0.4 | 1.3 | 1.0 |
| 10th harmonic | 0.4 | 0.8 | 0.3 | 1.6 | 0.5 | 2.9 |
Table 4.
Converter-transformer modeling parameter table.
Table 4.
Converter-transformer modeling parameter table.
| Parameter | Value |
|---|
| Dimension of converter core | L × W × H: 8 m × 1.6 m × 4 m |
| Height of net side winding | 2040 mm |
| Height of valve side winding | 1880 mm |
| Inner/outer diameter of mesh side winding | 1896 mm/2156 mm |
| Inner/outer diameter of valve side winding | 2556 mm/2856 mm |
| Number of turns of mesh/valve side winding | 533 mm/171 mm |
Table 5.
Vibration-experiment and simulation results.
Table 5.
Vibration-experiment and simulation results.
| Measuring Point | Measured Vibration | Model Vibration | Deviation |
|---|
| 1 | 1.31 m·s−2 | 1.41 m·s−2 | 7.6% |
| 2 | 1.12 m·s−2 | 1.18 m·s−2 | 5.4% |
| 3 | 4.80 m·s−2 | 4.92 m·s−2 | 2.5% |
| 4 | 2.67 m·s−2 | 2.48 m·s−2 | 7.1% |
| 5 | 2.00 m·s−2 | 1.95 m·s−2 | 2.5% |
| 6 | 2.41 m·s−2 | 2.23 m·s−2 | 7.4% |
| Disclaimer/Publisher’s Note: The statements, opinions and data contained in all publications are solely those of the individual author(s) and contributor(s) and not of MDPI and/or the editor(s). MDPI and/or the editor(s) disclaim responsibility for any injury to people or property resulting from any ideas, methods, instructions or products referred to in the content. |
© 2025 by the authors. Licensee MDPI, Basel, Switzerland. This article is an open access article distributed under the terms and conditions of the Creative Commons Attribution (CC BY) license (https://creativecommons.org/licenses/by/4.0/).


 ,
, 


