Article

Remaining Useful Life Prediction of Rolling Bearings Based on an Improved U-Net and a Multi-Dimensional Hybrid Gated Attention Mechanism

School of Mechatronics Engineering, Henan University of Science and Technology, Luoyang 471023, China
*
Author to whom correspondence should be addressed.
Appl. Sci. 2025, 15(13), 7166; https://doi.org/10.3390/app15137166 (registering DOI)
Submission received: 23 May 2025 / Revised: 23 June 2025 / Accepted: 24 June 2025 / Published: 25 June 2025

Abstract

In practical scenarios, rolling bearing vibration signals suffer from detail loss, and information loss occurs during feature dimensionality reduction and fusion, leading to inaccurate life prediction results. To address these issues, this paper first proposes a method for predicting the remaining useful life (RUL) of bearings, which combines an improved U-Net for enhancing vibration signals and a multi-dimensional hybrid gated attention mechanism (MHGAM) for dynamic feature fusion. The enhanced U-Net effectively suppresses the loss of signal details, while the MHGAM adaptively constructs health indices through multi-dimensional weighting, significantly improving prediction accuracy. Initially, the improved U-Net is utilized for signal preprocessing. By comprehensively considering both channel and spatial dimensions, the MHGAM dynamically assigns fusion weights across different dimensions to construct a health index. Subsequently, the health index is used as input for the Bi-GRU network model to obtain the remaining life prediction results. Finally, comparative analyses between the proposed method and other RUL prediction methods are conducted using the IEEE PHM 2012 bearing dataset (Condition 1: rotational speed 1800 r/min with radial load 4000 N; Condition 2: rotational speed 1650 r/min with radial load 4200 N) and engineering test data (rotational speed 1800 r/min with radial load 4000 N). Experimental results from the IEEE PHM 2012 bearing dataset indicate that this method achieves a low mean root mean square error (RMSE = 0.0504) and mean absolute error (MAE = 0.0239). The engineering test verification results demonstrate that the mean values of RMSE and MAE for this method are 7.8% lower than those of the CNN-BiGRU benchmark model and 14.6% lower than those of the TCN-BiGRU model, respectively. In terms of comprehensive prediction performance scores, the average scores improve by 7.8% and 9.3 percentage points compared with the two benchmark models, respectively. Under various test conditions, the prediction results of this method exhibit commendable comprehensive performance, significantly enhancing the prediction accuracy of bearing remaining useful life.

1. Introduction

With the advancement of technology, modern mechanical equipment is evolving towards high-reliability and intelligent systems. Bearings, as critical rotating components in mechanical systems, are extensively employed in aerospace applications, heavy machinery, and precision instrumentation. The accurate prediction of bearing remaining useful life (RUL) plays a vital role in industrial applications, effectively mitigating potential catastrophic failures caused by bearing degradation while significantly enhancing system reliability and operational availability [1,2].
Common methods for predicting RUL include probability–statistical approaches and data-driven methods [3]. With advancements in sensor technology and data acquisition capabilities, data-driven RUL prediction methods have become notably more accurate. These methods can automatically infer hidden causal relationships within data, directly extract degradation features from complex systems, effectively process large volumes of monitoring data, and deliver precise RUL predictions [4,5].
Current data-driven prognostic methodologies typically implement vibration signal denoising processing, followed by multi-domain time–frequency feature extraction from the processed signals. Dimensionality reduction algorithms are subsequently employed to fuse heterogeneous features into a unified health index (HI), which is then utilized in prognostic models for estimating RUL [6]. Luo et al. [7] proposed a time-series analytics framework that incorporates multi-scale feature extraction with path-weight selection mechanisms. Sun′s team [8] employed convolutional block attention modules (CBAMs) to dynamically allocate attention weights to degradation-sensitive features. Li et al. [9] adopted a hybrid architecture that combines long short-term memory (LSTM) networks with Bray–Curtis dissimilarity metrics to quantify mutual information between raw and reconstructed degradation trajectories. Gao′s methodology [10] integrated multi-scale degradation characterization with CNN-GRU hybrid networks for bearing RUL prediction. Yao et al. [11] introduced attention-enhanced gated recurrent units (GRUs) to achieve cross-type bearing lifespan prognostics. Qiao′s group [12] developed a modified inverted Transformer architecture with dynamic weighted attention mechanisms to enhance model robustness. Conversely, Mao′s approach [13] focused on temporal dependency modeling through recursive operations but exhibited limitations in capturing spatial features.
Effective signal processing and the optimal utilization of monitoring data are critical determinants for achieving accurate predictions of bearing RUL. Conventional signal processing techniques often induce edge blurring and detail smoothing through linear filtering operations, resulting in an irreversible loss of degradation-sensitive information components. This fundamental limitation hinders a comprehensive characterization of bearing degradation states based on measured vibration data. Furthermore, prevailing feature fusion and dimensionality reduction algorithms inevitably incur information dissipation during the mapping from high-dimensional to low-dimensional feature spaces. Given the heterogeneous information content across different feature modalities, current methodologies exhibit insufficient capability in synergistically integrating multi-source degradation signatures to achieve optimal prognostic performance.
To address the aforementioned issues, this paper proposes a method for predicting the RUL of rolling bearings based on an improved U-Net model, a multi-dimensional hybrid gated attention mechanism, and a Bi-GRU. Initially, the improved U-Net model is employed to preprocess time–frequency domain signals. Subsequently, a multi-dimensional hybrid gated attention mechanism is introduced, which simultaneously considers both channel global information and spatial information. By utilizing a parallel network cyclic structure, this mechanism adaptively and dynamically assigns varying weights for feature fusion, thereby constructing a health index (HI) that encompasses a more comprehensive representation of degradation features. Finally, the constructed health index is input into the Bi-GRU model to derive the final RUL prediction results.

2. Introduction to Related Methods

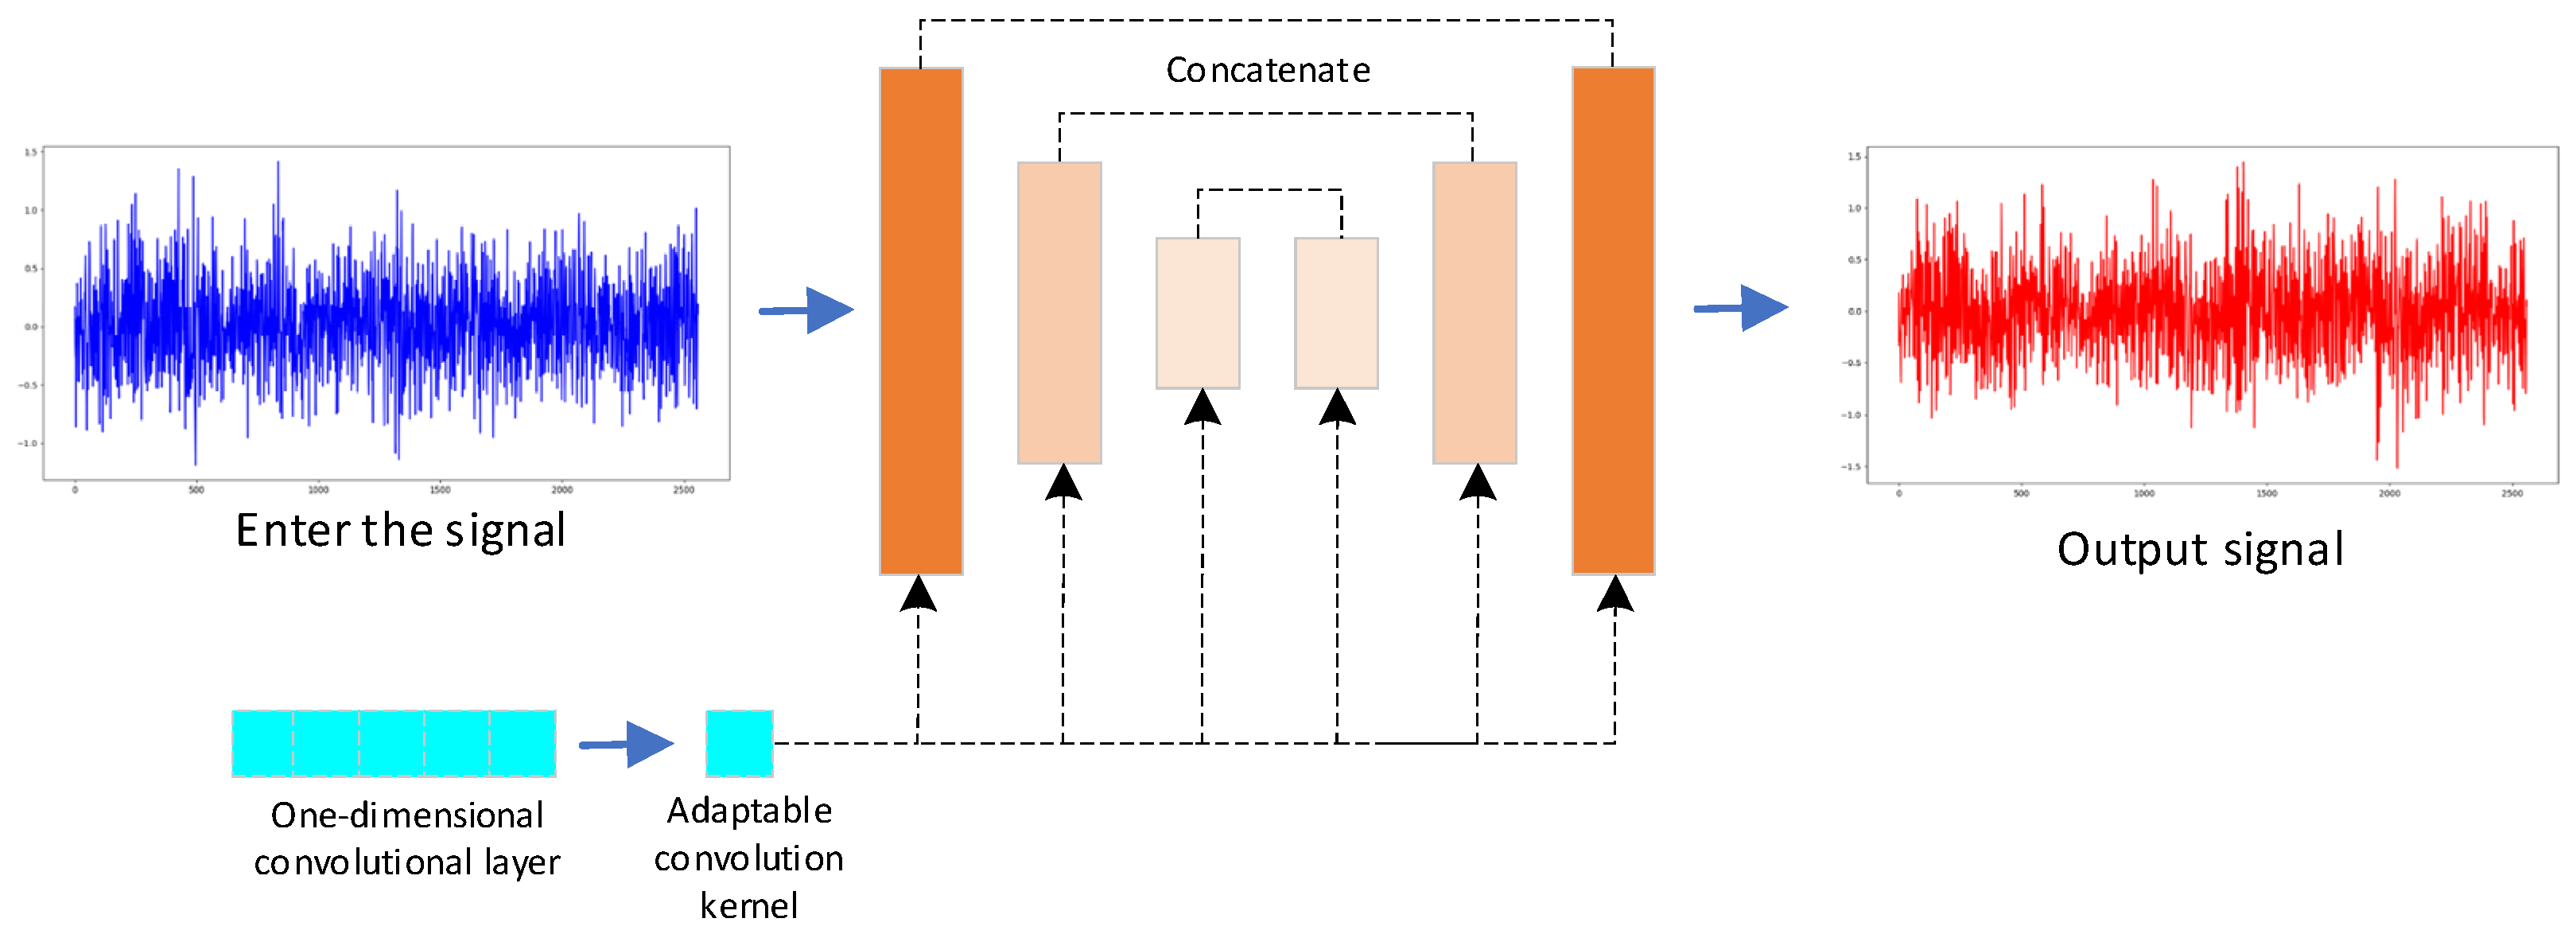
2.1. Improved U-Net Model

The U-Net is a widely utilized deep learning model for image segmentation [14]. This architecture comprises a symmetric encoder (compression path) and a decoder (expansion path). It effectively captures rich contextual information through the establishment of cross-level connections. This distinctive structure allows the U-Net to excel in managing detailed information while preserving global contextual features.
The encoder comprises multiple residual modules that gradually downsample the input signal while extracting relevant features [15]. Through successive convolutional and pooling layers, it captures local feature information, such as changes in the time–frequency-domain signal, during the continuous downsampling process. The feature maps generated in the encoder are linked to the decoder via a skip residual connection structure, allowing for the reconstruction of the extracted signals through upsampling, which aids in preserving the detailed information of the signal. The noise component of the original signal is eliminated through interpolation calculations, resulting in an approximate restoration of the original time–frequency-domain signal.
In this paper, the two-dimensional convolutional layers of the U-Net are restructured as one-dimensional convolutional layers. Additionally, adaptive convolution kernels are introduced to dynamically adjust the size of the convolution kernel based on the characteristics of the signal. This approach allows the model to employ distinct processing strategies for various frequency bands of the signal, thereby enhancing the quality of the generated output. Figure 1 shows the structural diagram of the improved U-Net model.

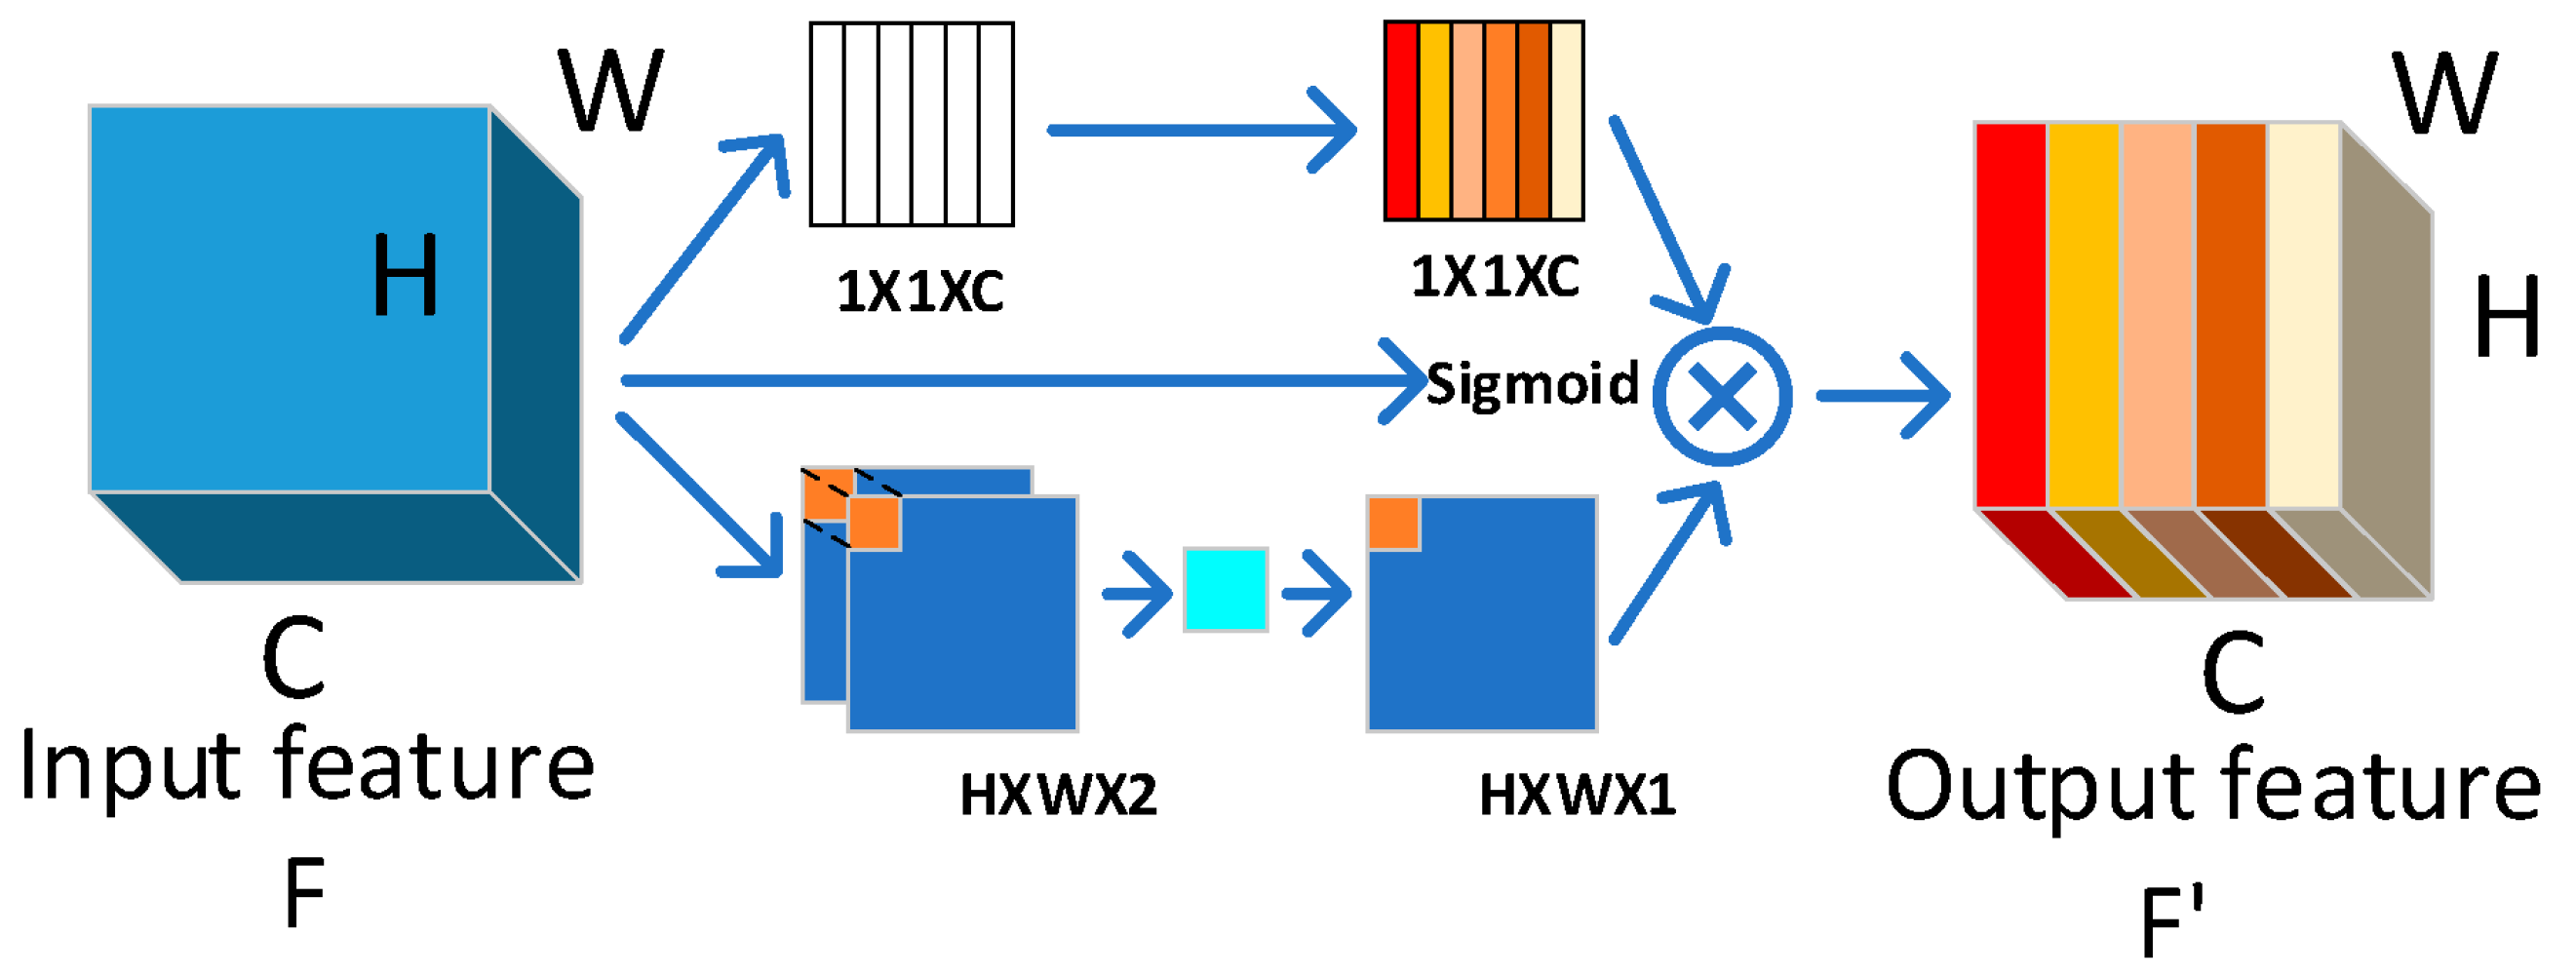
2.2. Multi-Dimensional Hybrid Gated Attention Mechanism

The Squeeze-and-Excitation (SE) attention mechanism aims to assign a weight to each channel of the input sequence, reflecting the importance of that channel [16]. By learning the interactions between channels, it allocates varying weight ratios to different channels within the dimensional space. Spatial gated attention serves as a dynamic selection mechanism that generates a feature channel weight matrix, enhancing responses in critical regions. The multi-dimensional hybrid gated attention mechanism achieves feature fusion by constructing a cyclic structure of spatial-channel parallel networks and dynamically adjusting weights across dimensions. The model structure diagram is shown in Figure 2. The calculation process is as follows:
Step 1: For the input feature map F R C × H × W (where C is the number of channels, C = 6, and H × W denotes the spatial dimensions, H × W = 64 × 1 = 64), first compress the input feature into a vector via global average pooling, as shown in Equation (1):
Z = F sq ( U c ) = 1 H × W i = 1 H j = 1 W F c ( i ,   j )
Step 2: Employ a spatial attention gating mechanism to dynamically generate a spatial attention weight matrix A R 1 × H × W , as shown in Equation (2):
A = σ f c o n v F max ;   F a v g
where F max R 1 × H × W represents the result of max pooling along the channel dimension, F a v g R 1 × H × W represents the result of average pooling along the channel dimension, f c o n v denotes a convolutional layer, and σ denotes the Sigmoid activation function. Dynamic weight allocation involves assessing the stability of feature channels, such as by calculating the standard deviation, and subsequently assigning varying weights to different channels. This approach enhances the model′s ability to focus on the most informative features while mitigating the influence of less stable channels.
Step 3: Using two Sigmoid fully connected layers W 1 and W 2 , map it to a smaller vector to generate channel dimension weights, and multiply it by the spatial attention weight matrix to generate multi-dimensional channel weight information s : s = R 1 × C × C , as shown in Equation (3):
s = σ ( W 2 δ ( W 1 Z ) ) × A
Step 4: Apply an activation function to compress each element of this vector into the range of 0 to 1 based on the weight information, and multiply it by the original input features to obtain the weighted output features F , where the output range of F is [0, 1], as shown in Equation (4):
F o u t = F × s

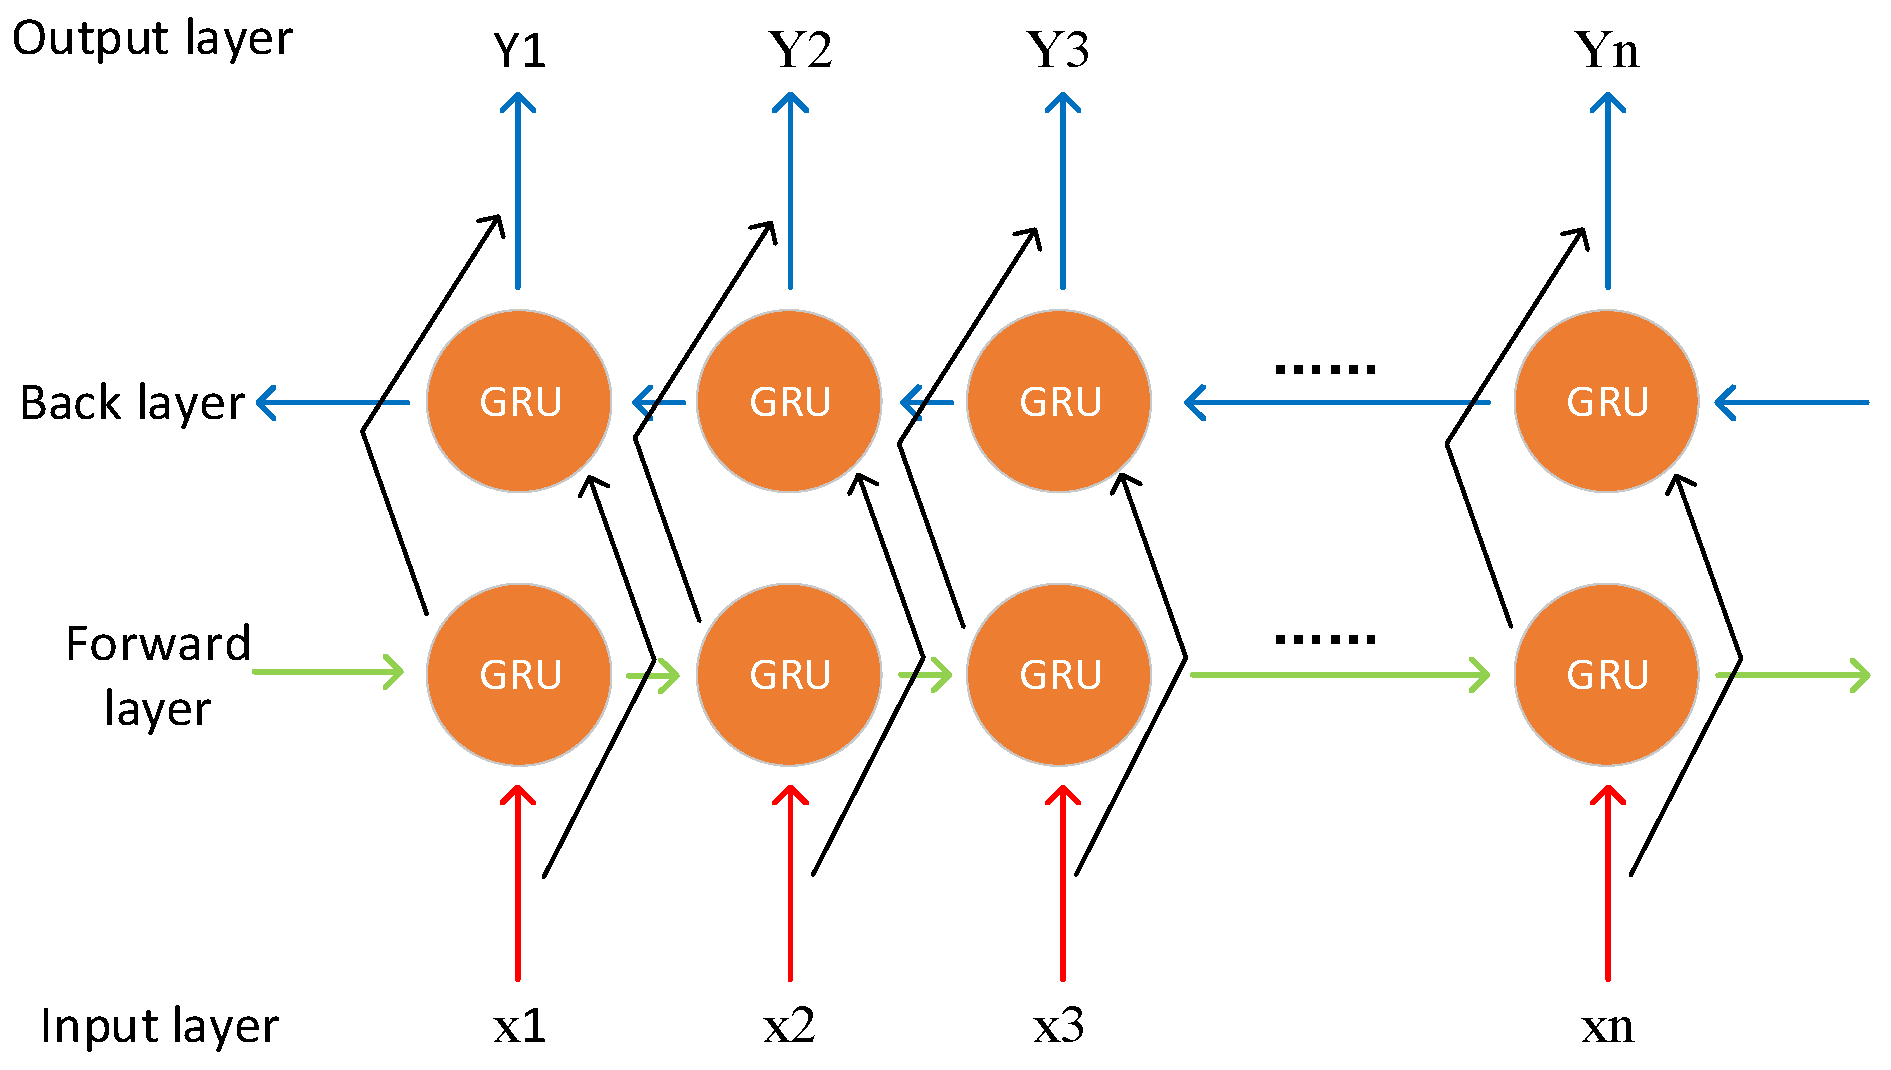
2.3. Bidirectional Gated Recurrent Unit (Bi-GRU)

The Bi-GRU network comprises two opposing Gated Recurrent Units (GRUs) [17], facilitating both forward and backward propagation to simultaneously harness historical and future information from the data. By collecting vibration signals from bearings for life prediction, the results are associated with historical feature information and the overall trend of changes. The Bi-GRU model effectively captures long-term dependencies, thereby enabling more precise predictions of the bearing′s RUL. A schematic diagram of the Bi-GRU model structure is shown in Figure 3.
The calculation formula for the update gate of the Gated Recurrent Unit (GRU) is as follows:
  • The input Xn at time step n is concatenated with the hidden state hn−1 from the previous time step n − 1, followed by a linear transformation. The result is then passed through a sigmoid function to output values within the fixed range of 0 to 1.
    Z n = σ ( W n ( h t - 1 , x ( n ) ) )
    where Xn is the input, Yn is the output, Wn represents learnable parameters, σ denotes the sigmoid activation function, Zn stands for the update gate, and ht−1 represents the hidden information from the previous time step.
2.
The reset gate primarily determines how much historical information should be forgotten.
r n = σ ( W r ( h t - 1 , x ( n ) ) )
where rn is the reset gate and Wr is the parameter matrix of the reset gate.
3.
The reset gate is multiplied by the hidden state output Yn−1 from the previous time step n − 1. This product determines how much of the information from the previous step is retained. The result is then passed through the tanh activation function to produce the new output Yn.
b n = tan ( W t r n × h t - 1 , x n )
where Wt is a trainable weight matrix.
4.
The gate value output by the update gate (1 − Zn) is multiplied by the hidden state output from the previous time step (n − 1) to determine the information to be retained. Finally, the result is added to obtain the final hidden state output Yn.
Y n = ( 1 Z n ) Y n 1 + Z n b n
The mathematical expressions for the BiGRU network architecture are as follows:
Y n = G R U ( x n , Y n 1 )
where Y n denotes forward propagation and Y n denotes backward propagation.

3. Rolling Bearing Remaining Useful Life (RUL) Prediction Method

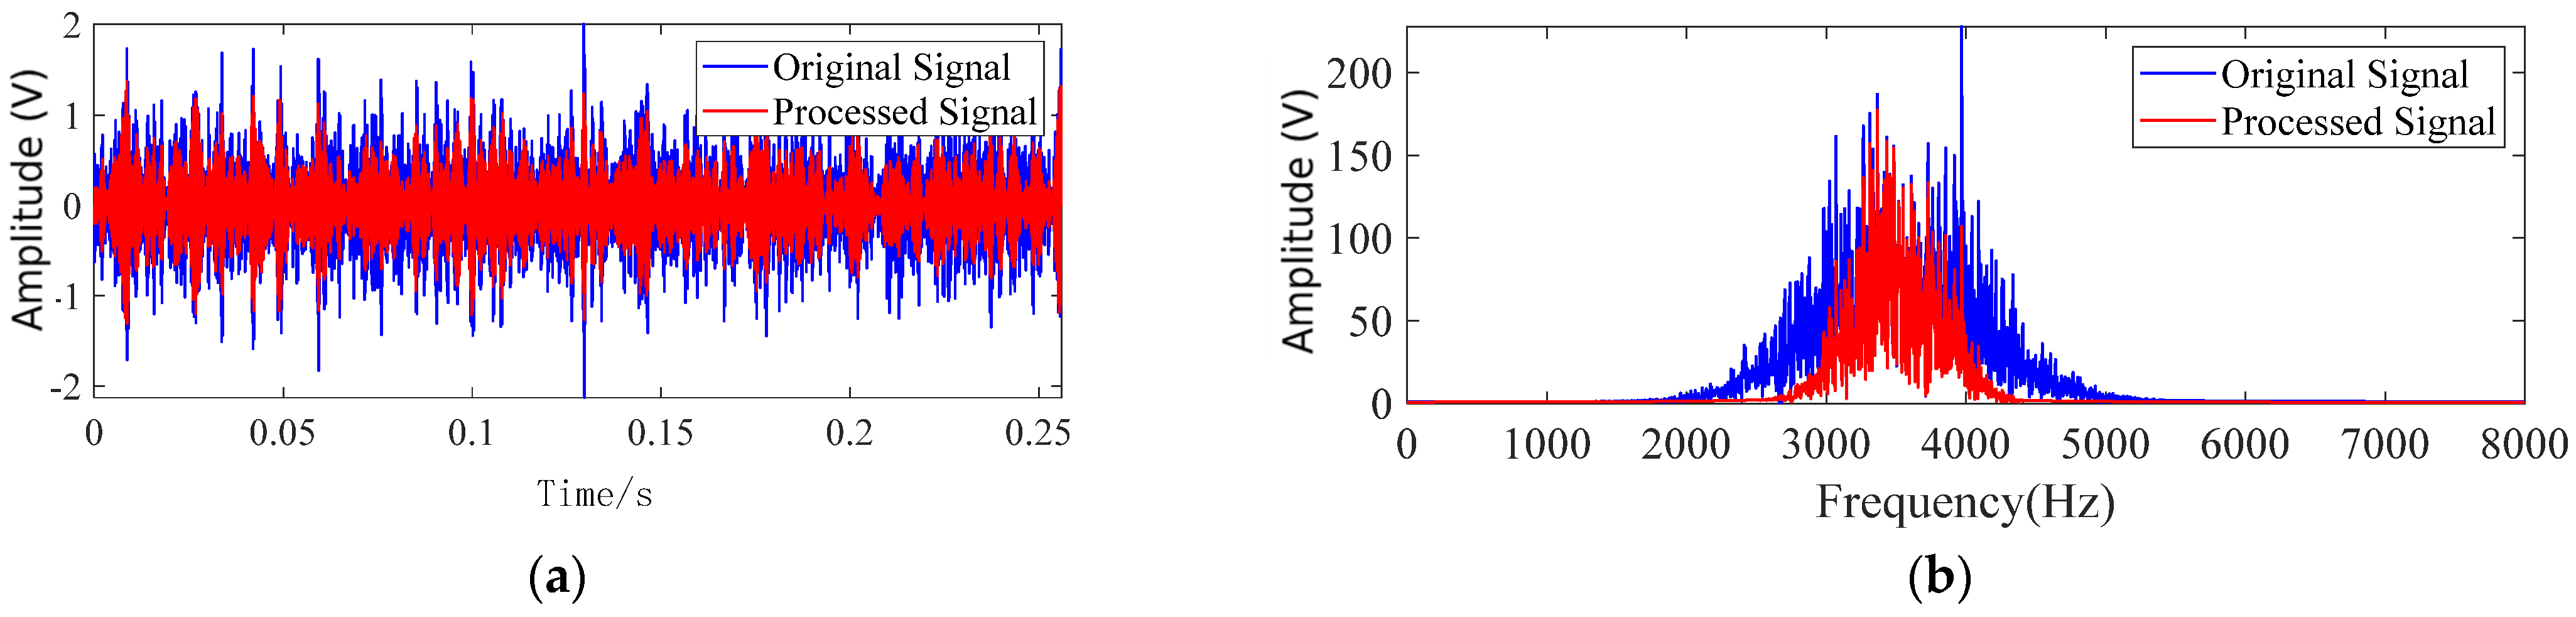
3.1. Signal Preprocessing

For rolling bearing vibration signals, an enhanced IU-Net model is employed to perform noise reduction on their time–frequency-domain signals. Initially, the time-domain signals undergo Fourier transform to generate frequency-domain signals, which are subsequently processed by the signal processing model. In this enhanced model, the standard U-Net′s 2D convolutions and pooling operations are replaced with their 1D counterparts. An end-to-end learning framework is utilized, wherein the encoder module extracts multi-scale signal features through downsampling. Each layer comprises two dilated convolutional kernels and ReLU activation functions, effectively expanding the receptive field to capture long-range dependencies. The decoder employs deconvolution and concatenation techniques to restore approximate representations of edge details through interpolation, thereby accomplishing effective signal preprocessing. A set of data is selected from the full-life data signals and processed using the method described in this paper. The specific processing results are shown in Figure 4.

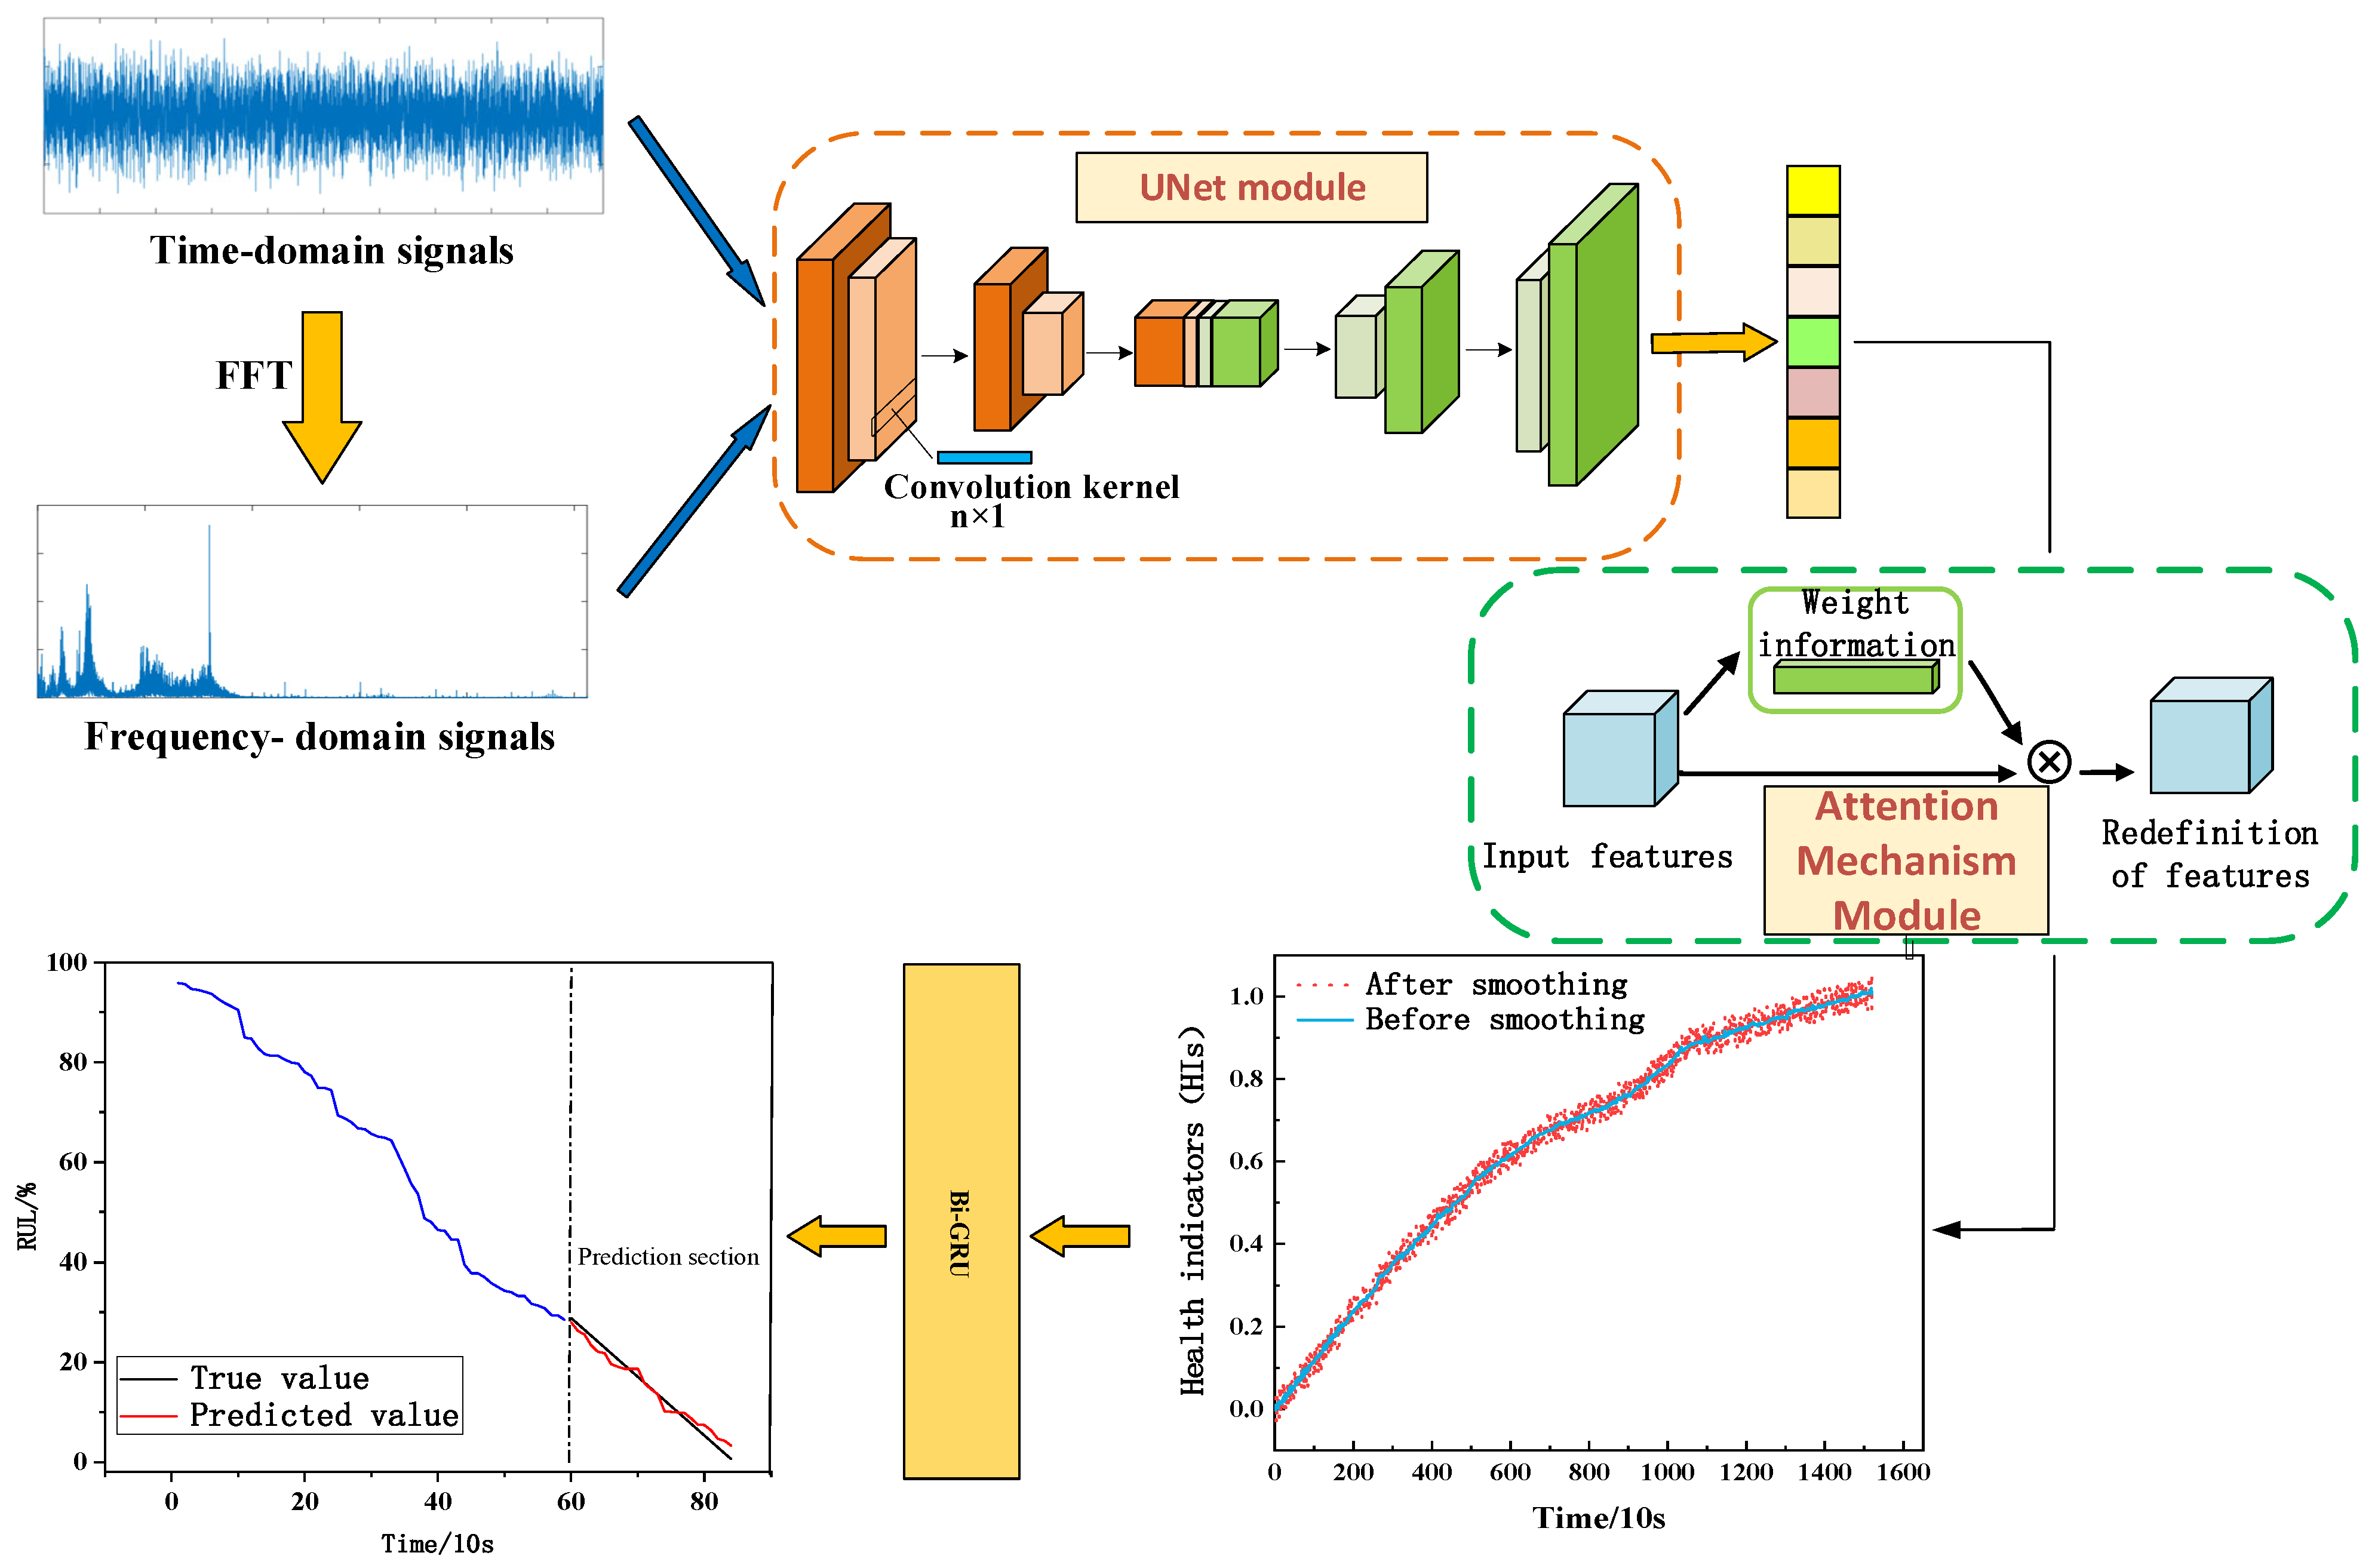
3.2. Overall Method Process

The bearing RUL prediction process proposed in this paper is shown in the figure, and its specific process is shown in Figure 5.
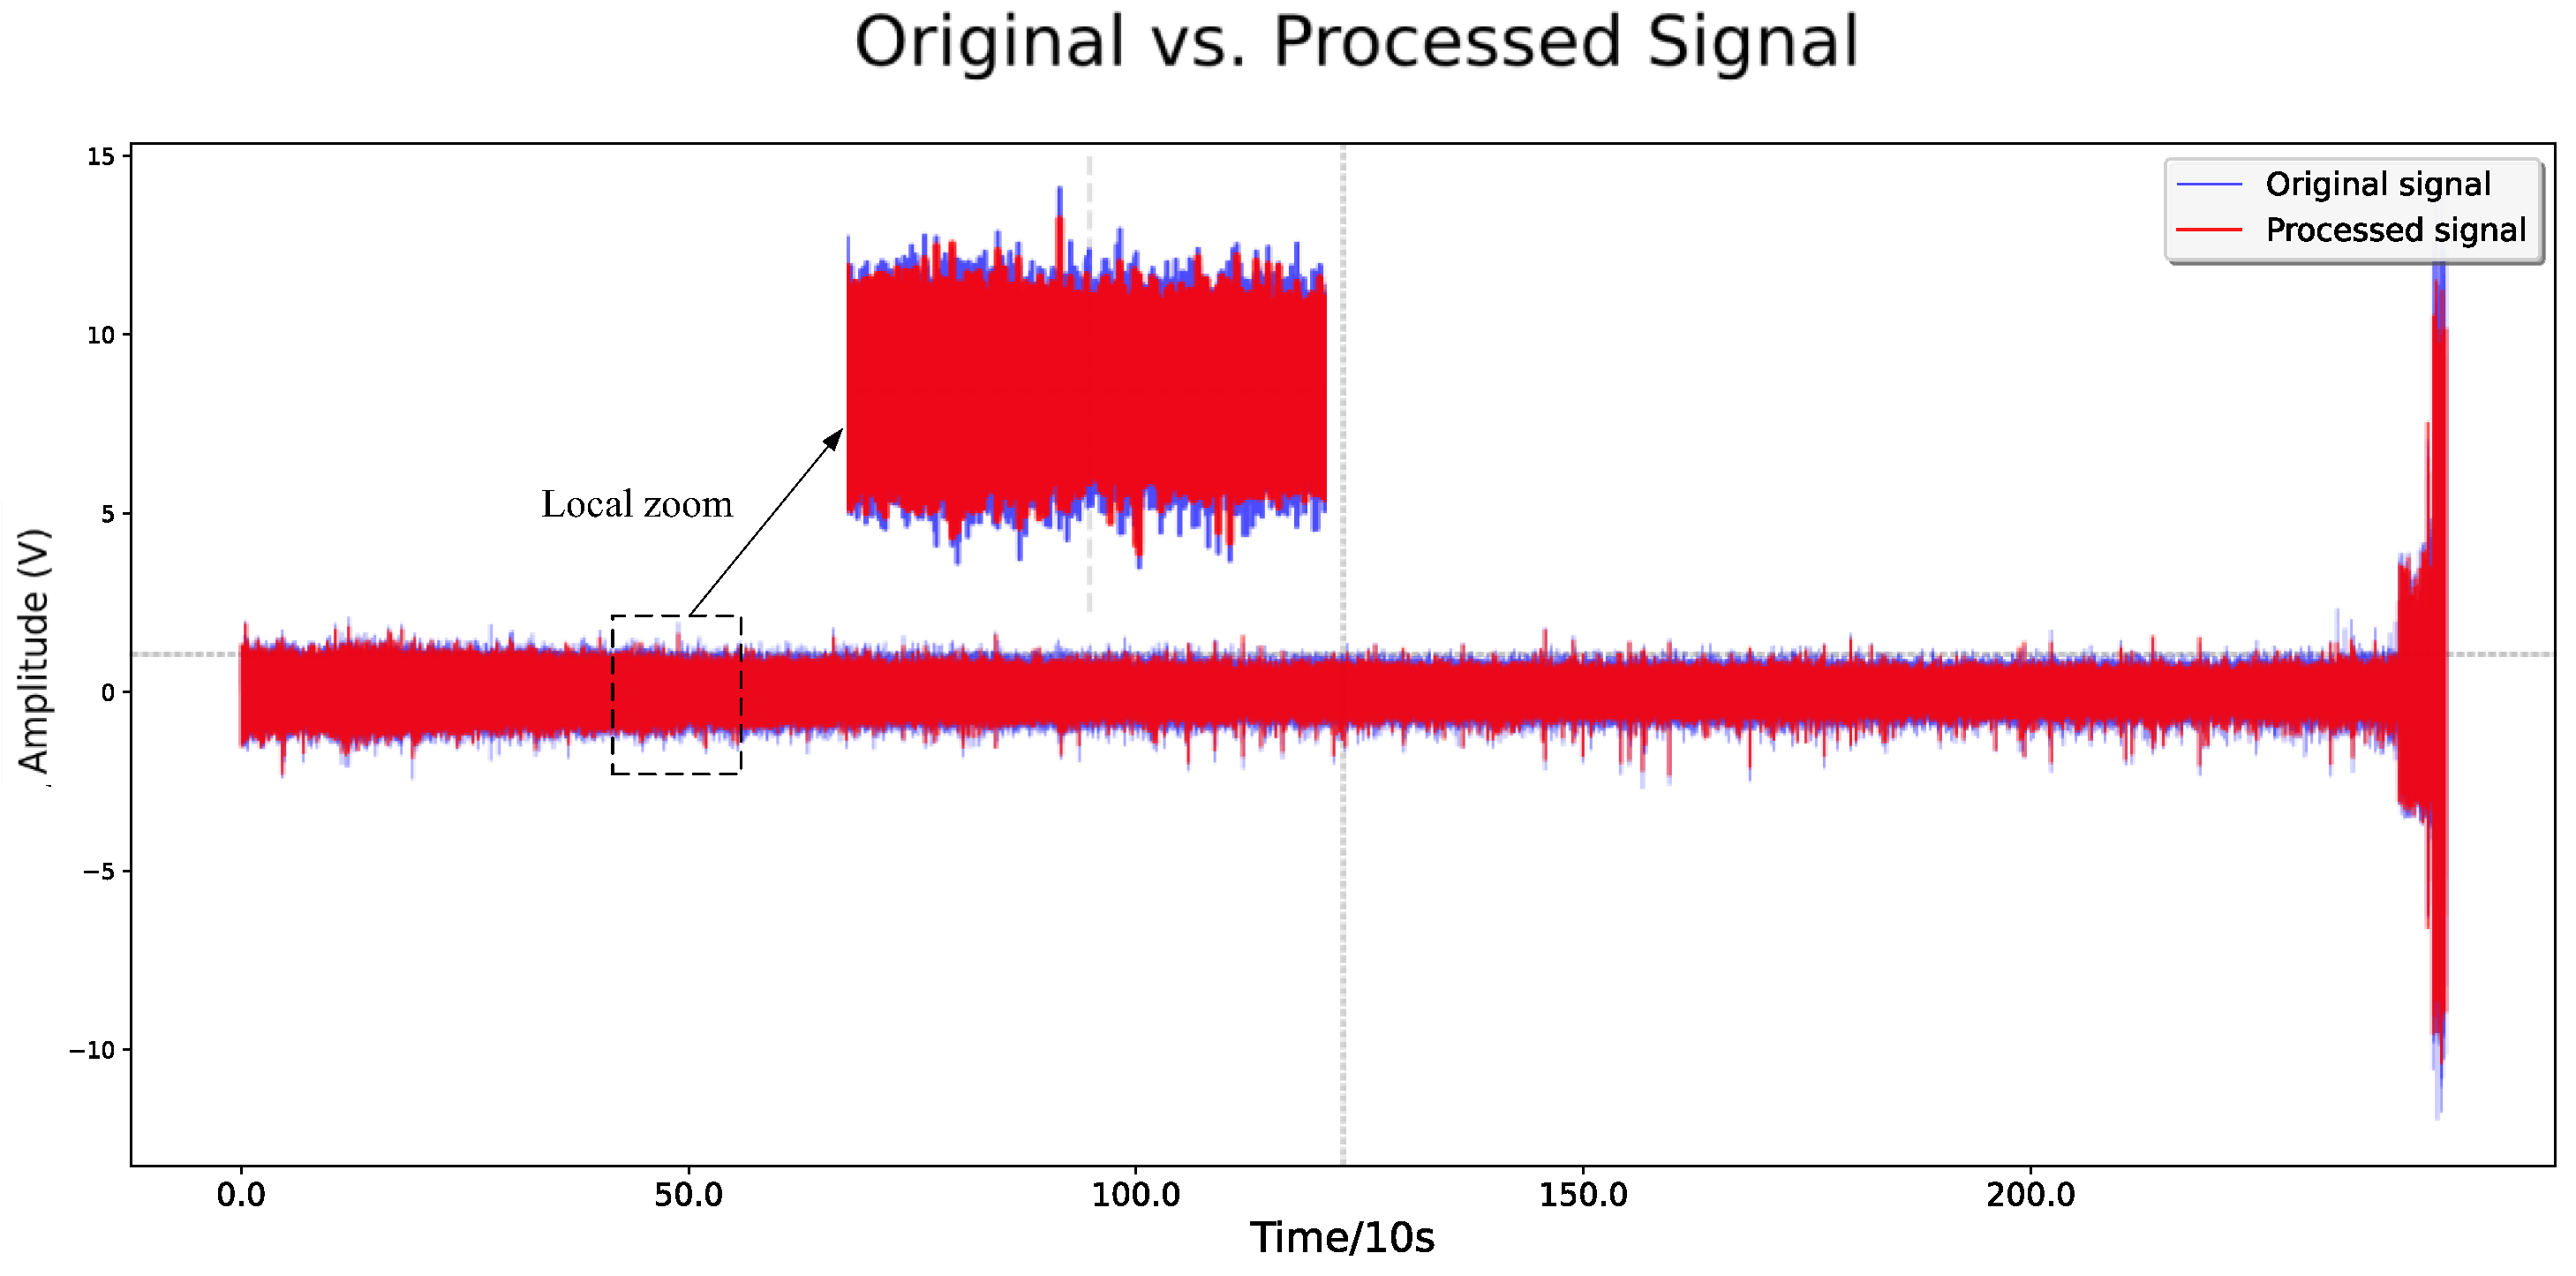
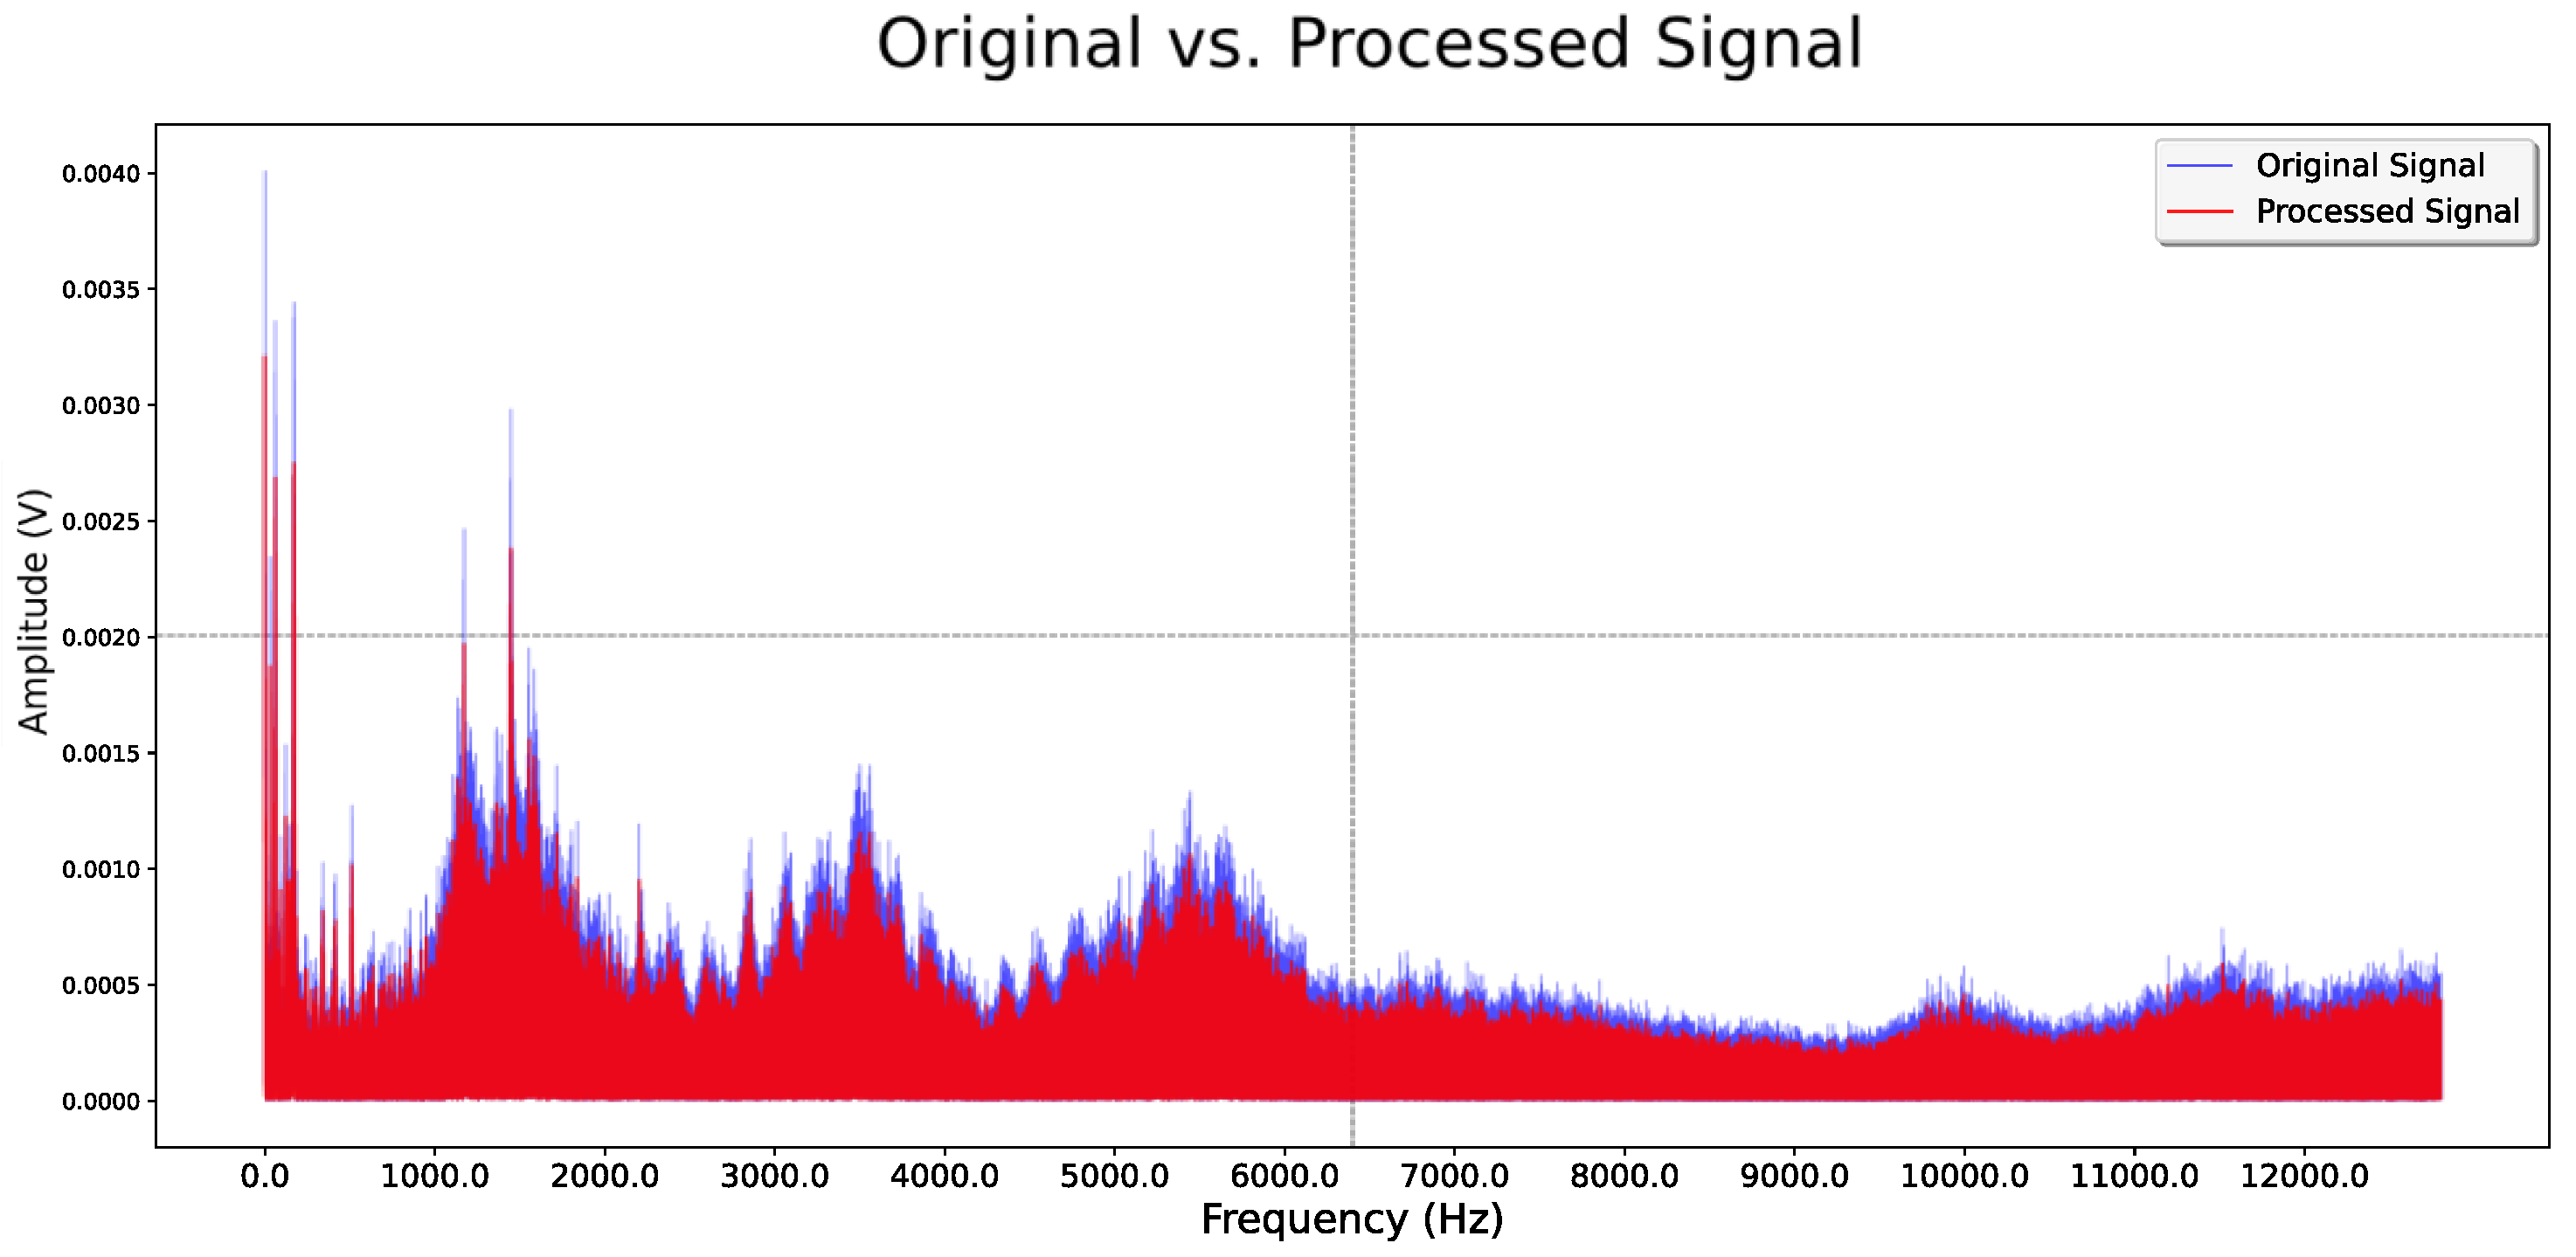
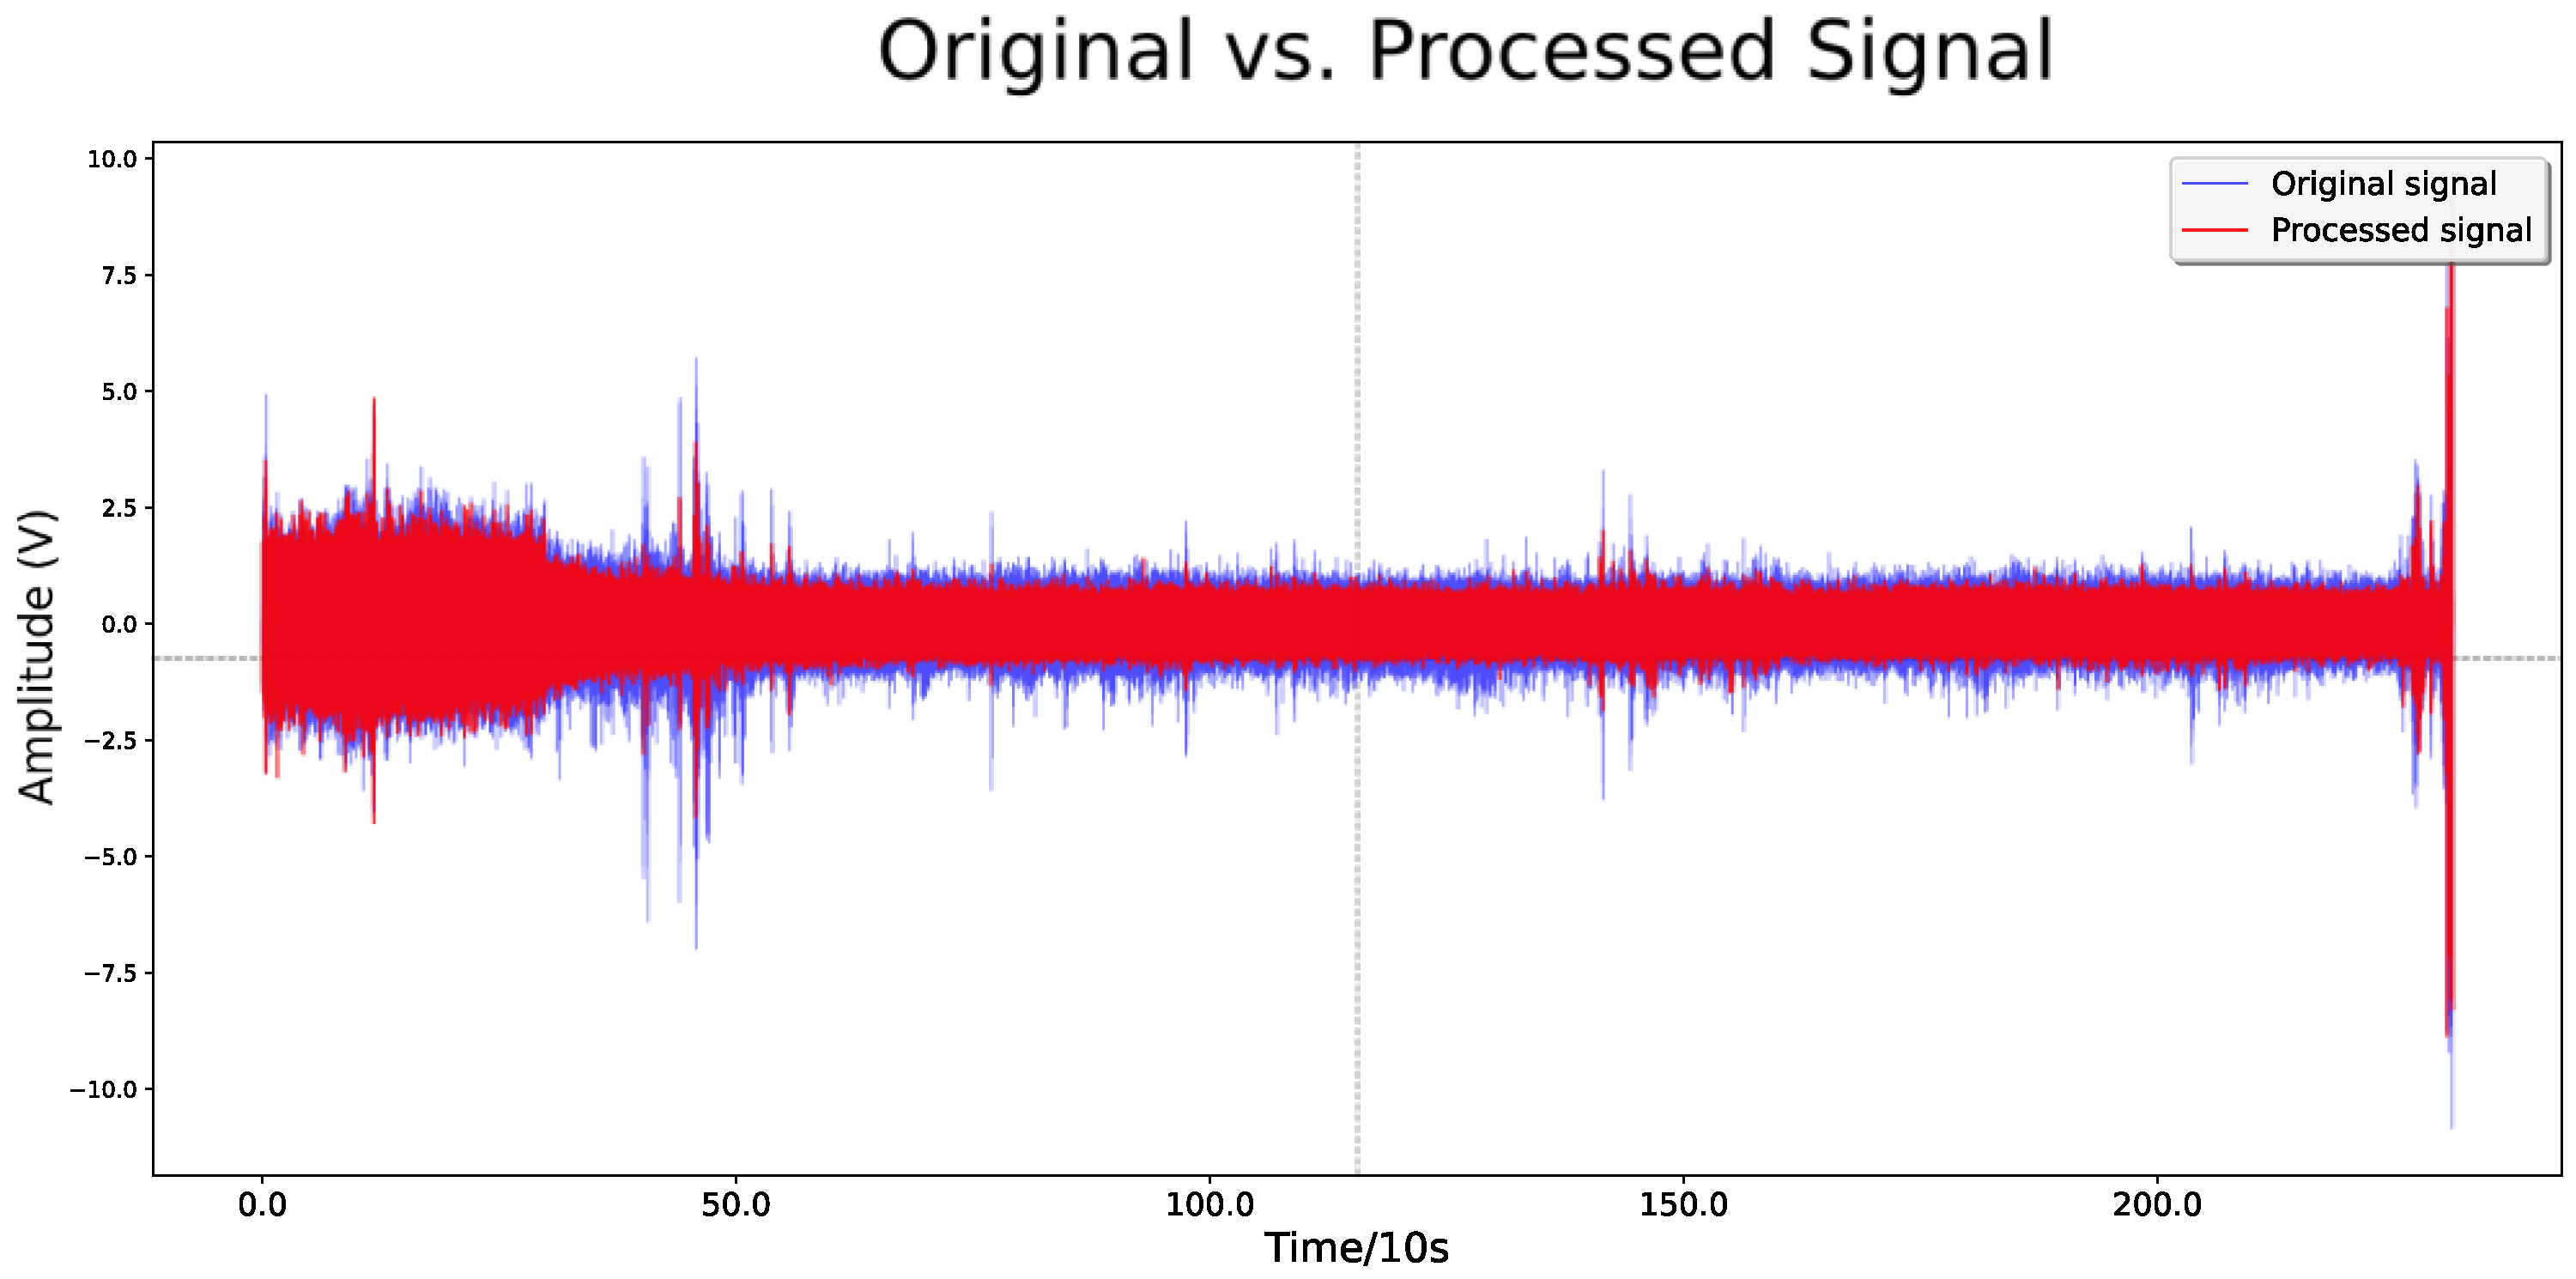
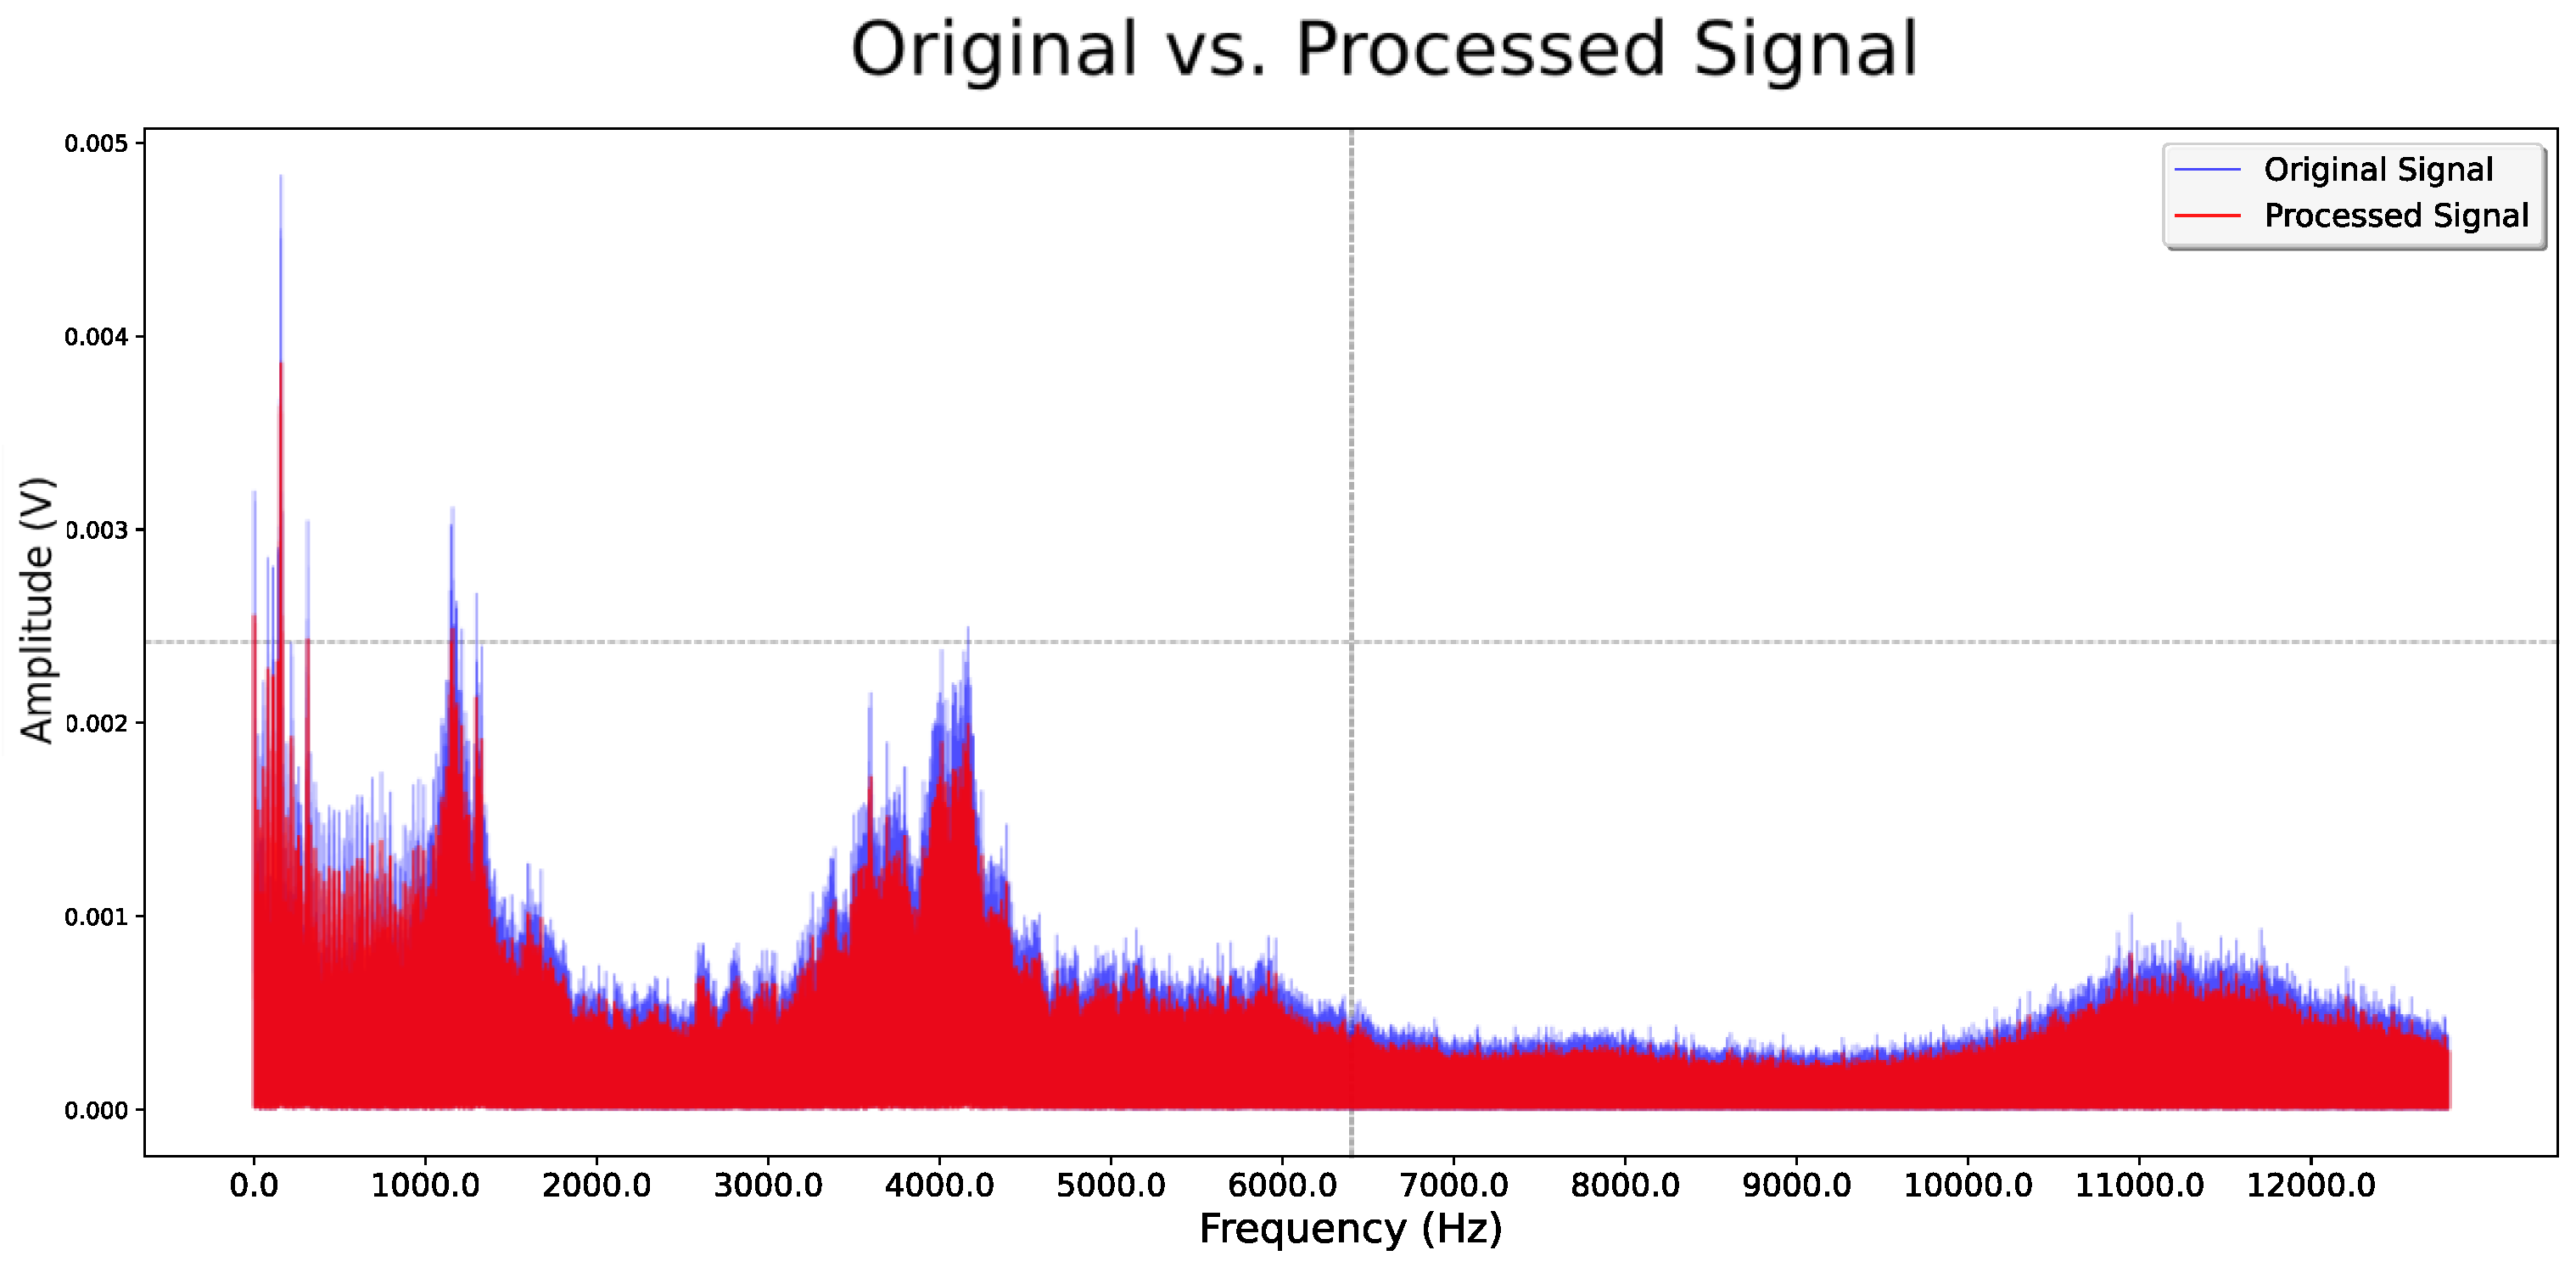
  • Data Preprocessing: The IU-Net model is utilized to process and denoise the original time-domain and frequency-domain signals. Multi-scale signal features are extracted using one-dimensional convolution and pooling, followed by deconvolution and concatenation techniques to produce the denoised signals.
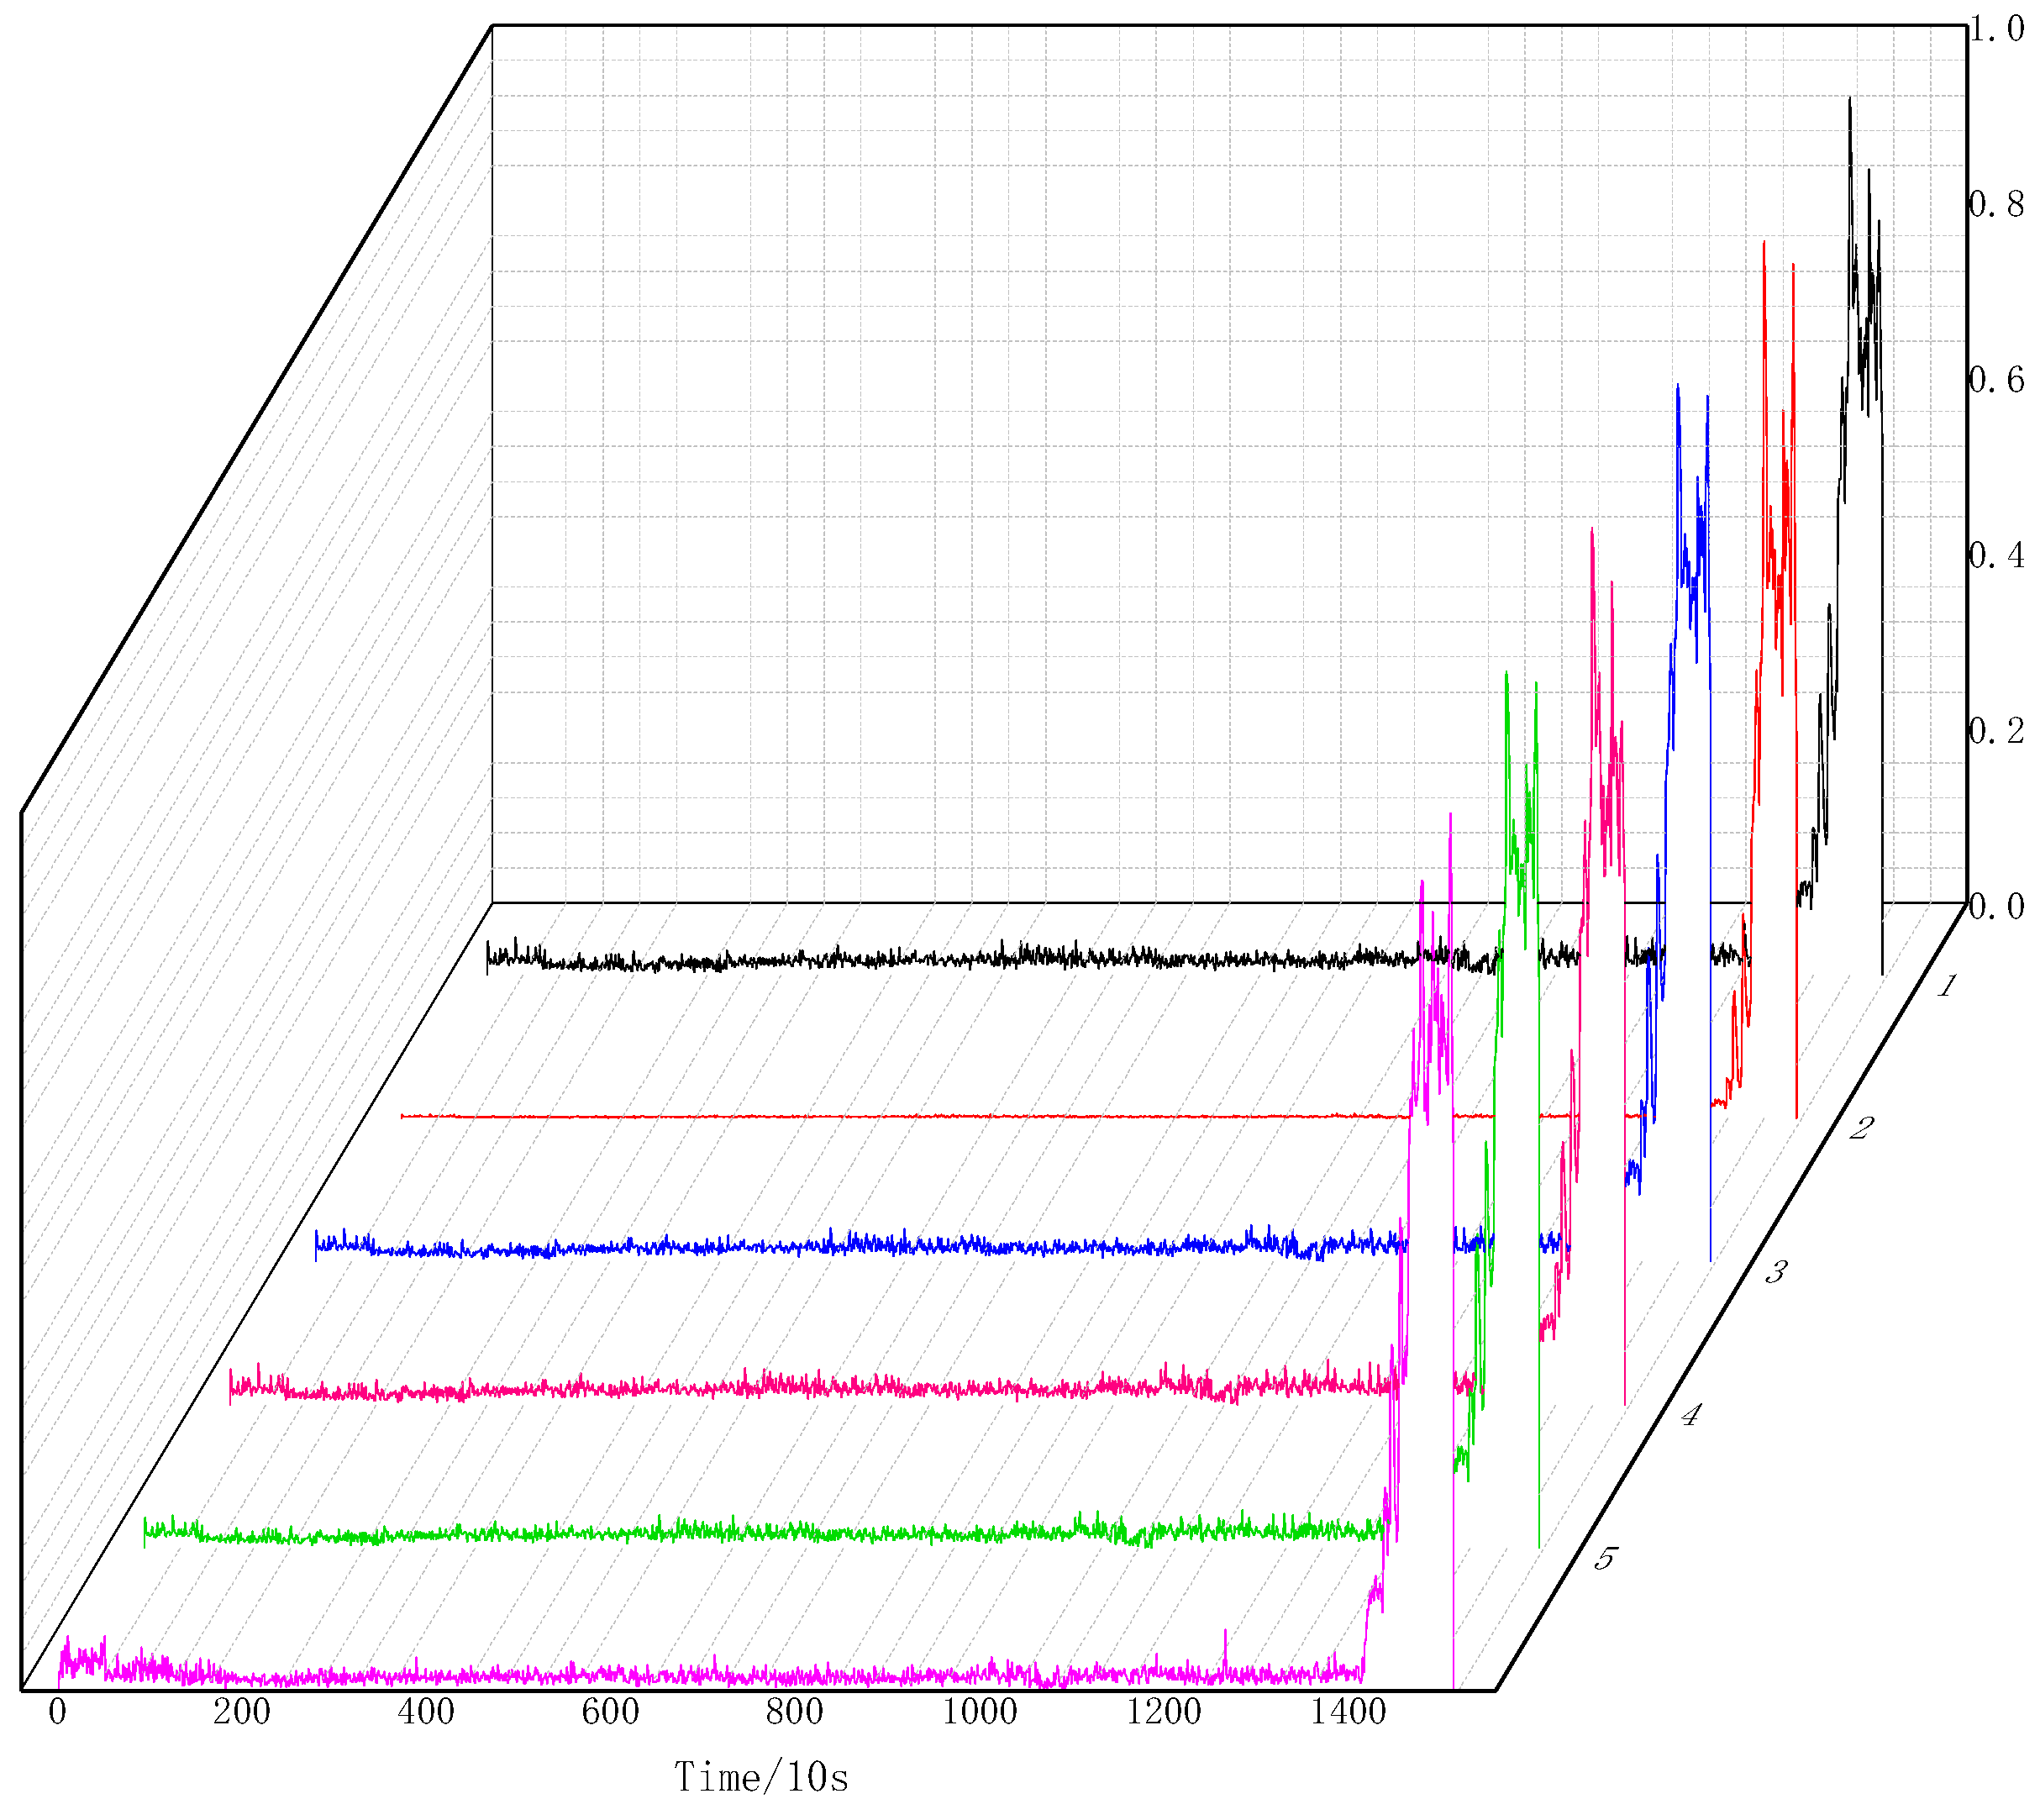
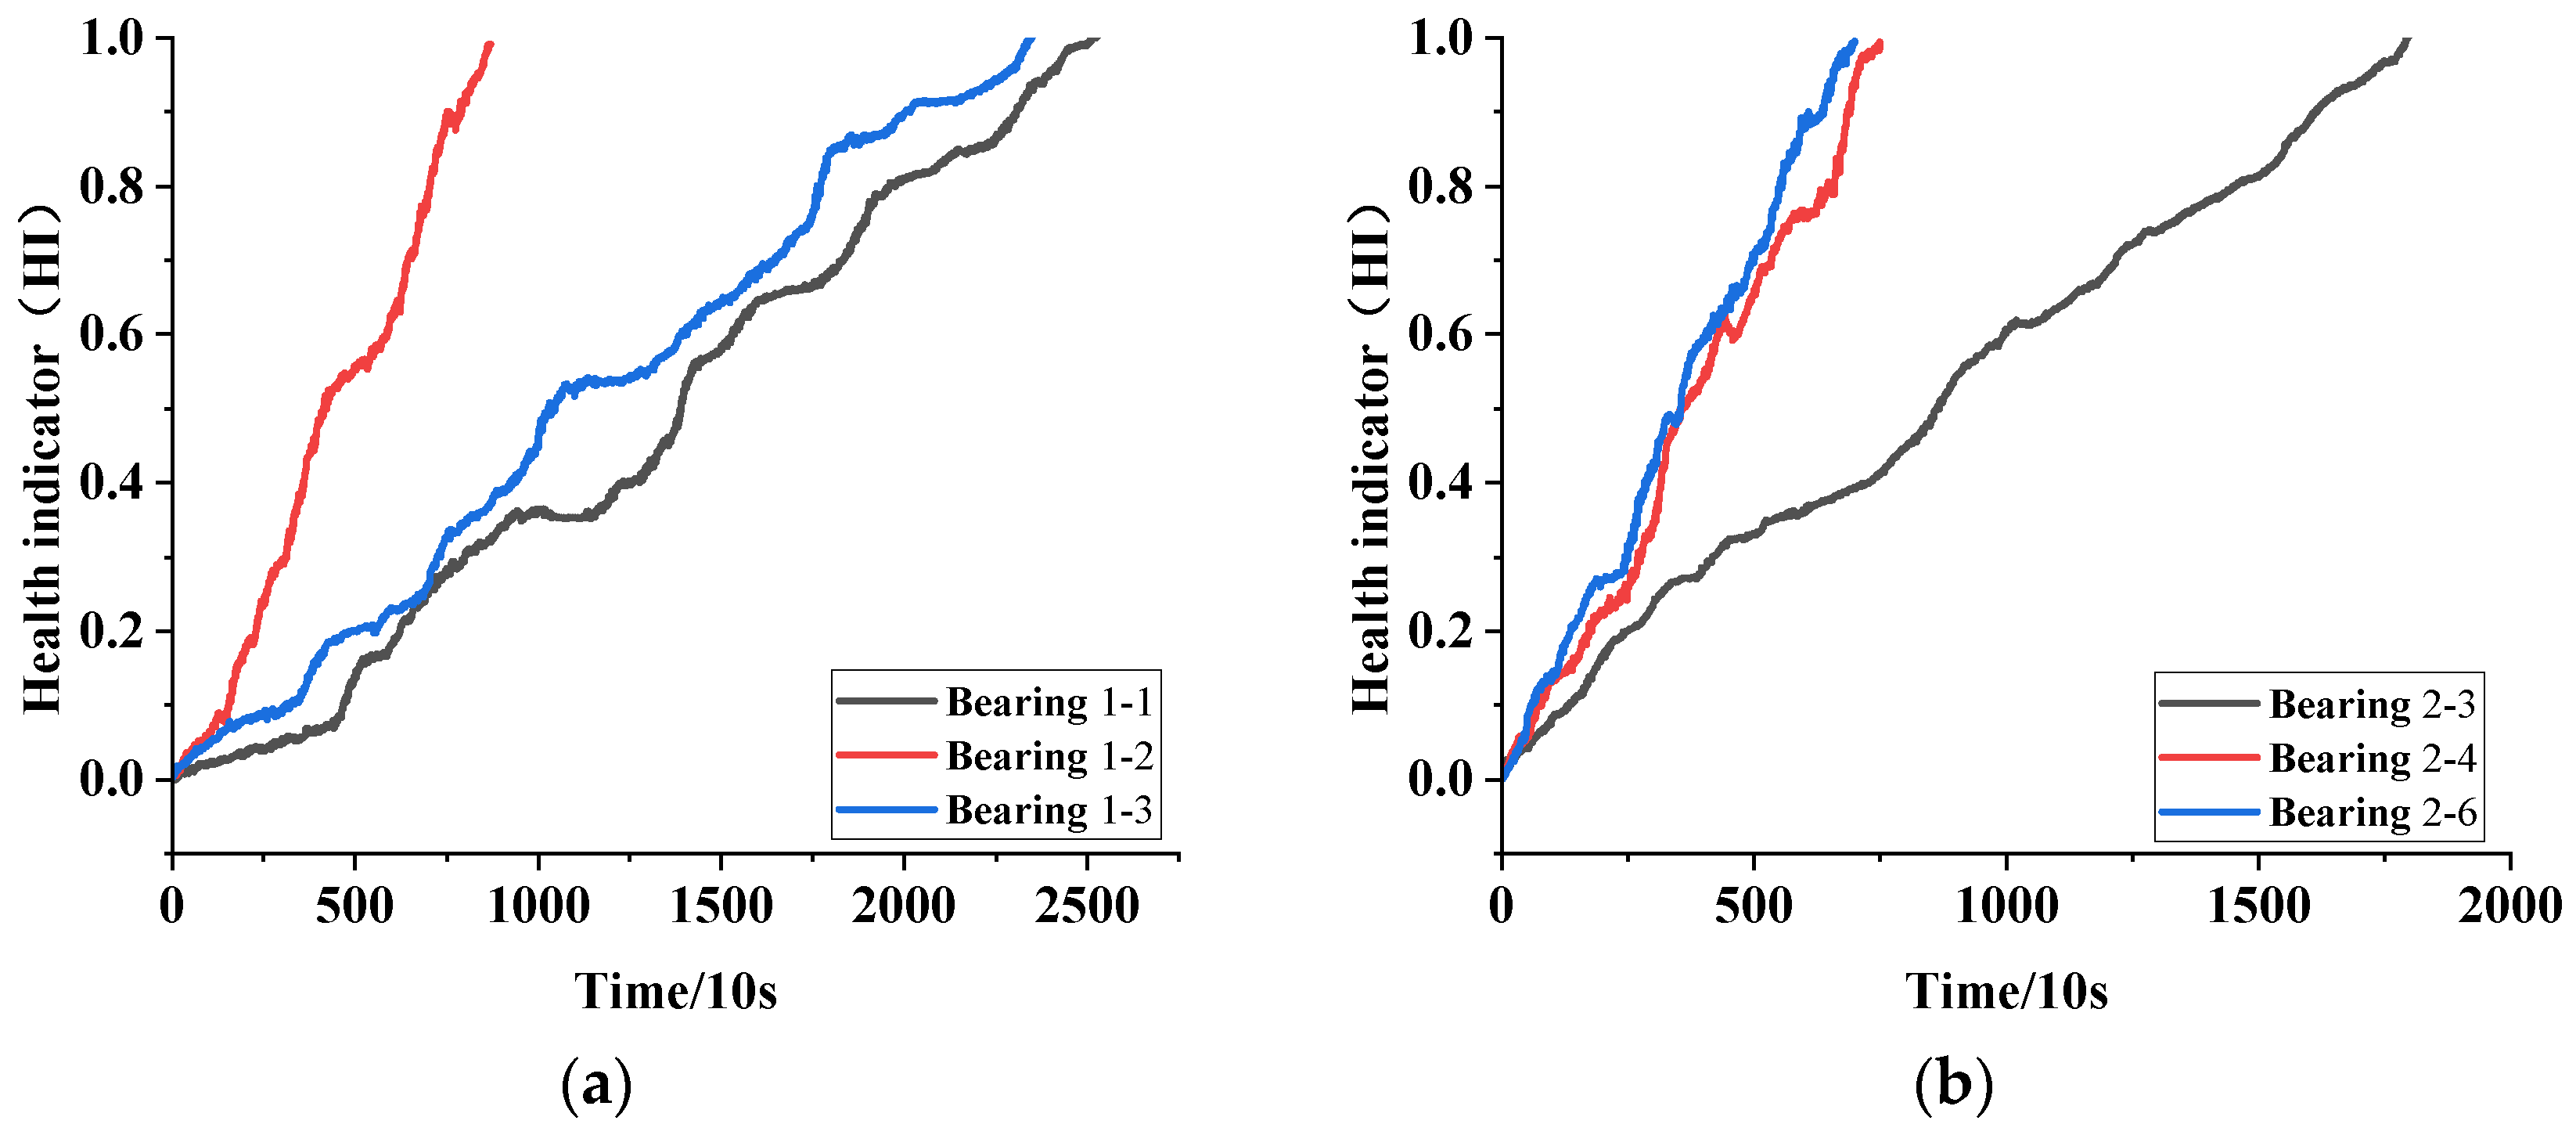
  • Health Indicator Construction: The processed signals are utilized to compute both time-domain and frequency-domain feature values. A multi-dimensional hybrid gated attention mechanism is implemented to generate multi-dimensional weight information, followed by feature fusion to construct the health indicator.
  • RUL Prediction: This section describes the construction of an IU-Net-MHGAM-BiGRU model for predicting the remaining useful life of bearings. The health indicators, which were developed in the previous step, serve as inputs to this model to facilitate accurate RUL predictions.

3.3. Health Indicator Evaluation

The degradation trend of rolling bearings exhibits time variance and randomness. An effective health indicator should possess correlation (Corr), monotonicity (Mon), and robustness (Rob) [18]. In this paper, features are extracted from both the time and frequency domains of bearing vibration signals. Multi-dimensional weight information is utilized for feature fusion to construct the health indicator, effectively addressing the challenges posed by nonlinear time-series characteristics and information loss. The definitions of correlation (Corr), monotonicity (Mon), and robustness (Rob) are as follows:
C o r r ( F , T ) = K = 1 K f T ( t k ) F ¯ ( t k T ¯ ) K = 1 K f T ( t k ) F ¯ 2 K = 1 K ( t k T ¯ ) 2
M o n ( F ) = d F > 0 K 1 d F < 0 K 1
R o b ( F ) = 1 K K = 1 K exp f R ( K ) f ( K )
where F ¯ denotes the mean value of feature sequences f T ( t k ) from 1 to k; T ¯ denotes the mean value of time sequences t k from 1 to k; and d F denotes the derivative of the feature sequence with respect to the time sequence. The metrics Corr, Mon, and Rob are defined on the closed interval [0, 1]. Increasing values of these metrics indicate enhanced predictive performance.
By computing various statistical features of the signal across different domains—namely, the time domain (e.g., mean, variance, kurtosis), the frequency domain (e.g., spectral centroid, spectral entropy), and the time–frequency domain (e.g., wavelet packet energy, time–frequency aggregation)—and selecting features with a Cori value greater than 0.5 [19], we construct a feature set that exhibits improved monotonicity and trend characteristics in characterizing signal variation patterns. The selected features include peak value, variance, waveform factor, kurtosis, RMS value, and root amplitude. This feature set is illustrated in Figure 6.

3.4. Remaining Useful Life (RUL) Evaluation Metrics

This paper employs three evaluation metrics as the final assessment indicators for the model′s prediction results: root mean square error (RMSE), mean absolute error (MAE) [20], and the average score (Score) defined by the IEEE PHM2012 Challenge [21]. Specifically, lower RMSE and MAE values, along with a higher score, indicate superior prediction performance of the model. The calculation formulas are as follows:
RMSE = 1 N i = 1 N d i 2
MAE = 1 N i = 1 N d i
A i = e ln ( 0.5 ) ( E r i / 5 )   if   E r i 0 e + ln ( 0.5 ) ( E r i / 20 )   if   E r i > 0
Score = 1 N i = 1 11 ( A i )
where d i = y y ^ denotes the difference between the actual value and the predicted value, E ri = ( d i / y ) × 100 % . When d i > 0 , it is a lagging prediction, which is prone to causing risks. When d i 0 , it is an advanced prediction, which is beneficial for equipment maintenance. For N data points, A i denotes the score value of each individual data point, while S c o r e represents the mean value of the scores across all data points.

4. Experimental Validation on Public Datasets

4.1. Dataset Introduction

The experimental data utilized in this paper were derived from the FEMTO-ST rolling bearing full-life accelerated degradation dataset [21], which was provided by the IEEE PHM 2012 Data Challenge. This dataset was collected using the bearing accelerated degradation PRONOSTIA experimental platform, as depicted in Figure 7, and encompassed the degradation processes of rolling bearings under three distinct operating conditions. The data acquisition interval was set at 10 s; the data were continuously acquired, with a sampling frequency of 25.6 kHz and a sampling duration of 0.1 s. Detailed dataset information is presented in Table 1. The bearing was considered to be completely degraded and in a failure state when the amplitude of the vibration signal, recorded by the acceleration sensor, exceeded 20 g. To validate the accuracy of the method proposed in this paper, data exhibiting relatively stable signals were selected from the dataset: under operating Condition No. 1, samples 1-1, 1-2, and 1-3 were designated as the training set, while samples 1-4, 1-5, and 1-6 served as the test set. Under operating Condition No. 2, samples 2-3, 2-4, and 2-6 were chosen as the training set, and samples 2-2, 2-5, and 2-7 were utilized as the test set.

4.2. Raw Data Processing

The enhanced U-Net signal processing method was utilized to process and analyze Bearings 1-4 and 2-5 within the dataset. Figure 8 and Figure 9 illustrate the time-domain and frequency-domain signal processing results for the entire lifespan of Bearing 1-4, while Figure 10 and Figure 11 display the corresponding results for Bearing 2-5. The quality of the generated signals was assessed using the signal-to-noise ratio (SNR) and root mean square error (RMSE), where a lower RMSE and a higher SNR indicate superior signal quality. The calculation formulas are provided in Equations (18) and (19). The proposed method was compared with WGAN [22] and DCGAN [23]. The relevant numerical information pertaining to the signal data is presented in Table 2. Table 3 and Table 4 present a comparison of the signal quality generated by various models. It is evident that the signal quality produced by WGAN and DCGAN is significantly inferior to that of the proposed method. This discrepancy is attributed to the requirement of GAN models for a substantial amount of data for effective learning; when data are limited, these models struggle to capture all relevant features. In this study, the selection and analysis of bearing datasets are guided by two primary criteria: the completeness of working condition coverage and the reliability of data quality.
The signal-to-noise ratio (SNR) formula [24] is:
S N R = 10 log 10 ( 1 N n = 0 N 1 x s ( n ) 2 1 N n = 0 N 1 x n ( n ) 2 )
where X S n denotes the separated useful signal component; X n n denotes the noise component; and N denotes the number of signal points.
The root mean square error (RMSE) formula [25] is:
R M S E = 1 N i = 1 N ( X i X ^ i ) 2
where X i denotes the i-th sampled value of the original signal; X ^ i denotes the i-th sampled value of the processed signal; and N denotes the number of data points.
The results presented in Table 3 and Table 4 demonstrate that the proposed method achieves significant improvements in signal quality for both bearing types. Specifically, the signal-to-noise ratio (SNR) of the signals from Bearings 1-4 and 2-5 generated by our method shows respective enhancements of 46.44% and 20.21%, as well as 19.82% and 8.3%, when compared with the two baseline methods. Furthermore, the root mean square error (RMSE) values exhibit notable reductions of 32.11% and 22.2% for Bearing 1-4 and 34.94% and 20.85% for Bearing 2-5. These quantitative improvements indicate that the proposed methodology not only effectively suppresses noise interference but also better preserves essential information from the original signals. Consequently, this approach establishes a more reliable data foundation for subsequent lifespan prediction tasks by maintaining higher signal fidelity.

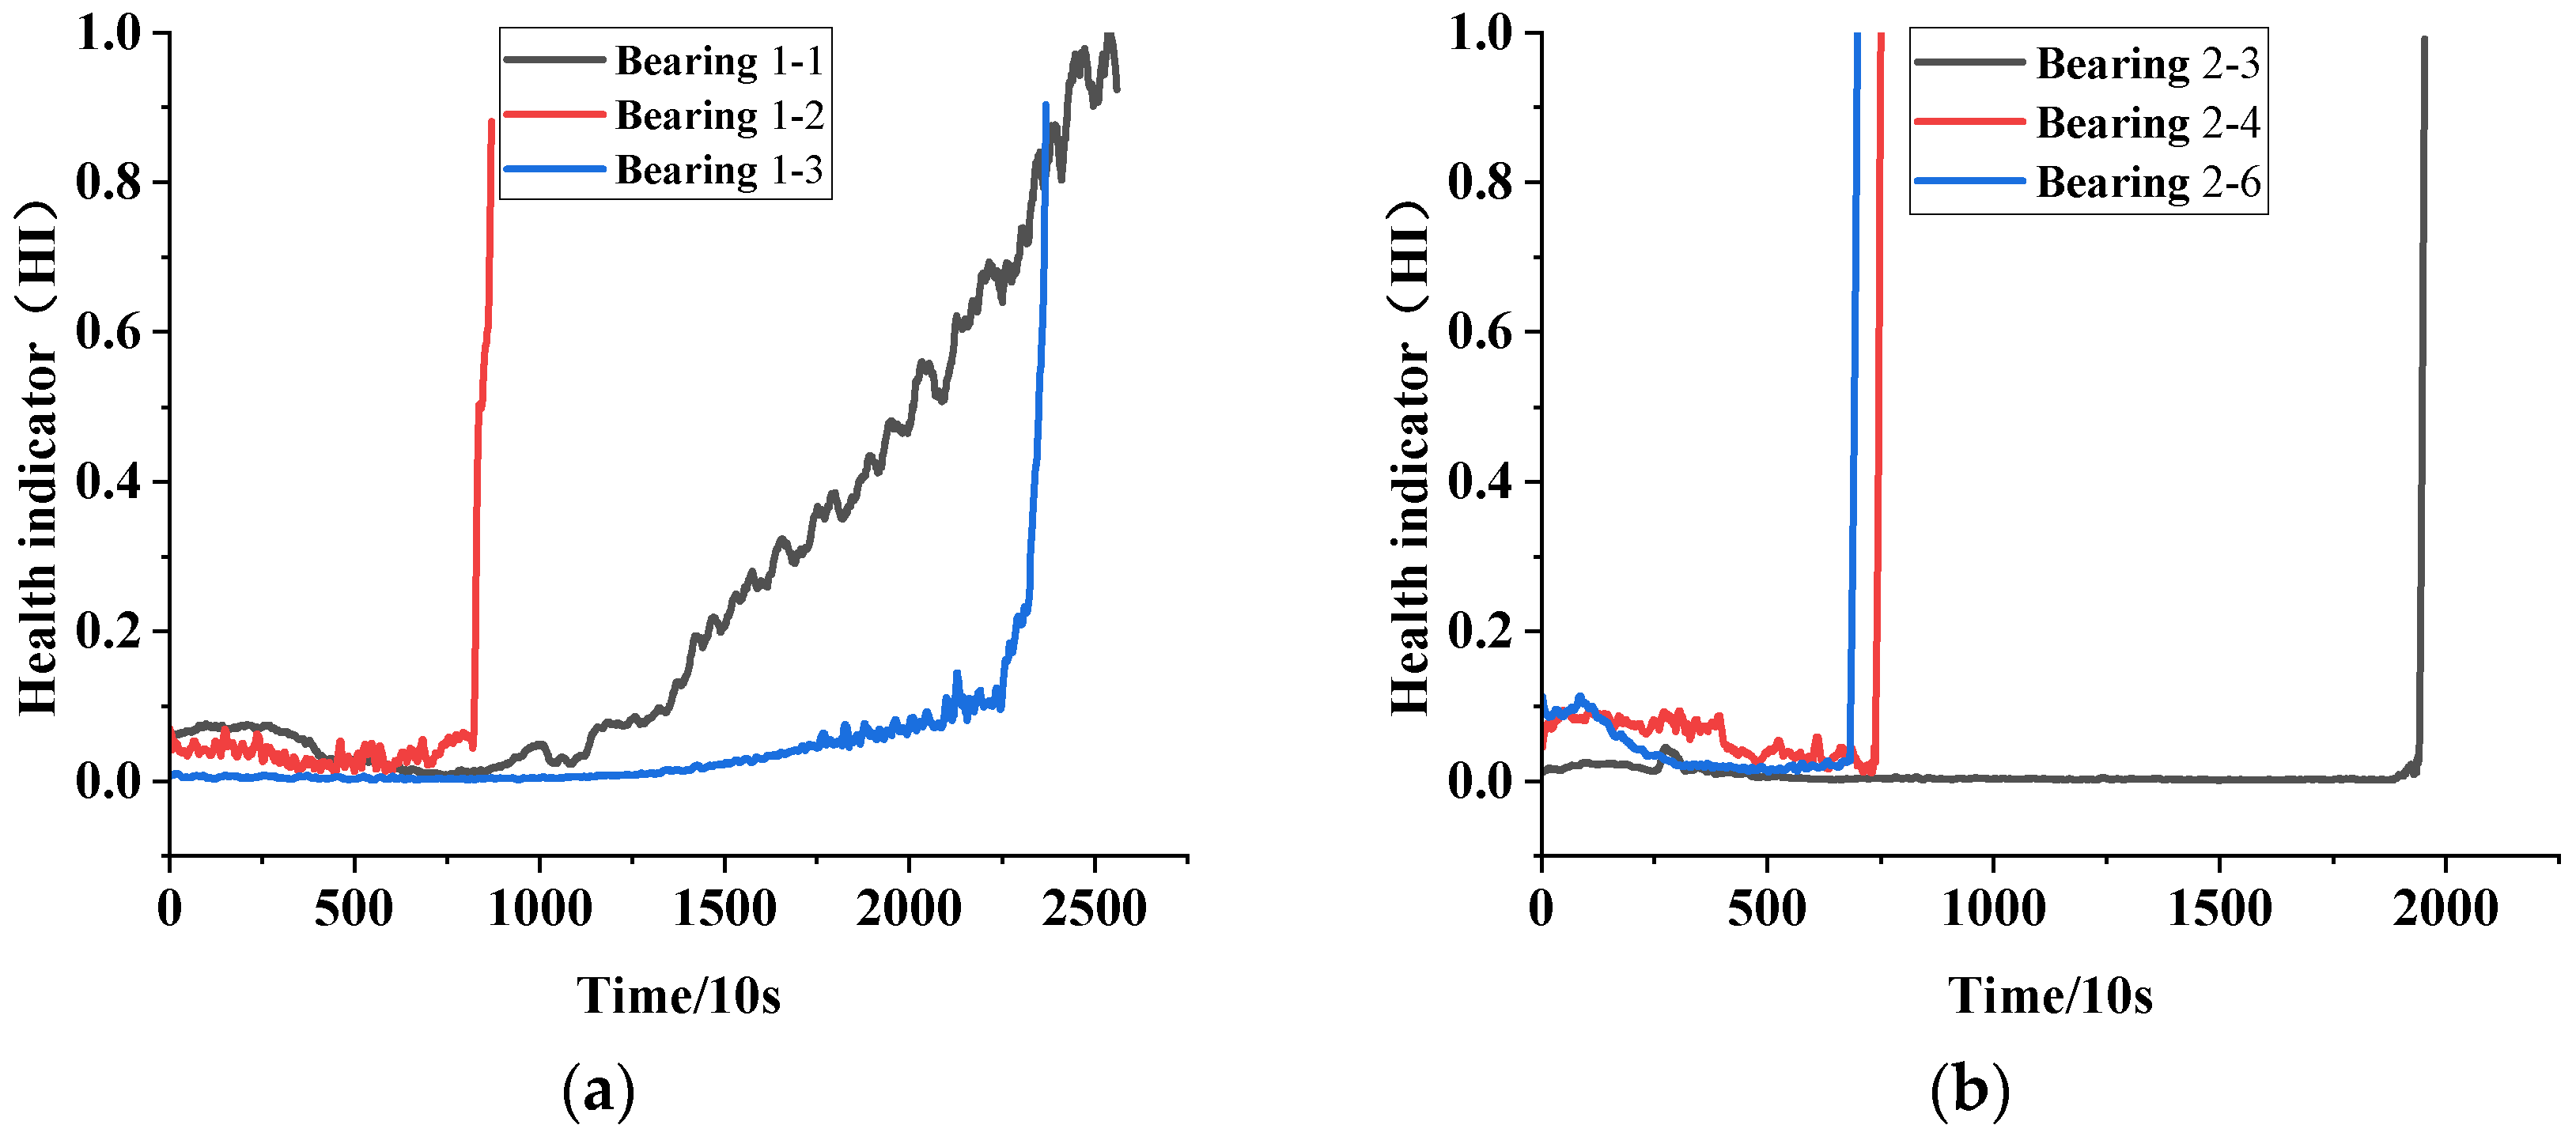
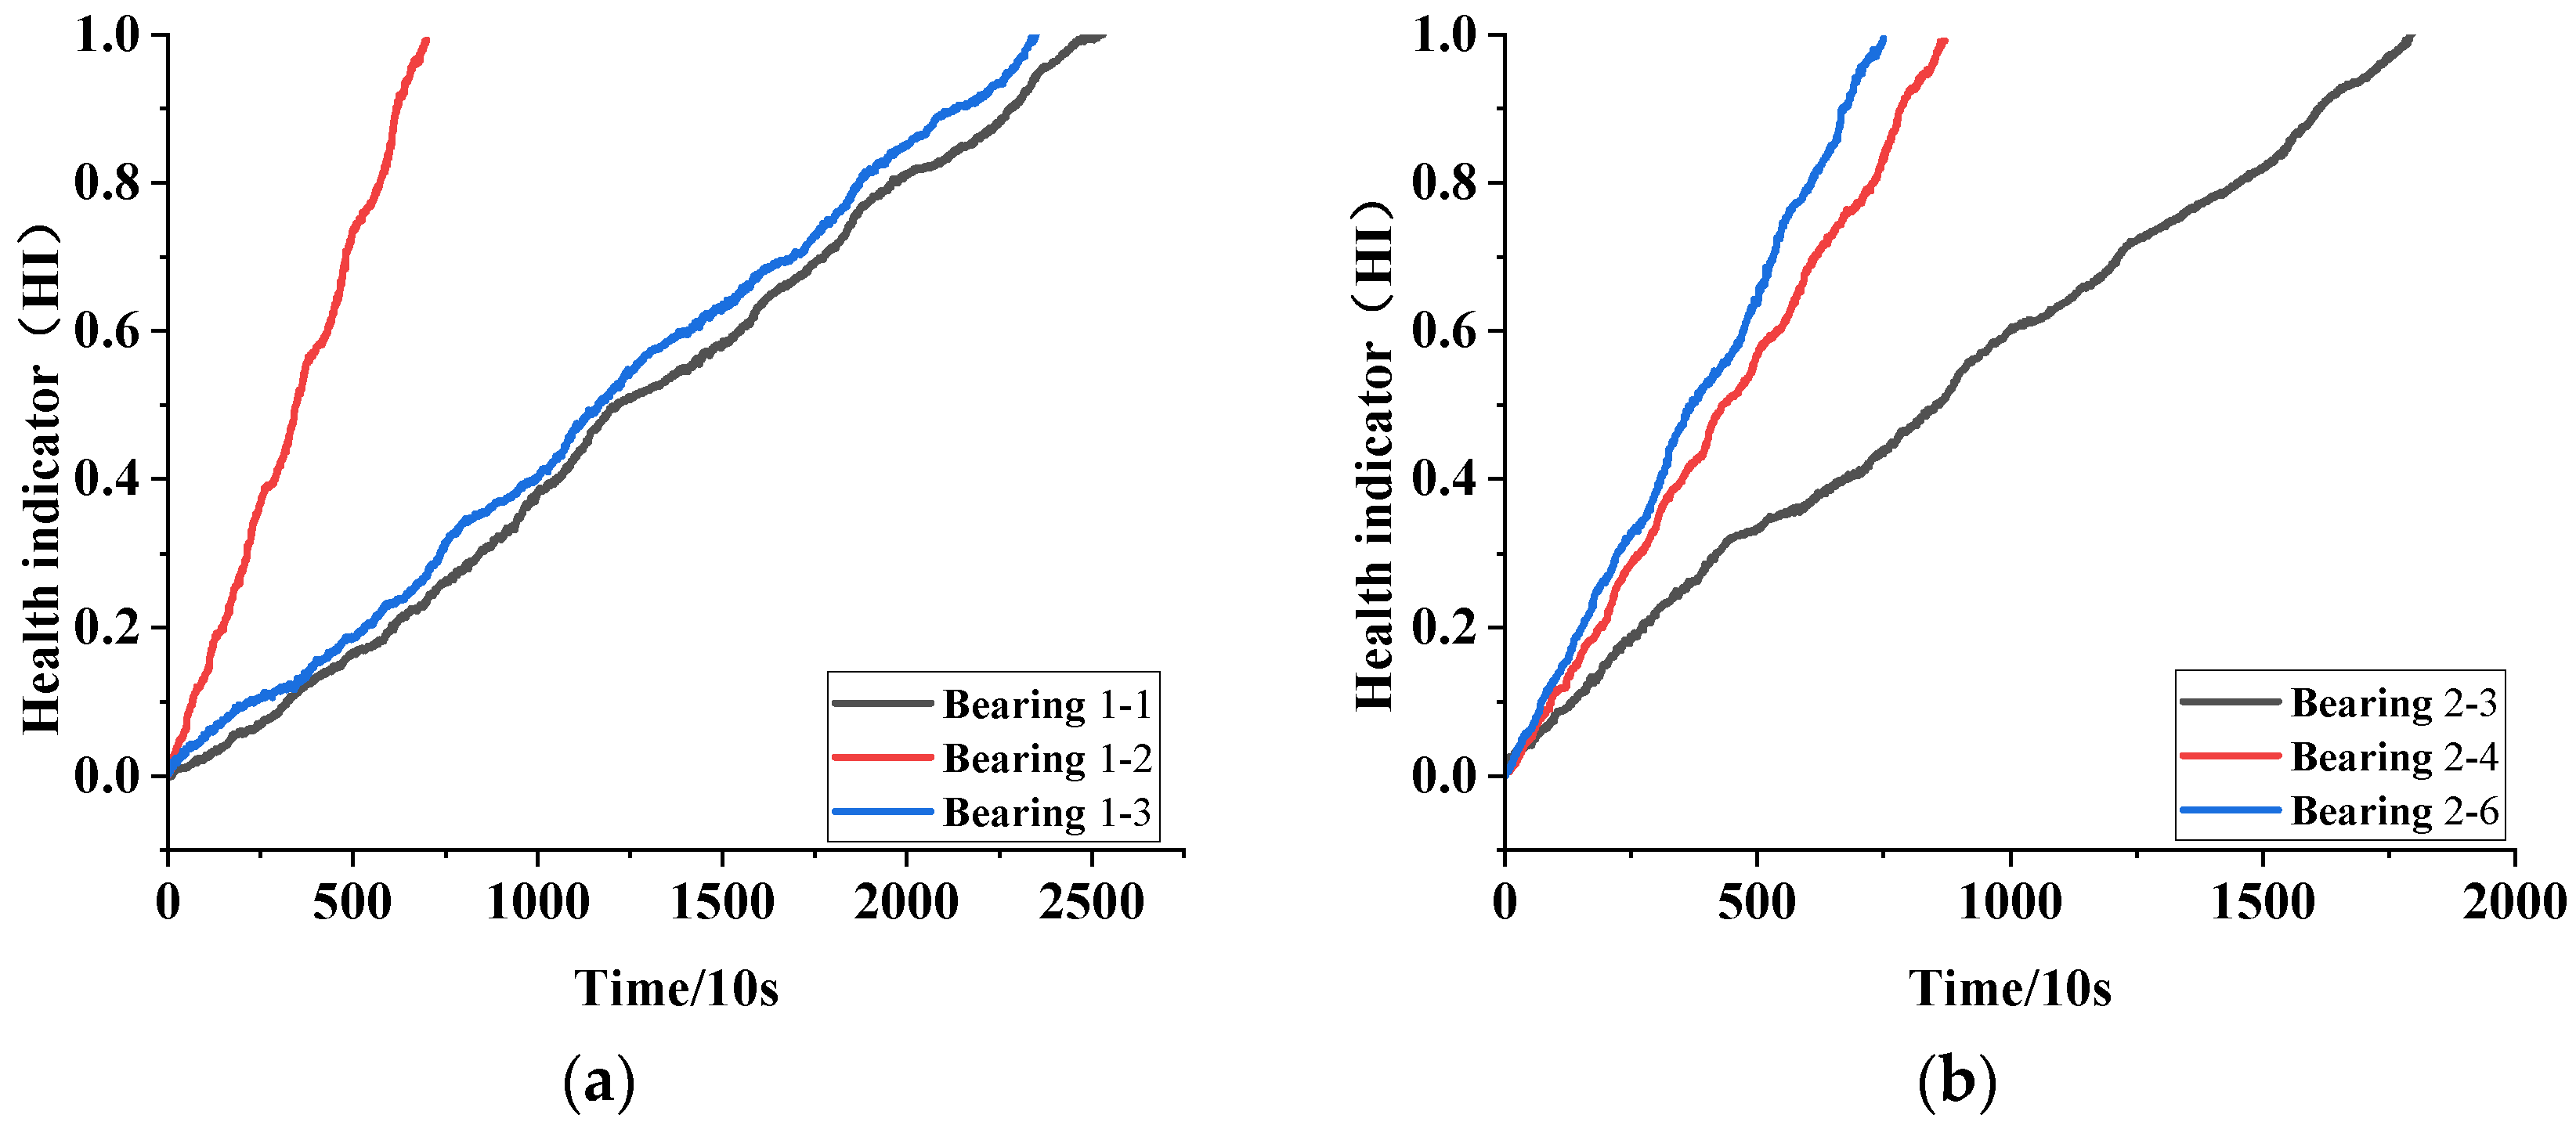
4.3. Health Indicator Construction

The processed time-domain and frequency-domain signal features were calculated and subsequently input into the Health Indicator Construction Module (MH-GAM). Deep learning models possess numerous parameters, and improper parameter settings can result in slow convergence and diminished accuracy. Consequently, this paper delineates the parameters for each module, with the input and output sizes presented in Table 5.
In this paper, the moving average method was employed to smooth all fused health indicators, with a sliding window size of 20. The smoothed health indicators demonstrate strong monotonicity and reduced volatility. To illustrate the superiority of the health indicators developed in this study, they are compared with those constructed by the DRSN (Deep Residual Shrinkage Network) method and the root mean square (RMS) value as a health indicator. As shown in Figure 12, the health indicators constructed by the DRSN exhibit certain limitations in stability. In contrast, Figure 13 demonstrates that the RMS value indicator suffers from poor monotonicity and experiences abrupt changes in the later stages. By comparison, the health indicators developed using the method presented in this paper (Figure 14) showcase improved stability and correlation when compared to those illustrated in Figure 12 and Figure 13.
To quantitatively compare the performance of the three health indicators—correlation, monotonicity, and robustness—a comparative analysis was conducted, with the results presented in Figure 15. The average values of the health indicators constructed using the method proposed in this paper showed increases of 11% and 331% in correlation, 27% and 540% in monotonicity, and 10.1% and 12.2% in robustness, respectively, compared to the average values of the DRSN and RMS health indicators. The data indicate that utilizing the root mean square (RMS) as a health indicator for characterizing the degradation performance of bearings is less effective. In contrast, the health indicators developed by the proposed method demonstrate superior overall performance.

4.4. Remaining Useful Life (RUL) Prediction

To validate the effectiveness of the proposed method in this paper, a portion of the test set data was utilized for prediction, and the prediction results were subsequently evaluated. The training and validation data were divided in a 70% to 30% ratio, with specific allocations detailed in Table 6. The prediction results are illustrated in Figure 16. Upon examining these results, it is evident that the health indicators constructed using the proposed method demonstrate superior accuracy in predicting the RUL of bearings. The generated RUL prediction curve closely aligns with the actual life trajectory, effectively capturing the degradation process of the bearing. To further establish the superiority of the proposed method, a quantitative comparative analysis was conducted between this method and the CNN-BiGRU [26,27] and TCN-BiGRU [28,29] approaches, with the results of the analysis presented in Table 6.
Table 7 presents the quantitative evaluation metrics for the RUL prediction of the test set, employing three distinct methods. The mean values of the root mean square error (RMSE) and mean absolute error (MAE) for the life prediction results of the proposed method are 0.0504 and 0.0239, respectively, both of which are lower than those obtained from the conventional CNN-BiGRU and TCN-BiGRU methods. Additionally, the average score of 0.867 surpasses that of the other two life prediction methods. The experimental results indicate that the health indicators constructed by the proposed method more effectively characterize the degradation trend of bearings, thereby achieving superior life prediction performance.
We comprehensively evaluated the overhead of experimental data on the same hardware platform (NVIDIA RTX 3090, manufactured by NVIDIA Corporation, headquartered in Santa Clara, CA, USA), and the specific information is shown in Table 8:
Based on experimental findings, this study concludes that TCN-BiGRU incurs the highest computational burden, primarily due to the increased complexity of dilated convolution operations in TCN compared to standard CNN computations. Although the proposed method introduces a moderate computational overhead over CNN-BiGRU through its gating-based dimensionality reduction mechanism, which is reflected in a 4.12% increase in parameter count, the substantial gains in predictive accuracy justify this trade-off.
In the aspect of signal processing methodology, this paper addresses the issue of signal detail loss during the analysis of rolling bearing vibration signals by enhancing the U-Net model with adaptive convolution kernels to improve signal quality. Structural optimizations are achieved through the incorporation of time-domain dilated convolution and multi-resolution feature pyramid modules, which significantly enhance signal processing performance. Comparative experiments with WGAN and DCGAN models demonstrate that the processed signals achieve average increases in the signal-to-noise ratio (SNR) of 33.33% and 14.06%, respectively, while the root mean square error (RMSE) decreases by averages of 27.16% and 27.89%, confirming a substantial improvement in signal quality. In terms of feature fusion technology, we propose a multi-dimensional mixed gating attention mechanism to overcome the limitations of traditional attention mechanisms in multi-dimensional feature interaction. By performing feature fusion across spatial and channel dimensions, this approach adaptively adjusts fusion weights, significantly enhancing the overall performance of the constructed health indicators.

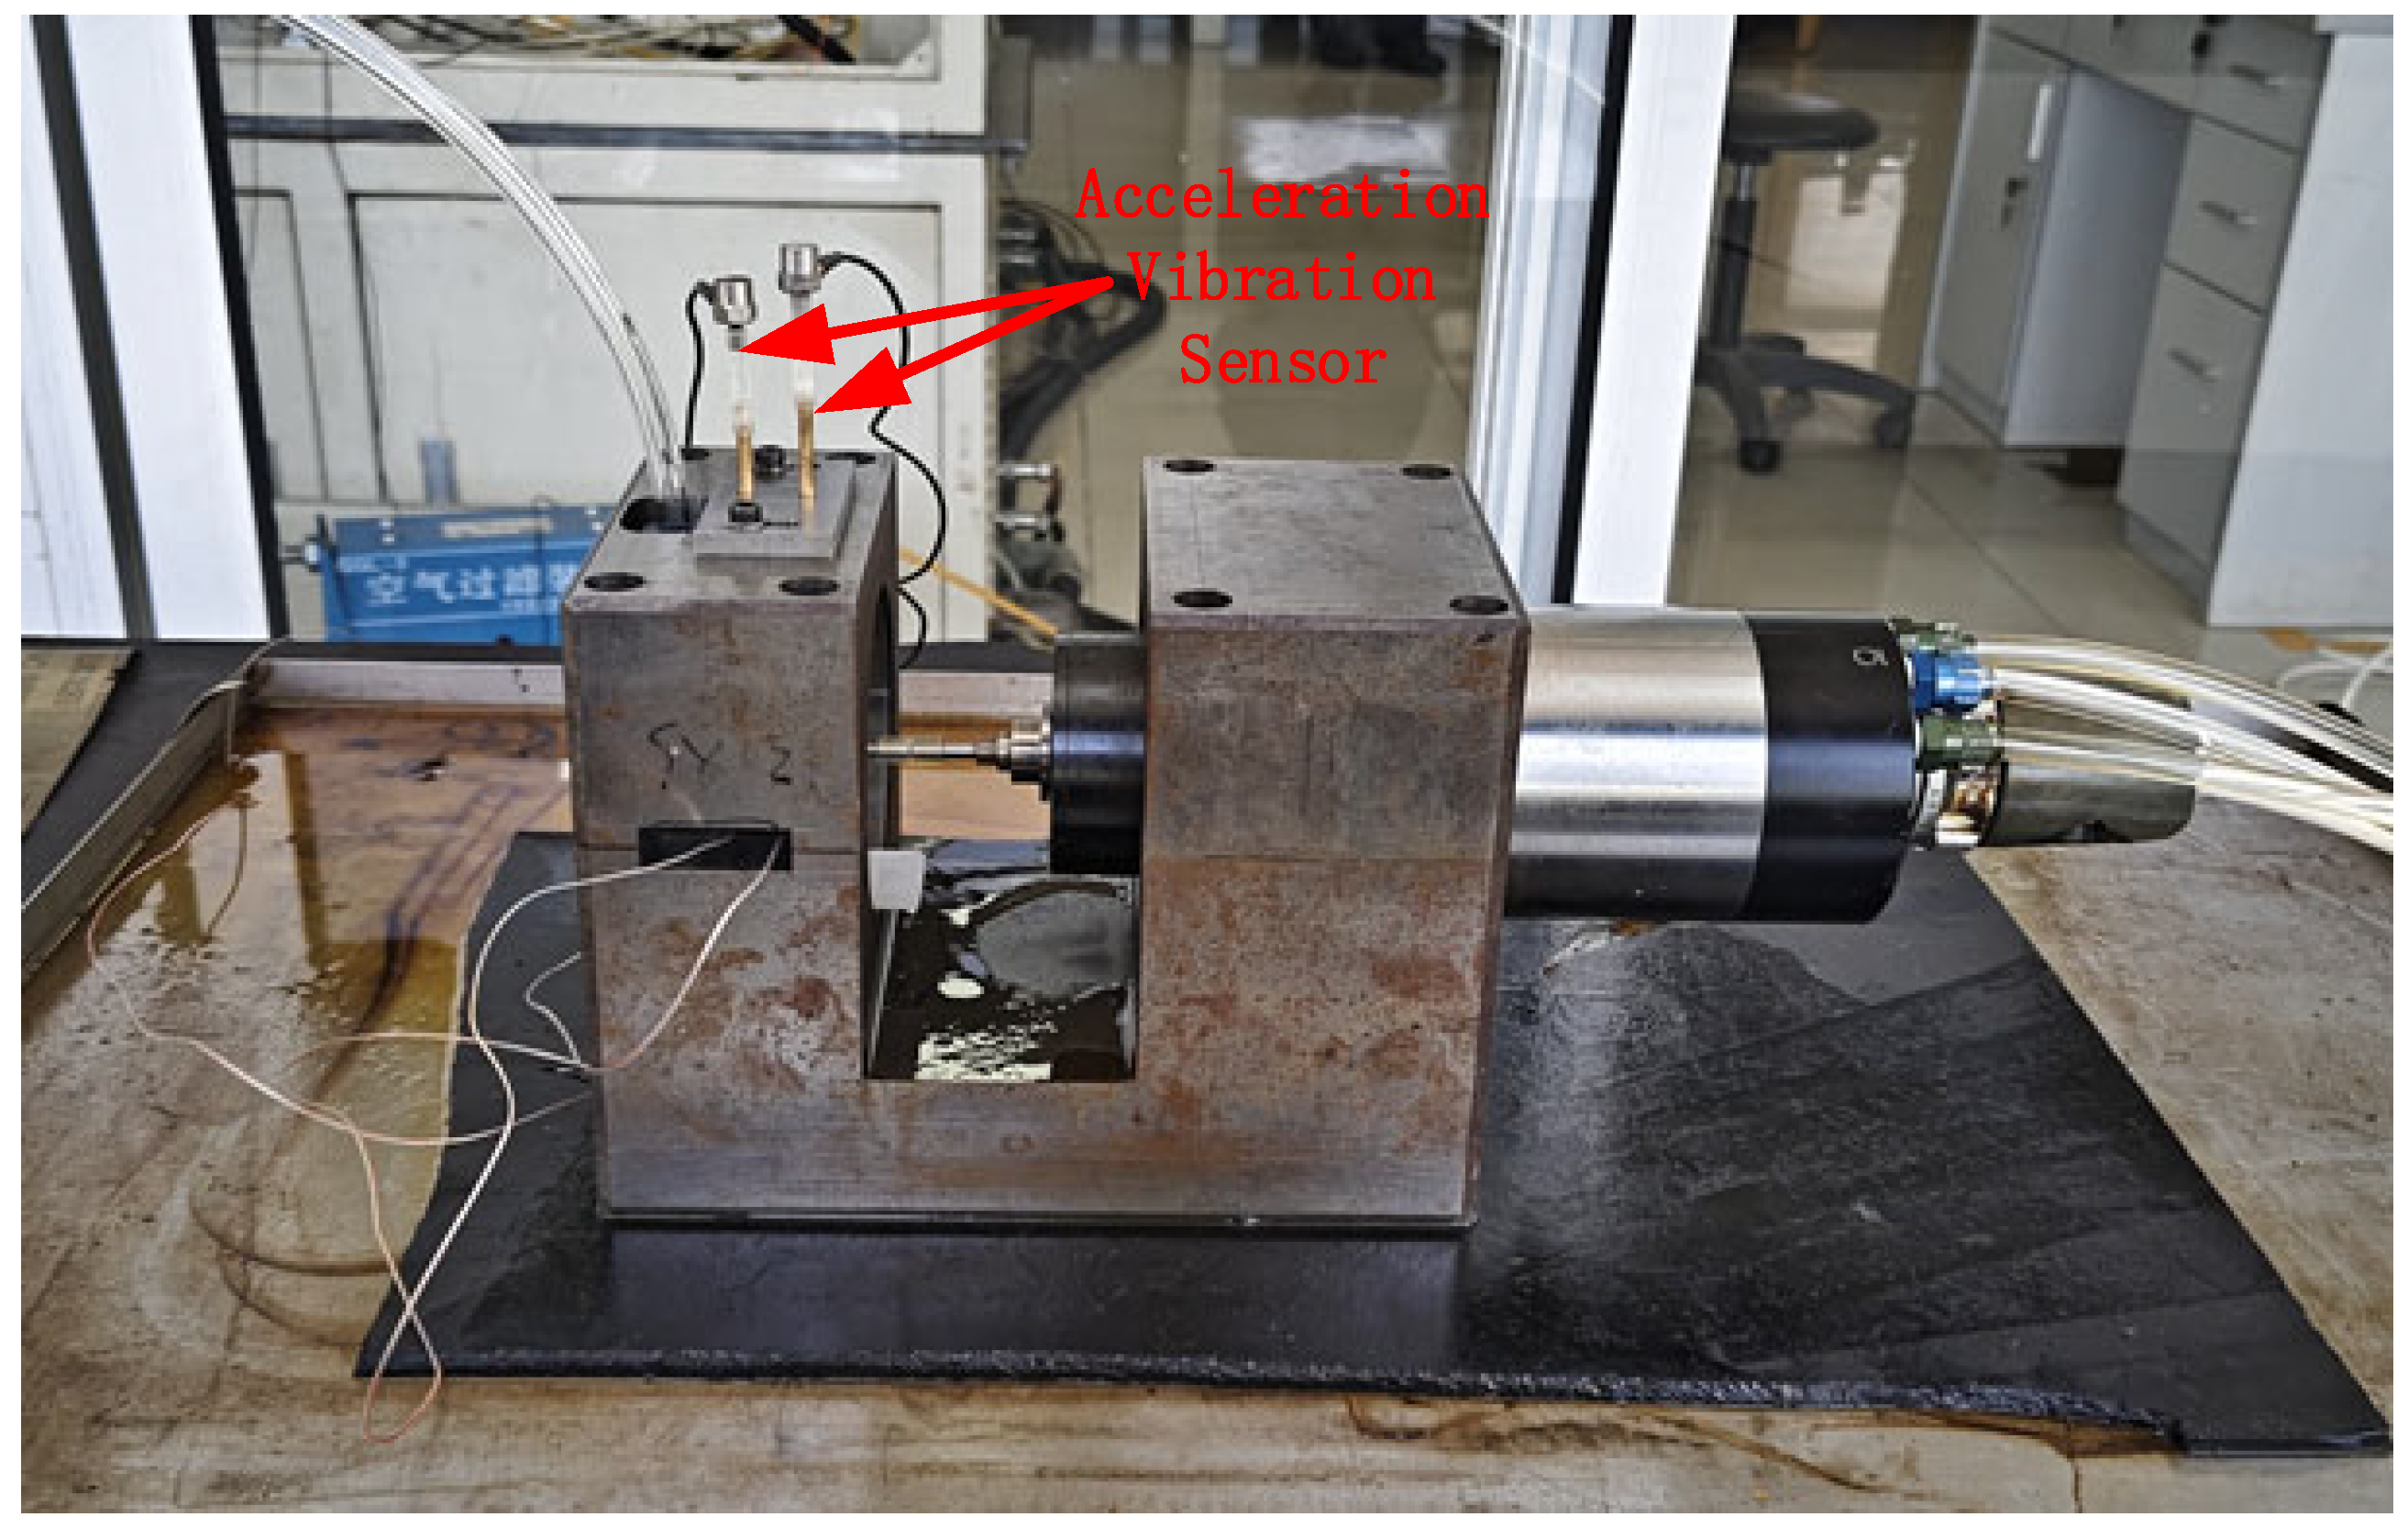
5. Engineering Test Validation

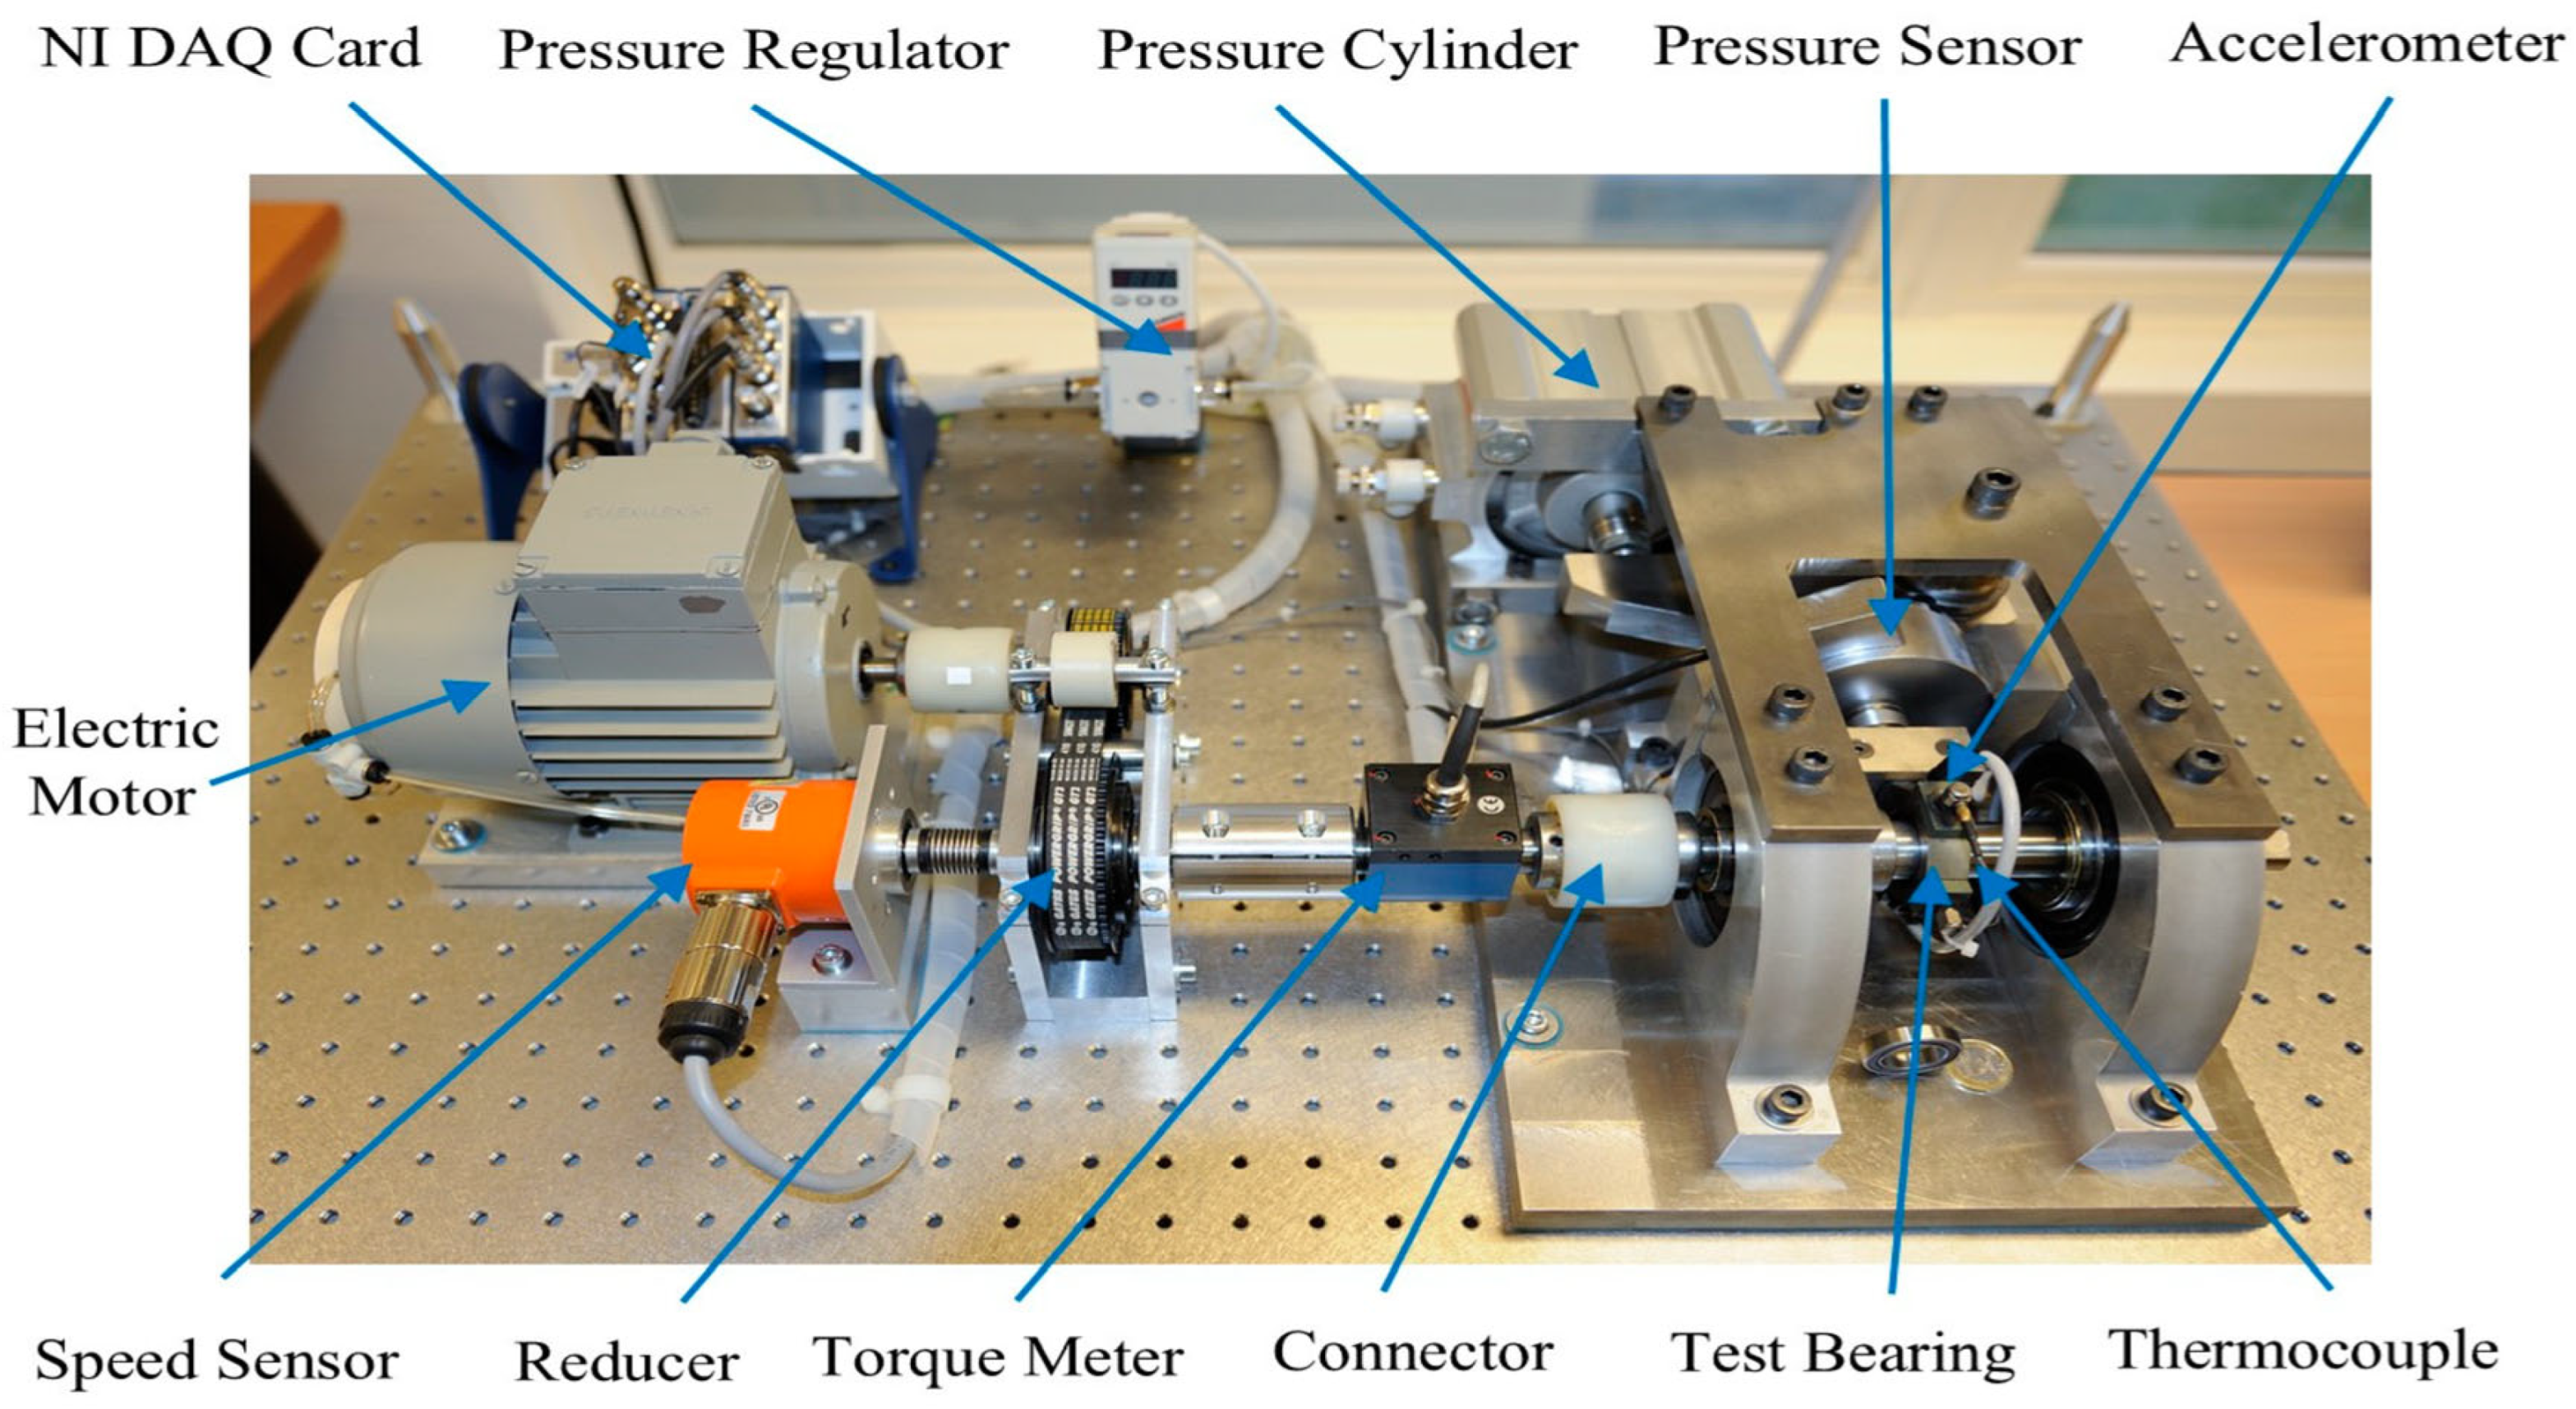
5.1. Introduction to the Test Platform

To further validate the superiority of the method described in this paper and mitigate the randomness of a single test, this study employed a bearing accelerated full-life testing machine to collect real bearing vibration signals for the validation of the proposed model. The overall structure primarily consists of a structural main body, a drive motor, and acceleration vibration sensors. The installation positions of the sensors are illustrated in Figure 17. This testing machine can simultaneously conduct synchronous life tests on two groups of bearings. The vibration signal sampling frequency was set at 25.6 kHz, with a sampling time of 0.32 s per acquisition and a sampling interval of 15 s; the data were continuously acquired. When the signal amplitude collected by the acceleration vibration sensor exceeded 20 g, the bearing was deemed to have completely failed.
The vibration data encompassed the complete lifecycle of vibration measurements for bearings, ranging from normal operation to failure. Each test involved two bearings, and a total of four test sets were conducted. The data from the first three sets served as the training set, while the data from the fourth test set were utilized as the test set. The bearings in the test set are designated as 4-A and 4-B.

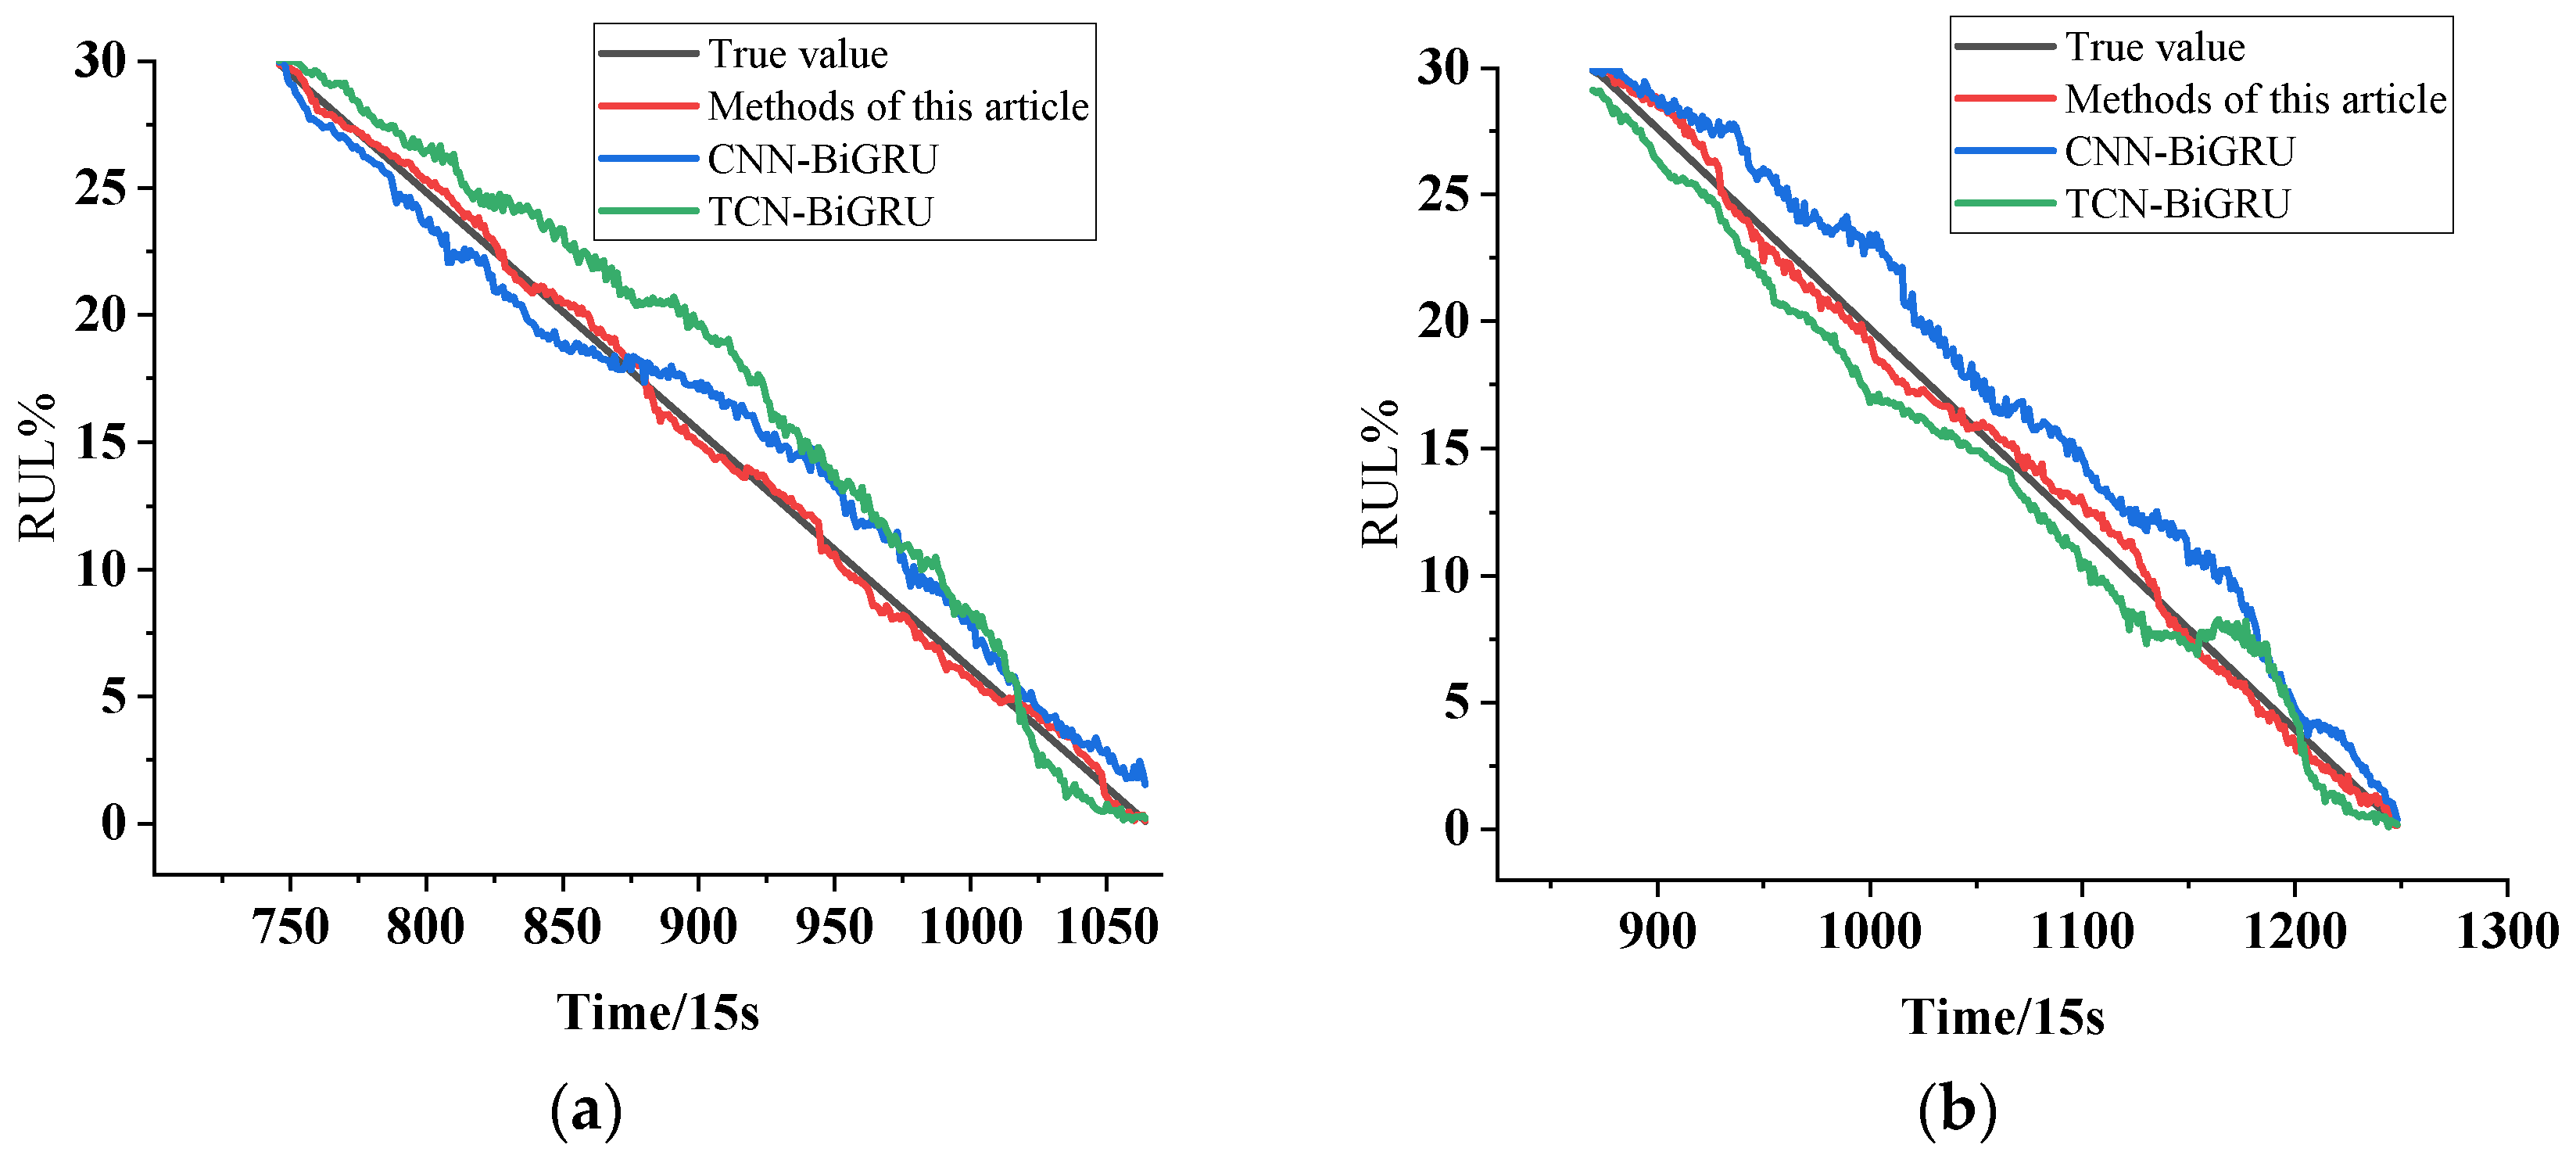
5.2. Experimental Results Analysis

Figure 18 shows the RUL prediction comparison between the proposed method, CNN-BiGRU, and TCN-BiGRU, while Table 9 presents the quantitative results comparison of the three different methods.
Through the analysis and validation of engineering test data, the method proposed in this study demonstrates significant advantages in key performance indicators. The experimental results indicate that, in the context of bearing RUL prediction, the mean values of the root mean square error (RMSE) and mean absolute error (MAE) for the proposed method are reduced by 7.8% compared to the CNN-BiGRU baseline model and decreased by 14.6% relative to the TCN-BiGRU model. Furthermore, regarding the comprehensive prediction performance scores, the average scores show improvements of 7.8% and 9.3 percentage points, respectively, when compared to the two benchmark methods. These results suggest that the proposed method significantly enhances the accuracy of remaining useful life (RUL) prediction.

6. Conclusions

To enhance real-time monitoring capabilities in industrial processes and achieve accurate and efficient predictions of rolling bearing remaining useful life (RUL), this study proposes a prediction method based on an improved U-Net architecture coupled with a multi-dimensional hybrid gated attention mechanism (MHGAM). Utilizing the IEEE PHM 2012 Data Challenge dataset, along with a self-constructed dataset derived from engineering tests, we draw the following conclusions:
  • The improved U-Net model effectively removes noise from vibration signals while preserving essential detail features in the time–frequency domain, utilizing depthwise separable convolutions and residual skip connections. The processed signals demonstrate an average increase in the signal-to-noise ratio (SNR) of 23.69% and a reduction in the root mean square error (RMSE) of 27.53% when compared to the WGAN and DCGAN methods.
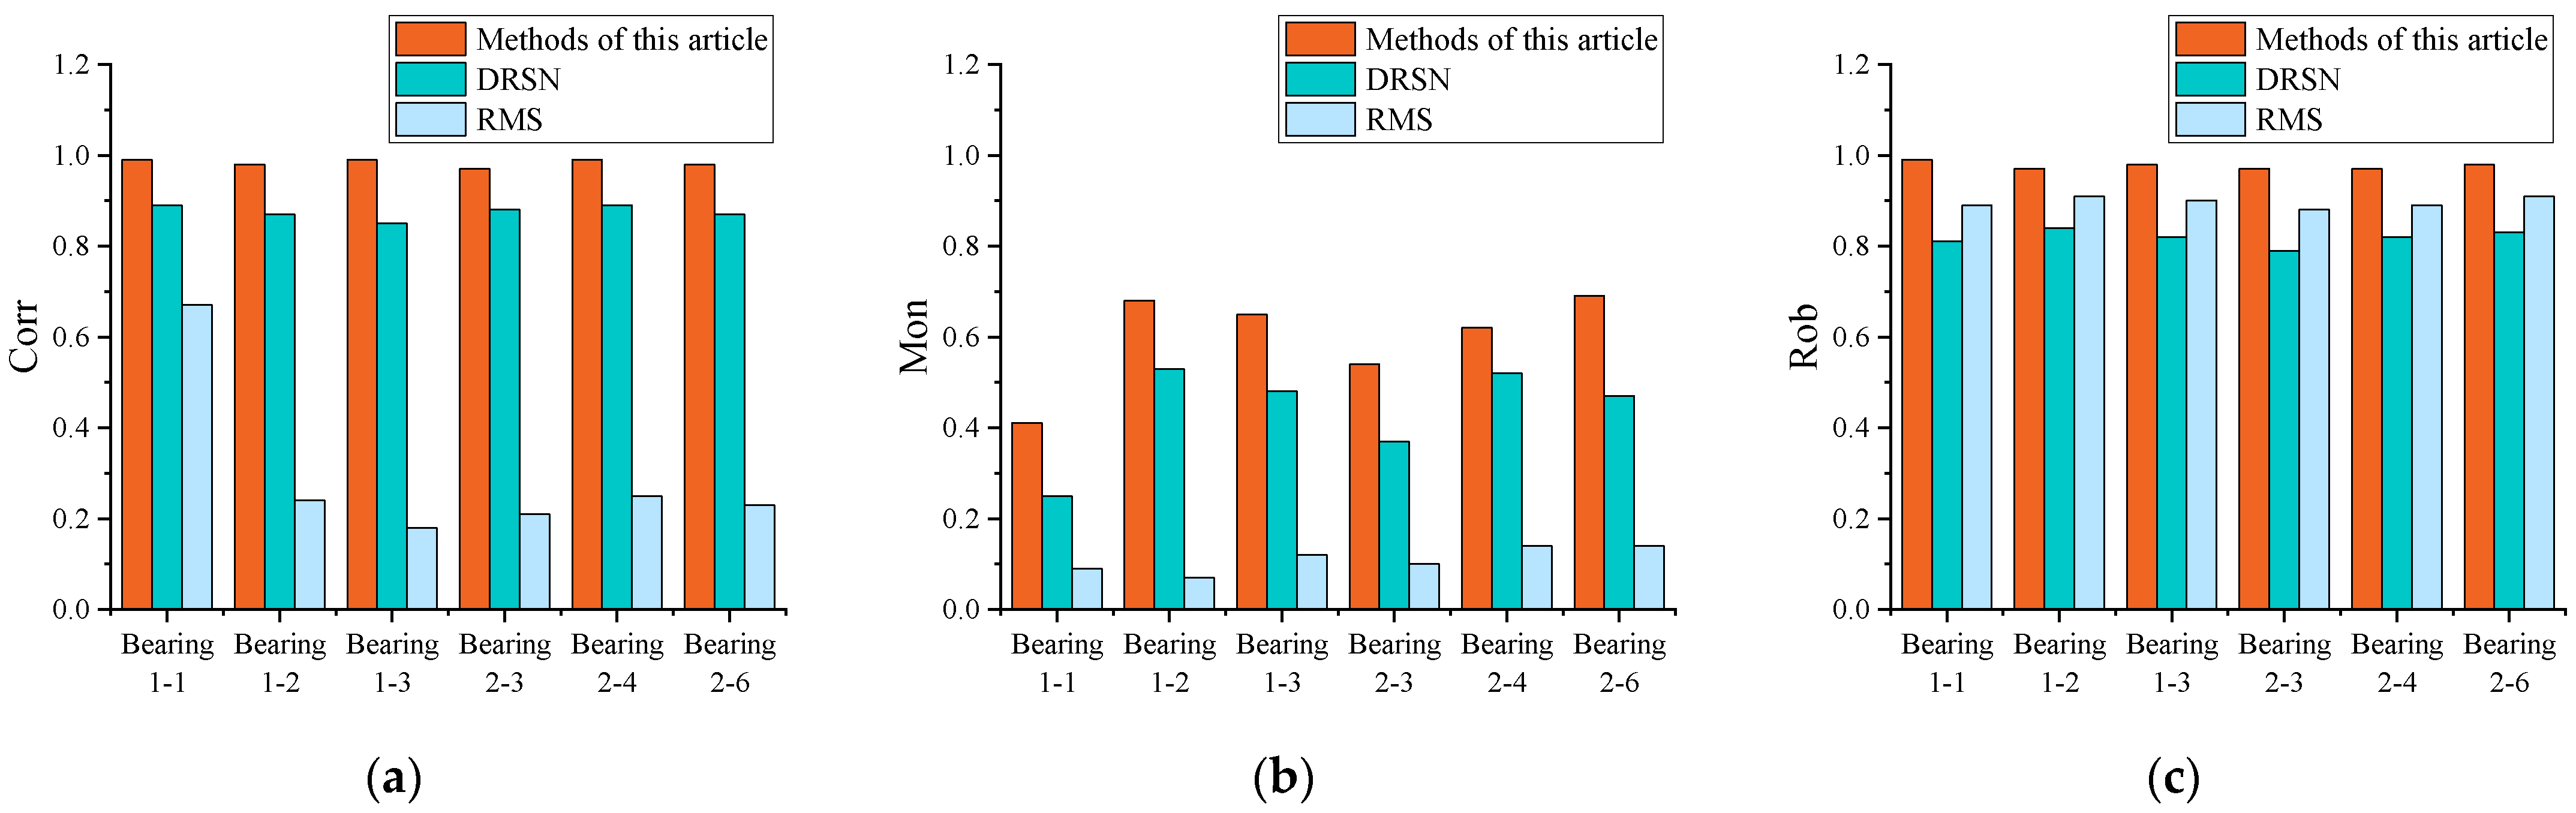
  • The multi-dimensional hybrid gated attention mechanism (MHGAM) employs a spatial-channel parallel network architecture to dynamically allocate multi-dimensional fusion weights. This approach effectively addresses the information loss commonly encountered in traditional feature dimensionality reduction and fusion processes. The health indices generated by the proposed method show substantial enhancements in correlation, monotonicity, and robustness, thereby exhibiting superior comprehensiveness.
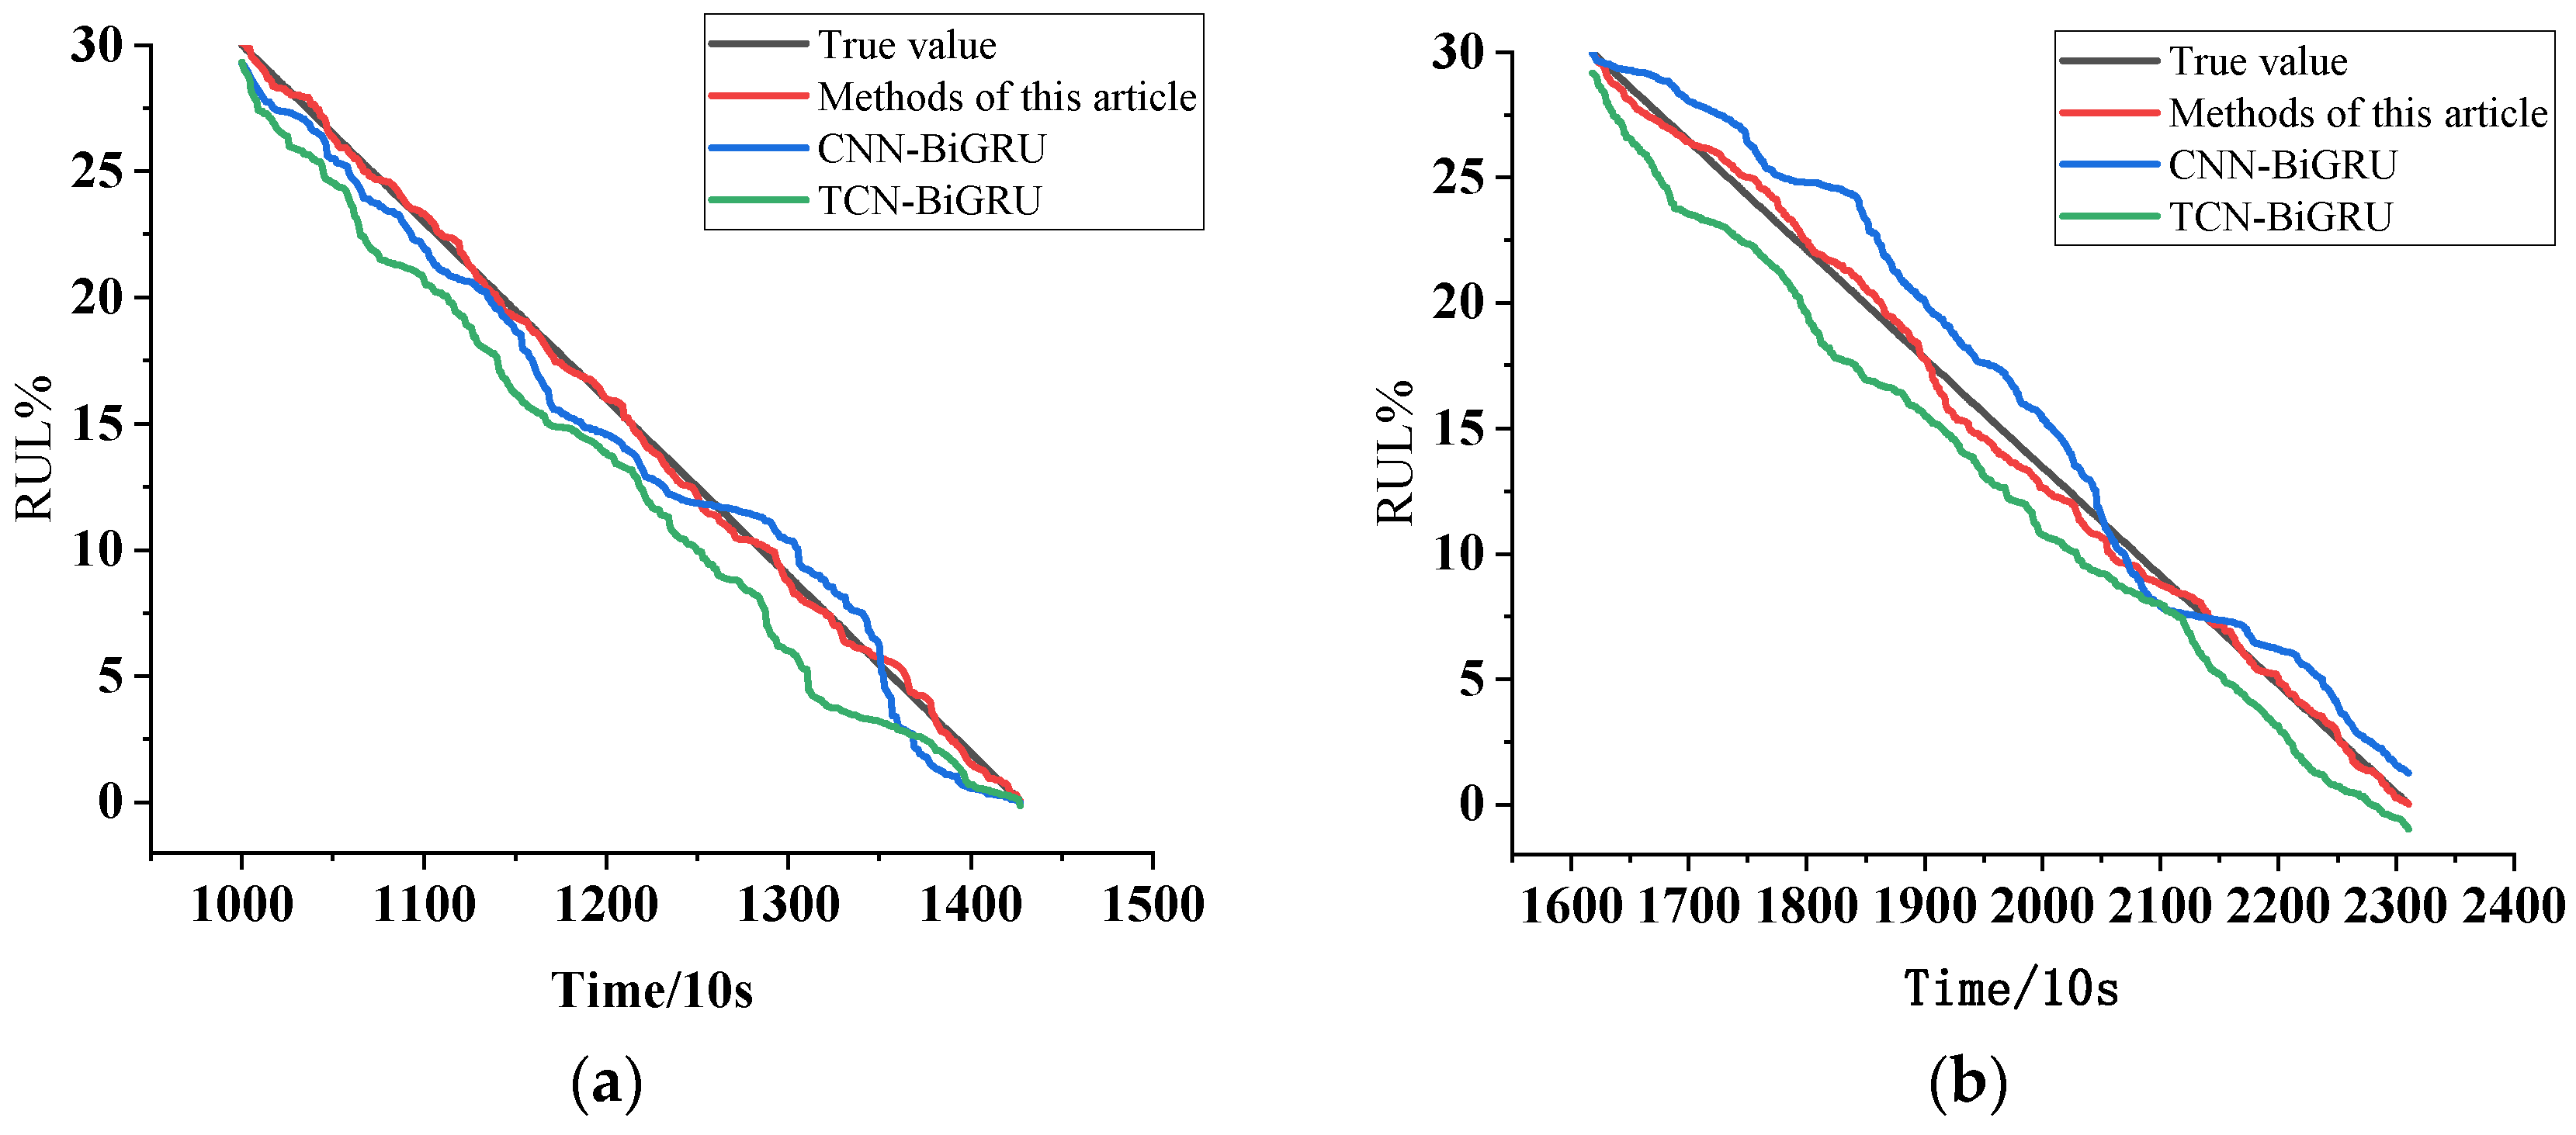
  • Experimental validation conducted on the IEEE PHM 2012 Data Challenge dataset demonstrates that the proposed method achieves reductions of 7.8% in RMSE and 14.6% in MAE compared to the CNN-BiGRU and TCN-BiGRU benchmark models, respectively. In terms of overall prediction performance scores, the proposed method exhibits average improvements of 7.8% and 9.3 percentage points, significantly enhancing prediction accuracy.
  • Validated by engineering test data, the proposed method demonstrates strong robustness and generalization capabilities under varying operating conditions, thereby providing an innovative technical approach for remaining useful life (RUL) prediction.

Author Contributions

Conceptualization, H.W. and A.S.; methodology, H.W. and A.S.; software, H.W.; validation, H.W. and A.S.; formal analysis, H.W.; investigation, A.S.; resources, H.W.; data curation, H.W. and A.S.; writing—original draft preparation, A.S.; writing—review and editing, H.W.; visualization, A.S.; supervision, H.W.; project administration, H.W.; funding acquisition, H.W. All authors have read and agreed to the published version of the manuscript.

Funding

This work was supported by the Ningbo City Unveiled Project (2023T016). This work was supported by the Key Research and Development Program of Ningbo City and the “Unveiling the List and Appointing the Commander” Project (2023Z006).

Institutional Review Board Statement

Not applicable.

Informed Consent Statement

Not applicable.

Data Availability Statement

The data used to support the findings of this study are available from the corresponding author upon request.

Conflicts of Interest

The authors declare no conflicts of interest.

Structured Nomenclature of the Mathematical Symbols

Mathematical symbolStructured nomenclature
F Input feature tensor
C The number of channels for the input feature
H The spatial height dimensions of the feature
W The spatial width dimensions of the feature
F a v g Eigenvectors after global average pooling
σ Sigmoid activation function
X n Input eigenvector for time step n
h i - 1 A hidden state vector of the previous time step (n − 1)
Y n The output result vector for time step n
W n Learnable parameters
W r Reset door parameter matrix
W i Trainable weight matrix
d F Derivative of the feature sequence with respect to the time sequence
X S n Isolated useful signals
X n n Noise signals
X i The i-th sample value of the real signal
X ^ i The i-th sample value of the processed signal

Abbreviations

AbbreviationFull Form
RULremaining useful life
MHGAMmulti-dimensional hybrid gated attention mechanism
IU-Netimproved U-Net
SESqueeze-and-Excitation
Bi-GRUBidirectional Gated Recurrent Unit
Corrcorrelation
Monmonotonicity
Robrobustness
DRSNDeep Residual Shrinkage Network
RMSEroot mean square error
MAEmean absolute error
SNRsignal-to-noise ratio
WGANWasserstein GAN
DCGAN Deep Convolutional GAN

References

  1. Hamadache, M.; Jung, J.H.; Park, J.; Youn, B.D. A comprehensive review of artificial intelligence-based approaches for rolling element bearing PHM: Shallow and deep learning. JMST Adv. 2019, 1, 125–151. [Google Scholar] [CrossRef]
  2. Wang, J.; Xu, Z.; Liu, W.; Wang, Y.; Liu, L. Review of Research on Rolling Bearing Health Intelligent Monitoring and Fault Diagnosis Mechanism. Comput. Sci. Explor. 2024, 18, 878–898. (In Chinese) [Google Scholar]
  3. Shao, X.; Cai, B.; Liu, Y.; Kong, X.; Yang, C.; Fam, H.; Sun, X.; Hao, K. A Remaining Useful Life Prediction Method Based on Multi-Stage Correlation Performance Degradation. In Proceedings of the 19th China Ocean (Coastal) Engineering Academic Symposium (Volume 1); 2019-10-11(Upper Volume). Chinese Society of Ocean Engineering: Ningbo, China, 2019; pp. 349–355. [Google Scholar]
  4. Zeng, D.; Yang, J.; Zou, Y.; Zhang, J.; Song, X. Bearing life prediction method based on parallel mu Iti-channel convolution long short term memory network PMCCNN-LSTM. China Mech. Eng. 2020, 31, 2454–2462, 2471. [Google Scholar]
  5. Xia, T.; Song, Y.; Zheng, Y.; Pan, E.; Xi, L. An ensemble framework based on convolutional bi-directional LSTM with multiple time windows for remaining useful life estimation. Comput. Ind. 2019, 115, 103182. [Google Scholar] [CrossRef]
  6. Song, X.; Zhou, Z.; Liu, L.; Chen, K. A method for predicting the remaining service life of rolling bearings based on Transformer model. J. Beijing Univ. Aeronaut. Astronaut. 2023, 49, 430–433. [Google Scholar]
  7. Luo, X.; Wang, M. Bearing Lifespan Reliability Prediction Method Based on Multiscale Feature Extraction and Dual Attention Mechanism. Appl. Sci. 2025, 15, 3662. [Google Scholar] [CrossRef]
  8. Sun, B.; Hu, W.; Wang, H.; Wang, L.; Deng, C. Remaining Useful Life Prediction of Rolling Bearings Based on CBAM-CNN-LSTM. Sensors 2025, 25, 554. [Google Scholar] [CrossRef]
  9. Li, M.; Pan, N.; Duan, Y.; Cao, X. Health Index Construction and Condition Assessment of Coal Mine Rotating Machinery. Ind. Mine Autom. 2022, 48, 33–41. [Google Scholar] [CrossRef]
  10. Gao, X.; Wang, H.; Zhao, Z.; Tian, J.; Zhang, F.; Wang, C. Prediction of Bearing Remaining Useful Life Based on CNN and Gated Recurrent Unit. In Proceedings of the 2023 Global Reliability and Prognostics and Health Management Conference (PHM-Hangzhou), Hangzhou, China, 12–15 October 2023; IEEE: Los Alamitos, CA, USA, 2023; pp. 1–7. [Google Scholar]
  11. Yao, D.; Li, B.; Liu, H.; Yao, J.; Pi, Y. Remaining Useful Life Prediction for Rolling Bearings Based on Attention-Based GRU Algorithm. Vib. Shock. 2021, 40, 116–123. [Google Scholar] [CrossRef]
  12. Qu, Q.; Wei, Q.; Wang, Y.; Liu, Y. Remaining Useful Life Prediction of Rolling Bearings Based on Deep Time–Frequency Synergistic Memory Neural Network. Coatings 2025, 15, 406. [Google Scholar] [CrossRef]
  13. Mao, W.; Liu, K.; Zhang, Y.; Liang, X.; Wang, Z. Self-supervised deep tensor domain-adversarial regression adaptation for online remaining useful life prediction across machines. IEEE Trans. Instrum. Meas. 2023, 72, 2509916. [Google Scholar] [CrossRef]
  14. Ronneberger, O.; Fischer, P.; Brox, T. U-Net: Convolutional networks for biomedical image segmentation. In Proceedings of the 18th International Conference on Medical Image Computing and Computer-Assisted Intervention (MICCAI), Munich, Germany, 5–9 October 2015; pp. 234–241. [Google Scholar]
  15. Fan, C.; Zhang, Y.; Ma, H.; Yu, K.; Ma, Z. A novel lightweight DDPM-based data augmentation method for rotating machinery fault diagnosis with small sample. Mech. Syst. Signal Process. 2025, 232, 112741. [Google Scholar] [CrossRef]
  16. Huang, Z.; Zhong, W.; An, R.; Wu, J.; Zhang, Z. A Novel Relay Protection Fault Diagnosis Method for Power Distribution Systems Based on Improved Attention-Gated Recurrent Unit. Tech. Autom. Appl. 2024, 1–9. Available online: http://kns.cnki.net/kcms/detail/23.1474.tp.20241223.1528.147.html (accessed on 17 May 2025).
  17. Lyu, Y.; Qiu, Q.; Chu, Y.; Zhang, J. An Adaptive BiGRU-ASSA-iTransformer Method for Remaining Useful Life Prediction of Bearing in Aerospace Manufacturing. Actuators 2025, 14, 238. [Google Scholar] [CrossRef]
  18. Xu, J.; Shen, Y. Bearing Remaining Useful Life Prediction Method Based on ARN and BiLSTM. Noise Vib. Control. 2024, 44, 136–142, 255. [Google Scholar]
  19. Wang, H.; Chen, P.; Zhang, W.; Wu, S.; Ma, Y. BWO-BiLSTM based staged life prediction method for rolling bearings. Bearing 2025, 1–9. Available online: http://kns.cnki.net/kcms/detail/41.1148.th.20250226.1214.010.html (accessed on 17 May 2025).
  20. Hodson, T. Root mean square error (RMSE) or mean absolute error (MAE): When to use them or not. Geosci. Model Dev. Discuss. 2022, 15, 5481–5487. [Google Scholar] [CrossRef]
  21. Nectoux, P.; Gouriveau, R.; Medjaher, K.; Ramasso, E.; Chebel-Morello, B.; Zerhouni, N.; Varnier, C. PRONOSTIA: An experimental platform for bearings accelerated degradation tests. In Proceedings of the IEEE International Conference on Prognostics and Health Management, Denver, CO, USA, 18–21 June 2012. [Google Scholar]
  22. Li, Y.; Zou, W.; Jiang, L. Fault diagnosis of rotating machinery based on combination of Wasserstein generative adversarial networks and long short term memory fully convolutional network. Measurement 2022, 191, 110826. [Google Scholar] [CrossRef]
  23. Zhou, K.; Diehl, E.; Tang, J. Deep convolutional generative adversarial network with semi-supervised learning enabled physics elucidation for extended gear fault diagnosis under data limitations. Mech. Syst. Signal Process. 2023, 185, 109772. [Google Scholar] [CrossRef]
  24. Medjaher, K.; Zerhouni, N.; Baklouti, J. Data-driven prognostics based on health indicator construction:application to PRONOSTIA′s data. In Proceedings of the 2013 European Control Conference, Zurich, Switzerland, 17–19 July 2013; pp. 1451–1456. [Google Scholar]
  25. Dabov, K.; Foi, A.; Katkovnik, V.; Egiazarian, K. Image denoising by sparse 3-d transform-domain collaborative filtering. IEEE Trans. Image Process 2007, 16, 2080–2095. [Google Scholar] [CrossRef]
  26. Niu, Q.; Sui, Z.; Han, J.; Zhao, Y. An Industrial Robot Gearbox Fault Diagnosis Approach Using Multi-Scale Empirical Mode Decomposition and a One-Dimensional Convolutional Neural Network-Bidirectional Gated Recurrent Unit Method. Processes 2025, 13, 1722. [Google Scholar] [CrossRef]
  27. Cheng, Y.W.; Hu, K.; Wu, J.; Zhu, H.; Shao, X. A convolutional neural network based degradation indicator construction and health prognosis using bidirectional long short-term memory network for rolling bearings. Adv. Eng. Inform. 2021, 48, 101247. [Google Scholar] [CrossRef]
  28. Liu, Y.; Wang, S.; Liu, J.; Ma, Y. Bearing remaining useful life prediction based on TCN-SA and Bi-GRU. Comput. Integr. Manuf. Syst. 2024, 1–11. [Google Scholar] [CrossRef]
  29. Zhang, C.; Zhang, C.; Li, J.; Xu, L.; Gao, F. Rolling bearing fault diagnosis method based on TCN-BiGRU-Attention. In Proceedings of the 2024 3rd International Conference on Electronics and Information Technology (EIT), Chengdu, China, 20–22 September 2024. [Google Scholar]
Figure 1. Structural diagram of the improved U-Net model.
Applsci 15 07166 g001
Figure 2. Structural diagram of the multi-dimensional hybrid gated attention mechanism.
Applsci 15 07166 g002
Figure 3. Bi-GRU architecture diagram.
Applsci 15 07166 g003
Figure 4. Input and output of the processed signal. (a) Time-domain signal; (b) frequency-domain signal.
Applsci 15 07166 g004
Figure 5. Overall methodology framework diagram.
Applsci 15 07166 g005
Figure 6. Feature set. Black (peak value); Red (variance); Blue (waveform factor); Pink (kurtosis); Green (RMS value); Magenta (root amplitude).
Applsci 15 07166 g006
Figure 7. PRONOSTIA platform.
Applsci 15 07166 g007
Figure 8. The time-domain processing results of Bearing 1-4.
Applsci 15 07166 g008
Figure 9. The frequency-domain processing results of Bearing 1-4.
Applsci 15 07166 g009
Figure 10. The time-domain processing results of Bearing 2-5.
Applsci 15 07166 g010
Figure 11. The frequency-domain processing results of Bearing 2-5.
Applsci 15 07166 g011
Figure 12. DRSN health indicator. (a) Bearings 1-1, 1-2, and 1-3; (b) Bearings 2-3, 2-4, and 2-6.
Applsci 15 07166 g012
Figure 13. RMS health indicator. (a) Bearings 1-1, 1-2, and 1-3; (b) Bearings 2-3, 2-4, and 2-6.
Applsci 15 07166 g013
Figure 14. The health indicator method proposed in this paper. (a) Bearings 1-1, 1-2, and 1-3; (b) Bearings 2-3, 2-4, and 2-6.
Applsci 15 07166 g014
Figure 15. Performance comparison of health indicators/%. (a) Correlation; (b) monotonicity; (c) robustness.
Applsci 15 07166 g015
Figure 16. RUL prediction results. (a) Bearing 1-4; (b) Bearing 2-5.
Applsci 15 07166 g016
Figure 17. Bearing life testing machine.
Applsci 15 07166 g017
Figure 18. RUL prediction results. (a) Bearing 4-A; (b) Bearing 4-B.
Applsci 15 07166 g018
Table 1. Rolling bearing dataset description.
Operating Condition NumberRotational Speed (r/min)Radial Force/NBearing Serial Number
118004000bearing 1-1~bearing 1-7
216504200bearing 2-1~bearing 2-7
315005000bearing 3-1~bearing 3-7
Table 2. Signal-related information.
Bearing Data Serial NumberNumber of Signal Data PointsSampling IntervalSampling FrequencyDuration of Each Sampling
Bearing 1-4142710/s25.6 kHz0.1 s
Bearing 2-5231110/s25.6 kHz0.1 s
Table 3. Evaluation results of Bearing 1-4 generated by different models.
Model RMSESNR
WGANAverage0.28347.8342
DCGANAverage0.24739.5436
the method proposed in this paperAverage0.192411.4725
Table 4. Evaluation results of Bearing 2-5 generated by different models.
Model RMSESNR
WGANAverage0.31459.4523
DCGANAverage0.258510.4578
the method proposed in this paperAverage0.204611.3258
Table 5. Parameter settings for the Health Indicator Construction Module.
Model LayerParameterOutput Size
Gated Recurrent UnitNumber of layers: 3; Input dimension: 16; Hidden state size: 64128 × 128 × 128
Self-Attention MechanismInput dimension: 128; Number of attention heads: 8128 × 128
Relu/1024 × 128
Dropout0.21024 × 128
Full Connection/1024 × 128
Table 6. Data allocation.
Bearing NumberNumber of SamplesTraining DataValidation Data
1-414281000428
2-523111618693
Table 7. Comparison of life prediction results by different methods.
Test BearingsMethods of This ArticleCNN-BiGRUTCN-BiGRU
RMSEMAEScoreRMSEMAEScoreRMSEMAEScore
1-40.04790.02360.890.05630.03450.820.05680.03120.83
1-50.05660.02450.810.06320.03090.740.07120.03520.71
1-60.04980.01760.920.06640.02540.810.06520.02180.79
2-20.04080.01770.90.04860.01890.860.04970.01980.82
2-50.05230.02810.830.07510.02960.710.06340.02880.72
2-70.0550.03220.850.06340.04210.740.06210.03810.75
Mean0.05040.02390.8670.06220.03020.780.06140.02920.77
Table 8. Computational resource consumption comparison across methods.
MethodEpochNumber of Parameters (M)
CNN-BiGRU46 ± 0.8 s2.91
TCN-BiGRU65 ± 1.3 s3.89
Methods of this article52 ± 0.7 s3.03
Table 9. Comparison of life prediction results by different methods.
Test BearingsMethods of This ArticleCNN-BiGRUTCN-BiGRU
RMSEMAEScoreRMSEMAEScoreRMSEMAEScore
4-A0.06840.04720.840.07450.05780.790.07860.05640.77
4-B0.07310.05540.820.07890.06240.750.07670.06580.74
Mean0.07080.05130.830.07670.06010.770.07770.06110.755
Disclaimer/Publisher’s Note: The statements, opinions and data contained in all publications are solely those of the individual author(s) and contributor(s) and not of MDPI and/or the editor(s). MDPI and/or the editor(s) disclaim responsibility for any injury to people or property resulting from any ideas, methods, instructions or products referred to in the content.

