Article

Performance Prediction and Optimization of High-Plasticity Clay Lime–Cement Stabilization Based on Principal Component Analysis and Principal Component Regression

by
Ibrahim Haruna Umar
1,2,
Zaharaddeen Ali Tarauni
3,
Abdullahi Balarabe Bello
4,
Hang Lin
1,*,
Jubril Izge Hassan
5 and
Rihong Cao
1,*
1
School of Resources and Safety Engineering, Central South University, Changsha 410083, China
2
Department of Civil Engineering, Faculty of Engineering, Aliko Dangote University of Science and Technology, Wudil 713101, Nigeria
3
Department of Computer Engineering, Faculty of Engineering, Bayero University Kano, Kano 700241, Nigeria
4
Department of Civil Engineering, Faculty of Engineering, Bayero University Kano, Kano 700241, Nigeria
5
Department of Geology, Faculty of Physical Sciences, Ahmadu Bello University Zaria, Zaria 810211, Nigeria
*
Authors to whom correspondence should be addressed.
Appl. Sci. 2025, 15(13), 7150; https://doi.org/10.3390/app15137150
Submission received: 26 April 2025 / Revised: 22 June 2025 / Accepted: 22 June 2025 / Published: 25 June 2025
(This article belongs to the Section Civil Engineering)

Abstract

High-plasticity clay soils pose significant challenges in geotechnical engineering due to their poor mechanical properties, such as low strength and high compressibility. Lime–cement stabilization offers a sustainable solution, but optimizing additive proportions requires advanced analytical approaches to decipher complex soil-stabilizer interactions. This study investigates the stabilization of high-plasticity clay soil (CH) sourced from Kano, Nigeria, using lime (0–30%) and cement (0–8%) for thirty (30) sample combinations to optimize consolidation and strength properties. Geotechnical laboratory tests (consolidation and UCS) were evaluated per ASTM standards. Multivariate analysis integrated principal component analysis (PCA) with regression modeling (PCR) for sensitivity and causality assessment. Optimal stabilization (15% lime + 6% cement) significantly improved soil properties: void ratio reduced by 58% (0.60→0.25), porosity by 49.5% (0.38→0.19), UCS increased by 222.5% to 2670 kPa (28 days), preconsolidation stress by 206% (355.63→1088.92 kPa), and compressibility modulus by 16% (7048→10,474.28 kPa). PCR sensitivity analysis attributed 46% of UCS variance to PC1 (compressibility parameters: void ratio, porosity, compression index; β = 0.72). PCR Causality analysis shows improvment with curing (R2: 68.7% at 7 days→83.0% at 28 days; RMSE: 11.2→7.8 kPa). PCR establishes compressibility reduction as the dominant causal mechanism for strength gain, providing a robust framework for dosage optimization beyond empirical approaches.

1. Introduction

Geotechnical engineers frequently encounter challenges when dealing with high-plasticity clay soils, known for their poor mechanical properties, including low strength, high compressibility, and pronounced volume changes [1]. These characteristics can lead to significant issues in construction and infrastructure projects, such as excessive settlement, instability, and reduced bearing capacity [2]. Soil stabilization techniques have become increasingly important in geotechnical engineering practice to address these challenges. Among various stabilization methods, lime and cement as admixtures have gained widespread attention due to their effectiveness in improving soil properties [3]. Lime–cement stabilization can enhance the strength, reduce compressibility, and increase the durability of problematic soils [2]. However, determining the optimal proportions of lime and cement for specific soil types remains a complex task, often requiring extensive laboratory testing and field trials. Soil stabilization techniques play a crucial role in sustainable infrastructure development. By minimizing the need for costly soil replacement or deep foundations, lime–cement stabilization contributes to resource conservation and environmental protection [4]. The study’s findings provide insights into the eco-friendly use of lime and cement, promoting efficient soil utilization.
The traditional approach to soil stabilization has relied predominantly on univariate analysis methods that examine relationships between individual parameters while holding others constant. Such approaches, however, fail to capture the multidimensional interactions characteristic of chemically stabilized soil systems [3]. The inherent complexity of these interactions necessitates more sophisticated multivariate analytical frameworks capable of elucidating the interdependencies among soil properties and their collective influence on mechanical performance. PCA and PCR offer powerful statistical tools to address these analytical challenges. PCA reduces the dimensionality of multivariate datasets by transforming potentially correlated variables into uncorrelated principal components that capture the essential variance structure of the original data [5]. PCR extends this transformation by utilizing these principal components as predictors in regression modeling, effectively addressing multicollinearity issues while providing insights into the underlying causal mechanisms [6]. These techniques have been successfully applied in various geotechnical applications, including landslide susceptibility assessment and soil classification, but their application to chemical soil stabilization remains limited.
The application of PCR for sensitivity and causality analysis in this study represents a methodological advancement in understanding soil-stabilizer interactions. These analyses bridge traditional empirical approaches with data-driven modeling, enabling the optimization of stabilizer dosages while minimizing experimental trial-and-error. By isolating causal relationships from correlated variables, this approach advances the design of sustainable soil improvement strategies, ensuring resource efficiency and alignment with infrastructure durability requirements. The findings establish PCR as a versatile tool for decoding complex soil-chemical interactions, with broader applicability to geotechnical systems involving multifactorial variables.
The integration of artificial intelligence (AI) into dynamic mechanical geotechnical applications has enabled sophisticated modeling of time-dependent soil behavior, nonlinear interactions, and complex multivariate systems [7]. Recent studies highlight AI’s capacity to address challenges in predicting and optimizing soil stabilization, consolidation, and strength progression under varying environmental and loading conditions [8]. Dynamic mechanical behavior, for example, research by Malashin, Tynchenko [9] applied long short-term memory (LSTM) networks to predict UCS in GGBS-stabilized soils, capturing temporal lag effects and hydration kinetics with 95% accuracy. Similarly, functional PCA (FPCA) was used to analyze seasonal temperature effects on frozen soil strength, revealing time-dependent relationships between porosity and compressibility [10]. The current study’s PCR framework corroborates these findings, showing that lime–cement interactions reduce void ratio and porosity over 28 days, with compressibility parameters dominating variance at later curing stages. This mirrors trends in slag-cement systems, where prolonged curing enhances microstructural densification. Alnaser K Ahmed, Hossein Vakili [11] applied convolutional neural networks (CNNs) to SEM images of cement-stabilized clays, correlating pore geometry with compressibility modulus improvements [12]. Topological data analysis (TDA) mapped persistent homology features in GGBS-treated soils, linking microstructural stability to pre-consolidation stress [13]. These studies highlight the need for integrating imaging data into AI models, a direction the current work’s PCR framework could expand by incorporating XRD or SEM-derived metrics to enhance predictive granularity.
AI models increasingly incorporate uncertainty quantification (UQ) to address variability in geotechnical systems. Polynomial chaos expansions (PCE) and Bayesian networks have been used to model moisture-induced UCS variability, explaining 32% of predictive variance in lime-treated soils [14]. While nonlinear models like ANNs report higher accuracy, they obscure mechanistic pathways. PCR, however, explicitly traces relationships between stabilizer content and UCS, as seen in the current study’s identification of PC1’s inverse correlation with void ratio and porosity. This interpretability is critical for translating lab findings to field applications, a challenge noted in studies using “black-box”. Multiscale modeling frameworks integrating macro- and micro-level data are gaining traction. Nguyen et al. developed physics-informed neural networks (PINNs) to simulate lime–cement stabilization, embedding Terzaghi’s consolidation theory into ML architectures to enhance accuracy [15]. Despite significant advancements, conventional analytical approaches have generally failed to elucidate the underlying causal mechanisms governing strength development in stabilized soils. The complex interdependencies among void ratio, porosity, compression characteristics, and strength parameters necessitate more sophisticated analytical frameworks capable of extracting meaningful patterns from multidimensional datasets.
This study aims to investigate the stabilization of high-plasticity clay soil using various combinations of lime (0–30%) and cement (0–8%) to optimize consolidation and strength properties. Through the integration of experimental testing and multivariate statistical analysis, we seek to: (1) characterize the effects of lime–cement combinations on key geotechnical parameters including void ratio, porosity, compression index, pre-consolidation stress, and unconfined compressive strength (UCS); (2) employ PCA to identify the principal components that capture the essential variance in these parameters; and (3) quantify the relative influence of soil properties on UCS through PCR sensitivity and causality analyses. Optimal stabilization (15% lime + 6% cement) yielded UCS increase, void ratio reduction, and higher pre-consolidation stress and compressibility modulus. PCR identified compressibility parameters (void ratio, porosity, compression index) as explaining 46% of UCS variance.

2. Materials and Method

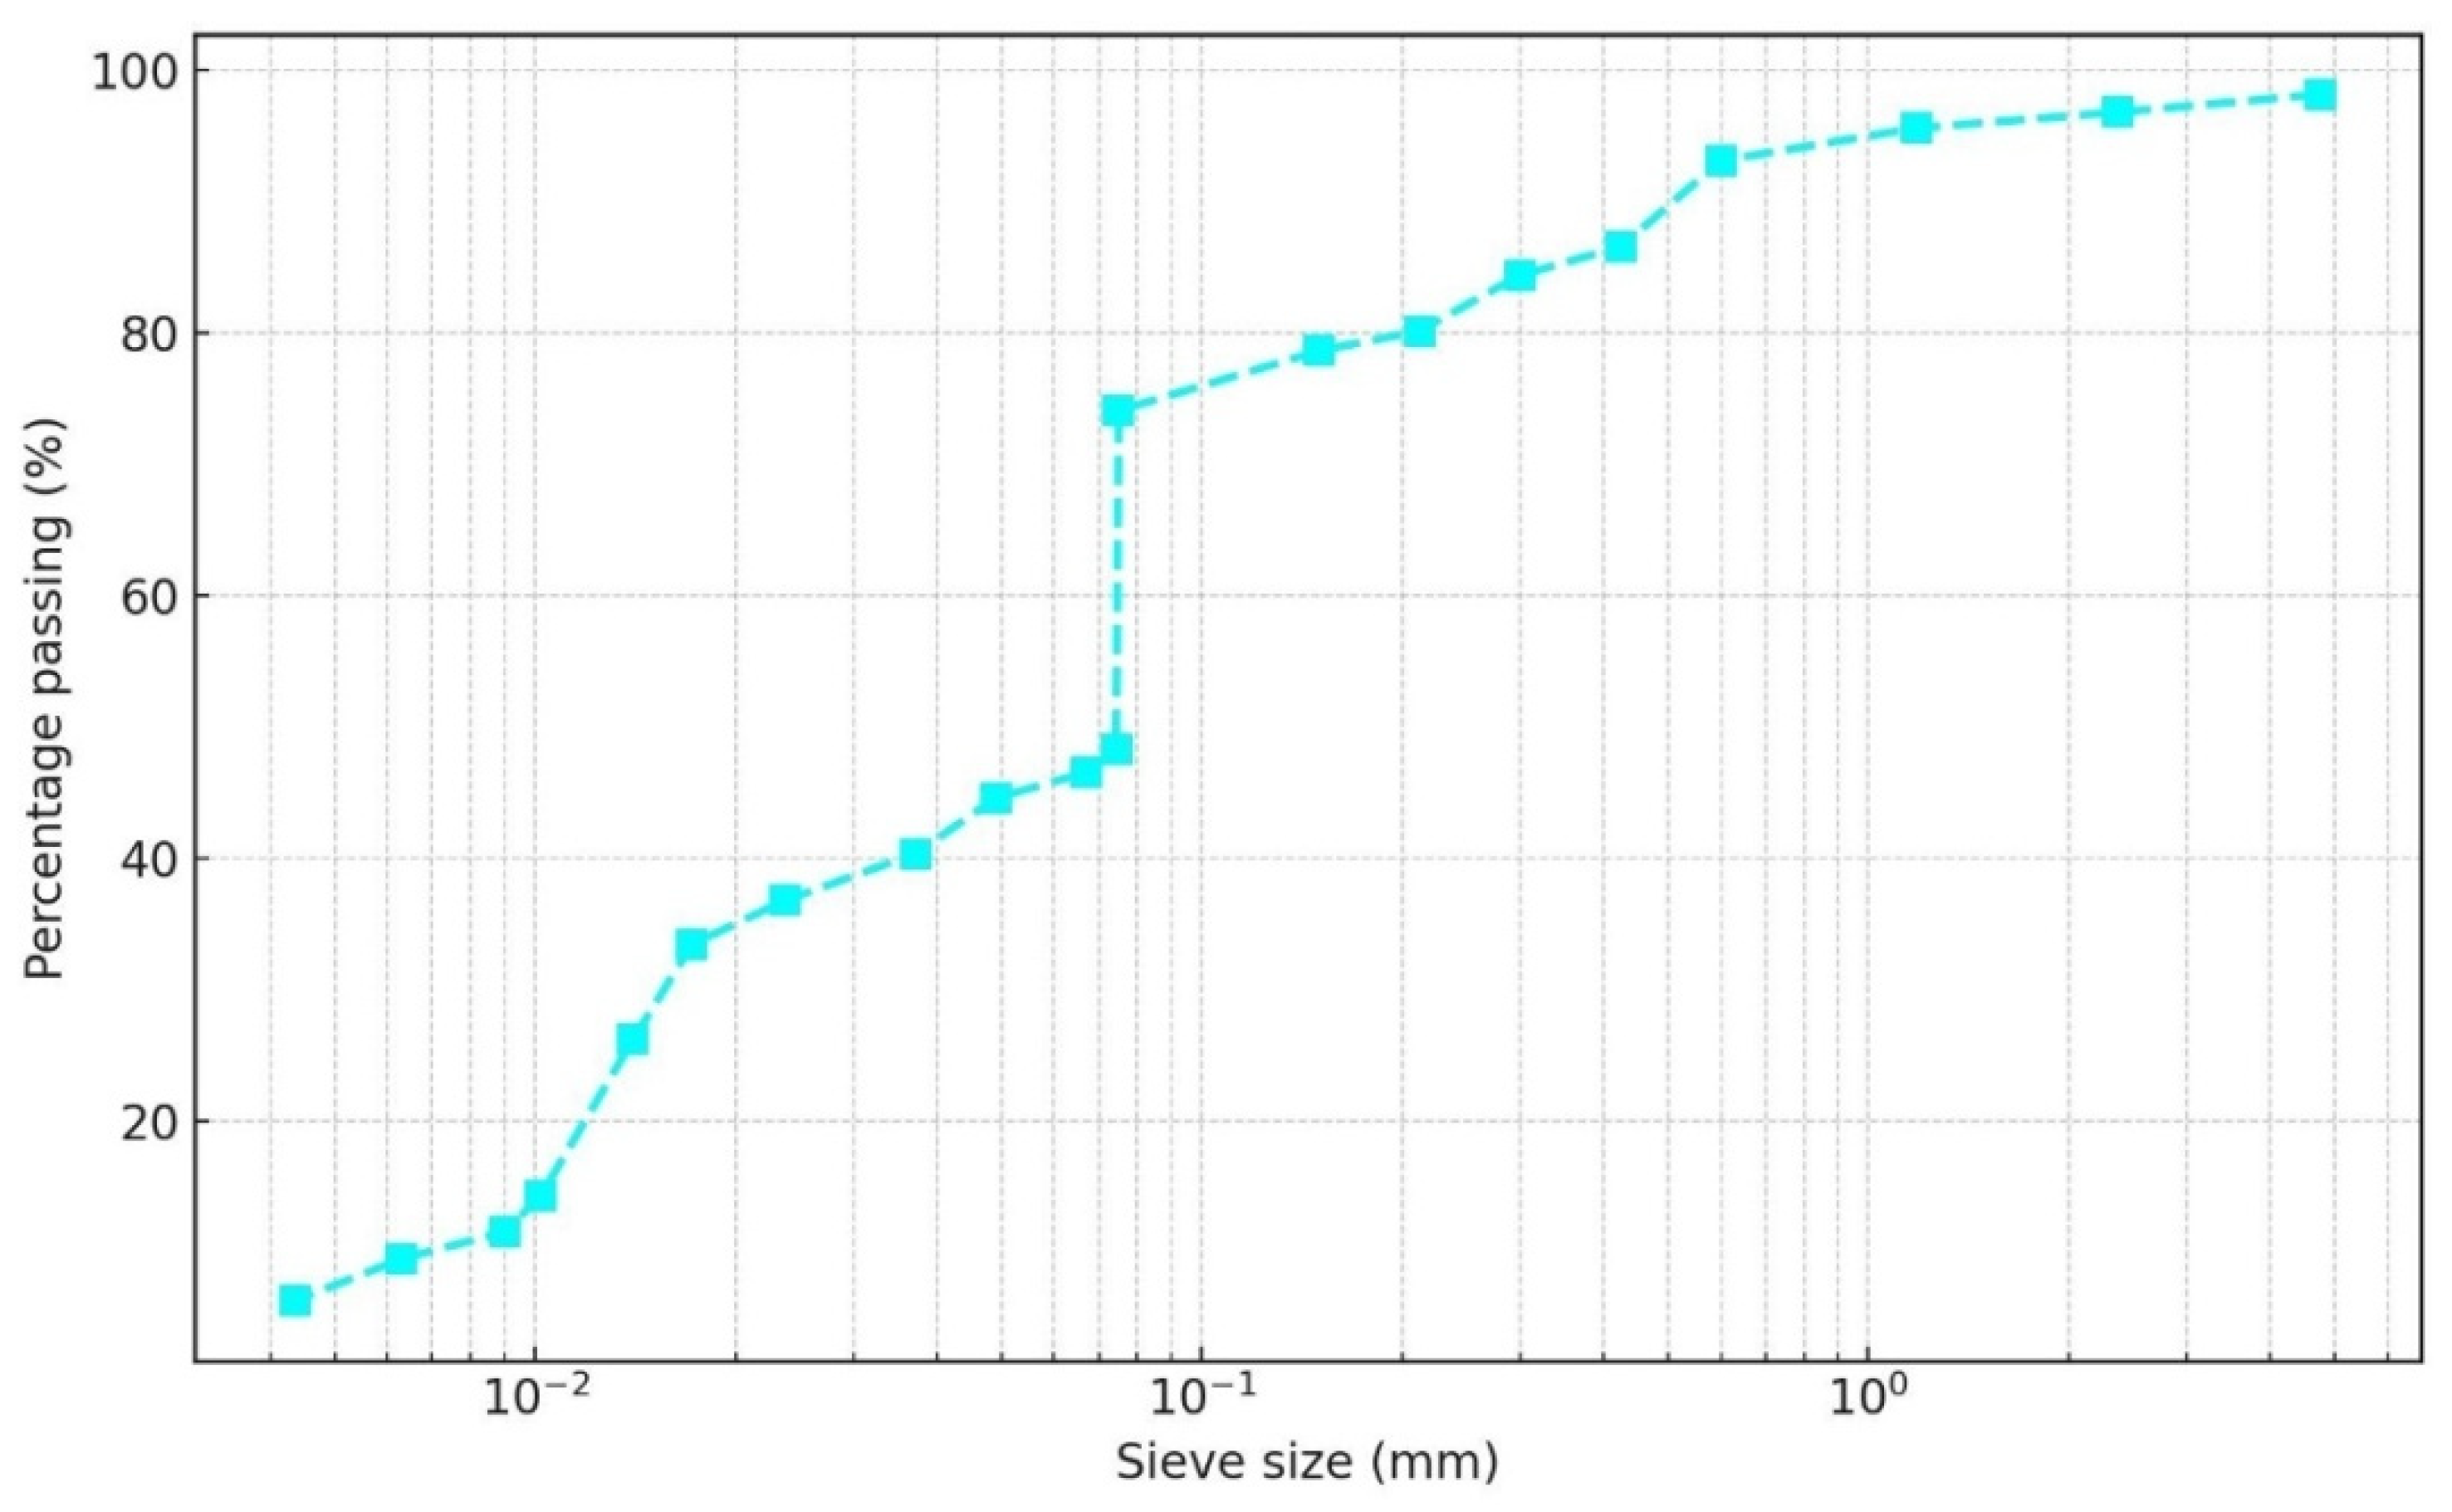
2.1. Specimen Preparation
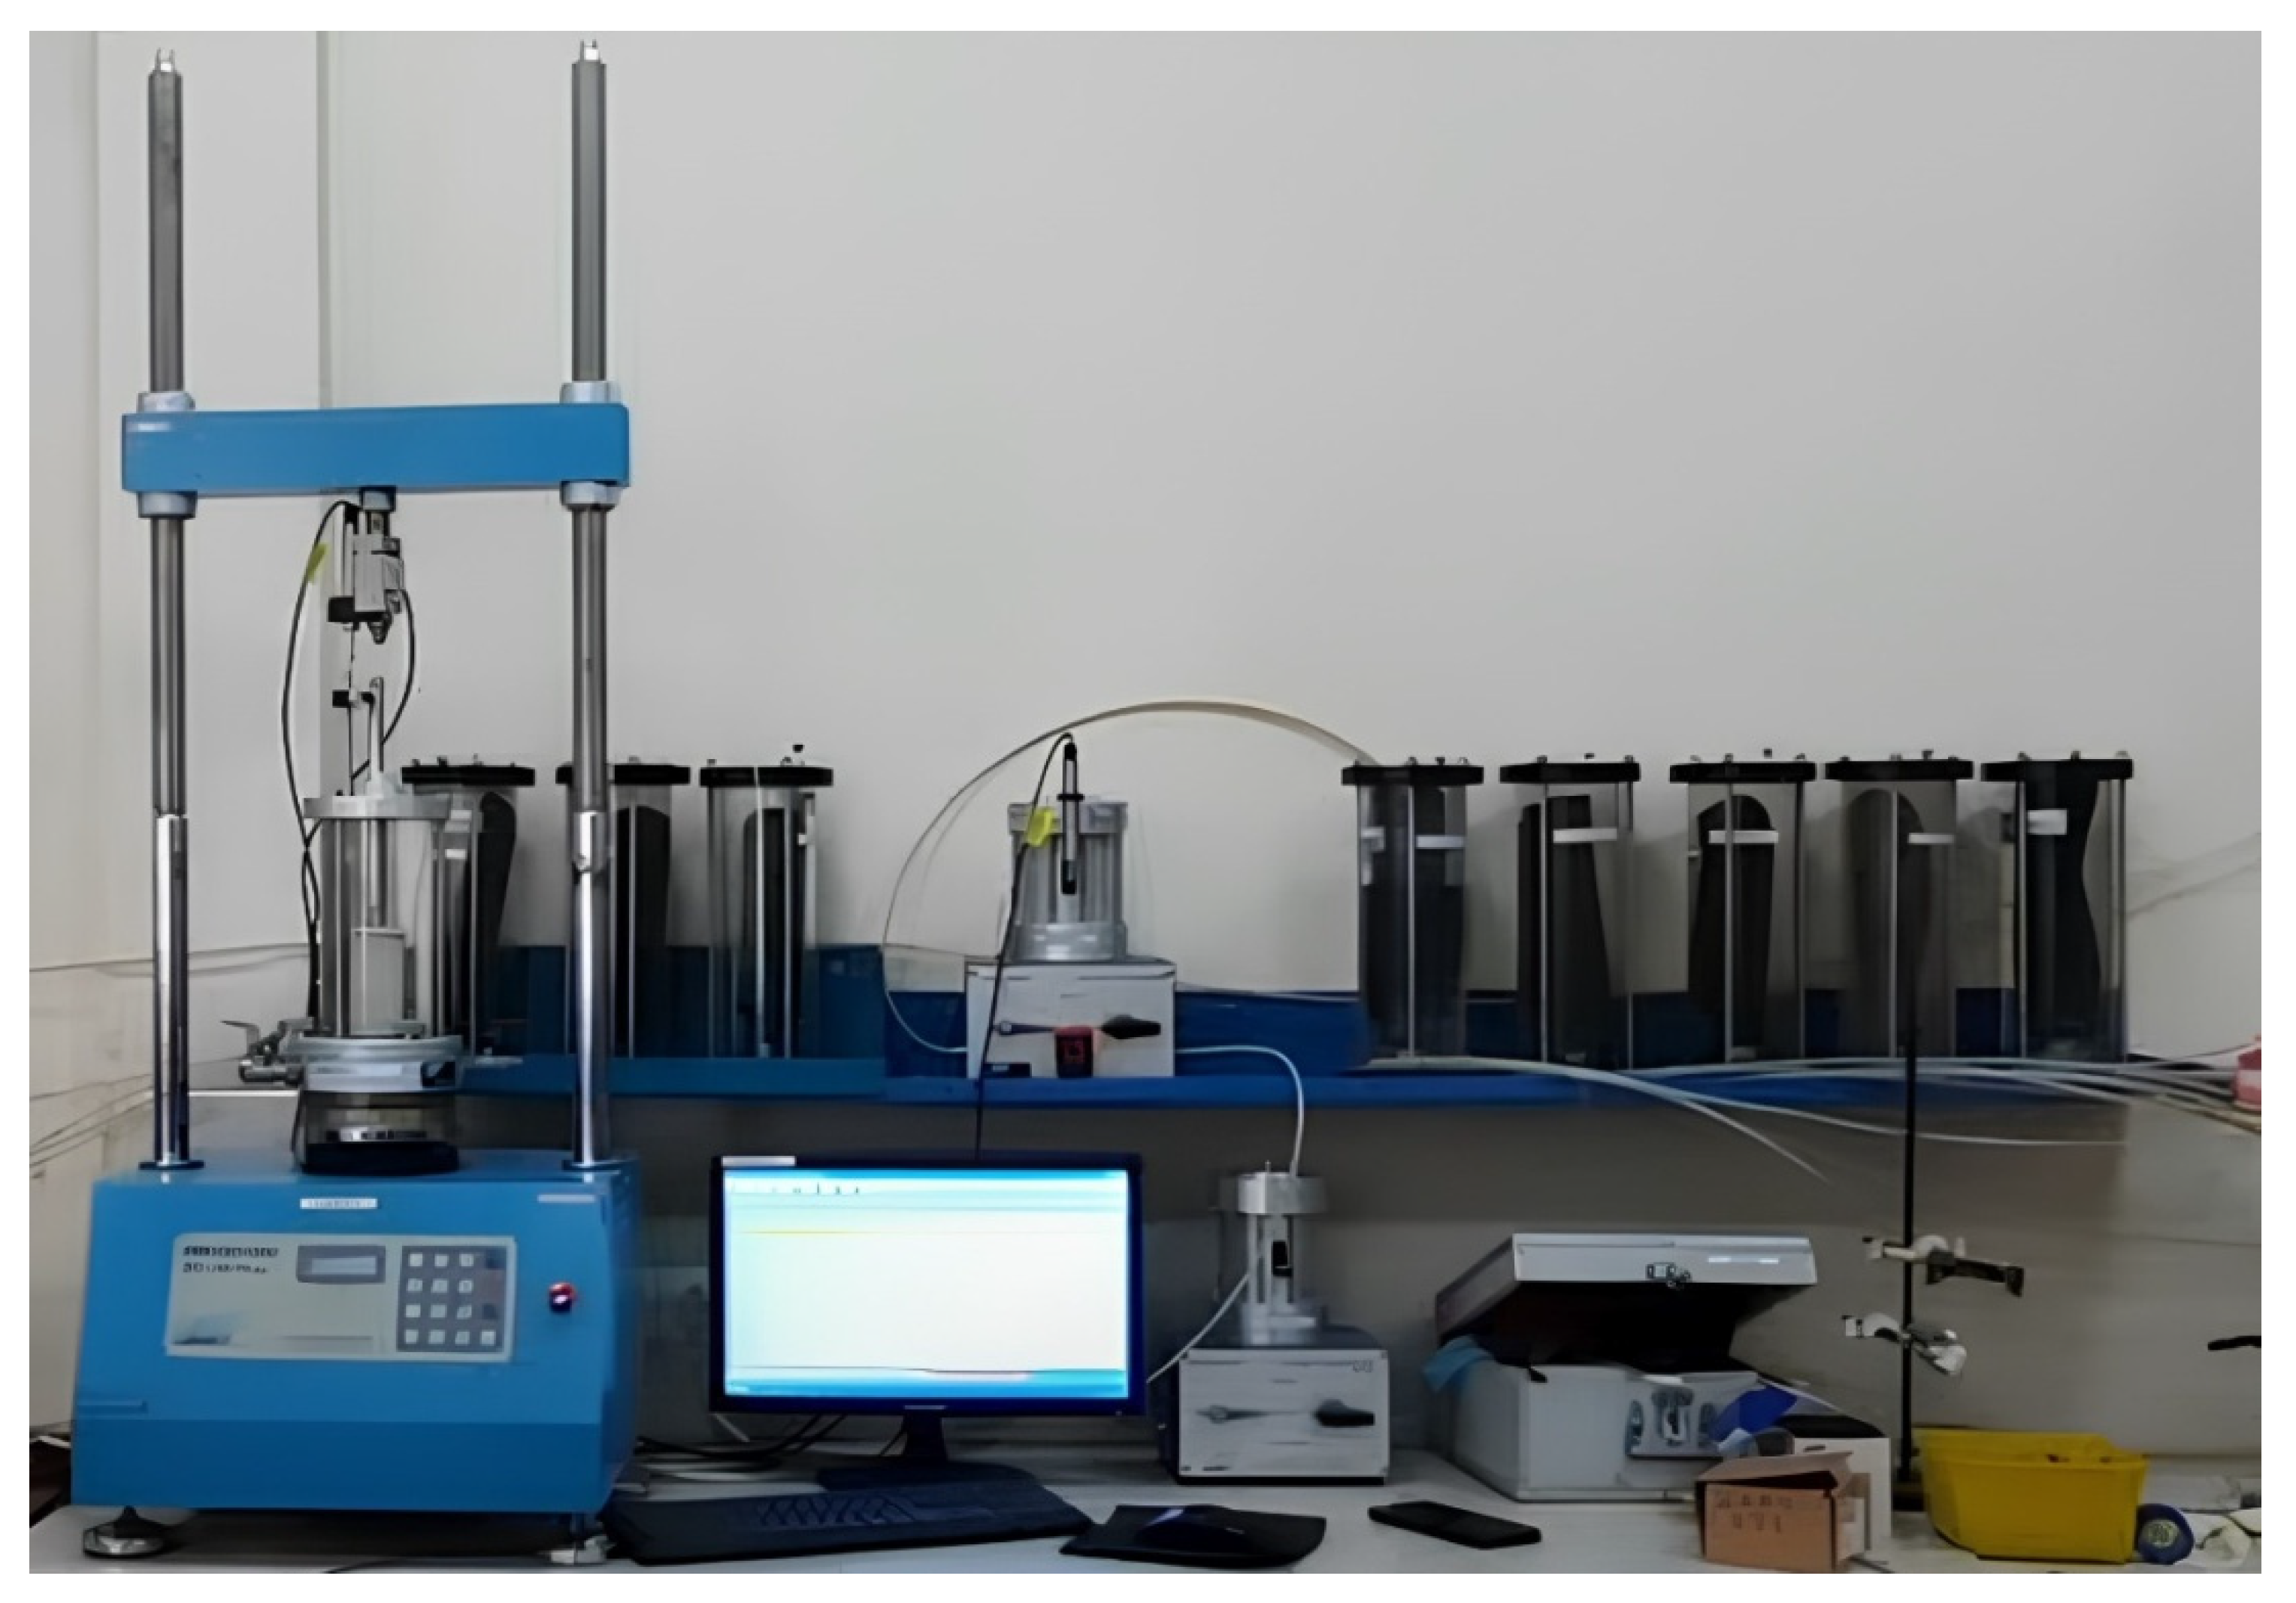
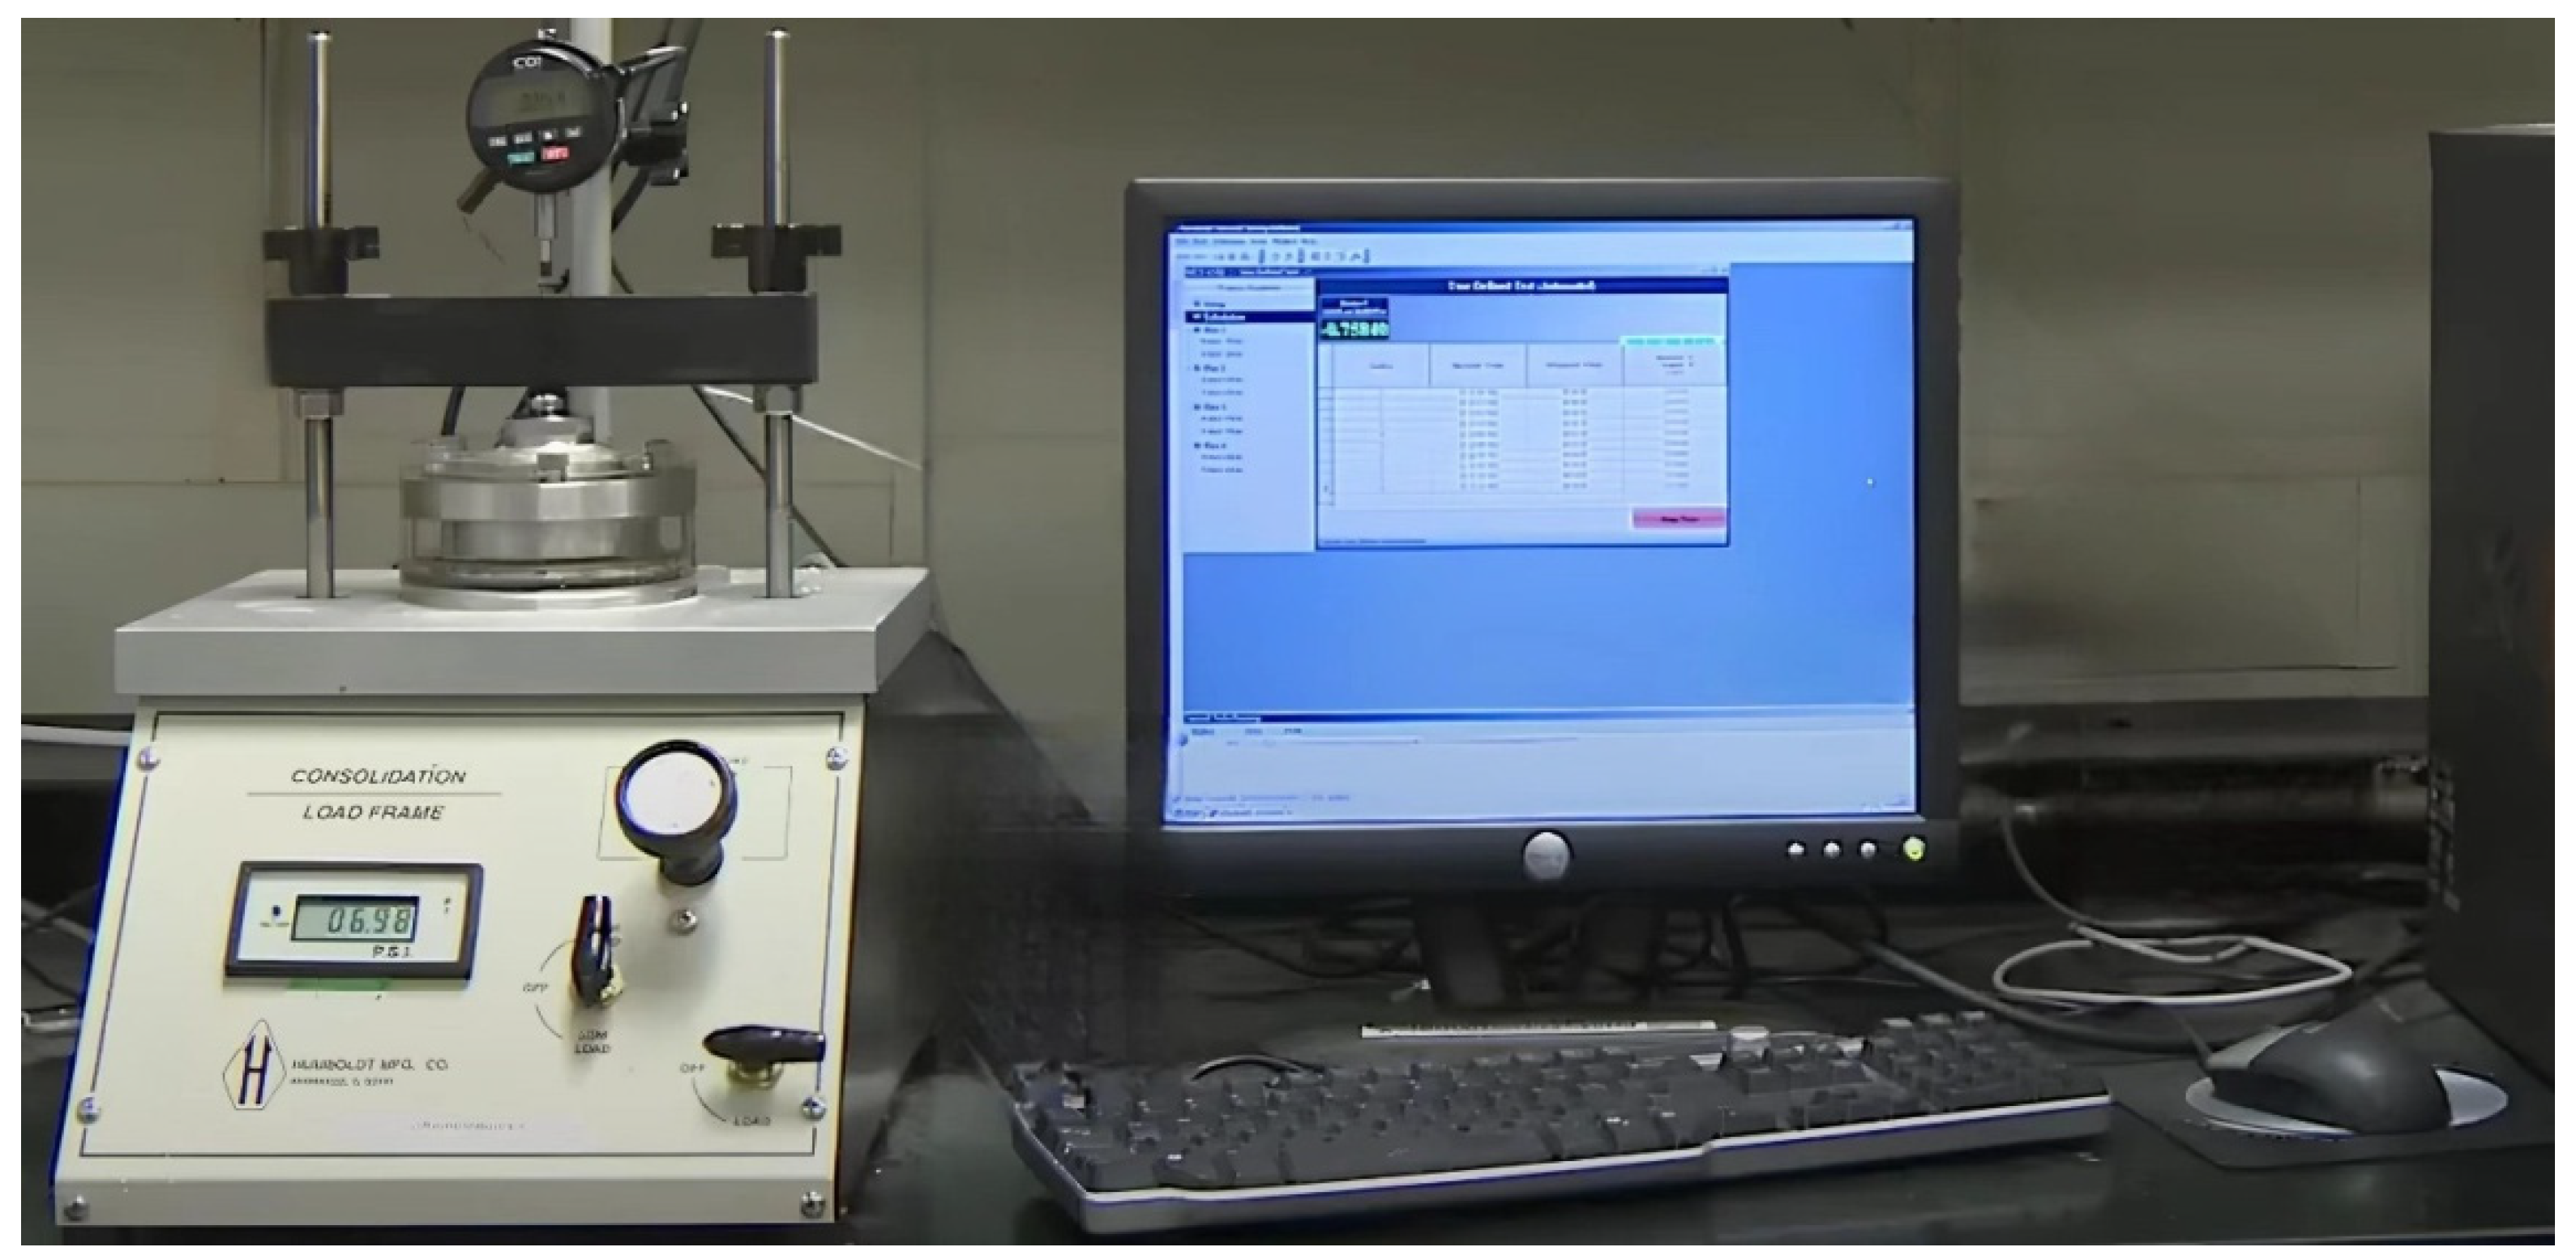
The material extraction and methodological parameters were established according to standardized geotechnical protocols. The soil specimens were sourced from Naibawa, Kano State, Nigeria (approximately 12.0833° N latitude) and classified as high-plasticity clay (CH) by ASTM D2487 [16]. Particle size distribution analysis using sieve and hydrometer tests revealed a fine-grained soil composition, with over 74% of particles passing the 200 mesh sieve (see Figure 1). The soil was initially air-dried in a controlled laboratory environment to standardize its initial moisture content. Lime and cement additives were commercially procured from Sharada Market in Kano State and subsequently stored in airtight containers to prevent pre-test carbonation or moisture absorption that could compromise experimental integrity. For the preparation methods, soil processing involved air-drying the samples, sieving them through a 0.075 mm aperture, and thoroughly homogenizing them with the additives using a mechanical mixer to ensure uniform distribution of stabilizers. The testing parameters encompassed both physical and mechanical properties. Physical characterization included particle size distribution analysis following ASTM D422 [17], determination of Atterberg limits per ASTM D4318 [18], and measurement of specific gravity according to ASTM D854 [19]. Mechanical testing consisted of unconfined compressive strength (UCS) tests conducted in compliance with ASTM D2166 at a controlled strain rate of 0.076% [20], and consolidation testing performed through incremental loading as specified in ASTM D2435 using a standard consolidometer apparatus [21]. This comprehensive testing regimen enabled a thorough assessment of the soil stabilization efficacy across multiple engineering parameters. Table 1 shows the physical properties of the soil, lime, and cement.
The suitability assessment confirms the clay soil meets established requirements for both stabilization methods according to ASTM standards. For lime stabilization, the soil satisfies critical criteria with a plasticity index of 42% (above the minimum 10% threshold) and 74.1% fines content (exceeding the minimum 25% requirement). The predominant montmorillonite composition provides high reactivity and cation exchange capacity, while the initial pH of 5.31 falls within the acceptable range for lime treatment. For cement stabilization, the soil meets gradation requirements with sufficient fines for adequate binding matrix formation. Organic matter testing confirmed the absence of compounds that could impair cement hydration, while sulfate content remained below the critical 1000 ppm threshold preventing potential expansion issues. The moderate optimum moisture content (21%) aligns with typical cement stabilization procedures. The high liquid limit (66%) and free swelling (71.1%) indicate expansive characteristics that benefit from stabilization through reduced plasticity and swelling potential. The initial low strength (779 kPa UCS) provides substantial improvement potential. These assessments confirm the selected clay represents an ideal candidate for both stabilization methods, meeting all specified criteria and enabling the comparative analysis presented in this study.
Also, for high plasticity clay with montmorillonite as the dominant clay mineral, as indicated in Table 1. Montmorillonitic clays are known to contain reactive silica and alumina in forms that can participate in pozzolanic reactions, though the reactivity varies depending on the clay’s structure and crystallinity. The chemical composition analysis reveals that our soil contains silica and alumina compounds, though the manuscript does not explicitly distinguish between reactive and non-reactive forms of these constituents. Montmorillonite clay minerals typically possess some degree of structural disorder and contain poor crystalline phases that can provide reactive silica and alumina for pozzolanic reactions when exposed to the high pH environment created by lime addition (pH 12.1 as shown in Table 1). The alkaline conditions facilitate the dissolution of silica and alumina from the clay structure, enabling their reaction with available calcium ions to form cementitious compounds such as calcium silicate hydrate (C-S-H) and calcium aluminate hydrate (C-A-H) gels.
The experimental program investigated lime–cement stabilization effects on clay soil through thirty distinct mixture compositions. Cement content was tested at five levels (0%, 2%, 4%, 6%, 8%) and lime content at six levels (0%, 5%, 10%, 15%, 20%, 30%) by dry weight of soil, with soil content calculated as the complement (100% minus combined stabilizer percentages). All thirty (30) mixtures underwent identical procedures with specimens cured for 7, 14, and 28 days at controlled ambient temperature (22 °C). Following each curing period, specimens were subjected to physical property tests, one-dimensional consolidation tests, and unconfined compressive strength tests. This design evaluated all combinations of cement content, lime content, and curing time for specified geotechnical properties.
The experimental protocol for evaluating the geotechnical properties of lime- and cement-stabilized clay soil involved rigorous specimen preparation and testing methodologies adhering to ASTM standards. For unconfined compression testing, specimens were meticulously positioned within the loading frame to ensure axial alignment, with deformation and load data captured continuously at a constant strain rate to generate stress–strain relationships and determine unconfined compressive strength. Consolidation testing required precise trimming of specimens to fit consolidation rings, minimizing structural disturbance, followed by incremental loading in a consolidometer. Primary consolidation completion for each load increment was assessed via the log-time method, with vertical displacement measurements enabling the calculation of consolidation parameters such as compression index, coefficient of consolidation, and preconsolidation pressure. Specimen preparation for both test types involved homogenizing dry soil with stabilizing agents (lime or cement) using a mechanical mixer for a standardized duration to ensure uniform distribution, followed by incremental water addition to achieve optimal moisture content for compaction. Cylindrical specimens (38 mm diameter × 76 mm height) were compacted using a three-layer wet tamping method, with each layer receiving a controlled number of blows from a calibrated compaction hammer to achieve uniform density. Interlayer scarification was performed to enhance bonding and mitigate plane weaknesses. Environmental conditions (temperature, humidity) were stabilized throughout testing, and instrumentation—including load cells, displacement transducers, and data acquisition systems—underwent regular calibration to ensure measurement precision. This systematic approach yielded a robust dataset characterizing the influence of stabilizer type, dosage, and curing duration on soil strength, compressibility, and hydraulic behavior, providing a comprehensive framework for evaluating stabilization efficacy in clay soils.
The cement used in this study was Ordinary Portland Cement (OPC) Type I conforming to ASTM C150 specifications, sourced from [Kofar Ruwa Market Kano State, Nigeria product from Dangote Cement Plc Kogi State, Nigeria]. The chemical composition presented in Table 2 shows typical characteristics of Type I Portland cement, with CaO content of 62.62% and appropriate levels of silicates and aluminates for standard construction applications. The lime used was commercial hydrated lime (calcium hydroxide) intended for construction purposes, though as noted in the chemical analysis, it exhibited lower purity than typical high-grade hydrated lime products. Based on the chemical composition showing CaO content of 50.5% and elevated loss on ignition (42.32%), this lime would be classified as lower-grade hydrated lime, likely affected by carbonation during storage. The lime was sourced from [Sabon Gari Market Kano State, Nigeria] and, while not meeting the strict requirements of ASTM C207 Type N hydrated lime (which typically requires minimum 95% Ca(OH)2 + CaO content), it represents materials commonly available in many construction markets.
The chemical composition analysis of lime and cement presented in Table 2 was conducted using standard analytical techniques for oxide quantification, including X-ray fluorescence (XRF) spectroscopy and wet chemical methods. The reported values for constituents such as SiO2, Al2O3, Fe2O3, CaO, and MgO align with typical compositional ranges for commercial Portland cement and hydrated lime. The loss on ignition (LOI) for lime (42.32%) reflects its calcitic origin and hydration state. These analyses adhered to established protocols for cement and lime characterization, such as ASTM C114-22 (standard test methods for chemical analysis of hydraulic cement) for cement and ASTM C25-22 (standard test methods for chemical analysis of limestone, quicklime, and hydrated lime) for lime. The mineralogical identification of montmorillonite as the dominant clay mineral in the soil was confirmed via X-ray diffraction (XRD) analysis, consistent with the methodology outlined in ASTM D3084-22 (standard practice for alpha-quartz content of soil). These standardized approaches ensure compatibility with global material characterization practices while maintaining precision for geotechnical applications.
The CaO content of 50.5% and LOI of 42.32% indeed indicate significant deviation from pure Ca(OH)2 characteristics. Pure calcium hydroxide theoretically contains approximately 75.7% CaO with LOI values typically ranging from 24 to 25%. The elevated LOI in our lime sample (42.32%) suggests extensive carbonation, likely indicating the conversion of Ca(OH)2 to CaCO3 through atmospheric CO2 exposure during storage or handling. This lower purity could have influenced our experimental results by reducing the material’s reactivity, as the carbonated fraction (CaCO3) is significantly less reactive than Ca(OH)2 for soil stabilization. The reduced available calcium hydroxide would also provide a less-alkaline environment, which is crucial for pozzolanic reactions and clay mineral modification, while the lower Ca2+ availability could affect the cation exchange processes that contribute to soil stabilization. Despite these limitations, the lime and cement combination still demonstrated the effectiveness of stabilization in our study, though optimal dosages and performance metrics might differ from those achievable with higher-purity lime. This finding actually provides practical relevance, as many construction projects, particularly in developing regions, may encounter similar quality variations in locally available lime.
The environmental concerns regarding cement production are valid, as cement generates approximately 0.9 tons of CO2 per ton produced. However, soil stabilization requires substantially lower cement quantities than conventional construction, with optimal performance at only 4–6% content by dry weight, representing a fraction of cement needed for traditional foundation systems when dealing with poor soils. The stabilization approach utilizes existing in situ materials rather than requiring excavation and replacement with imported aggregates, reducing transportation emissions and site disturbance. Enhanced durability extends service life compared to untreated soils requiring frequent repairs, while improved the load-bearing capacity eliminates the need for over-excavation and thick granular layers, resulting in overall material savings over the project lifecycle. Contemporary developments in supplementary cementitious materials such as fly ash, slag, and silica fume offer pathways to reduce carbon intensity while maintaining effectiveness. Additionally, emerging alternative binders including geopolymers and bio-based stabilizers present opportunities for more sustainable soil improvement. The research establishes a fundamental understanding of stabilization mechanisms that can inform the development of these environmentally preferable alternatives while maintaining demonstrated structural performance benefits.

Method of the Test

The testing methodology adhered to several ASTM standards to comprehensively evaluate the mechanical and hydraulic properties of the lime–cement stabilized clay. The primary tests conducted included physical property, unconfined compression, and consolidation tests. The compaction test followed the procedures outlined in ASTM D698-12 [22]. This test was crucial in determining the stabilized soil mixtures’ optimal moisture content and maximum dry density. The standard Proctor test was employed, using a 944 cm3 mold and a 2.5 kg rammer dropped from a height of 305 mm. The soil was compacted in three layers, each receiving 25 blows. This allows the development of the compaction curve and the identification of the optimal moisture content for the soil. The UCS test was conducted following ASTM D2166 [20]. This test evaluated the stabilized specimens’ axial load capacity and strength characteristics. The specimens were carefully extruded from the molds and positioned in the testing apparatus. A constant strain rate of 0.076% per minute was applied until failure occurred, allowing for the determination of the unconfined compressive strength and stress–strain behavior of the stabilized soil. Figure 2 shows the triaxial machine.
The consolidation characteristics of lime–cement stabilized clay soil were comprehensively evaluated through a systematic experimental program employing ASTM D2435 [21] one-dimensional consolidation testing as the primary methodology, supplemented by auxiliary characterization tests following ASTM D7263 [23], D854 [19], and D2216 [24] standards. This test was crucial in determining the stabilized soil’s pre-consolidation pressure, compression index, and compressibility characteristics. Specimens were carefully trimmed to fit the consolidation ring and then subjected to incremental loads (25, 50, 100, 200, 400, 800 and 1600 kPa). Each load was maintained for 0, 1, 2, 4, 8, 15, 30, 60, 120, and 1440 min or until primary consolidation was deemed complete, as indicated by the log-time method. Figure 3 shows the consolidation test apparatus.
The consolidation testing methodology followed ASTM D2435 protocol using precision oedometer apparatus with 63.5 mm diameter and 25 mm height specimens, yielding a cross-sectional area of 3166.92 mm2. Initial porosity (n0) was calculated using n0 = 1 − (Ms/(V0 × Gs × ρw)), where the mass of solids (Ms), initial volume (V0) of 0.000079 m3, specific gravity (Gs), and water density (ρw) of 1000 kg/m3 were measured parameters. The corresponding initial void ratio was determined through the dry density method as e0 = (Gs × ρw × V0)/Ms − 1. Gravimetric water content determinations followed ASTM D2216 procedures, incorporating precise mass measurements including ring weight (w1), wet soil plus ring weight before testing (w2), dry soil plus ring weight after testing (w3), and final soil plus ring weight (w4). Specific gravity determination adhered to ASTM D854 protocols. Pre-consolidation pressure (σp′) was determined through rigorous application of the Casagrande graphical method on the e-log σ′ consolidation curve, involving systematic plotting of void ratio against the logarithm of effective stress and identification of maximum curvature points on the virgin compression line. The method’s precision was validated through careful examination of the transition from recompression to virgin compression behavior, ensuring accurate demarcation of the yield stress threshold.
The compression index (Cc) was quantified from the slope of the linear portion of the virgin compression line in e-log σ′ space, calculated as Cc = Δe/Δlog σ′ through linear regression analysis of the virgin compression portion while excluding recompression and transitional regions. The reduction in compression index compared to unstabilized clay reflects the constraining effect of cementitious bonds formed through pozzolanic reactions between lime, cement, and clay minerals. The constrained modulus (M) was evaluated from consolidation data using M = Δσ′/Δε, where Δε represents axial strain increment corresponding to applied stress increment Δσ′. This parameter relates directly to the coefficient of volume compressibility (mv) through M = 1/mv, where mv = Δe/((1 + e0)Δσ′. The elevated constrained modulus value reflects enhanced load-bearing capacity and reduced compressibility achieved through lime–cement stabilization. The experimental methodology employed ensures comprehensive characterization of the consolidation behavior while maintaining consistency with established geotechnical testing standards. The integration of multiple ASTM procedures provides robust quantification of the stabilization effects, enabling reliable prediction of field performance for lime–cement-treated clay soils under various loading scenarios.

2.2. Principal Component Regression (PCR) Method

2.2.1. Data Preprocessing

The efficacy of integrated principal component and regression modeling for analyzing lime-, cement-, and soil-stabilization mechanisms depends on rigorous preprocessing to ensure dataset integrity. As highlighted by Delgado-Peña et al., unreliable inputs compromise analytical outcomes [25]. Key steps include systematic collation, quality control, normalization, gap interpolation, and stratified partitioning into training and validation subsets. These processes preserve genuine experimental variance while minimizing biases that could skew multivariate models. Tony et al. further stress adaptive preprocessing tailored to raw data distributions to align with dimensionality reduction requirements. Constructing a representative dataset through standardized protocols—mixing ratios, moisture conditioning, compaction, and scaling—enables accurate deciphering of stabilization pathways [25]. Structured, bias-resistant datasets enhance PCA and regression modeling, bridging empirical studies and field-scale implementation via reliability-driven analytics.

2.2.2. Standardization

Standardization is critical prior to PCA to align variables to zero-mean, unit-variance scales, ensuring equitable contribution to variance-based component extraction. Using Equation (1) [26], variables are transformed to eliminate scale-driven biases, enabling PCA-derived components to reflect authentic covariance patterns. In UCS prediction models, standardized inputs (mixture compositions, dosages, curing-time-dependent strengths) ensure latent relationships are isolated through dimensionality reduction, yielding mechanistic insights into stabilization processes while preserving regression accuracy. This safeguards against misinterpretation of variable importance, anchoring results to underlying physicochemical phenomena.
X i j = X i j μ j σ j
where
X i j = the original value of the j-th soil property for the i-th sample
μ j = mean of the j-th soil property across all samples
σ j = standard deviation of the j-th soil property
X i j = standardized value

2.2.3. Principal Component Analysis (PCA)

PCA commences with the covariance matrix of the standardized dataset, which quantifies linear relationships between variables (e.g., UCS, stabilizer dosage, curing time) within the multivariate soil stabilization data. Eigen decomposition of this matrix yields orthogonal principal components (PCs), ranked by explained variance, with the first PC capturing maximal data variance and subsequent PCs sequentially maximizing residual variance under orthogonality constraints. Eigenvector loadings derived from the covariance matrix define each PC’s composition, revealing how input variables (e.g., physicochemical properties, amendment proportions) contribute to latent variance patterns [27]. By projecting standardized data onto these PCs, PCA reduces dimensionality while preserving covariance-driven relationships, enabling the distillation of complex stabilization mechanisms—such as hydration kinetics or particle bonding—into interpretable components [28]. This process facilitates regression modeling by linking latent variables to geotechnical performance metrics, ensuring robust mechanistic insights. The covariance matrix thus anchors PCA as both a variance-exploration tool and a bridge to predictive analytics. The covariance matrix captures relationships between soil properties of the standardized data as in Equation (2).
Cov ( X ) = 1 n 1 i = 1 n ( x i x ¯ ) ( x i x ¯ ) T
where
X = matrix of standardized data
n = number of samples
x ¯ = mean vector of X
x i = 1 , 2 , 3 ,

2.2.4. Eigenvalue Decomposition

Eigenvalue decomposition of the covariance matrix provides the mathematical basis for PCA, enabling dimensionality reduction by identifying latent structures in multivariate soil stabilization data. This process decomposes the covariance matrix into orthogonal eigenvectors (principal components, PCs) and associated eigenvalues, which represent the variance explained by each PC. Eigenvectors define the orientation of PCs in the data space, with the first PC capturing maximal variance, followed by subsequent PCs capturing residual variance under orthogonality constraints. Eigenvalues quantify the significance of each PC, guiding the selection of dominant components that cumulatively explain a predefined threshold of total variance (Equation (3)). By retaining high-eigenvalue PCs, complex multicollinear variables (e.g., stabilizer dosage, curing time, UCS) are condensed into interpretable indices, simplifying regression modeling while preserving critical covariance patterns. This decomposition bridges empirical observations and mechanistic insights, aligning with Delchambre’s framework for analyzing stabilization mechanisms [29].
Cov ( X ) × ϑ = λ × ϑ
where
ϑ = eigenvector
= c o r responding eigenvalue

2.2.5. Principal Components (PC)

Principal components, as eigenvectors of the covariance matrix derived from preprocessed multiparameter data, enable a physically interpretable coordinate transformation in PCA [30]. By projecting high-dimensional experimental observations onto orthogonal eigenvector axes—termed principal component (PC) axes—this process generates PC scores for each sample, as defined in Equation (4). For example, in datasets tracking lime–cement-soil amendment effects (e.g., strength evolution across curing times and stabilizer ratios), PC scores distill complex covariance patterns among chemical, mechanical, and microstructural variables into simplified composite indices. These indices consolidate correlated responses into interpretable dimensions, preserving multidimensional reconstructability while isolating dominant variance sources. Selection of significant PCs, guided by cumulative explained variance thresholds, scree plots, or cross-validation, ensures dimensionality reduction without sacrificing critical information. This transformation bridges multivariate empirical data and mechanistic insights, providing a structured basis for regression modeling that links stabilization mechanisms to engineering performance.
Z = X W
where
Z  = matrix of principal components score
Each column Z i = scores for principal component i
X = matrix of standardized data
W = matrix of eigenvectors

2.2.6. Principal Component Regression (PCR)

In this study, the PCR analysis method has been employed to predict the UCS of cementitious materials at different curing times (7, 14, and 28 days). PCR integrates PCA for dimension reduction with regression modeling, enabling improved elucidation and prediction of complex multivariate systems. The selected PCs are treated as independent variables, and a regression model is developed to predict the target variable (UCS) using these PCs. The regression equation can be expressed as in Equation (5).
UCS = β0 + β1PC1 + β2PC2 +…+ βkPCk + ε
where
UCS = predicted unconfined compressive strength
β0 = intercept or constant term
β1, β2,…, βk = regression coefficients associated with the respective principal components (PC1, PC2,…, PCk)
ε = residual or error term
The regression coefficients (β0, β1, β2,…, βk) are estimated using ordinary least squares (OLS) or other regression techniques to minimize the sum of squared residuals between the predicted and actual UCS values. The predictive performance of the PCR model is evaluated using appropriate metrics, such as the R-squared, RMSE, or MAE. These metrics provide quantitative measures of the model’s accuracy and can be used to compare the PCR approach with other regression techniques or literature values. It is important to note that the PCR approach assumes linearity between the principal components and the target variable (UCS). If nonlinear relationships are present, alternative techniques like nonlinear PCR or kernel PCR may be more appropriate.

2.3. Sensitivity Analysis via Principal Component Regression

This study employs PCR to analyze the sensitivity of UCS to interdependent geotechnical properties in lime–cement-stabilized high-plasticity clay soils. The complex interplay between stabilization mechanisms and mechanical performance—mediated by variables such as void ratio, porosity, compression index, preconsolidation stress, and compressibility modulus—necessitates a multivariate approach beyond traditional univariate analyses. PCR addresses multicollinearity by transforming correlated predictors into orthogonal principal components, which are then used to model UCS as a response variable. This methodological framework enables the quantification of relationships between microstructural modifications (e.g., pore volume reduction, cementitious bonding) and macroscopic strength development. Sensitivity coefficients derived from PCR, as defined in Equation (6), quantify the relative influence of each PC on UCS, revealing both dominant and counterintuitive relationships. By isolating the contributions of PCs linked to specific physicochemical mechanisms (e.g., flocculation, pozzolanic reactions), this approach identifies key drivers of strength enhancement while accounting for nonlinear interactions inherent to stabilized soils. The resulting insights provide a mathematical basis for optimizing stabilizer dosages and treatment protocols, enhancing the efficiency of soil stabilization in geotechnical applications.
S P C i = β i × λ i
This equation weights the regression coefficient by the square root of the eigenvalue. This captures both the impact of the component on UCS. ( β i ) and the component’s importance in explaining overall soil variability ( λ i ). Higher absolute values indicate a stronger influence on UCS.
The percentage of UCS variance is explained by each principal component as in Equation (7).
V C P C i ( % ) = β i 2 × λ i j = 1 k β j 2 × λ j × 100 %
where
VCPCi (%) = percentage of variance in UCS explained by PCi
This metric quantifies how much of the total explained variance in UCS can be attributed to each principal component. For example, the 46% contribution of PC1 (Soil Compressibility) indicates that nearly half of the explainable variation in UCS comes from this component.
Backward transformation to original variables, to interpret results in terms of original soil properties, sensitivities are mapped back as in Equation (8). This transformation reveals how changes in individual soil properties (like void ratio or lime content) affect UCS. The equation accounts for both direct and indirect effects through all principal components.
S X j = i = 1 k S P C i × W j i
where
S X j = sensitivity of UCS to original soil property X j
W j i = loading of property j on principal component i
Normalized sensitivity coefficients, to make sensitivities comparable across different properties as in Equation (9). This dimensionless coefficient expresses how many standard deviations UCS changes when a soil property changes by one standard deviation. Values near +1 or −1 indicate strong positive or negative influence.
N S C X j = S X j × σ X j σ U C S
where
N S C X j = normalized sensitivity coefficient
σ X j = standard deviation of variable Xj
σ U C S = standard deviation of UCS
Elasticity coefficients, to express sensitivity in percentage terms as in Equation (10). Elasticity coefficients indicate the percentage change in UCS expected from a 1% change in a soil property. For example, an elasticity of 0.5 for lime content would mean that increasing lime by 10% would increase UCS by approximately 5%.
E X j = S X j × μ X j μ U C S
Significance testing for sensitivities, to determine if sensitivity coefficients are statistically significant as in Equation (11). This t-statistic helps determine if an observed sensitivity might be due to random variation rather than a true effect. Values above critical thresholds (typically ± 1.96 for 95% confidence) indicate significant sensitivities.
t S X j = S X j S E ( S X j )
where
S E S X j = standard error of the sensitivity coefficient

2.4. Causality Analysis Using Principal Component Regression

PCR serves as a powerful methodological approach for establishing causality between soil properties and UCS in this study. Unlike traditional correlation analyses that simply identify associations, PCR enables researchers to infer causal relationships by addressing multicollinearity issues and isolating the principal factors that drive soil strength development over time. The PCR analysis incorporated key geotechnical properties such as void ratio, porosity, compression index, pre-consolidation stress and compressibility modulus. These properties were transformed into principal components that represent fundamental dimensions of soil behavior. The core PCR equation for causal analysis can be formally expressed as Equation (5). The time-indexed coefficients ( β i , t ) are particularly critical for causal inference as they capture the evolving influence of each principal component across different curing periods. The stability or systematic change in these coefficients provides substantive evidence for causality rather than spurious correlation. Figure 4 illustrates the systematic methodology employed in the study, from material collection through experimental testing, multivariate statistical analysis, and ultimately to the optimization of stabilizer proportions based on the findings.
To strengthen the causal interpretation, the PCR approach can be conceptualized within the Rubin causal model framework expressed in Equation (12).
U C S i ( 1 ) U C S i ( 0 ) = τ i
where
UCSi(1) = potential outcome with treatment (e.g., reduced compressibility)
UCSi(0) = potential outcome without treatment
τ i = causal effect for sample i
By incorporating the principal components as instrumental variables that influence treatment assignment, PCR enables estimation of the average treatment effect (ATE) while controlling for potential confounders expressed in Equation (13).
E [ U C S i ( 1 ) U C S i ( 0 ) ] = E [ β 1 , t × Δ P C 1 ]
where Δ P C 1 represents the change in the first principal component. This formulation explicitly links the PCR coefficient β 1 , t to the causal effect of interest.
Dynamic coefficient analysis, the time-varying coefficients for PC1 across different curing periods provide compelling evidence for a strengthening causal relationship at 7, 14 and 28 days are expressed as Equations (14)–(16).
U C S 7 d = β 0 , 7 d 76.84 P C 1 + 21.24 P C 2 + ε 7 d
U C S 14 d = β 0 , 14 d 139.96 P C 1 + 18.60 P C 2 + ε 14 d
U C S 28 d = β 0 , 28 d 170.70 P C 1 + 9.74 P C 2 + ε 28 d

3. Consolidation Properties

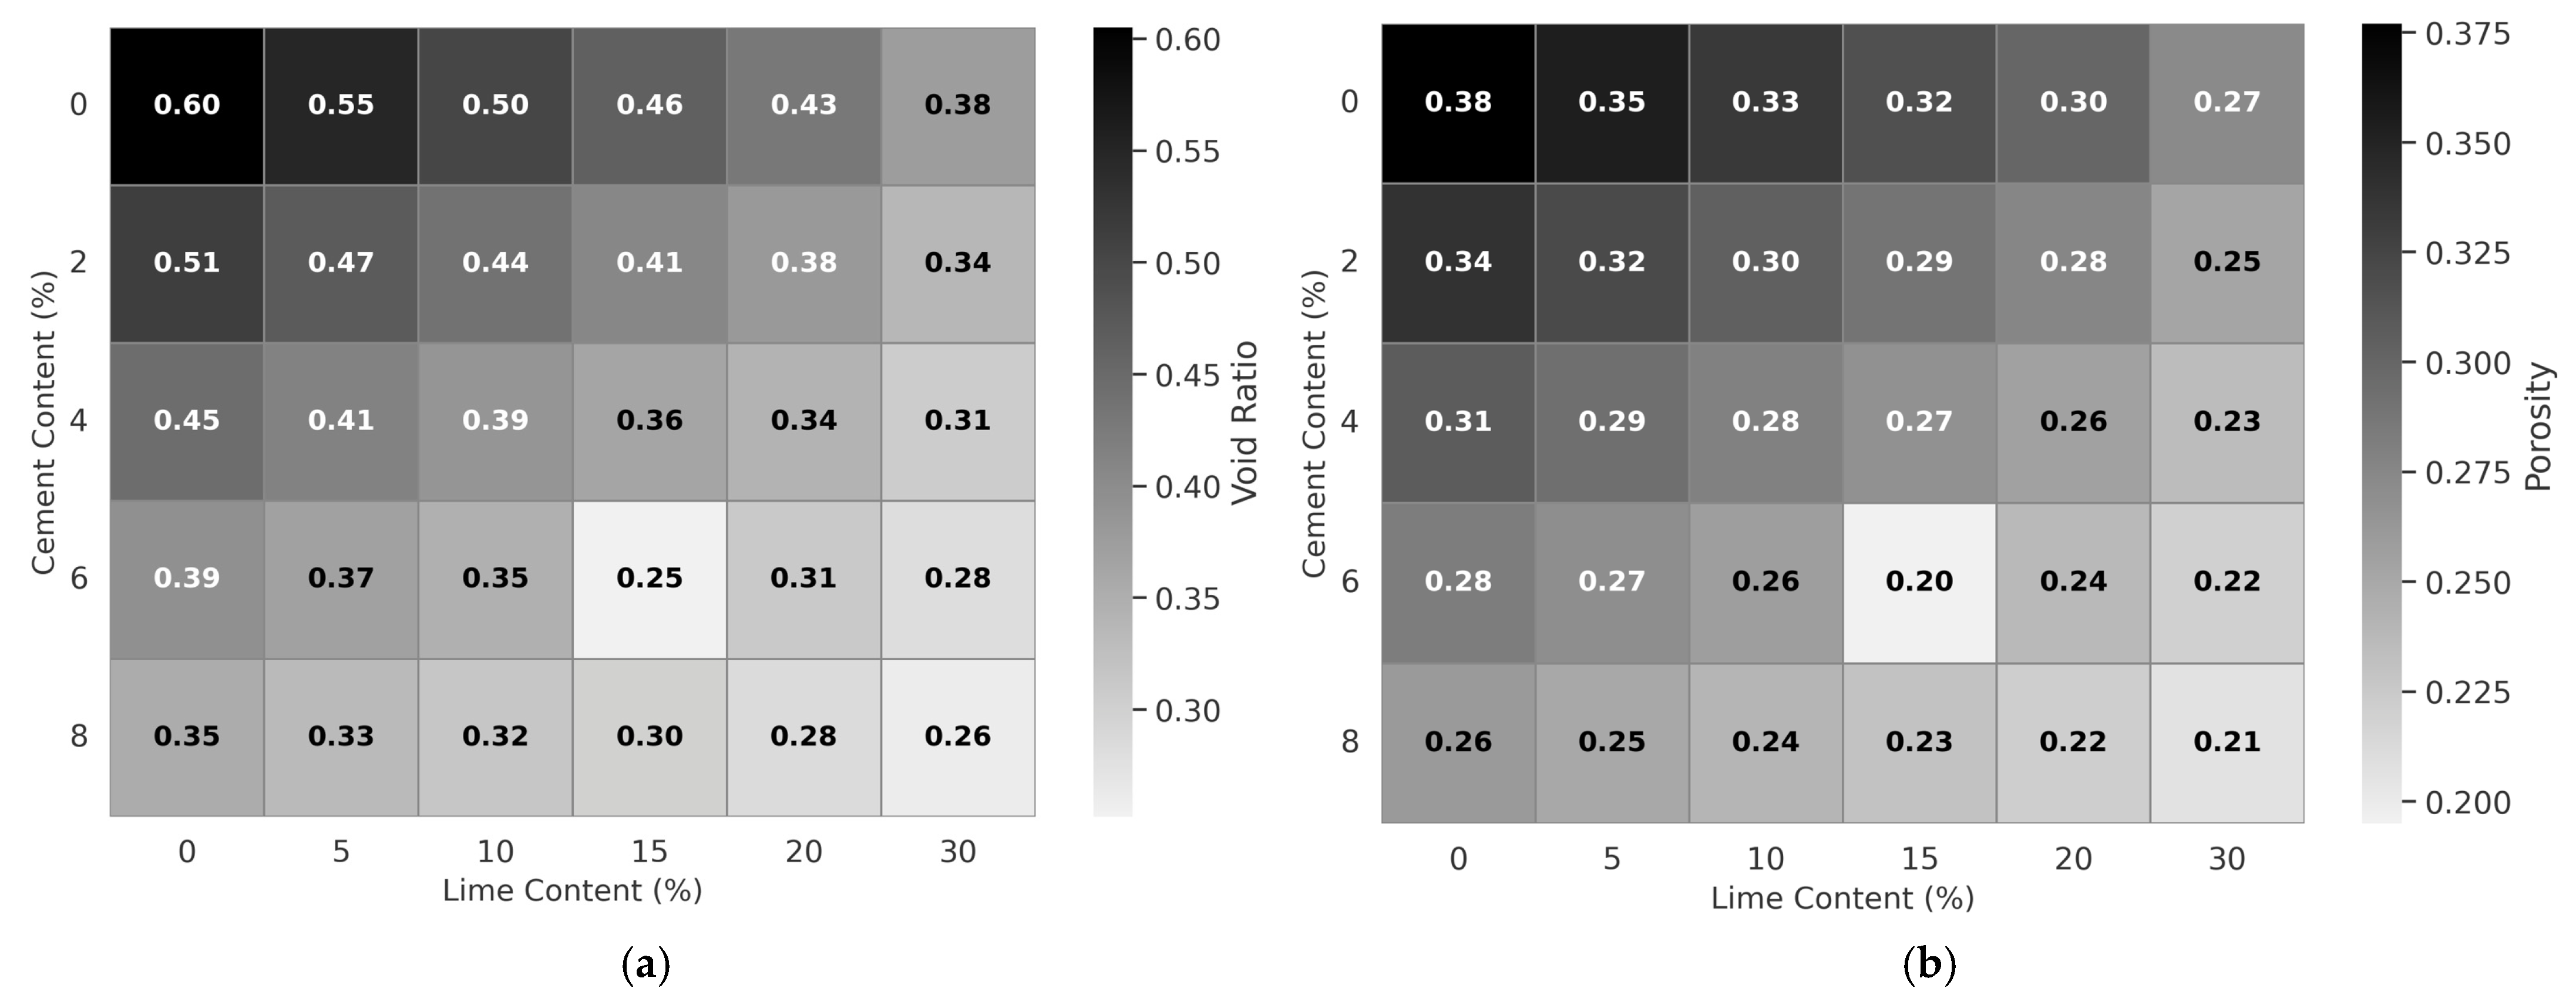
3.1. Effects of Lime–Cement Stabilization on the Void Ratio and Porosity of the Clay Soil

The void ratio and porosity are fundamental parameters that directly influence the microstructural density and mechanical performance of stabilized soil systems (Figure 5a,b). Lower values of both parameters indicate enhanced soil densification and improved engineering properties [31]. The experimental results demonstrate consistent reductions in both void ratio and porosity with increasing cement and lime contents. The void ratio decreased from 0.60 in untreated soil to a minimum of 0.25 at 6% cement and 15% lime content, while porosity declined from 0.38 to 0.19 at the same optimal combination. This synchronized reduction confirms the effectiveness of lime–cement stabilization in achieving maximum soil densification. These reductions result from pozzolanic reactions between cementitious materials and clay minerals, generating calcium silicate hydrate (C-S-H) and calcium aluminate hydrate (C-A-H) gels that progressively fill interstitial spaces within the soil matrix. At the optimal combination of 6% cement and 15% lime, the synergistic interaction between these binders achieves maximum efficiency in particle rearrangement and gel formation. Beyond this optimal threshold, both parameters exhibit slight increases, with the void ratio rising to 0.28 and porosity to 0.22 at 20% lime and 8% cement content. This over-stabilization phenomenon suggests that excessive cementitious agents disrupt efficient particle packing arrangement, indicating a critical equilibrium threshold where the balance between chemical reactivity and physical microstructural interactions becomes compromised. This effect may result from excess hydration products creating additional voids or preventing optimal particle arrangement, thereby diminishing the overall densification efficiency of the stabilization process.
The lime–cement system’s exceptional void ratio reduction (0.60→0.25, 58%) and porosity decrease (0.38→0.19, 49.5%) at 6% cement + 15% lime substantially outperforms most pozzolanic additives, with fly ash achieving only 20–40% void ratio reductions at 15–30% replacements (final void ratios 0.45–0.50) and rice husk ash reaching 30–50% reductions (void ratios 0.40–0.45) due to limited pozzolanic reactivity [32]. Ground granulated blast furnace slag (GGBFS) demonstrates comparable performance with 30–50% void ratio reductions achieving final values of 0.30–0.35, though requiring extended curing periods (28–91 days) versus the lime–cement system’s 28-day effectiveness [33]. Silica fume’s ultrafine particles achieve similar 40–60% reductions (void ratios 0.25–0.30) at 5–10% dosages, matching lime–cement performance but with significantly higher costs and dosage sensitivity [34]. Advanced materials including metakaolin and geopolymers surpass lime–cement systems with 50–70% void ratio reductions (final values 0.20–0.25) [35], though requiring complex alkali activation and controlled curing conditions that limit field applicability [36]. The lime–cement system’s superior performance over single admixtures stems from synergistic flocculation-hydration mechanisms, with combined systems like 20% FA + 30% GGBS achieving 65% reductions, highlighting the potential for hybrid lime-GGBS or cement-SF combinations to further enhance densification [37]. However, the observed over-stabilization phenomenon at 20% lime + 8% cement, where void ratio increases to 0.28 and porosity to 0.22, mirrors literature findings where excess binders create secondary voids and disrupt particle rearrangement, emphasizing the critical importance of optimized dosages (15% lime, 6% cement) to maintain peak densification while avoiding microstructural disruption that compromises soil improvement effectiveness.

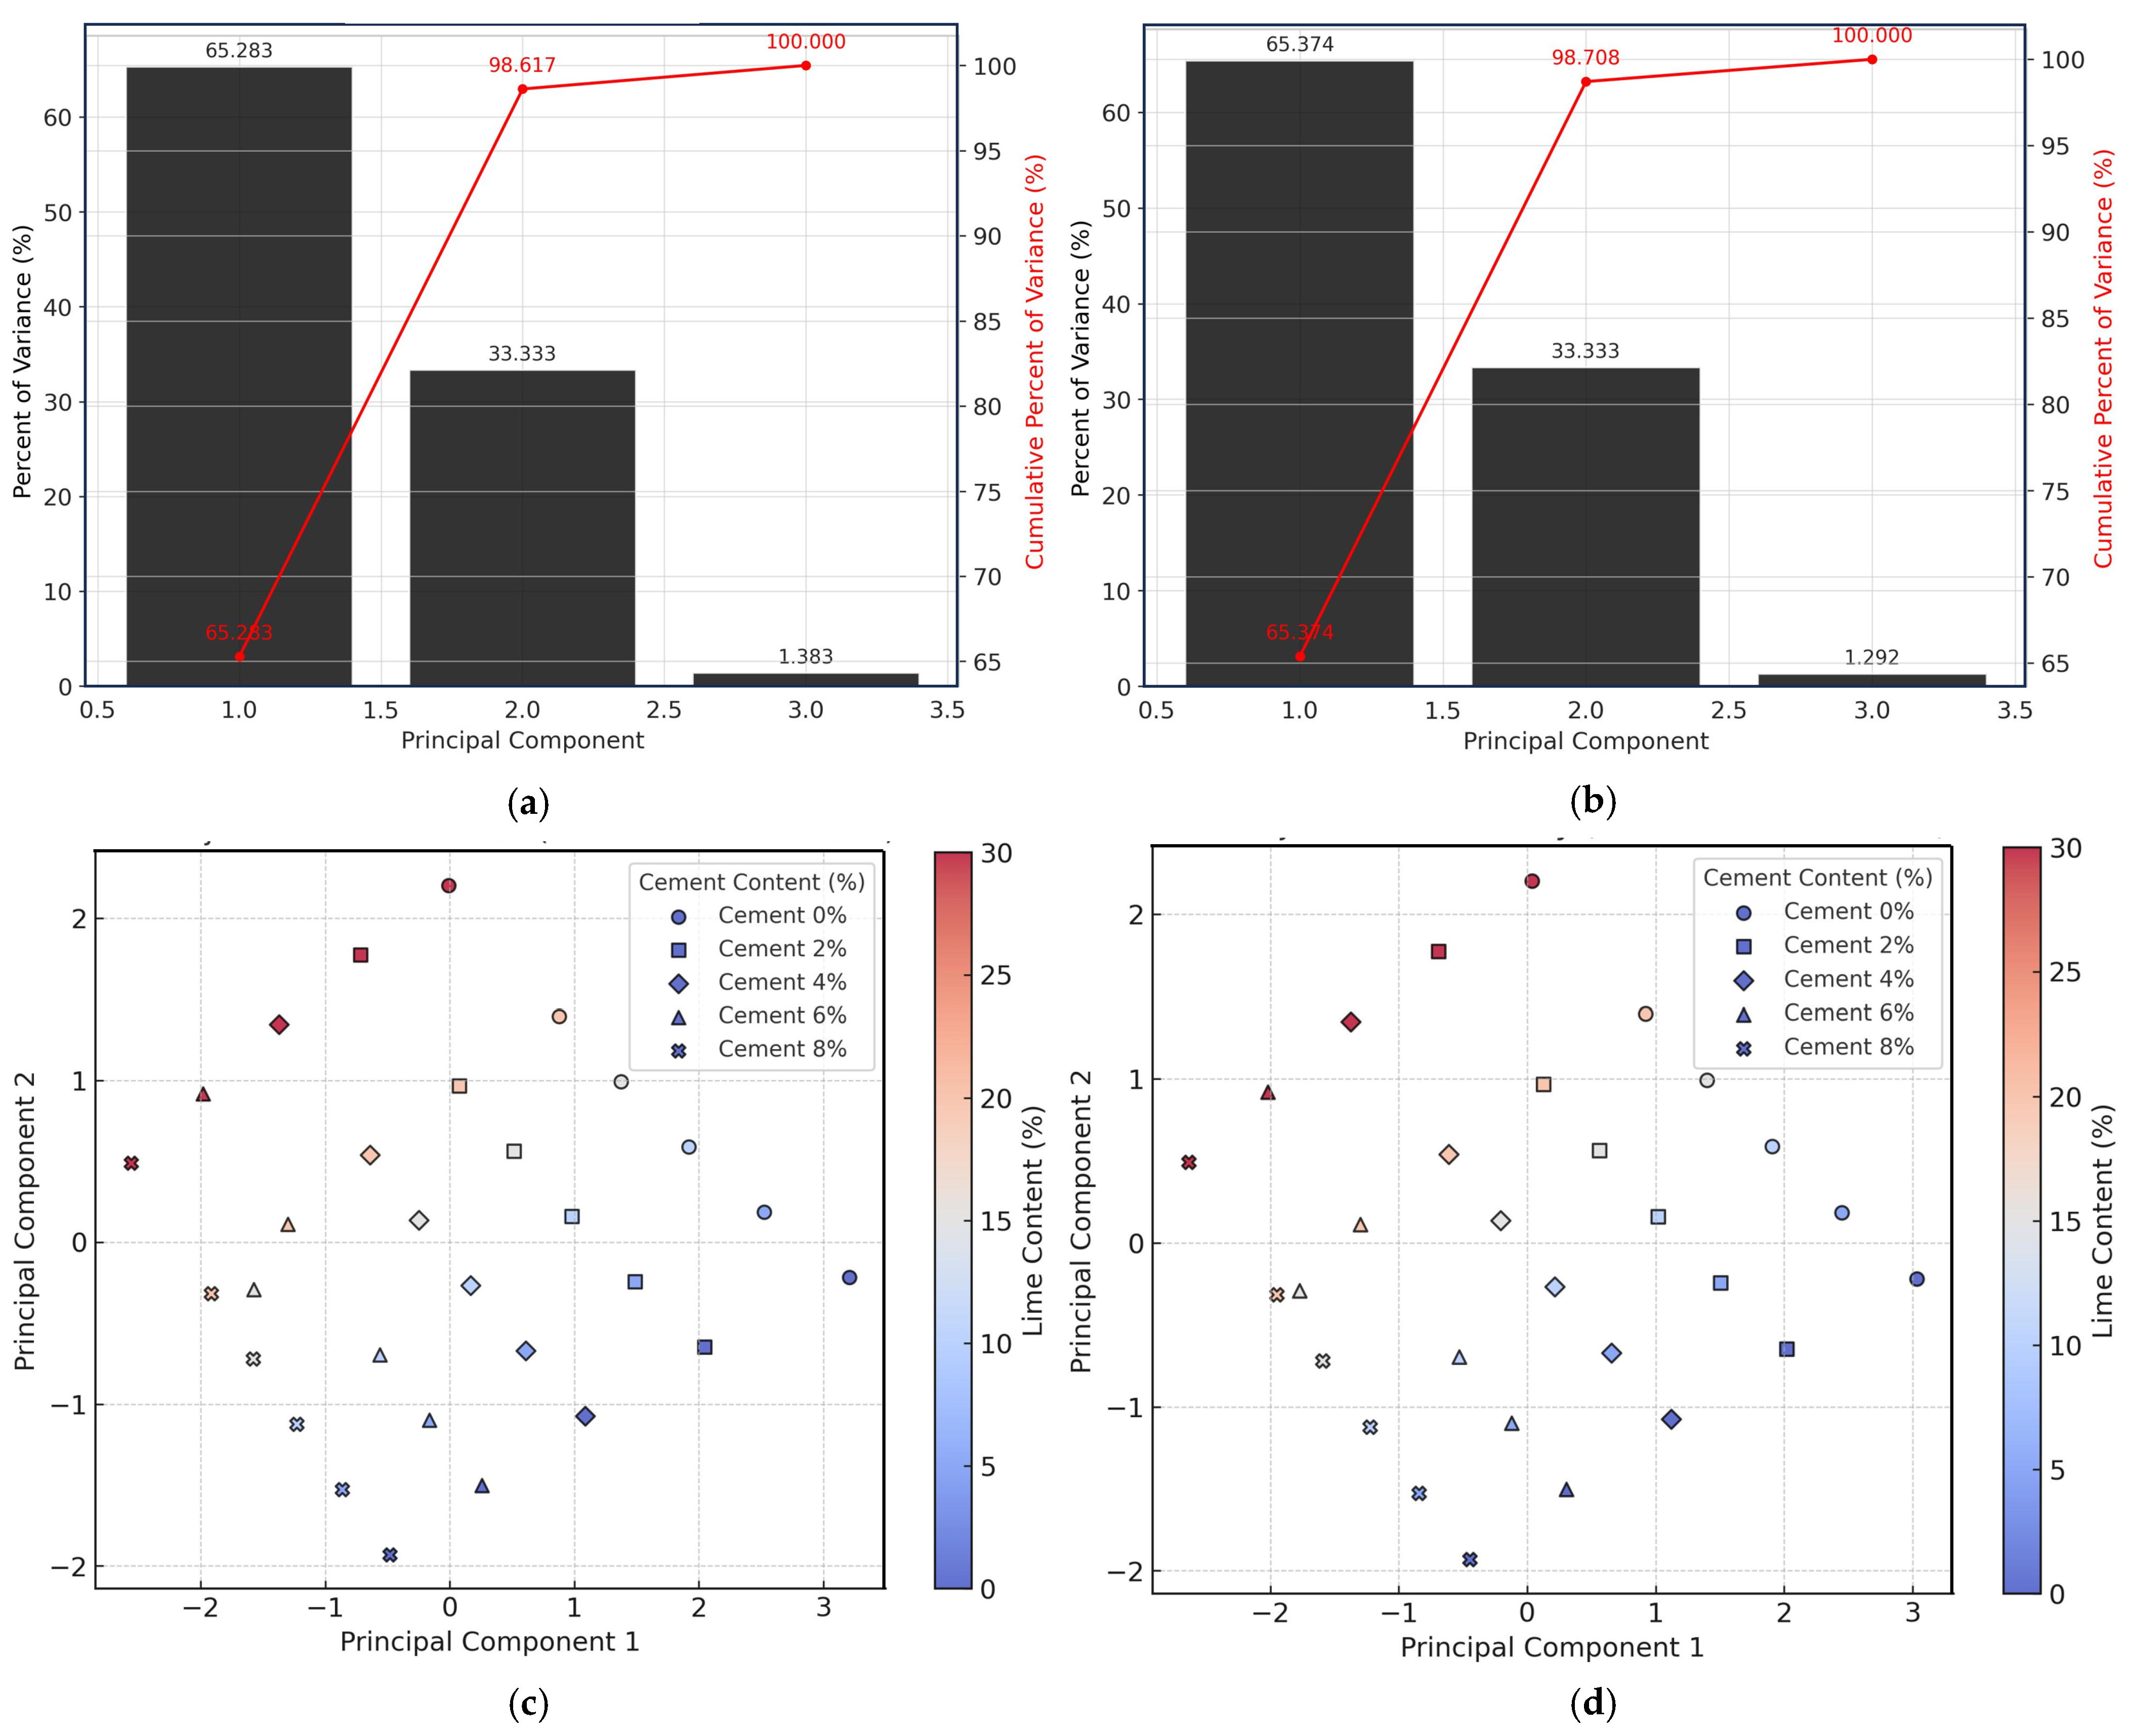
3.2. Principal Component Analysis of Soil Stabilization Effects on Void Ratio and Porosity

Principal component analysis provides quantitative insights into the relationships between stabilizing agents and soil microstructural parameters. The analysis demonstrates that void ratio and porosity changes are predominantly governed by a single underlying mechanism, with PC1 explaining 90.33% and 98.32% of variance for void ratio and porosity, respectively. The addition of PC2 increases the cumulative variance explanation to 98.33% for void ratio and 99.31% for porosity, indicating the near-complete capture of the data structure (Figure 6a,b). The steep decline in scree plots after PC1 for both parameters confirms that soil densification through chemical stabilization can be characterized as essentially a single-dimensional phenomenon. This dominant influence of the first component validates that the combined lime–cement stabilizer content serves as the primary determinant of microstructural modification, with secondary factors contributing minimally to the overall variance. Distinct behavioral patterns emerge between the two parameters in their PCA biplots (Figure 6c,d). Porosity exhibits more compact clustering with reduced scatter, indicating greater predictability and consistency in response to stabilizer additions. Conversely, the void ratio displays moderate clustering with increased variability, suggesting higher sensitivity to material heterogeneity and experimental factors. This differential response pattern indicates that porosity follows more deterministic pathways during chemical stabilization processes.
Both parameters demonstrate strong negative correlations with lime content, as evidenced by the color gradients in the biplots. This relationship quantitatively confirms the mechanistic understanding of lime-induced densification through calcium ion-mediated flocculation and clay particle agglomeration. The cement component enhances this densification through cementitious bond formation, creating a progressively compact soil matrix with reduced interparticle spacing and diminished pore volume. The exceptional variance explanations achieved through PCA validate this multivariate approach for characterizing soil stabilization mechanisms.

3.3. Effects of Lime–Cement Stabilization on the Preconsolidation Stress of the Clay Soil

Preconsolidation stress, representing the maximum effective stress a soil has experienced and critical for foundation design and slope stability analysis, increased dramatically from 355.63 kPa at 0% additives to a peak of 1088.92 kPa at 6% cement and 15% lime content through complex physicochemical mechanisms (Figure 7). This 206% enhancement results from calcium hydroxide initiating pozzolanic reactions that generate calcium silicate hydrate and calcium aluminate hydrate gels, creating robust inter-particle bonds and a complex microstructural network that significantly enhances soil skeleton stiffness and load-bearing capacity. The optimal combination at 15% lime demonstrates the critical balance required for maximum consolidation resistance, as further lime increases beyond this threshold, particularly at 8% cement, result in slightly lower preconsolidation stress values due to potential saturation where excess binding agents disrupt the optimal crystalline gel structure. This transformation fundamentally alters the soil’s mechanical history by creating artificial overconsolidation through chemical bonding rather than physical loading, effectively increasing the soil’s apparent geological stress experience and making it more suitable for construction applications requiring enhanced bearing capacity and reduced settlement potential.
The relatively high preconsolidation stress of 355.63 kPa reflects the clay’s overconsolidated nature, likely from past overburden removal through erosion. The deposit was initially subjected to greater effective stresses from overlying formations that were subsequently eroded, while preserving the consolidated fabric established under higher stress conditions. The montmorillonite-dominated mineralogy suggests marine or lacustrine deposition where accumulating sediment thickness generated consolidation pressures significantly higher than current overburden stress, developing strong inter-particle bonds and reduced void ratio. Subsequent geological processes including tectonic uplift, glacial cycles, or erosional events removed substantial overburden while maintaining the consolidated structure.
The high plasticity index (42%) and liquid limit (66%) are consistent with overconsolidated marine clays that experienced significant stress history, reflecting previous consolidation influence on structural arrangement. Alternative explanations include desiccation effects from past climatic conditions or secondary compression over extended periods enhancing recompression resistance. The preconsolidation pressure magnitude aligns with typical values for overconsolidated clays in similar geological settings, indicating that stress history significantly influences mechanical behavior and explains the substantial baseline strength observed before stabilization treatment.
The pre-consolidation stress values in clay soil stabilization using industrial by-products like bagasse ash (BA) and poly(vinyl alcohol) (PVA) exhibit distinct trends. For bagasse ash and lime, studies by Hasan, Dang [38] show that combining it with lime significantly enhances pre-consolidation pressure. For instance, a mixture of 18.75% BA and 6.25% lime reduced swelling pressure and increased pre-consolidation stress, with the highest values observed in this ratio. Similarly, sugarcane bagasse ash (SCBA) improved preconsolidation pressure (σ′c) over curing periods, alongside reduced compressibility indices (Cα/Cc) as per Abu Talib, AbuTalib [39]. These effects are attributed to pozzolanic reactions and microstructural bonding, akin to lime–cement systems but with lower efficacy in stress improvement compared to the increase observed in lime–cement stabilization. For PVA, while it enhances soil cohesion and reduces surface cracking at ≤5% quicklime content [40], direct quantitative data on pre-consolidation stress improvements are limited [41]. Unlike BA, which demonstrates measurable stress increases (e.g., 65 to 66.5 kN/m2 with 12% rice husk ash by Oshioname, Paul [42]), PVA’s role appears more focused on mitigating shrinkage rather than directly altering consolidation thresholds. Thus, BA shows clearer potential for increasing pre-consolidation stress, particularly when combined with lime, whereas PVA’s benefits are more indirect.

3.4. Principal Component Analysis of Pre-Consolidation Stress in Stabilized Soil

Principal component analysis of pre-consolidation stress in stabilized soil reveals a highly deterministic relationship where PC1 accounts for 99.32% of total variance, with the first two components explaining approximately 97% of variation, establishing stabilizer content as the predominant factor governing soil strength enhancement. The pronounced elbow in the scree plot at PC1 confirms pre-consolidation stress behaves as a single-dimensional phenomenon (Figure 8a), while the PCA biplot demonstrates greater data dispersion compared to void ratio and porosity patterns, reflecting the heightened sensitivity of strength parameters to stabilizer variations (Figure 8b). This enhanced variability stems from complex physicochemical mechanisms where lime content increases pre-consolidation stress through pozzolanic reactions that consume calcium hydroxide to form calcium silicate hydrate gels, simultaneously facilitating cation exchange processes that flocculate clay particles and reduce plasticity. Cement addition amplifies these effects through rapid hydration reactions producing additional calcium silicate hydrate and calcium aluminate hydrate phases, creating a progressively rigid soil matrix with interlocking cementitious bonds that significantly enhance deformation resistance. The clear positive correlation between stabilizer content and pre-consolidation stress values validates these established geotechnical principles, where small incremental changes in lime or cement dosage produce disproportionate strength modifications due to the exponential nature of chemical bond formation and pore structure densification.

3.5. Effects of Lime–Cement Stabilization on the Compression Index of the Clay Soil

The compression index, quantifying soil compressibility under stress where lower values indicate reduced settlement potential, decreased optimally from 0.48 at 0% additives to 0.20 at 6% cement and 15% lime through complex microstructural transformations involving pozzolanic reactions that generate calcium silicate hydrate and calcium aluminate hydrate gels (Figure 9). This 58% reduction results from these cementitious compounds creating robust inter-particle bonding networks that effectively constrain soil particle rearrangement by developing a more rigid, interconnected microstructure with enhanced deformation resistance, making the soil significantly more suitable for foundation design and construction applications requiring minimal settlement. The optimal combination at 15% lime demonstrates the critical balance for maximum compressibility reduction, as further lime increases to 30% at 8% cement cause the compression index to rise slightly to 0.23, indicating a threshold where excess binding agents disrupt the optimal gel structure and diminish stabilization effectiveness. This transformation fundamentally alters the soil’s consolidation behavior by replacing weak van der Waals forces between clay particles with strong chemical bonds, effectively creating a quasi-cemented matrix that maintains structural integrity under loading while demonstrating the nuanced equilibrium required between chemical interaction and mechanical performance in geotechnical stabilization processes.
The compression index of clay soils stabilized with mineral and pozzolanic additives, such as fly ash (Class C/F), rice husk ash (RHA), and ground granulated blast furnace slag (GGBS), can approach or match lime–cement mixtures when optimized for dosage and curing conditions, though lime–cement remains more predictable due to its immediate cementation and long-term pozzolanic effects. Fly ash (e.g., 5% fly ash + 8% cement [43]) and GGBS [33], which leverage calcium-based reactions and pozzolanic activity, reduce compressibility comparably to lime–cement, while RHA serves as a sustainable lime alternative with slightly lower efficacy unless combined with other stabilizers [44]. Zeolites [45] and dolomite [46] primarily address swelling potential and pH balance, respectively, with minimal impact on compression index, whereas organic additives (wood ash, bone meal) lack the cementitious properties to significantly alter mechanical behavior [47].

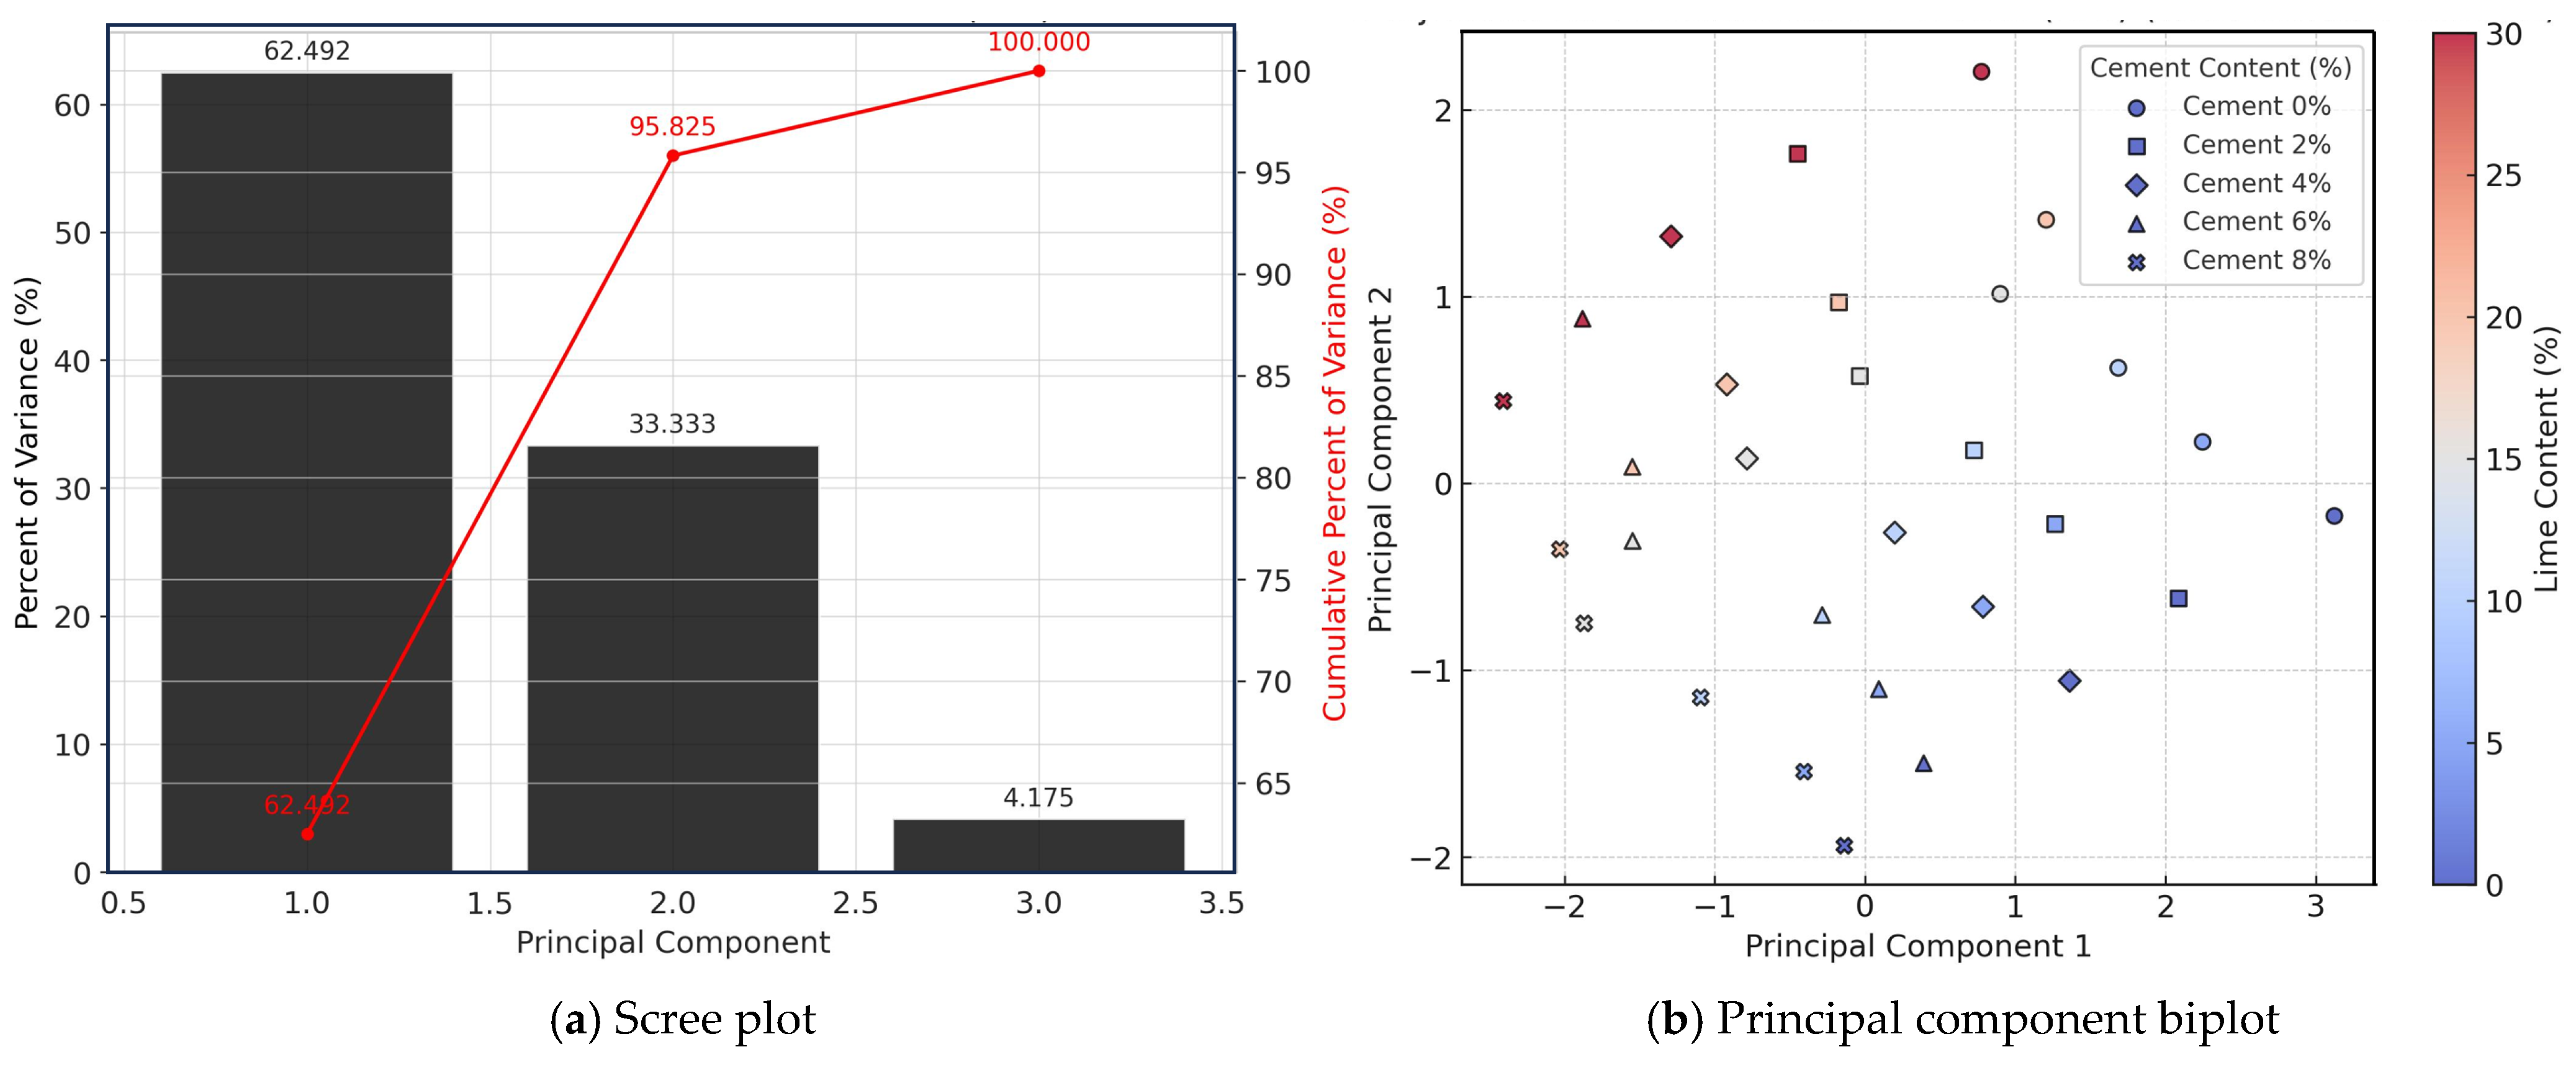
3.6. Principal Component Analysis of Compression Index in Stabilized Soil

Principal component analysis of compression index in stabilized soil demonstrates a highly deterministic relationship where PC1 accounts for 99.75% of total variance, with the first two components explaining approximately 94% of variability, establishing stabilizer content as the predominant factor governing soil compressibility reduction. The scree plot exhibits a precipitous decline after PC1 with subsequent components contributing less than 0.5%, confirming the compression index as essentially a single-dimensional phenomenon controlled by lime and cement additions (Figure 10a). The PCA biplot reveals moderate data dispersion indicating nonlinear relationships between stabilizer content and compression index reduction, where compressibility reduction rates vary across stabilization levels due to complex physicochemical interactions within the soil matrix (Figure 10b). The lime content gradient demonstrates a clear negative correlation with compression index values through flocculation mechanisms that aggregate clay particles into larger, more stable clusters, while simultaneous pozzolanic reactions between lime and clay minerals form cementitious compounds that bind soil particles permanently. Cement stabilization enhances these effects through hydration processes that produce calcium silicate hydrate and calcium aluminate hydrate gels, creating a rigid three-dimensional network that encapsulates soil particles and dramatically increases inter-particle bonding strength. These combined mechanisms fundamentally alter the soil microstructure by reducing void ratios, increasing particle interlocking, and establishing strong chemical bonds that resist deformation under applied loads, resulting in substantial compression index reduction while maintaining high predictive reliability across varying stabilization scenarios.

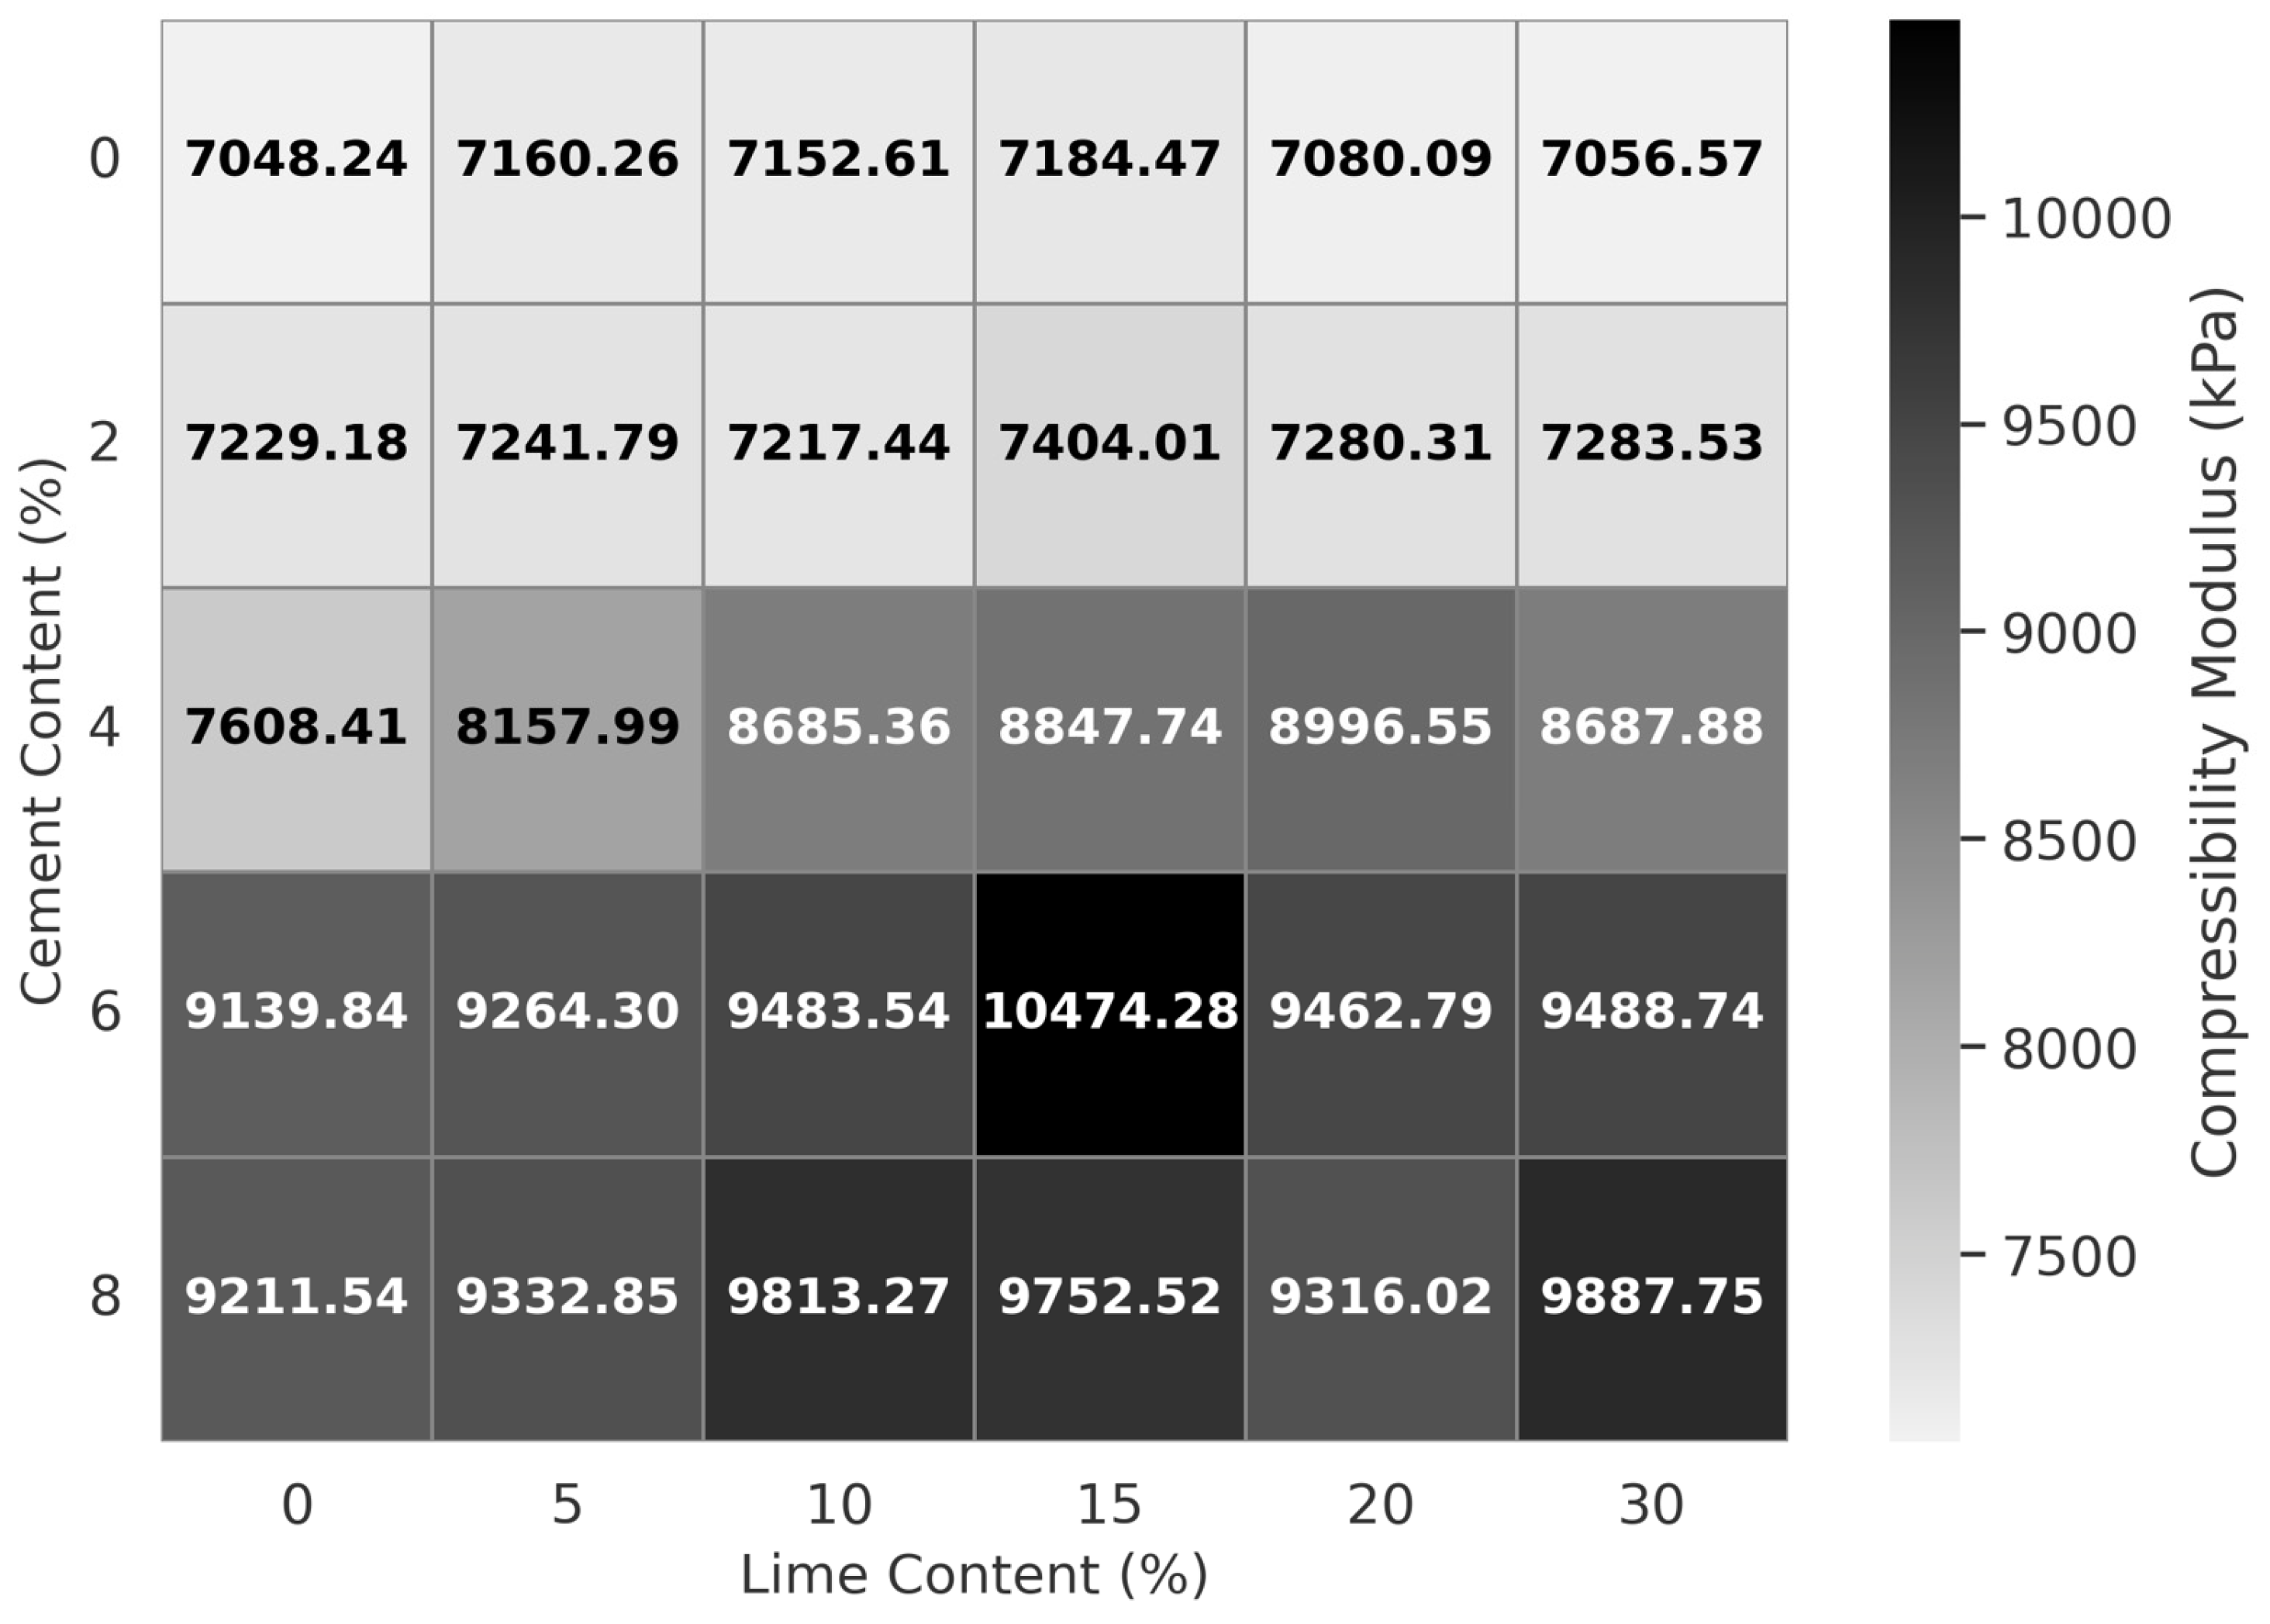
3.7. Effects of Lime–Cement Stabilization on the Compressibility Modulus of the Clay Soil

Figure 11 demonstrates that the compressibility modulus, representing soil resistance to volumetric deformation under stress, increases progressively from 7048 kPa at 0% additives to 10,474.28 kPa at 6% cement and 30% lime content through complex physicochemical mechanisms. This 48.6% enhancement results from pozzolanic reactions between cement, lime, and soil particles that generate calcium silicate hydrate and calcium aluminate hydrate gels, creating an interconnected microstructural network that significantly increases soil skeleton stiffness and constrains particle mobility. The progressive modulus improvement reflects the gradual formation of these secondary cementitious products, which develop robust inter-particle bonds and establish a more rigid crystalline structure that effectively resists compression. Higher compressibility modulus values indicate reduced compressibility and enhanced material stiffness, making the stabilized soil more suitable for foundation design, embankment construction, and structural applications where volumetric stability is critical. The synergistic effects of cement and lime demonstrate how chemical bonding fundamentally modifies soil mechanical properties by transforming loose particle arrangements into cohesive, compression-resistant matrices through controlled cation exchange and gel formation processes.
The compressibility modulus values achieved using additives such as marble dust, bagasse ash, PVA, and others exhibit varying degrees of improvement compared to lime–cement stabilization. For instance, marble dust enhances the shear modulus by up to 9% relative to cement-only mixes in Toubal Seghir, Mellas [48], while partial replacement of cement with 10% marble powder increases strength by 28 days [49]. Similarly, silica fume, a pozzolanic material, contributes to strength improvement [50], though specific modulus values for most additives (e.g., bagasse ash, PVA, Butane Tetra Carboxylic Acid (BTCA)) remain unquantified in the literature [51]. In contrast, lime–cement stabilization demonstrates a quantifiable increase in compressibility modulus from 7048 kPa (unstabilized) to 10,474.28 kPa with 6% cement and 30% lime, surpassing the reported incremental gains from additives like marble dust. While additives improve specific mechanical properties (e.g., cohesion, plasticity), lime–cement stabilization provides a more pronounced and directly measurable enhancement in compressibility modulus.

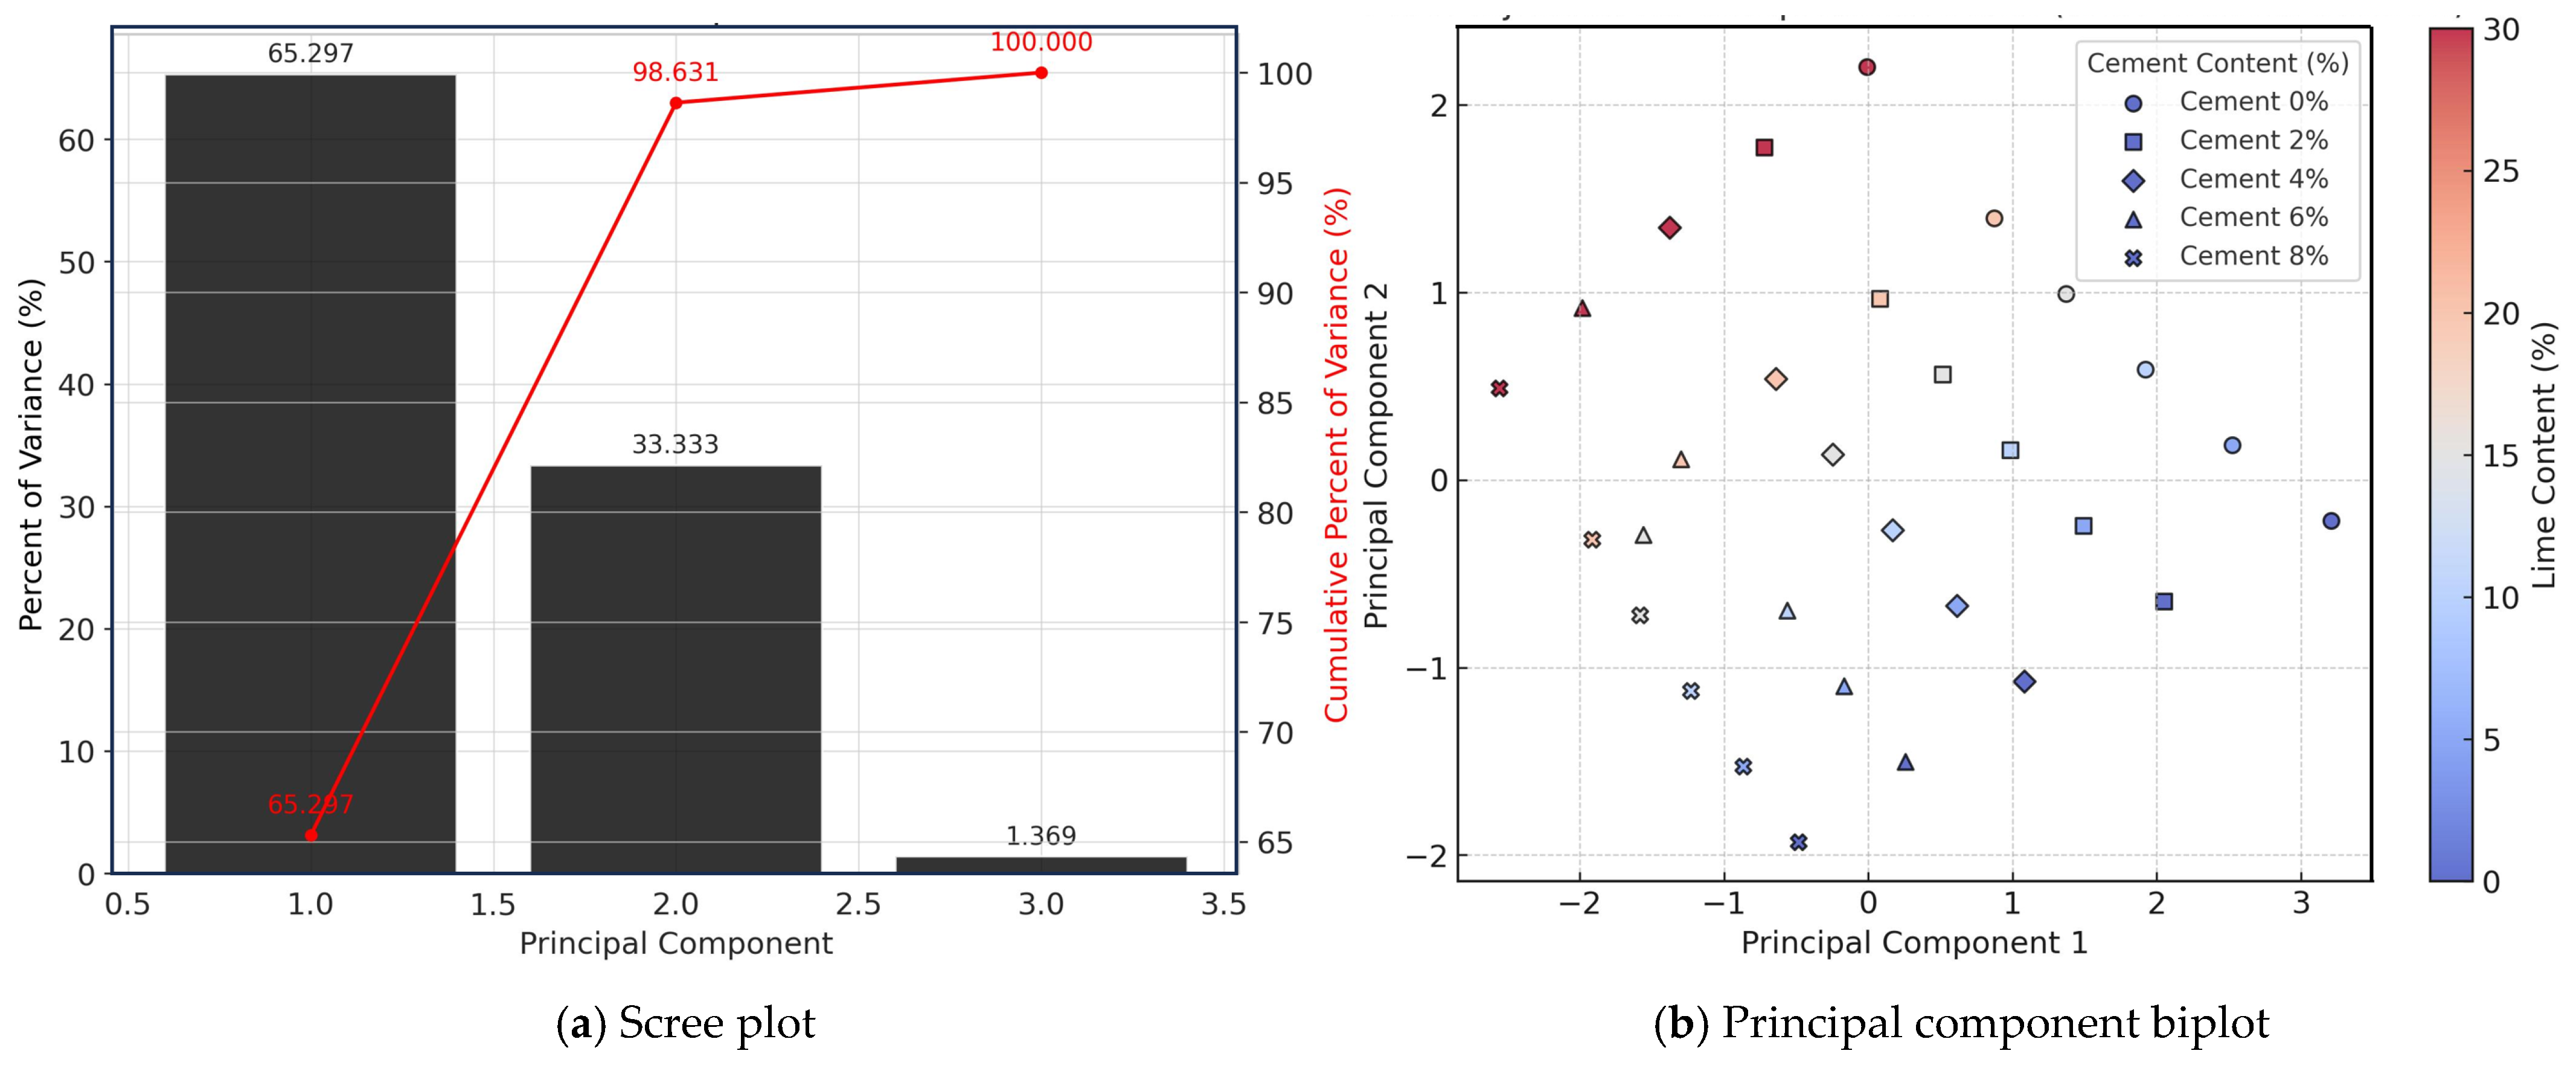
3.8. Principal Component Analysis of Compressibility Modulus in Stabilized Soil

Principal component analysis reveals an exceptionally strong relationship between stabilizer content and soil stiffness enhancement, with PC1 accounting for 99.89% of total variance and the first two components explaining approximately 98% of variability, indicating that compressibility modulus is governed almost exclusively by lime and cement stabilizer additions. The scree plot demonstrates an extremely sharp decline after PC1, with subsequent components contributing less than 0.2%, establishing compressibility modulus as essentially a single-dimensional phenomenon where stabilizer content serves as the overwhelming determinant of soil stiffness characteristics (Figure 12a). The PCA biplot reveals tight data clustering with a strong linear relationship between stabilizer content and compressibility modulus enhancement, demonstrating predictable soil stiffness response to increasing lime and cement additions with minimal experimental variability and high consistency in stiffness development (Figure 12b). This enhancement occurs through distinct but complementary mechanisms: lime content increases soil stiffness via ionic exchange processes that modify clay particle surface chemistry and subsequent pozzolanic reactions between lime and siliceous/aluminous soil components, creating stable cementitious compounds that enhance particle bonding, while cement addition augments this effect through immediate hydration reactions forming calcium silicate hydrate and calcium aluminate hydrate gels that bind soil particles into a rigid matrix with superior load-bearing capacity and reduced compressibility under applied loads.

4. Strength Properties

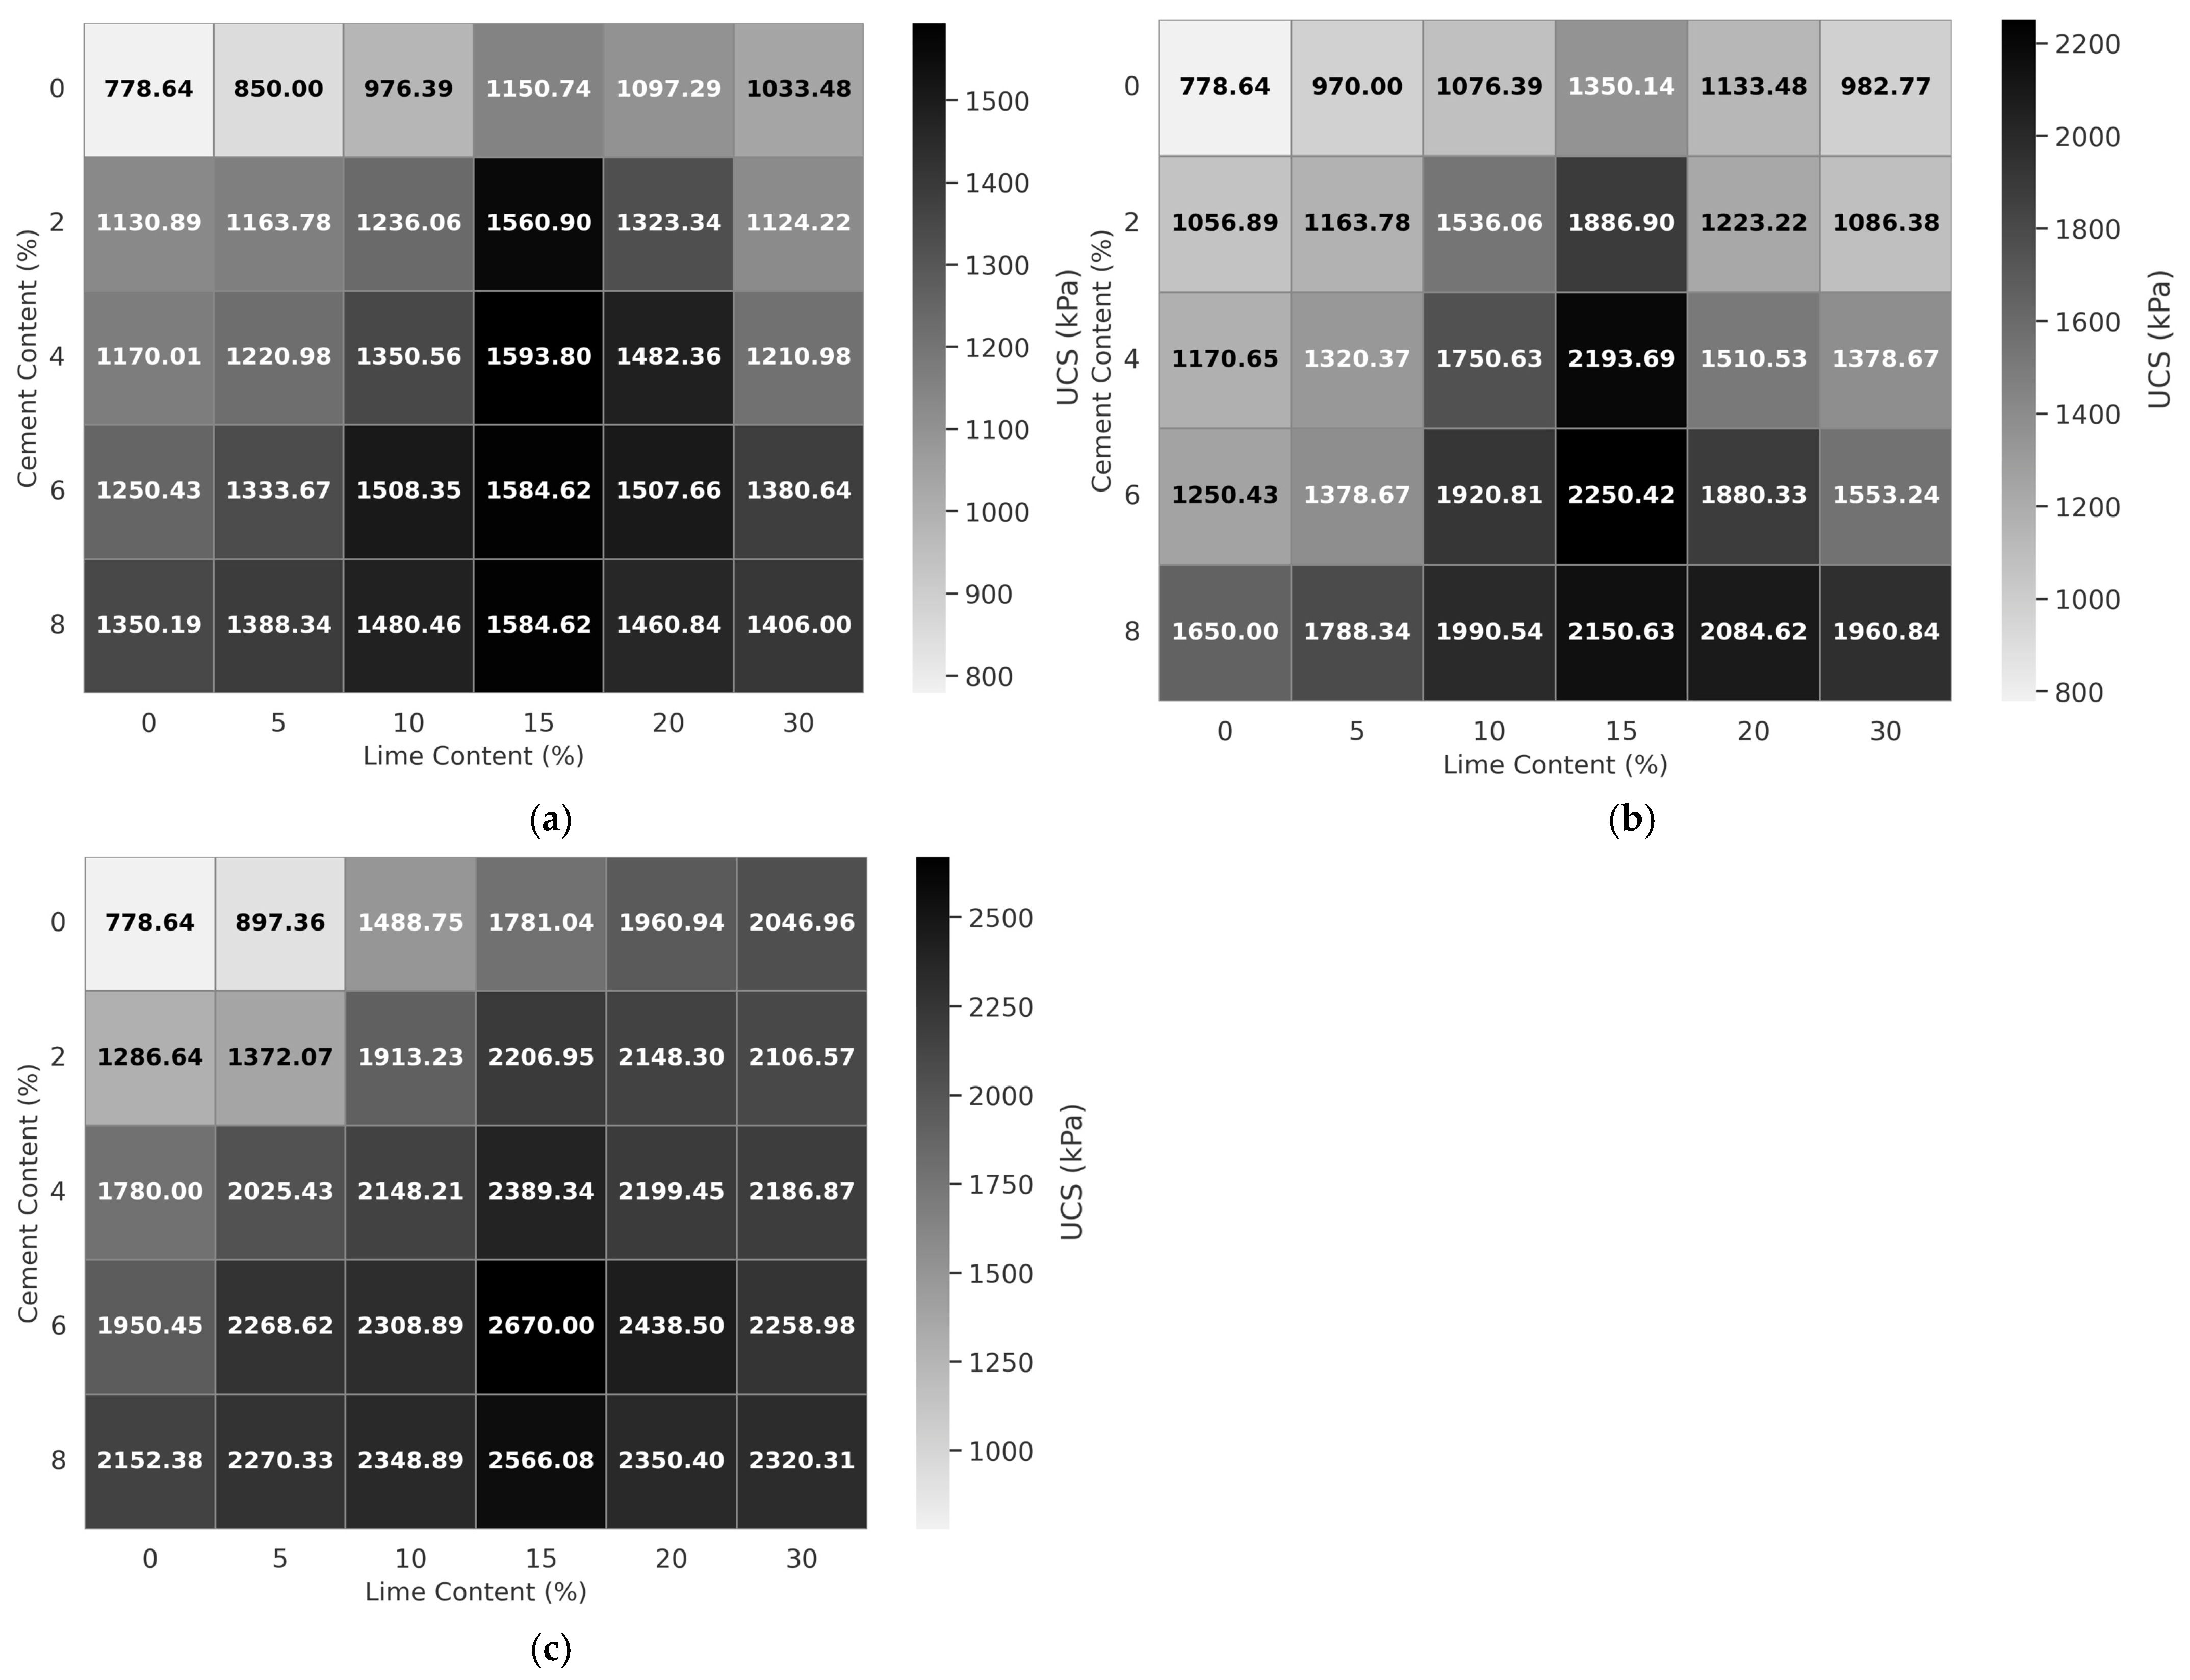
4.1. Unconfined Compressive Strength of Lime–Cement Stabilized Clay Soil

The unconfined compressive strength tests on clay soil stabilized with lime (0–30%) and cement (0–8%) over 7, 14, and 28 days revealed significant strength enhancement patterns driven by complex physicochemical mechanisms (Figure 13a–c). The unstabilized soil exhibited 779 kPa at 7 days, while optimal performance occurred at 15% lime and 6% cement, achieving 1584.62 kPa, 2250.42 kPa, and 2670 kPa at 7, 14, and 28 days, respectively, representing a remarkable 222.5% increase over unstabilized soil at 28 days. These improvements result from calcium-induced pozzolanic reactions that form calcium silicate hydrate and calcium aluminate hydrate gels, creating water-resistant inter-particle bonds through cation exchange processes and progressive crystalline structure development. The most pronounced strength development occurred between 7 and 14 days, with the optimal mixture gaining 40.4% strength compared to only 18.5% from 14 to 28 days, indicating accelerated pozzolanic reactions and gel formation during the initial two weeks when calcium ion availability and clay mineral reactivity are highest. Lime content beyond 15% consistently decreased strength across all curing periods and cement combinations, establishing an optimal threshold where excess calcium disrupts the delicate balance of crystalline structure formation. Similarly, cement effectiveness diminished at higher percentages, with strength increases of 23.9% when adding 0–2% cement but only 8.3% when increasing from 6 to 8% cement at 28 days with 15% lime, suggesting saturation of available reaction sites and potential interference with optimal hydration processes. These results demonstrate that while prolonged curing enhances strength development through continued pozzolanic activity, the critical improvements occur within the first two weeks when primary cementitious reactions establish the fundamental microstructural network, and optimal additive proportions exist beyond which additional materials provide diminishing returns due to disrupted chemical equilibrium.
The failure modes provide crucial insights into stabilization mechanisms. Unstabilized clay specimens exhibited typical ductile failure with gradual deformation and barrel-shaped bulging, behavior that persisted with low lime content (0–5%) where insufficient pozzolanic reactions failed to establish rigid bonds. At optimal lime content (10–15%), specimens transitioned to brittle failure characterized by well-defined shear planes and sudden load drops, reflecting calcium silicate hydrate and calcium aluminate hydrate gel formation that creates rigid crystalline structures. This brittle behavior indicates successful cementitious bonding with failure planes oriented at 45–60 degrees to the loading axis. Cement incorporation at optimal percentages (4–6%) further enhanced brittle characteristics with sharp, clean fracture surfaces and minimal post-peak ductility, demonstrating effective reinforcement of the lime-induced matrix. However, excessive lime (>20%) or cement (>6%) produced erratic failure patterns with multiple micro-fractures, suggesting disrupted microstructural integrity where excess additives interfere with optimal gel formation. Temporal evolution showed progressive embrittlement as reactions advanced, with 7-day specimens displaying transitional ductile-brittle behavior while 28-day specimens demonstrated fully brittle failure consistent with mature cementitious microstructures. These observations confirm that optimal stabilization transforms clay from a ductile soil matrix to a quasi-cementitious composite with failure mechanisms governed by pozzolanic reaction product quality and distribution.
Nano-silica and nano-clays demonstrate the potential to partially or fully replace traditional stabilizers like lime and cement in clay soil stabilization, though their efficacy depends on application-specific conditions. Studies indicate that nano-silica, as a sole additive, improves unconfined compressive strength (UCS) and acts as a strength enhancer for cement, lime, or fiber [52,53]. For instance, Thomas and Kodi [54] show nano-silica added to cemented clay increases UCS due to enhanced pozzolanic reactions and microstructural densification, with some studies suggesting it can partially replace cement while achieving “multi-fold” strength improvements [55]. However, the net initial cost of nano-silica remains higher than traditional stabilizers [55]. Nano-clays, while less extensively studied, have shown promise in improving geotechnical properties, including strength and plasticity reduction [56]. Their ability to modify soil fabric at the nanoscale may yield comparable or superior results to lime in certain scenarios, such as altering plasticity characteristics [57]. While nano-additives offer advantages in targeted applications (e.g., rapid strength gain, reduced environmental footprint), traditional stabilizers like lime and cement remain more extensively validated in large-scale engineering practices. Hybrid approaches combining nano-materials with conventional additives may optimize cost-effectiveness and performance [58]. Further research is needed to establish standardized benchmarks for UCS improvements using nano-clays and nano-silica relative to lime–cement systems.

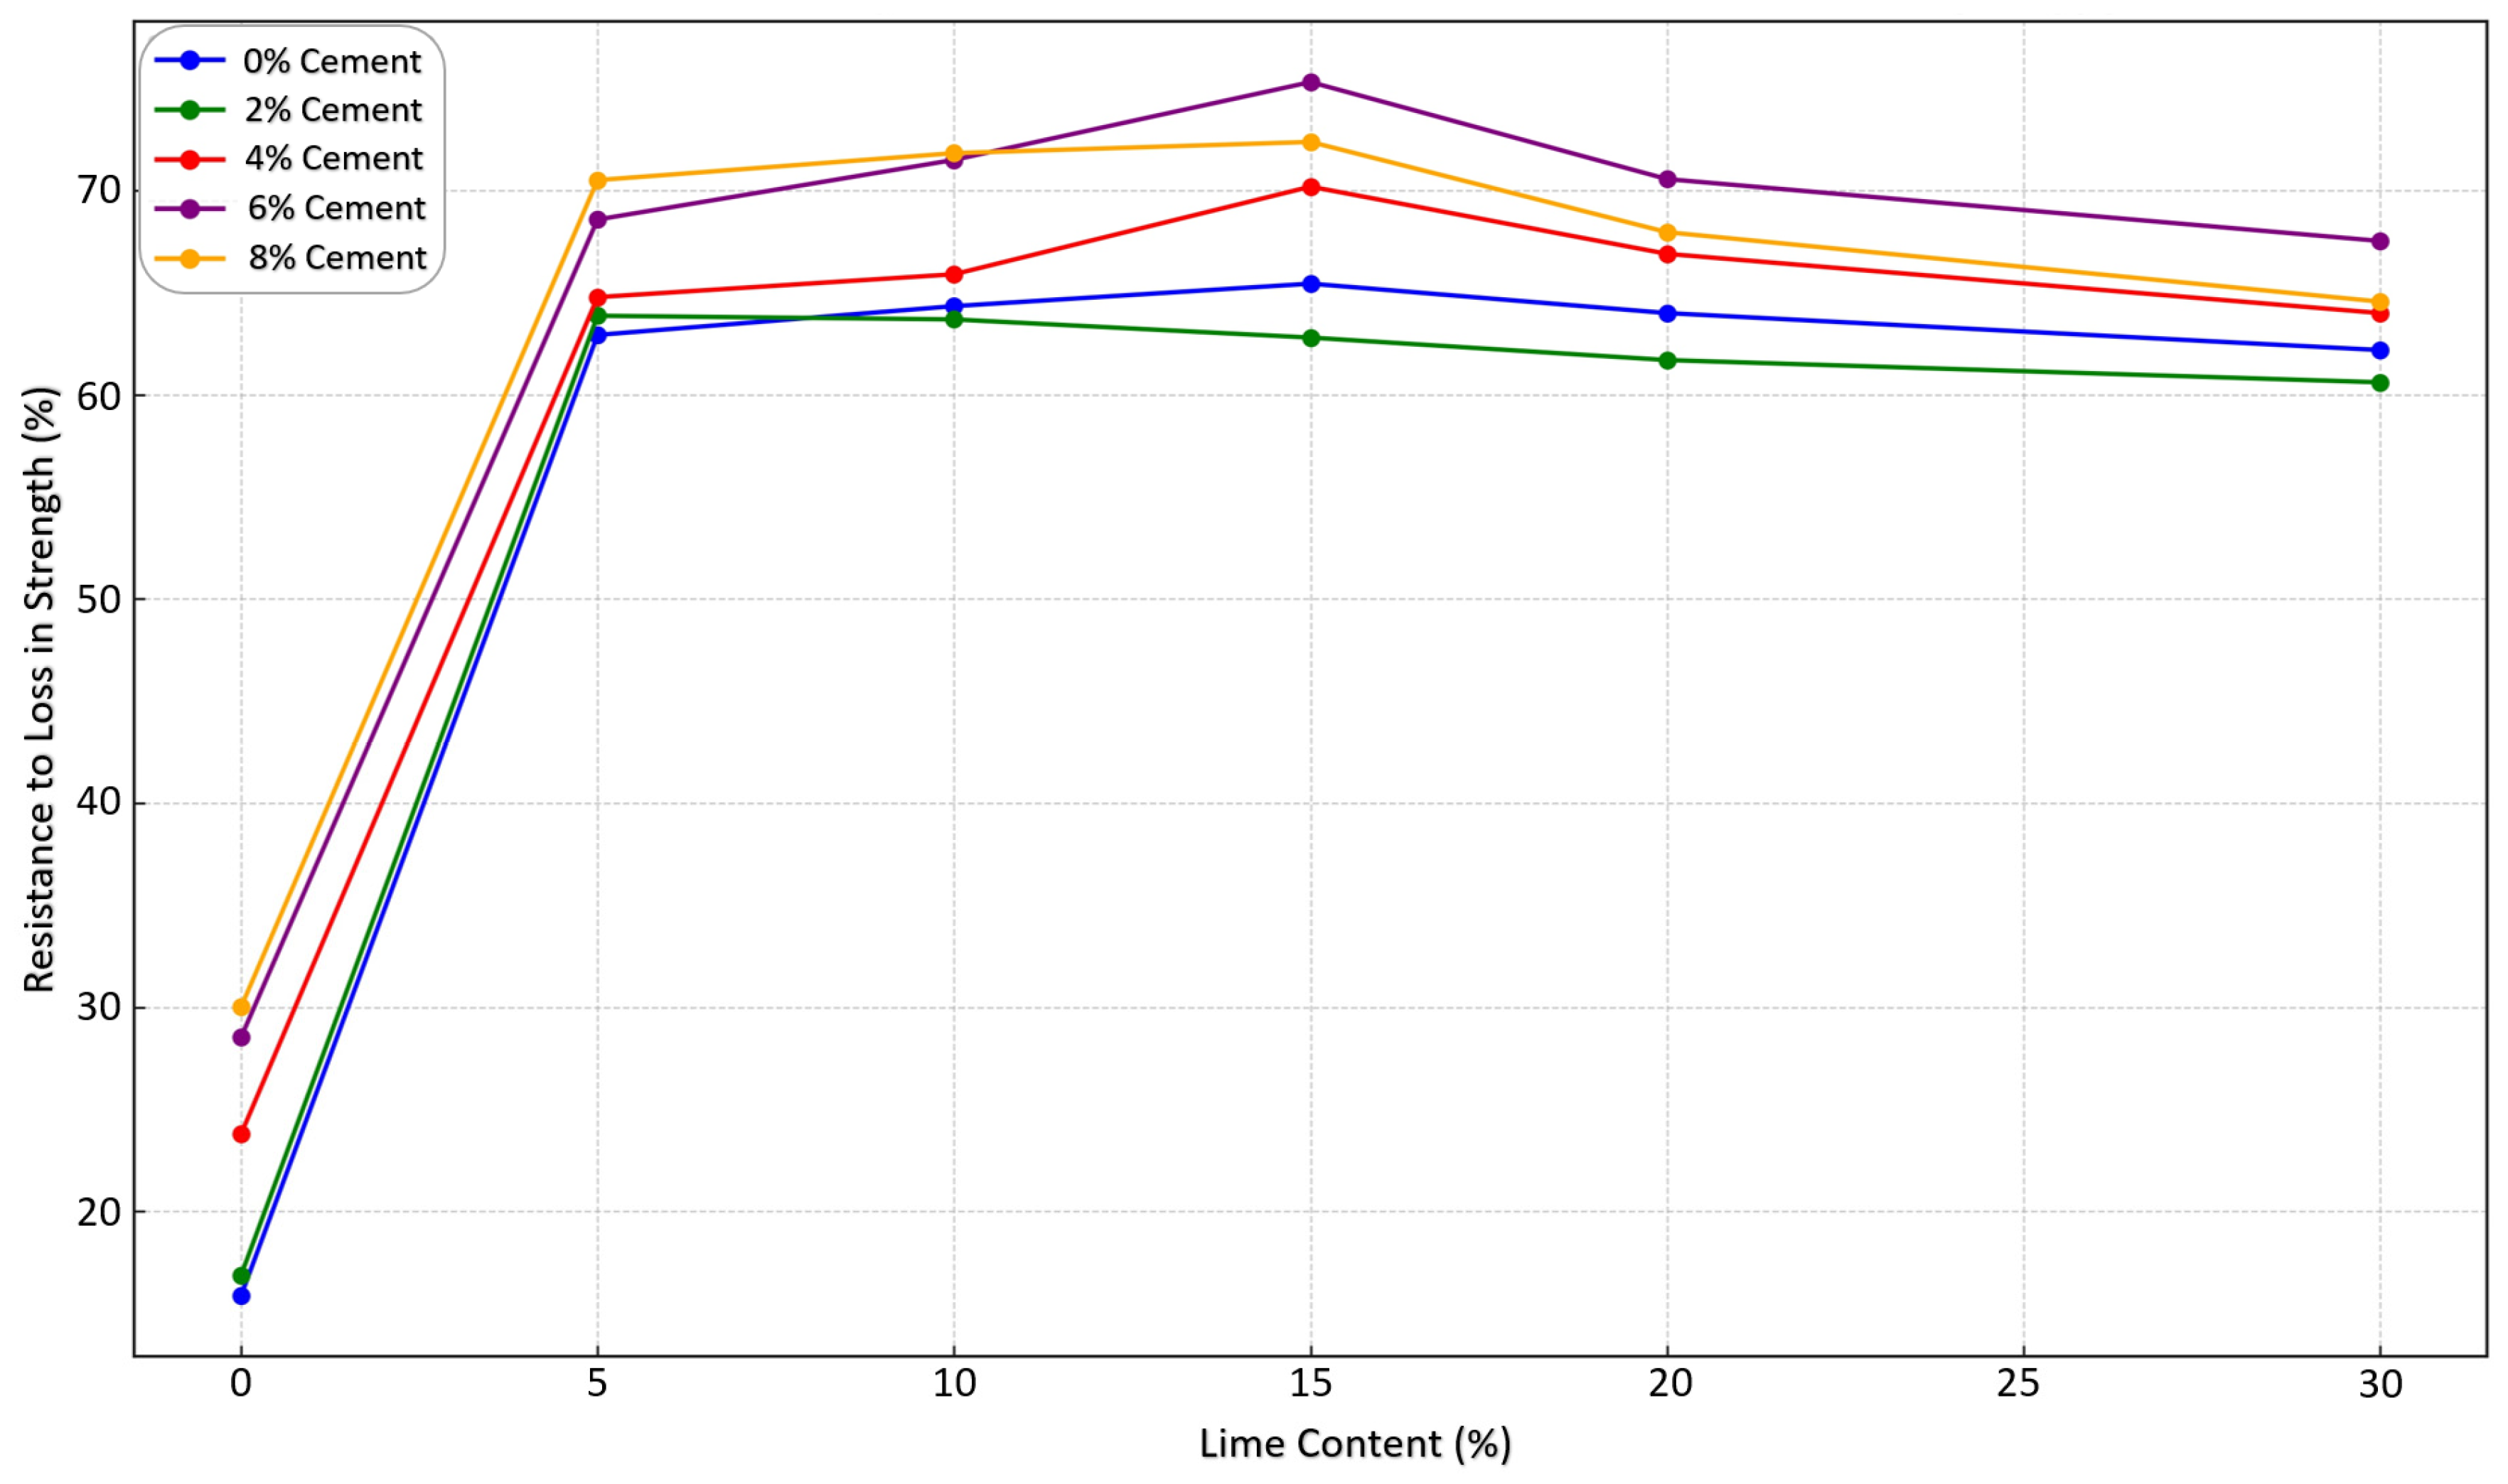
4.2. Effects of Lime–Cement Stabilization on the Resistance to Loss in Strength of the Clay Soil

The resistance to strength loss, a critical durability parameter assessed through water immersion testing that compares 7-day cured plus 7-day soaked specimens to 14-day cured specimens, increased dramatically from 9% at 0% additives to 76% at 15% lime and 6% cement through calcium-induced pozzolanic reactions forming calcium silicate hydrate and calcium aluminate hydrate gels with enhanced hydrophobic properties (Figure 14). This substantial improvement results from these secondary cementitious compounds creating water-resistant inter-particle bonds that effectively prevent water-induced degradation by replacing weak clay particle associations with robust chemical linkages that maintain structural integrity under adverse environmental conditions. The linear improvement pattern from 20% to 60% resistance over 0–20% lime and 0–6% cement indicates optimal cation exchange and progressive gel formation within this range, while diminished effectiveness beyond the 15% lime and 6% cement threshold suggests a critical saturation point where excess additives disrupt optimal crystalline structure formation and incomplete utilization of binding agents occurs. This transformation demonstrates the precise balance required between chemical reactivity and mechanical resilience in soil stabilization, where controlled additive proportioning fundamentally alters the material’s response to environmental stressors by creating a quasi-cemented matrix that resists water penetration and maintains long-term durability under field conditions.
The effects of Fly Ash and GGBS in clay soil stabilization demonstrate distinct strengths and durability compared to lime–cement systems. Fly Ash (Class C/F) exhibits long-term pozzolanic activity, achieving compressive strengths of 915.5 kPa at 28 days in geopolymer composites in clay stabilization [59], though its early-age performance (e.g., 180 kPa at 7 days) lags behind cement-based controls [60]. GGBS shows significant strength improvements, with 71% enhancement at 20% replacement in binder mixes [61], and optimizes CBR values at 20% dosage [62]. However, lime–cement stabilization (15% lime + 6% cement) achieves a 76% resistance to strength loss, surpassing Fly Ash and GGBS due to calcium-mediated cation exchange and pozzolanic reactions [60]. While Fly Ash reduces moisture absorption in lime-stabilized soils and GGBS/FA blends lower mass loss, lime–cement systems remain more effective in mitigating durability losses under immersion. Combinations of Fly Ash and GGBS (e.g., 50:50 mixes) show promise in balancing workability and strength [63], but lime–cement retains superior efficacy for clay stabilization.

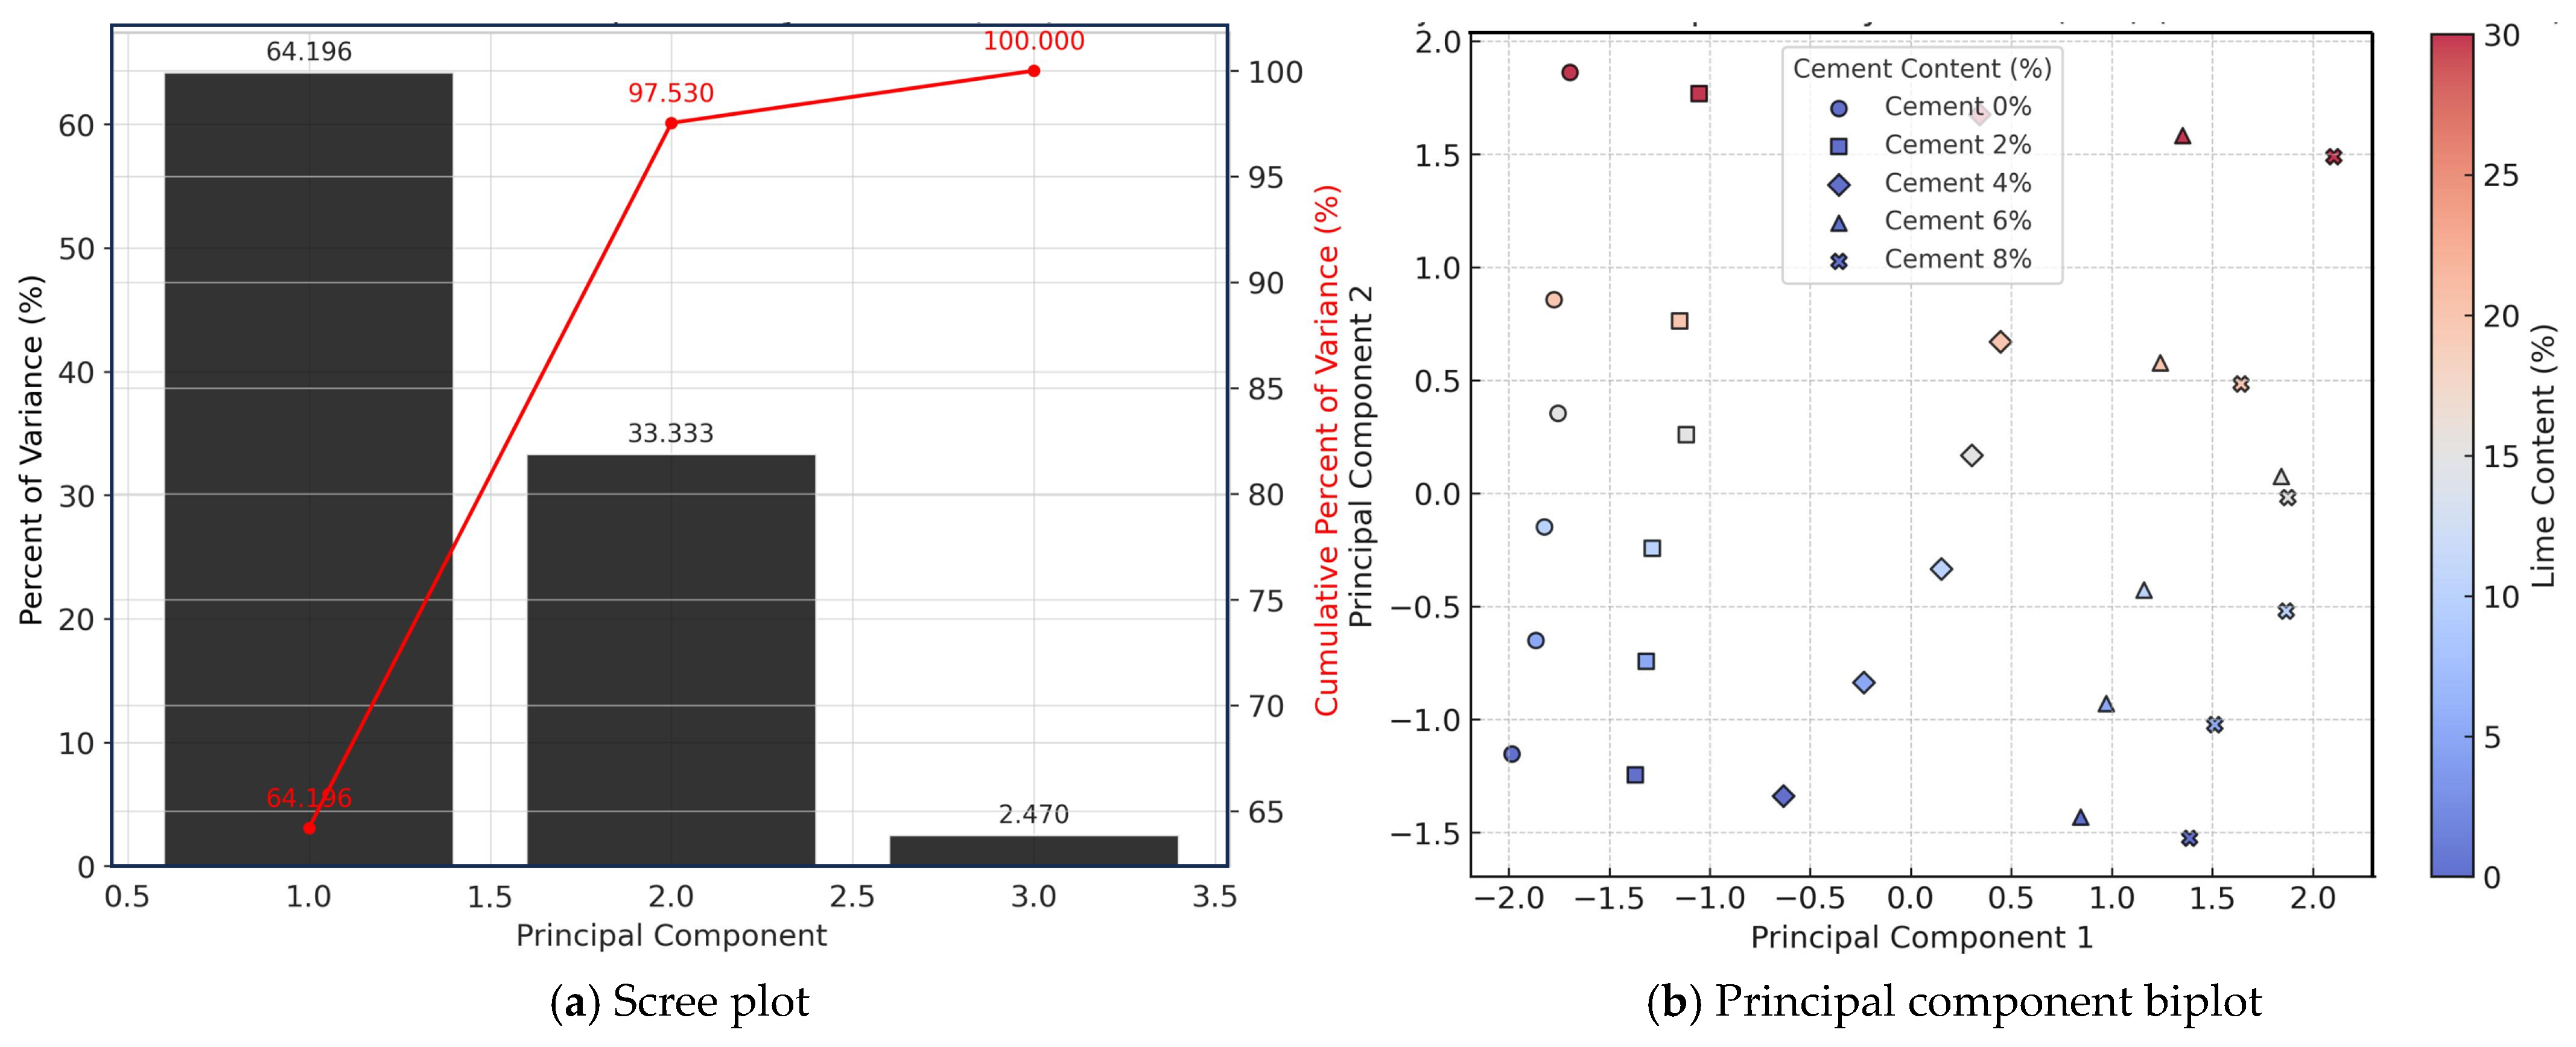
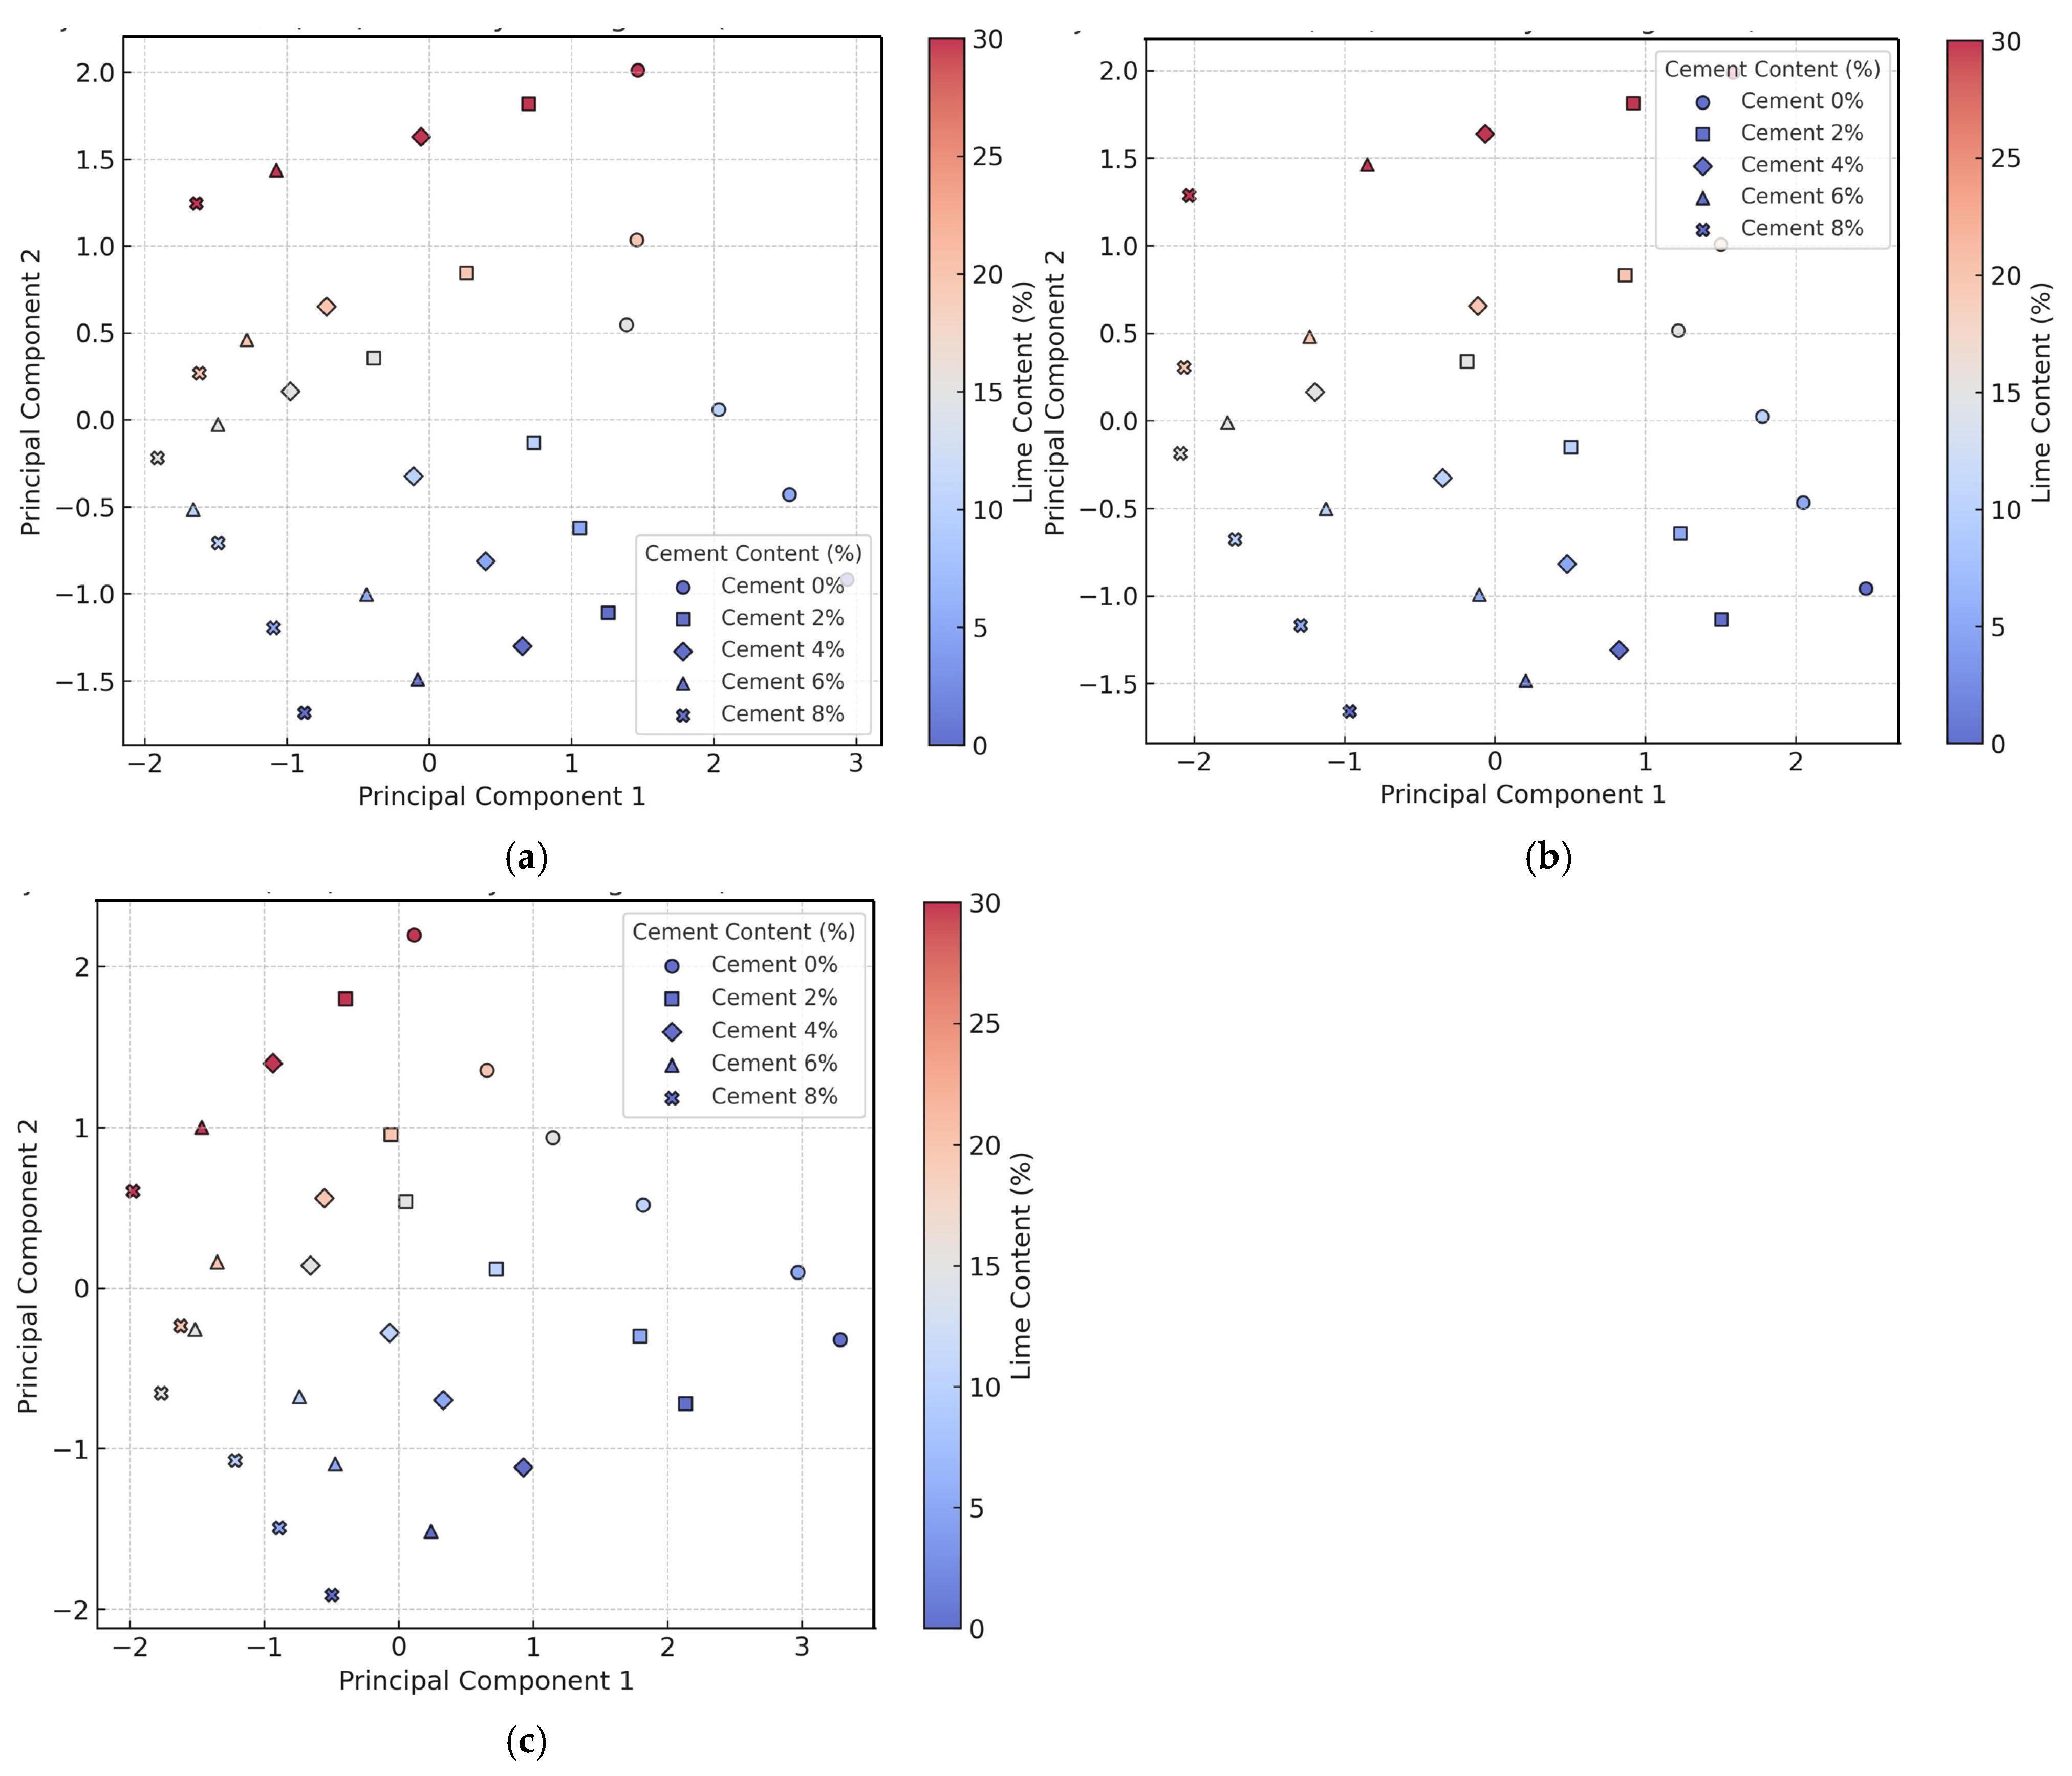
4.3. Principal Component Analysis of UCS in Stabilized Soil

PCA is a multivariate statistical technique widely used for dimensionality reduction, data illustration, and identifying patterns or relationships within complex datasets. Figure 15a–c represent scree plots, which display the eigenvalues associated with each PC of UCS for cementitious materials at different curing ages (7, 14, and 28 days). The first principal component demonstrates dominant explanatory power, accounting for 58.8% of the total variance in both 7-day and 14-day specimens, with a slight increase to 61.1% at 28 days of curing. The second principal component contributes substantially less variance, maintaining 33.3% across 7-day and 14-day periods before showing minimal change at the 28-day interval. The third principal component exhibits diminishing importance over time, decreasing from 7.9% at both 7 and 14 days to 5.6% at 28 days. The cumulative variance patterns show remarkable stability, with the first two components explaining 92.1% of total variance for 7-day and 14-day specimens, increasing marginally to 94.4% at 28 days, ultimately reaching 100% when all three components are considered. The elbow criterion clearly indicates that two principal components provide optimal dimensionality reduction, as evidenced by the sharp inflection point between the second and third components across all curing periods. This consistency suggests that the underlying variance structure of UCS data remains relatively stable throughout the curing process, with the first two principal components capturing the vast majority of meaningful variation in the lime–cement stabilized clay soil system, while the extended curing time to 28 days shows only marginal improvements in the concentration of variance within the primary components.
The PCA biplots in Figure 16 reveal systematic changes in mixture composition-strength relationships across curing periods, with distinct clustering patterns based on cement and lime contents. At 7 days (Figure 16a), samples demonstrate clear separation along Principal Component 1, where higher cement contents (6% and 8%) occupy the positive PC1 space (0.5 to 2.0) while lower cement contents (0%, 2%, 4%) cluster in the negative range (−2.0 to −0.5). The lime content gradient (0–30%) shows that samples with 20–30% lime achieve PC2 values exceeding 1.0, particularly in high cement groups. The 14-day analysis (Figure 16b) maintains similar clustering but exhibits increased PC2 dispersion (−1.5 to 2.0), with high cement samples continuing to dominate positive PC1 space and lime effects becoming more pronounced at 25–30% contents achieving PC2 values above 1.5. By 28 days (Figure 16c), the distribution becomes more dispersed with PC1 spanning from −2.0 to 3.0 and PC2 ranging from −2.0 to 2.5, indicating complex long-term interaction patterns. Throughout all curing periods, cement content serves as the primary discriminating factor in PC1, while lime content increasingly influences the secondary component over time, with the most significant effects observed in samples containing ≥6% cement combined with >20% lime content.
Furthermore, integrating variables such as admixture dosages and UCS values at different curing ages provides a comprehensive understanding of observed trends and relationships. This integration with PCA results facilitates the development of predictive models and empirical relationships for optimizing mixture designs and achieving desired performance targets. Combining PCA with other analytical techniques enables deeper insights into the complex interplay between mixture compositions and resulting mechanical properties, contributing to more sustainable and high-performance cementitious materials. This research bridges statistical analysis and geotechnical engineering to develop multidimensional optimization frameworks for sustainable soil stabilization using lime and cement amendments. Moving beyond traditional single-indicator approaches, the innovative integration of PCA and principal component regression (PCR) unravels complex improvement phenomena and mathematically links mechanisms to performance. PCA enables the extraction of dominant chemical and physical phenomena driving change from multivariate soil property datasets, condensing covariance patterns between complex responses into representative principal components. PCR then constructs quantitative models correlating PCA-derived composite indices to infrastructure-relevant metrics such as strength progression [6]. This integrated analytics paradigm shifts soil stabilization from isolated empirical investigations to mechanistically optimized interventions, overcoming historical trade-offs between explanatory insights and predictive frameworks. The approach provides unprecedented clarification power for improvement pathways, enabling translation from laboratory to field applications and recasting infrastructure additives as understandable and manageable soil solutions.

5. Principal Component Regression Analysis

5.1. Effects of Lime–Cement Stabilization on the Principal Component Regression (PCR) in the Strength of the Clay Soil

PCR is a powerful multivariate statistical technique combining PCA for dimension reduction with regression modeling, enabling improved prediction of complex systems such as UCS of cementitious materials at different curing times (7, 14, and 28 days) (Figure 17a–c). The linear regression model developed using principal components from PCA achieved an RMSE of approximately 103.4 kPa and R-squared of 0.7000. This RMSE value, representing the standard deviation of prediction errors, indicates that model predictions are reasonably close to actual values with acceptable performance for UCS prediction. As noted by Cottrell et al., modest statistical uncertainties are typical in the initial modeling of complex environmental systems, reflecting the conservative balance between model complexity and overfitting avoidance [64]. The current predictive accuracy enables pragmatic screening of additive integration scenarios to identify optimal configurations warranting subsequent fine-tuning. The RMSE and R-squared values provide objective guidance for efficient experimental data collection expansion. The composite framework combining qualitative chemistry interpretation with configurable property enhancement predictions establishes scalable and sustainable soil engineering approaches. This model architecture systematically bridges laboratory knowledge to infrastructural applications, representing foundational exploration of additive sustainability, statistical learning, and soil improvement intersections.
The variability in PCR model fidelity across discrete subsets highlights both the complexity of additive stabilization pathways and the power of integrated predictive approaches in distilling multifaceted systems. As discussed by Zhao et al., localized discrepancies between predicted and observed responses provide targeted opportunities to refine regression constraints through strategic augmentation of underrepresented transition zones [65], Additional sampling can meaningfully deepen resolution of specific processes that may have been peripherally consolidated during the initial dimensionality reduction.

5.2. Analysis of Principal Component Through Sensitivity Analysis for Unconfined Compressive Strength

Principal component regression analysis reveals significant insights into relationships between soil properties and unconfined compressive strength. PC1 accounts for approximately 78% of total variance, while PC2 contributes 17%, collectively explaining nearly 95% of variance (Figure 18). This high cumulative explanation indicates that PCR effectively captures essential relationships while substantially reducing dimensionality. The regression coefficients reveal each component’s influence on UCS prediction. PC1’s substantial negative coefficient (−170.70) indicates that variables loading heavily on this component exhibit strong inverse relationships with soil strength. This aligns with geotechnical principles where void ratio and porosity negatively impact UCS by creating matrix discontinuities that compromise structural integrity. PC2’s positive coefficient (21.24) indicates that variables with high loadings contribute positively to UCS development through secondary or interaction effects. PC1’s dominance confirms that primary UCS determinants include lime content, cement content, and pre-consolidation stress—properties enhancing soil strength through particle binding, cementitious reactions, and densification processes. The substantial variance explanation demonstrates that these properties collectively define a primary variation axis strongly predicting UCS behavior in stabilized soil systems. This sensitivity analysis provides a quantitative framework for understanding the relative importance of different soil properties in determining UCS, offering insights for optimizing stabilizer formulations. The high cumulative variance explanation validates the PCR approach for developing predictive models while maintaining the interpretability of underlying mechanisms governing soil strength enhancement.

Analysis of Principal Component Loadings in Soil Stabilization

Principal component loadings extraction reveals how individual geotechnical parameters contribute to the principal components, enabling the interpretation of soil mechanical behavior in response to stabilization treatments. The primary component (PC1), accounting for 46% of total variance, exhibits strong positive loadings for void ratio (0.462), porosity (0.463), and compression index (0.462), with substantial negative loadings for pre-consolidation stress (−0.439) and compressibility modulus (−0.407). This pattern characterizes PC1 as a fundamental contrast axis between soil compressibility and strength characteristics, capturing the inverse relationship between void spaces and mechanical strength consistent with geotechnical principles. The secondary component (PC2), explaining 20% of variance, shows pronounced negative loading for compressibility modulus (−0.909) with moderate positive loading for pre-consolidation stress (0.263). This component differentiates between these strength parameters, suggesting they represent distinct aspects of soil mechanical behavior not perfectly correlated. The tertiary component (PC3), contributing 15% of variance, is characterized by strong negative loading for pre-consolidation stress (−0.859), indicating that certain pre-consolidation behavior aspects warrant dedicated representation, potentially reflecting complex stress history dependencies not captured by PC1. Higher-order components exhibit specialized patterns, with PC4 influenced by porosity (−0.828) and compression index (0.407), while PC5 shows associations with void ratio (−0.714) and compression index (0.700). These components represent subtle soil characteristics unexplained by primary variation axes, with opposing loading signs suggesting conditional relationships between parameters manifesting under specific conditions.

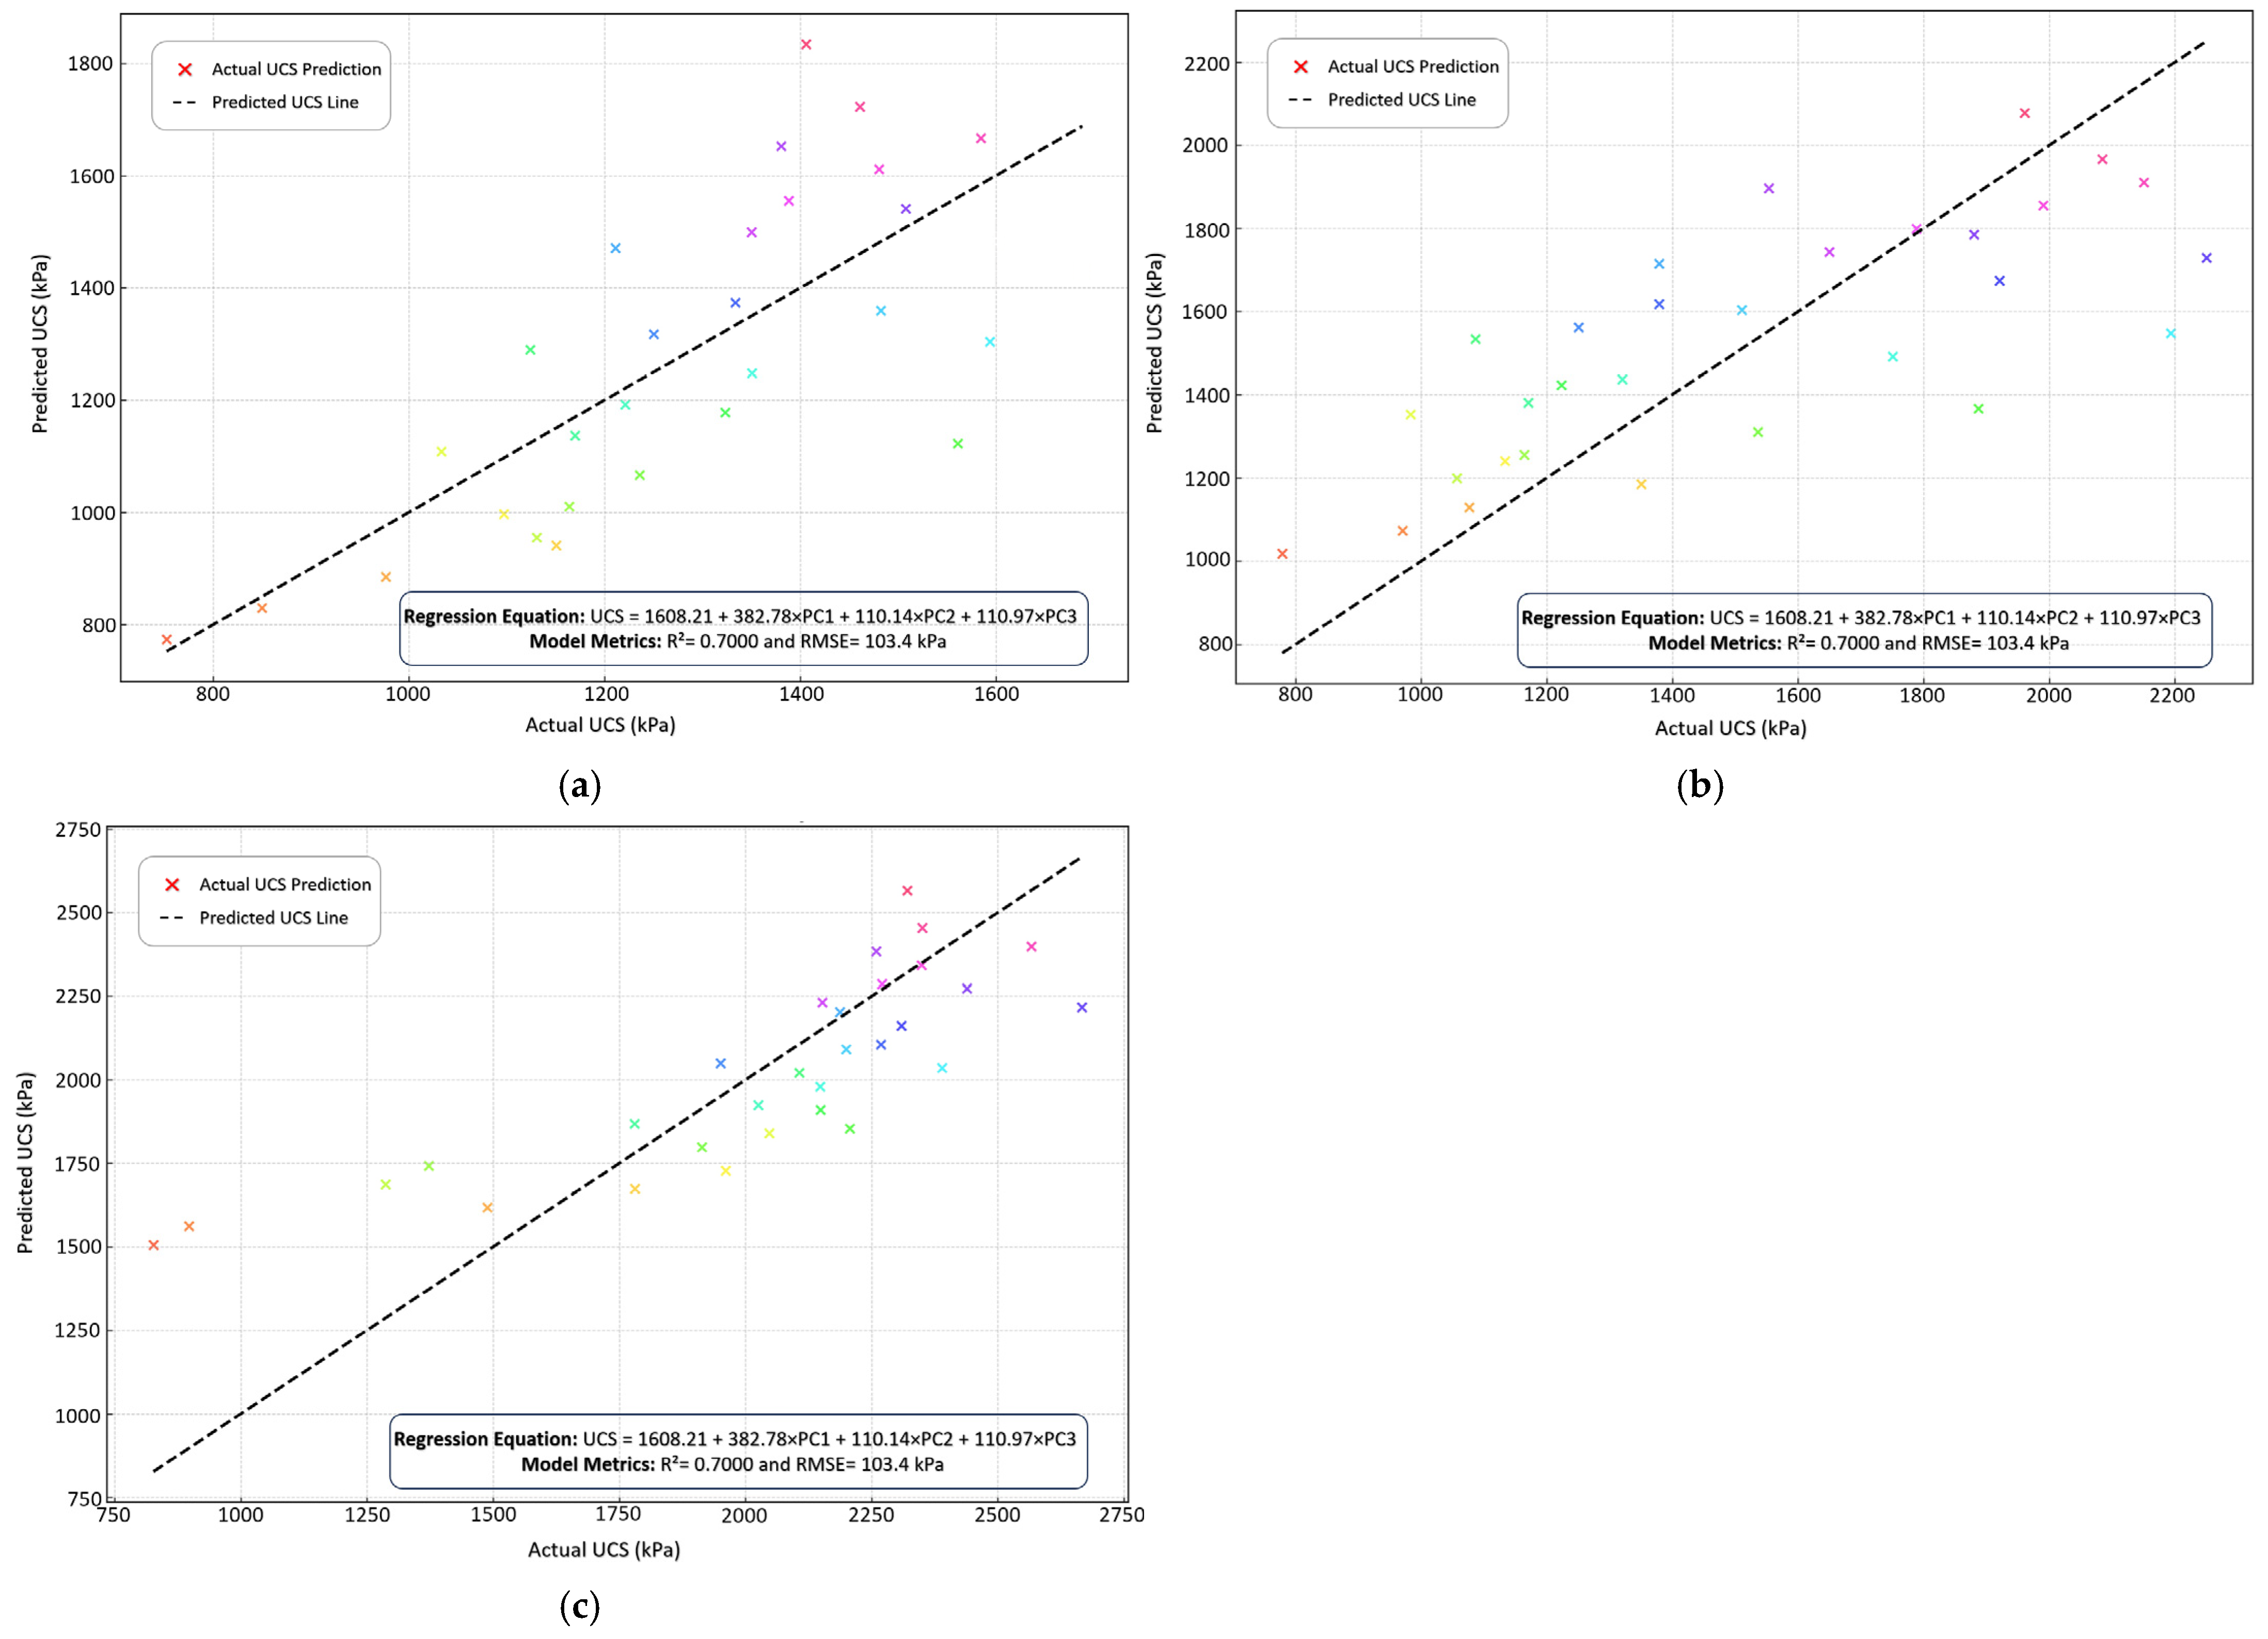
5.3. Principal Component Regression Sensitivity Analysis for Unconfined Compressive Strength

The principal component regression sensitivity analysis quantifies the relative influence of soil properties on UCS, revealing a clear hierarchical structure across principal components (Figure 19). PC1 (compressibility characteristics) exhibits the strongest impact with a regression coefficient of 0.72. Through loadings on void ratio, porosity, and compression index, this component directly influences soil matrix structure and compressive resistance. The positive coefficient confirms that reduced compressibility enhances UCS, supporting the established inverse relationship between void spaces and soil strength. PC2 (stiffness parameters) shows moderate importance (coefficient = 0.51), representing the contrast between compressibility modulus and pre-consolidation stress. This indicates that increased soil stiffness contributes positively to UCS development, though less significantly than fundamental compressibility properties. PC3 (pre-consolidation stress) demonstrates negative influence (coefficient = −0.32), suggesting that stress history effects interact with stabilization processes in ways that do not translate to proportional strength increases. This counterintuitive finding warrants further investigation. PC4 and PC5 show negligible influence, indicating that once primary compressibility effects are captured in PC1, subtle variations in porosity and void ratio become irrelevant to UCS prediction. The established hierarchy (compressibility > stiffness > stress history > minor variations) provides clear guidance for optimizing soil stabilization formulations, enabling engineers to focus on controlling primary compressibility characteristics while recognizing the limited value of fine-tuning secondary property variations.
Table 3 presents a principal component regression analysis of factors influencing soil settlement, showing how various soil properties contribute to settlement variance. PC1 (soil compressibility) accounts for the largest portion of variance (46%) with a high coefficient (0.72), indicating it has the highest sensitivity ranking. PC2 (modulus vs. pre-consolidation stress) contributes 20% of the variance with moderate sensitivity, while PC3-PC5 have progressively decreasing impacts on soil settlement behavior. This analysis helps geotechnical engineers prioritize the most influential parameters when modeling and predicting soil settlement. UCS increases with lime and cement but shows diminishing returns beyond 20–30% lime. For cross-validation, the PCR performance varies (R2 = 0.86), suggesting a fit model.
The principal component regression (PCR) sensitivity analysis conducted in this study, which identified soil compressibility (PC1, β = 0.72, 46% variance) as the dominant factor influencing unconfined compressive strength (UCS), demonstrates both consistency and contrast with alternative methodologies reported in the literature. When compared to studies employing multivariate adaptive regression splines (MARS) for UCS prediction [66], PCR offers a more interpretable hierarchical variable structure, though MARS may capture nonlinear interactions unobserved in linear PCR frameworks. For instance, Asare et al. achieved predictive accuracy with MARS but did not quantify parameter sensitivity hierarchies [26], which PCR explicitly resolves through regression coefficients and variance decomposition. Support vector regression (SVR) has shown superior predictive performance (R2 > 0.90) in some geomechanical studies [66], potentially surpassing this study’s PCR model (R2 = 0.86). However, SVR’s “black-box” nature obscures direct sensitivity quantification, whereas PCR’s coefficients provide clear mechanistic insights—such as the counterintuitive negative influence of pre-consolidation stress (PC3, β = −0.32)—that align with the findings of sensitivity analyses in functional principal component frameworks [26]. This underscores PCR’s unique utility in balancing interpretability with predictive capacity.
Traditional sensitivity analyses in regression models by Sala et al. [67], corroborate the hierarchical influence structure observed in the current study, though such studies often fail to account for multicollinearity as systematically as PCR. The 46% variance contribution of PC1 in this study exceeds the 32% reported in a similar PCR analysis of coastal sediment stability [26], likely due to differences in input parameter selection (e.g., inclusion of void ratio and compression index in this study vs. mineralogical variables in coastal studies). The diminishing returns of lime–cement content beyond 20–30% observed in this work parallel threshold effects identified in kernel-based supervised PCR approaches [68], though the latter employs reproducing kernel Hilbert spaces to model nonlinear dosage–response relationships. Notably, the negative coefficient for PC3 contrasts with principal component analyses of pre-consolidation stress in landslide susceptibility models [26], where positive correlations with strength were reported. This discrepancy may arise from contextual differences: the current study focuses on stabilized soils, whereas landslide analyses typically address natural soil profiles. The negligible impact of higher-order components (PC4–PC5, ≤12% variance) aligns with robust PCR studies employing singular value thresholding [68], which demonstrate that noise-dominated components contribute minimally to response variables.

5.4. Causality Analysis Using Principal Component Regression (PCR)

PCR analysis reveals the temporal evolution of soil property influences unconfined compressive strength development during stabilization curing (Figure 20). The analysis identifies two primary components: PC1 representing compressibility-related factors (void ratio, porosity, compression index) and PC2 encompassing stiffness-related properties (compressibility modulus, pre-consolidation stress). Both components exhibit negative coefficients, confirming inverse relationships with UCS where parameter reductions correlate with strength increases. PC1 demonstrates intensifying influence across the curing timeline, with coefficients strengthening from −76.84 at 7 days to −139.96 at 14 days and −170.70 at 28 days. This progressive enhancement indicates that compressibility-related parameters become increasingly dominant UCS determinants as curing advances. The trend aligns with fundamental stabilization theory, where continued lime and cement hydration progressively modifies soil structure through pozzolanic reactions that systematically reduce porosity and void ratio.
Conversely, PC2 exhibits variable temporal behavior, with coefficients changing from −39.7 at 7 days to −86.84 at 14 days before recovering to 21.24 at 28 days. This pattern indicates that stiffness-related properties contribute less significantly to strength development, particularly during extended curing periods, becoming progressively overshadowed by compressibility factors. The divergent PC1 and PC2 trajectories underscore complex soil stabilization dynamics, where structural improvements through reduced porosity and increased densification emerge as predominant strength-driving mechanisms. This temporal evolution provides guidance for optimizing stabilization practices by emphasizing techniques that enhance compressibility-related properties. Model performance metrics demonstrate progressive improvement with extended curing. The coefficient of determination increases from 68.7% at 7 days to 83.0% at 28 days, while cross-validation RMSE decreases from 11.2 kPa to 7.8 kPa, indicating that soil-stabilizer relationships become increasingly deterministic and reliable as curing advances. Throughout all temporal stages, PC1 maintains statistical significance as the predominant UCS predictor (p < 0.001), establishing compressibility parameters as invariant strength determinants regardless of curing duration (Table 4).
The principal component regression (PCR) causality analysis, which identifies the temporal evolution of soil property influences on unconfined compressive strength (UCS) during curing, demonstrates both alignment and contrast with alternative methodologies in geotechnical literature. The PCR results reveal a dominant role for compressibility-related parameters (PC1: β = −170.70 at 28 days) over stiffness-related properties (PC2: β = 21.24 at 28 days), with PC1’s influence intensifying over curing time. This aligns with studies employing multivariate adaptive regression splines (MARS) [69], which similarly prioritize porosity and void ratio in UCS prediction. However, MARS models often obscure the temporal dynamics of parameter influence due to their focus on nonlinear interactions, whereas PCR explicitly quantifies the progressive dominance of PC1 (from 68.7% to 83.0% R2 improvement). In contrast, support vector regression (SVR) studies by Artigue et al. [70] report higher predictive accuracy (R2 > 0.90) but fail to resolve the mechanistic hierarchy of variables, highlighting PCR’s unique strength in causal inference. The observed curing-time dependency of PC1 (increasing from β = −76.84 at 7 days to β = −170.70 at 28 days) corroborates findings from time-series functional principal component analysis (FPCA) [26], which links prolonged curing to microstructural densification. However, FPCA typically requires dense temporal sampling, whereas PCR achieves comparable insights with fewer time points (7, 14, 28 days). The diminishing role of PC2 (stiffness) over time contrasts with kernel-based PCR approaches [70], which model nonlinear dosage–response relationships but may overemphasize early-stage stiffness contributions due to kernel weighting biases.
The PCR model’s R2 improvement (68.7% to 83.0%) and RMSE reduction (11.2 kPa to 7.8 kPa) align with elastic net PCR studies [70], which similarly report enhanced stability in later curing stages. However, elastic net PCR often incorporates regularization to mitigate multicollinearity [26], whereas this study’s reliance on variance decomposition avoids coefficient constraints that might obscure causal relationships. The consistent significance of PC1 (p < 0.001) across all curing stages contrasts with traditional multiple regression, where collinearity frequently destabilizes parameter estimates, underscoring PCR’s robustness in handling correlated predictors. The negative influence of PC3 (pre-consolidation stress, β = −0.32) in this study contrasts with landslide susceptibility models, where pre-consolidation stress positively correlates with strength. While PCR provides interpretable causal hierarchies, its linear framework may overlook nonlinear interactions captured by random forest or gradient-boosting models. Hybrid approaches combining PCR with functional data analysis could reconcile these limitations by modeling temporal trajectories as continuous functions. Additionally, the PCR-identified threshold of 20–30% lime–cement content for diminishing returns aligns with response surface methodology (RSM) studies, suggesting opportunities for integrating PCR with RSM to optimize additive dosages.
This PCR analysis offers a nuanced understanding of UCS causality in stabilized soils, particularly the time-dependent dominance of compressibility over stiffness parameters. While non-PCR methods like SVR or MARS may achieve marginally higher predictive accuracy, they lack PCR’s ability to decompose variance and trace mechanistic pathways. Future work should explore geographically weighted PCR to account for spatial variability in soil properties, enhancing the generalizability of these findings. This research investigates high-plasticity clay stabilization from Kano, Nigeria, using lime (0–30%) and cement (0–8%) additives. The study employs PCA and PCR to examine relationships between stabilizer content, curing time (7–28 days), and geotechnical properties including UCS, void ratio, porosity, compression index, pre-consolidation stress, and compressibility modulus. The research successfully evaluates lime–cement stabilization efficacy, establishes UCS predictive models, and elucidates soil-stabilizer interaction mechanisms for sustainable infrastructure development in expansive clay regions. Key constraints include exclusive focus on lime–cement stabilizers, restriction to 28-day curing periods, residual PCR model variance indicating unaccounted factors (environmental conditions, nonlinear interactions), and laboratory conditions potentially inadequately representing field heterogeneities. Recommended research should encompass diverse soil types and geographic locations, incorporate alternative stabilizers, extend curing periods, implement advanced nonlinear models or machine learning algorithms, conduct field validation trials, and perform comprehensive life cycle and techno-economic analyses for sustainable geotechnical applications.

6. Conclusions

In conclusion, variables like cement and lime contents significantly influenced material properties. PCA captured significant variance, enabling visualization of relationships. At the same time, PCR leveraged dimension reduction for accurate prediction, sensitivity and causal insight offering a powerful approach for optimizing sustainable, high-performance cementitious mixtures. Based on the results of this research, it can be concluded that;
  • The combination of 6% cement and 15% lime (by dry soil weight) yielded maximum improvements: UCS increased by 222.5% to 2670 kPa at 28 days, void ratio decreased by 58% to 0.25, porosity decreased by 49.5% to 0.19, pre-consolidation stress increased by 206% to 1088.92 kPa, and the compression index decreased by 58% to 0.20, and the compressibility modulus increased by 16% to 10,474.28 kPa compared to untreated soil (779 kPa UCS, 0.60 void ratio, 0.38 porosity, 355.63 kPa preconsolidation stress, 0.48 compression index, and 7048 kPa compressibility modulus).
  • A single principal component (PC1) explained the vast majority of variance in key consolidation parameters: 90.33% for void ratio, 98.32% for porosity, 99.32% for pre-consolidation stress, 99.75% for compression index, and 99.89% for compressibility modulus. This overwhelmingly indicates that the combined lime and cement stabilizer content is the primary driver of microstructural modification and densification, with secondary factors contributing minimally.
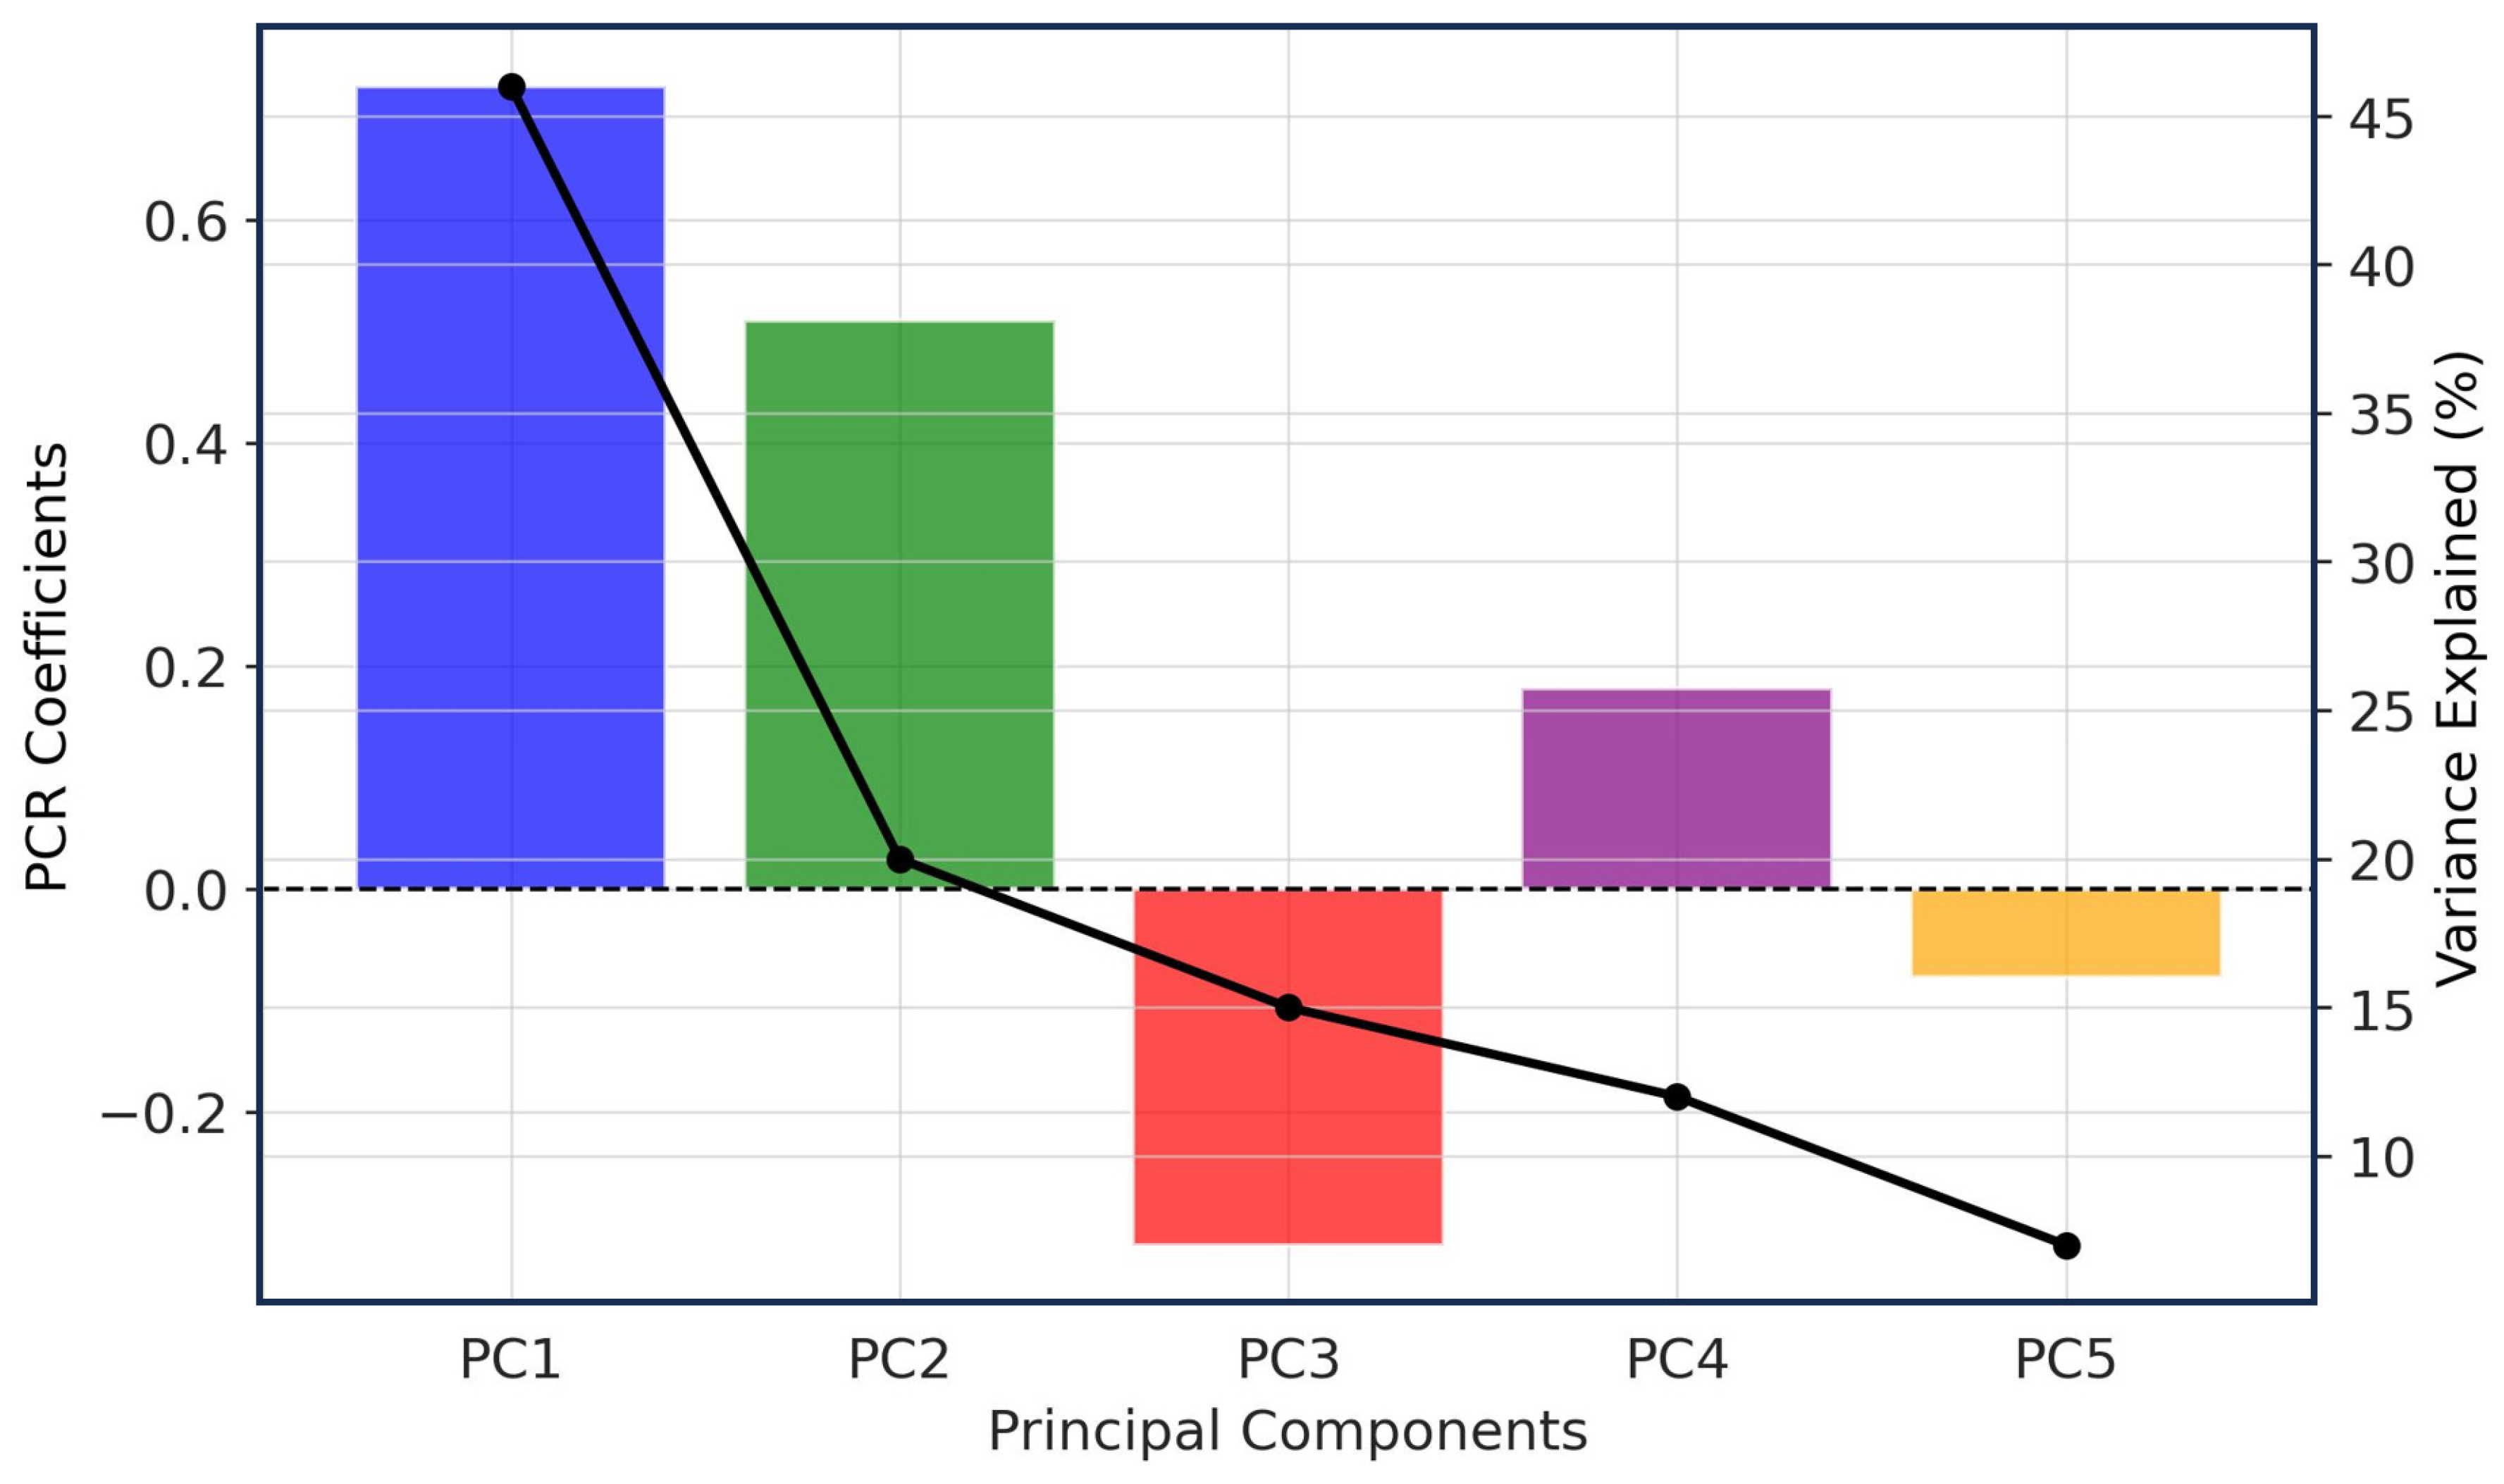
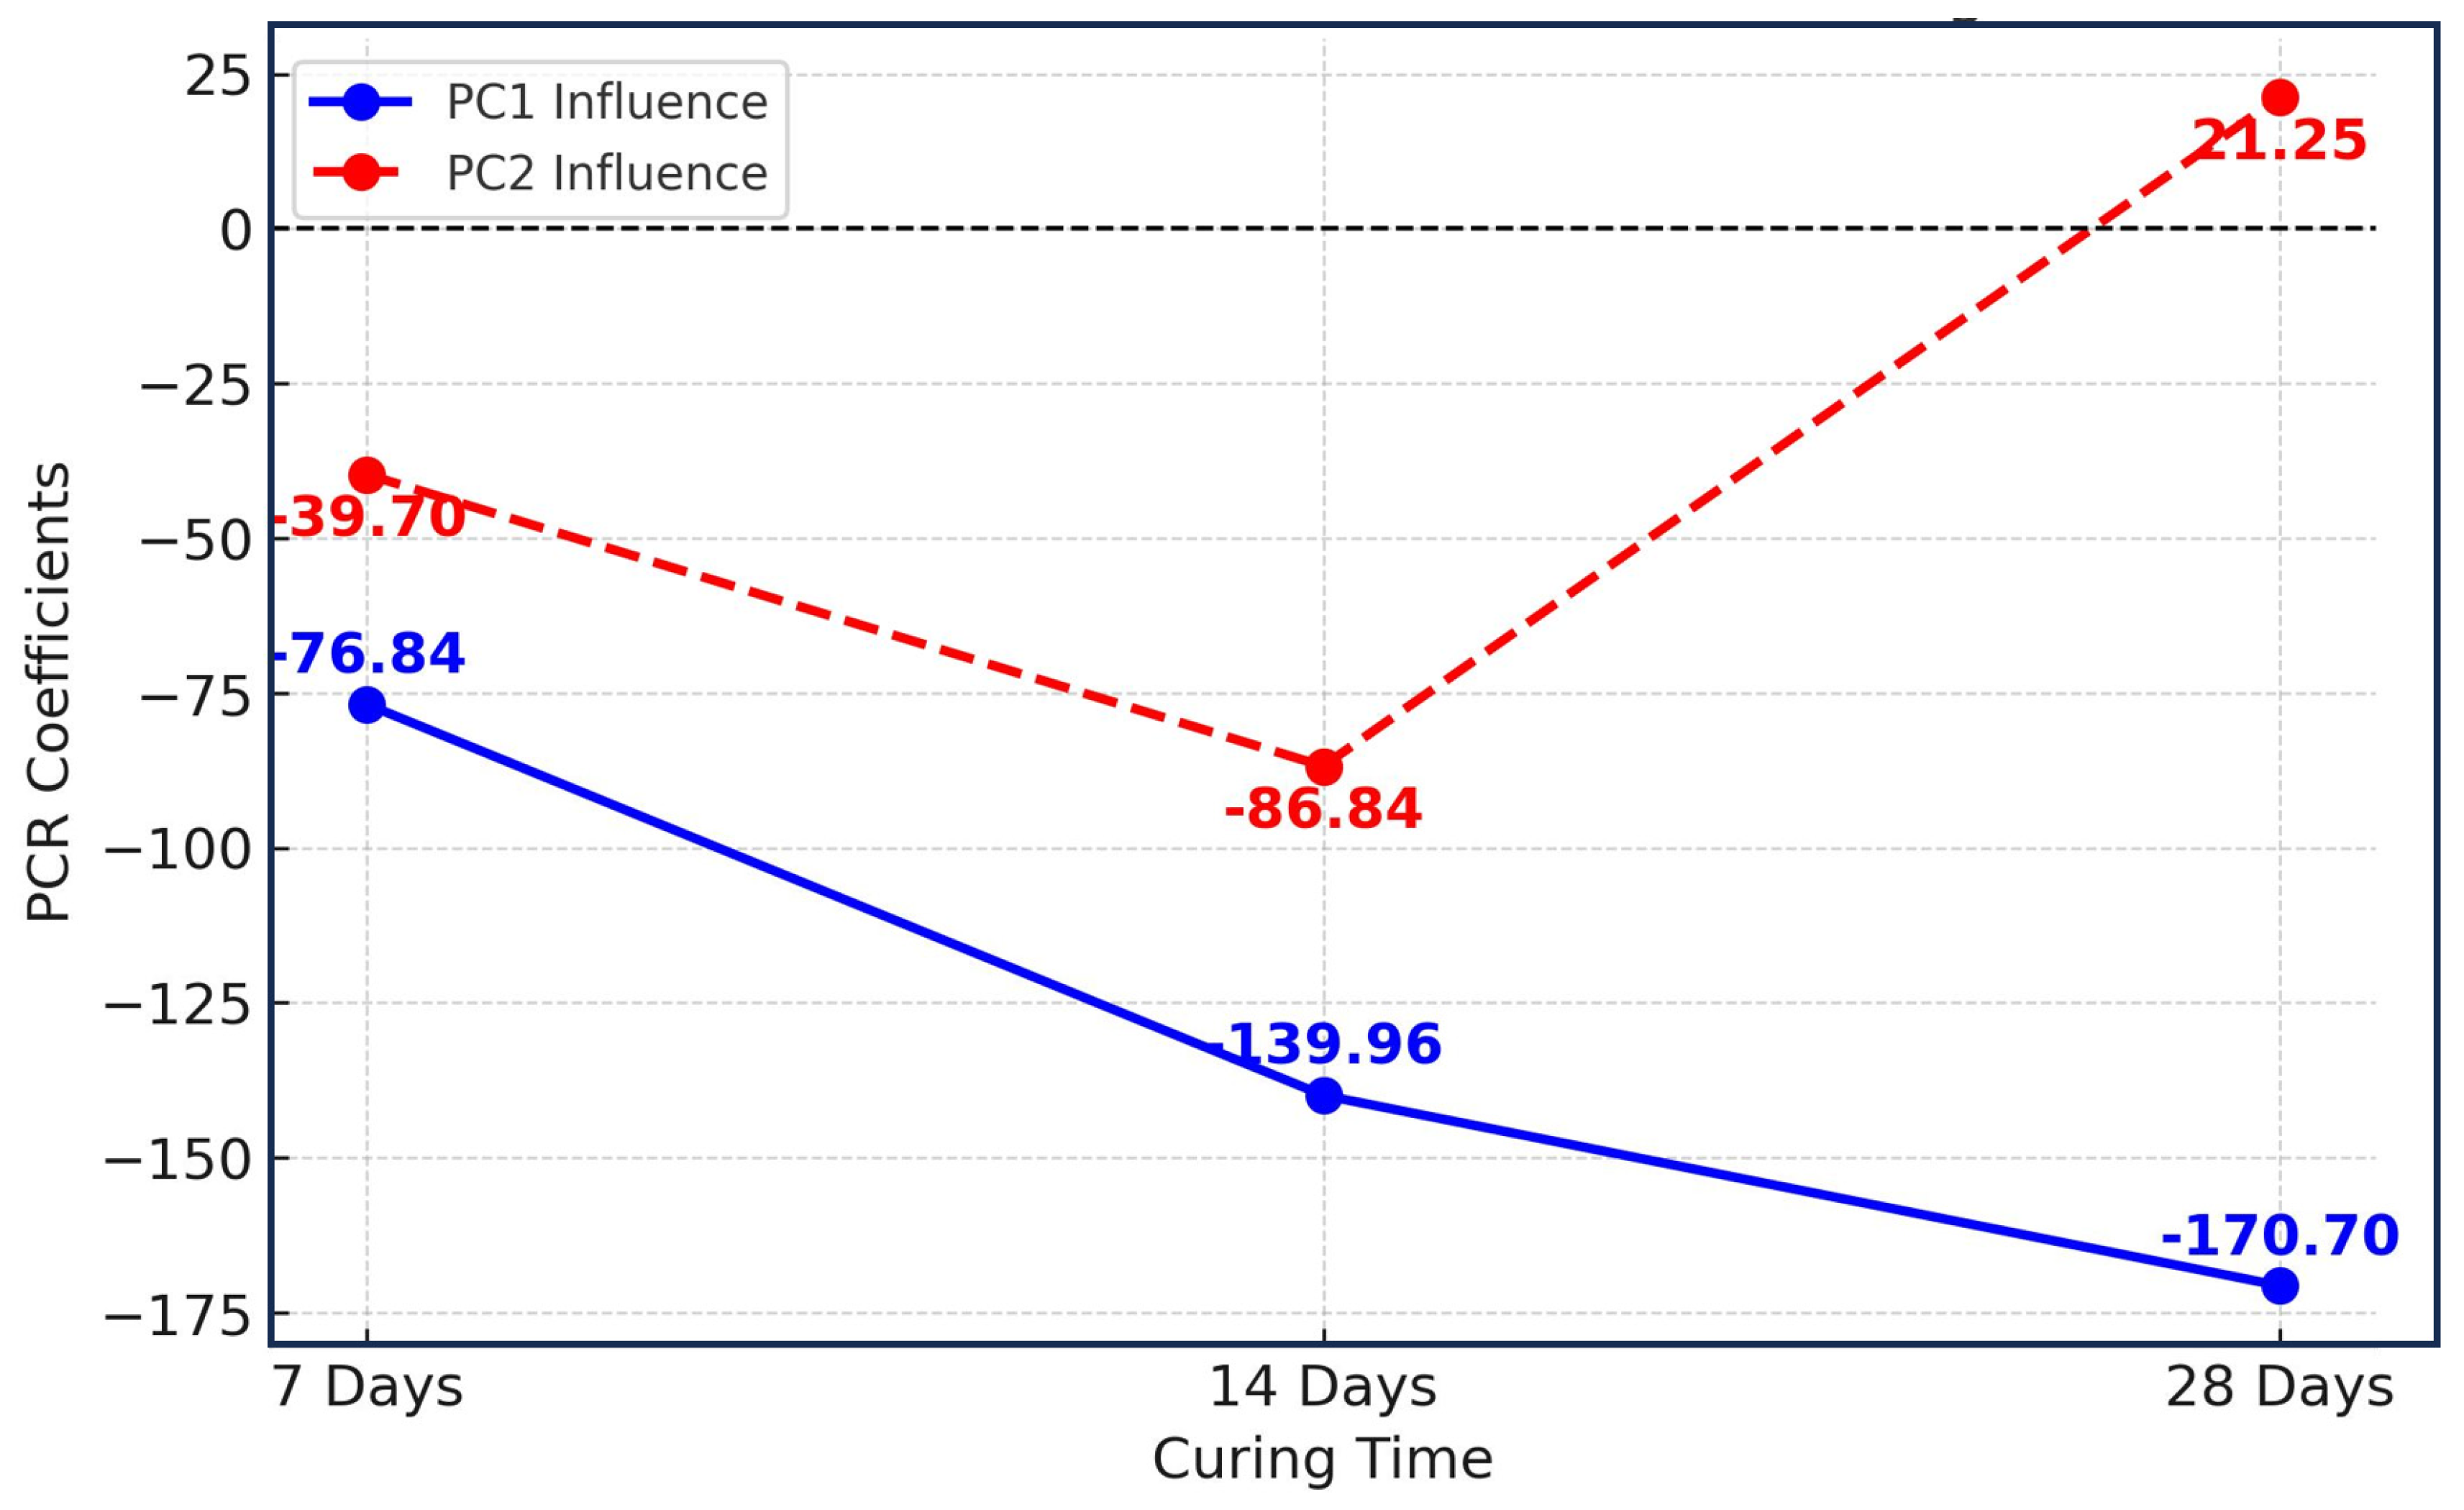
  • The PCR model achieved an R2 of 0.700 and an RMSE of 103.4 kPa for UCS prediction. The PCR causality model showed marked improvement in predictive accuracy with curing time, with R2 increasing from 0.687 at 7 days to 0.830 at 28 days, while RMSE decreased from 11.2 kPa to 7.8 kPa. Sensitivity analysis identified soil compressibility characteristics (PC1: void ratio, porosity, compression index) as the dominant influence on UCS (46% variance explained, β = −170.70 at 28 days), with its negative effect intensifying progressively from β = −76.84 at 7 days to β = −170.70 at 28 days, confirming that reduced compressibility is the primary causal mechanism for strength gain.
  • The most significant UCS gain occurred between 7 and 14 days under optimal stabilization (15% lime, 6% cement), increasing by 40.4% (1584.62 kPa to 2250.42 kPa), compared to only an 18.5% increase from 14 to 28 days (2250.42 kPa to 2670 kPa). Concurrently, the PCR model’s explanatory power (R2) improved from 68.7% at 7 days to 83.0% at 28 days, indicating that soil-stabilizer interactions become more deterministic and predictable with extended curing.
  • Resistance to strength loss, evaluated after 7 days of soaking following 7 days of curing compared to 14-day cured strength, increased substantially from only 9% for untreated soil to 76% for soil stabilized with the optimal combination (15% lime, 6% cement). This demonstrates the effectiveness of the formed cementitious bonds (C-S-H, C-A-H gels) in creating a water-resistant soil matrix with enhanced long-term performance under adverse environmental conditions.

Author Contributions

Methodology, H.L., R.C., and A.B.B.; laboratory experiments, Z.A.T., and J.I.H.; validation, I.H.U., R.C., and H.L.; formal analysis, R.C., A.B.B., and Z.A.T.; writing—original draft, J.I.H., Z.A.T., and I.H.U.; writing—review and editing, I.H.U., A.B.B., R.C., and H.L. All authors have read and agreed to the published version of the manuscript.

Funding

This paper receives its funding from Projects (5247042340, 42277175) supported by National Natural Science Foundation of China; Project (2023JJ30657, 2023JJ30666) supported by Hunan Provincial Natural Science Foundation of China; Guizhou Provincial Major Scientific and Technological Program (2023-425). The authors wish to acknowledge this support.

Data Availability Statement

Some or all data, models, or codes that support the findings of this study are available from the corresponding author upon reasonable request.

Acknowledgments

The authors express gratitude for the financial support extended by the organizations referenced in the funding section.

Conflicts of Interest

On behalf of all authors, the corresponding author states that there is no conflict of interest.

References

  1. Zhao, J.; Xie, H.; Li, C.; Liu, Y. Deep Learning-Based Reconstruction of 3D Morphology of Geomaterial Particles from Single-View 2D Images. Materials 2024, 17, 5100. [Google Scholar] [CrossRef] [PubMed]
  2. Arias-Jaramillo, Y.P.; Gómez-Cano, D.; Carvajal, G.I.; Hidalgo, C.A.; Muñoz, F. Evaluation of the Effect of Binary Fly Ash-Lime Mixture on the Bearing Capacity of Natural Soils: A Comparison with Two Conventional Stabilizers Lime and Portland Cement. Materials 2023, 16, 3996. [Google Scholar] [CrossRef] [PubMed]
  3. Ibrahim, A.; Idris, A.; Umar, I.; Lin, H.; Shehu, H. Enhanced bearing capacity prediction using hybrid tree-based ensemble learning with advanced meta-heuristic optimization. Eng. Res. Express 2025, 7, 015113. [Google Scholar] [CrossRef]
  4. Umar, I.; Abubakar, S.; Lin, H.; Hassan, J. Metakaolin as a soil stabilizing admixture: A comprehensive analysis of California bearing ratio and consolidation behavior using experimental and machine learning approaches. Earth Sci. Inform. 2025, 18, 200. [Google Scholar] [CrossRef]
  5. Elhaik, E. Principal Component Analyses (PCA)-based findings in population genetic studies are highly biased and must be reevaluated. Sci. Rep. 2022, 12, 14683. [Google Scholar] [CrossRef]
  6. Anowar, F.; Sadaoui, S.; Selim, B. Conceptual and empirical comparison of dimensionality reduction algorithms (PCA, KPCA, LDA, MDS, SVD, LLE, ISOMAP, LE, ICA, t-SNE). Comput. Sci. Rev. 2021, 40, 100378. [Google Scholar] [CrossRef]
  7. Pan, J.; Lin, H.; Wu, J.; Zeng, L. An innovative GWO-BiLSTM model for predicting the advance rates of double-line subway shield tunneling with TBM. Arch. Civ. Mech. Eng. 2025, 25, 163. [Google Scholar] [CrossRef]
  8. Panchbhai, K.G.; Lanjewar, M.G.; Naik, A.V. Modified MobileNet with leaky ReLU and LSTM with balancing technique to classify the soil types. Earth Sci. Inform. 2024, 18, 77. [Google Scholar] [CrossRef]
  9. Malashin, I.; Tynchenko, V.; Gantimurov, A.; Nelyub, V.; Borodulin, A. Applications of Long Short-Term Memory (LSTM) Networks in Polymeric Sciences: A Review. Polymers 2024, 16, 2607. [Google Scholar] [CrossRef]
  10. Onyelowe, K.C.; Moghal, A.A.B.; Ebid, A.; Rehman, A.U.; Hanandeh, S.; Priyan, V. Estimating the strength of soil stabilized with cement and lime at optimal compaction using ensemble-based multiple machine learning. Sci. Rep. 2024, 14, 15308. [Google Scholar] [CrossRef]
  11. Ahmed, S.A.K.; Vakili, A.H.; Keskin, I.; Onur, M.I. A state-of-the-art review on the dynamic characteristics of untreated and treated soils by traditional, recycled, and sustainable stabilizers. Transp. Geotech. 2024, 49, 101430. [Google Scholar] [CrossRef]
  12. Liu, H.; Su, H.; Sun, L.; Dias-Da-Costa, D. State-of-the-art review on the use of AI-enhanced computational mechanics in geotechnical engineering. Artif. Intell. Rev. 2024, 57, 196. [Google Scholar] [CrossRef]
  13. Jeremiah, J.J.; Abbey, S.J.; Booth, C.A.; Kashyap, A. Results of Application of Artificial Neural Networks in Predicting Geo-Mechanical Properties of Stabilised Clays—A Review. Geotechnics 2021, 1, 147–171. [Google Scholar] [CrossRef]
  14. Umar, I.H.; Firat, M.E.O. A Study on Uniaxial Compressive Strength and Ultrasonic Non-Destructive Analysis of Fine-Grained Soil in Seasonally Frozen Regions. Turk. J. Sci. Technol. 2022, 17, 267–277. [Google Scholar] [CrossRef]
  15. Baldovino, J.d.J.A.; Palma Calabokis, O.; Saba, M. From Bibliometric Analysis to Experimental Validation: Bibliometric and Literature Review of Four Cementing Agents in Soil Stabilization with Experimental Focus on Xanthan Gum. Sustainability 2024, 16, 5363. [Google Scholar] [CrossRef]
  16. ASTM D24872018; Standard Practice for Classification of Soils for Engineering Purposes (Unified Soil Classification System). ASTM: West Conshohocken, PA, USA, 2018; pp. 125–133.
  17. ASTM D422-632018; Standard Test Method for Particle-Size Analysis of Soils. ASTM: West Conshohocken, PA, USA, 2018.
  18. ASTM D4318-002018; Standard Test Methods for Liquid Limit, Plastic Limit, and Plasticity Index of Soils. ASTM: West Conshohocken, PA, USA, 2018.
  19. ASTM D8542023; Standard Test Methods for Specific Gravity of Soil Solids by the Water Displacement Method. ASTM: West Conshohocken, PA, USA, 2023.
  20. ASTM D2166-062010; Standard Test Method for Unconfined Compressive Strength of Cohesive Soil. ASTM: West Conshohocken, PA, USA, 2010.
  21. ASTM D2435M-11(2020); Standard Test Methods for One-Dimensional Consolidation Properties of Soils Using Incremental Loading. ASTM: West Conshohocken, PA, USA, 2020.
  22. ASTM D698-122021; Standard Test Methods for Laboratory Compaction Characteristics of Soil Using Standard Effort. ASTM: West Conshohocken, PA, USA, 2021.
  23. ASTM D7263-212021; Standard Test Methods for Laboratory Determination of Density and Unit Weight of Soil Specimens. ASTM: West Conshohocken, PA, USA, 2021.
  24. ASTM D2216-192019; Standard Test Methods for Laboratory Determination of Water (Moisture) Content of Soil and Rock by Mass. ASTM: West Conshohocken, PA, USA, 2019.
  25. Tang, T.M.; Allen, G.I. Integrated Principal Components Analysis. J. Mach. Learn. Res. 2021, 22, 1–71. [Google Scholar]
  26. Perrin, T.V.E.; Roustant, O.; Rohmer, J.; Alata, O.; Naulin, J.; Idier, D.; Pedreros, R.; Moncoulon, D.; Tinard, P. Functional principal component analysis for global sensitivity analysis of model with spatial output. Reliab. Eng. Syst. Saf. 2021, 211, 107522. [Google Scholar] [CrossRef]
  27. Umar, I.H.; Lin, H.; Ibrahim, A.S. Laboratory Testing and Analysis of Clay Soil Stabilization Using Waste Marble Powder. Appl. Sci. 2023, 13, 9274. [Google Scholar] [CrossRef]
  28. Lee, G.; Sim, E.; Yoon, Y.; Lee, K. Probabilistic orthogonal-signal-corrected principal component analysis. Knowl.-Based Syst. 2023, 268, 110473. [Google Scholar] [CrossRef]
  29. Greenacre, M.; Groenen, P.J.F.; Hastie, T.; D’Enza, A.I.; Markos, A.; Tuzhilina, E. Principal component analysis. Nat. Rev. Methods Prim. 2022, 2, 100. [Google Scholar] [CrossRef]
  30. Ji, Y.; Fu, J.; Lu, Y.; Liu, B. Three-dimensional-based global drought projection under global warming tendency. Atmos. Res. 2023, 291, 106812. [Google Scholar] [CrossRef]
  31. Iliyas, S.; Idris, A.; Umar, I.H.; Lin, H.; Muhammad, A.; Xie, L. Experiment and Analysis of Variance for Stabilizing Fine-Grained Soils with Cement and Sawdust Ash as Liner Materials. Materials 2024, 17, 2397. [Google Scholar] [CrossRef]
  32. Laouidji, Z.; Boutlikht, M.; Douadi, A.; Hebbache, K.; Atiki, E.; Belebchouche, C.; Moretti, L.; Czarnecki, S. Exploring the Effect of Lime and Cement Ratios on the Mechanical Properties of Clay Bricks Made from Different Types of Soils. Buildings 2025, 15, 631. [Google Scholar] [CrossRef]
  33. Parhizkar, A.; Nazarpour, A.; Khayat, N. Investigation of geotechnical and microstructure characteristics of gypsum soil using ground granulated blast-furnace slag (GGBS), fly ash, and lime. Constr. Build. Mater. 2024, 418, 135358. [Google Scholar] [CrossRef]
  34. Qureshi, L.A.; Ali, B.; Ali, A. Combined effects of supplementary cementitious materials (silica fume, GGBS, fly ash and rice husk ash) and steel fiber on the hardened properties of recycled aggregate concrete. Constr. Build. Mater. 2020, 263, 120636. [Google Scholar] [CrossRef]
  35. Khan, S.U.; Nuruddin, M.F.; Ayub, T.; Shafiq, N. Effects of different mineral admixtures on the properties of fresh concrete. Sci. World J. 2014, 2014, 986567. [Google Scholar] [CrossRef]
  36. Banu, S.A.; Attom, M.F. Effect of Curing Time on Lime-Stabilized Sandy Soil against Internal Erosion. Geosciences 2023, 13, 102. [Google Scholar] [CrossRef]
  37. Boukhatem, G.; Bencheikh, M.; Benzerara, M.; Anas, S.M.; Sabri, M.M.; Najm, H.M. Optimizing properties of clayey soil using lime and waste marble powder: A sustainable approach for engineering applications. Front. Mater. 2024, 11, 1392875. [Google Scholar] [CrossRef]
  38. Hasan, H.; Dang, L.; Khabbaz, H.; Fatahi, B. Swelling pressure and consolidation of soft clay stabilized with bagasse ash and lime. In Proceedings of the 10th International Conference on the Bearing Capacity of Roads, Railways and Airfields (BCRRA 2017), Athens, Greece, 28–30 June 2017; pp. 1069–1075. [Google Scholar]
  39. Abu Talib, M.K.; Yasufuku, N.; Ishikura, R. Effects of sugarcane bagasse ash (SCBA) on the strength and compressibility of cement stabilized peat. Lowl. Technol. Int. 2015, 17, 73–82. [Google Scholar] [CrossRef]
  40. Zhang, Q.; Chen, W.; Fan, W.; Liu, D. The effect of polyvinyl alcohol solution with a high degree of alcoholysis on the expansion and cracking behaviour of quicklime-treated soil in earthen sites. Bull. Eng. Geol. Environ. 2021, 80, 4159–4170. [Google Scholar] [CrossRef]
  41. Zhang, Q.; Chen, W.; Han, N.; Cai, T.; Du, Y. Feasibility of Polyvinyl Alcohol-Treated Soil in a Mud State as the Anti-Weathering Material for Earthen Sites. Int. J. Arch. Heritage 2021, 17, 486–499. [Google Scholar] [CrossRef]
  42. Oshioname, E.A.; Paul, Y.; Mustapha, A.; Abdullahi, A.-A. Consolidation Characteristics of Lateritic Soil Treated with Rice Husk Ash. Malays. J. Civ. Eng. 2022, 34, 19–28. [Google Scholar] [CrossRef]
  43. Mohamed, A.A.M.S.; Yuan, J.; Al-Ajamee, M.; Dong, Y.; Ren, Y.; Hakuzweyezu, T. Improvement of expansive soil characteristics stabilized with sawdust ash, high calcium fly ash and cement. Case Stud. Constr. Mater. 2023, 18, e01894. [Google Scholar] [CrossRef]
  44. Khankhaje, E.; Jang, H.; Kim, J.; Rafieizonooz, M. Utilizing rice husk ash as cement replacement in pervious concrete: A review. Dev. Built Environ. 2025, 22, 100675. [Google Scholar] [CrossRef]
  45. Anvar, A.; Said, S.; Kadir, U.; Ilkhom, K. Some Peculiarities of the Process of Preparing the Zeolites Containing Breeds in a Ball Mill. Int. J. Recent Technol. Eng. 2019, 8, 7695–7698. [Google Scholar] [CrossRef]
  46. Lone, I.J.; Joia, P.S. Soil Stabilization of Black Cotton Soil Using Lime and Wood Ash. Int. Res. J. Eng. Technol. 2022, 9, 1111–1117. [Google Scholar]
  47. Olaiya, B.C.; Lawan, M.M.; Olonade, K.A. Utilization of sawdust composites in construction—A review. SN Appl. Sci. 2023, 5, 140. [Google Scholar] [CrossRef]
  48. Seghir, N.T.; Mellas, M.; Sadowski, Ł.; Żak, A. Effects of marble powder on the properties of the air-cured blended cement paste. J. Clean. Prod. 2018, 183, 858–868. [Google Scholar] [CrossRef]
  49. Alyamaç, K.; Aydin, A. Concrete properties containing fine aggregate marble powder. KSCE J. Civ. Eng. 2015, 19, 2208–2216. [Google Scholar] [CrossRef]
  50. Ramzi, S.; Hajiloo, H. The Effects of Supplementary Cementitious Materials (SCMs) on the Residual Mechanical Properties of Concrete after Exposure to High Temperatures—Review. Buildings 2023, 13, 103. [Google Scholar] [CrossRef]
  51. Umar, I.H.; Muhammad, A.; Ahmad, A.; Yusif, M.A.; Yusuf, A. Suitability of Geotechnical Properties of Bentonite-Bagasse Ash Mixtures Stabilized Lateritic Soil as Barrier in Engineered Waste Landfills. In Proceedings of the 7th International Student Symposium, Samsun, Turkey, 1–3 October 2021; Ondokuz Mayiz University: Samsun, Turkey, 2021. [Google Scholar]
  52. Güllü, H.; Yetim, M.; Güllü, E. On the rheological, fresh and strength effects of using nano-silica added geopolymer grout for grouting columns. Eur. J. Environ. Civ. Eng. 2023, 28, 1183–1207. [Google Scholar] [CrossRef]
  53. Güllü, H.; Yetim, M.E.; Güllü, E.B. Effect of using nano-silica on the rheological, fresh and strength characteristics of cement-based grout for grouting columns. J. Build. Eng. 2023, 76, 107100. [Google Scholar] [CrossRef]
  54. Thomas, G.; Kodi, R. Strengthening of cement blended soft clay with nano-silica particles. Geomech. Eng. 2020, 20, 505–516. [Google Scholar] [CrossRef]
  55. Mirzababaei, M.; Karimiazar, J.; Teshnizi, E.S.; Arjmandzadeh, R.; Bahmani, S.H. Effect of Nano-Additives on the Strength and Durability Characteristics of Marl. Minerals 2021, 11, 1119. [Google Scholar] [CrossRef]
  56. Bayat, M. Nanomaterials in Geotechnical Engineering: A Comprehensive Review on Soil Improvement Techniques. Civ. Eng. Infrastruct. J. 2025. [Google Scholar] [CrossRef]
  57. Uddin, M.N.; Hossain, M.T.; Mahmud, N.; Alam, S.; Jobaer; Mahedi, S.I.; Ali, A. Research and applications of nanoclays: A review. SPE Polym. 2024, 5, 507–535. [Google Scholar] [CrossRef]
  58. Changizi, F.; Haddad, A. Application of Nano Materials in Improving Geotechnical Properties of Soils: A Review Study. J. Rehabil. Civ. Eng. 2023, 11, 138–158. [Google Scholar] [CrossRef]
  59. Turan, C.; Javadi, A.A.; Vinai, R. Effects of Class C and Class F Fly Ash on Mechanical and Microstructural Behavior of Clay Soil—A Comparative Study. Materials 2022, 15, 1845. [Google Scholar] [CrossRef]
  60. Magara, D.; She, H. A Systematic Review of the Effects of Soil Stabilization on Soil Mechanical Properties: A Comparative Study of Fly Ash, Cement and Lime. Open Access Libr. J. 2024, 11, 1–19. [Google Scholar] [CrossRef]
  61. Ramanujam, I.V.R.; Reddy, K.R.; Ramana, N.V. Evaluation of Pozzolanic activity and lime reactivity of fly ash, GGBS, mica powder and pumice as binders. E3S Web Conf. 2024, 529, 01008. [Google Scholar] [CrossRef]
  62. Darsi, B.P.; Molugaram, K.; Madiraju, S.V.H. Subgrade Black Cotton Soil Stabilization Using Ground Granulated Blast-Furnace Slag (GGBS) and Lime, an Inorganic Mineral. Environ. Sci. Proc. 2021, 6, 15. [Google Scholar] [CrossRef]
  63. Xie, J.; Wang, J.; Rao, R.; Wang, C.; Fang, C. Effects of combined usage of GGBS and fly ash on workability and mechanical properties of alkali activated geopolymer concrete with recycled aggregate. Compos. Part B Eng. 2018, 164, 179–190. [Google Scholar] [CrossRef]
  64. Phoon, K.-K.; Cao, Z.-J.; Ji, J.; Leung, Y.F.; Najjar, S.; Shuku, T.; Tang, C.; Yin, Z.-Y.; Ikumasa, Y.; Ching, J. Geotechnical uncertainty, modeling, and decision making. Soils Found. 2022, 62, 101189. [Google Scholar] [CrossRef]
  65. Efaw, C.M.; Wu, Q.; Gao, N.; Zhang, Y.; Zhu, H.; Gering, K.; Hurley, M.F.; Xiong, H.; Hu, E.; Cao, X.; et al. Localized high-concentration electrolytes get more localized through micelle-like structures. Nat. Mater. 2023, 22, 1531–1539. [Google Scholar] [CrossRef]
  66. Khanmohammadi, M.; Sadrara, M. Application of principal component analysis–multivariate adaptive regression splines for the determination of surface area in zeolites. J. Chemom. 2022, 37, e3431. [Google Scholar] [CrossRef]
  67. Sala, L.T.; Nwaogazie, I.L.; Ugbebor, J.N.; Inyang, U.J.; Onofeghara, C.O.; Fowode, K.V.; Ozobu, C.O.; Eyenike, N. Application of Sensitivity & Principal Component Analyses for Modelling of Safety Parameters for Oil & Gas Companies in Niger Delta. Asian J. Probab. Stat. 2025, 27, 97–111. [Google Scholar] [CrossRef]
  68. Sharbaf, M.A.M.J.; Abedini, M.J. Implementation of supervised principal component analysis for global sensitivity analysis of models with correlated inputs. Stoch. Environ. Res. Risk Assess. 2022, 36, 2789–2818. [Google Scholar] [CrossRef] [PubMed]
  69. Suvarnapathaki, S. Use of Principal Component Analysis in Regression Problem. Int. J. Res. Anal. Rev. 2023, 10, 125–135. [Google Scholar] [CrossRef]
  70. Kawano, S.; Fujisawa, H.; Takada, T.; Shiroishi, T. Sparse principal component regression for generalized linear models. Comput. Stat. Data Anal. 2018, 124, 180–196. [Google Scholar] [CrossRef]
Figure 1. Particle size distribution curve for a soil sample, with percentage passing plotted against particle size on a semi-logarithmic scale.
Applsci 15 07150 g001
Figure 2. Laboratory triaxial testing machine setup showing loading frame, pressure cell, and control panel used for measuring the UCS of soil specimens.
Applsci 15 07150 g002
Figure 3. Consolidation test apparatus showing the loading frame, consolidation cell, and dial gauge.
Applsci 15 07150 g003
Figure 4. Research progresses from material preparation through testing and analysis to final optimization.
Applsci 15 07150 g004
Figure 5. Trends analysis of lime–cement stabilized soil: (a). Void ratio, and (b). Porosity.
Applsci 15 07150 g005
Figure 6. Principal component analysis of lime–cement stabilized soil: (a). Scree plot for void ratio, (b). Scree plot for porosity, (c). Principal component biplot for void ratio, and (d). Principal component biplot for porosity.
Applsci 15 07150 g006
Figure 7. Preconsolidation stress variations with cement content (0–8%) across different lime percentages (0–30%).
Applsci 15 07150 g007
Figure 8. Principal component analysis of pre-consolidation stress in lime–cement stabilized soil.
Applsci 15 07150 g008
Figure 9. Compression index variation with cement content (0–8%) for different lime percentages (0–30%).
Applsci 15 07150 g009
Figure 10. Principal component analysis of compression index in lime–cement stabilized soil.
Applsci 15 07150 g010
Figure 11. Compressibility modulus trends with cement content (0–8%) for various lime percentages (0–30%).
Applsci 15 07150 g011
Figure 12. Principal component analysis of compressibility modulus in lime–cement stabilized soil.
Applsci 15 07150 g012
Figure 13. Line plot showing unconfined compressive strength (UCS) values after days of curing, with varying cement (0–8%) and lime (0–30%) contents. Lines show strength development patterns: (a). UCS values for 7-day curing time. (b). UCS values for 14-day curing time. (c). UCS values for 28-day curing time.
Applsci 15 07150 g013
Figure 14. Showing resistance to strength loss for different cement contents (0–8%) across various lime percentages (0–30%).
Applsci 15 07150 g014
Figure 15. Scree plot illustrating eigenvalues versus principal components for UCS data, depicting variance distribution: (a). A 7-day curing time. (b). A 14-day curing time. (c). A 28-day curing time.
Applsci 15 07150 g015
Figure 16. PCA biplot for curing days data showing the relationship between mixture compositions and UCS values, with vectors indicating variable loadings and points representing samples: (a). A 7-day curing time. (b). A 14-day curing time. (c). A 28-day curing time.
Applsci 15 07150 g016
Figure 17. Scatter plot comparing actual versus predicted UCS values for curing times, with PCR line showing model fit quality: (a). A 7-day curing time. (b). A 14-day curing time. (c). A 28-day curing time. Different color dots on the plot represent the data points with variation of samples.
Applsci 15 07150 g017
Figure 18. Scree plot for the principal component regression sensitivity analysis for unconfined compressive strength.
Applsci 15 07150 g018
Figure 19. PCR sensitivity analysis for unconfined compressive strength (UCS). The color of the bar sticks represent the variation of PC’s.
Applsci 15 07150 g019
Figure 20. Influence of PC1 and PC2 on UCS changes over curing periods of 7, 14, and 28 days.
Applsci 15 07150 g020
Table 1. Comparative summary of key physical, chemical, and engineering properties of soil, lime powder, and cement.
PropertySoilLime Cement
General Properties
ColorBrownWhite
Specific Gravity2.532.363.13
pH5.3112.113
Composition/Gradation
Gravel/Sand/Silt + Clay (%)0/25.9/74.1
Dominant Clay MineralMontmorillonite
Engineering Properties
Liquid Limit/Plastic Limit/Plasticity Index/Linear Shrinkage/Free Swelling (%)66/24/42/18.52/71.1
Optimum Moisture (%)/Max Dry Density (kN/m3)21/16.7
UCS (kPa)0.779 29.1 (3 days)
CBR (unsoaked, %)8.2
Material-Specific Properties
USCS ClassificationCH
Melting point/Boiling point (°C)2547/2894
Fineness (µm)368362
Setting Time (min)33.4 (Initial)/242 (Final)
Bulk Density (kg/m3)5551101
Soundness (mm)0.38
Table 2. Chemical composition of the lime and cement.
Chemical ConstituentComposition of Cement (%)Composition of Lime (%)
SiO219.33.5
Al2O33.671.25
Fe2O33.441.14
Na2O0.26
K2O0.780.09
CaO62.6250.5
TiO20.597
PbO0
MgO3.391.21
SO33.21
SrO2-
P2O50.0897
NiO2-
MnO0.2370.05
ZnO-
CuO-
Cr2O3-
BaO0
Cl0.03
LOI2.3842.32
Table 3. Principal component analysis of soil parameters.
Principal ComponentRegression CoefficientVariance Contribution (%)Sensitivity Ranking
PC1 (soil compressibility)0.7246%High Sensitivity
PC2 (modulus vs. pre-consolidation stress)0.5120%Moderate Sensitivity
PC3 (pre-consolidation stress)−0.3215%Low Sensitivity
PC4 (porosity and compression index)0.1812%Minor Impact
PC5 (void ratio and compression index)−0.087%Negligible Impact
Table 4. PCR causality results for UCS at 7, 14, and 28 days.
Curing TimeR2 (Model Fit)Significant Principal Components (p < 0.05)Most Influential Factor
7 Days0.687 (68.7%)PC1 (−76.84, p < 0.001)Soil Compressibility and Porosity
14 Days0.688 (68.8%)PC1 (−139.96, p < 0.001)Porosity and Stiffness
28 Days0.830 (83.0%)PC1 (−170.70, p < 0.001)Soil Strength and Compaction
Disclaimer/Publisher’s Note: The statements, opinions and data contained in all publications are solely those of the individual author(s) and contributor(s) and not of MDPI and/or the editor(s). MDPI and/or the editor(s) disclaim responsibility for any injury to people or property resulting from any ideas, methods, instructions or products referred to in the content.

