Article

AI-Based Classification of Pediatric Breath Sounds: Toward a Tool for Early Respiratory Screening

1
Department of Electrical Engineering, Northern Illinois University, DeKalb, IL 60115, USA
2
Alexander Innovation Centre, Vancouver, BC V6B 1Y1, Canada
3
School of Nursing, Northern Illinois University, DeKalb, IL 60115, USA
*
Author to whom correspondence should be addressed.
Appl. Sci. 2025, 15(13), 7145; https://doi.org/10.3390/app15137145
Submission received: 14 May 2025 / Revised: 16 June 2025 / Accepted: 18 June 2025 / Published: 25 June 2025

Abstract

Context: Respiratory morbidity is a leading cause of children’s consultations with general practitioners. Auscultation, the act of listening to breath sounds, is a crucial diagnostic method for respiratory system diseases. Problem: Parents and caregivers often lack the necessary knowledge and experience to identify subtle differences in children’s breath sounds. Furthermore, obtaining reliable feedback from young children about their physical condition is challenging. Methods: The use of a human–artificial intelligence (AI) tool is an essential component for screening and monitoring young children’s respiratory diseases. Using clinical data to design and validate the proposed approaches, we propose novel methods for recognizing and classifying children’s breath sounds. Different breath sound signals were analyzed in the time domain, frequency domain, and using spectrogram representations. Breath sound detection and segmentation were performed using digital signal processing techniques. Multiple features—including Mel–Frequency Cepstral Coefficients (MFCCs), Linear Prediction Coefficients (LPCs), Linear Prediction Cepstral Coefficients (LPCCs), spectral entropy, and Dynamic Linear Prediction Coefficients (DLPCs)—were extracted to capture both time and frequency characteristics. These features were then fed into various classifiers, including K-Nearest Neighbor (KNN), artificial neural networks (ANNs), hidden Markov models (HMMs), logistic regression, and decision trees, for recognition and classification. Main Findings: Experimental results from across 120 infants and preschoolers (2 months to 6 years) with respiratory disease (30 asthma, 30 croup, 30 pneumonia, and 30 normal) verified the performance of the proposed approaches. Conclusions: The proposed AI system provides a real-time diagnostic platform to improve clinical respiratory management and outcomes in young children, thereby reducing healthcare costs. Future work exploring additional respiratory diseases is warranted.

1. Introduction

Respiratory diseases, including community-acquired pneumonia, asthma, and acute asthma exacerbations, are a major source of morbidity and mortality in children, with the World Health Organization (WHO) identifying acute respiratory infections as the leading cause of death in children under five years of age [1,2,3]. In the United States, 6.3 million children are diagnosed with asthma. Most respiratory tract infections (RTIs) are self-limiting, and they impose a significant financial burden, costing billions annually in ambulatory care [4,5,6,7]. While diagnostic tests such as chest radiographs and assessments of vital signs and symptoms are essential, auscultation and clinical observation remain critical in diagnosing pediatric respiratory conditions. Misdiagnosis or misinterpretation in this area can lead to unnecessary pressure on healthcare resources.
The evaluation of bodily sounds dates back to ancient Egypt [5]. A major milestone occurred in 1816 when Dr. René Laennec invented the first stethoscope using a rolled sheet of paper [8]. This innovation quickly became a typical assessment method in clinical practice, and the stethoscope has since remained a fundamental diagnostic tool [8]. Lung auscultation, in particular, continues to be a vital component of respiratory assessments due to its accessibility, affordability, and clinical relevance [9]. However, despite its advantages, chest auscultation suffers from significant inter-listener variability. It requires the overall pooled sensitivity for lung auscultation to be 37% and specificity 89% [10], which limits its diagnostic reliability [8].
To address these limitations, in recent years, many researchers have tried to develop technology-assisted auscultation and have used computerized approaches to analyze breath and lung sounds [9,11,12,13,14,15,16,17,18,19,20,21,22,23,24,25,26,27,28,29]. Some studies have explored general respiratory sound analysis [9], while others have focused on specific conditions such as chronic obstructive pulmonary disease (COPD) [11]. For instance, Nagasaka and Guntupalli developed methods to analyze wheeze signals in asthma patients [11], and Verder et al. introduced an artificial intelligence (AI)-based algorithm to predict bronchopulmonary dysplasia in newborns, aiming to improve clinical outcomes. Additionally, computerized lung sound analysis tools have been proposed to support disease diagnosis [16,17]. R. Palaniappan developed a system using computerized analysis to classify respiratory pathologies from lung sounds [25], distinct from broader breath signals, while Brian R. Snider applied hidden Markov models (HMMs) to automate breath sound classification for sleep-disordered breathing [26]. These approaches are tailored to adult conditions like chronic obstructive pulmonary disease (COPD) [11], asthma [5,27], pneumonia [27], and bronchopulmonary dysplasia [11,28]. Since respiratory sounds in children differ significantly from those in adults [9,11,12,13,14,15,16,17,18,19,20,21,22,23,24,25,26,27,28,29], these models are insufficient for early childhood applications [30]. Researchers also use machine learning to interpret children’s lung sounds. Kevat and Kalirakah proposed the use of digital stethoscopes to detect pathological breath sounds in children [31]. Kim and colleagues conducted research on deep learning models for detecting wheezing in pediatric patients [32]. Park and Kim employed support vector machines (SVMs) to classify breath sounds in children, including distinctions between normal and abnormal, crackles and wheezing, normal and crackles, and normal and wheezing [33]. Ruchonnet-Métrailler and Siebert also applied deep learning techniques to analyze breath sounds in children with asthma [34]. Mochizuki developed an automated procedure for analyzing lung sounds in children with a history of wheezing [35]. Moon and Ji utilized machine learning-based strategies to improve wheezing detection in pediatric populations [36]. However, most existing studies focus either on distinguishing normal from abnormal breath sounds—such as wheezing or crackles—or single respiratory conditions like asthma. There is limited research targeting disease-specific classification across a broader range of pediatric respiratory diseases, such as croup or pneumonia.
Breath sounds, characterized as non-stationary and time-varying, pose significant challenges to traditional speech signal processing techniques, necessitating tailored adaptations for effective analysis. In young children, unique anatomical and developmental differences produce breath sounds with distinct individual traits that deviate from standard speech signal models. Consequently, applying fixed-parameter LPCs or MFCCs to pediatric breath sounds proves suboptimal. This paper introduces a novel method leveraging Dynamic Linear Prediction Coefficients (DLPCs) for breath sound recognition. Unlike conventional LPCs, DLPCs treat coefficients as time-dependent functions rather than static values, adeptly capturing evolving frequency patterns in non-stationary signals. This approach enables analysis of extended signal segments, lowering computational demands while preserving flexibility across diverse subjects.
Moreover, in order to capture the nonlinear chaotic dynamics of disordered breathing, such as airflow turbulence or airway obstruction, which are critical indicators of respiratory pathologies in pediatric populations, and enable robust classification of normal versus abnormal breath sounds, this paper employs a spectral entropy approach as another complementary feature [37,38,39]. Spectral entropy quantifies the complexity and irregularity of acoustic signals by computing the Shannon entropy of the normalized power spectral density across breath sound segments. This approach allows us to detect subtle physiological changes, differentiate distinct pathologies, and maintain resilience against ambient noise.
Building on previous work [40,41], the proposed methods advance breath sound analysis by incorporating information from the time, frequency, and spectrogram domains. The approach is guided and validated by input from health professionals. Two distinct features—Dynamic Linear Prediction Coefficients (DLPCs) and spectral entropy—are introduced to capture dynamic acoustic patterns with greater accuracy. These features are evaluated using random forest and logistic regression classifiers to assess their respective strengths and limitations. This comparative analysis helps to identify the most effective feature representations for future integration or optimization, and it provides a robust framework for pediatric breath sound classification.
Section 2 examines respiratory sounds and respiratory diseases in young children and their characteristics, followed by an acoustic analysis using signal processing techniques. Section 3 discusses breath sound preprocessing techniques and detection methods. Section 4 introduces pattern extraction methods, including commonly used speech signal features—Linear Predictive Coding (LPC), Linear Predictive Cepstral Coefficients (LPCCs), and Mel–Frequency Cepstral Coefficients (MFCCs)—as well as newly proposed features for breath sound analysis, such as dynamic LPC and spectral entropy. Section 5 explores breath sound recognition using the K-Nearest Neighbor (KNN), hidden Markov model (HMM), artificial neural network (ANN), logistic regression, and decision tree classifiers. Section 6 and Section 7 present and discuss the experimental results, while Section 8 summarizes the findings and discusses future directions.

2. Breath Sound and Respiratory Diseases in Young Children

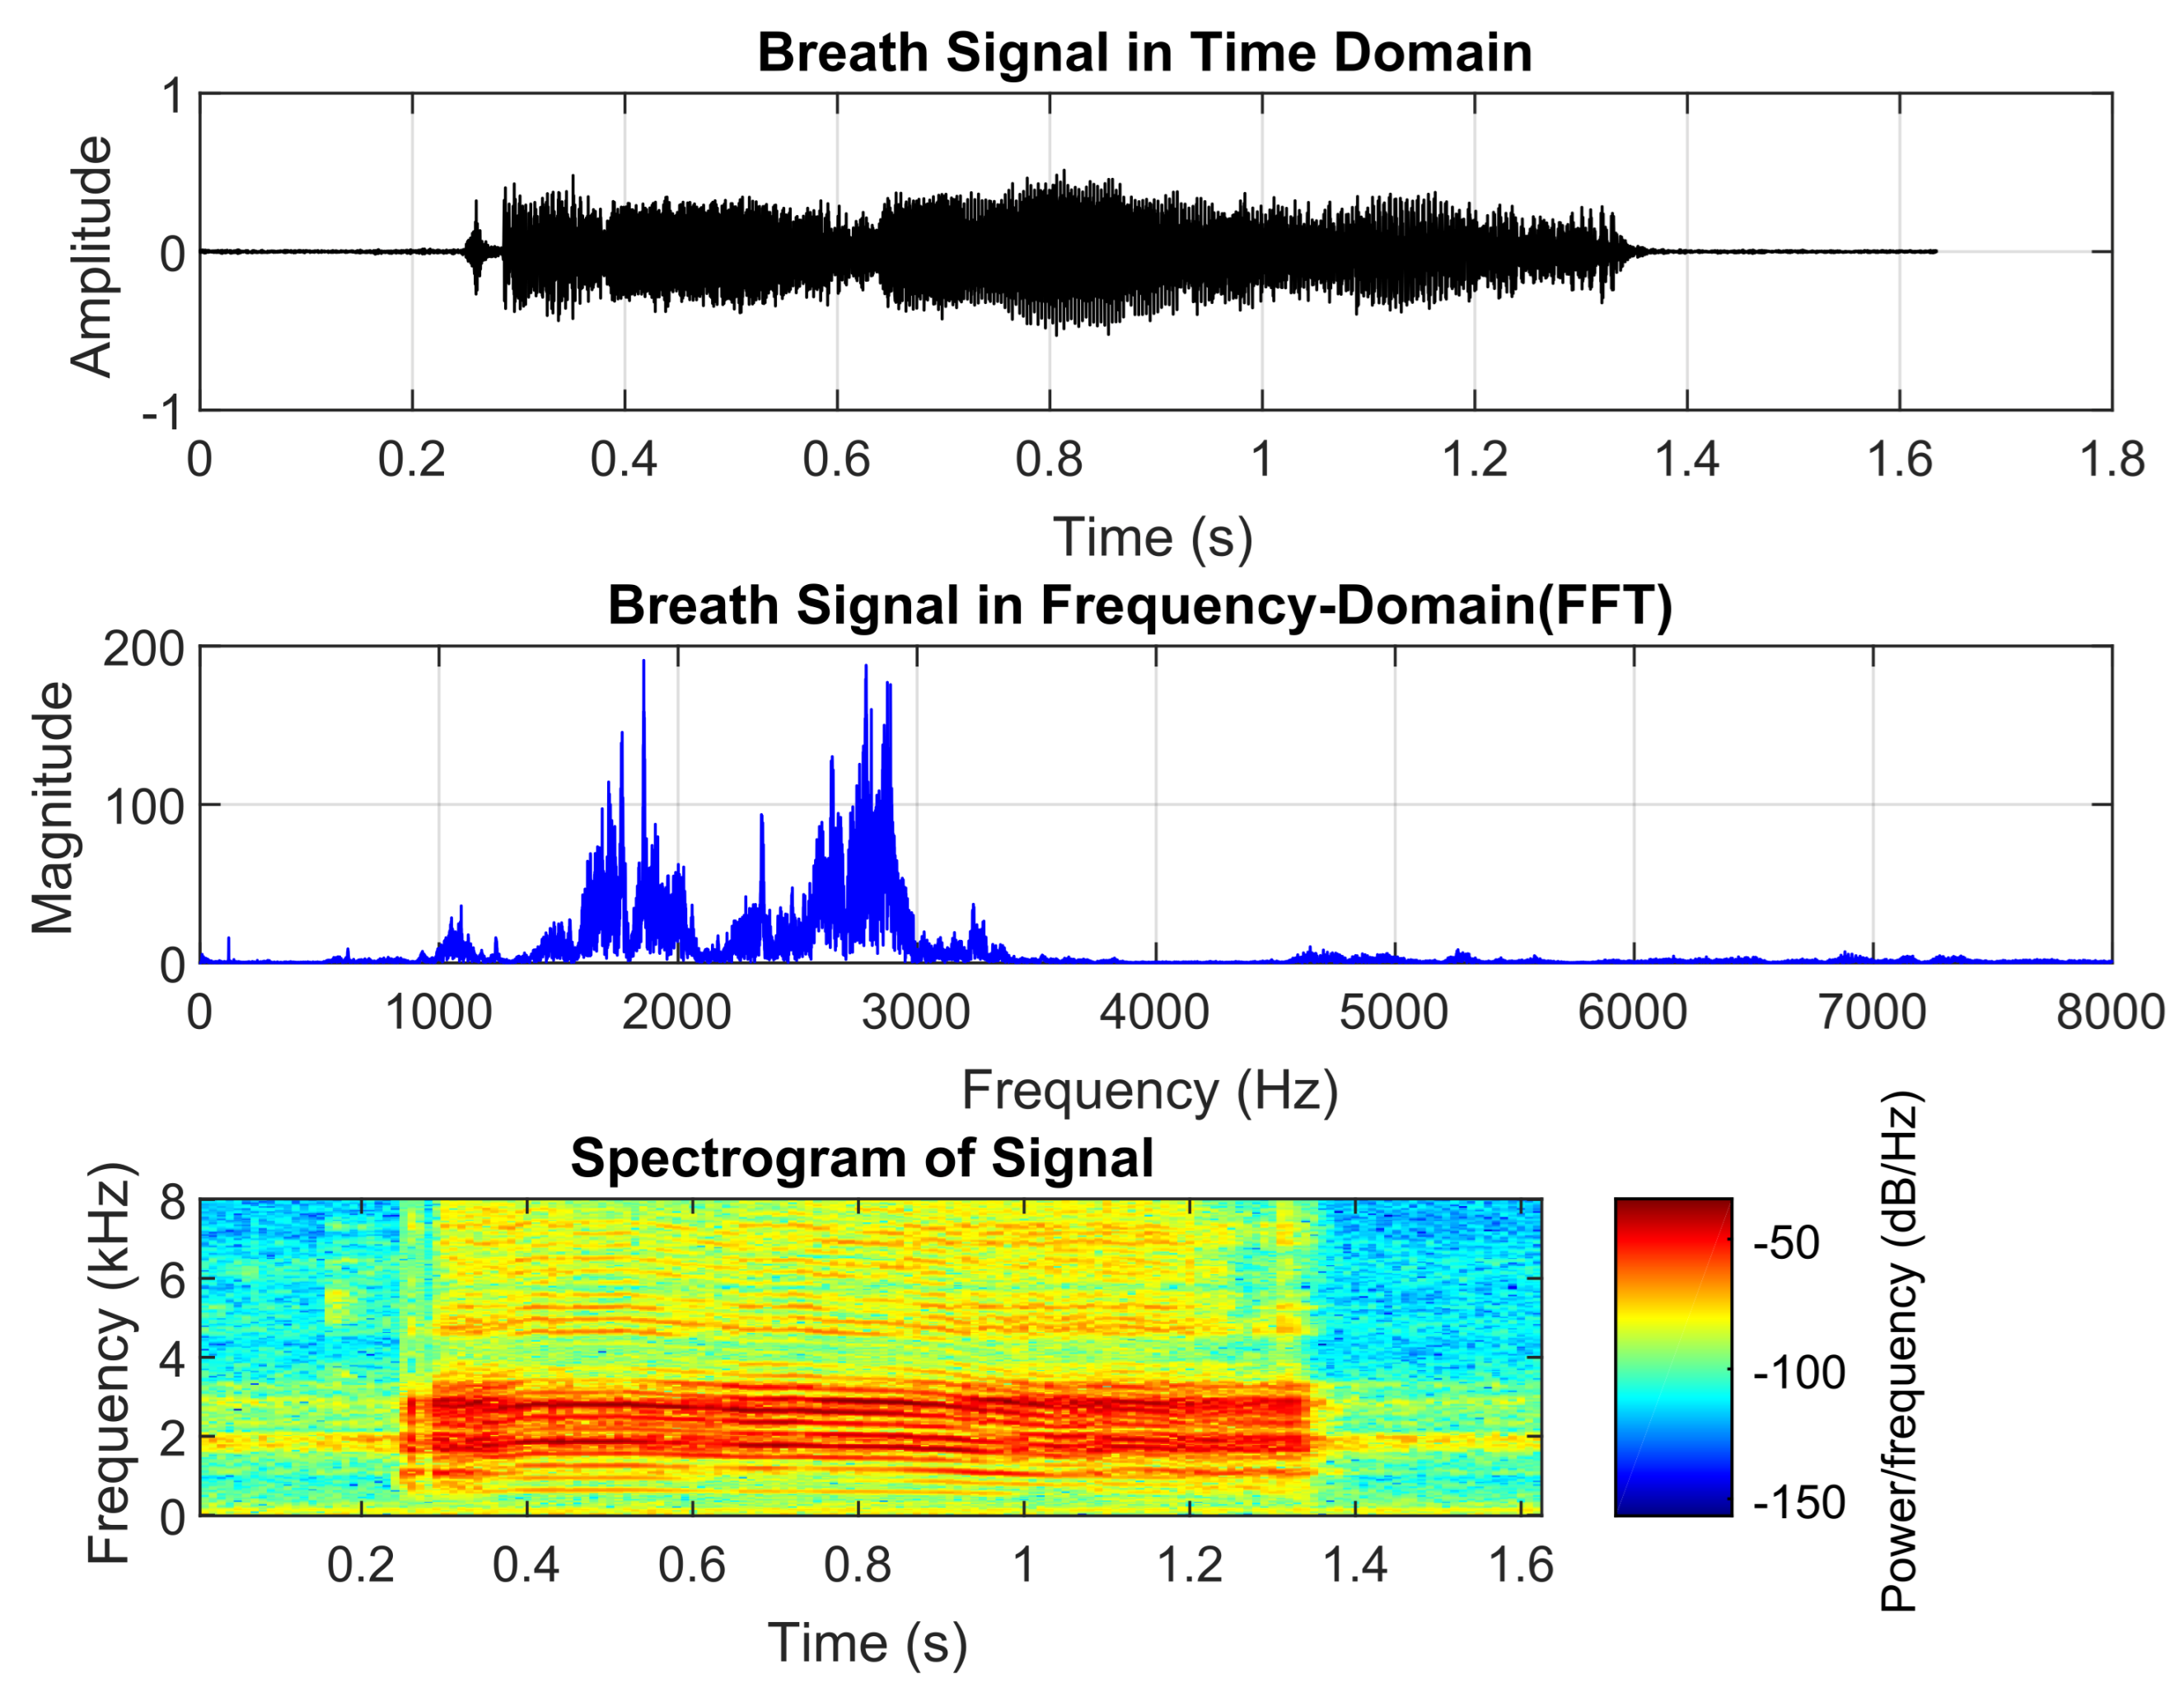
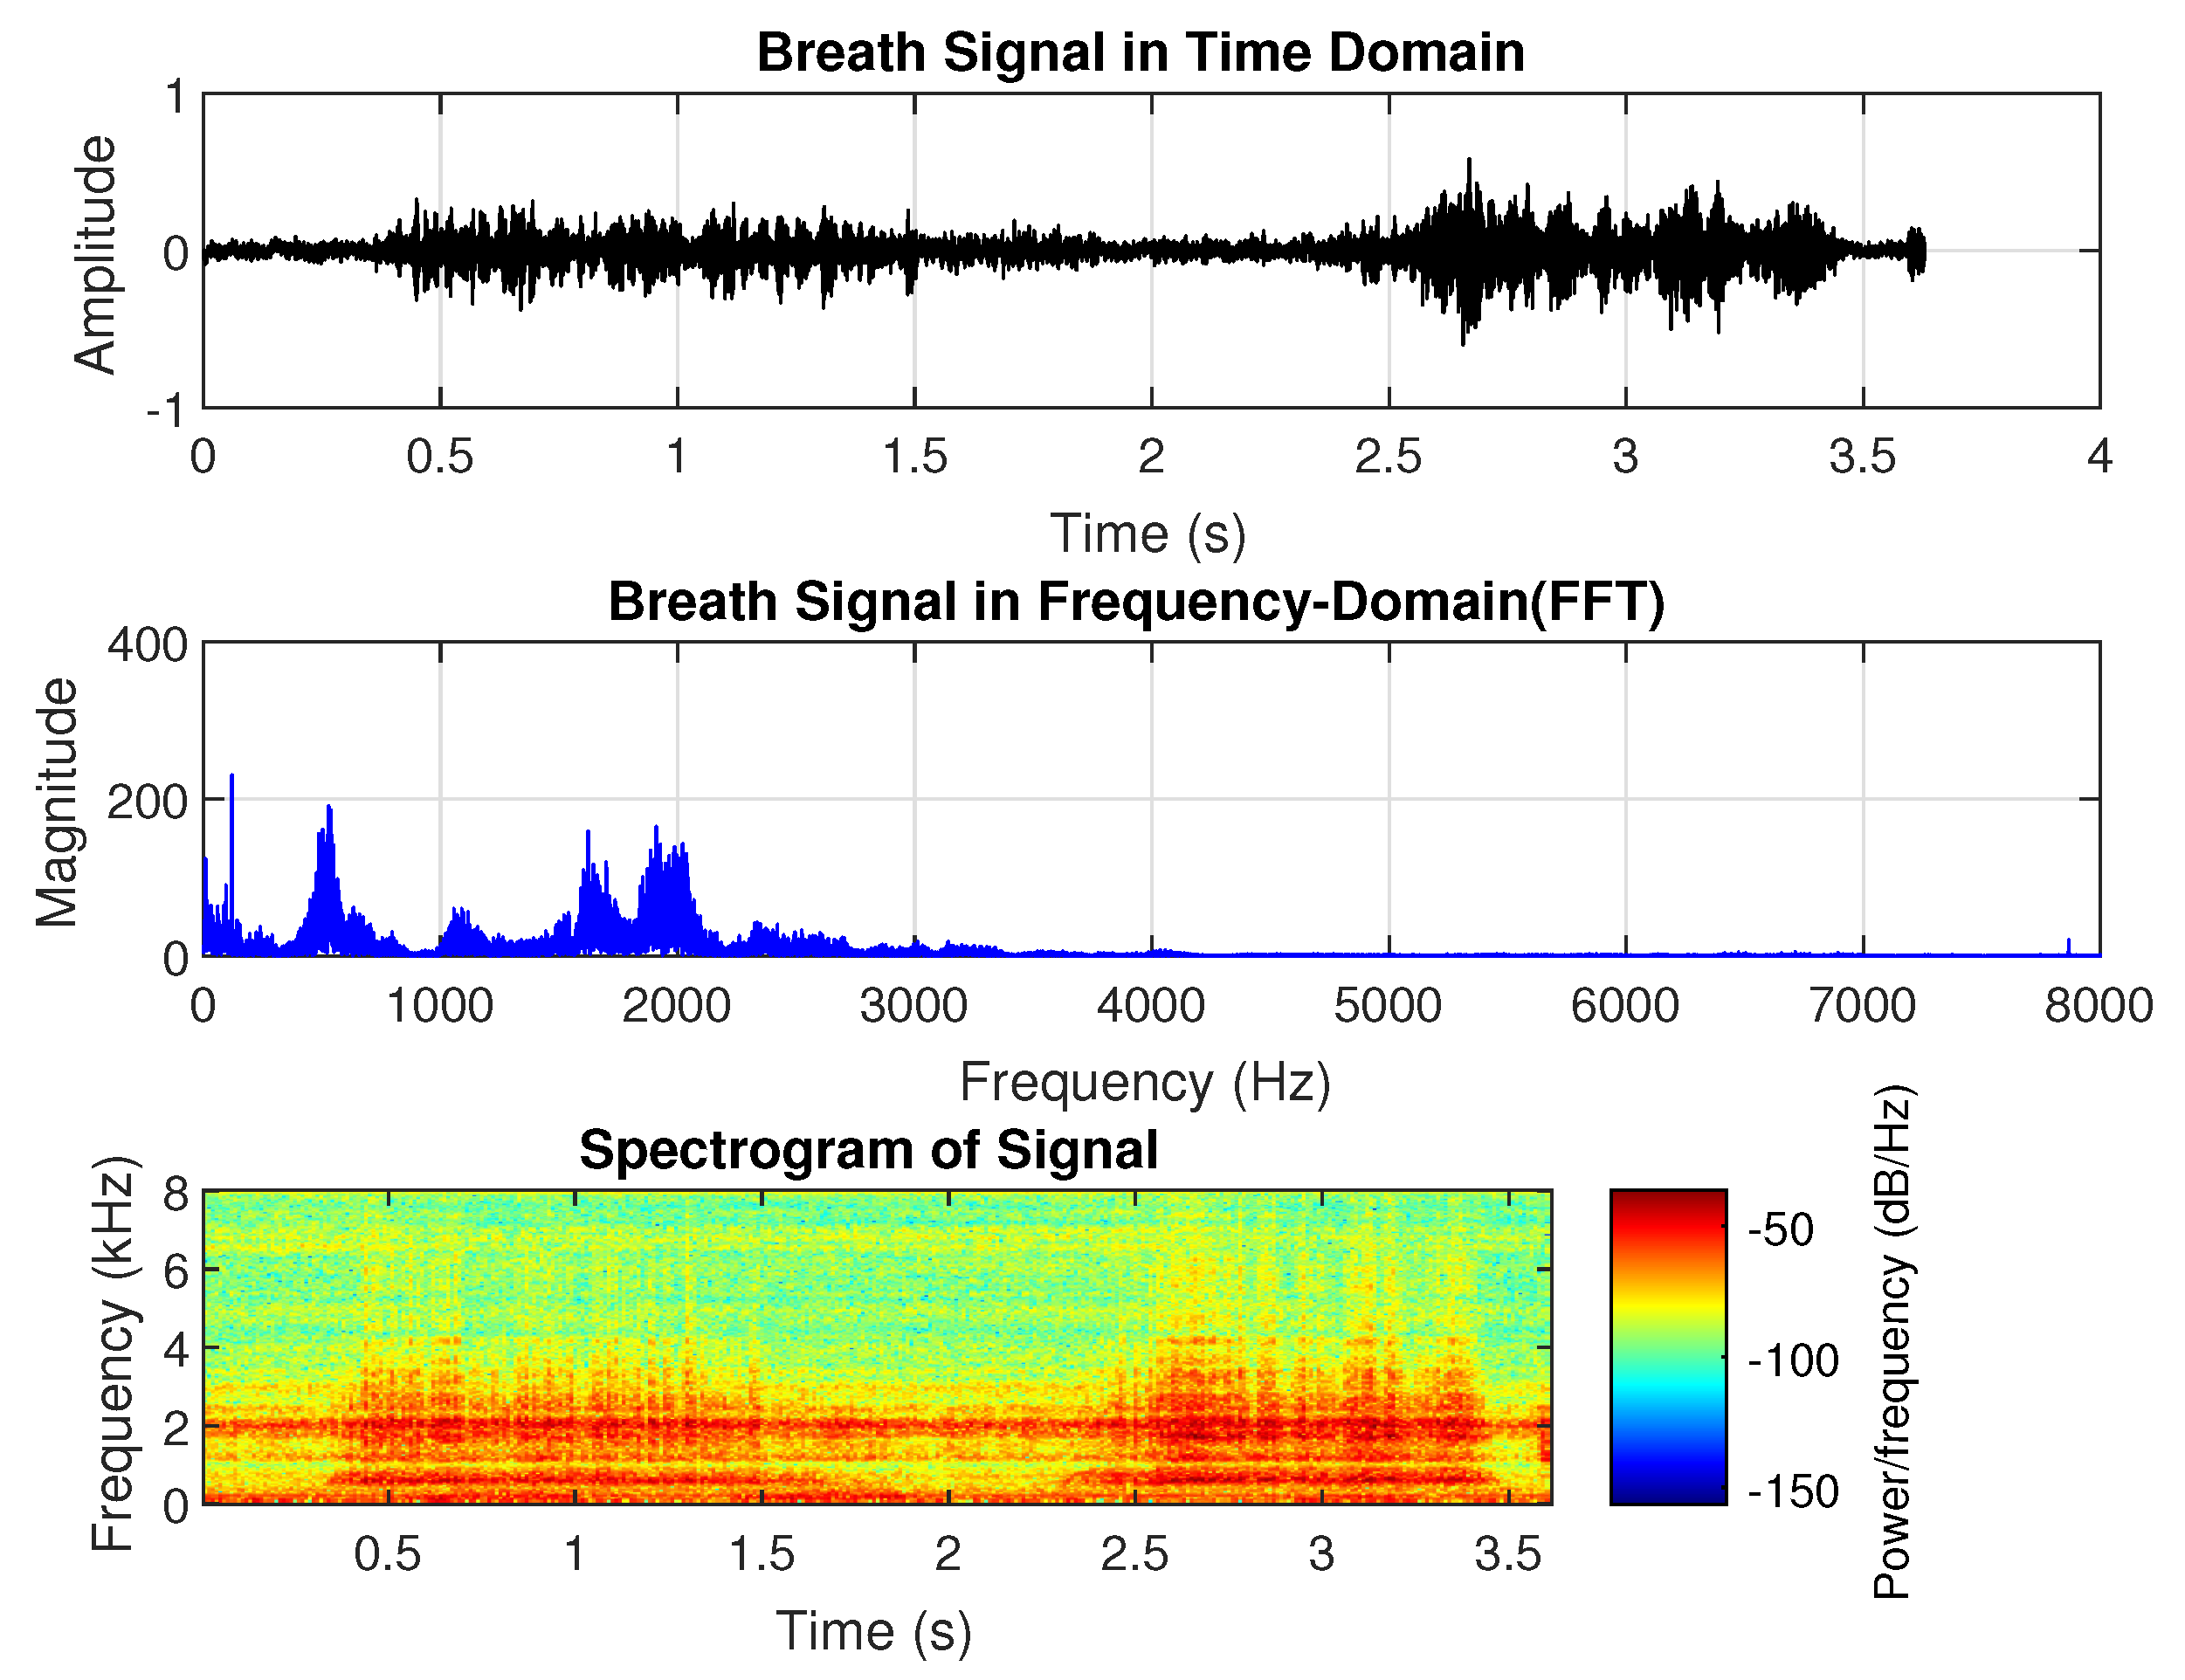
Breath sounds are created in the large airways as a result of vibrations that are generated from air velocity and turbulence [3]. Breath sounds can be heard through a stethoscope and are regarded as one of the most significant bio-signals used to diagnose certain respiratory abnormalities and are widely used by physicians in their practice. Breath sounds are typically categorized into two groups: normal breath sounds, which occur in the absence of respiratory issues, and abnormal or adventitious sounds. Normal breath sounds include both inspiratory and expiratory sounds, which can be heard in the airways during inhalation and exhalation. When auscultating clear lungs—free from swelling, mucus, or blockages—breath sounds are smooth and soft. Normal lung sounds create a smooth, soft sound that can be heard when breathing in and out and are referred to as vesicular lung sounds; i.e., nothing is blocking the airways and they are not narrowed or swollen. Normal breath sounds, as shown in Figure 1, have the longest duration compared to abnormal breath sounds. They consist of two distinguishable phases: inhalation and exhalation. The highest peak in frequency occurs around 100 Hz, with additional dominant frequency groups at approximately 500 Hz, 1600 Hz, and 1800 Hz. In the spectrogram, both inhalation and exhalation are clearly recognizable, with frequencies around 100 Hz and 1800 Hz present throughout the entire duration.
Abnormal breath sounds include crackles, wheezes, rhonchi, stridor, and pleural rub. Wheezes are continuous musical adventitious lung sounds, typically with a dominant frequency over 100 Hz and a duration exceeding 100 ms [42]. They are associated with partial airway obstruction, and their presence during breathing often reflects the severity of conditions such as children’s nocturnal asthma. Wheezing in children is also used to assess asthma predisposition. Crackles, in contrast, are discontinuous and explosive sounds, usually occurring during inspiration and lasting less than 100 ms [42]. They feature a rapid initial pressure deflection followed by a short oscillation and are classified by duration: fine crackles last under 10 ms, while coarse crackles last over 10 ms [42].
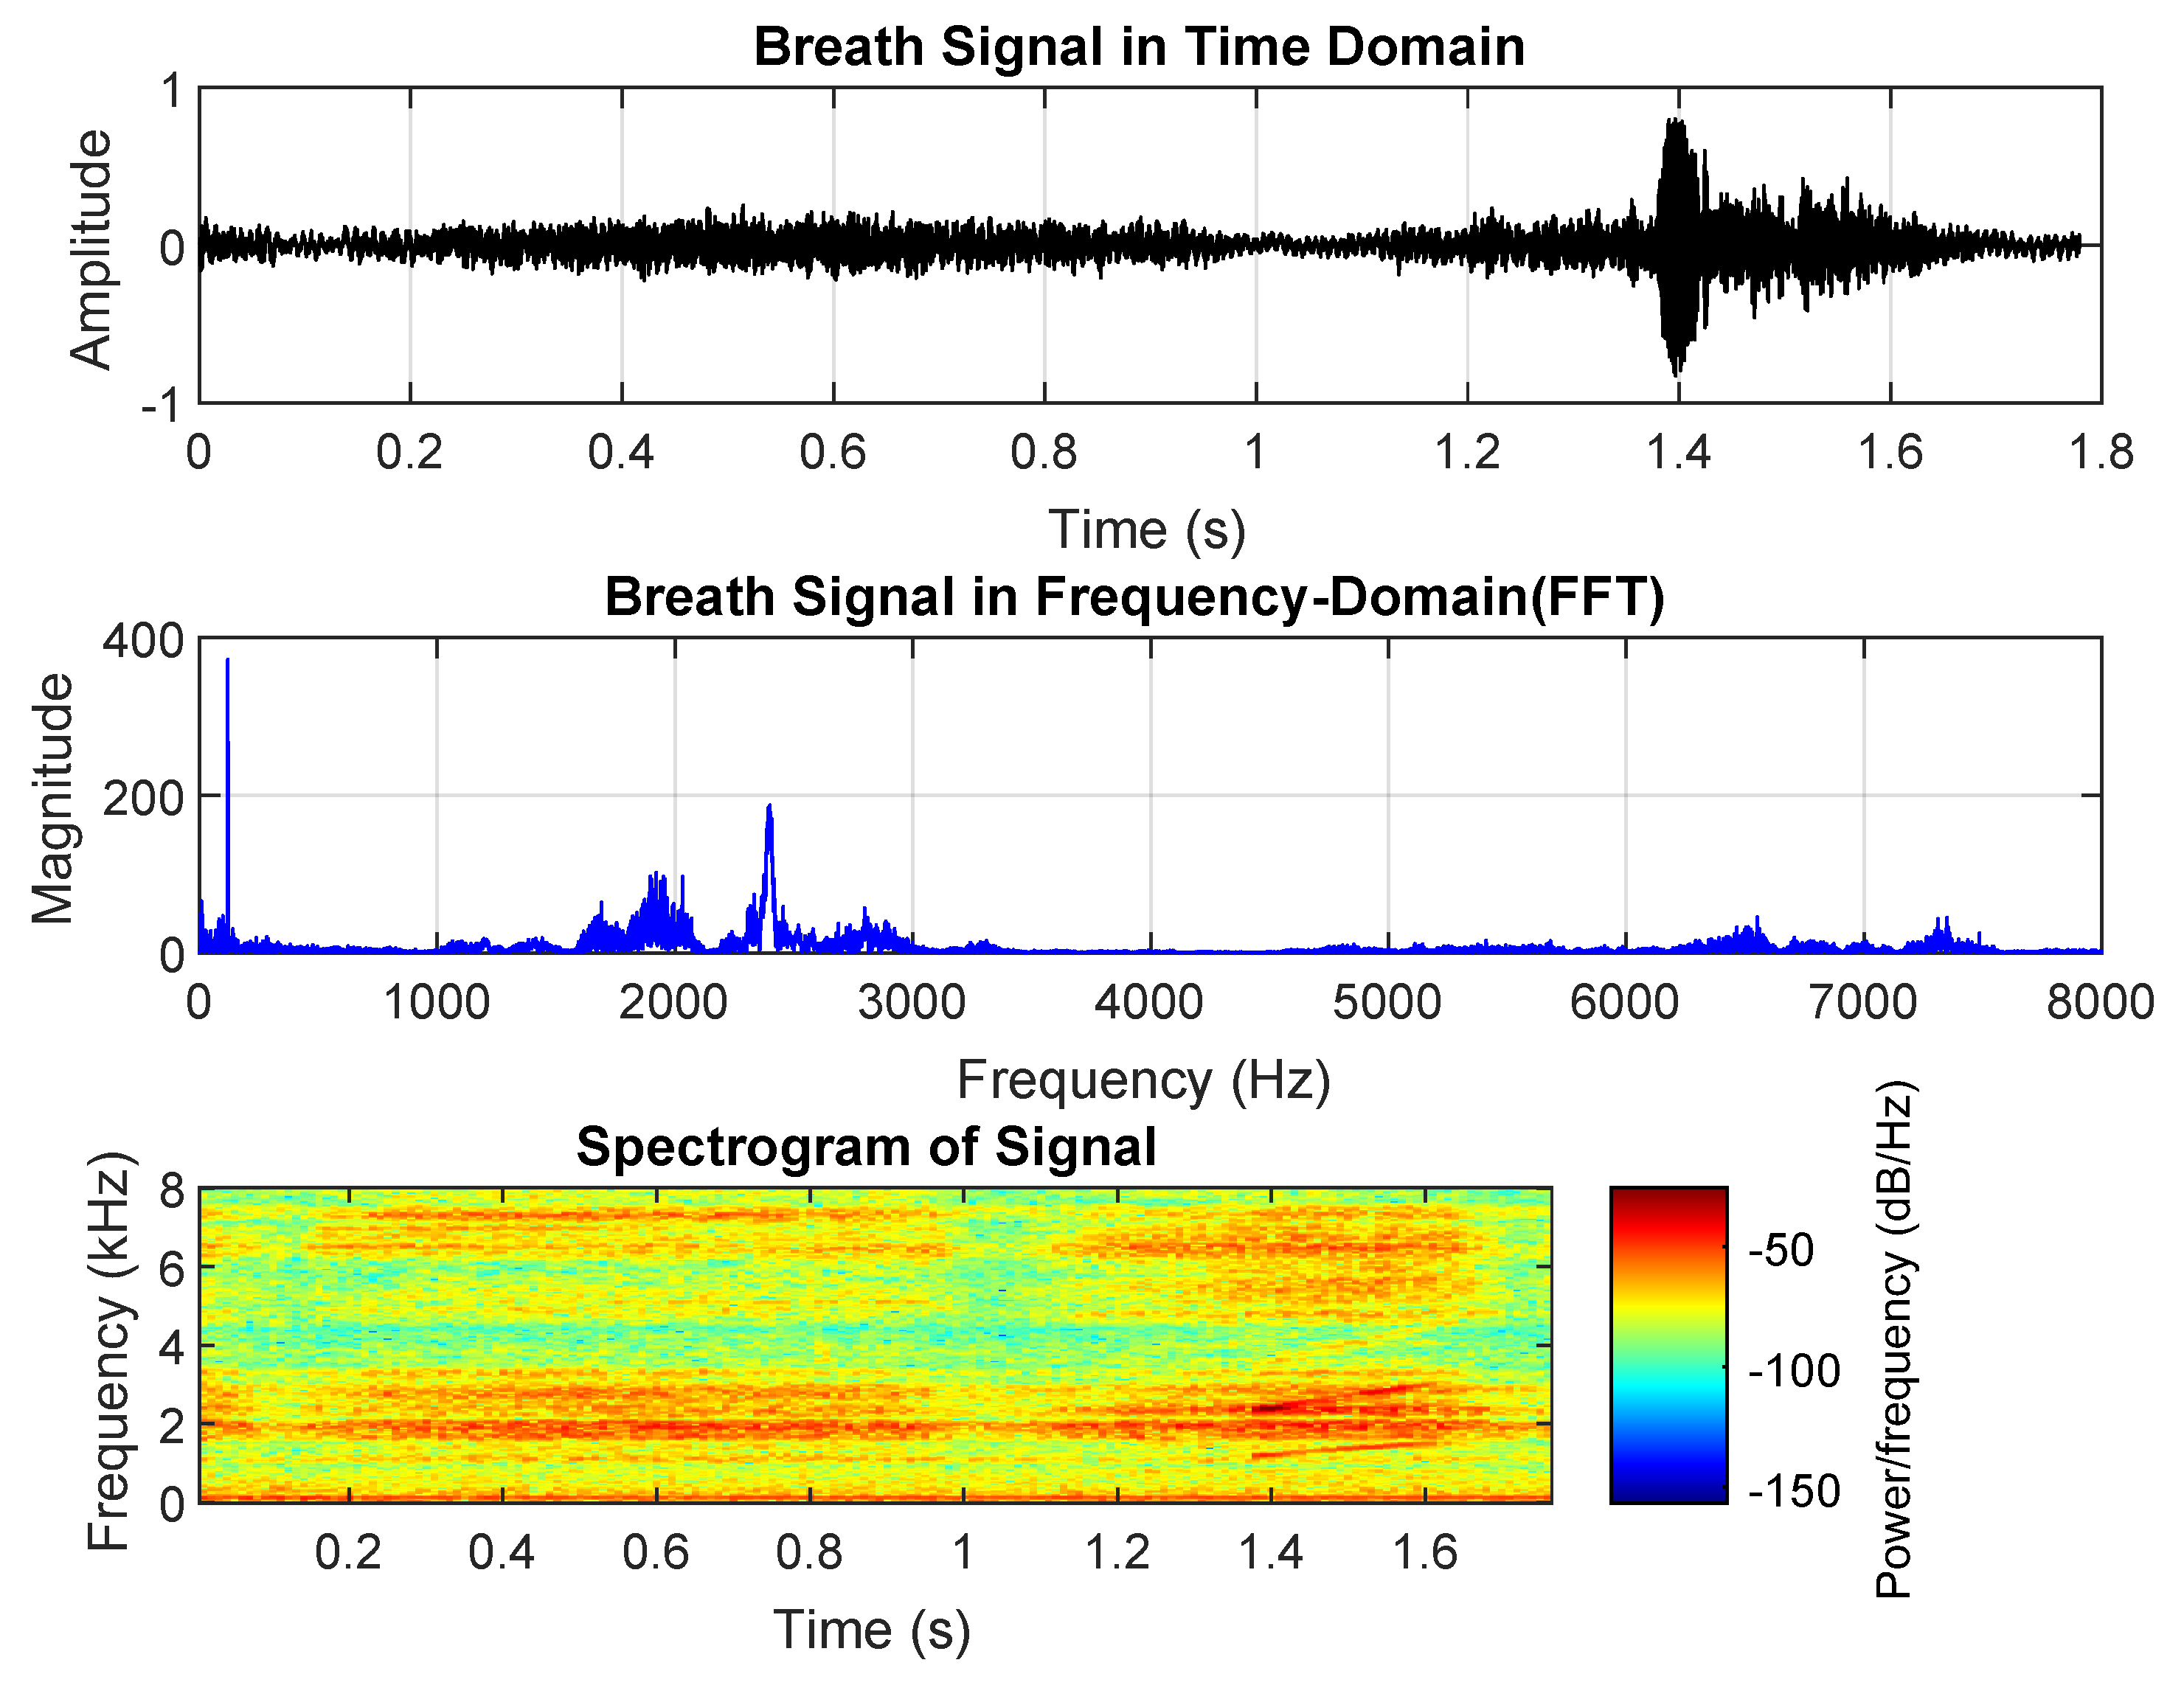
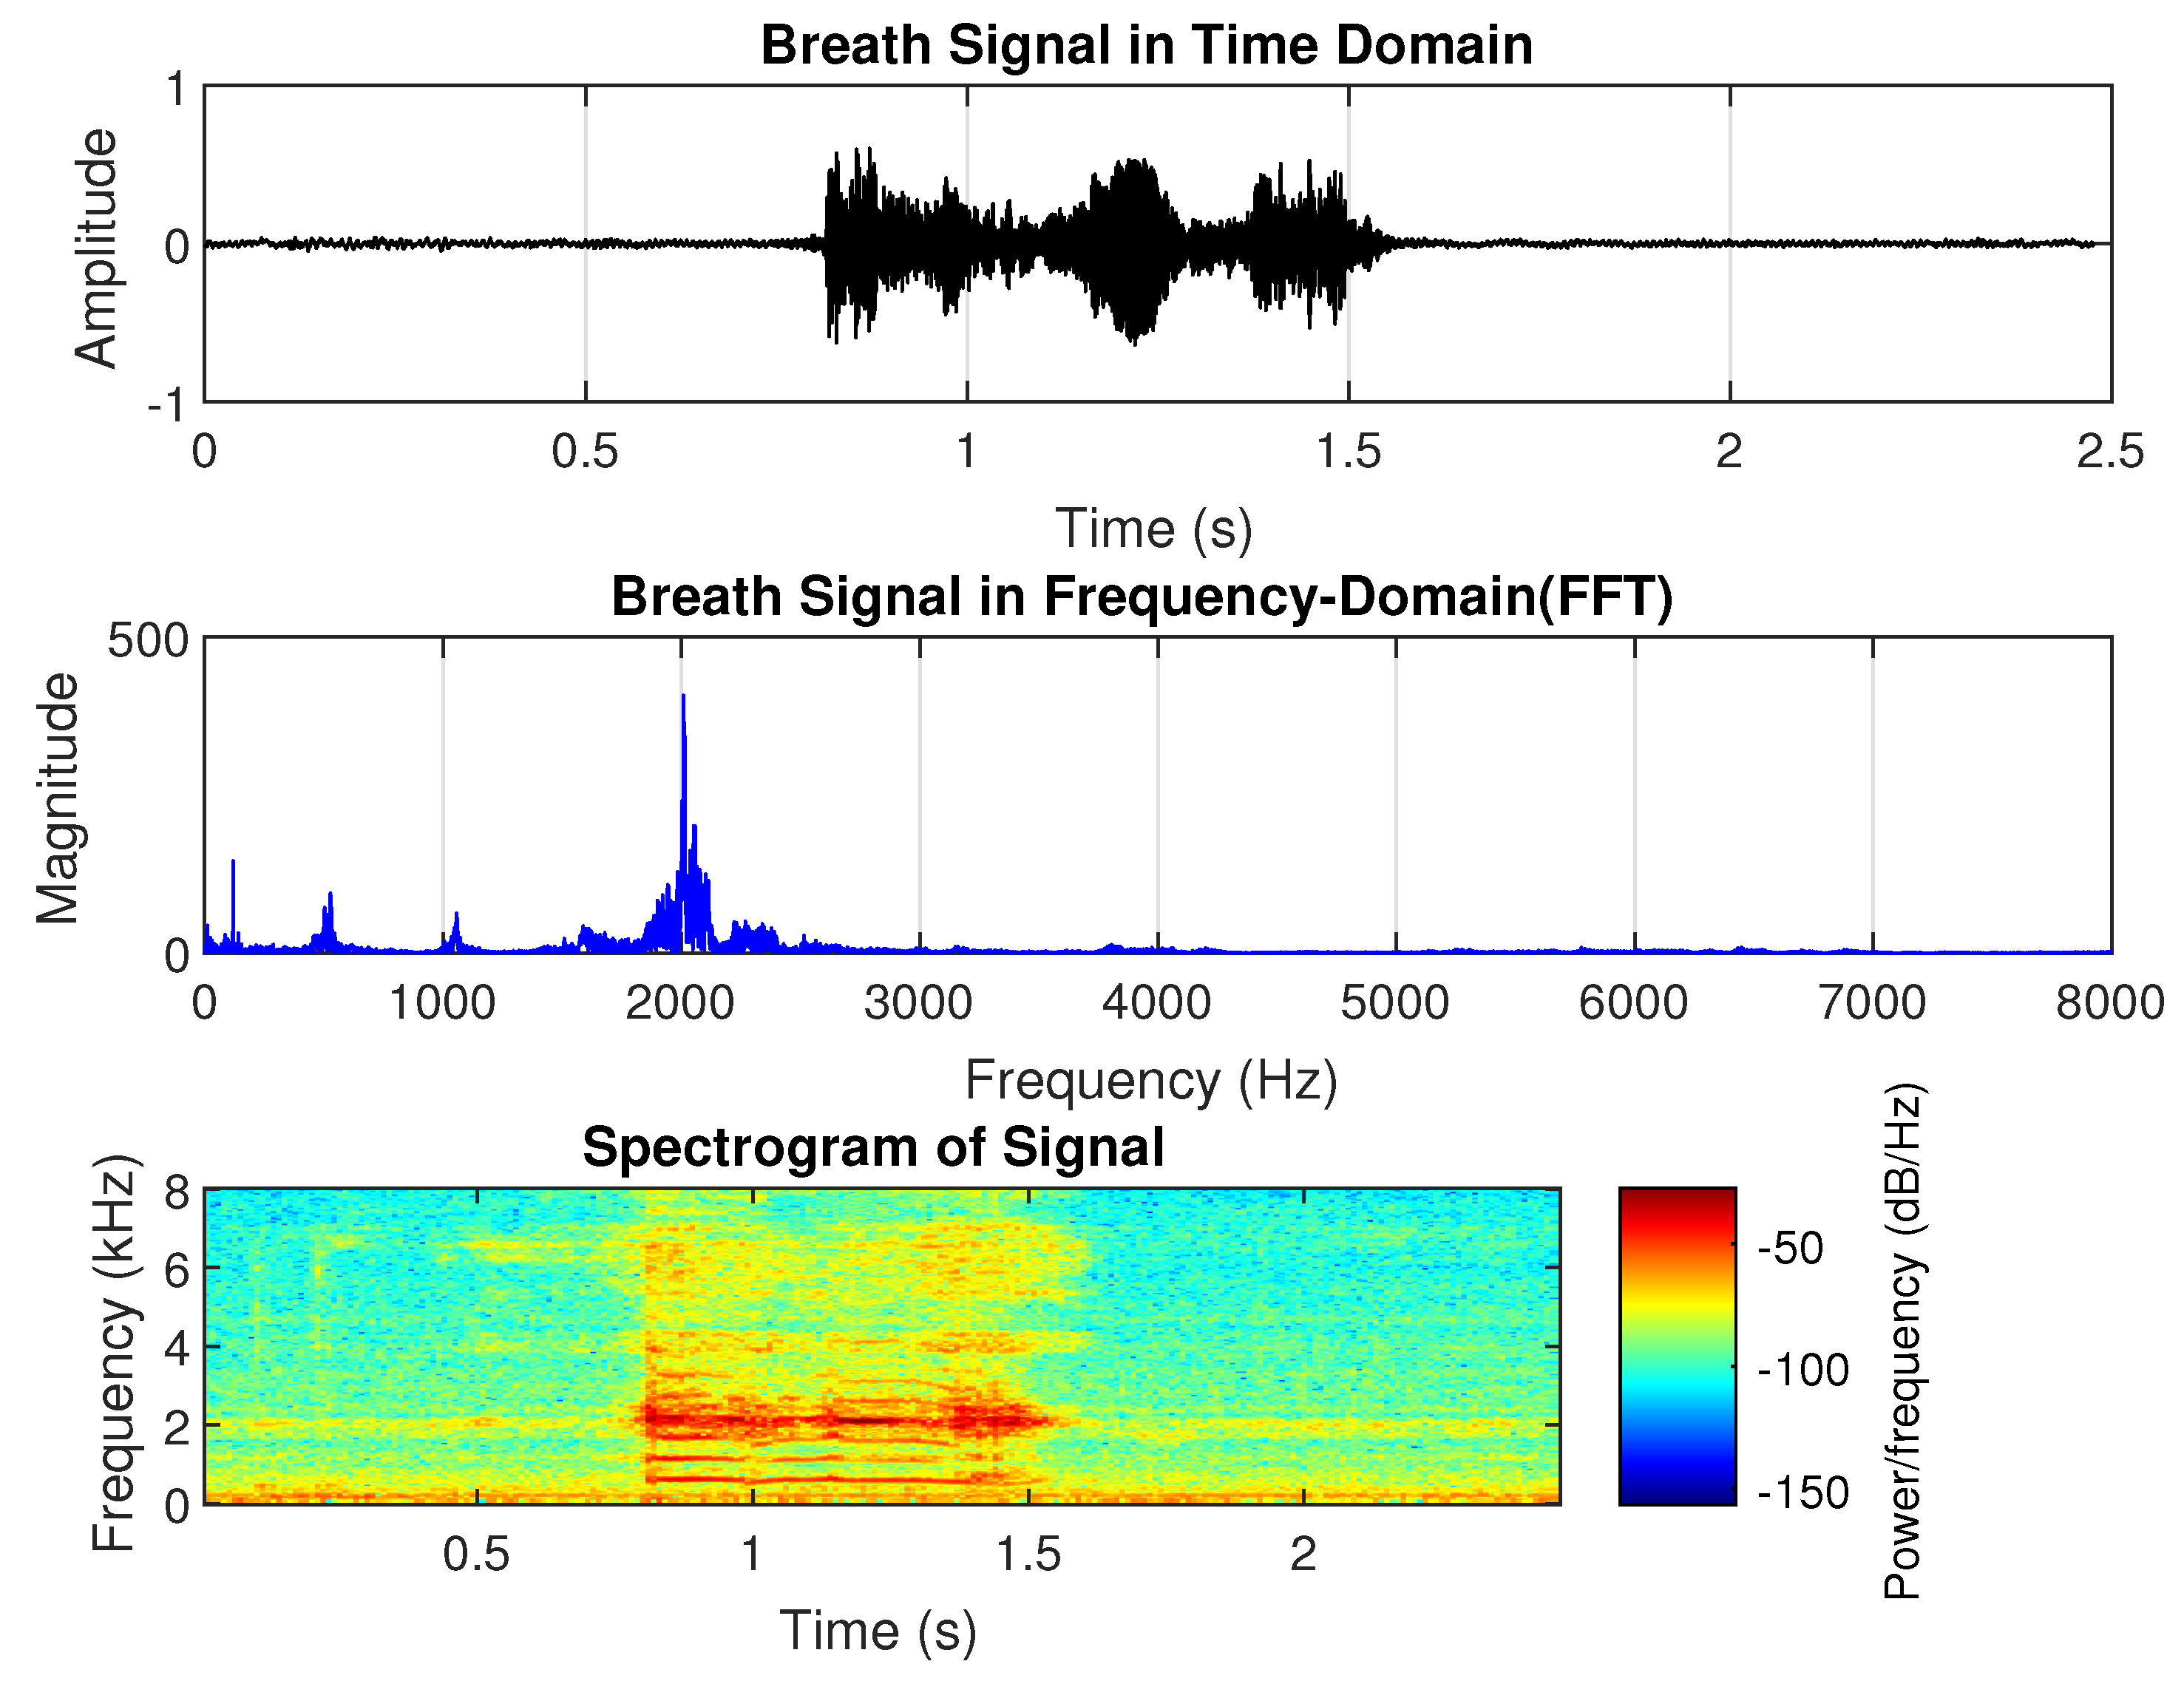
Pneumonia is an inflammatory lung condition affecting the alveoli, with symptoms such as cough, chest pain, fever, and difficulty breathing. It is the leading cause of hospitalization for children in the United States [43]. Pediatric patients with pneumonia, malignancy, or other pulmonary conditions may exhibit a pleural rub in their breath sounds. Pleural rub is characterized by a coarse grating sound resulting from the pleural surfaces rubbing against each other. It can be heard during both inhalation and exhalation [44]. Pleural friction rubs are distinctive sounds akin to “the sound made by walking on fresh snow” when the pleural surfaces become rough or inflamed due to conditions like pleural effusion, pleurisy, or serositis [44]. From the sample shown in Figure 2, the dominant frequency of pneumonia-related breath sounds is approximately 2000 Hz, with harmonics around 4 kHz and 6 kHz. The duration of the sound is shorter than the normal breath sound in the time domain. There is no significant difference in amplitude between inhalation and exhalation. However, the harmonic power decreases between phases, particularly in the higher-order harmonics.
Asthma is a chronic condition that causes inflammation and narrowing of the airways, leading to wheezing, chest tightness, and shortness of breath. It typically begins in childhood, affecting approximately 6% of children, and ranks as the third leading cause of death from respiratory diseases [45]. Wheezing, a high-pitched whistling sound produced during breathing, is commonly associated with asthma. It can occur during exhalation (expiration) or inhalation (inspiration) and may or may not be accompanied by breathing difficulties.
Figure 3 shows asthmatic breath sounds, which have a longer duration than those of pneumonia but are shorter than normal breath sounds. They exhibit two dominant frequencies, around 1800 Hz and 2700 Hz, which are significantly higher than normal breath sounds. The spectrogram appears relatively steady. These acoustic characteristics align with healthcare providers’ perceptions of asthmatic wheezing as they often describe it as a continuous high-pitched sound with a distinct tonal quality.
Croup, a viral infection affecting the upper airways, produces a distinctive barking cough and noticeable breathing difficulties. The associated breath sounds include stridor, a high-pitched squeaky noise during inhalation caused by swollen, narrowed airways; a barking cough, characterized by a loud, harsh, seal-like sound; and hoarseness, resulting from vocal cord inflammation.
As shown in Figure 4, the inhalation phase has a shorter duration and significantly higher amplitude than exhalation, aligning with the obstruction of the upper airway. Croup-related breath sounds contain more high-frequency components, particularly in the 6000–8000 Hz range, which corresponds to the characteristic high-pitched noise. The overall breath cycle is longer than that of asthma and pneumonia but shorter than normal breath sounds.

3. Breath Sound Detection

Over the past two decades, audio signal processing technology has advanced significantly, driven by growing demands. Breath sound recognition applications have emerged across fields like medical diagnostics, pediatric care, and health monitoring. This section presents modified signal processing algorithms designed for breath sound analysis [46]. The first step in classification is detection and segmentation. To detect breath sounds efficiently and accurately, short-time magnitude and short-time energy methods are applied.

Short-Time Energy and Magnitude Signals

A breath signal refers to the sound waveform spanning from the start point to the end point of a breath sound segment. Breath and silent segments differ in their short-time characteristics, with the most notable being short-time energy (STE): breath segments exhibit higher STE, while silent segments show lower STE. This distinction allows STE to be used for identifying the boundary points of each breath segment. STE is calculated as the average of the squared sample values within a defined window and is mathematically expressed as [46]
E ( n ) = 1 N m = 1 n 1 [ w ( m ) x ( n m ) ] ,
in this context, w ( m ) denotes the window coefficient corresponding to the signal sample, where m is the window index, n is the sample index, and N represents the window length.
Since all breath recordings are down-sampled from 44.1 kHz to 7350 Hz, the window length N is chosen as 128, covering a 17.4 ms segment of the signal. For each frame, the average energy of the short-time signal is computed. Different window types result in varying STE amplitude levels. The detailed experimental results are provided in Section 6.
To precisely identify the boundaries of a breath segment, setting an appropriate threshold is essential. STE amplitude values are normalized between 0 and 1 by dividing by the maximum STE value across the entire recording. To remove silent artifacts from low STE and eliminate short high-energy impulse noise, two specific thresholds are defined to detect breath period boundaries. These conditions are as follows:
  • Normalized S T E > 0.015 .
  • Interval between start point and end point of a breath period > 0.14 s.
The start and end points of each breath segment are detected using a normalized STE threshold, while an interval time threshold helps to eliminate false breath periods that are too brief. Short-time magnitude, a common time-domain feature for audio signals, measures signal strength in real time and is also well-suited for detecting breath sounds. A simple way to compute the short-time magnitude is to apply a sliding window over the signal and calculate the magnitude within that window. The magnitude of the signal x ( n ) is defined as follows [46]:
M n = m = x [ m ] | w [ n m ] ,
where w ( m ) is the window coefficient corresponding with the signal sample.

4. Feature Extraction

This section presents the features used to analyze breath sound signals, combining both traditional speech signal features and newly proposed methods tailored for breath sound classification. Traditional speech features include Linear Predictive Coding (LPC), which represents the spectral envelope of a signal through linear predictive models; Linear Predictive Cepstral Coefficients (LPCCs), derived from LPC to capture spectral properties with enhanced robustness to noise; and Mel–Frequency Cepstral Coefficients (MFCCs), which mimic the human auditory system’s frequency perception and are widely used in speech and audio processing. In addition to these conventional features, two new features are introduced: Dynamic Linear Predictive Coding (DLPC), an extension of LPC that incorporates temporal variations to analyze dynamic respiratory patterns, and spectral entropy, a measure of spectral distribution randomness that is particularly useful in distinguishing abnormal breath sounds as irregularities in airflow caused by respiratory diseases result in higher entropy values. Combining these traditional and novel features enhances the ability to accurately differentiate between normal and abnormal breath sounds, improving respiratory sound analysis.

4.1. Linear Predicative Code

In traditional linear prediction modeling, the autoregressive (AR) model is widely used in speech signal processing [46], including applications such as speech coding and speech recognition. In this research, we employ the AR model to represent the characteristics of breath sounds. The data x ( n ) is modeled as a linear combination of its past p samples. That is,
x ( n ) = i = 1 p a i x ( n i ) + e ( n ) ,
where e ( n ) is the modeling error/residues. Minimizing the above error with respect to each coefficient leads to the following set of normal equations:
c ( i , j ) = n x ( n i ) x ( n j ) .
The minimization of the total error results in a set of p equations that must be solved for the coefficients a i . Equation (4) can be expressed in matrix form by defining the following vectors and matrix:
a = a 1 i a 2 i a p i T
and
c = c 0 i ( 0 , 1 ) c 0 i ( 0 , 2 ) c 0 i ( 0 , p ) T ,
C = c k l ( 1 , 1 ) c k l ( 1 , 2 ) c k l ( 1 , p ) c k l ( 2 , 1 ) c k l ( 2 , 2 ) c k l ( 2 , p ) c k l ( p , 1 ) c k l ( p , 2 ) c k l ( p , p ) ,
and then Equation (4) becomes
C a = c .
The solution for a can be simplified as
a = C 1 c .

4.2. Linear Predictive Cepstral Coefficients

The cepstrum is a set of numbers that describe a frame of audio signals, often used in pitch tracking and speech recognition. Linear Predictive Cepstral Coefficients (LPCCs) translate LPC coefficients into the cepstral domain. Cepstra are derived by applying the inverse Fourier transform to the log-magnitude of the spectrum, effectively approximating the signal’s envelope [46].
First, calculate the speech signal’s correlation
R ( k ) = n = 0 N 1 k s w [ n , m ] s w [ n + k , m ] , k = 0 , 1 , , p
Then, obtain LPC via Levinson–Durbin algorithm
k = 1 p a ( k ) R ( | i k | ) = R ( i ) , i = 1 , 2 , , p
Recursive steps:
k i = R ( i ) j = 1 i 1 a ( j ) R ( i j ) E ( i 1 )
a ( i ) = k i
a ( j ) = a ( j ) k i a ( i j ) , j = 1 , 2 , , i 1
E ( i ) = ( 1 k i 2 ) E ( i 1 )
Then, we have as c m coefficients from a m = a ( m ) :
c 0 = r ( 0 ) ,
c m = a m + k = 1 m 1 k m c k a m k , 1 < m < p
c m = k = m p m k m c k a m k , m > p

4.3. Mel–Frequency Cepstral Coefficients

Mel–Frequency Cepstral Coefficients (MFCCs) are widely used in sound processing to capture the short-term power spectrum of audio signals. This is achieved by applying a linear cosine transform to the logarithm of the power spectrum, which is scaled according to the nonlinear Mel–frequency scale [47].
The speech signal is pre-emphasized to enhance high frequencies:
y ( n ) = x ( n ) 0.97 x ( n 1 )
The signal is segmented into frames and windowed with a Hamming window:
s w ( n , m ) = y ( n + m · H ) · w ( n )
where w ( n ) = 0.54 0.46 cos 2 π n N 1 , 0 n < N
The power spectrum is calculated for each frame:
S [ k , m ] = n = 0 N 1 s w [ n , m ] e j 2 π k n N 2
The Mel scale converts frequency to a perceptual scale, followed by filter bank application:
H m [ k ] = 0 , k < f [ m 1 ] k f [ m 1 ] f [ m ] f [ m 1 ] , f [ m 1 ] k < f [ m ] f [ m + 1 ] k f [ m + 1 ] f [ m ] , f [ m ] k < f [ m + 1 ] 0 , k f [ m + 1 ]
E [ m ] = k = 0 N / 2 S [ k , m ] H m [ k ]
The filter bank energies are logged, and the Discrete Cosine Transform (DCT) yields MFCCs:
L [ m ] = log ( E [ m ] )
c [ l ] = m = 0 M 1 L [ m ] cos π l ( 2 m + 1 ) 2 M , l = 0 , 1 , , 12

4.4. Dynamic LPC

While common audio features capture time and frequency characteristics, they are not ideal for breath sounds. Breath sounds exhibit non-stationary time-varying behavior due to changes in airflow rate and volume throughout the respiratory cycle [48], so conventional speech features cannot be directly applied.
To better model such signals, represented by x ( n ) , that have time-varying properties like breath sounds, the adaptive autoregressive (AAR) model [48] can be employed. This model allows the filter coefficients, a i ’s, to vary over time, enhancing the accuracy of the representation.
A discrete-time AAR process is then expressed as
x ( n ) = i = 1 p a i ( n ) x ( n i ) + e ( n )
where the time-varying AR coefficients are constructed from
a i ( n ) = k = 0 q a i k u k ( n ) ,
and, in the equation above, u k ( n ) , k = 0 , 1 , q are independent basis functions. The basis function for breath signal modeling is given as { u k n = n k } k = 0 q .
Combining (3) and (26):
x ( n ) = i = 1 p k = 0 q a i k u k ( n ) x ( n i ) + e ( n ) .
Minimimal squared error approach is used to obtain the optimal coefficient:
E = n e 2 ( n ) = n x ( n ) + i = 1 p k = 0 q a i k u k ( n ) x ( n i ) 2 ,
for each coefficient:
i = 1 p k = 0 q a i k c k l ( i , j ) = c 0 l ( 0 , j ) , 0 j p , 1 l q
c k l ( i , j ) is generalized correlation function,
c k l ( i , j ) = n u k ( n ) u l ( n ) x ( n i ) x ( n j ) , 0 k , l q
By minimizing the total error, we obtain a set of p q + 1 equations to solve for the coefficients a i k . Equation (29) can then be represented in matrix form using the vectors and matrix defined as follows:
a i = a 1 i a 2 i a p i T , 0 i q
and
c i = c 0 i ( 0 , 1 ) c 0 i ( 0 , 2 ) c 0 i ( 0 , p ) T , 0 i q
C k l = c k l ( 1 , 1 ) c k l ( 1 , 2 ) c k l ( 1 , p ) c k l ( 2 , 1 ) c k l ( 2 , 2 ) c k l ( 2 , p ) c k l ( p , 1 ) c k l ( p , 2 ) c k l ( p , p ) 0 k q , 0 l q
Equation (29) becomes
C 00 C 01 C 0 q C 10 C 11 C 1 q C q 0 C q 1 C q q Γ a 0 a 1 a q α = c 0 c 1 c q γ
The solution for a is simplified as
α = Γ 1 γ .
The vector α corresponds to the DLPC coefficients derived from a breath sound segment, effectively reflecting its time-varying acoustic patterns. Given that x ( n ) is a non-stationary signal, longer segmentation windows can be used. This enables each segment to be represented by fewer feature coefficients, which in turn lowers the input dimensionality for classifiers and decreases computational demands.

4.5. Spectral Entropy Feature

Spectral entropy quantifies the complexity of breath or speech signals in the frequency domain, which aids recognition tasks.
Power spectral density can be obtained as follows:
S [ k ] = n = 0 N 1 x [ n ] e j 2 π k n N 2 , k = 0 , 1 , , N 2
where N = 110 .
Then, normalize it as follows:
p [ k ] = S [ k ] m = 0 N / 2 S [ m ] , k = 0 , 1 , , N 2
and we can obtain spectral entropy (SE)
H s = k = 0 N / 2 p [ k ] log 2 ( p [ k ] )
and the normalized SE
H max = log 2 N 2 + 1
H norm = H s H max

5. Classification

This section presents the classification of breath sounds, which is vital for diagnosing and monitoring respiratory conditions. By analyzing the features extracted from breath sound signals, various classification methods can effectively distinguish between normal and abnormal breath patterns. We discuss different techniques, highlighting their performance in identifying respiratory diseases such as asthma, pneumonia, and croup.

5.1. K-Nearest Neighbor (KNN)

K-Nearest Neighbor (KNN) is a widely used reliable classification approach [49]. It is based on the Euclidean distance between a test sample and the training samples. Let x i be an input sample with p features x i 1 x i 2 , · , x i p , n be the number of input samples i = 1 , 2 , , n , and p is the number of features j = 1 , 2 , , p . The Euclidean distance between sample x i and x l ( l = 1 , 2 , , n ) can be calculated as
d ( x i , x l ) = ( x i 1 x l 1 ) 2 + ( x i 2 x l 2 ) 2 + + ( x i p x l p ) 2 .
A cell that covers all neighboring points that are the nearest to each sample can be expressed as
R i = x R p : d ( x , x i ) d ( x , x m ) , i m .
In the context above, R i represents the region or cell associated with sample x i , while x refers to any point within that cell. This framework embodies two fundamental aspects of the coordinate system [49]: every point inside a cell is considered among the nearest neighbors of the sample defining that cell, and the closest sample to any point is determined by the nearest boundary of these cells. Leveraging this property, the K-Nearest Neighbor (KNN) algorithm classifies a test sample by assigning it the most common category among its k nearest training samples. To avoid ties in voting, k is typically chosen as an odd number. When k equals 1, the method is known as the nearest neighbor classifier.

5.2. Artificial Neural Network (ANN)

An artificial neural network (ANN) is a computational model inspired by the brain’s synaptic connections, designed to process information. It consists of numerous nodes (or neurons), each representing a specific output function known as the activation function. The connections between nodes, called synaptic weights, define the relationship between them. The output of an ANN depends on how the nodes are connected, the connection weights, and the activation function. Key characteristics of ANNs include their ability to learn from examples and generalize results through the activation function. During the training process, the knowledge learned is stored in the synaptic weights of the neurons [50].
For breath sound signals with different causes, it is assumed that they exhibit distinct feature patterns. By learning from various breath sounds, ANNs can classify them into different categories, storing these feature patterns as “codebooks.” When an unknown breath sound is presented, it can be recognized by comparing its features to the stored “codebooks,” thereby classifying the cause it belongs to.
Self-organizing ANNs can evaluate input patterns, organize themselves to learn from the collective input set, and categorize similar patterns into groups [50]. Self-organized learning typically involves frequent adjustments to the network’s synaptic weights based on the input patterns [50]. One such self-organizing network model is Linear Vector Quantization (LVQ), a feed-forward ANN widely used in pattern recognition and optimization tasks. LVQ can be effectively applied to classify different causes of breath sounds.
This work utilizes the LVQ model for classifying breath sounds. The input to the LVQ neural network comprises 10 elements, reflecting the structure of the breath sound feature data. The classification categories addressed in this thesis are defined as follows:
  • Category Class 1: Pneumonia.
  • Category Class 2: Asthma.
  • Category Class 3: Croup.
  • Category Class 4: Normal.
For breath sound signals, if n-order coefficient feature is extracted, the input vector of LVQ has n elements as
x = x 1 x 2 x n T .
The weight matrix of LVQ neural network, when n = 10, is
W = w 1 w 2 w 3 w 4 = w 1 , 1 w 2 , 1 w 4 , 1 w 1 , 2 w 2 , 2 w 4 , 2 w 1 , 10 w 2 , 10 w 4 , 10 ,
Here, w i = w i , 1 w i , 2 w i , 10 T represents the patterns of Class i, i = 1 , , 10 . The subscript of each weight coefficient w i , j corresponds to the connection from the jth input element to the ith output neuron. The LVQ ANN model must be trained with labeled breath sound data to obtain these reference codebooks. The training procedure is carried out through the following steps:
1.
Initialize all weight vectors w 1 ( 1 ) , w 2 ( 1 ) , w 3 ( 1 ) , and w 4 ( 1 ) by selecting a 10-order breath sound feature from each breath sound class. Set the adaptive learning rate as μ ( k ) = μ ( 0 ) k with μ ( 0 ) = 0.1 . The training iteration index starts at k = 1 ;
2.
Let M be the number of training input feature vectors per iteration. For each training input vector x m , where m = 1 , 2 , , M , perform steps 3 and 4;
3.
Find the weight vector index q that minimizes the Euclidean distance | x m w q ( m ) | 2 . Record this index as C W q ( m ) = q , which is the training output class number for x m ;
4.
Update the weight vector w q ( m ) as follows:
w q ( m + 1 ) = w q ( m ) + μ ( k ) [ x q ( m ) w q ( m ) ] , C W q ( m ) = C x ( m ) w q ( m + 1 ) = w q ( m ) μ ( k ) [ x q ( m ) w q ( m ) ] , C W q ( m ) C x ( m )
where C x ( m ) is the known class number of input x ( m ) ; for example, if input x ( m ) is a breath sound for croup, x ( m ) = 3 . Only w 3 is updated, and the updating rule depends on whether the real class number is the same as the LVQ output class number q in step (4);
5.
Here, we have k = k + 1 ; let μ ( k ) = μ ( k 1 ) k for following iteration, and repeat steps (2) to (4) until k = K, where K is the total iteration number.
After training, w 1 , w 2 , w 3 , and w 4 serve as the reference “codebooks” for their respective classes. With these codebooks established, the trained ANN can be used to classify incoming breath sound signals.

5.3. Hidden Markov Model

A Markov model represents a system that can exist in one of a finite set of N distinct states. At time t, the system transitions from state q t 1 to state q t , where q t denotes the current state. In a time-independent first-order Markov model, the assumption is that the next state depends solely on the current state [26]. The transitions between states are governed by state transition probabilities, defined as follows:
a i j = P [ q t = s j q t 1 = s i ] , 1 i , j N
where s i is state i of N states; a i j is an element of the state transition matrix A . The state transition coefficients a i j are non-negative, so
j N a i j = 1 , 1 i N
The observation symbol probability distribution in state j, B = { b j ( k ) } , where
b j ( k ) = P [ v k at t q t = s j ] , 1 j N , 1 k M
here, M provides the value of distinct observation symbols per state; v k is the individual symbols. The initial state distribution is given by π = { π i } , where π i is the probability of the initial state q 1 being in the state i
π i = P [ q 1 = s i ] , 1 i N .
A hidden Markov model (HMM) is an extension of a Markov model in which the states themselves are not directly observable. Instead, only the output generated by the system—known as the observation sequence—is available for analysis [46]. Based on the underlying HMM framework, once suitable values are assigned to the number of states N, the number of distinct observation symbols M, the state transition matrix A , the observation probability distribution B, and the initial state distribution π , the HMM can function as a probabilistic generator capable of producing observation sequences:
O = O 1 O 2 O T
where O T represents symbols from v k ; T is the value of the observations in the sequence:
1.
Choose an initial state q 1 = s i according to the initial state distribution π , which is set to 1 3 in this research.
2.
Set t = 1 .
3.
Select the observation O t = v k based on the symbol probability distribution b i ( k ) for the current state s i .
4.
Transition to the next state q t + 1 = s j using the state transition probability distribution a i j from state s i .
5.
Set t = t + 1 ; repeat step 3 if t < T . Otherwise, end the procedure.

5.4. Random Forest Classifier

The random forest (RF) classifier aggregates predictions from B decision trees, each trained on a bootstrap sample of the dataset. For a breath sound input x (e.g., DLPC and spectral entropy features), each tree T b predicts a class:
y ^ b ( x ) = arg max c C I ( T b ( x ) = c )
where C = { asthma , croup , normal , pneumonia } , and I is the indicator function.
The final RF prediction is determined by majority voting across B trees:
y ^ ( x ) = arg max c C b = 1 B I ( y ^ b ( x ) = c )
Feature randomness is introduced by selecting m = p features at each split, where p is the total number of features. The out-of-bag (OOB) error, estimated from samples not used in training each tree, is
OOB error = 1 N i = 1 N I ( y i y ^ OOB ( x i ) )

5.5. Logistic Regression Classifier

Logistic regression (LR) models breath sound classification using spectral entropy and DLPC features. For an input x , the score for each class c C = { asthma , croup , normal , pneumonia } is
z c ( x ) = w c x + b c
The probability of class c is computed via the softmax function:
P ( y = c | x ) = e z c ( x ) k C e z k ( x )
The predicted class is
y ^ ( x ) = arg max c C P ( y = c | x )
The model minimizes the cross-entropy loss:
J ( w , b ) = 1 N i = 1 N c C y i , c log P ( y i = c | x i )
weights are updated via gradient descent:
w c w c η J w c

6. Experimental and Results

6.1. Data Collection

In this study, breath sound data were collected at the School of Nursing, Northern Illinois University (NIU). A total of 120 audio samples—30 each for asthma, croup, pneumonia, and normal conditions—were obtained from twelve pediatric subjects (eight male; four female), ranging in age from 2 months to 6 years. The details are shown in Table 1 Each subject contributed a single recording, captured using a medical stethoscope placed on standard auscultation points and recorded with a digital device, with assistance from a pediatric nurse practitioner. The recordings were labeled based on clinical assessments conducted by pediatric physicians. Asthma recordings were obtained during active asthma episodes to ensure the presence of characteristic breath sounds. The original files were sampled at 44.1 kHz with the resolution of 16 bits. During the experiment, down-sampling is performed to 7350 kHz with Matlab R2017a.

6.2. Experimental Results

6.2.1. Signal Detection Results

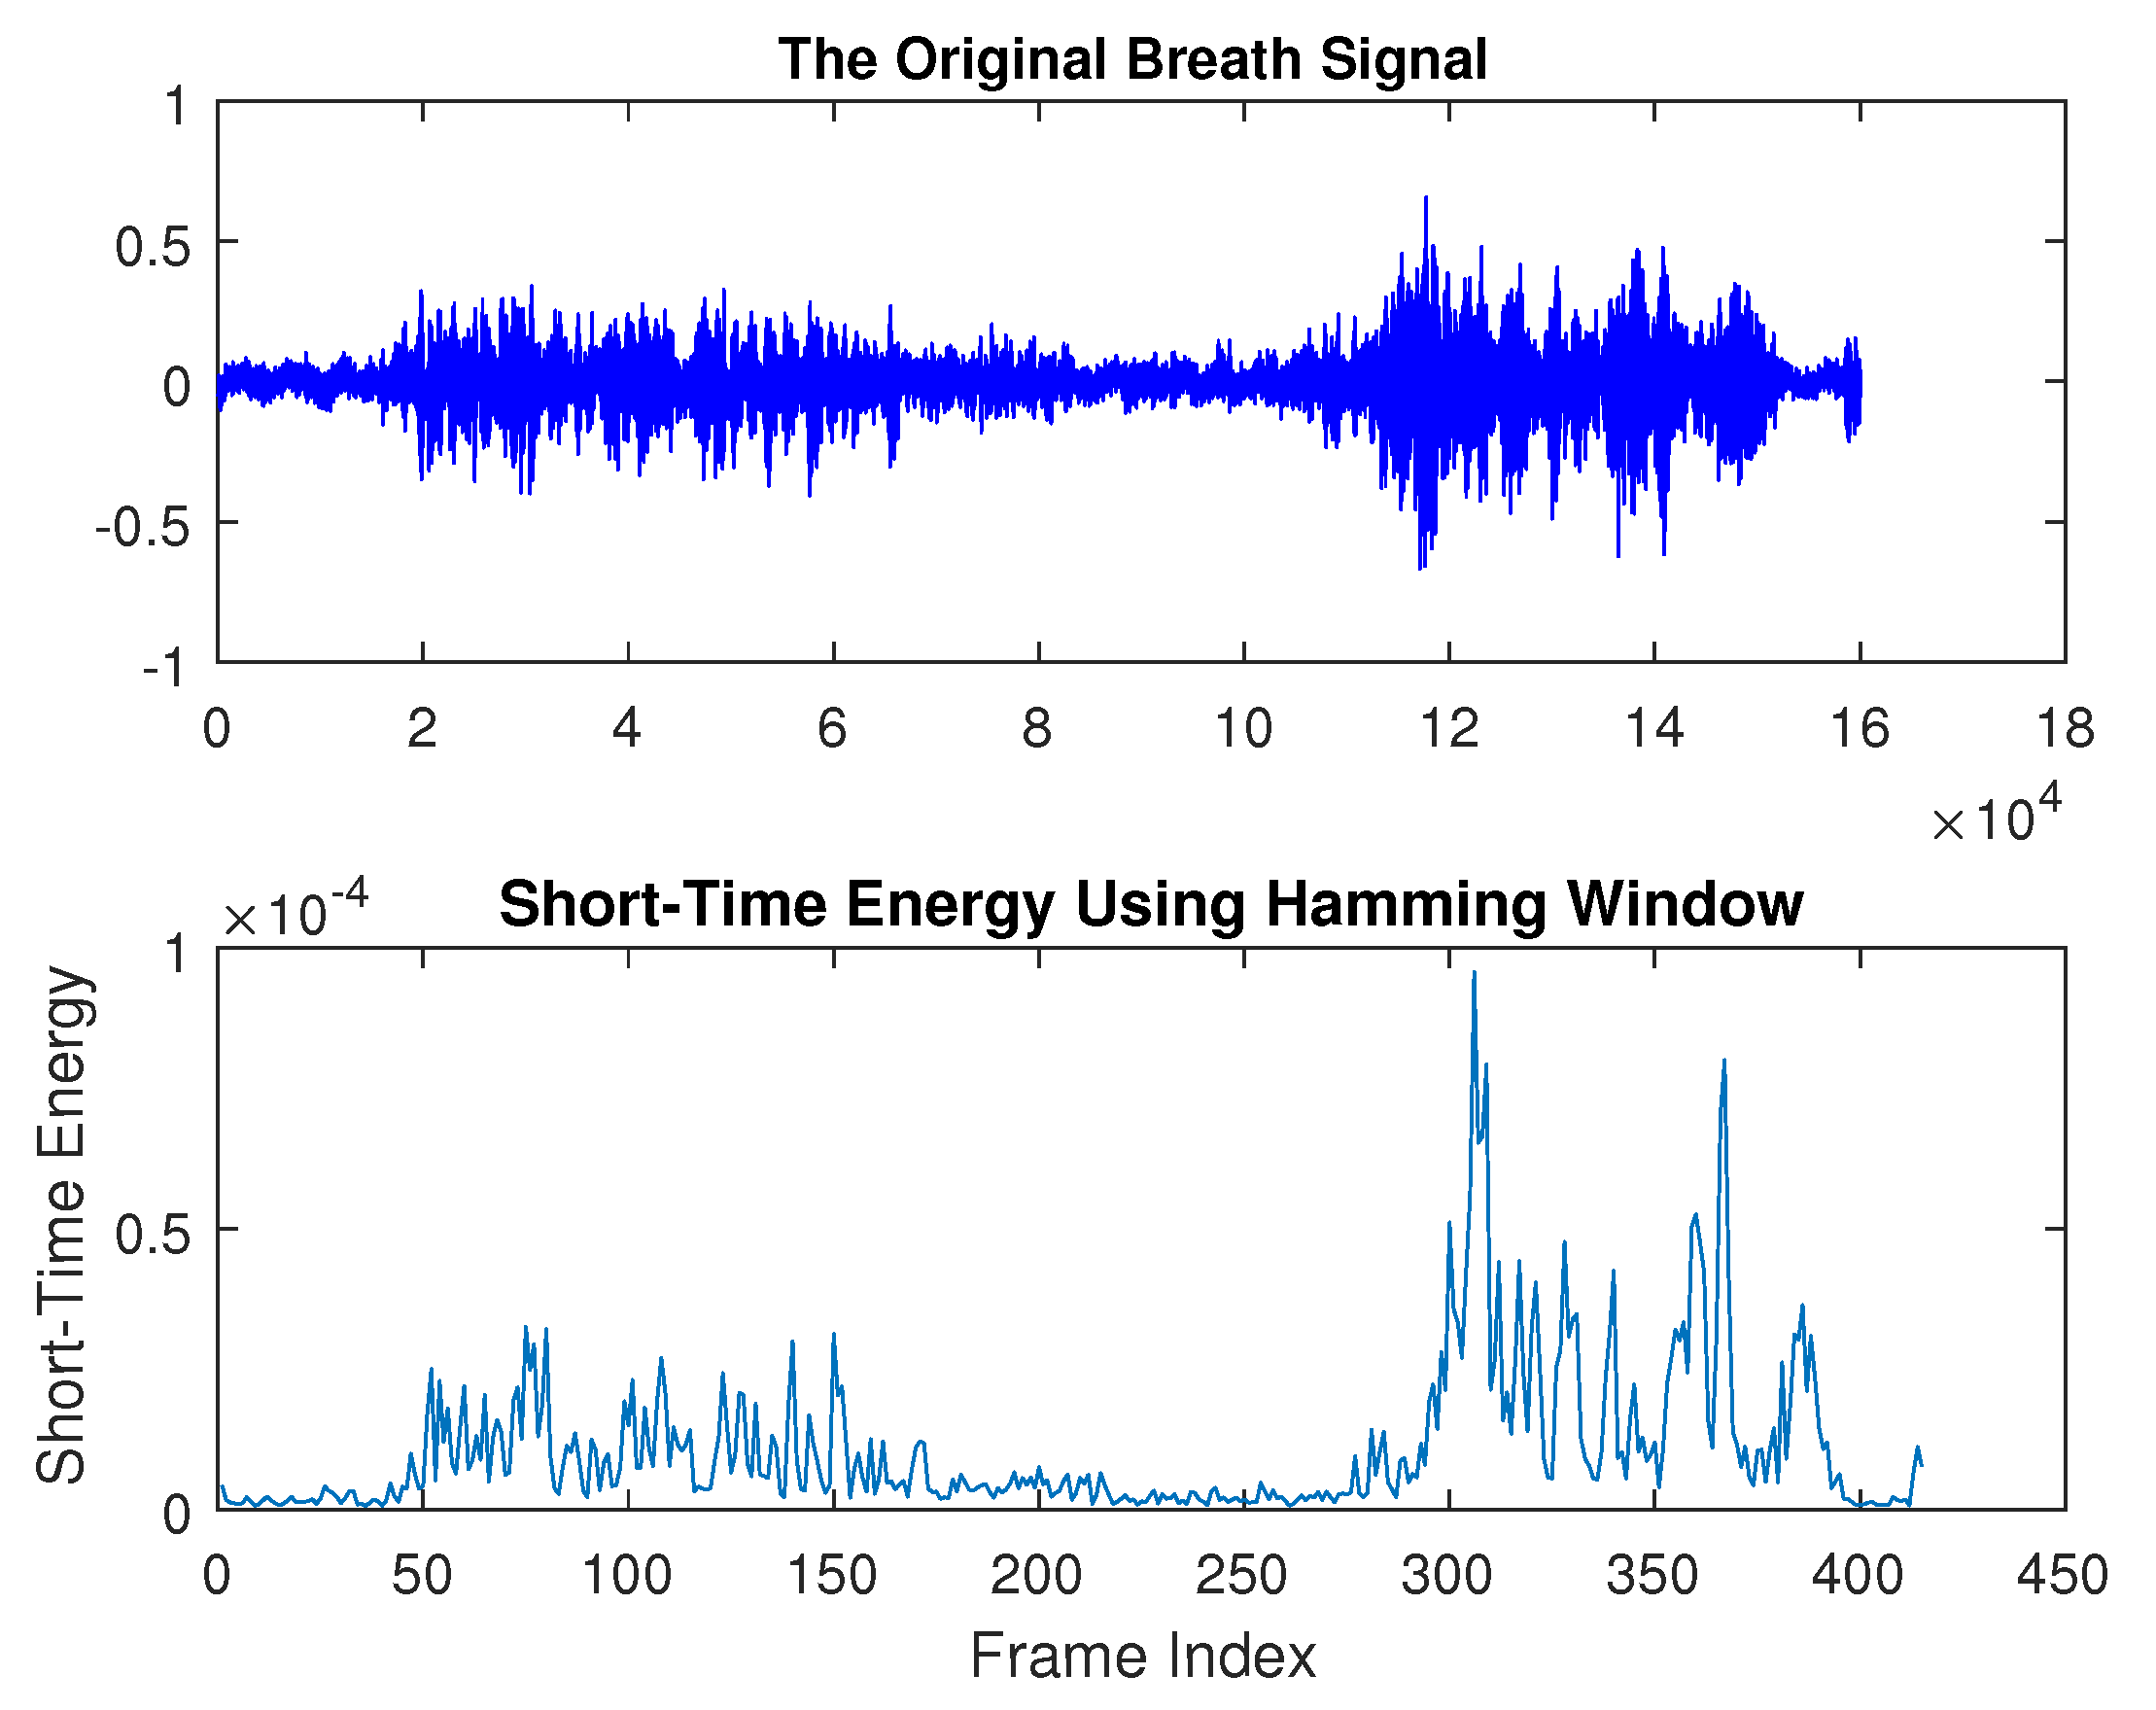
This study employs short-time analysis to divide recorded audio into individual “breath sound segments.” For example, a single segment may include both an inhalation and an exhalation, as illustrated in Figure 5, comparing the raw breath sound waveform with its short-time energy (STE) profile. Silent intervals are easily distinguished by their substantially lower STE values. By removing these low-energy segments, the remaining audio accurately captures the active breath sounds used for further analysis.

6.2.2. Pattern Extraction Results

Feature extraction results from breath sounds of young children with various respiratory conditions are presented. Our previous findings indicated that LPC features exhibit similarity in the lower-order coefficients, and that LPCC is not sufficiently sensitive to distinguish between different types of breath sounds [40].
Figure 6 shows the Mel–Frequency Cepstral Coefficients (MFCCs) for asthma from three different human subjects. Despite being from different children, the MFCCs under the same physical conditions exhibit notable similarity. The x-axis represents the frame index, the y-axis indicates the MFCC coefficient number (1–10), and the z-axis shows the corresponding coefficient values. First, within a single data sample, similar coefficient values can be observed across different frames at the same MFCC index. Furthermore, when comparing across different subjects, the MFCC surface plots reveal a high degree of correlation, suggesting consistency in spectral patterns associated with asthma.
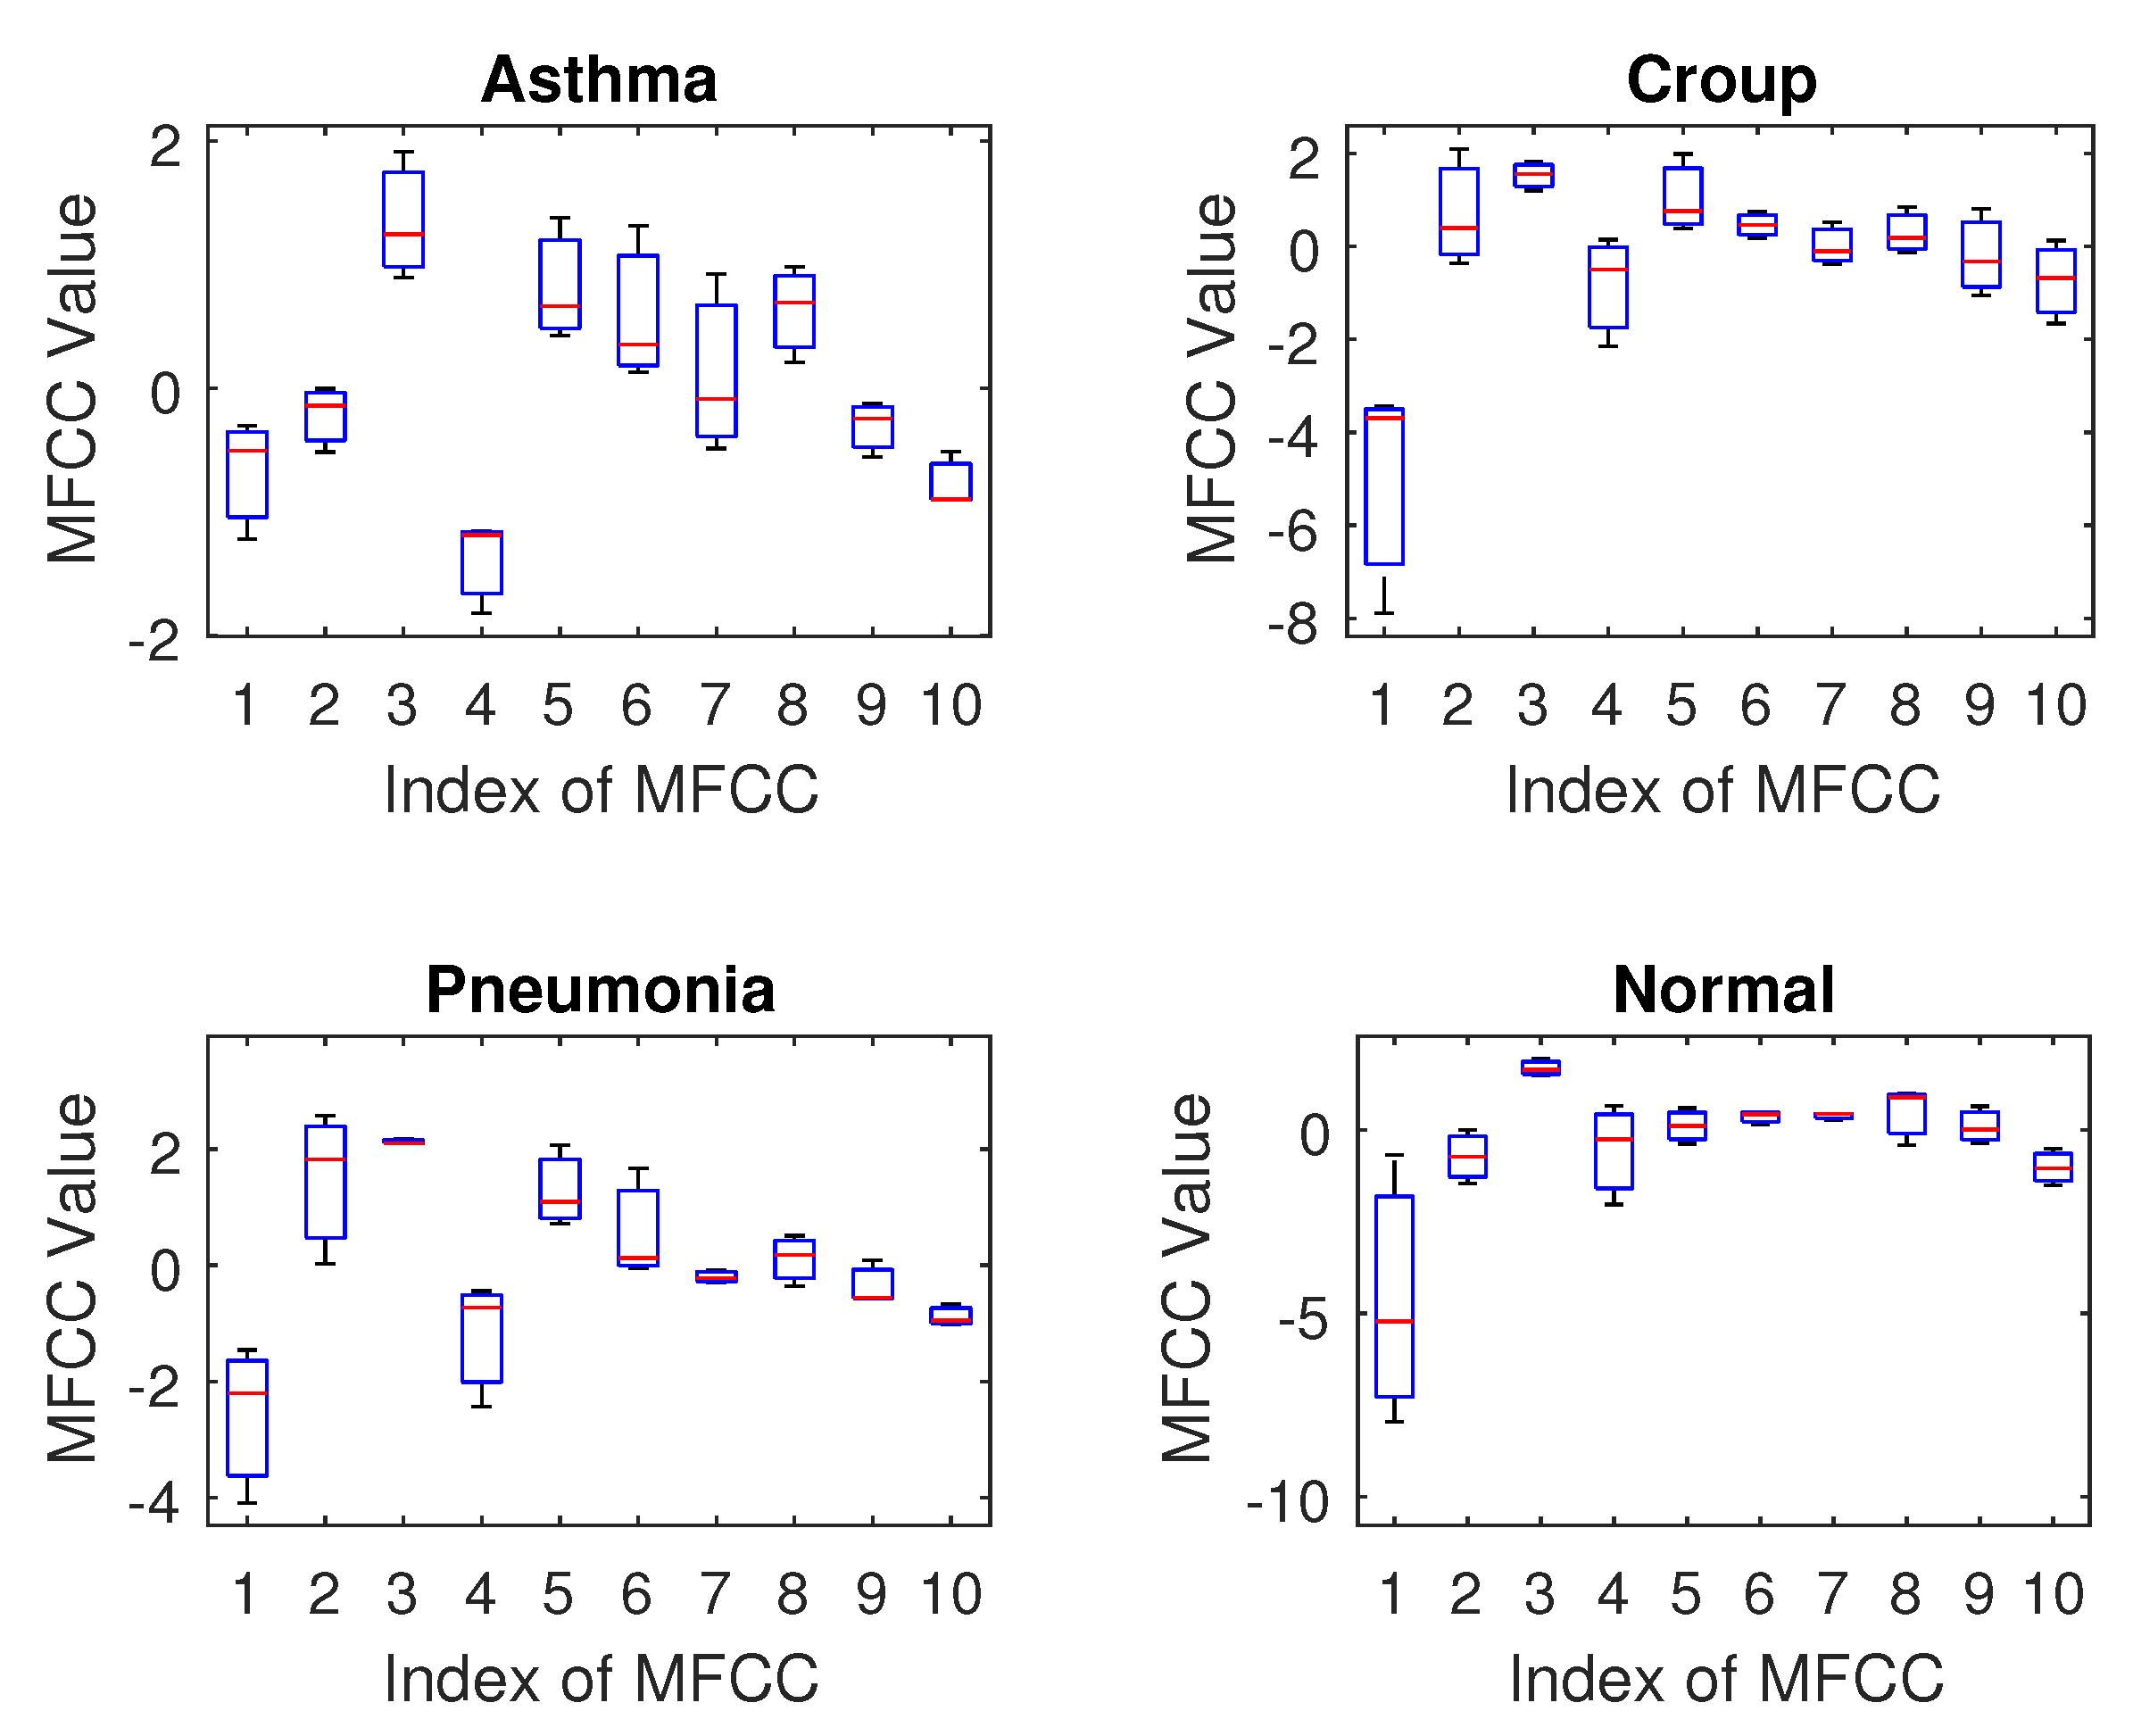
Figure 7 illustrates the MFCC features for various breath sound categories across different young children. For ‘asthma’ (upper left), a striking similarity in MFCC features is observed among the three children, indicating a consistent pattern for this condition. Similarly, in the ‘croup’ category (upper right), the MFCC features demonstrate notable similarity across the three breath sound files, suggesting a consistent characteristic for this diagnosis. In contrast, ‘pneumonia’ (lower left) exhibits a marked difference in MFCC features compared to ‘asthma’ and ‘croup’, highlighting a distinct pattern for this disease. Finally, ‘normal’ breath sounds (lower right) reveal a clear trend of similarity in MFCC features among the three children. These results suggest that MFCC features effectively capture the similarity within each breath sound category, supporting their potential for robust breath sound recognition.
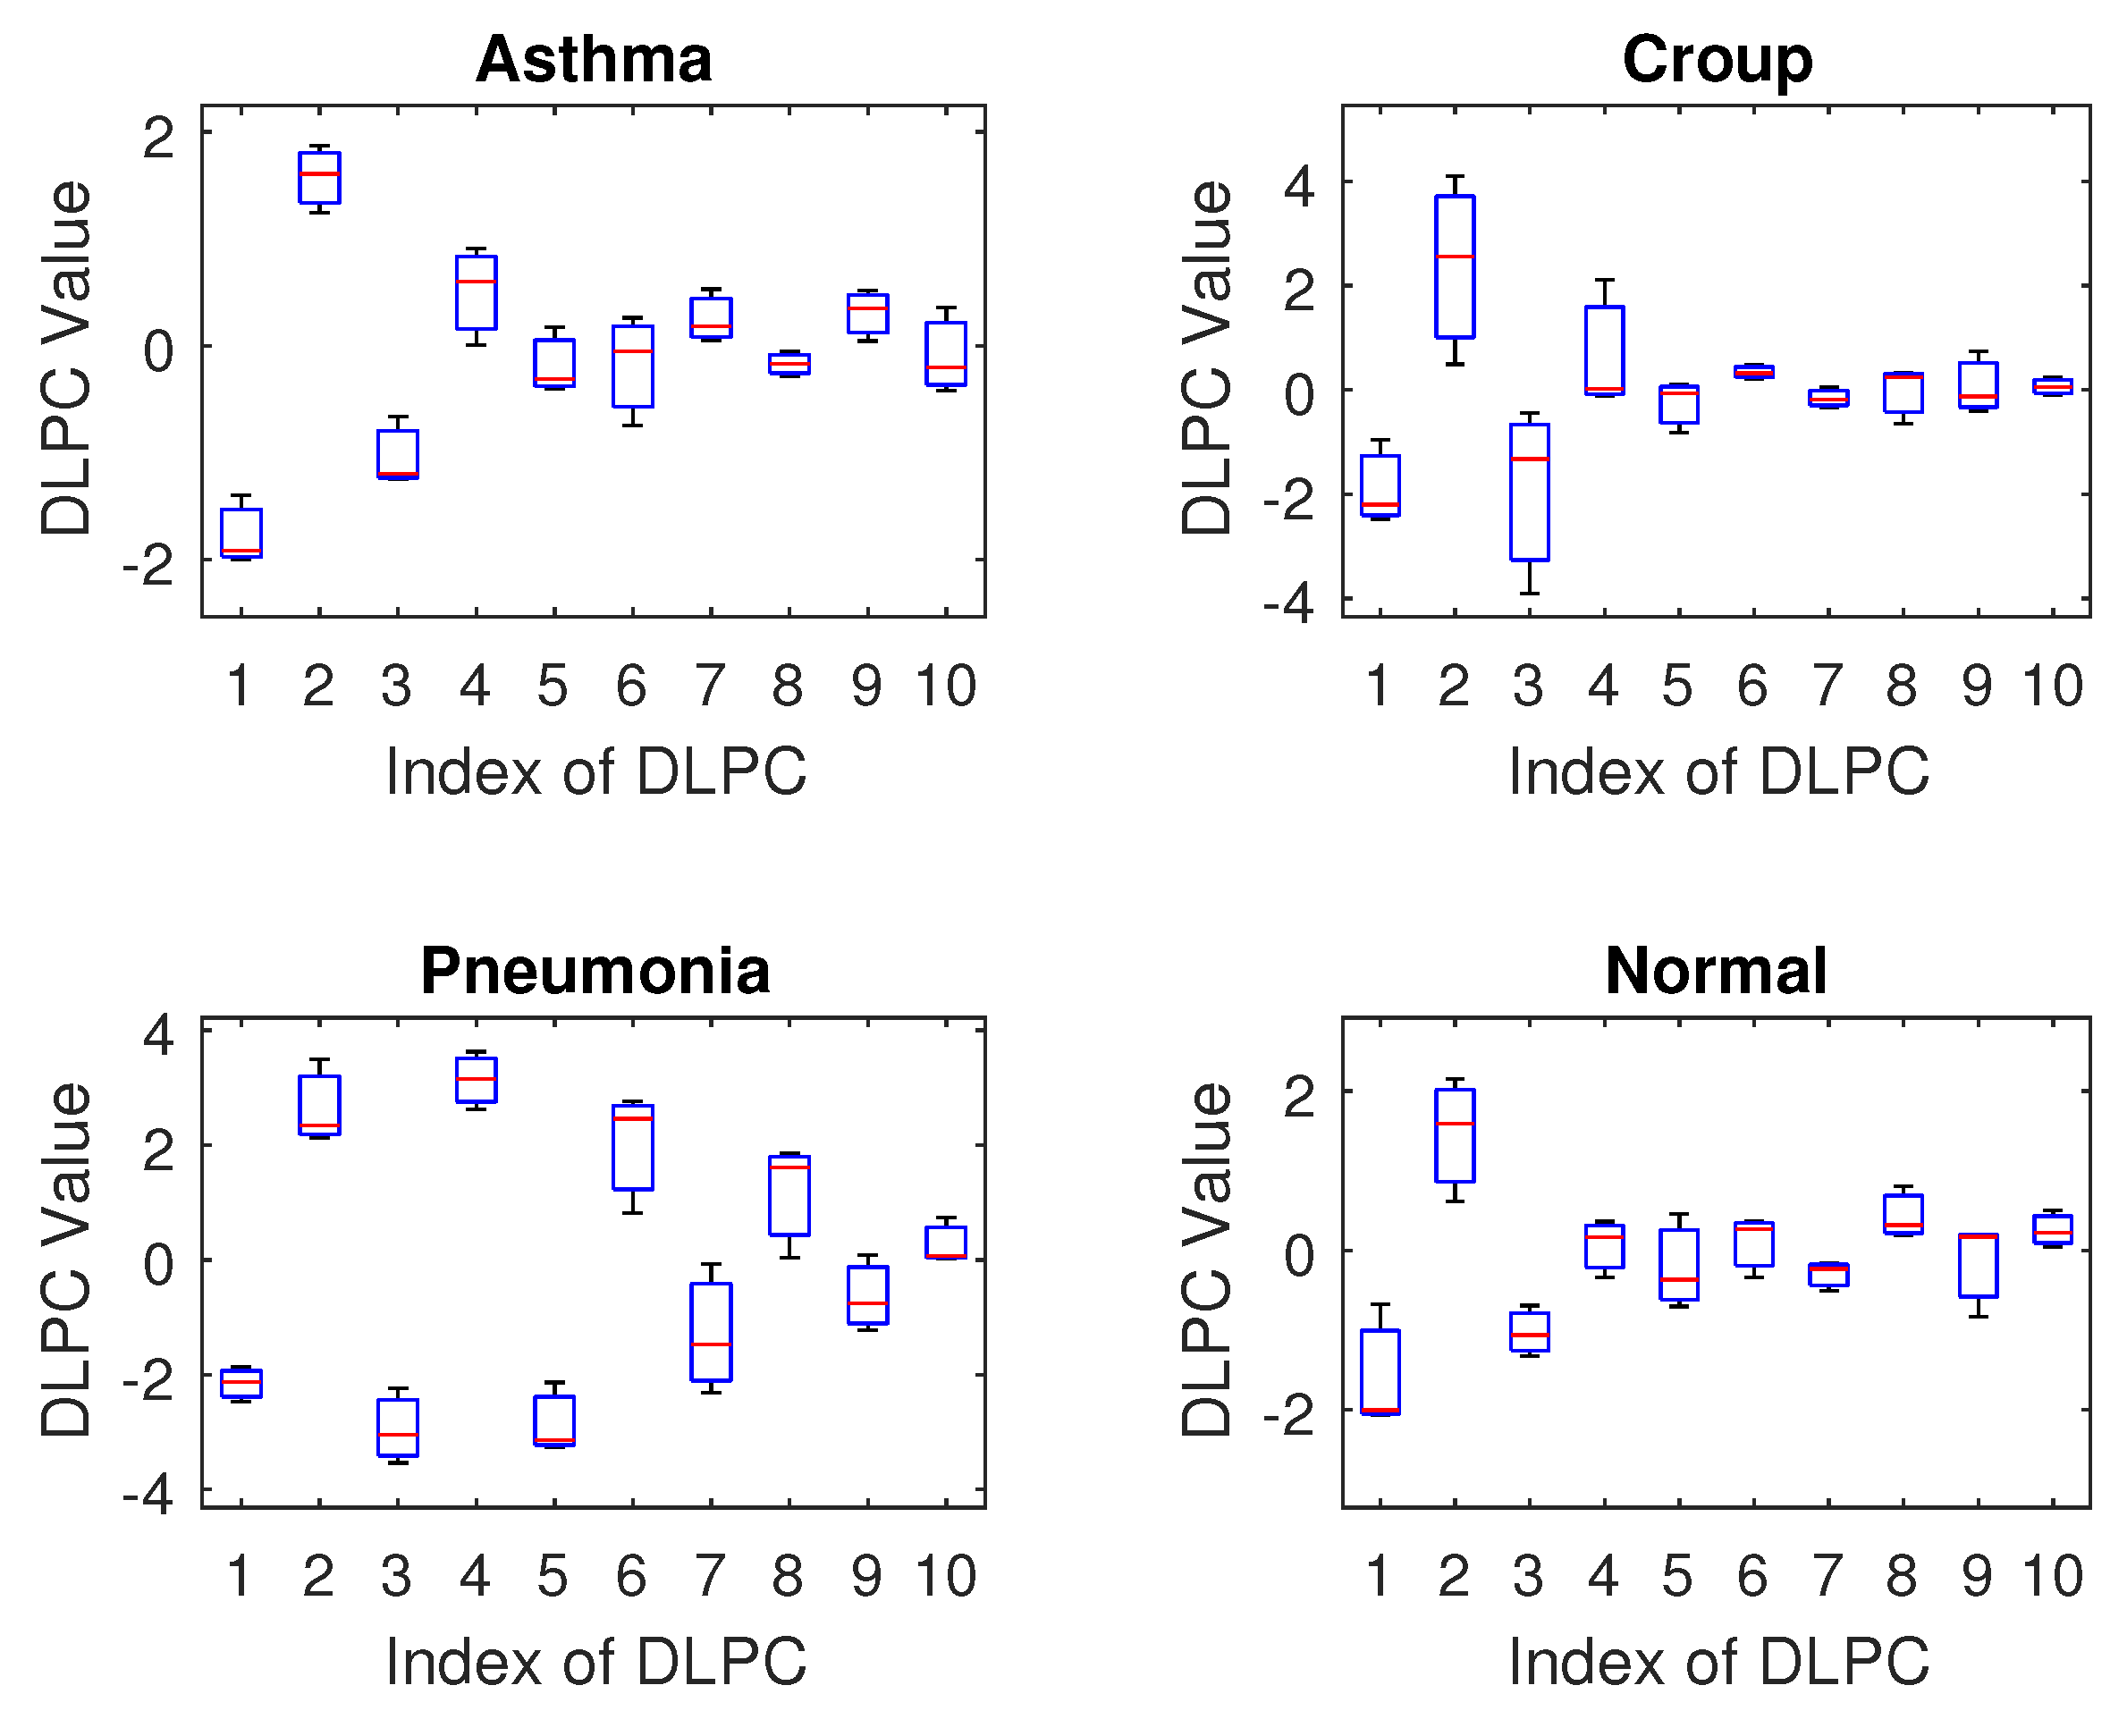
Figure 8 depicts the Dynamic Linear Predictive Coding (DLPC) features for various respiratory conditions in children, highlighting the temporal evolution of spectral patterns. For ‘asthma’ (upper left), DLPC features from three children show striking similarity, reflecting a consistent temporal signature for this condition. Likewise, ‘croup’ (upper right) reveals strong correlations among features extracted from three subjects, specifically in the first-order and high-order coefficients, indicating a unified temporal trend. ‘Pneumonia’ (lower left) exhibits a comparable temporal pattern. These features markedly differ from those of ‘asthma’ and ‘croup,’ underscoring DLPC’s discriminative capability. Finally, ‘normal’ breath sounds (lower right) display consistent temporal trends and high feature similarity across three children. These results demonstrate DLPC’s effectiveness in capturing temporal dynamics of breath sounds, positioning it as a robust tool for breath sound recognition.

6.3. Recognition Performance Evaluation

In this section, we present the recognition results for breath sound classification, focusing on the most representative outcomes from various features and classifiers due to paper length constraints. We evaluate performance using accuracy, precision, recall, and F1 score, highlighting key results from features like Dynamic Linear Prediction Coefficients (DLPCs) and spectral entropy, paired with classifiers such as random forest and logistic regression.
The confusion matrix tabulates predicted versus actual class labels, as shown in Table 2:
Accuracy is the ratio of correctly classified instances to the total:
Accuracy = i = 1 C TP i Total Samples
Recall is the ability of a classification model to identify all data points in a relevant class.
Precision i = TP i TP i + FP i
Precision is the ability of a classification model to return only the data points in a class.
Recall i = TP i TP i + FN i
The F1 score, combining precision and recall, assesses classification performance per class.
F 1 i = 2 · Precision i · Recall i Precision i + Recall i
Classification results using K-Nearest Neighbor (KNN) with LPC, LPCC, MFCC, and DLPC features are detailed in Table 3, Table 4, Table 5 and Table 6, respectively. Overall accuracies are 0.733 for LPC, 0.65 for LPCC, 0.80 for MFCC, and 0.717 for DLPC. MFCC outperforms other features for breath sound extraction, achieving a peak accuracy of 80%. LPC and DLPC yield similar results, around 70%, while LPCC performs worst at 65%. Notably, DLPC offers the advantage of reduced computational complexity despite its competitive accuracy.
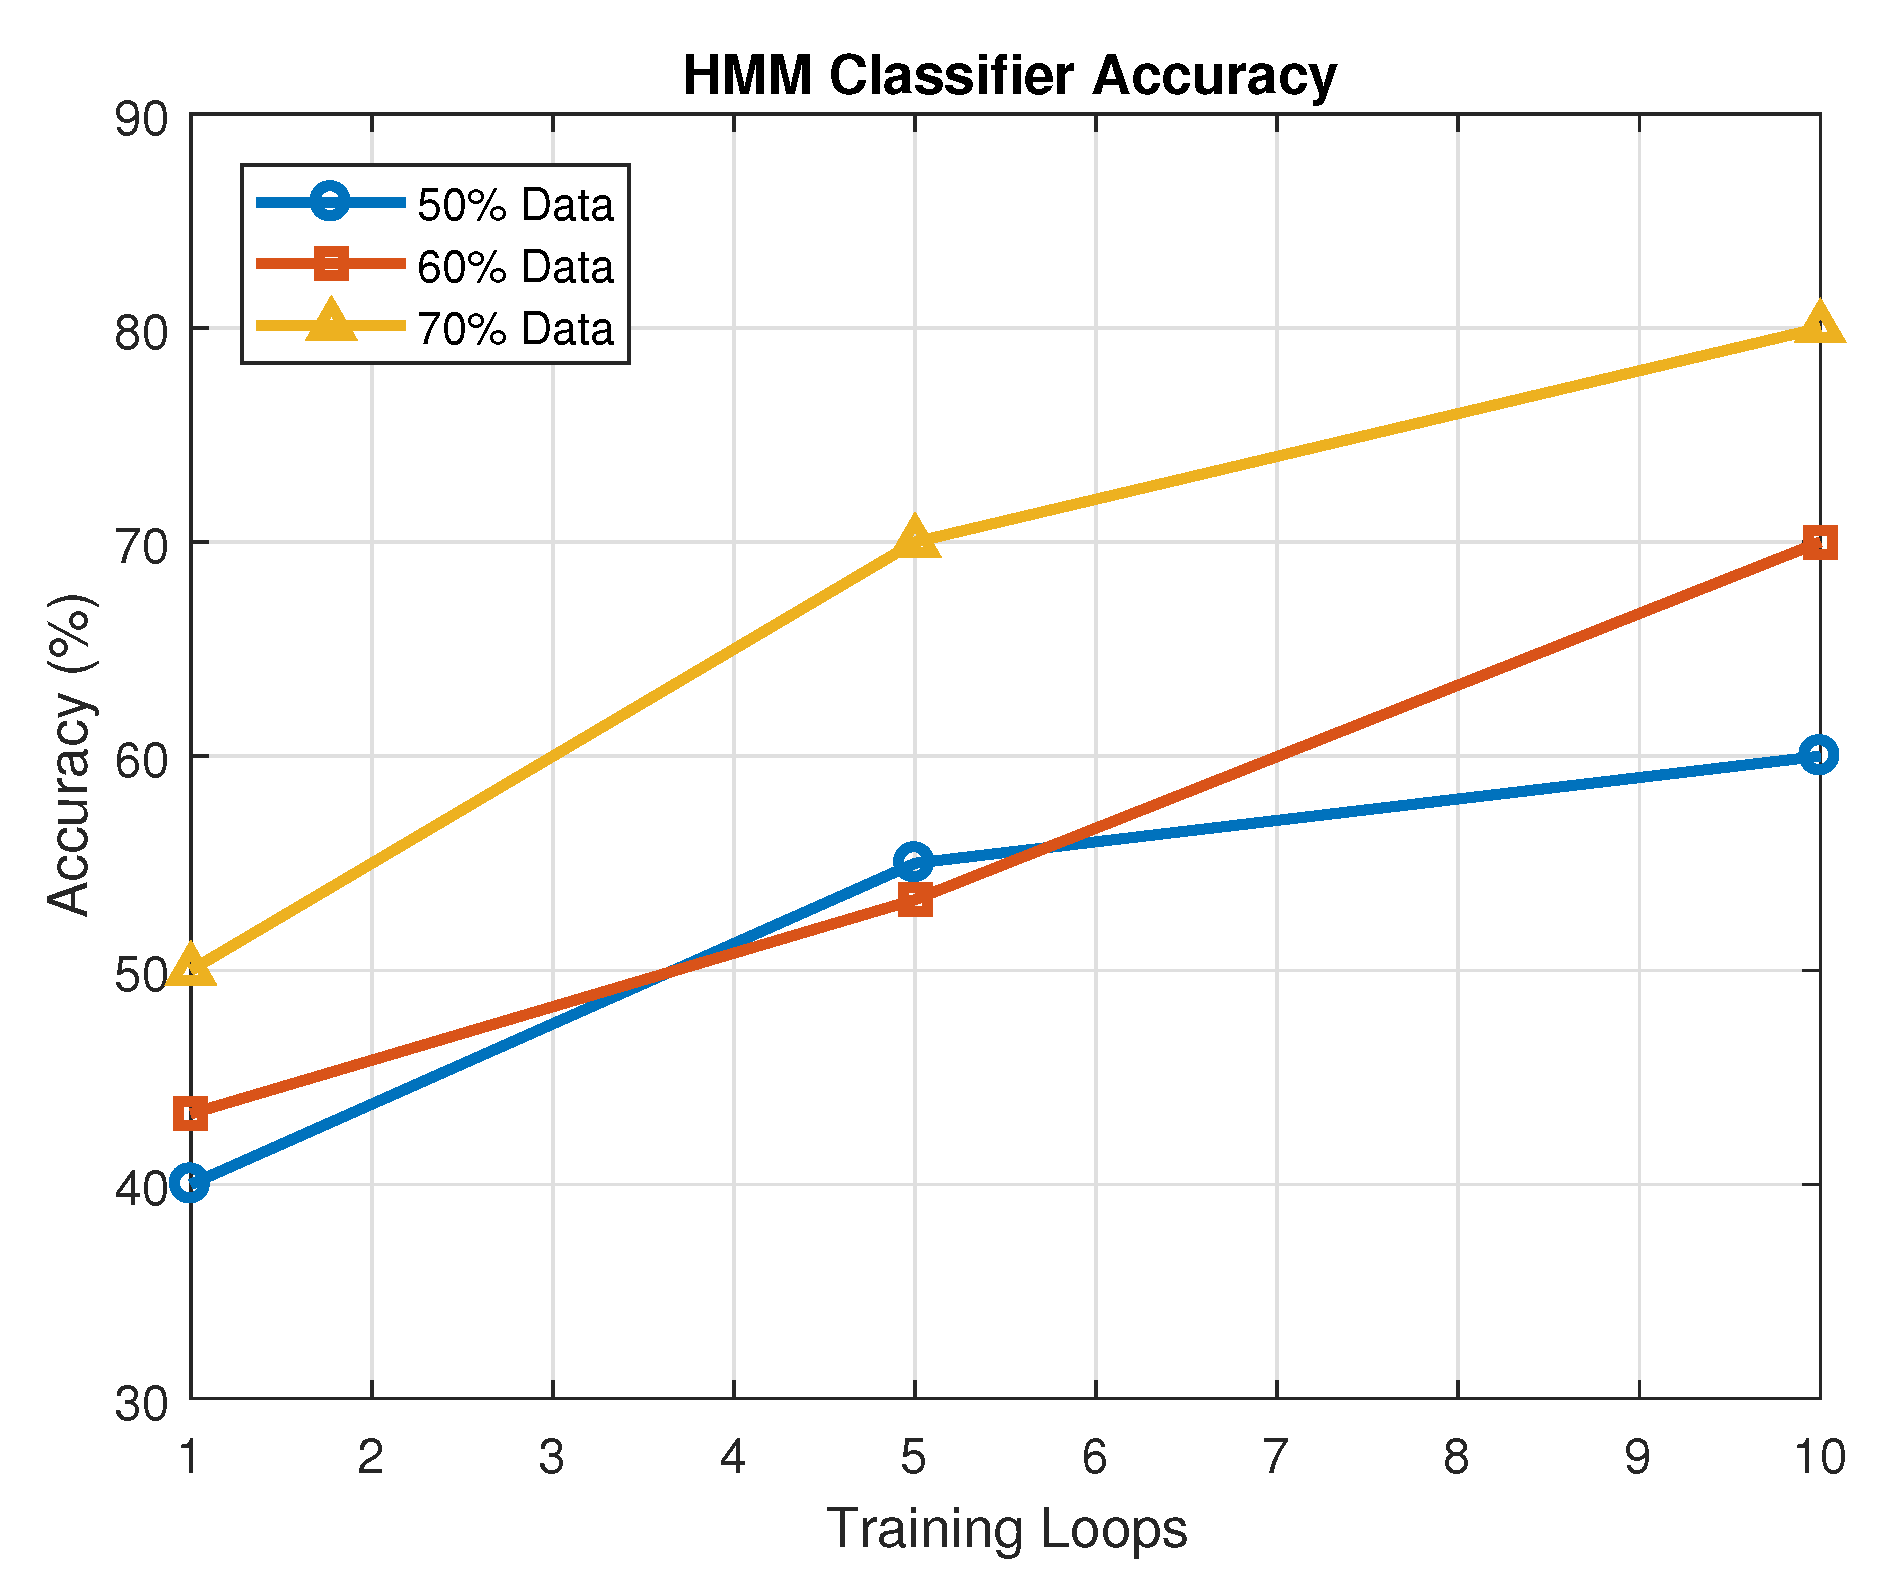
For the hidden Markov model (HMM) classification, the data was partitioned into training and testing sets. The number of training iterations significantly impacted the classification performance. Figure 9 illustrates the HMM classification results, demonstrating the effect of varying training data proportions and training loop counts. The highest recognition rate, achieving 80%, was observed with 10 training loops and a 70% training data proportion.
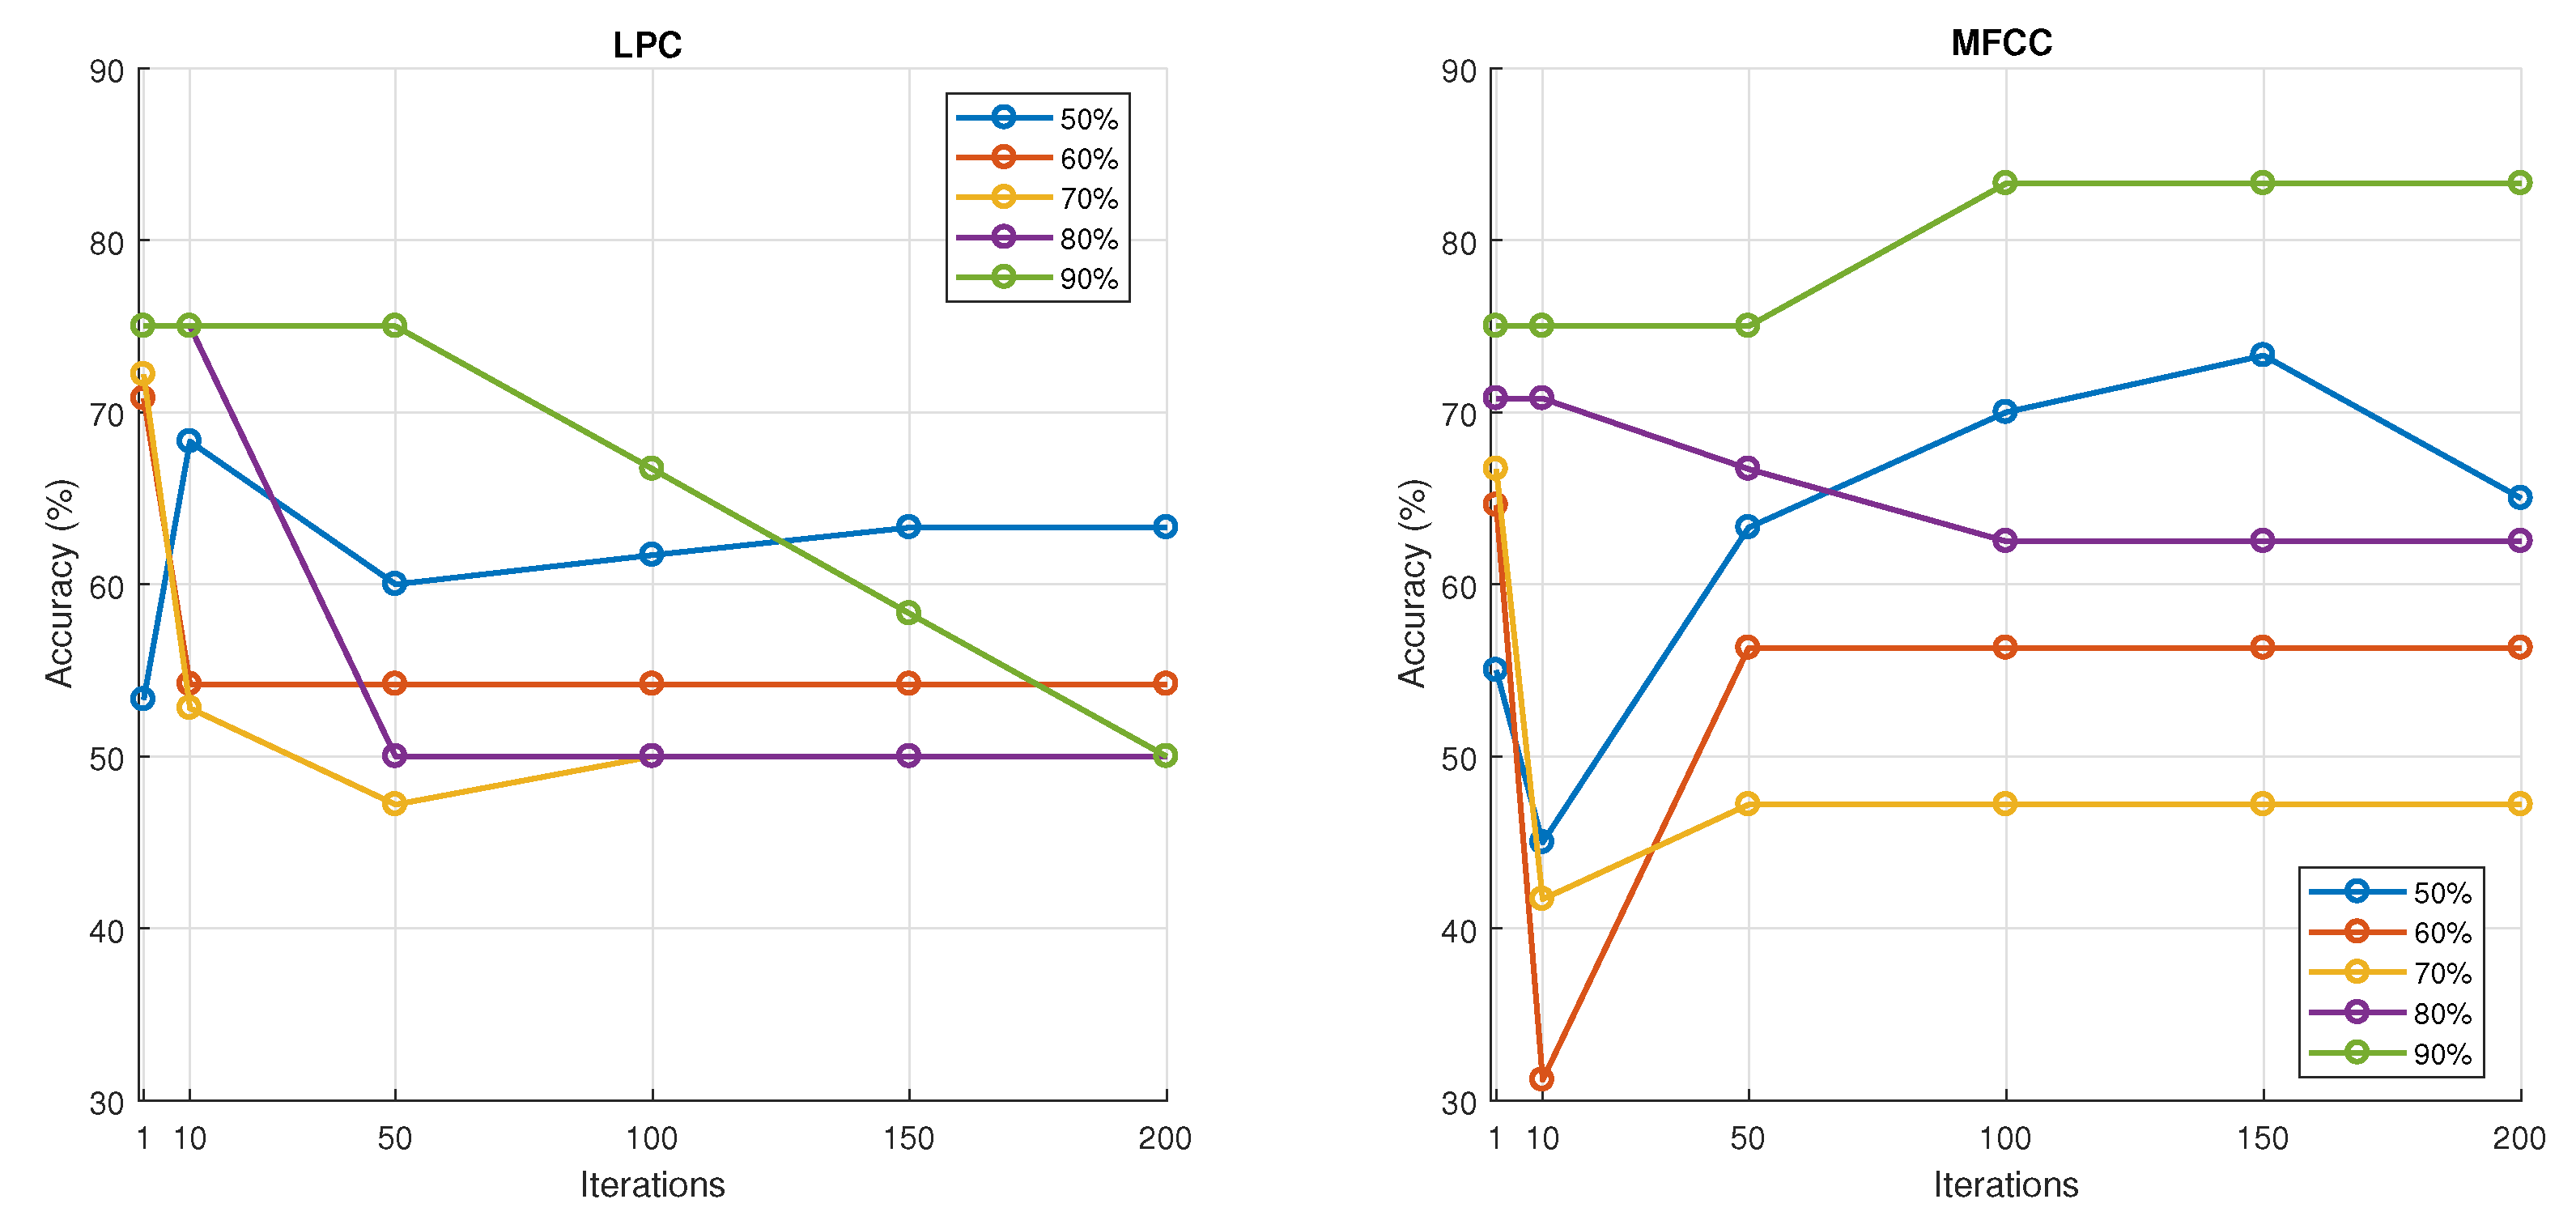
To evaluate the efficacy of artificial neural networks (ANNs) for breath sound recognition, we conducted experiments using Linear Predictive Coding (LPC) features. The classification accuracy, as a function of training data proportion and training iterations, is presented in Figure 10. Our analysis revealed that the neural network weights converged after approximately 50 iterations. Furthermore, satisfactory training performance was achieved with 50% to 60% of the total breath sound training dataset, resulting in a classification rate of approximately 70%. Subsequently, we investigated the performance of ANNs using Mel–Frequency Cepstral Coefficients (MFCCs) as input features. Again, we varied the training data proportion and the number of training iterations. In this configuration, neural network convergence was observed after roughly 50 iterations, and a training dataset comprising 70% to 80% of the total data yielded optimal results. While the classification rate using MFCC features alone was approximately 70%, the highest achieved classification rate was 83.3 %, indicating potential for improved performance with optimized training parameters.
For artificial neural networks (ANNs) paired with LPC, accuracy remains relatively low, below 0.70, with no discernible trend of improvement from additional iterations or increased data sample size, the latter limited by our dataset. This suggests that ANNs and LPC form a suboptimal combination for breath sound classification. In contrast, when ANNs are paired with MFCCs, increasing the data sample size boosts accuracy, and additional iterations further enhance performance, with some configurations achieving 0.80 or higher. This implies that ANNs and MFCCs offer promising synergy for effective breath sound recognition, leveraging larger datasets and iterative refinement.
Table 7, Table 8 and Table 9 present the performance of spectral entropy features across different classifiers—K-Nearest Neighbor (KNN), random forest (RF), and logistic regression (LR)—evaluated using accuracy, precision, recall, and F1 score for the classes asthma, croup, normal, and pneumonia. KNN and RF achieve near-perfect accuracy (97%), with exceptional performance on normal and pneumonia (F1 scores of 1.0 ). This reflects spectral entropy’s ability to capture distinct patterns in these conditions. However, slight trade-offs emerge for asthma (precision 0.91 ; recall 1.0 ) and croup (precision 1.0 ; recall 0.9 for KNN; 0.88 recall for RF), suggesting minor variability in detecting these disorders. In contrast, logistic regression performs poorly, with an accuracy of 63% and significant weakness in classifying pneumonia (F1 0.29 ; precision 0.33 ; recall 0.25 ), indicating that spectral entropy’s nonlinear properties are less effectively leveraged by LR’s linear framework. These results underscore spectral entropy’s critical role in enhancing the discriminative power of KNN and RF, making them robust choices for breath sound classification, while highlighting LR’s limitations in this context.
The Table 10 presents the Wilson 95 % confidence intervals (CIs) for classification accuracy across different combinations of audio features and classifiers used in breath sound analysis. The confidence interval provides an estimated range within which the true accuracy lies, with 95 % certainty. The DLPC and MFCC with KNN yielded high performance, with the DLPC achieving a CI of [ 0.717 ,   0.866 ] , demonstrating strong reliability in classifying pediatric respiratory sounds. Spectral entropy, when used with KNN and random forest, achieved the highest confidence intervals of [ 0.925 ,   0.990 ] , indicating promising predictive consistency. On the other hand, the LPCC and LPC with KNN yielded comparatively wider and lower intervals, suggesting moderate performance. The combination of spectral entropy and logistic regression resulted in a lower CI of [ 0.540 ,   0.712 ] , indicating weaker performance compared to ensemble or instance-based classifiers.
These intervals help to compare not only the average classification performance but also the stability and reliability of each method across varying samples. High and narrow intervals signify greater confidence in model generalizability for pediatric respiratory sound classification.

7. Discussion

Recorded signals contain undesired components, such as environmental ambient noise, heartbeat sounds, and speech from patients or physicians. A band-pass filter ranging from 50 to 2500 Hz—corresponding to the typical bandwidth of breath sounds—is commonly applied during data collection and preprocessing to suppress these unwanted signals. However, this approach has limited effectiveness against interfering signals that overlap in frequency with breath sounds, including heartbeats, broadband noise, and human speech. Such interference can impact signal quality and consistency.
Regarding feature selection, our results indicate that the MFCC (Mel–Frequency Cepstral Coefficient) is a promising feature for breath sound classification. The DLPC (Dynamic Linear Prediction Coefficient) also demonstrates reasonable performance with reduced computational complexity, making it suitable for training deep learning models on limited datasets. In contrast, the LPC and LPCC were found to be less effective as they showed high similarity across different classes, suggesting they are not sensitive enough to distinguish the unique acoustic patterns of various breath sounds.
Spectral entropy emerged as a strong candidate feature, particularly for detecting low-probability events such as respiratory diseases. Its ability to capture both the frequency characteristics and the underlying probability distribution of the signal makes it well-suited for this task. However, given the limited dataset size, the observed high accuracy may be a result of overfitting. Further investigation with larger datasets is needed to confirm its generalizability.
Among the classifiers tested, artificial neural networks (ANNs) and random forest demonstrated the most promising results, achieving high accuracy and generalization within the constraints of the current dataset. K-Nearest Neighbor (KNN) also showed reasonable performance and can serve as a strong baseline for small- to medium-sized datasets.
In contrast, logistic regression did not perform well in our experiments, suggesting it is not well-suited for capturing the complex nonlinear patterns inherent in breath sound data. Hidden Markov models (HMMs) showed performance comparable to ANNs, indicating their potential in modeling temporal dynamics, although further tuning and data expansion may enhance their effectiveness.
Looking ahead, more advanced architectures, such as convolutional neural networks (CNNs) or recurrent neural networks (RNNs), could be explored, especially as more data becomes available. These models may provide improved feature representation and classification accuracy by leveraging spatial and temporal dependencies in the audio signals.
To ensure the robustness and generalizability of the proposed system, it is essential to expand the dataset with a larger number of diverse samples. This will facilitate more comprehensive statistical analysis, improve classifier training, and support the development of more sophisticated models. The proposed breath sound analysis system demonstrates significant potential for application in real-world healthcare settings. In particular, it can serve as a valuable screening tool in primary care environments, assisting clinicians in early identification of pediatric respiratory conditions such as asthma, croup, and pneumonia. Additionally, due to its lightweight computational requirements and interpretability, the system is well-suited for home monitoring, especially in households with young children who are prone to respiratory infections. With minimal training, non-specialist caregivers—including parents and community health workers—could use this tool to capture breath sounds and conduct preliminary assessments, enabling earlier medical intervention and reducing the burden on emergency services. This approach aligns with the growing trend of integrating AI-powered diagnostics into accessible user-friendly platforms to promote preventive care and reduce gaps in healthcare access.

8. Conclusions

This paper introduces innovative approaches for detecting and recognizing breath sounds in young children, tailored to be individually independent for general application and robust against noisy environments. By extracting audio features—such as Dynamic Linear Prediction Coefficients (DLPCs) and spectral entropy—in both the time and frequency domains, and aligning these with spectrogram analysis informed by health professionals, we developed a comprehensive framework for breath sound classification. Clinical data from 120 samples across infants, toddlers, and preschoolers (aged 2 months to 6 years) were used to design and validate these methods, with the experiments demonstrating high accuracy: K-Nearest Neighbor (KNN) and random forest (RF) achieved 97% accuracy. These results highlight the efficacy of DLPCs and spectral entropy in capturing the nonstationary, chaotic patterns of pediatric breath sounds, enabling precise differentiation of conditions like asthma, croup, pneumonia, and normal breathing. Future work will expand the classification to include additional respiratory classes (e.g., bronchitis and wheezing subtypes), increase the dataset size for greater generalizability, and enhance performance through advanced feature engineering or classifier optimization. The proposed system offers a practical tool for parents and novice caregivers, facilitating early monitoring and screening of respiratory health to mitigate risks of impairment in young children and reduce healthcare costs. Looking forward, this approach lays a foundation for scalable human–machine cooperative systems, with potential enhancements through expanded datasets and integration with real-time diagnostic platforms. The potential of the system as a screening instrument in primary care has thus been investigated. The utilization of the aforementioned apparatus is to be executed within the confines of a residential setting, with the implementation of remote guidance. The potential exists for expansion to other childhood respiratory diseases.
Author Contributions

Methodology, L.L. and W.L.; Validation, B.M. All authors have read and agreed to the published version of the manuscript.

Funding

This research received no external funding.

Institutional Review Board Statement

Approved by NIU (IRB HS17-0139).

Informed Consent Statement

Informed consent was obtained from all subjects involved in the study.

Data Availability Statement

The original contributions presented in the study are included in the article, further inquiries can be directed to the corresponding author.

Conflicts of Interest

Author Wei Li is with the Alexander Innovation Centre. The remaining authors declare that the research was conducted in the absence of any commercial or financial relationships that could be construed as a potential conflict of interest.

References

  1. Simoes, E.A.F.; Cherian, T.; Chow, J.; Shahid-Salles, S.A.; Laxminarayan, R.; John, T.J. Acute Respiratory Infections in Children. In Disease Control Priorities in Developing Countries, 2nd ed.; Jamison, D.T., Breman, J.G., Measham, A.R., Alleyne, G., Claeson, M., Evans, D.B., Jha, P., Mills, A., Musgrove, P., Eds.; The International Bank for Reconstruction and Development/The World Bank: Washington, DC, USA; Oxford University Press: New York, NY, USA, 2006; Chapter 25. Available online: https://www.ncbi.nlm.nih.gov/books/NBK11786/ (accessed on 6 May 2018).
  2. McCance, K.; Huether, S. Pathophysiology: The Biologic Basis for Disease in Adults and Children; Mosby Publish: Maryland Heights, MI, USA, 2020. [Google Scholar]
  3. Frese, T.; Klauss, S.; Herrmann, K.; Sandholzera, H. Children and Adolescents as Patients in General Practice—The Reasons for Encounter. J. Clinical. Med. Res. 2011, 3, 177–182. [Google Scholar] [CrossRef] [PubMed]
  4. Witt, W.P.; Weiss, A.J.; Elixhauser, A. Overview of hospital stays for children in the United States, 2012. In Healthcare Cost and Utilization Project (HCUP) Statistical Briefs; Agency for Healthcare Research and Quality (US): Rockville, MD, USA, 2014. [Google Scholar]
  5. Bartlett, K.W.; Parente, V.M.; Morales, V.; Hauser, J.; McLean, H.S. Improving the efficiency of care for pediatric patients hospitalized with asthma. Hosp. Pediatr. 2017, 7, 31–38. [Google Scholar] [CrossRef] [PubMed]
  6. Frey, U.; Gerritsen, J. Respiratory Diseases in Infants and Children; European Respiration Society Publication: New York, NY, USA, 2006. [Google Scholar]
  7. Norman, S.; Olwen, T.; Sheila, J.; Marvin, G.; Paul, D. Parents’ responses to symptoms of respiratory tract infection in their children. Can. Med. Assoc. J. 2003, 168, 25–30. [Google Scholar]
  8. Laennec, R.T.H. De l’Auscultation Mediate ou Traite du Diagnostic des Maladies des Poumons et du Coeur; Brosson and Chaude: Paris, France, 1819. [Google Scholar]
  9. Bohadana, A.; Izbicki, G.; Kraman, S.S. Fundamentals of lung auscultation. N. Engl. J. Med. 2014, 370, 744–751. [Google Scholar] [CrossRef]
  10. Arts, L.; Lim, E.H.T.; Ven, P.M.v.; Heunks, L.; Tuinman, P.R. The diagnostic accuracy of lung auscultation in adult patients with acute pulmonary pathologies: A meta-analysis. Sci. Rep. 2020, 10, 7347. [Google Scholar] [CrossRef]
  11. Jacome, C.; Marques, A. Computerized respiratory sounds in patients with COPD: A systematic review. COPD 2015, 12, 104–112. [Google Scholar] [CrossRef] [PubMed]
  12. Andrès, E.; Gass, R.; Charloux, A.; Brandt, C.; Hentzler, A. Respiratory sound analysis in the era of evidence-based medicine and the world of medicine 2.0. J. Med. Life 2018, 11, 89–106. [Google Scholar] [PubMed] [PubMed Central]
  13. Waitman, L.R.; Clarkson, K.P.; Barwise, J.A.; King, P.H. Representation and classification of breath sounds recorded in an intensive care setting using neural networks. J. Clin. Monit. Comput. 2000, 16, 95–105. [Google Scholar] [CrossRef]
  14. Sovijarvi, A.R.; Malmberg, L.P.; Charbonneau, G.; Vandershoot, J. Characteristics of breath sounds and adventitious respiratory sounds. Eur. Respir. Rev. 2000, 10, 591–596. [Google Scholar]
  15. Pramono, R.X.A.; Bowyer, S.; Rodriguez-Villegas, E. Automatic adventitious respiratory sound analysis: A systematic review. PLoS ONE 2017, 12, e0177926. [Google Scholar] [CrossRef]
  16. Palaniappan, R.; Sundaraj, K.; Ahamed, N.U. Machine learning in lung sound analysis: A systematic review. Biocybern. Biomed. Eng. 2013, 33, 129–135. [Google Scholar] [CrossRef]
  17. Palaniappan, R.; Sundaraj, K.; Ahamed, N.U.; Arjunan, A.; Sundaraj, S. Computer-based respiratory sound analysis: A systematic review. IETE Tech. Rev. 2013, 30, 248–256. [Google Scholar] [CrossRef]
  18. Gurung, A.; Scrafford, C.G.; Tielsch, J.M.; Levine, O.S.; Checkley, W. Computerized lung sound analysis as diagnostic aid for the detection of abnormal lung sounds: A systematic review and meta-analysis. Respir. Med. 2011, 105, 1396–1403. [Google Scholar] [CrossRef] [PubMed]
  19. Sarkar, M.; Madabhavi, I.; Niranjan, N.; Dogra, M. Auscultation of the respiratory system. Ann. Thorac. Med. 2015, 10, 158–168. [Google Scholar] [CrossRef]
  20. Elphick, H.E.; Ritson, S.; Rodgers, H.; Everard, M.L. When a wheeze is not a wheeze: Acoustic analysis of breath sounds in infants. Eur. Respir. J. 2000, 16, 593–597. [Google Scholar] [CrossRef]
  21. Elphick, H.E.; Lancaster, G.A.; Solis, A.; Majumdar, A.; Gupta, R.; Smyth, R.L. Validity and reliability of acoustic analysis of respiratory sounds in infants. Arch. Dis. Child. 2004, 89, 1059–1063. [Google Scholar] [CrossRef]
  22. Earis, J.E.; Cheetham, B.M.G. Current methods used for computerized respiratory sound analysis. Eur. Respir. Rev. 2000, 10, 586–590. [Google Scholar]
  23. Flietstra, B.; Markuzon, N.; Vyshedskiy, A.; Murphy, R. Automated analysis of crackles in patients with interstitial pulmonary fibrosis. Pulm. Med. 2011, 2010, 590506. [Google Scholar] [CrossRef]
  24. Oweis, R.; Abdulhay, E.; Khaya, A.; Awad, A. An Alternative Respiratory Sounds Classification System Utilizing Artificial Neural Networks. Biomed. J. 2015, 38, 153–161. [Google Scholar] [CrossRef]
  25. Palaniappan, R.; Sundaraj, K.; Lami, C.K. Reliable system for respiratory pathology classification from breath sound signals. In Proceedings of the International Conference on System Reliability and Science (ICSRS), Paris, France, 15–18 November 2016; pp. 15–17. [Google Scholar]
  26. Snider, B.; Kaini, A. Automatic Classification of Breathing Sounds During Sleep. In Proceedings of the 2016 International Conference on audio speech and signal processing (ICASSP), Izmir, Turkey, 2–5 May 2016; pp. 794–798. [Google Scholar]
  27. Shaharum, S.M.; Sundaraj, K.; Palaniappan, R. A survey on automated wheeze detection systems for asthmatic patients. Bosn. J. Basic Med. Sci. 2012, 12, 249–255. [Google Scholar] [PubMed]
  28. Rizal, A.; Hidayat, R.; Nugroho, H.A. Signal domain in respiratory sound analysis: Methods, application and future development. J. Comput. Sci. 2015, 11, 1005–1012. [Google Scholar] [CrossRef]
  29. Atman, D.G. Preferred reporting items for systematic reviews and meta-analyses: The PRISMA statement. Ann. Intern. Med. 2009, 151, 264–269. [Google Scholar]
  30. Gavriely, N.; Nissan, M.; Rubin, A.; Cugell, D.W. Spectral characteristics of chest wall breath sounds in normal subjects. Thorax 1995, 50, 1292–1300. [Google Scholar] [CrossRef]
  31. Kevat, A.; Kalirajah, A.; Roseby, R. Artificial intelligence accuracy in detecting pathological breath sounds in children using digital stethoscopes. Respir. Res. 2020, 21, 253. [Google Scholar] [CrossRef]
  32. Kim, B.J.; Kim, B.S.; Mun, J.H.; Lim, C.; Kim, K. An accurate deep learning model for wheezing in children using real world data. Sci. Rep. 2022, 12, 22465. [Google Scholar] [CrossRef]
  33. Park, J.S.; Kim, K.; Kim, J.H.; Choi, Y.J.; Kim, K.; Suh, D.I. A machine learning approach to the development and prospective evaluation of a pediatric lung sound classification model. Sci. Rep. 2023, 13, 1289. [Google Scholar] [CrossRef]
  34. Ruchonnet-Métrailler, I.; Siebert, J.N.; Hartley, M.A.; Lacroix, L. Automated Interpretation of Lung Sounds by Deep Learning in Children With Asthma: Scoping Review and Strengths, Weaknesses, Opportunities, and Threats Analysis. J. Med. Internet Res. 2024, 26, e53662. [Google Scholar] [CrossRef]
  35. Mochizuki, H.; Hirai, K.; Furuya, H.; Niimura, F.; Suzuki, K.; Okino, T.; Ikeda, M.; Noto, H. The analysis of lung sounds in infants and children with a history of wheezing/asthma using an automatic procedure. BMC Pulm. Med. 2024, 24, 394. [Google Scholar] [CrossRef]
  36. Moon, H.J.; Ji, H.; Kim, B.S.; Kim, B.J.; Kim, K. Machine learning-driven strategies for enhanced pediatric wheezing detection. Front. Pediatr. 2025, 13, 1–7. [Google Scholar] [CrossRef]
  37. Reyes-Sanchez, E.; Alba, A.; Obregón, Á.; Obregón, M.O.M.Á.; Milioli, G.; Parrino, L. Spectral entropy analysis of the respiratory signal and its relationship with the cyclic alternating pattern during sleep. Int. J. Mod. Phys. C 2016, 27, 1650140. [Google Scholar] [CrossRef]
  38. Rizal, A.; Hidayat, R.; Nugroho, H.A. Entropy measurement as features extraction in automatic lung sound classification. In Proceedings of the International Conference on Control, Electronics, Renewable Energy and Communications (ICCREC), Yogyakarta, Indonesia, 26–28 September 2017; pp. 93–97. [Google Scholar]
  39. Rizal, A.; Puspitasari, A. Lung Sound Classification Using Wavelet Transform and Entropy to Detect Lung Abnormality. Serbian J. Electr. Eng. 2022, 19, 79–98. [Google Scholar] [CrossRef]
  40. Liu, L.; Li, W.; Jiang, C. Applying Time-varying Features in Children Respiratory Recognition and Classification for Respiration System Diseases Screening. In Proceedings of the IEEE International Conference on Systems, Man, and Cybernetics, Melbourne, Australia, 17–20 October 2021. [Google Scholar]
  41. Liu, L.; Li, W.; Jiang, C. Breath Sounds Recognition and Classification for Respiration System Diseases. In Proceedings of the IEEE International Conference on Communications (ICC), Shanghai, China, 20–24 May 2019. [Google Scholar]
  42. Riella, R.J.; Nohama, P.; Maia, J.M. Method for automatic detection of wheezing in lung sounds. Braz. J. Med. Biol. Res. 2009, 38, 674–684. [Google Scholar] [CrossRef] [PubMed]
  43. Frey, U.; Gerritsen, J. New CDC Study Highlights Burden of Pneumonia Hospitalizations on U.S. Children; Center for Disease Control and Prevention: New York, NY, USA, 2015. [Google Scholar]
  44. Adderley, N.; Goldin, J.; Sharma, S. Pleural Friction Rub. In StatPearls; StatPearls Publishing: Treasure Island, FL, USA, 2025. [Google Scholar] [PubMed]
  45. Frey, U.; Gerritsen, J. Chronic Obstructive Pulmonary Disease (COPD) Includes: Chronic Bronchitis and Emphysema; Center for Disease Control and Prevention: New York, NY, USA, 2016. [Google Scholar]
  46. Kondoz, A.M. Digital Speech; John Wiley & Sons Ltd.: West Sussex, UK, 2004. [Google Scholar]
  47. Sahidullah, M.; Saha, G.K. Design analysis and experimental evaluation of block based transformation in MFCC computation for speaker recognition. Speech Commun. 2012, 54, 543–565. [Google Scholar] [CrossRef]
  48. Hall, M.; Oppenheim, A.; Willsky, A. Time-varying autoregressive modeling of speech. Signal Process. 1984, 5, 267–285. [Google Scholar] [CrossRef]
  49. Oliver, K. K-nearest neighbors. In Dimensionality Reduction with Unsupervised Nearest Neighbors; Springer: Berlin/Heidelberg, Germany, 2013; pp. 13–23. [Google Scholar]
  50. Ham, F.M.; Kostanic, I. Principles of Neurocomputing for Science and Engineering; McGraw-Hill: New York, NY, USA, 2001. [Google Scholar]
Figure 1. Normal breath sound analysis. (upper) Time-domain waveform. (middle) Frequency spectrum. (lower) Spectrogram.
Applsci 15 07145 g001
Figure 2. Pneumonia breath sound analysis. (upper) Time-domain waveform. (middle) Frequency spectrum. (lower) Spectrogram.
Applsci 15 07145 g002
Figure 3. Asthma breath sound analysis. (upper) Time-domain waveform. (middle) Frequency spectrum. (lower) Spectrogram.
Applsci 15 07145 g003
Figure 4. Croup breath sound analysis. (upper) Time-domain waveform. (middle) Frequency spectrum. (lower) Spectrogram.
Applsci 15 07145 g004
Figure 5. Short-time energy for breath sound classification.
Applsci 15 07145 g005
Figure 6. Mel–Frequency Cepstral Coefficients (MFCCs) extracted from breath sound recordings of three children diagnosed with asthma. Each surface plot visualizes the MFCCs with frame index values on the x-axis, coefficient numbers (1–10) on the y-axis, and coefficient values on the z-axis. Notable similarity is observed both within and across subjects, reflecting consistent spectral patterns under similar physical conditions.
Applsci 15 07145 g006
Figure 7. Mel–Frequency Cepstral Coefficients (MFCCs) for children breath sounds across four conditions: asthma (upper left), croup (upper right), pneumonia (lower left), and normal (lower right). Each panel shows MFCCs extracted from three children. Asthma and croup display similar MFCC surface patterns within the same physical condition. Pneumonia features exhibit more variability but still maintain internal consistency. Normal breath sounds show smooth and uniform surfaces across subjects.
Applsci 15 07145 g007
Figure 8. Dynamic Linear Predictive Coding (DLPC) features for four different respiratory conditions in children (overlap 50%; window length = 128). Each chart box represents DLPC features extracted from three different children under the same condition: asthma (upper left), croup (upper right), pneumonia (lower left), and normal (lower right). Asthma and croup display highly similar temporal feature patterns across subjects. Pneumonia also shows intra-group consistency. Normal breath sounds exhibit stable and coherent temporal trends, further validating DLPC’s robustness in capturing condition-specific temporal dynamics of respiratory sounds.
Applsci 15 07145 g008
Figure 9. Accuracy of HMM classifier vs. training loops for different training data portions.
Applsci 15 07145 g009
Figure 10. Accuracy of ANN classifier vs. training loops for different training data portions.
Applsci 15 07145 g010
Table 1. Breath sound data by physical condition, child ID, age, gender, and segment count.
Physical ConditionChild IDAgeGenderBreath Segments
Pneumonia12 yM18
28 mM24
36 mF19
Croup418 mM30
54 mF12
64 yF19
Asthma75 yM16
82 mM16
93 mM12
Normal105 yM29
116 yF15
126 yM26
Table 2. Confusion matrix for breath sound classification.
Predicted ↓/Actual →AsthmaCroupPneumoniaNormal
Asthma T P 1 F N 12 F N 13 F N 14
Croup F P 21 T P 2 F N 23 F N 24
Pneumonia F P 31 F P 32 T P 3 F N 34
Normal F N 41 F N 42 F N 43 T P 4
Table 3. LPC: precision, recall, and F1 score values; accuracy = 0.73.
ClassPrecisionRecallF1 Score
Asthma0.8670.7650.812
Croup0.4671.0000.636
Pneumonia0.7000.8080.751
Normal0.9000.5870.710
Table 4. LPCC: precision, recall, and F1 score values; accuracy = 0.65.
ClassPrecisionRecallF1 Score
Asthma0.6330.6130.623
Croup0.5670.5860.576
Pneumonia0.6000.9000.720
Normal0.8000.6000.686
Table 5. MFCC: precision, recall, and F1 score values; accuracy = 0.80.
ClassPrecisionRecallF1 Score
Asthma0.7330.9570.830
Croup0.9090.6670.769
Pneumonia0.8670.6500.743
Normal0.9330.8000.862
Table 6. DLPC: precision, recall, and F1 score values; accuracy = 0.717.
ClassPrecisionRecallF1 Score
Asthma0.7330.7330.733
Croup0.6670.6670.667
Pneumonia0.6670.6670.667
Normal0.8000.8000.800
Table 7. KNN classifier performance with spectral entropy (accuracy: 97%).
ClassPrecisionRecallF1 Score
Asthma0.911.000.95
Croup1.000.900.95
Normal1.001.001.00
Pneumonia1.001.001.00
Table 8. Random forest classifier performance with spectral entropy (accuracy: 97%).
ClassPrecisionRecallF1 Score
Asthma0.911.000.95
Croup1.000.900.95
Normal1.001.001.00
Pneumonia1.000.880.93
Table 9. Logistic regression classifier performance with spectral entropy (accuracy: 63%).
ClassPrecisionRecallF1 Score
Asthma0.580.700.64
Croup0.600.600.60
Normal1.001.001.00
Pneumonia0.330.250.29
Table 10. Wilson 95% confidence intervals for various feature–classifier combinations.
FeatureClassifier95% Confidence Interval
LPCKNN[0.644, 0.805]
LPCCKNN[0.560, 0.732]
MFCCKNN[0.717, 0.866]
DLPCKNN[0.631, 0.793]
Spectral EntropyKNN[0.925, 0.990]
Spectral EntropyRandom Forest[0.925, 0.990]
Spectral EntropyLogistic Regression[0.540, 0.712]
Disclaimer/Publisher’s Note: The statements, opinions and data contained in all publications are solely those of the individual author(s) and contributor(s) and not of MDPI and/or the editor(s). MDPI and/or the editor(s) disclaim responsibility for any injury to people or property resulting from any ideas, methods, instructions or products referred to in the content.