Article

Analysis of Hydrological and Meteorological Conditions in the Southern Baltic Sea for the Purpose of Using LNG as Bunkering Fuel

Faculty of Navigation, Maritime University of Szczecin, 1/2 Wały Chrobrego Street, 70-500 Szczecin, Poland
*
Author to whom correspondence should be addressed.
Appl. Sci. 2025, 15(13), 7118; https://doi.org/10.3390/app15137118
Submission received: 17 May 2025 / Revised: 20 June 2025 / Accepted: 21 June 2025 / Published: 24 June 2025

Abstract

The southern Baltic Sea is characterized by highly variable weather conditions, particularly in autumn and winter, when storms, strong westerly winds, and temporary sea ice formation disrupt maritime operations. This study presents a climatographic overview and evaluates key hydrometeorological factors that influence the safe and efficient use of liquefied natural gas (LNG) as bunkering fuel in the region. The analysis draws on long-term meteorological and hydrological datasets (1971–2020), including satellite observations and in situ measurements. It identifies operational constraints, such as wind speed, wave height, visibility, and ice cover, and assesses their impact on LNG logistics and terminal functionality. Thresholds for safe operations are evaluated in accordance with IMO and ISO safety standards. An ice severity forecast for 2011–2030 was developed using the ECHAM5 global climate model under the A1B emission scenario, indicating potential seasonal risks to LNG operations. While baseline safety criteria are generally met, environmental variability in the region may still cause temporary disruptions. Findings underscore the need for resilient port infrastructure, including anti-icing systems, heated transfer equipment, and real-time environmental monitoring, to ensure operational continuity. Integrating weather forecasting into LNG logistics supports uninterrupted deliveries and contributes to EU goals for energy diversification and emissions reduction. The study concludes that strategic investments in LNG infrastructure—tailored to regional climatic conditions—can enhance energy security in the southern Baltic, provided environmental risks are systematically accounted for in operational planning.

1. Introduction

Although previous scientific studies have addressed both the use of LNG in the Baltic Sea region and the variability of local hydrological and meteorological conditions, there is a noticeable lack of research that integrates these two areas in a comprehensive and practical way. The existing literature tends to treat LNG-related issues and environmental factors separately without clearly linking them to the operational requirements of LNG bunkering. This study adopts an integrated approach by combining long-term environmental data with operational thresholds and safety standards set by organizations like the IMO and ISO. This framework enables a practical environmental risk assessment and supports decision making processes related to the planning and operation of LNG infrastructure in the region.

1.1. The Context of Maritime Safety

Located in northeastern Europe, the Baltic Sea is one of the largest inland seas in the world, with a surface area of ca. 415,266 sq km. Longitudinal in shape, its length and width can be contained in a rectangle of 1100 km by 1400 km. Its central part, the Proper Baltic, bifurcates in the north into the Gulf of Finland and the Bothnian Sea. In the west, it connects to the North Sea through the Danish Straits—the Sound, the Great Belt, and the Little Belt. The Baltic Sea is relatively shallow, with the average depth of 52 m. The small depth restricts the interchange of water between the Baltic and the North Sea and affects the hydrodynamic conditions and salinity [1,2,3].
Maritime safety in the Baltic region is of utmost geopolitical [4,5] and economic [6] importance. Busy merchant shipping, including the transportation of energy resources, requires reliable navigational systems, harbor infrastructure, and operational procedures. The hydrological and meteorological conditions strongly affect the safety of navigation, even more so in the transportation and handling of liquefied natural gas (LNG) [7,8,9,10]. The reliability of the maritime infrastructure and the predictability of weather conditions are of key importance to the effective and safe operation of LNG terminals and LNG carriers in the Baltic Sea.
The southern Baltic, encompassing the territorial waters of Poland and the adjacent water areas of Germany and Russia (the exclave of Królewiec), has been an important object of analysis for its potential in the transportation and storage of LNG. The ongoing development of the LNG infrastructure in the region, including import terminals in the port of Świnoujście and the planned investment projects in Gdańsk, require a detailed analysis of the hydrological and meteorological conditions, which may affect the shipping, safety, and operation of regasification vessels and LNG carriers [11,12,13].

1.2. The Importance of Analysis of Hydrological and Meteorological Conditions

Familiarity with the geological history of the Baltic Sea is essential for proper understanding of the present hydrological and meteorological conditions of the area. The sea was formed in a succession of multiple glacial and interglacial periods, which determined its topography and depth and the composition of the waters. The modern stage of the Baltic Sea’s development, referred to as the Mya Sea, is characterized by variable salinity, which is lower than that of other seas. This fact has a significant impact on the operational conditions of LNG vessels [14].
The hydrological and meteorological conditions in the southern Baltic include a number of key aspects, including the following:
  • The hydrodynamics and structure of waters—flows of sea currents, variability of the temperature, and the salinity profile, affected by, inter alia, the inflow of fresh water from large rivers, such as the Vistula and the Odra;
  • The atmospheric conditions—mean and extreme wind speeds, precipitation, and variability of the barometric pressure, which affect waves and water level [15];
  • Ice—although the Baltic Sea does not freeze entirely, ice may form locally in winter, especially in the Gdańsk Bay, which may restrict the availability of ports and navigational routes [16];
  • The impact of hydrological and meteorological conditions on the LNG infrastructure—an analysis of how vessels, quays, and cargo handling systems withstand variable and/or severe weather, such as storms or surges and falls in water level [17].

1.3. Prospective Use of LNG in the Baltic Sea

In view of the above, a comprehensive analysis of the hydrological and meteorological conditions in the southern Baltic is required for optimal planning and implementation of LNG investment projects. With these factors taken into consideration, the safety of navigation can be enhanced, the operational effectiveness of LNG terminals improved, and possible hazards to the operation of the LNG infrastructure mitigated.
Considering the increasing demand for low-emission energy sources, the development of LNG infrastructure in the southern Baltic Sea is regarded as a key component of the region’s energy and maritime strategy [18]. In the context of global efforts to decarbonize transport and reduce greenhouse gas emissions, LNG is widely presented as an alternative to conventional marine fuels, such as heavy fuel oil and coal. Its technical advantages—including high energy density, reduced emissions of sulfur oxides, nitrogen oxides, and particulates, as well as relative transport safety—position LNG as an important transitional fuel in maritime decarbonization [19,20,21,22,23,24,25,26,27,28].
This perception is reinforced by current European Union policy frameworks. The Fit for 55 package aims to reduce net GHG emissions by at least 55% by 2030 and includes regulatory instruments like the Alternative Fuels Infrastructure Regulation, which mandates the provision of LNG bunkering facilities at core TEN-T ports by 2025. IMO itroduces carbon intensity limits for marine fuels used in European waters, further incentivizing the shift toward cleaner fuels. On the international level, IMO sets a target of reducing GHG emissions from international shipping by 50% by 2050, encouraging the adoption of low-carbon and transitional fuels, including LNG.
In addition, MARPOL Annex VI imposes a global sulfur cap of 0.5% in marine fuels, with stricter limits of 0.1% in Emission Control Areas, such as the Baltic and North Seas. LNG complies with these standards without requiring additional exhaust gas cleaning systems. The Baltic Sea, classified as both a Sulfur Emission Control Area and a Nitrogen Emission Control Area, offers a particularly favorable regulatory environment for LNG deployment.
However, the assumption that LNG represents an inevitable or permanent solution is not sufficiently substantiated. LNG is best viewed as a transitional fuel that enables partial emission reductions while longer-term zero-emission technologies continue to mature. Alternative marine fuels, such as green ammonia, hydrogen, and methanol, are under active development and may offer greater long-term climate benefits. Moreover, concerns about unburned methane emissions (“methane slip”) from LNG-powered engines call into question the net climate advantage of LNG over its full lifecycle. Therefore, while LNG can facilitate near-term compliance with environmental regulations, its long-term role remains uncertain and should not be overstated in strategic investment decisions.
From an operational perspective, the southern Baltic presents a range of meteorological and hydrological challenges for LNG infrastructure and vessel traffic. As a semi-enclosed basin with limited tidal exchange, the region is subject to rapidly changing weather patterns, strong seasonal winds, icing conditions, and frequent storms. These factors may temporarily disrupt bunkering operations or compromise navigational safety. Climate change is expected to intensify such phenomena, increasing the need for resilient infrastructure and adaptive risk management [29].
In this context, investment in LNG must be accompanied by enhancements in port infrastructure, such as reinforced mooring facilities, heated bunkering systems, and anti-icing technologies, as well as the implementation of real-time environmental monitoring, weather forecasting, and flexible operational protocols. Some Baltic ports (e.g., Klaipėda, Helsinki) already suspend LNG operations during low-visibility or high-sea-state events, illustrating the direct impact of environmental variability on LNG logistics.
Consequently, a comprehensive assessment of hydrometeorological conditions is essential to inform planning decisions and ensure the technical and economic viability of LNG-related infrastructure in the region. When properly accounted for, these factors can help optimize port resilience, ensure continuity of supply, and reduce operational risks associated with LNG deployment in the southern Baltic.

1.4. Purpose and Scope of the Review

This review aimed to analyze the hydrological and meteorological conditions in the southern part of the Baltic Sea with respect to LNG handling. The authors have examined the hydrodynamic and meteorological characteristics of the region, their impact on the safety and logistics of LNG transportation, and possible hazards posed by the specific characteristics of the area. Special focus has been placed on aspects that may affect the development and operation of the LNG infrastructure in the region, such as temperature, sea currents, waves, salinity, ice, barometric pressure, precipitation, sunshine duration, fogginess, humidity, water level, tides, and extreme weather conditions. The study has been restricted to an analysis of a Baltic Sea area marked on the map (Figure 1). The analysis covers the southern part of the Baltic Sea based on the data available on sea-going vessels and the hydrological and meteorological conditions. Sections of traffic streams in the main shipping routes in the southern part of the Baltic Sea have been examined. Based on the analysis of shipping traffic streams, eleven research sections were identified along the main maritime routes. These sections can be analyzed in terms of vessel traffic intensity and technical parameters, which makes it possible to determine both the movement trends of different types of ships during the analyzed period and the length and width of the studied shipping lanes.
A detailed analysis covers the port areas of Łeba, Ustka, Hel, Świnoujście, Szczecin, Kołobrzeg, and Gdynia based on data and information on the main shipping routes in the Baltic Sea obtained using the IWRAP system.
The primary objective of this study is to evaluate the impact of meteorological and hydrological conditions on the feasibility and safety of LNG bunkering operations at key ports in the southern Baltic Sea. While LNG infrastructure, maritime transport, and fuel bunkering are interconnected elements of the LNG supply chain, this research focuses specifically on the operational constraints imposed by environmental factors during the bunkering phase. By combining long-term observational data, regulatory thresholds, and climate projections, the study identifies risk conditions that may disrupt the continuity of LNG supply. The results are intended to inform planning decisions related to port adaptation, risk mitigation, and investment prioritization in the context of increasing reliance on LNG as a transitional marine fuel.

2. Materials and Methods

Nevertheless, the hydrological and meteorological conditions in the region pose a number of operational and logistic challenges for the LNG sector. As a semi-closed sea basin with limited interchange of waters, the Baltic is characterized by considerable variability of atmospheric and hydrodynamic conditions, which may adversely affect the safety and efficiency of LNG shipping. Additionally, climate change takes its toll on the Baltic, causing extreme weather conditions, such as severe storms, sudden surges and falls in water levels, icing of vessels, and variability of wave patterns. They all may adversely affect the operation of LNG terminals, LNG handling processes, and the operation of LNG carriers.
Moreover, the development of the LNG infrastructure in the southern Baltic requires adjustment of harbors and shipping routes [30].
State-of-the-art LNG terminals must feature, inter alia, systems for the mooring of large vessels and LNG storage facilities and technologies ensuring reliable and safe cargo handling even in adverse weather. Integration of systems monitoring and forecasting hydrological and meteorological conditions are of key importance to minimize risk and ensure operational continuity.
In view of the above, a comprehensive analysis of the hydrological and meteorological conditions in the southern Baltic is required for optimal planning and implementation of LNG investment projects. With these factors taken into consideration, the safety of navigation can be enhanced, operational effectiveness of LNG terminals improved, and possible hazards to operation of the LNG infrastructure in the region mitigated.

2.1. Meteorological Factors

Meteorological factors are defined as phenomena occurring in the Earth’s atmosphere, which have a direct influence on the conditions prevailing in the southern part of the Baltic Sea [31,32]. Their strong effect determines both short- and long-term hydrological, biological, and chemical conditions in the area [33].
The key factor that determines conditions prevailing in the southern Baltic Sea is air temperature, measured as the mean kinetic energy of air particles (Figure 2). Air temperature is one of the basic meteorological parameters that influence the occurrence and nature of atmospheric phenomena and physical processes in the atmosphere. Mean air temperature briefly describes thermal conditions in an area and can be used to compare these the conditions across areas and relate them to regional and global air temperatures [34].
Air temperature fluctuations strongly affect heat and humidity transportation, which determine the formation of air pressure systems and the atmospheric circulation in the Baltic Sea [37]. Changes in air temperature may cause thunderstorms and sea storms, affecting the safety of navigation and the reliability of LNG operations. Moreover, air temperature has an impact on the intensity of icing, which is especially hazardous in the winter season. Sudden temperature falls may cause freezing of the water surface and icing on ships’ hulls, which considerably reduces maneuverability and increases the risk of technical failures.
Another important meteorological factor is barometric pressure, which determines air circulation and the development of weather systems [38]. Low barometric pressure is conducive to the formation of cyclones, often coinciding with strong winds and heavy rain, impeding navigation and harbor operations. High barometric pressure, on the other hand, leads to periods of stable weather but may bring fog and/or mist, which restrict visibility and affect the safety of navigation [39]. Barometric pressure plays an important role in the formation of hydrological and meteorological conditions. It is defined as the force of air acting on a measurement unit of the Earth’s surface resulting from the mass of an air column situated above a certain point [40]. Fluctuations of the barometric pressure have a major impact on air circulation, the formation of weather systems, and sea state—factors that may affect the safety and efficiency of LNG operations in the southern Baltic.
The movement of air masses in the Baltic Sea is characterized by the so-called atmospheric wave [41]. A swell, referred to as the atmospheric wave, forms beyond a concentric cyclone, its height depending on the magnitude of the drop in pressure in the center of the cyclone. This phenomenon strongly affects changes in water levels in the Baltic Sea. The formation of atmospheric waves is related to dynamic changes in the barometric pressure (Table 1) and differences in temperature across atmospheric layers and may lead to sudden changes in water levels, affecting the safety of navigation and harbor operations, including the handling of LNG [42].
Another phenomenon of key importance is the formation of anti-cyclones. An anti-cyclone, or a weather system with high barometric pressure that rises towards its center, has a significant impact on weather conditions in the region. In higher atmospheric layers, an anti-cyclone is a convergence zone, i.e., winds converge towards its center. In lower atmospheric layers, an anti-cyclone is a divergence zone, with winds diverging away from the center and moving towards areas of lower barometric pressure. Anti-cyclones bring periods of stable weather with no rain and slight wind; however, they may also lead to the formation of fog and mist, which restrict visibility [44].
Cyclones, or low-pressure systems, on the other hand, are characterized by strong winds, rapid weather changes, and frequent rains [45]. Moving cyclones have an impact on the variability of hydrological and meteorological conditions, causing sudden changes in sea levels and severe storms. Therefore, they may have a direct impact on the operation of the LNG infrastructure in the southern Baltic. Low-pressure systems are especially dangerous in autumn and winter seasons, when intensified convection processes lead to heavy storms and increased risk of icing of vessels’ hulls [46].
A factor of great importance in an analysis of hydrological and meteorological conditions is precipitation, i.e., all and any solid and/or liquid products of water vapor condensation in the atmosphere [47,48]. Precipitation has a direct impact on the salinity and temperature of surface waters and thus on the operational conditions of LNG terminals and shipping routes. Heavy rains may cause increased inflow of river water into the Baltic Sea and thus change the hydrological balance in the area, whereas heavy snow or freezing rain may impede LNG handling operations and call for adjustment of LNG storage and transport technologies to extreme weather conditions. Maximum daily precipitation occurring in Poland may be significantly higher (mostly three or four time higher) than the mean daily amount of water in the atmosphere (Table 2) [49].
Sunshine duration is defined as the number of hours in which sunshine directly reaches the Earth’s surface in a certain area. Measured as a daily, monthly, or annual total, sunshine duration is an important indicator in meteorological and climatic analyses [50].
Sunshine duration depends on a number of astronomical, meteorological, and topographical factors [51,52]. The most important of them are as follows:
  • Length of day—in the southern Baltic, the length of day varies between several hours in winter and a dozen or so hours in summer [53,54];
  • Cloudiness—the Baltic Sea is characterized by variable cloudiness, with mainly stratus and nimbostratus clouds in winter, which are conducive to rain and fog; summer periods also see cumulus clouds, which may bring thunderstorms [55];
  • Terrain—diverse in the Baltic Sea and characterized by various geo-morphological features, such as beaches, spits, dunes, cliffs, bays, coves, and estuaries [56].
Sunshine duration is an important factor in the energy balance of the region under analysis (Table 3). It affects the temperature of the sea’s surface, which in turn has an impact on evaporation, the formation of clouds, and atmospheric circulation. Understanding the sunshine distribution in the region is fundamental for an analysis of climate trends and the optimization of maritime operations and the LNG infrastructure, which require adjustment to variable weather conditions.
Fog is another atmospheric phenomenon that requires detailed examination in an analysis of the hydrological and meteorological conditions in the southern Baltic Sea (Table 4). Caused by condensation of water vapor in the atmospheric boundary layer, it reduces visibility to less than 1 km. The formation of fog is directly related to local meteorological conditions, such as air temperature, humidity, and the speed and direction of wind [57,58].
There are several types of fog in the Baltic Sea, especially in the southern part of the region, caused by various atmospheric phenomena [59,60,61,62]:
  • Advection fog—caused by the movement of warm air over a cooler water surface, leading to vapor condensation; the most common type of fog in sea areas, especially in spring and autumn;
  • Radiation fog—forms mainly at night and in the early morning when, as a result of the radiation of warmth from the surface of the sea, the atmospheric boundary layer gets cooler;
  • Frontal fog—forms with the passing of warm, atmospheric fronts, which lead to strong humidity condensation.
Fog considerably affects the safety of maritime transport and operation of the LNG infrastructure. Restricted visibility impedes navigation, increases the risk of collision, and may lead to delays in harbor operations. Therefore, close monitoring of meteorological conditions and implementation of appropriate warning systems is of utmost importance for safe navigation and effective shipping operations in the region under analysis [63].
Another phenomenon that strongly determines weather conditions is wind, defined in climatology as the horizontal movement of air masses relative to the Earth’s surface.
The occurrence of wind is closely related to the distribution of barometric pressure, and, more precisely, the horizontal and vertical gradients of barometric pressure. The greater the differences in barometric pressure in a certain area and the smaller the distance between isobars, the stronger and faster the flow of air. Speed and direction of wind are also affected by the Coriolis force, friction against the Earth’s surface, and local topographic conditions [63,64,65].
Based on the available data, the highest wind speeds on the Polish coast occur in winter and are related to the presence of deep low-pressure systems and strong frontal systems (Figure 3). The lowest wind speeds are observed in late spring and summer, when the air pressure gradient is lower and the weather is less variable.
Air humidity has a major impact on weather conditions and the climate. It affects the perceived temperature and the transportation of heat and humidity in the atmosphere. Air humidity is defined as the amount of water vapor in the atmosphere [68,69].
Air humidity strongly influences meteorological processes, such as condensation, vaporing, and formation of clouds and precipitation [70]. One of the basic parameters of air humidity is relative humidity, expressed as the percentage of water vapor in the air relative to the maximum amount of water vapor air may contain at a certain temperature. An increase in temperature amplifies the capability of air to hold moisture, whereas a decrease in temperature is conducive to condensation [71,72,73,74,75,76].
Relative humidity is an important factor in the analysis of hydrological and meteorological conditions in the southern part of the Baltic Sea, as it affects the rate of change in atmospheric conditions, which has an impact on the safety of navigation and the operation of the LNG infrastructure (Table 5) [77].
All of the meteorological factors mentioned above play a crucial role in shaping the hydrological and meteorological conditions in the southern part of the Baltic Sea. Analyzing and forecasting them are of utmost importance for the safety of LNG handling and efficient management of the LNG transportation and storage infrastructure. Meteorological conditions in the southern Baltic Sea significantly constrain the operational feasibility of LNG bunkering by imposing both technical and logistical limitations. Wind speeds exceeding 15–20 m/s represent a critical safety threshold established by international standards beyond which bunkering operations must be suspended due to the risk of hose failure and vessel instability. Analysis of long-term meteorological data indicates that such wind speeds occur, on average, during 15–25% of days per month in the winter season (November–March), particularly in exposed areas, such as the Gulf of Gdańsk and off of the coast near Ustka.
Sea state presents an additional challenge; wave heights exceeding 2.5 m interfere with safe mooring and the stability of connections between bunkering vessels and terminal infrastructure. These conditions are typically observed during 10–15 days per month in storm-prone periods. Similarly, reduced visibility below 500 m—most frequently caused by fog or heavy precipitation in autumn and winter—necessitates the suspension of operations in accordance with IMO regulations and Baltic port safety protocols.
Icing is another critical constraint. When air temperatures drop below −5 °C and relative humidity exceeds 90%, the risk of ice formation on cryogenic systems increases substantially. These conditions are commonly recorded in January and February in ports like Gdańsk, Gdynia, and Klaipėda. In the absence of specialized deicing systems, LNG bunkering may be rendered temporarily unfeasible.
Collectively, these meteorological constraints not only increase operational risk but also directly affect the economic viability of LNG logistics by causing service interruptions, narrowing safe weather windows, and requiring contingency planning. As such, atmospheric conditions must be treated as an integral component of LNG infrastructure planning and risk management strategies.

2.2. Oceanographic Factors

The characteristics of seawater in the Baltic Sea comprise properties that are not subject to significant change in a daily cycle but are rather shaped over longer time periods, such as seasons or decades. The Baltic Sea, enclosed by land and connected to the North Sea by several relatively shallow Danish Straits, has little interchange of waters with the Atlantic Ocean. This geographical location creates relatively isolated hydrological conditions affecting the physical and chemical properties of Baltic Sea waters [78,79].
The basic property of the Baltic Sea is salinity. Seawater contains more than 30 different chemical compounds, mainly salts, as well as microelements, such as iodine, copper, phosphorus, gold, and silver. Moreover, it contains diluted gases, mainly nitrogen, oxygen, and carbon dioxide, with traces of hydrogen sulfide and organic compounds, which may be present in the benthic zone [80,81]. Compared to oceans, the Baltic Sea is characterized by low salinity due to restricted interchange of waters with the North Sea and a considerable inflow of water from rivers. The average salinity of surface waters amounts to ca. 7‰ and increases towards the Danish Straits, where it reaches a level of ca. 12‰ [82,83]. The greatest differences in salinity are observed in the vertical direction. Salt water, which is heavier, sinks; thus, at a depth of ca. 100 m, salinity may reach ca. 19‰ [14].
Variable salinity levels strongly affect the density of water and, consequently, the circulation and layering of the Baltic’s waters. The latter have an impact on both the Baltic’s ecosystem and its hydrological and meteorological conditions, which in turn are of key importance to safe navigation and effective operation of the LNG infrastructure [84]. Mean salinity values in the Gdańsk Deep are lower. In 2022, the difference between the maximum (7.54, January) and minimum (7.21, February) mean salinity value was 0.33. Salinity in the Vistula Lagoon stands at a mere 1–3‰ [85]. A relatively stable salinity of ca. 6‰ of the Bay of Pomerania has an impact on the salinity of the Szczecin Lagoon. In winter, strong winds and increased water levels cause a backwater current effect from the Baltic Sea to the Szczecin Lagoon through the River Świna, which temporarily increases salinity in the northern part of the Szczecin Lagoon to 6‰, where mean salinity in the area is ca. 2‰ [86].
Thermal conditions, i.e., temperature distribution across water layers, is one of the crucial factors affecting changes in the Baltic’s ecosystem. The Baltic is characterized by large seasonal temperature fluctuations, which depend on the amount of sunshine, heat exchange with the atmosphere, and the surface structure of the water [87,88,89].
In summer, the temperature of surface water may reach 20–25 °C, especially in shallow areas, such as the Gdańsk Deep or the Vistula Lagoon. As a result of the heating up of waters, distinct thermal layers are formed, where warmer surface water is separated from cooler deep-sea water with the thermocline—a transitional layer in which the temperature drops rapidly as the depth increases [90,91,92,93].
In winter, the situation reverses. The temperature of surface water drops to 0–2 °C, and, in the northern and eastern parts of the Baltic, the surface of the sea freezes. The thickness of the ice depends on the weather, including air temperature and wind force, which may cause crumbling and accumulation of ice [94,95].
Shallow areas, such as the Bay of Pomerania and the Vistula Lagoon, are characterized by the greatest variability of temperatures, as they are more prone to heating up and cooling down than deeper water areas. Thermal properties of waters determine circulation, layering, and hydrological and meteorological conditions, which in turn affect both the ecosystem and business activity, including the operation of the LNG infrastructure in the region [85].
Changes in water levels in the Baltic Sea on a scale of months to years are caused by, inter alia, the thermal expansion of water and the effects of atmospheric circulation, barometric pressure, and sea currents. Local changes in water levels may be human-made and result from, e.g., the training of rivers, hydraulic engineering work, or the exploitation of natural resources.
Nevertheless, on a scale of decades, water levels in the Baltic Sea have been continuously rising—a trend directly related to climate changes. Melting glaciers and continental ice sheets of Greenland and Antarctica feed huge masses of water to oceans, contributing to a global increase in sea levels. Isostatic changes, i.e., local rises or falls in land levels, are another factor affecting the sea levels. In the north of the Baltic Sea (e.g., in Sweden and Finland), the processes lead to a relative fall of the sea level, whereas on the southern coast of the Baltic (Poland), they result in its rise [96].
Ocean tides occur twice a day. In the Baltic Sea, their amplitudes are relatively small, and their maximum range is estimated at 24 cm (Figure 4). Daily tides have the greatest effect, especially in the eastern Baltic (the Gulf of Finland and the Bothnian Bay) [97]. Their total impact on the development of the LNG infrastructure is negligible [98].
The latest research emphasizes significant fluctuation of tidal patterns, especially in the Eastern Gotland Basin, where, previously, tidal currents had a steady drift and set towards the north and long-term cycles of 100–150 days [99]. An analysis of data from the last five decades shows new tidal patterns in the Baltic Sea. It has been found that drifts of surface and bottom currents are on the rise, presumably related to the positive phase of the North-Atlantic Oscillation (NAO). It has also been noted that sub-surface tidal currents (at a depth of 20, 40, and 60 m) are more stable (0.4–0.7 m/s) compared to surface currents (0.2–0.5 m/s). On average, the drift of sub-surface currents at a depth of 20 m is 0.1 m/s slower than that of surface currents. This shows that surface currents are more ephemeral and more dependent on the prevailing weather conditions, whereas sub-surface currents do not change considerably [100].
A factor characterized by considerable daily fluctuations that strongly affect the overall hydrological and meteorological conditions is wind waves. These are waves generated by wind acting on the water’s surface, where energy from movement in the atmosphere is transferred to the surface of the sea [101,102,103,104,105].
The process takes place in the function of time and space, and its intensity as well as the height of waves depend on a number of factors. Therefore, for each wind speed, there is a boundary wind duration and boundary run-up length, and, once they are reached, the height of waves has attained its maximum, and waves stop increasing in height [106,107].
The height of wave in oceanographic physics is defined as the mean height of 1/3 of the highest waves occurring in a group of waves in a certain location, observed in time [108,109]. Mean extreme heights of the significant wave in the southern part of the Baltic Sea do not exceed 5 m, whereas its maximum height observed in the period under analysis is 7.3 m (January 2015). The highest mean values of wave height are observed in winter and are correlated with higher wind speeds measured during the occurrence of a maximum wave (Table 6).
Wave size depends mainly on the wind speed that generates the waves—the stronger the wind, the higher the waves may become—as well as the duration of wind above water from a constant (±15°) direction—the longer the wind of a certain speed blows above water, the higher the waves generated (Table 7) [110].
The direction of wind-generated wave propagation is closely related to the wind’s direction, i.e., a wind-generated wave moves in the direction from which the wind blows. In the Baltic Sea, most of the maximum waves came from the western sector, suggesting that the strongest wind at that time blew from that direction (Table 8) [110].
Frequency and force of storms and squalls are useful indicators of prevailing weather conditions. Storm waves in the Baltic Sea are characterized by a short length and a steep profile. The highest waves reach a height of ca. 10 m, especially in late autumn and winter; however, their usual height does not reach even half of that value. Waves in the Baltic’s open waters are moderate and only occasionally reach a height of 8 m (Figure 5) [111,112,113].
The factors described above compose a clear image of the Baltic Sea as a sea area relatively friendly to maritime transport and with predictable hydrological and meteorological conditions. Absence of tides, infrequent storms, low yearly amplitudes, and relatively low wind speeds render the Baltic Sea conducive to the development of maritime shipping. The Baltic offers a reliable and safe maritime transport environment, which makes it an attractive shipping route.

3. Results

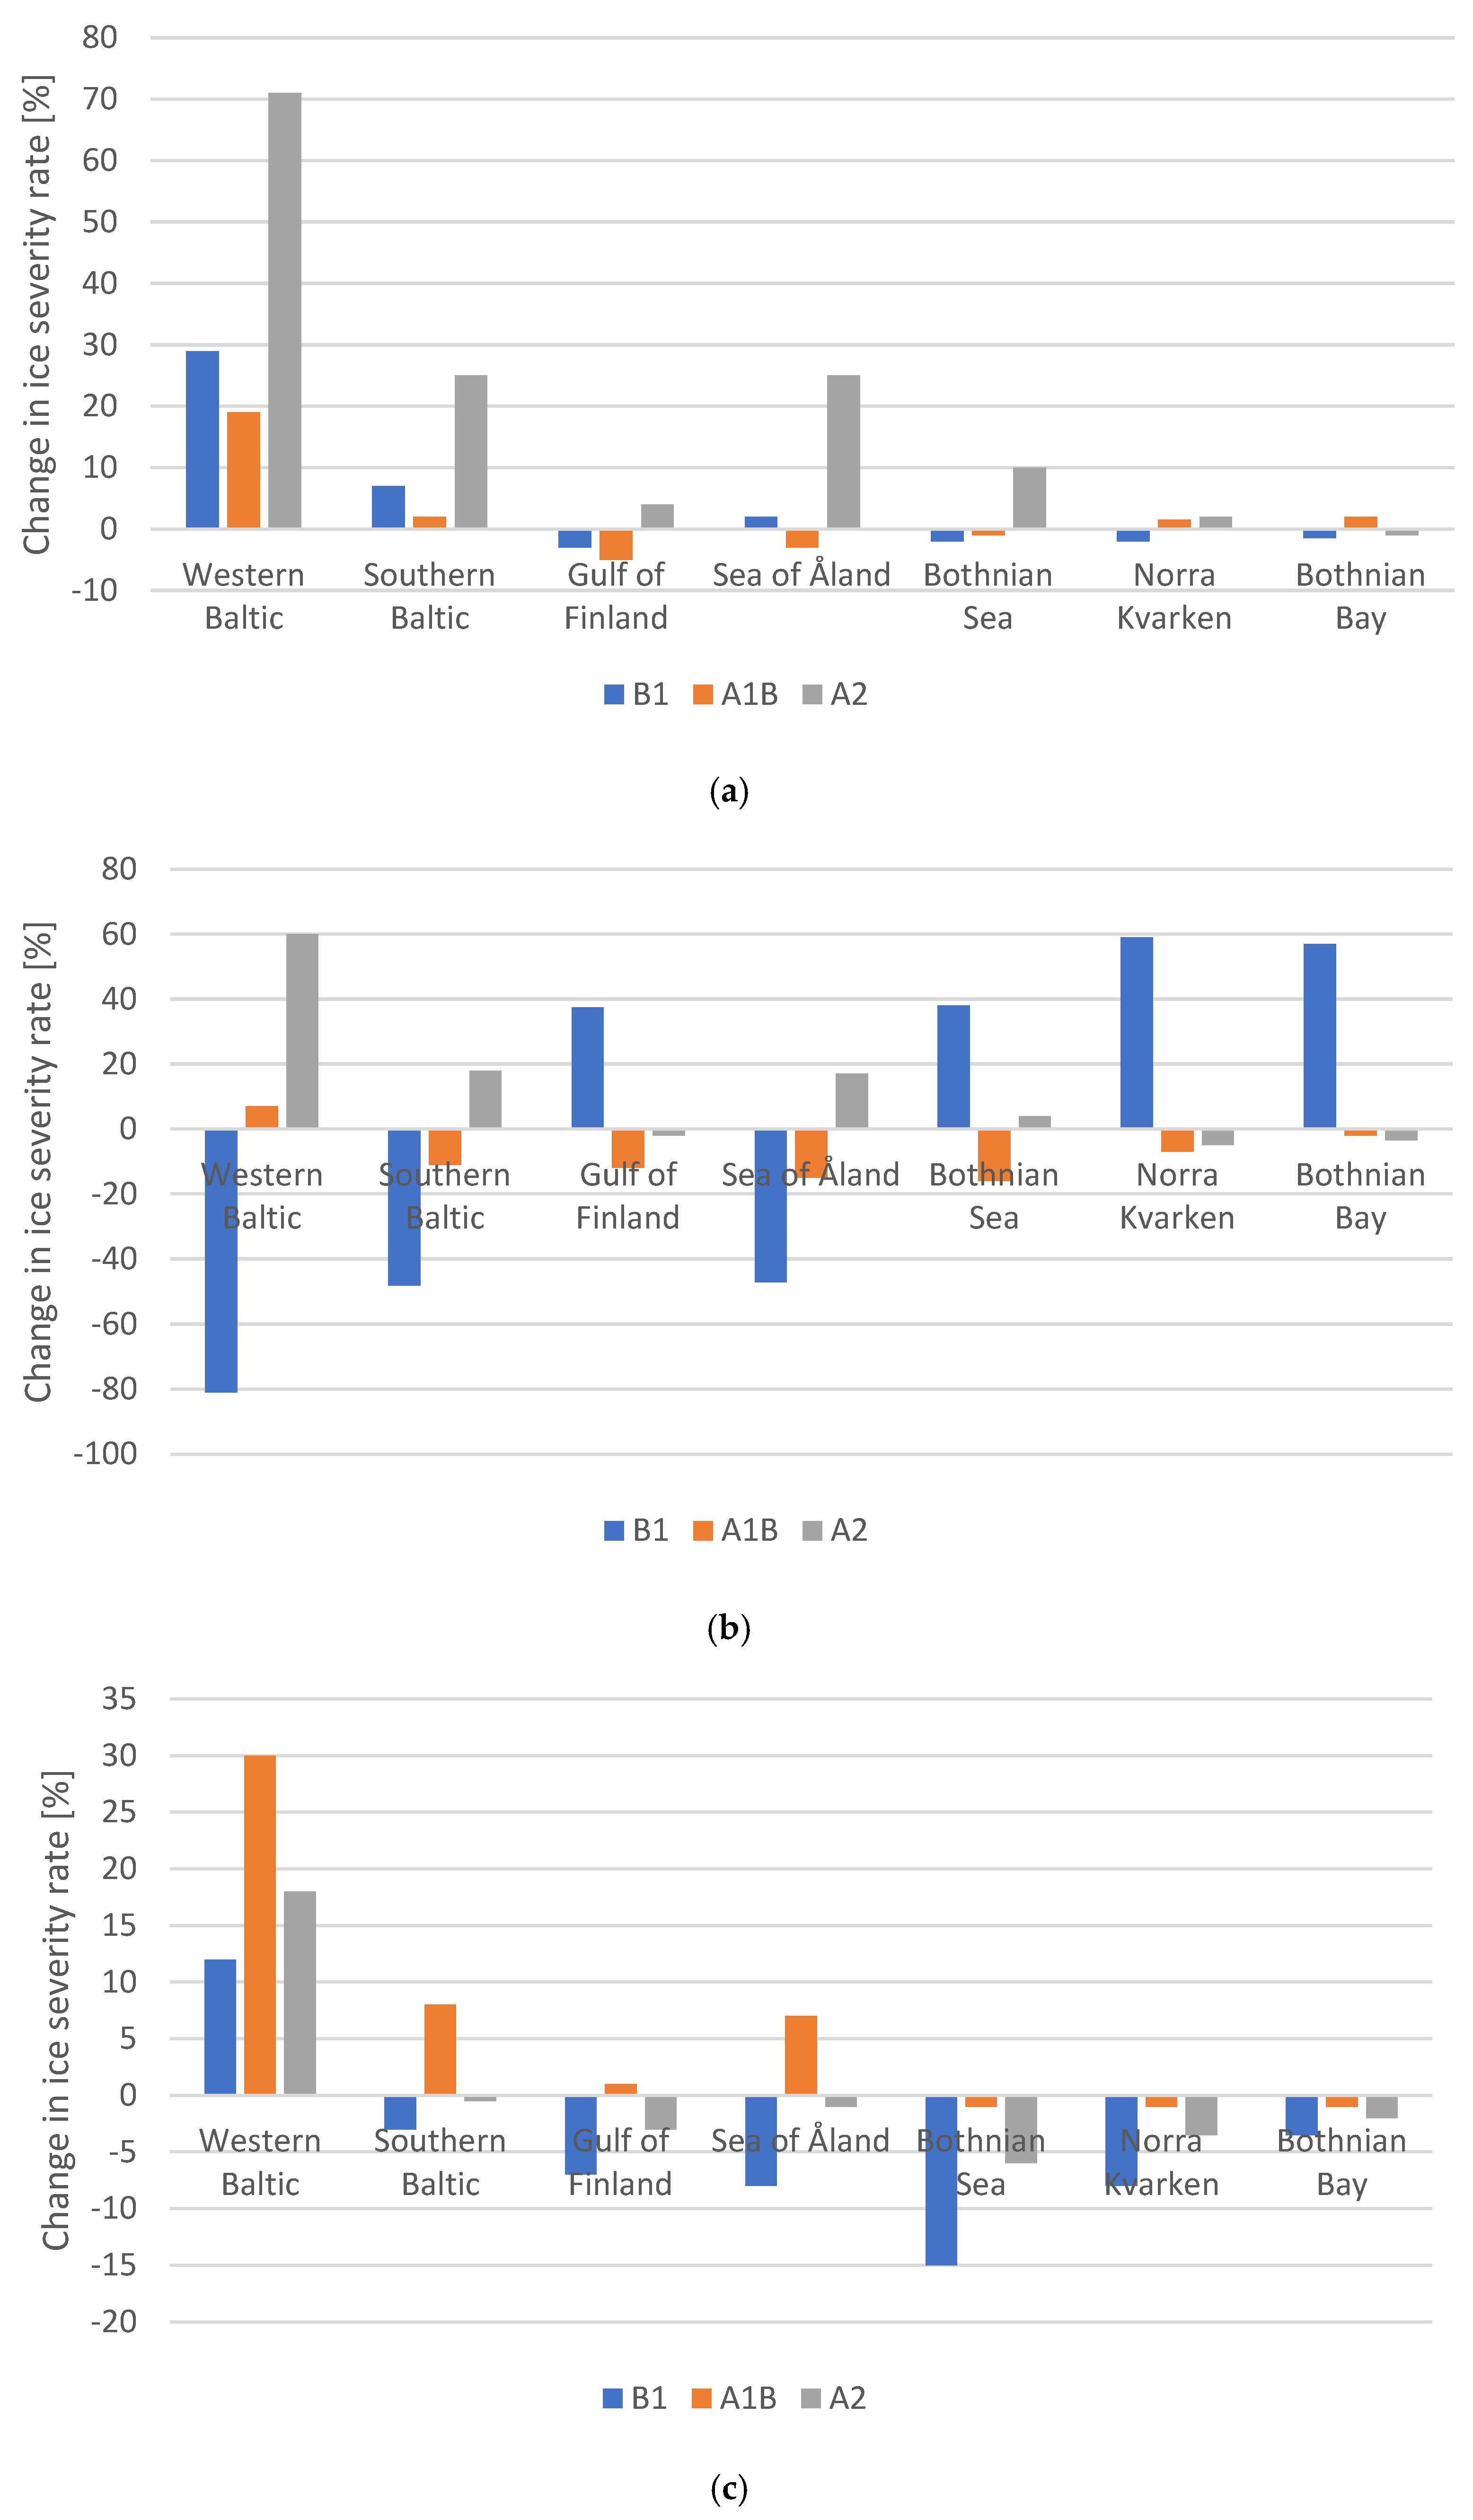
3.1. Weather Anomalies

Overall, global ecological changes have a direct impact on all meteorological conditions. The rate of change of the mean area temperature on the seacoast is 0.27 °C/10 years—the greatest change in the scale of the country (Figure 6) [115].
Water temperature has a similar trend. Every decade, the mean yearly temperature in the Gdańsk Deep goes up by ca. 0.64 °C, and in the Słupsk Basin it goes up by 0.84 °C [116].
Based on the total monthly precipitation for 1961–2023, the mean total yearly precipitation for the Polish Baltic coast has been determined at 643.7 mm. The value is considerably higher than that for other physical and geographical regions of Poland. No large changes have been observed in the total precipitation values, and only high volatility has been noted year by year.
Snow cover is strictly correlated with temperature and the amount of precipitation; therefore, it is a convenient indicator of changes in the meteorological conditions in Pomerania. With a high albedo, low thermal conductivity, and high emissivity, accumulated snow considerably affects thermal conditions and hydrological processes in progress in winter [117,118,119].
The second half of the 20th century saw a falling trend of the duration and thickness of snow cover in Pomerania. The maximum number of days with snow cover was 35 [115]. Anomalies related to snow cover have been observed in the area of the Baltic Sea, caused mainly by specific synoptic conditions, such as low-pressure systems, air flow patterns, and regional climate volatility. They lead to quick changes in the properties of snow cover and ice build-up [120].
There is a strong correlation between the amount of water in various forms in the atmosphere and other climate components. It is assumed that an increase in air temperature by 1 °C results in an up to 7% increase in the amount of water in the atmosphere [121]. This entails further changes in energy exchange between the ground and the atmosphere. Bearing in mind that the Baltic Sea region is characterized by the greatest increase in mean air temperature of all of the regions of Poland, it can be concluded that long-term changes in the process of energy exchange will occur in direct proportion to that increase [115].
Barometric pressure in the Baltic region rarely departs from the usual pattern. In 1986–2007, the difference between extreme daily values of barometric pressure on the Polish coast of the Baltic Sea stood at 83.3 hPa in winter and 40.8 hPa in summer [122].
The occurrence of low sea levels changes drastically decade by decade, and a sea level below the mean has a downward trend. Both in the western and eastern parts of the coast, the number of incidents when the sea level falls to low is significantly smaller, especially in the port of Świnoujście. At the same time, the number of incidents where the sea level goes above the mean and reaches alarm levels is growing. The sea level in the southern Baltic is constantly rising due to global warming and western zonal circulation prevailing in the region [123,124]. The rate of increase in sea level is varied across the coast, and a higher growth rate is observed in the eastern part of the coast. For example, in Świnoujście, the sea level increased by 14.1 cm within the past 73 years [125]. The usual daily sea levels varied between 511–520 cm (25.48% of the total variations) and 501–510 cm (22.47% of the total variations) [126].
The observable changes (increasing air temperature, diminishing snow cover of shorter duration) correspond to the climate changes reported in other European countries [126,127,128,129].
Scenarios developed by the Institute of Meteorology and Water Management (IMGW) show that in 2024–2030, Pomerania may see the greatest increase in mean air temperature by more than 0.4 °C in Świnoujście, Szczecin, and Słubice. The changes are likely to be observed especially in winter seasons, which are expected to be warmer, with less snow. Increased fluctuations are forecast for all meteorological parameters, with higher daily, seasonal, and annual amplitudes.
A phenomenon occurring in the Baltic Sea of great importance for the maritime economy is ice. Since the 1940s and 1960s, when ice on the Baltic Sea reached its record thickness and duration, the Polish coast has seen a constant decrease in the number of days with ice covering its waters [130,131].
In 1971–1990, the average number of days with ice was 16 in Świnoujście, where the longest ice sheet duration was observed. However, during extremely severe winters, this number would grow to even more than 60. It is worth mentioning here that in some years, the sea did not freeze at all [132,133].
The probability of ice formation in the early 2000s varied from 32% in the southern part of the Baltic Sea, along the Polish coast, to 100% in the north and along the Finnish and Russian coasts. Based on observations from the majority of stations, a trend towards shorter ice periods has been identified, with a maximum reduction of 44 days per century. The trend corresponds to the increasing winter temperatures throughout Europe and thus point to a relationship between climate changes and the ice situation on the Baltic Sea [134].
According to forecasts by IMGW, a significant increase in the number of days with ice sheet along the Polish coast can be expected in 2011–2030 compared to the reference period of 1971–1990 [132]. Longer ice duration is expected in each emission scenario under analysis. The scale of change is clearly varied geographically, with the smallest change in Świnoujście and the greatest in Ustka and Hel. Changes in Ustka and Gdańsk amount to 30%, and in Hel they are more than 45%. Only in Świnoujście can a slight decrease in ice sheet duration (by less than 2%) be expected compared to the reference period. The ice severity forecast for the period of 2011–2030 was carried out using the ECHAM5 global climate model, as applied in the projections developed by IMGW. This time frame corresponds to the validated simulation range provided by the model.
The expected changes in ice sheet duration (Figure 5) have been developed using the ECHAM5 global model, one of the more precise atmospheric circulation models developed by the Max-Planck Institute for Meteorology in Hamburg. The model is used for the forecasting of long-term global and regional climate changes. Data simulated by the model have been used in the analysis discussed below with reference to changes in the regional barometric pressure at sea level (SLP) and regional mean air temperature from a level of 2 m above ground level (T2) and from a level of 700 hPa (T700) [132].
The analysis of ice has been conducted based on three emission scenarios, B1, A1B, and A2, which represent various paths of social and economic development of the world and related greenhouse gas emissions (Figure 7) [135]:
  • Scenario B1 assumes moderate economic growth and simultaneous implementation of low-emission technologies;
  • Scenario A1B assumes fast economic growth and sustainable utilization of energy sources;
  • Scenario A2 assumes growth based on the dominance of regions, a low level of global cooperation, and high emissions.
The forecast increase in global temperatures at the end of the 21st century (compared to the base period of 1980–1990) is as follows:
  • For scenario B1—1.8 °C (within a range of 1.1–2.9 °C);
  • For scenario A1B—2.8 °C (within a range of 1.7–4.4 °C);
  • For scenario A2—3.4 °C (within a range of 2.0–5.4 °C) [132].
Based on the output data obtained from the ECHAM5 model adjusted to the conditions of the Baltic Sea, changes in ice range and intensity have been estimated on a timeline until the end of the 21st century. The analyses aim to identify areas extremely vulnerable to climate changes and assess possible consequences of these changes for navigational conditions, the functioning of marine ecosystems, and the operation of the coastal infrastructure.
The results of the forecast have been compared to the corresponding historical data (Table 9) for correct interpretation. The data unequivocally show strong spatial differentiation of ice intensity.
The simulation results show slight changes in the ice severity rate on a regional scale. Even though in the selected areas of the Baltic Sea (especially in the marginal regions, taking into consideration the present range of ice) the ice severity rate may show an 80% deviation in extreme emission scenarios, its impact on the actual range and intensity of ice is negligible. This results from very low initial levels of these values. This means that in areas of minimal or occasional occurrence of ice, even significant relative changes translate to negligible absolute changes. As a result, the changes in the ice conditions forecast for the forthcoming years will have no critical impact on navigational conditions or the functioning of the Baltic’s coastal environment. Their meaning is mainly statistical, and they have no effect on the environment.

3.2. Use of LNG in Maritime Transport vs. The Natural Environment

Since the day of entry into force of the sulfur directive introducing requirements for lower toxic emissions [136,137], the demand for LNG as shipping fuel has been on an upward trend (Figure 8). The model of global LNG supply shows that production will go up from 406 m tons per year (MTPA) in 2024 to the forecast 710 MTPA in 2035. The trend for the years 2000–2025 is clearly rising [138,139,140,141].
The global demand for LNG as bunkering fuel spiked from 9 m tons in 2021 to 16.6 m tons in 2025, only to go up to the forecast 53.2 m tons in 2040. The growth in demand is driven by the increasing use of LNG as alternative fuel in maritime transport [145,147,148,149].
The number of vessels navigating the Baltic Sea changes year by year. In 2024, the total number of units rendering services in the area and entering the ports of Gdańsk, Gdynia, Szczecin, Świnoujście, Police, Darłowo, Elbląg, Frombork, Hel, Kołobrzeg, Krynica Morska, Międzyzdroje, Sport, Stepnica, Trzebież, Ustka, and Władysławowo stood at 20,690 (Table 10).
Considering the growing number of sea-going vessels, it is necessary to determine the size of the LNG fleet in the area. A forecast of the number of LNG-powered ships navigating the Baltic Sea has been made based on the share of LNG-powered ships to the total number of vessels, taking into consideration worldwide trends and changing fume regulations, which affect the choice of fuels. The forecast has been made based on the following:
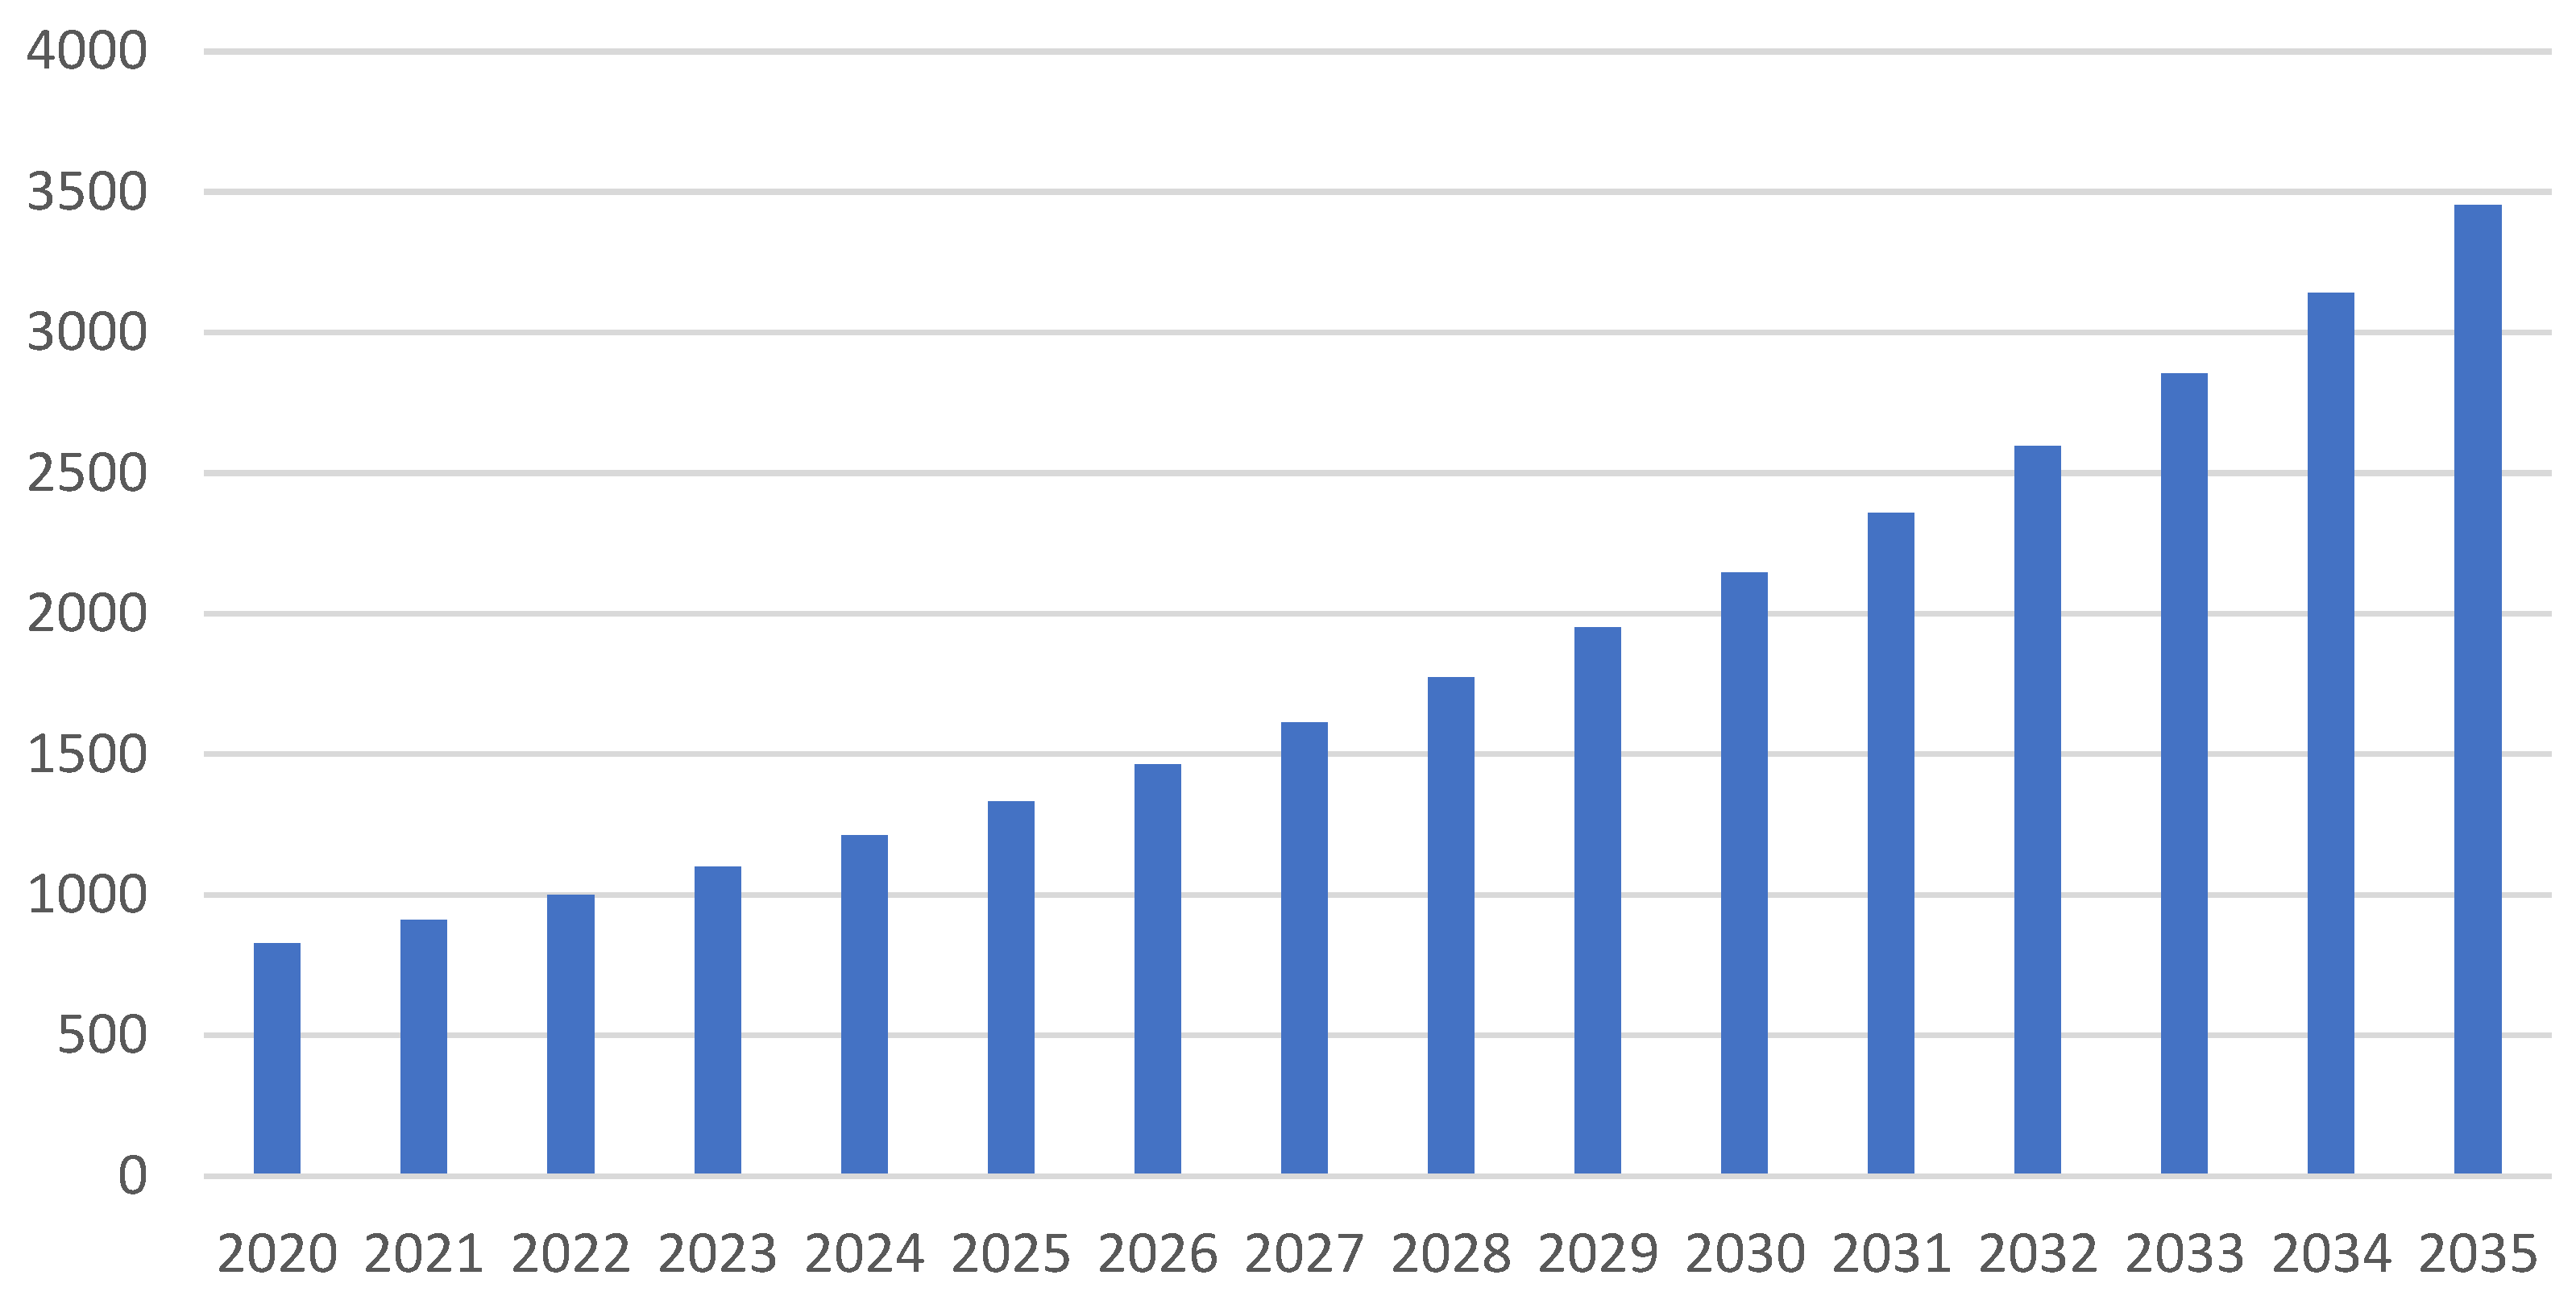
  • An analysis of worldwide trends in the use of LNG—recent years saw growth in the number of LNG-powered ships (especially in Europe), where anti-emission regulations are becoming more and more stringent;
  • A division into regions—increased interest in and demand for environmentally friendly fuels suggest that growth in the share of LNG-powered vessels in Europe (including the Baltic Sea) will depend on the introduced regulations, e.g., requirements for the SECA areas or CO2 limits;
  • A forecast for the Baltic Sea—on the basis of the assumptions referred to above, a conservative forecast has been made based on assumed growth in the number of LNG-powered vessels in the region under analysis by 10–15% annually, starting from 2020.
Based on an assumed percentage of LNG-powered ships navigating the Baltic Sea in 2020 of 4% and annual growth by 10–15%, the number of LNG-powered ships has been calculated. A total number of 100,000 vessels navigating worldwide has been assumed by all types until 2020 (Figure 9).
The forecast number of LNG-powered ships navigating the Baltic Sea in the 2035 time horizon shows significant growth. In 2020, the estimated number of vessels stands at 827, which is bound to increase to 3454 by the year 2035 based on assumed yearly growth by 10%. The increase is driven by the growing interest in environmentally friendly fuels and the introduction of anti-emission regulations, which make ship operators consider LNG as a more environmentally friendly fuel.
The development of the LNG market in the Baltic Sea calls for an analysis of the hydrological and meteorological conditions in the southern part of the Baltic Sea. These conditions are crucial for ensuring the safety of transportation and bunkering of LNG, taking into consideration variable weather conditions, waves, sea currents, seasonal changes in the density of maritime traffic, etc.

4. Discussion

In this analysis of hydrological and meteorological conditions in the southern part of the Baltic Sea with a view to the use of LNG as bunkering fuel, the boundary values of wind speed, sea state, visibility, air temperature, precipitation, barometric pressure, icing, humidity, LNG temperature, mist and fog, salinity, sunshine duration, waves, and sea currents provided have been determined in compliance with international standards and guidelines issued by the International Maritime Organization (IMO), the International Organization for Standardization (ISO), and guidelines of the Baltic ports, including, without limitation, Gdańsk, Gdynia, Helsinki, and Tallinn (Table 11).
Although the boundary values for key meteorological components, such as wind speed, wave height, visibility, air temperature, icing potential, and sea currents, generally comply with international standards, the operational environment of the Baltic Sea is characterized by considerable variability. Conditions like wind speeds exceeding 15–20 m/s, visibility falling below 500 m due to fog, and seasonal ice formation can cause temporary interruptions to LNG transfer operations. Additionally, the Baltic’s shallow depth and minimal tidal range and the frequent occurrence of short, steep waves during storms further complicate maneuvering and berthing, particularly for larger LNG-fueled vessels.
From an infrastructure perspective, these environmental challenges necessitate the implementation of robust technical measures. For example, LNG bunkering terminals should be equipped with heated loading arms and anti-icing systems to ensure operational continuity during subzero temperatures. Moreover, real-time meteorological monitoring, predictive weather analytics, and flexible scheduling procedures are essential to minimize weather-related disruptions. In practice, some Baltic ports, such as Helsinki and Klaipėda, already enforce operational restrictions under conditions of low visibility or high sea state, reflecting the operational relevance of such thresholds.
In contrast, Western European ports, like Rotterdam and Zeebrugge, benefit from milder climates and more stable hydrological conditions. LNG bunkering in these locations is less frequently affected by icing, strong winds, or reduced visibility, which translates into fewer unplanned delays and more consistent scheduling. On the other hand, Arctic and subarctic ports, such as Murmansk and Hammerfest, experience significantly harsher weather, including prolonged ice cover and polar storms. However, their LNG infrastructure is purpose-built for such extremes, featuring reinforced components, permanent deicing systems, and vessels designed to meet ice class specifications. This results in a high degree of resilience, albeit at the cost of increased capital and operational expenditure.
Within this spectrum, the Baltic region represents an intermediate operational challenge. While it does not demand the full extent of polar infrastructure, it must nonetheless contend with marked seasonal variability and occasional extreme weather events. This reality highlights the importance of scalable and climate-resilient infrastructure investments that reflect the specific risk profile of the region. Furthermore, LNG handling protocols in the Baltic should be subject to regular review and adaptation, informed by updated climatological data and operational experience.
From a systemic standpoint, the impact of meteorological constraints extends beyond safety considerations. It also influences the economic viability and logistical efficiency of LNG supply chains. Weather-related interruptions in bunkering operations can disrupt fuel availability for short sea shipping and Ro-Ro vessels operating under tight schedules. As such, hydrometeorological risks must be integrated into LNG infrastructure planning and cost–benefit assessments.
In conclusion, although the hydrological and meteorological conditions in the southern Baltic Sea generally support the safe conduct of LNG bunkering operations within internationally recognized parameters, the region’s environmental volatility introduces non-negligible operational risks. A comprehensive strategy is required—one that includes adaptive infrastructure, port-specific operational procedures, and enhanced coordination among port authorities, terminal operators, and shipping lines. Future research should prioritize the development of regional risk indices, comparative performance analyses of LNG systems under varying weather conditions, and the integration of climate forecasting into long-term LNG supply chain planning.
This study does not consider economic, legal, technological, or social aspects, as the analysis is focused exclusively on hydrological and meteorological conditions. The aim was to assess their impact on the potential for LNG infrastructure development in the selected region. Such an approach enables the identification of environmental factors that may serve as one of the criteria in a broader investment evaluation process.

5. Conclusions

An analysis of the hydrological and meteorological conditions in the southern part of the Baltic Sea for the purpose of bunkering LNG reveals important factors that affect the safety and efficiency of LNG operations. Wind speed, sea state, visibility, air temperature, and other weather conditions are crucial for ensuring a safe working environment in the Baltic ports. In the Baltic Sea, where the maximum mean wind speed is 15–20 m/s and the sea state is 3–4 on the Beaufort scale, LNG operations can easily comply with the IMO IGF Code and ISO 20519 standards and other port guidelines [152]. Wind speed can strongly affect the stability of ships, and high seas, especially during storms, may pose a hazard to harbor infrastructure and cargo handling equipment. Visibility within a range of 500 m to 1 km meets the requirements for the safety of operations; however, according to the regulations specified in the IMO IGF Code and port regulations, operations are prohibited in fog and at a visibility of less than 500 m. Air temperatures, which may drop to −20 °C in winter, meet the requirements for LNG handling; however, extremely low temperatures may affect the performance of cryogenic equipment and cause the freezing of valves. High air humidity, although below 90%, may cause the icing of equipment and hinder its operation in low temperatures. Sea currents in the Baltic Sea of a maximum speed of 1.5 kn do not pose any serious risk, but they may nevertheless affect the stability of ships during maneuvers. The salinity of the Baltic, at a mean value of 7 PSU, is considerably lower than that of oceans and may affect the properties of water and the equipment used in LNG bunkering. Variable sunshine duration, depending on the season, and waves of 0.5–2 m in normal conditions and even 4–7 m in storms, also affect the stability of ships and the safety of LNG operations. These conditions call for the deployment of suitable monitoring systems and systems securing port infrastructure, including anti-icing systems, which are required especially in winter.
To sum up, the hydrological and meteorological conditions in the southern Baltic Sea meet the requirements prescribed by international law. Nevertheless, considering their variability, special focus must be placed on the monitoring of weather parameters and their impact in order to ensure safe and streamlined LNG operations in Baltic ports.

Author Contributions

Conceptualization, E.O.; methodology, E.O. and J.F.; investigation, E.O., J.F., M.P., M.Z. and B.R.; resources, E.O., J.F., M.P., M.Z. and B.R.; data curation, E.O., J.F., M.P., M.Z. and B.R.; writing—original draft preparation, E.O., J.F., M.P., M.Z. and B.R.; writing—review and editing, E.O., J.F., M.P., M.Z. and B.R.; visualization, E.O., J.F., M.P., M.Z. and B.R. All authors have read and agreed to the published version of the manuscript.

Funding

This research received no external funding.

Institutional Review Board Statement

Not applicable.

Informed Consent Statement

Not applicable.

Data Availability Statement

The original contributions presented in the study are included in the article, further inquiries can be directed to the corresponding author.

Conflicts of Interest

The authors declare no conflicts of interest.

References

  1. Feistel, R.; Weinreben, S.; Wolf, H.; Seitz, S.; Spitzer, P.; Adel, B.; Wright, D.G. Density and absolute salinity of the Baltic Sea 2006–2009. Ocean Sci. 2010, 6, 3–24. [Google Scholar] [CrossRef]
  2. Jakobsson, M.; Stranne, C.; O’Regan, M.; Greenwood, S.L.; Gustafsson, B.G.; Humborg, C.; Weidner, E. Bathymetric properties of the Baltic Sea. Ocean Sci. 2019, 15, 905–924. [Google Scholar] [CrossRef]
  3. Szymczycha, B.; Zaborska, A.; Bełdowski, J.; Kuliński, K.; Beszczyńska-Möller, A.; Kędra, M.; Pempkowiak, J. The Baltic Sea. In World Seas: An Environmental Evaluation, 2nd ed.; Sheppard, C., Ed.; Elsevier: Amsterdam, The Netherlands, 2019; Volume 2, pp. 85–111. [Google Scholar]
  4. Schmidt-Felzmann, A.; Engelbrekt, K. Challenges in the Baltic Sea region: Geopolitics, insecurity and identity. Glob. Aff. 2018, 4, 445–466. [Google Scholar] [CrossRef]
  5. Ekengren, M. A return to geopolitics? The future of the security community in the Baltic Sea Region. Glob. Aff. 2018, 4, 503–519. [Google Scholar] [CrossRef]
  6. Bilczak, M. The Economic Role of Baltic Sea Region Seaports in Changing Geopolitical Conditions. Acta Sci. Pol. Adm. Locorum 2024, 23, 361–375. [Google Scholar] [CrossRef]
  7. Starosta, A. Safety of cargo handling and transport liquefied natural gas by sea. Dangerous properties of LNG and actual situation of LNG Fleet. TransNav Int. J. Mar. Navig. Saf. Sea Transp. 2007, 1, 427–431. [Google Scholar]
  8. Jeong, B.; Park, S.; Ha, S.; Lee, J.U. Safety evaluation on LNG bunkering: To enhance practical establishment of safety zone. Ocean Eng. 2020, 216, 107804. [Google Scholar] [CrossRef]
  9. Gritsenko, D. Explaining choices in energy infrastructure development as a network of adjacent action situations (NAAS): The case of LNG in the Baltic Sea region. Energy Policy 2018, 112, 74–83. [Google Scholar] [CrossRef]
  10. Grigoryev, L.; Medzhidova, D. Energy Transition in the Baltic Sea Region: A Controversial Role of LNG? In The Future of Energy Consumption, Security and Natural Gas; Springer: Berlin/Heidelberg, Germany, 2021; pp. 61–91. [Google Scholar]
  11. Rozmarynowska-Mrozek, M. The Development of the LNG-Fuelled Fleet and the LNG-Bunkering Infrastructure within the Baltic and North Sea Region. Ekon. Probl. Usług 2015, 119, 23–40. [Google Scholar] [CrossRef]
  12. Zarzecki, D. Development of the LNG Terminal in Świnoujście, Poland. In The Future of Energy Consumption, Security and Natural Gas; Springer: Berlin/Heidelberg, Germany, 2021; pp. 191–220. [Google Scholar]
  13. Matczak, M. Możliwości rozwojowe oraz rola terminala LNG w Świnoujściu na rynku gazowym Bałtyku oraz Europy północnej i wschodniej. Logistyka 2012, 5, 642–651. [Google Scholar]
  14. Hakanson, L. Charakterystyka fizycznogeograficzna zlewiska Morza Bałtyckiego. In Środowisko Morza Bałtyckiego; Jankowski, A., Jankowski, G., Eds.; Wyd. Uniw. w Uppsali: Uppsala, Sweden, 1991; Volume 1, pp. 1–37. [Google Scholar]
  15. Bierstedt, S.E. Variability of wind direction statistics of mean and extreme wind events over the Baltic Sea region. Tellus A Dyn. Meteorol. Oceanogr. 2015, 67, 29073. [Google Scholar] [CrossRef]
  16. Granskog, M.; Kaartokallio, H.; Kuosa, H.; Thomas, D.N.; Vainio, J. Sea ice in the Baltic Sea—A review. Estuar. Coast. Shelf Sci. 2006, 70, 145–160. [Google Scholar] [CrossRef]
  17. Brown, S.; Hanson, S.; Nicholls, R.J. Implications of sea-level rise and extreme events around Europe: A review of coastal energy infrastructure. Clim. Change 2014, 122, 81–95. [Google Scholar] [CrossRef]
  18. Andžāns, M. The Baltic Road to Energy Independence from Russia Is Nearing Completion. 2022. Available online: https://www.fpri.org/article/2022/05/the-baltic-road-to-energy-independence-from-russia-is-nearing-completion/ (accessed on 1 April 2025).
  19. Tuswan, T.; Sari, D.P.; Muttaqie, T.; Prabowo, A.R.; Soetardjo, M.; Murwantono, T.T.P.; Yuniati, Y. Representative application of LNG-fuelled ships: A critical overview on potential GHG emission reductions and economic benefits. Brodogr. Int. J. Nav. Archit. Ocean Eng. Res. Dev. 2023, 74, 63–83. [Google Scholar] [CrossRef]
  20. Martínez-López, A.; Romero, A.; Orosa, J.A. Assessment of cold ironing and LNG as mitigation tools of short sea shipping emissions in port: A Spanish case study. Appl. Sci. 2021, 11, 2050. [Google Scholar] [CrossRef]
  21. Jankowski, S. Possibilities for the Use of LNG as a Fuel on the Baltic Sea. In Marine Navigation and Safety of Sea Transportation: Maritime Transport and Shipping; CRC Press: Boca Raton, FL, USA, 2013; pp. 87–90. [Google Scholar]
  22. Pfoser, S.; Schauer, O.; Costa, Y. Acceptance of LNG as an alternative fuel: Determinants and policy implications. Energy Policy 2018, 120, 259–267. [Google Scholar] [CrossRef]
  23. Karp, G. Changes in water transport standard requirements and their effect on ecology. J. Pol. CIMAC 2014, 9, 7–12. [Google Scholar]
  24. Richards, G.A.; McMillian, M.M.; Gemmen, R.S.; Rogers, W.A.; Cully, S.R. Issues for low-emission, fuel-flexible power systems. Prog. Energy Combust. Sci. 2001, 27, 141–169. [Google Scholar] [CrossRef]
  25. Woroch, T.; Klonowski, K. LNG Jako Alternatywne Źródło Energii. Nowoczesne Budownictwo Inżynieryjne; 2006; pp. 30–32. Available online: https://nbi.com.pl/content/uploads/assets/NBI-pdf/2006/6_9_2006/pdf/9_lpg.pdf (accessed on 1 April 2025).
  26. Shang, M.; Ma, Z.; Su, Y.; Khan, S.R.; Tahir, L.M.; Sasmoko; Answer, M.K.; Zaman, K. Understanding the importance of sustainable ecological innovation in reducing carbon emissions: Investigating the green energy demand, financial development, natural resource management, industrialisation and urbanisation channels. Econ. Res. 2023, 36, 2137823. [Google Scholar] [CrossRef]
  27. Yao, S.; Li, C.; Wei, Y. Design and optimization of a zero carbon emission system integrated with the utilization of marine engine waste heat and LNG cold energy for LNG-powered ships. Appl. Therm. Eng. 2023, 231, 120976. [Google Scholar] [CrossRef]
  28. Kumar, S.; Kwon, H.; Choi, K.; Lim, W.; Cho, J.K.; Tak, K.; Moon, I. LNG: An eco-friendly cryogenic fuel for sustainable development. Appl. Energy 2011, 88, 4264–4273. [Google Scholar] [CrossRef]
  29. Peng, Y.; Zhao, X.; Zuo, T.; Wang, W.; Song, X. A systematic literature review on port LNG bunkering station. Transp. Res. Part D Transp. Environ. 2021, 91, 102704. [Google Scholar] [CrossRef]
  30. Czermański, E. Baltic shipping development trends in maritime spatial planning aspect. Stud. I Mater. Inst. Transp. I Handlu Morskiego 2017, 14, 48–64. [Google Scholar]
  31. Łabuz, T.A. Influence of meteorological conditions in autumn/winter 2021–2022 on the development of storm surges and the dune erosion on the Polish Baltic coast as a result of climate changes. Stud. Quat. 2023, 40, 93–114. [Google Scholar] [CrossRef]
  32. Meilutytė-Lukauskienė, D.; Nazarenko, S.; Kobets, Y.; Akstinas, V.; Sharifi, A.; Haghighi, A.T.; Hashemi, H.; Kokorīte, I.; Ozolina, B. Hydro-meteorological droughts across the Baltic Region: The role of the accumulation periods. Sci. Total Environ. 2024, 913, 169669. [Google Scholar] [CrossRef] [PubMed]
  33. Feistel, R.; Nausch, G.; Wasmund, N. State and Evolution of the Baltic Sea, 1952–2005: A Detailed 50-Year Survey of Meteorology and Climate, Physics, Chemistry, Biology, and Marine Environment; Wiley: Hoboken, NJ, USA, 2008. [Google Scholar]
  34. Quinn, T.J. Temperature, 2nd ed.; Academic Press: Cambridge, MA, USA, 2013. [Google Scholar]
  35. IMGW-PIB, Normy Klimatyczne 1991–2020. Available online: https://klimat.imgw.pl/pl/climate-normals/USL (accessed on 23 July 2024).
  36. Climate Data, Polska, Pomeranian Voivodeship, Gdańsk. Available online: https://en.climate-data.org/europe/poland/west-pomeranian-voivodeship-458/ (accessed on 10 April 2025).
  37. Kniebusch, M.; Meier, H.E.M.; Neumann, T.; Börgel, F. Temperature Variability of the Baltic Sea Since 1850 and Attribution to Atmospheric Forcing Variables. JGR Oceans 2019, 124, 4168–4187. [Google Scholar] [CrossRef]
  38. Surkova, G.V.; Arkhipkin, V.S.; Kislov, A.V. Atmospheric circulation and storm events in the Baltic Sea. Open Geosci. 2015, 1, 332–341. [Google Scholar] [CrossRef]
  39. Mirou, S.M.; Elawady, A.T.; Ashour, A.G.; Zeiada, W.; Abuzwidah, M. Visibility Prediction through Machine Learning: Exploring the Role of Meteorological Factors. In Proceedings of the ASAT, Dubai, United Arab Emirates, 20–23 February 2023. [Google Scholar]
  40. Merriam, J.B. Atmospheric pressure and gravity. Geophys. J. Int. 1992, 109, 488–500. [Google Scholar] [CrossRef]
  41. Furmanczyk, K. Zagrożenia i Systemy Ostrzegania. Zintegrowane Zarządzanie Obszarami Przybrzeżnymi w Polsce—Stan Obecny i Perspektywy; Część 4; Uniwersytet Szczeciński Instytut Nauk o Morzu: Szczecin, Poland, 2012; pp. 153–163. [Google Scholar]
  42. Dotsenko, S.F.; Miklashevskaya, N.A. Transformation of the ocean level under a moving area of disturbances of atmospheric pressure. Phys. Oceanogr. 2007, 17, 65–74. [Google Scholar] [CrossRef]
  43. IMGW-PIB, Rocznik Meteorologiczny 2018, 2019, 2020, 2021, 2022, 2023, Warszawa, Polska. Available online: https://bip.imgw.pl/ (accessed on 20 April 2025).
  44. Guijo-Rubio, D.; Gutiérrez, P.A.; Casanova-Mateo, C.; Sanz-Justo, J.; Salcedo-Sanz, S.; Hervás-Martínez, C. Prediction of low-visibility events due to fog using ordinal classification. Atmos. Res. 2018, 2014, 64–73. [Google Scholar] [CrossRef]
  45. Świątek, M. The connection between configurations of lows over Europe and precipitation along Poland’s Baltic coast. Przegląd Geogr. 2013, 85, 87–102. [Google Scholar] [CrossRef]
  46. Zipser, E.J.; Liu, C. Extreme Convection vs. Extreme Rainfall: A Global View. Curr. Clim. Change Rev. 2022, 7, 121–130. [Google Scholar] [CrossRef]
  47. Kożuchowski, K.M. Obfitość opadów w Polsce w przebiegu rocznym. In Przegląd Geofizyczny; Wydawcy: Polskie Towarzystwo Geofizyczne; Komitet Geofizyki PAN: Warsaw, Poland, 2015; pp. 27–38. [Google Scholar]
  48. Karpinski, P.H.; Wey, J.S. Precipitation processes. In Handbook of Industrial Crystallization, 2nd ed.; Butterworth-Heinemann: Boston, MA, USA, 2002; pp. 141–160. [Google Scholar]
  49. Malinowska, M.; Miętus, M. Opady o dużym natężeniu w Gdyni i ich uwarunkowania atmosferyczne (1981–2000). In Woda w badaniach geograficznych Uniwersytet Humanistyczno-Przyrodniczy Jana Kochanowskiego; Ciupa, T., Suligowski, R., Eds.; Instytut Geografii: Kraków, Poland, 2010; pp. 49–58. [Google Scholar]
  50. Berger, A.; Loutre, M.F.; Christian Tricot, C. Insolation and Earth’s orbital periods. J. Geophys. Res. Atmos. 1993, 98, 10341–10362. [Google Scholar] [CrossRef]
  51. Marsz, A.A. Usłonecznienie. Stowarzyszenie Klimatologów Polskich. Available online: https://klimatolodzy.pl/index.php/pl/baza-wiedzy/elementy-meteorologiczne/uslonecznienie (accessed on 25 July 2024).
  52. Śmierzchalska, P.; Chmielowiec, M. Mapa Usłonecznienia w Polsce; Akademia Pomorska w Słupsku: Słupsk, Poland, 2015. [Google Scholar]
  53. Huld, T.A.; Šúri, M.; Dunlop, E.D.; Micale, F. Estimating average daytime and daily temperature profiles within Europe. Environ. Model. Softw. 2006, 21, 1650–1661. [Google Scholar] [CrossRef]
  54. Holme, R.; Viron, O. Characterization and implications of intradecadal variations in length of day. Nature 2013, 499, 202–204. [Google Scholar] [CrossRef]
  55. Paszkuta, M.; Zapadka, Z.; Krężel, A. Diurnal variation of cloud cover over the Baltic Sea. Oceanologia 2022, 64, 299–311. [Google Scholar] [CrossRef]
  56. Uścinowicz, S.; Zachowicz, J.; Graniczny, M.; Dobracki, R. Geological structure of the southern Baltic coast and related hazards. Pol. Geol. Inst. Spec. Pap. 2004, 15, 61–68. [Google Scholar]
  57. Gonser, S.G.; Klemm, O.; Griessbaum, F.; Chang, S.; Chu, H.; Hsia, Y. The Relation Between Humidity and Liquid Water Content in Fog: An Experimental Approach. Pure Appl. Geophys. 2011, 196, 821–833. [Google Scholar] [CrossRef]
  58. Entwistle, F. Fog. Aeronaut. J. 1928, 32, 342–384. [Google Scholar] [CrossRef]
  59. Ducongé, L.; Lac, C.; Vié, B.; Bergot, T.; Price, J.D. Fog in heterogeneous environments: The relative importance of local and non-local processes on radiative-advective fog formation. Q. J. R. Meteorol. Soc. 2020, 146, 2522–2546. [Google Scholar] [CrossRef]
  60. Liu, D.Y.; Yan, W.L.; Yang, J.; Pu, M.J.; Niu, S.J.; Li, Z.H. A Study of the Physical Processes of an Advection Fog Boundary Layer. Bound.-Layer Meteorol. 2015, 158, 125–138. [Google Scholar] [CrossRef]
  61. Carpenter, A.B. A Study of Pre-Warm Frontal Fog at Portland, Oregon. Bull. Am. Meteorol. Soc. 1941, 22, 47–51. [Google Scholar] [CrossRef]
  62. Dąbrowska, E.; Torbicki, M. Forecast of Hydro–Meteorological Changes in Southern Baltic Sea. Water 2024, 16, 1151. [Google Scholar] [CrossRef]
  63. Sun, J.; Lenschow, D.H.; Mahrt, L.; Nappo, C. The Relationships among Wind, Horizontal Pressure Gradient, and Turbulent Momentum Transport during CASES-99. J. Atmos. Sci. 2013, 70, 3397–3414. [Google Scholar] [CrossRef]
  64. Spiridonov, V.; Ćurić, M. Atmospheric Pressure and Wind. Fundam. Meteorol. 2020, 3, 87–114. [Google Scholar]
  65. Rohli, R.V.; Li, C. Effect of Friction. In Meteorology for Coastal Scientists; Springer: Berlin/Heidelberg, Germany, 2021; pp. 151–155. [Google Scholar]
  66. IMGW PIB, Biuletyn Południowego Bałtyku Monthly Reports from January 2013 to December 2023. Available online: https://klimat.imgw.pl/pl/biuletyn-baltyk/ (accessed on 23 July 2024).
  67. Weatherspark Całoroczny Klimat i Średnie Warunki Pogodowe w Gdańsk. Available online: https://pl.weatherspark.com/y/84138/%C5%9Arednie-warunki-pogodowe-w:-Gda%C5%84sk-Polska-w-ci%C4%85gu-roku (accessed on 12 April 2025).
  68. Wypych, A. Para Wodna w Troposferze Nad Europą, 1st ed.; Instytut Geografii i Gospodarki Przestrzennej Uniwersytetu Jagiellońskiego: Kraków, Poland, 2018. [Google Scholar]
  69. Ahmad, A.; Biswas, A.; Warland, J.; Anjum, I. Atmospheric Humidity. In Climate Change and Agrometeorology; Elsevier: Amsterdam, The Netherlands, 2023; pp. 53–82. [Google Scholar]
  70. Lee, S.S. Dependence of aerosol-precipitation interactions on humidity in a multiple-cloud system. Atmos. Chem. Phys. 2011, 11, 2179–2196. [Google Scholar] [CrossRef]
  71. Pierrehumbert, R.T.; Brogniez, H.; Rémy Roca, R. On the Relative Humidity of the Atmosphere. In The Global Circulation of the Atmosphere; Princeton University Press: Princeton, NJ, USA, 2008. [Google Scholar]
  72. Stull, R. Wet-Bulb Temperature from Relative Humidity and Air Temperature. J. Appl. Meteorol. Climatol. 2011, 50, 2267–2269. [Google Scholar] [CrossRef]
  73. Rynska, J. Temperatura i wilgotność względna zawsze razem. Nowocz. Magazyn. Pismo O Syst. Skladowania I Magazynowania 2015, 17, 43–46. [Google Scholar]
  74. Pérez-Díaz, J.L.; Álvarez-Valenzuela, M.A.; García-Prada, J.C. The effect of the partial pressure of water vapor on the surface tension of the liquid water–air interface. J. Colloid Interface Sci. 2012, 381, 180–182. [Google Scholar] [CrossRef]
  75. Marsz, A.A.; Styszyńska, A. Wilgotność Powietrza. Stowarzyszenie Klimatologów Polskich. Available online: https://klimatolodzy.pl/index.php/pl/baza-wiedzy/elementy-meteorologiczne/wilgotnosc-powietrza (accessed on 25 July 2024).
  76. Mondal, B.; Mukherjee, T.; Finch, N.W.; Saha, A.; Gao, M.Z.; Palmer, T.A.; DebRoy, T. Vapor Pressure versus Temperature Relations of Common Elements. Materials 2023, 16, 50. [Google Scholar] [CrossRef]
  77. Bumke, K.; Karger, U.; Hasse, L.; Niekamp, K. Evaporation over the Baltic Sea as an example of a semi-enclosed sea. Contrib. Atmos. Phys. 1998, 71, 249–261. [Google Scholar]
  78. Knasik, M.; Rutkowski, D.; Tadajewski, A. Wpływ Warunków Hydrochemicznych Zalewu Szczecińskiego na Chemizm Wód Zatoki Pomorskiej z Uwzględnieniem Układów Hydrologicznych Estuarium Odry. In Proceedings of the Zebranie Plenarnego Komitetu Badań Morza Polskiej Akademii Nauk, Szczecin, Poland, 22 May 1990. [Google Scholar]
  79. Bendtsen, J.; Gustafsson, K.E.; Söderkvist, J.; Hansen, J.L.S. Ventilation of bottom water in the North Sea–Baltic Sea transition zone. J. Mar. Syst. 2009, 75, 138–149. [Google Scholar] [CrossRef]
  80. Lehmann, A.; Myrberg, K.; Post, P.; Chubarenko, I.; Dailidiene, I.; Hinrichsen, H.H.; Bukanova, T. Salinity dynamics of the Baltic Sea. Earth Syst. Dyn. 2022, 13, 373–392. [Google Scholar] [CrossRef]
  81. Holland, H.D. Sea level, sediments and the composition of seawater. Am. J. Sci. 2005, 305, 220–239. [Google Scholar] [CrossRef]
  82. Gustafsson, B.G. Quantification of water, salt, oxygen and nutrient exchange of the Baltic Sea from observations in the Arkona Basin. Cont. Shelf Res. 2001, 21, 1485–1500. [Google Scholar] [CrossRef]
  83. Samuelsson, M. Interannual salinity variations in the Baltic Sea during the period 1954–1990. Cont. Shelf Res. 1996, 16, 1463–1477. [Google Scholar] [CrossRef]
  84. Thurman, E.M.; Wershaw, R.L.; Malcolm, R.L.; Pinckney, D.J. Molecular size of aquatic humic substances. Org. Geochem. 1982, 4, 27–35. [Google Scholar] [CrossRef]
  85. Zalewska, T.; Iwaniak, M.; Kraśniewski, W.; Sapiega, P.; Danowska, B.; Saniewski, M.; Wawryniuk, K. Hydromorphology of the southern Baltic coastal and transitional waters–New index-based assessment method. Cont. Shelf Res. 2023, 270, 105195. [Google Scholar] [CrossRef]
  86. Bangel, H.; Schernewski, G.; Bachor, A.; Landsberg-Uczciwek, M. Spatial Pattern and Long-Term Development of Water Quality in the Oder Estuary; Institut Für Ostseeforschung: Warnemünde, Germany, 2004; p. 21. [Google Scholar]
  87. Stont, Z.I.; Bukanova, T.V. General features of air temperature over coastal waters of the south-eastern Baltic Sea for 2004–2017. Russ. J. Earth Sci. 2019, 19, 5. [Google Scholar] [CrossRef]
  88. Girjatowicz, J.P.; Świątek, M. Effects of atmospheric circulation on water temperature along the southern Baltic Sea coast. Oceanologia 2019, 61, 38–49. [Google Scholar] [CrossRef]
  89. Bradtke, K.; Herman, A.; Urbanski, J.A. Spatial and interannual variations of seasonal sea surface temperature patterns in the Baltic Sea. Oceanologia 2010, 52, 345–362. [Google Scholar] [CrossRef]
  90. Janecki, M.; Dybowski, D.; Rak, D.; Dzierzbicka-Glowacka, L. A new method for thermocline and halocline depth determination at shallow seas. J. Phys. Oceanogr. 2022, 52, 2205–2218. [Google Scholar] [CrossRef]
  91. Prandke, H.; Stips, A. A model of Baltic thermocline turbulence patches, deduced from experimental investigations. Cont. Shelf Res. 1992, 12, 643–659. [Google Scholar] [CrossRef]
  92. Dutheil, C.; Meier, H.E.M.; Gröger, M.; Börgel, F. Understanding past and future sea surface temperature trends in the Baltic Sea. Clim. Dyn. 2022, 58, 3021–3039. [Google Scholar] [CrossRef]
  93. Liblik, T.; Lips, U. Stratification Has Strengthened in the Baltic Sea—An Analysis of 35 Years of Observational Data. Front. Earth Sci. 2019, 7, 00174. [Google Scholar] [CrossRef]
  94. Kożuchowski, K.; Wibig, J. Współczesne zmiany zlodzenia Bałtyku a cyrkulacja atmosferyczna. Przegląd Geofiz. 2024, 69, 87–113. [Google Scholar]
  95. Leppäranta, M.; Lewis, J.E. Observations of ice surface temperature and thickness in the Baltic Sea. Int. J. Remote Sens. 2007, 28, 3963–3977. [Google Scholar] [CrossRef]
  96. HELCOM ACTION. Conditions That Influence Good Environmental Status (GES) in the Baltic Sea. 2021. Available online: https://helcom.fi/wp-content/uploads/2021/11/Conditions-that-influence-Good-Environmental-Status-GES-in-the-Baltic-Sea.pdf (accessed on 23 July 2024).
  97. Medvedev, I.P.; Rabinovich, A.B.; Kulikov, E.A. Tides in Three Enclosed Basins: The Baltic, Black, and Caspian Seas. 2016. Available online: https://scispace.com/pdf/tides-in-three-enclosed-basins-the-baltic-black-and-caspian-15mwob1zbb.pdf (accessed on 27 April 2025).
  98. Ardalan, A.A.; Hashemifaraz, A. Tidal modeling based on satellite altimetry observations of TOPEX/Poseidon, Jason1, Jason2, and Jason3 with high prediction capability: A case study of the Baltic Sea. Geod. Geodyn. 2024, 15, 404–418. [Google Scholar] [CrossRef]
  99. Hagen, E.; Feistel, R. Observations of low-frequency current fluctuations in deep water of the Eastern Gotland Basin/Baltic Sea. J. Geophys. Res. Ocean. 2004, 109, C002017. [Google Scholar] [CrossRef]
  100. Jędrasik, J.; Kowalewski, M. Mean annual and seasonal circulation patterns and long-term variability of currents in the Baltic Sea. J. Mar. Syst. 2019, 193, 1–26. [Google Scholar] [CrossRef]
  101. Barnett, T.P.; Kenyon, K.E. Recent advances in the study of wind waves. Rep. Prog. Phys. 1975, 38, 667. [Google Scholar] [CrossRef]
  102. Brahtz, J.F.; Hendershott, M.C. Physical and hydrodynamical factors. In Ocean Engineering: Goals, Environment, Technology; John Wiley and Sons, Inc.: New York, NY, USA, 1968. [Google Scholar]
  103. Maat, N.; Kraan, C.; Oost, W.A. The roughness of wind waves. Bound.-Layer Meteorol. 1991, 54, 89–103. [Google Scholar] [CrossRef]
  104. Li, T.; Shen, L. The principal stage in wind-wave generation. J. Fluid Mech. 2022, 934, A41. [Google Scholar] [CrossRef]
  105. Phillips, O.M. On the generation of waves by turbulent wind. J. Fluid Mech. 2006, 2, 417–445. [Google Scholar] [CrossRef]
  106. Akademia Morska w Gdyni, Wydział Nawigacyjny, Katedra Meteorologii i Oceanografii Nautycznej. Falowanie Wiatrowe. 1999. Available online: https://archive.is/9p58 (accessed on 27 April 2025).
  107. Sokolov, A.; Chubarenko, B. Baltic sea wave climate in 1979–2018: Numerical modelling results. Ocean Eng. 2024, 297, 117088. [Google Scholar] [CrossRef]
  108. Vanem, E. Joint statistical models for significant wave height and wave period in a changing climate. Mar. Struct. 2016, 49, 180–205. [Google Scholar] [CrossRef]
  109. Munk, W.H. Proposed Uniform Procedure for Observing Waves and Interpreting Instrument Records; Wave Project Rep; Scripps Institution of Oceanography: San Diego, CA, USA, 1944; Volume 26, p. 22. [Google Scholar]
  110. Stewart, R.H. Introduction to Physical Oceanography; University Press of Florida: Gainesville, FL, USA, 2008. [Google Scholar]
  111. Kwiecień, K. Warunki klimatyczne. [w:] B. Augustowski (red.), Bałtyk Południowy. Gdańskie Towarzystwo Naukowe; Ossolineum: Wrocław, Poland, 1987; pp. 219–288. [Google Scholar]
  112. Kislov, A.V.; Surkova, G.V.; Arkhipkin, V.S. Occurence frequency of storm wind waves in the Baltic, Black, and Caspian Seas under changing climate conditions. Russ. Meteorol. Hydrol. 2016, 41, 121–129. [Google Scholar] [CrossRef]
  113. Pietrek, S.A.; Jasiński, J.M.; Winnicki, I.A. Analysis of a storm situation over the southern Baltic Sea using direct hydrometeorological and remote sensing measurements results. Zesz. Nauk. Akad. Morskiej Szczecinie 2014, 38, 81–88. [Google Scholar]
  114. Marosz, M.; Wójcik, R.; Biernacik, D.; Jakusik, E.; Pilarski, M.; Owczarek, M.; Miętus, M. Zmienność klimatu polski od połowy xx wieku. rezultaty projektu klimat poland’s climate variability 1951–2008. KLIMAT project’s results. Pr. I Stud. Geogr. 2011, 47, 51–66. [Google Scholar]
  115. IMGW PIB, Klimat Polski w. 2022. Available online: https://www.imgw.pl/sites/default/files/inline-files/klimat-polski-2022_raport-koncowy.pdf (accessed on 19 July 2024).
  116. Zalewska, T.; Wilman, B.; Łapeta, B.; Marosz, M.; Biernacik, D.; Wochna, A.; Iwaniak, M. Seawater temperature changes in the southern Baltic Sea (1959–2019) forced by climate change. Oceanologia 2024, 66, 37–55. [Google Scholar] [CrossRef]
  117. Qu, X.; Alex, H. Assessing snow albedo feedback in simulated climate change. J. Clim. 2006, 19, 2617–2630. [Google Scholar] [CrossRef]
  118. Gardner, A.S.; Sharp, M.J. A review of snow and ice albedo and the development of a new physically based broadband albedo parameterization. J. Geophys. Res. Earth Surf. 2010, 115, F001444. [Google Scholar] [CrossRef]
  119. Thackeray, C.W.; Fletcher, C.G. Snow albedo feedback: Current knowledge, importance, outstanding issues and future directions. Prog. Phys. Geogr. 2016, 40, 392–408. [Google Scholar] [CrossRef]
  120. Bednorz, T. Synoptic Conditions of the Occurrence of Snow Cover in Central European Lowlands; Wiley: Hoboken, NJ, USA, 2010. [Google Scholar]
  121. Skliris, N.; Zika, J.D.; Nurser, G.; Josey, S.A.; Marsh, R. Global water cycle amplifying at less than the Clausius-Clapeyron rate. Sci. Rep. 2016, 6, 38752. [Google Scholar] [CrossRef] [PubMed]
  122. Koźmiński, C.; Michalska, B. Międzydobowe zmiany ciśnienia atmosferycznego w strefie polskiego wybrzeża Bałtyku. Przegląd Geogr. 2010, 82, 73–84. [Google Scholar]
  123. Jakusik, E.; Wójcik, R.; Pilarski, M.; Biernacik, D.M.M.; Miętus, M. Poziom morza w polskiej strefie brzegowej–stan obecny i spodziewane zmiany w przyszłości. KLIMAT “Wpływ zmian klimatu na środowisko, gospodarkę i społeczeństwo (zmiany, skutki i sposoby ich ograniczania, wnioski dla nauki, praktyki inżynierskiej i planowania gospodarczego)”. Zadanie 2012, 6, 146–169. [Google Scholar]
  124. Weisse, R.; Dailidienė, I.; Hünicke, B.; Kahma, K.; Madsen, K.; Omstedt, A.; Parnell, K.; Schöne, T.; Soomere, T.; Zhang, W.; et al. Sea level dynamics and coastal erosion in the Baltic Sea region. Earth Syst. Dyn. 2021, 12, 871–898. [Google Scholar] [CrossRef]
  125. Miętus, M. Vector of geostrophic wind in the Baltic Sea region as an index of local circulation and its relationship to hydro-meteorological characteristics along the Polish coast. In Proceedings of the European Workshop on Climate Variations, Majvik, Finland, 15–18 May 1994; pp. 8–23. [Google Scholar]
  126. IMGW PIB, Klimat Polski w. 2023. Available online: https://www.imgw.pl/sites/default/files/2024-05/imgw-pib_klimat_polski_2023_raport.pdf (accessed on 23 July 2024).
  127. IPCC; Core Writing Team; Pachauri, R.K.; Reisinger, A. (Eds.) Climate Change 2007: Synthesis Report. In Contribution of Working Groups I, II and III to the Fourth Assessment Report of the Intergovernmental Panel on Climate IPCC; IPCC: Geneva, Switzerland, 2007. [Google Scholar]
  128. Ustrnul, Z.; Czekierda, D.; Wypych, A. Extreme values of air temperature in Poland according to different atmospheric circulation classifications. Phys. Chem. Earth Parts A/B/C 2010, 35, 429–436. [Google Scholar] [CrossRef]
  129. Tomczyk, A.M.; Bednorz, E.; Półrolniczak, M.; Kolendowicz, L. Strong heat and cold waves in Poland in relation with the large-scale atmospheric circulation. Theor. Appl. Climatol. 2019, 137, 1909–1923. [Google Scholar] [CrossRef]
  130. Sztobryn, M.; Stanislawczyk, I. Changes of sea ice climate during the XX century–Polish coastal waters. In Proceedings of the Fourth Workshop on the Baltic Sea Ice Climate, Norrköping, Sweden, 22–24 May 2002; pp. 69–76. [Google Scholar]
  131. Dyrcz, C. Zlodzenie Morza Bałtyckiego w latach 2000–2018. Nautologia 2019, 156, 10–16. [Google Scholar]
  132. Sztobryn, M.; Wójcik, R.; Miętus, M. Występowanie zlodzenia na Bałtyku–stan obecny i spodziewane zmiany w przyszłości. In Warunki Klimatyczne i Oceanograficzne w Polsce i na Bałtyku Południowym. Spodziewane Zmiany i Wytyczne do Opracowania Strategii Adaptacyjnych w Gospodarce Krajowej, Seria Monografie; 2012; pp. 189–215. Available online: https://www.researchgate.net/publication/266605153_Wystepowanie_zlodzenia_na_Baltyku_-_stan_obecny_i_spodziewane_zmiany_w_przyszlosci (accessed on 15 April 2025).
  133. Ptak, M.; Choinski, A. Ice phenomena in rivers of the coastal zone (southern Baltic) in the years 1956–2015. Zone J. Ecol. Prot. Coastline 2016, 20, 73–83. [Google Scholar]
  134. Jevrejeva, S.; Drabkin, V.V.; Kostjukov, J.; Lebedev, A.A.; Leppäranta, M.; Mironov Ye, U.; Schmelzer, N.; Sztobryn, M. Baltic Sea ice seasons in the twentieth century. Clim. Res. 2004, 25, 217–227. [Google Scholar] [CrossRef]
  135. Nakićenović, N.; Swart, R. Emissions Scenarios—Special Report of the Intergovernmental Panel on Climate Change. 2000. Available online: https://www.ipcc.ch/site/assets/uploads/2018/03/sres-en.pdf (accessed on 15 April 2025).
  136. Directive 2012/33/EU of the European Parliament and of the Council of November 21 Amending Council Directive 1999/32/ as Regards the Sulfur Content of Marine Fuels. Available online: https://eur-lex.europa.eu/eli/dir/2012/33/oj/eng (accessed on 1 April 2025).
  137. Directive (EU) 2018/2001 on the Promotion of the Use of Energy from Renewable Sources. Renewable Energy Directive II. Available online: https://eur-lex.europa.eu/eli/dir/2018/2001/oj (accessed on 4 April 2025).
  138. Zannis, T.C.; Katsanis, J.S.; Christopoulos, G.P.; Yfantis, E.A.; Papagiannakis, R.G.; Pariotis, E.G.; Vallis, A.G. Marine exhaust gas treatment systems for compliance with the IMO 2020 global sulfur cap and tier III NOx limits: A review. Energies 2022, 15, 3638. [Google Scholar] [CrossRef]
  139. Livaniou, S.; Chatzistelios, G.; Lyridis, D.V.; Bellos, E. LNG vs. MDO in marine fuel emissions tracking. Sustainability 2022, 14, 3860. [Google Scholar] [CrossRef]
  140. Çelikaslan, Z.; Kılıç, A. Safety Precautions for The Use of LNG as Marine Fuel. J. Marit. Transp. Logist. 2023, 4, 11–22. [Google Scholar] [CrossRef]
  141. Salarkia, M.; Golabi, S.I. Liquefied Natural Gas (LNG): Alternative Marine Fuel Restriction and Regulation Considerations, Environmental and Economic Assessment. Energy Eng. Manag. 2023, 10, 44–59. [Google Scholar]
  142. DNV GL. Decarbonization of Maritime Transport: The Role of LNG and Hydrogen. In Energy Policy; DNV GL: Bærum, Norway, 2020. [Google Scholar]
  143. DNV GL. Rising LNG demand: Overcoming bunkering challenges. In Energy Policy; DNV GL: Bærum, Norway, 2025. [Google Scholar]
  144. Thunder Said Energy. The Research Consultancy for Energy Technologies. Available online: https://thundersaidenergy.com/ (accessed on 4 April 2025).
  145. Chae, G.Y.; An, S.H.; Lee, C.Y. Demand forecasting for liquified natural gas bunkering by country and region using meta-analysis and artificial intelligence. Sustainability 2021, 13, 9058. [Google Scholar] [CrossRef]
  146. International Energy Agency. Gas Market Report, Q1-2025; International Energy Agency: Paris, France, 2025. [Google Scholar]
  147. Gas Exporting Countries Forum. Global Gas Outlook 2050, 9th ed.; Gas Exporting Countries Forum: Doha, Qatar, 2025. [Google Scholar]
  148. International Energy Agency: 2021–2025: Rebound and beyond. Available online: https://www.iea.org/reports/gas-2020/2021-2025-rebound-and-beyond (accessed on 20 January 2025).
  149. Institute for Energy Economics and Financial Analysis. Global LNG Outlook 2024–2028. Available online: https://www.energy.gov/sites/default/files/2024-06/067.%20IEEFA%2C%20Global%20LNG%20Outlook%202024-2028.pdf (accessed on 1 April 2024).
  150. Central Statistical Office in Poland—Statistical Office in Szczecin, Statistical Yearbook of Maritime Economy. Warszawa, Szczecin 2021, 2022, 2023, 2024. Available online: https://stat.gov.pl/obszary-tematyczne/roczniki-statystyczne/ (accessed on 10 April 2024).
  151. IMO. International Code of Safety for Ships Using Gases or Other Low-Flashpoint Fuels (IGF Code); IMO: London, UK, 2017. [Google Scholar]
  152. ISO 20519; Ships and Marine Technology—Specification for Bunkering of Liquefied Natural Gas. ISO: Geneva, Switzerland, 1917.
  153. IMO MSC/Circ.850; Guidelines for the Prevention of LNG Leakage and Freezing of Equipment. IMO: London, UK, 1998.
  154. IMO MSC.285(86); Interim Guidelines on Safety for Natural Gas-Fueled Engine Installations. IMO: London, UK, 2009.
Figure 1. The area under analysis.
Applsci 15 07118 g001
Figure 2. Mean daily air temperature by selected ports, 1991–2020 [35,36].
Applsci 15 07118 g002
Figure 3. Mean wind speed by selected ports, 2013–2023 [66,67].
Applsci 15 07118 g003
Figure 4. Yearly mean sea level [66].
Applsci 15 07118 g004
Figure 5. Number of stormy days by years [114].
Applsci 15 07118 g005
Figure 6. Temperature anomalies on the seacoast [115].
Applsci 15 07118 g006
Figure 7. Forecast changes in ice severity rate in the Baltic Sea in 2011–2030, taking into consideration changes in regional atmospheric circulation (a); changes in mean air temperature from a level of 2 m above the ground (b); changes in mean air temperature from a level of 700 hPa (c) [132].
Applsci 15 07118 g007
Figure 8. LNG production and demand for LNG bunkering [142,143,144,145,146].
Applsci 15 07118 g008
Figure 9. Total number of ships and forecast number of LNG-powered ships navigating the Baltic Sea [units] [150].
Applsci 15 07118 g009
Table 1. Mean atmospheric pressure by selected ports, 2018–2023 [43].
Gdańsk
[hPa]
Hel
[hPa]
Kołobrzeg
[hPa]
Łeba
[hPa]
Świnoujście
[hPa]
Szczecin
[hPa]
Ustka
[hPa]
January1011.61012.01012.41011.81012.61013.11010.9
February1014.91015.41015.01015.21016.01016.51014.4
March1014.11014.81015.81014.51014.61014.81013.5
April1015.11016.01016.51015.91015.91015.61015.0
May1015.51016.41015.51016.21016.11015.91015.2
June1015.01015.91015.61015.81015.61015.21014.8
July1012.61013.31013.41013.31013.81013.81012.5
August1013.81014.61013.91014.31014.11014.01013.3
September1015.41016.11015.21015.91015.91016.01014.9
October1013.31013.81012.81013.41013.31013.81012.3
November1013.71014.21011.41013.61012.91013.31012.5
December1011.11011.61010.41011.21011.11011.61010.1
Yearly1013.81014.51014.01014.31014.31014.51013.3
Table 2. Mean total yearly precipitation by selected ports, 1991–2020 [35].
PortMean Total Yearly Precipitation [mm/m2]
Łeba661.6
Ustka666.9
Hel598.1
Świnoujście585.1
Szczecin567.0
Kołobrzeg697.6
Gdańsk571.1
Table 3. Mean sunshine duration by selected ports, 2018–2023 [43].
Gdańsk
[h]
Hel
[h]
Kołobrzeg
[h]
Łeba
[h]
Świnoujście
[h]
Szczecin
[h]
Ustka
[h]
January37363839183835
February989487100819483
March165160152170154157158
April241253248269246235261
May277286279312280269317
June323330326334299289344
July266272270300268256298
August246248242266246238261
September204201195207196202198
October127122109126116118109
November49504050294840
December36342930132826
Total2069208520162203194619722129
Table 4. Number of days with mist and fog by selected ports, 2018–2023 [43].
Mist
GdańskHelKołobrzegŁebaŚwinoujścieSzczecinUstka
January20172821262519
February15141713191913
March18161817191915
April108109978
May109101112810
June1291613978
July87711787
August123106854
September9512712116
October17111413191910
November23182120242420
December23182121242219
Total178134182161188173139
Fog
GdańskHelKołobrzegŁebaŚwinoujścieSzczecinUstka
January3122201
February4143233
March2242322
April4247113
May3136335
June31711117
July3019022
August6033021
September6023131
October5123271
November7233351
December4243221
Total49113855213129
Table 5. Mean relative humidity [%] by selected ports, 2017–2023 [43].
GdańskHelKołobrzegŁebaŚwinoujścieSzczecinUstka
January86878887878586
February81838384817982
March75797979777378
April72757775756776
May73767777746777
June74777878756877
July76797881757078
August76808081777377
September77818182797878
October83858484848381
November88878788888785
December88888788898786
Mean79818282807780
Table 6. Extreme heights of the significant wave [m] in position 55°29′ N 018°10′ E [66].
JanuaryFebruaryMarchAprilMayJuneJulyAugustSeptemberOctoberNovemberDecember
20135.23.64.73.53.92.63.32.83.85.24.96.4
20145.03.84.43.03.43.92.23.85.53.52.94.5
20157.34.74.93.43.12.53.62.53.33.35.32.6
20162.42.21.81.31.41.21.53.43.34.45.45.9
20175.64.33.13.73.43.43.42.95.44.44.14.5
20184.53.53.93.62.63.13.23.64.94.73.13.9
20196.43.35.12.43.32.63.62.54.24.03.94.3
20203.94.75.74.32.92.93.32.33.44.84.23.2
20213.33.43.43.13.62.33.84.23.74.34.04.1
20225.25.02.84.42.72.12.83.03.03.22.95.0
20235.16.15.03.82.42.43.95.12.94.95.44.7
Mean4.94.14.13.33.02.63.13.33.94.24.24.5
Table 7. Wind speed [m/s] during the occurrence of extreme heights of the significant wave in position 55°29′ N 018°10′ E [66].
JanuaryFebruaryMarchAprilMayJuneJulyAugustSeptemberOctoberNovemberDecember
2013161315109881013171322
2014151414914129714111415
2015211411111111111213121110
2016111178775121317718
201718151010101291118171413
201813121513911111016171614
20191913151212612915131013
202013151614111312712181717
202111141411111012121615138
2022211610141110101213121117
20231519181497151810171617
Mean161413111010101114151315
Table 8. Distribution [%] of wind directions in position 55°29′ N 018°10′ E while taking measurements of the maximum height of the significant wave [66].
Northerly N
(Sector 315–45°)
Easterly
(Sector 45–135°)
Southerly
(Sector 135–225°)
Westerly
(Sector 225–315°)
201317%8%0%75%
201433%8%8%50%
20158%17%8%67%
20160%8%42%50%
201717%8%25%50%
201817%17%17%50%
201917%8%8%67%
20208%0%8%83%
20210%8%17%75%
20228%0%8%83%
20238%0%25%67%
Mean12%8%15%65%
Table 9. Ice severity rates in the reference period 1971–1990 [132].
Western BalticSouthern BalticGulf of FinlandSea of ÅlandBothnian SeaNorra KvarkenBothnian Bay
Mean1.31.94.32.34.16.27.9
Max5.64.86.65.86.58.09.3
Min0.00.10.80.00.52.95.6
Table 10. Number of ships entering the Polish ports [150].
YearTotal [Units]
202020,690
202124,387
202221,638
202318,735
202420,690
Table 11. General guidelines on meteorological requirements for the bunkering of LNG in the Baltic Sea [151,152,153,154].
Weather Component Boundary ValueValue in the Baltic SeaCompliance with RegulationsRemarks
Wind speedMax. 15–20 m/sMax. 15–20 m/sYesAdditionally: guidelines of the Baltic ports.
Sea stateMax. 3–4 Beaufort scale (wave height 1.25–2.5 m)Max. 3–4 Beaufort scale (wave height 1.25–2.5 m)YesAdditionally: guidelines of the Baltic ports (due to frequent storms and short waves specific to the Baltic).
VisibilityMin. 500 m–1 kmMinimum 500 m–1 kmYesAdditionally: port guidelines.
Air temperatureFrom −20 °C to +35 °CFrom −20 °C to +35 °CYesSpecific to LNG: low temperatures may affect equipment performance and pose a risk of the freezing of valves.
PrecipitationNo heavy rain or snowNo heavy rain or snowYesProvided that the risk of equipment failure and restricted visibility are minimized.
Barometric pressureSteady, no sudden changesSteady, no sudden changesYesSudden changes may affect LNG cryogenic systems and LNG handling operations.
IcingNo icing of equipment or infrastructureNo icing of equipment or infrastructureYesBaltic ports require anti-icing systems for the LNG handling equipment/infrastructure, especially in winter.
HumidityRange: less than 90%Less than 90%YesHigh air humidity in a cold climate may lead to icing and hinder the operation of valves and cryogenic armature.
Mist and fogOperations prohibited at restricted visibility < 500 mOperations prohibited at restricted visibility < 500 mYesStandards for the Baltic ports, considering frequent fog.
Sea currentsMax. 1.5 knMax. 1.5 knYesAdditionally: guidelines of the Baltic ports (strong currents may affect the stability of vessels during the LNG bunkering operation).
Salinity-Mean 7 PSU,
in the Bothnian Bay < 3
Lower than in oceans; the Baltic has a lower salinity than oceans (mean 35 PSU), which affects water qualityAdditionally: guidelines of the Baltic ports.
Sunshine duration-Summer 8–12 h daily, winter
0–3 h
Variable across seasons; highly dependent on the season—very short in winter, long in summerPort guidelines.
Waves-Mean 0.5–2 m, during storms 4–7 mSometimes above standard; values within standard, but during storms may be significantly higher than permitted-
Disclaimer/Publisher’s Note: The statements, opinions and data contained in all publications are solely those of the individual author(s) and contributor(s) and not of MDPI and/or the editor(s). MDPI and/or the editor(s) disclaim responsibility for any injury to people or property resulting from any ideas, methods, instructions or products referred to in the content.

