
Influencing Factors of Solar-Powered Electric Vehicle Charging Stations in Hail City, Saudi Arabia


Abstract
1. Introduction
2. Literature Review
3. Methodology
3.1. Station Demand
- ▪
- EV consumption rate, R: ranged from 0.05 to 0.40 kWh/km in steps of 0.05 kWh/km.
- ▪
- Car BC: varied from 25 to 100 kWh in increments of 5 kWh, reflecting the energy storage capacity of EVs.
- ▪
- CS per station: Ranged from 50 to 500 slots in increments of 50. This indicates the capacity of each charging station in terms of the number of cars it can accommodate.
- ▪
- CP: varied from 20 to 75 kWh in increments of 5 kWh, indicating each charger’s power output.
3.2. PV System
4. Results and Discussion
4.1. Site Spatial Parametric Study
4.2. Charging Stations
4.2.1. Required Station Numbers
4.2.2. Factors Affecting the Number of Stations
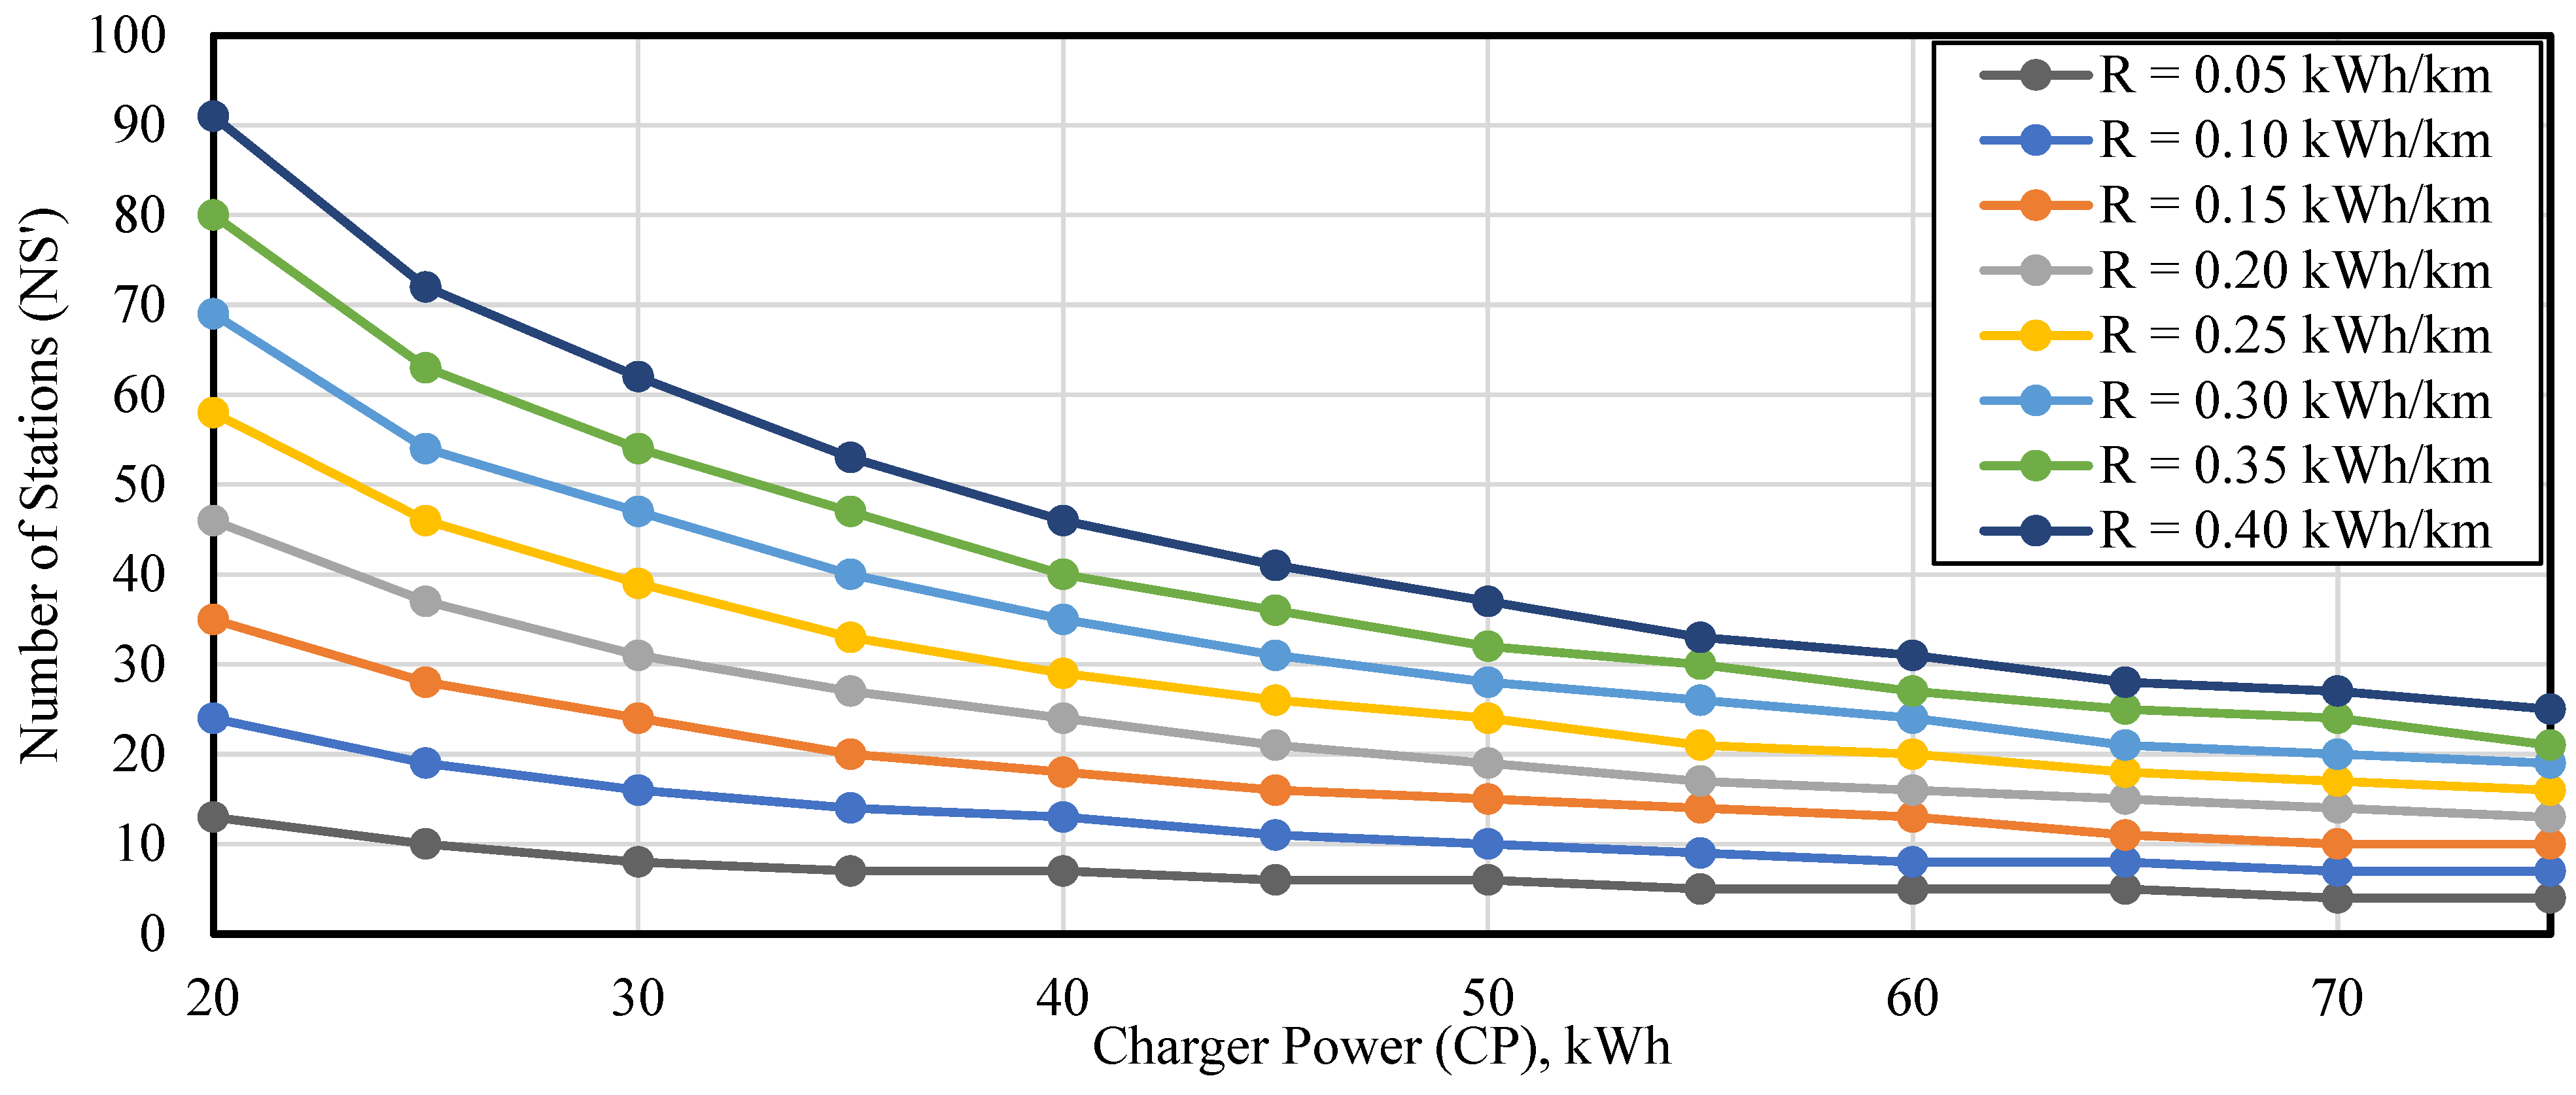
Impact of Average Car Consumption Rate (R) and Charger Power (CP) on Station Numbers
- ▪
- Lowest R = 0.05 kWh/km: At this optimal efficiency level, the NS’ required started at 13 for the lowest CP of 20 kWh. As CP increases, a notable decrease in station requirements is observed. For instance, at CP values of 40 and 45 kWh, the NS’ drops to seven and six, respectively. The highest CP of 75 kWh requires the fewest stations, with only four needed.
- ▪
- Medium R = 0.20 kWh/km: With moderate efficiency, the station requirement escalates noticeably. At a CP of 20 kWh, the NS’ almost quadruples to 46 compared to the lowest R. Even at higher CP levels, such as 60 and 75 kWh, the numbers are significantly higher than in the lowest R scenario, requiring 16 and 13 stations, respectively.
- ▪
- Highest R = 0.40 kWh/km: This scenario demands the most substantial infrastructure and represents the least efficient EVs: the station requirement at a CP of 20 kWh skyrockets to 91. Even at the highest CP of 75 kWh, the requirement remains high at 25 stations, highlighting a more than sixfold increase from the most efficient scenario.
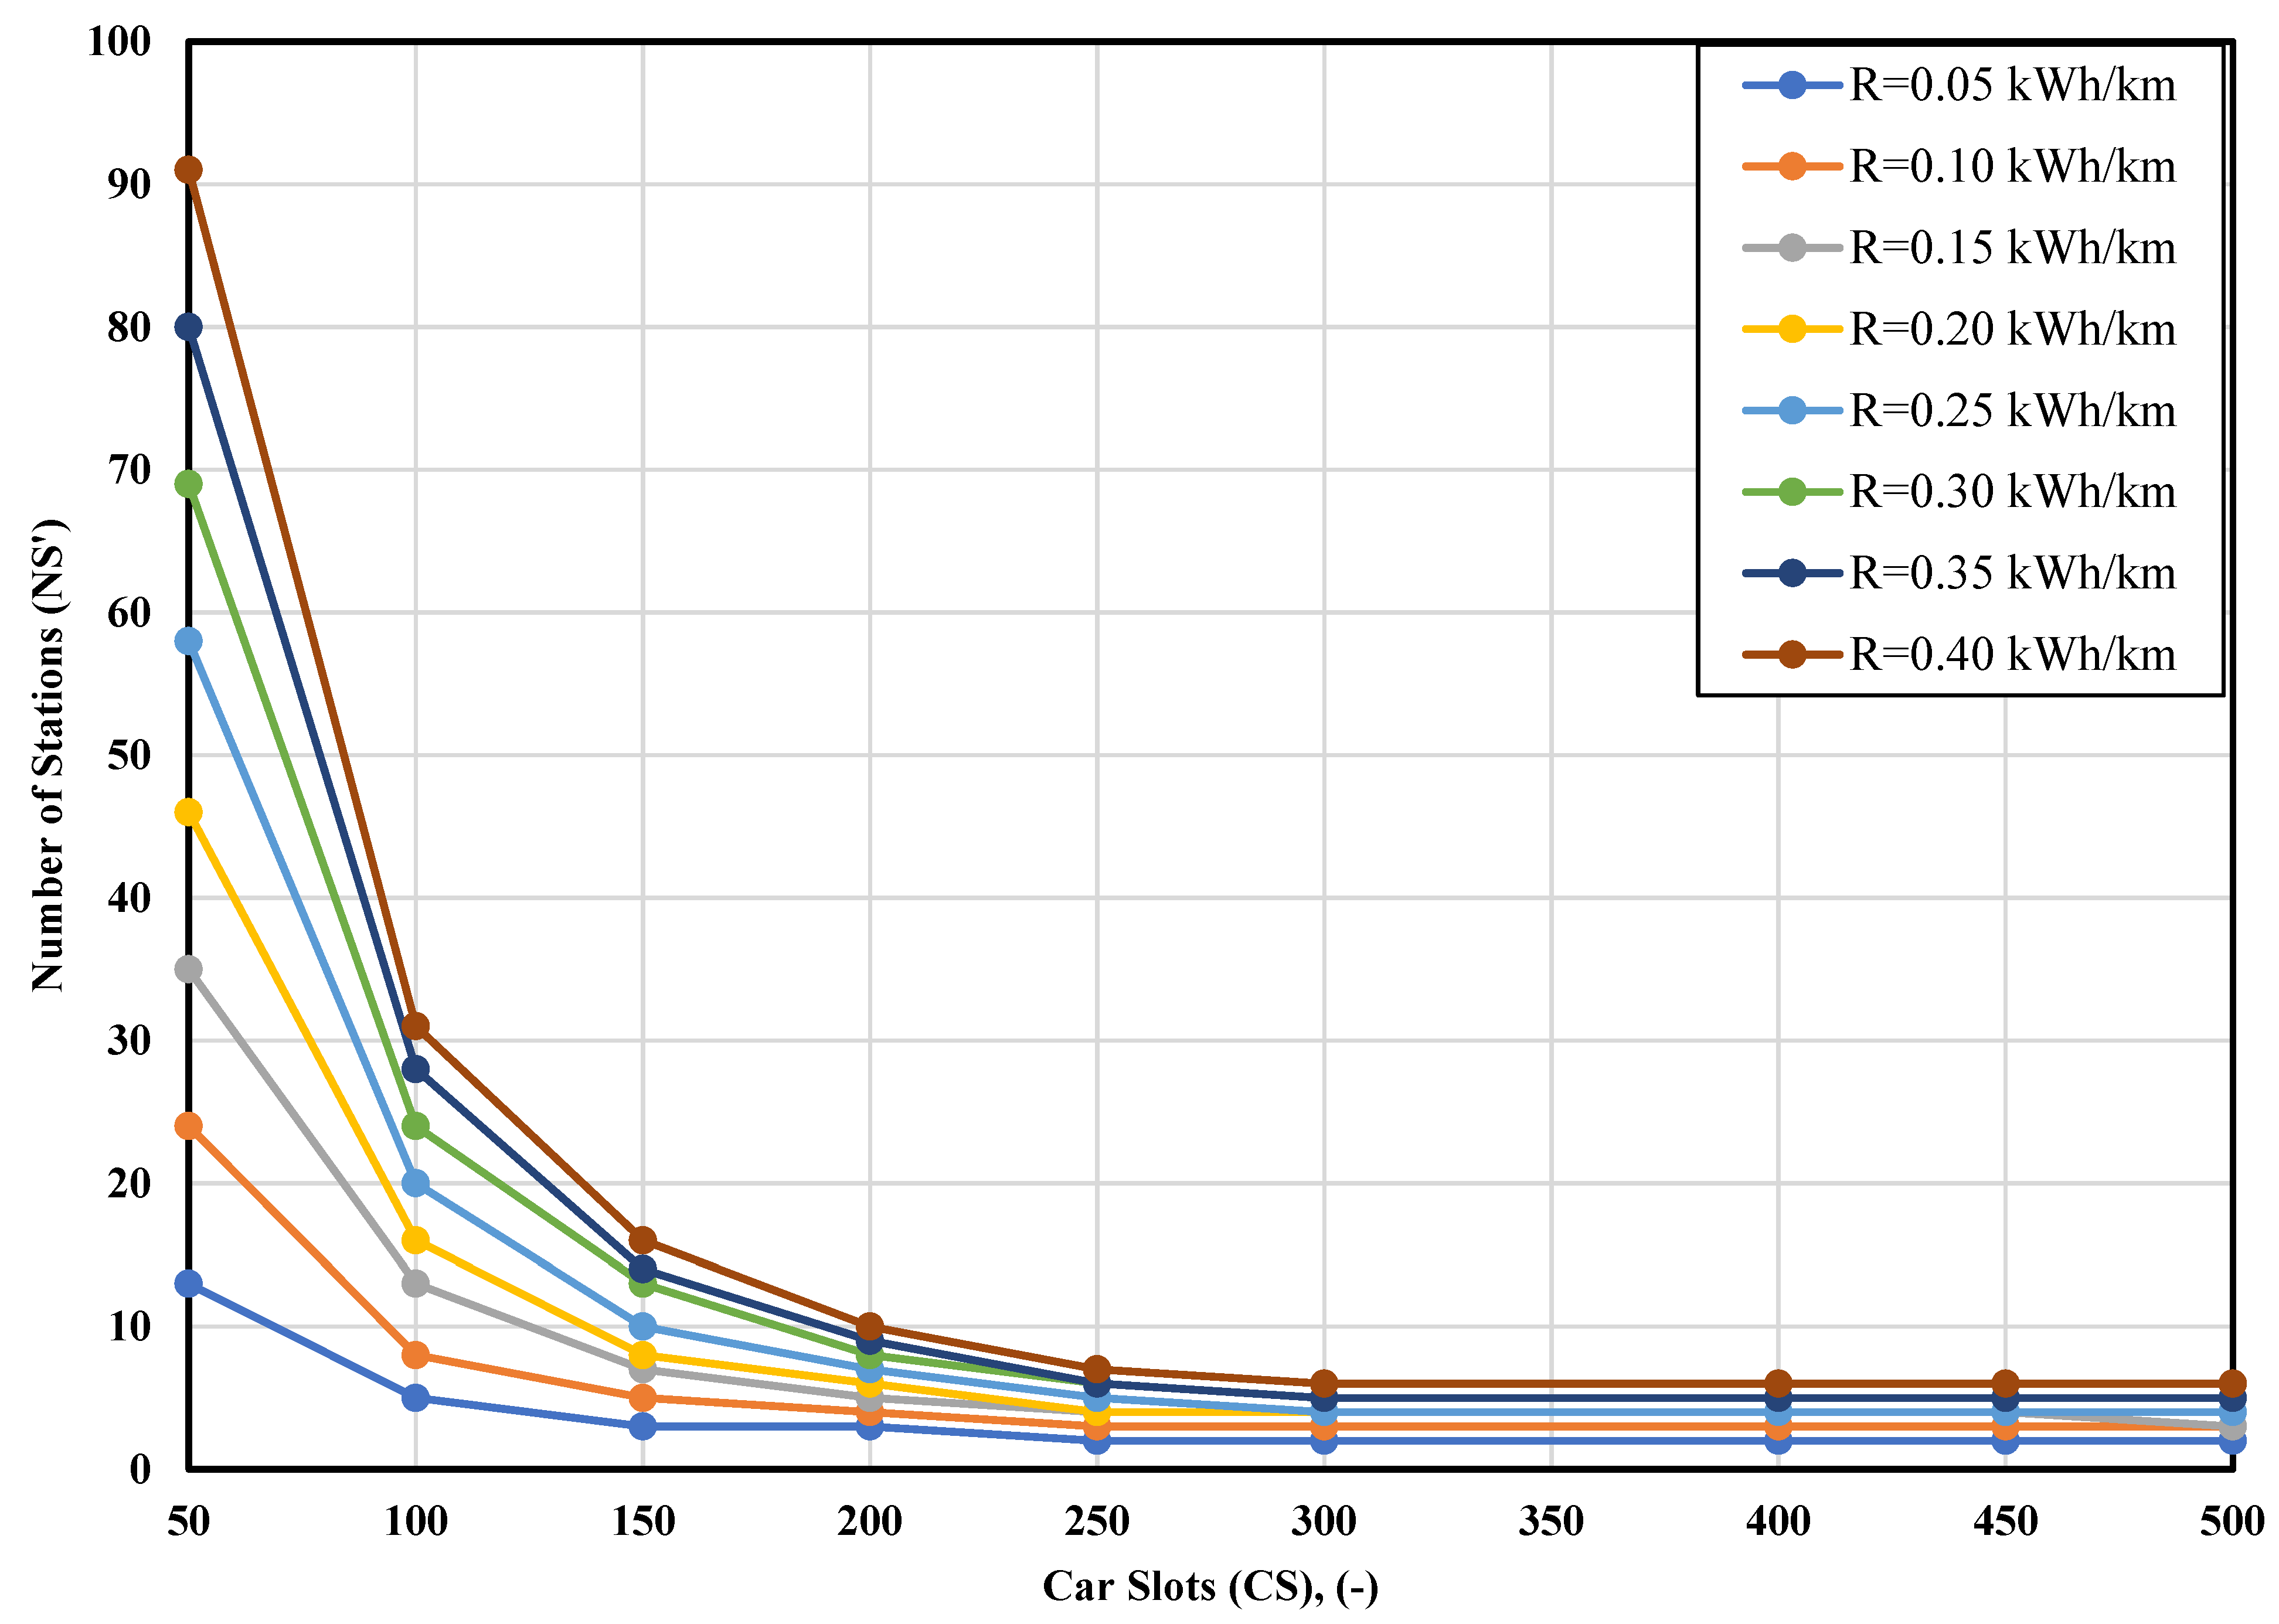
Effects of Car Slots (CSs) per Station and Average Car Consumption Rate (R)
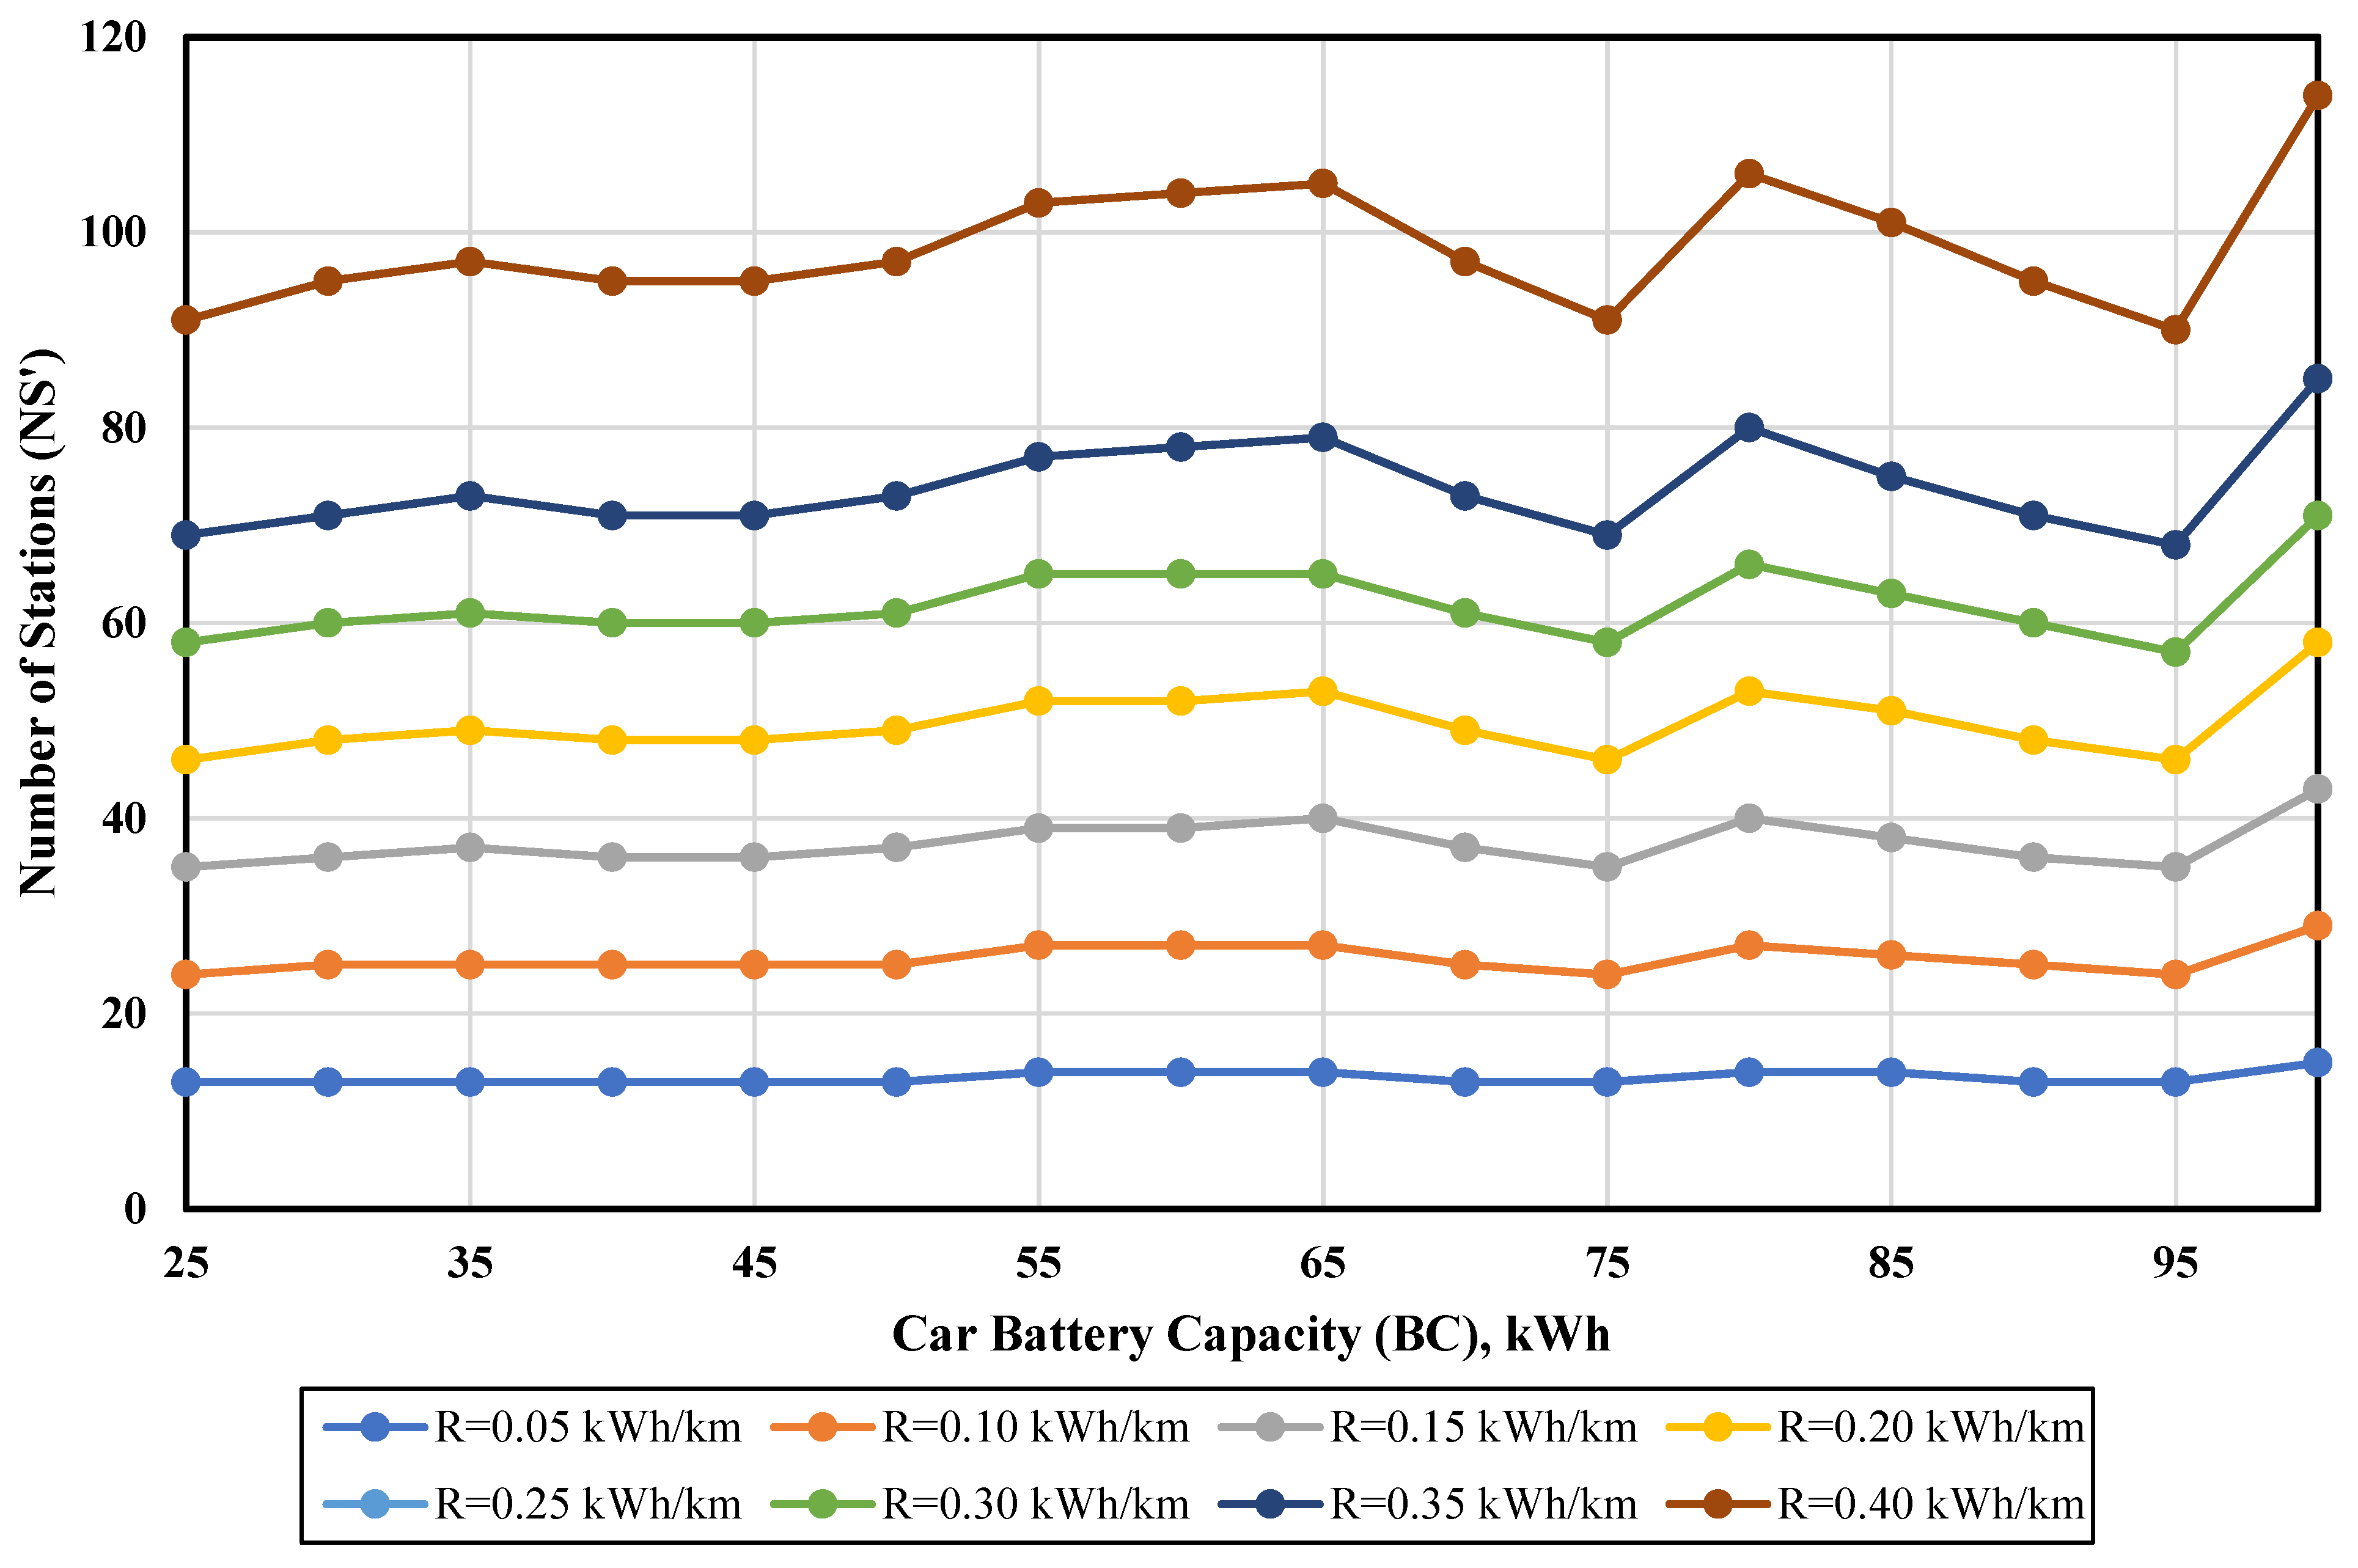
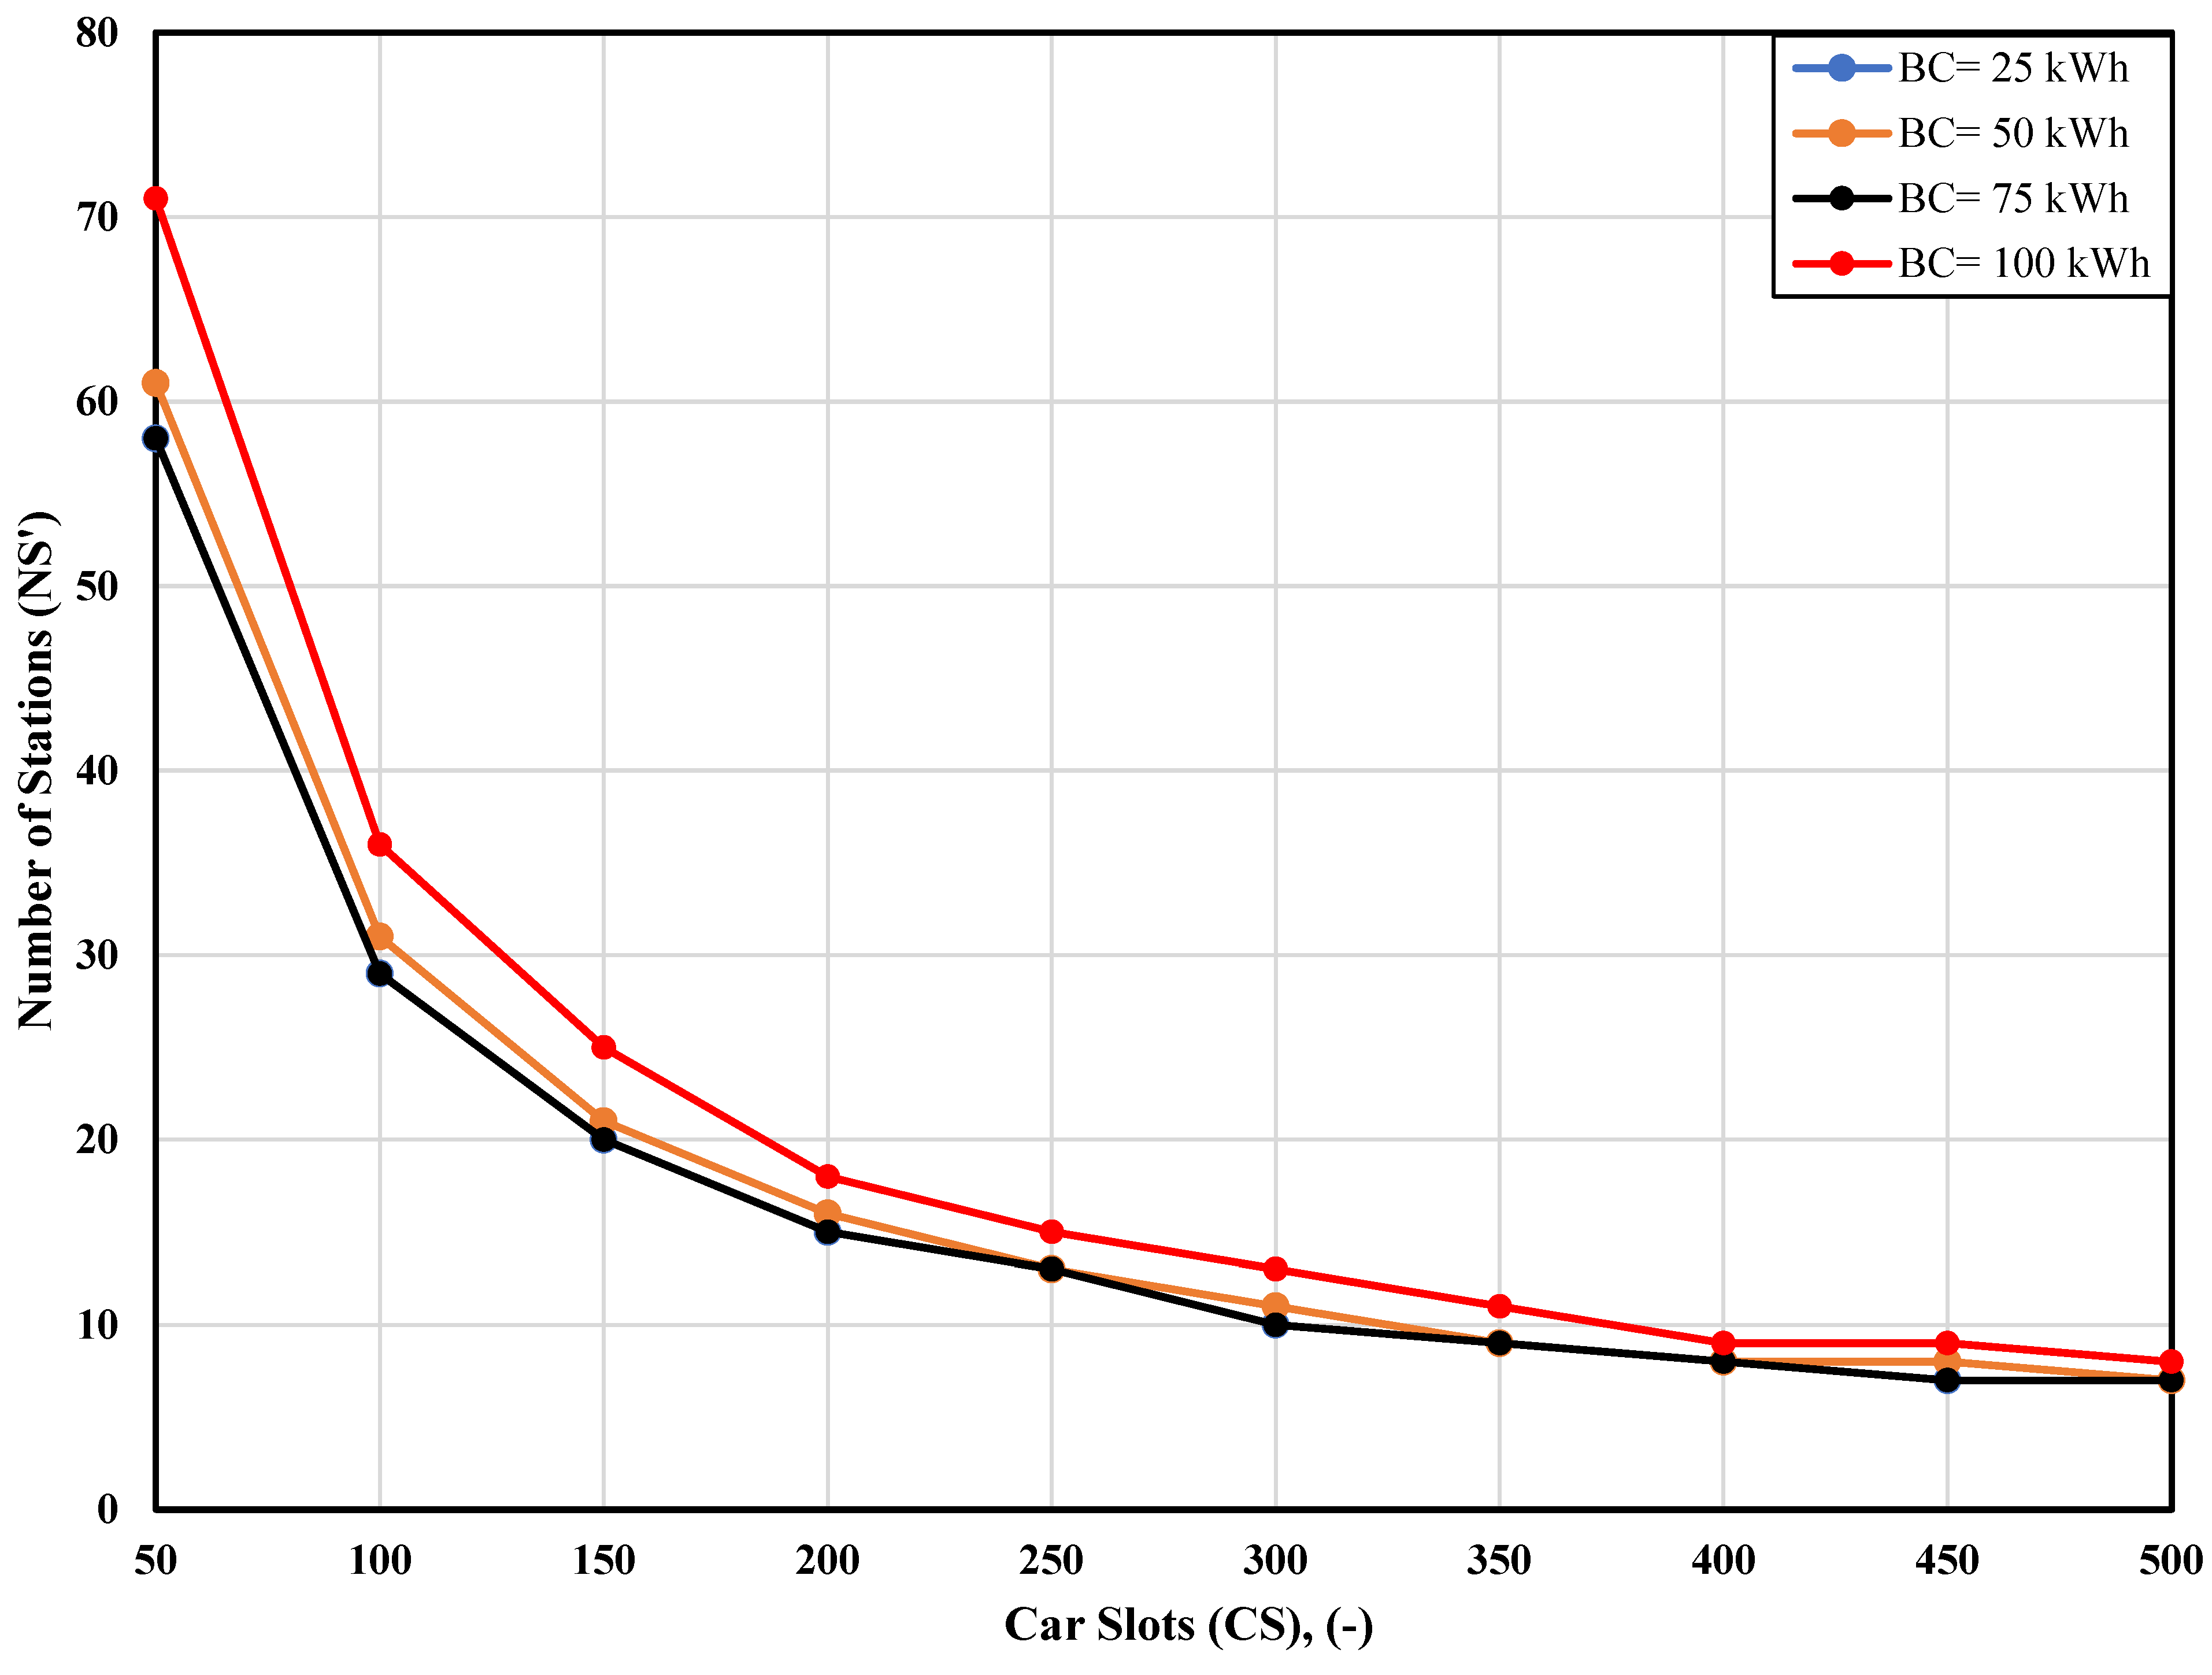
Car Battery Capacity’s Role in Charging Infrastructure Needs
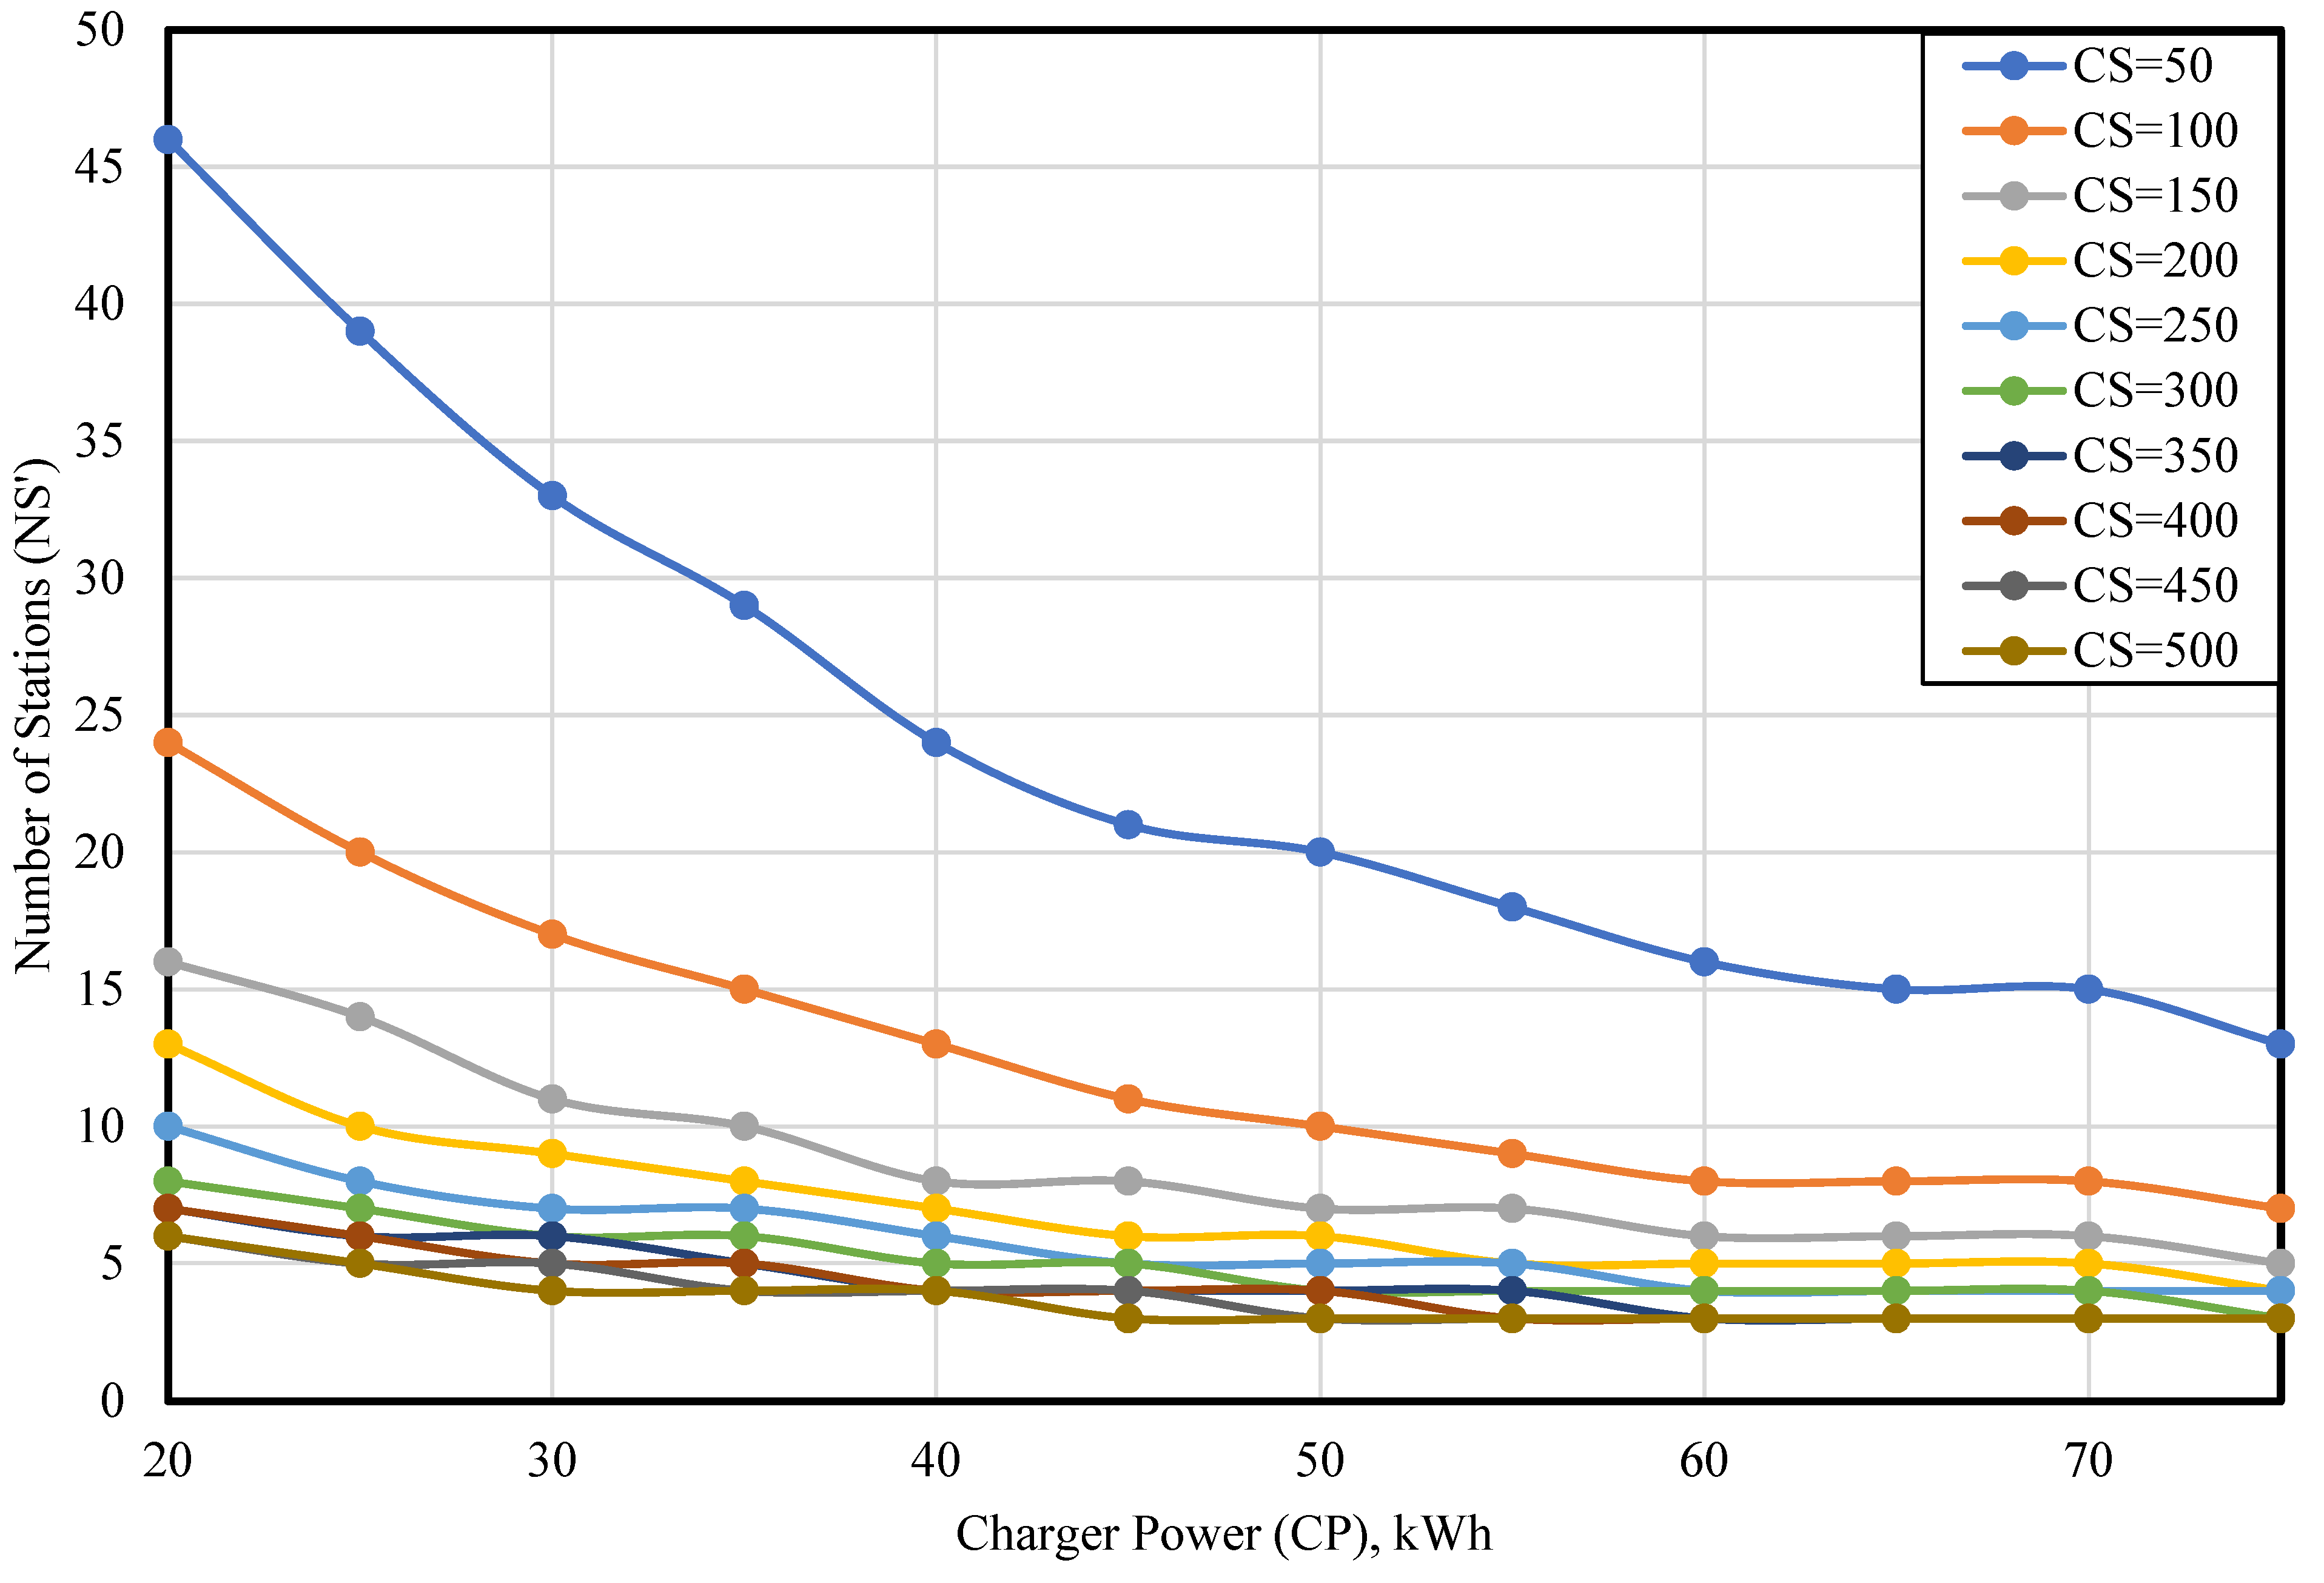
Effect of Car Slots (CSs) per Station and Charger Power (CP) on Station Number
- ▪
- Lower CSs (50 Cars): The station numbers start relatively high at the lowest CSs: 50. For instance, as many as 46 stations are required. As CP increases, station numbers gradually decline. Notably, at the highest CP of 75 kWh, this number drops to 13.
- ▪
- Mid-range CSs (200 to 250 Cars): A marked reduction in the NS’ is observed when the CSs are increased to 200 and 250. For CP values of 20 and 75 kWh, the station requirements decrease to 13 and 4 for CSs = 200 and further down to 10 and 4 for CSs = 250, respectively.
- ▪
- Higher CSs (500 Cars): The number of required stations decreases significantly at the upper limit of CSs (500 cars). Only six stations are needed for a CP of 20 kWh, which remains consistently low across higher CP values, reaching a minimum of three stations for a CP of 75 kWh.
Efficiency Gains from Increasing Car Slots and Battery Capacity
Influence of Charger Power (CP) and Car Battery Capacity (BC)
4.3. Car Battery Profile over 24 H
4.4. Design of PV System
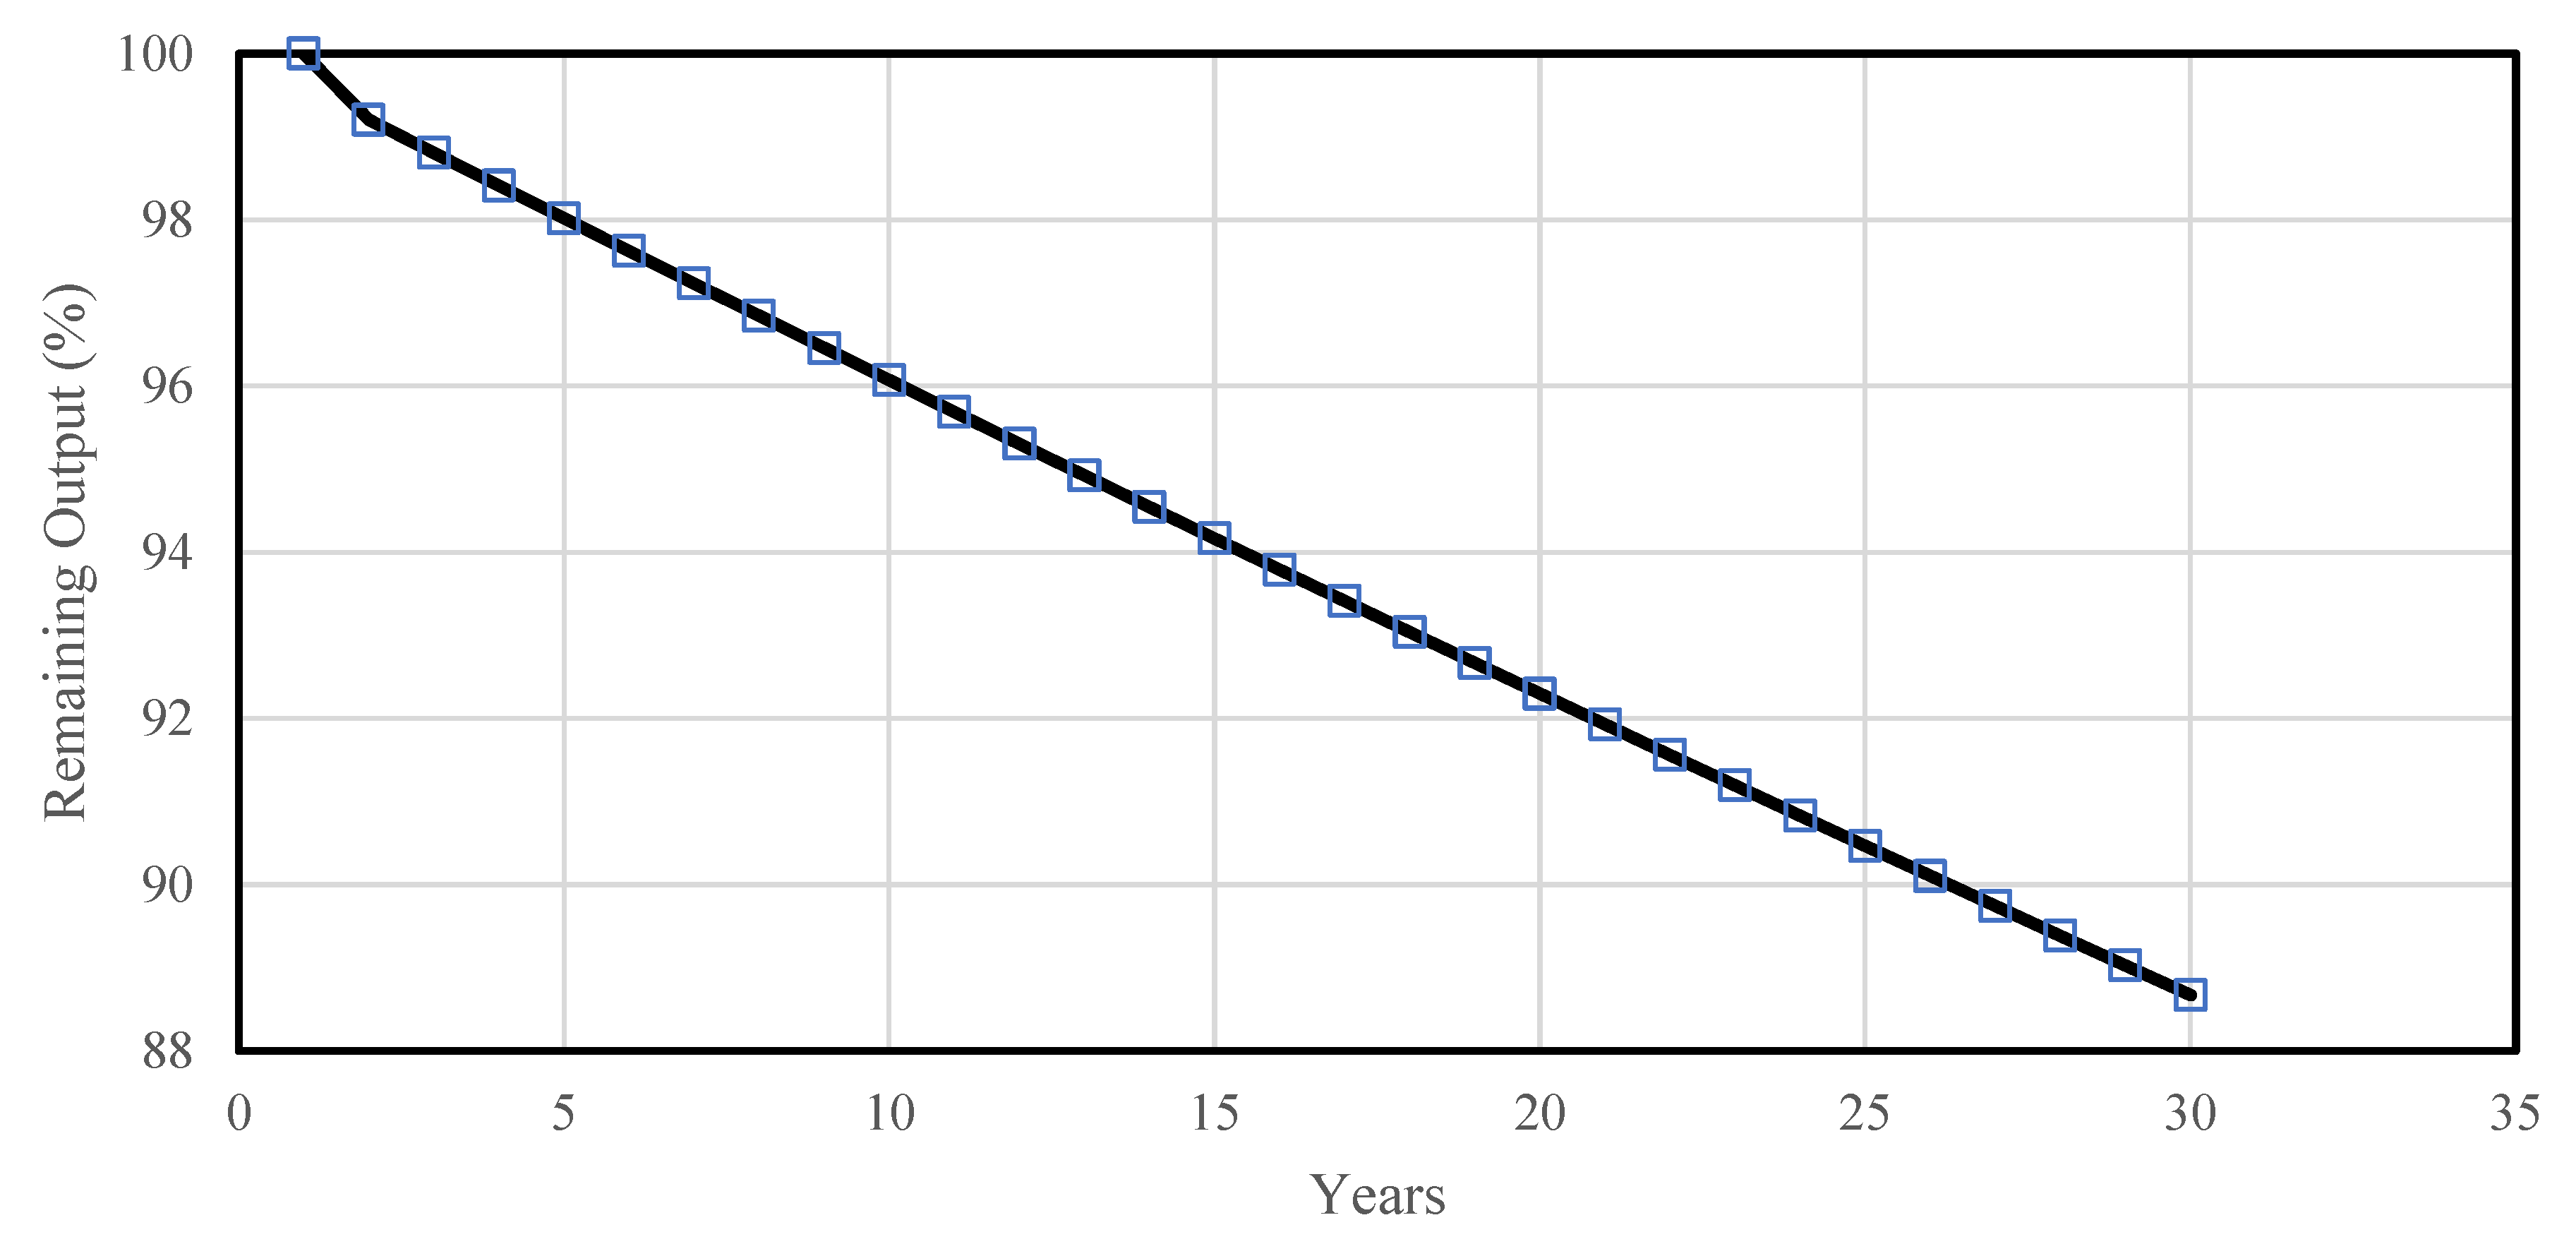
- After 1 year: The efficiency decreases slightly to 99.6% of its original capacity.
- After 10 years: The panels maintain 96.04% of their initial output. This shows a modest decline and suggests that the panels continue to perform robustly a decade into operation.
- After 20 years: The efficiency drops further to 92.19%. This indicates more pronounced wear, but the retaining of a significant portion of the productive capacity.
- After 30 years: The efficiency reaches about 88.07%. This marks a noticeable reduction from the original output, aligning with the standard solar panel longevity and effectiveness expectations.
5. Conclusions and Recommendations
- ❖
- The diminishing returns on increasing car slots become apparent beyond 200 slots, where the NS’ plateaus, suggesting an optimal range for station capacity depending on the average vehicle efficiency in the fleet.
- ❖
- Higher consumption rates generally correspond to a higher number of required stations across most battery capacities, illustrating that less efficient vehicles with higher consumption rates demand a more extensive charging infrastructure.
- ❖
- Increasing the car slots up to 200 leads to an apparent decrease in the required NS’, after which it remains almost constant. On the other hand, the effect of battery capacity on the NS’ required is limited. This confirms that the car slots per station required should be around 200.
- ❖
- Increasing the charger power leads to an apparent decrease in the number of stations, while the effect of the battery capacity on the NS’ required is limited, especially for values of charger power more significant than 30 kWh.
- ❖
- The total annual energy output was 1373.659 MWh, with 1359.12 MWh used for charging EVs. This equates to a higher power consumption rate of 99.8% and a solar fraction of 44.3%.
- ❖
- The system’s efficiency and dependability are demonstrated by its performance measures, which show its output during 30 years of 1960.7 kWh/kWp and a high-performance ratio of 88.7%.
Author Contributions
Funding
Institutional Review Board Statement
Informed Consent Statement
Data Availability Statement
Acknowledgments
Conflicts of Interest
Abbreviations and Symbols
| AC | alternating current |
| BC | battery capacity |
| CP | charger power |
| CS | car slot |
| DC | direct current |
| ESS | energy storage system |
| EV | electric vehicle |
| EVCS | electric vehicle charging station |
| GIS | geographic information system |
| L | average trip length per day |
| NSs | number of stations |
| NS’ | adjusted station number |
| ORS | Open Route Service |
| PV | photovoltaic |
| PVCS | PV-powered charging station |
| R | consumption rate |
| RE | renewable energy |
| RES | renewable energy source |
| STCs | standard test conditions |
References
- EU. Directive (EU) 2018/844 of the European Parliament and of the Council of 30 May 2018 Amending Directive 2010/31/EU on the Energy Performance of Buildings and Directive 2012/27/EU on Energy Efficiency (Text with EEA Relevance), PE/4/2018/REV/1. Off. J. Eur. Union 2018, 156, 75–91. Available online: https://eur-lex.europa.eu/legal-content/EN/TXT/?uri=CELEX%3A32018L0844 (accessed on 16 November 2023).
- Szumska, E.M. Electric Vehicle Charging Infrastructure along Highways in the EU. Energies 2023, 16, 895. [Google Scholar] [CrossRef]
- Paulraj, P. The Netherlands Has the Highest Density of Electric Vehicle Chargers in the World|EOY-2019 EV—EVSE Statistics. 2019. Available online: https://www.emobilitysimplified.com/2019/12/netherlands-highest-density-ev-charging-infrastructure.html (accessed on 7 December 2023).
- Number of Electric Cars in Poland Grows 63% in a Year But Remains Well Below Government Target. 2023. Available online: https://notesfrompoland.com/2023/02/18/number-of-electric-cars-in-poland-grows-63-in-a-year-but-remains-well-below-government-target/ (accessed on 7 December 2023).
- Almasri, R.A.; Alharbi, T.; Alshitawi, M.S.; Alrumayh, O.; Ajib, S. Related Work and Motivation for Electric Vehicle Solar/Wind Charging Stations: A Review. World Electr. Veh. J. 2024, 15, 215. [Google Scholar] [CrossRef]
- Barman, P.; Dutta, L.; Bordoloi, S.; Kalita, A.; Buragohain, P.; Bharali, S.; Azzopardi, B. Renewable energy integration with electric vehicle technology: A review of the existing smart charging approaches. Renew. Sustain. Energy Rev. 2023, 183, 113518. [Google Scholar] [CrossRef]
- Seddig, K.; Jochem, P.; Fichtner, W. Two-stage stochastic optimization for cost-minimal charging of electric vehicles at public charging stations with photovoltaics. Appl. Energy 2019, 242, 769–781. [Google Scholar] [CrossRef]
- Taghizad-Tavana, K.; Alizadeh, A.; Ghanbari-Ghalehjoughi, M.; Nojavan, S. A Comprehensive Review of Electric Vehicles in Energy Systems: Integration with Renewable Energy Sources, Charging Levels, Different Types, and Standards. Energies 2023, 16, 630. [Google Scholar] [CrossRef]
- Sinha, P.; Paul, K.; Deb, S.; Sachan, S. Comprehensive Review Based on the Impact of Integrating Electric Vehicle and Renewable Energy Sources to the Grid. Energies 2023, 16, 2924. [Google Scholar] [CrossRef]
- Enescu, F.M.; Birleanu, F.G.; Raboaca, M.S.; Raceanu, M.; Bizon, N.; Thounthong, P. Electric Vehicle Charging Station Based on Photovoltaic Energy with or without the Support of a Fuel Cell–Electrolyzer Unit. Energies 2023, 16, 762. [Google Scholar] [CrossRef]
- Bhatti, A.R.; Salam, Z.; Aziz, M.J.B.A.; Yee, K.P.; Ashique, R.H. Electric vehicles charging using photovoltaic: Status and technological review. Renew. Sustain. Energy Rev. 2016, 54, 34–47. [Google Scholar] [CrossRef]
- Tran, V.T.; Islam, R.; Muttaqi, K.M.; Sutanto, D. An Efficient Energy Management Approach for a Solar-Powered EV Battery Charging Facility to Support Distribution Grids. IEEE Trans. Ind. Appl. 2019, 55, 6517–6526. [Google Scholar] [CrossRef]
- Krishnan Nair, D.; Prasad, K.; Lie, T.T. Design of a PV-fed electric vehicle charging station with a combination of droop and master-slave control strategy. Energy Storage 2023, 5, e442. [Google Scholar] [CrossRef]
- Atawi, I.E.; Hendawi, E.; Zaid, S.A. Analysis and Design of a Standalone Electric Vehicle Charging Station Supplied by Photovoltaic Energy. Processes 2021, 9, 1246. [Google Scholar] [CrossRef]
- Shariff, S.M.; Alam, M.S.; Ahmad, F.; Rafat, Y.; Asghar, M.S.J.; Khan, S. System Design and Realization of a Solar-Powered Electric Vehicle Charging Station. IEEE Syst. J. 2020, 14, 2748–2758. [Google Scholar] [CrossRef]
- Fachrizal, R.; Munkhammar, J. Improved Photovoltaic Self-Consumption in Residential Buildings with Distributed and Centralized Smart Charging of Electric Vehicles. Energies 2020, 13, 1153. [Google Scholar] [CrossRef]
- Umair, M.; Hidayat, N.M.; Sukri Ahmad, A.; Nik Ali, N.H.; Mawardi, M.M.; Abdullah, E. A renewable approach to electric vehicle charging through solar energy storage. PLoS ONE 2024, 19, e0297376. [Google Scholar] [CrossRef]
- Shin, M.; Choi, D.H.; Kim, J. Cooperative Management for PV/ESS-Enabled Electric Vehicle Charging Stations: A Multiagent Deep Reinforcement Learning Approach. IEEE Trans. Ind. Inform. 2020, 16, 3493–3503. [Google Scholar] [CrossRef]
- Chaudhari, K.; Ukil, A.; Kumar, K.N.; Manandhar, U.; Kollimalla, S.K. Hybrid Optimization for Economic Deployment of ESS in PV-Integrated EV Charging Stations. IEEE Trans. Ind. Inform. 2018, 14, 106–116. [Google Scholar] [CrossRef]
- Ji, D.; Lv, M.; Yang, J.; Yi, W. Optimizing the Locations and Sizes of Solar Assisted Electric Vehicle Charging Stations in an Urban Area. IEEE Access 2020, 8, 112772–112782. [Google Scholar] [CrossRef]
- Zhang, J.; Zhang, Y.; Li, T.; Jiang, L.; Li, K.; Yin, H.; Ma, C. A Hierarchical Distributed Energy Management for Multiple PV-Based EV Charging Stations. In Proceedings of the IECON 2018—44th Annual Conference of the IEEE Industrial Electronics Society, Washington, DC, USA, 21–23 October 2018. [Google Scholar]
- Feizi, M.R.; Khodayar, M.E.; Chen, B. Feasible Dispatch Limits of PV Generation With Uncertain Interconnection of EVs in the Unbalanced Distribution Network. IEEE Trans. Veh. Technol. 2022, 71, 2267–2280. [Google Scholar] [CrossRef]
- Alrubaie, A.J.; Salem, M.; Yahya, K.; Mohamed, M.; Kamarol, M. A Comprehensive Review of Electric Vehicle Charging Stations with Solar Photovoltaic System Considering Market, Technical Requirements, Network Implications, and Future Challenges. Sustainability 2023, 15, 8122. [Google Scholar] [CrossRef]
- Funke, S.Á.; Sprei, F.; Gnann, T.; Plötz, P. How much charging infrastructure do electric vehicles need? A review of the evidence and international comparison. Transp. Res. Part D Transp. Environ. 2019, 77, 224–242. [Google Scholar] [CrossRef]
- Stańczyk, T.L.; Hyb, L. Technological and organisational challenges for e-mobility. Arch. Automot. Eng. Arch. Motoryz. 2019, 84, 57–70. [Google Scholar] [CrossRef]
- Stoma, M.; Dudziak, A. Future Challenges of the Electric Vehicle Market Perceived by Individual Drivers from Eastern Poland. Energies 2023, 16, 7212. [Google Scholar] [CrossRef]
- Halbey, J.; Kowalewski, S.; Ziefle, M. Going on a Road-Trip with My Electric Car: Acceptance Criteria for Long-Distance-Use of Electric Vehicles. In Design, User Experience, and Usability: Interactive Experience Design; Springer International Publishing: Cham, Switzerland, 2015. [Google Scholar]
- Almutairi, A. Plug-in electric vehicles and their impact on power generation availability: A real survey-based analysis in Saudi Arabia. Sustain. Cities Soc. 2021, 75, 103389. [Google Scholar] [CrossRef]
- Bailey, J.; Miele, A.; Axsen, J. Is awareness of public charging associated with consumer interest in plug-in electric vehicles? Transp. Res. Part D Transp. Environ. 2015, 36, 1–9. [Google Scholar] [CrossRef]
- Sheldon, T.L.; Dua, R. Assessing the effectiveness of California’s “Replace Your Ride”. Energy Policy 2019, 132, 318–323. [Google Scholar] [CrossRef]
- Al-fouzan, A.A.; Almasri, R.A. Indicators of Potential Use of Electric Vehicles in Urban Areas: A Real-Life Survey-Based Study in Hail, Saudi Arabia. World Electr. Veh. J. 2024, 15, 22. [Google Scholar] [CrossRef]
- Xu, R.; Seatle, M.; Kennedy, C.; McPherson, M. Flexible electric vehicle charging and its role in variable renewable energy integration. Environ. Syst. Res. 2023, 12, 11. [Google Scholar] [CrossRef]
- Osório, G.J.; Gough, M.; Lotfi, M.; Santos, S.F.; Espassandim, H.M.; Shafie-Khah, M.; Catalão, J.P. Rooftop photovoltaic parking lots to support electric vehicles charging: A comprehensive survey. Int. J. Electr. Power Energy Syst. 2021, 133, 107274. [Google Scholar] [CrossRef]
- Tripathi, A.K.; Lakshmi, G.S.; Mishra, H.; Chapala, S.; Alwetaishi, M.; Atamurotov, F.; Benti, N.E.; Sura, S.; Saleel, C.A. Integration of Solar PV Panels in Electric Vehicle Charging Infrastructure: Benefits, Challenges, and Environmental Implications. Energy Sci. Eng. 2025, 13, 2135–2152. [Google Scholar] [CrossRef]
- Etukudoh, E.A.; Hamdan, A.; Ilojianya, V.I.; Daudu, C.D.; Fabuyide, A. Electric Vehicle Charging Infrastructure: A Comparative Review in Canada, USA, and Africa. Eng. Sci. Technol. J. 2024, 5, 245–258. [Google Scholar] [CrossRef]
- Singh, A.R.; Vishnuram, P.; Alagarsamy, S.; Bajaj, M.; Blazek, V.; Damaj, I.; Rathore, R.S.; Al-Wesabi, F.N.; Othman, K.M. Electric vehicle charging technologies, infrastructure expansion, grid integration strategies, and their role in promoting sustainable e-mobility. Alex. Eng. J. 2024, 105, 300–330. [Google Scholar] [CrossRef]
- Güven, A.F.; Ateş, N.; Alotaibi, S.; Alzahrani, T.; Amsal, A.M.; Elsayed, S.K. Sustainable hybrid systems for electric vehicle charging infrastructures in regional applications. Sci. Rep. 2025, 15, 4199. [Google Scholar] [CrossRef]
- Chen, X.-P.; Jiang, X.; Yu, X.-C.; Hao, P.; Xie, B.-C. What factors affect the development of public charging infrastructures? A study from the perspective of potential users. Front. Energy Res. 2024, 12, 1257121. [Google Scholar]
- Nogueira, T.; Sousa, E.; Alves, G.R. Electric vehicles growth until 2030: Impact on the distribution network power. Energy Rep. 2022, 8, 145–152. [Google Scholar] [CrossRef]
- Gnann, T.; Funke, S.; Jakobsson, N.; Plötz, P.; Sprei, F.; Bennehag, A. Fast charging infrastructure for electric vehicles: Today’s situation and future needs. Transp. Res. Part D Transp. Environ. 2018, 62, 314–329. [Google Scholar] [CrossRef]
- Al-fouzan, A.A.; Almasri, R.A. A Sustainable Solution for Urban Transport Using Photovoltaic Electric Vehicle Charging Stations: A Case Study of the City of Hail in Saudi Arabia. Appl. Sci. 2024, 14, 5422. [Google Scholar] [CrossRef]
- United Nations Human Settlements Programme. Future Saudi Cities Program: The Comprehensive Urban Vision for Hail City; United Nations Human Settlements Programme: Nairobi, Kenya, 2020. [Google Scholar]
- Al-Anazi, M.A.; Almasri, R.A. Evaluation of potential capabilities of energy savings and utilization of solar energy in mosques in Hail city, Kingdom of Saudi Arabia. Energy Explor. Exploit. 2023, 41, 1051–1084. [Google Scholar] [CrossRef]
- Jinko Solar, 78HL4-BDV, 625-650 Watt, Bifacial Module with Dual Glass, N-Type. 2022. Available online: https://jinkosolarcdn.shwebspace.com/uploads/JKM625-650N-78HL4-BDV-F9-EN.pdf (accessed on 20 September 2024).
- Argaam. Saudi Statistics Authority: 3.3 Million Saudi Families Own Cars, 65% of Which Own a Single Car. 2023. Available online: https://www.argaam.com/ar/article/articledetail/id/530080 (accessed on 1 April 2024).
- Tawab, O.A. Learn About Car Numbers in Saudi Arabia Between 2019 and 2022 and Ownership Rates. 2023. Available online: https://www.assayyarat.com/%D8%AA%D8%B9%D8%B1%D9%81%D9%88%D8%A7-%D8%B9%D9%84%D9%89-%D8%A3%D8%B9%D8%AF%D8%A7%D8%AF-%D8%A7%D9%84%D8%B3%D9%8A%D8%A7%D8%B1%D8%A7%D8%AA-%D9%81%D9%8A-%D8%A7%D9%84%D8%B3%D8%B9%D9%88%D8%AF%D9%8A%D8%A9/ (accessed on 1 April 2024).
- Leaf, N. Electric Family Car Nissan. 2023. Available online: https://www.nissan.co.uk/vehicles/new-vehicles/leaf.html (accessed on 12 May 2024).
- GoodWe GW100K-HT. 2024. Available online: https://www.greenessencelebanon.com/store/items/217/GoodWe-GW100K-HT--------- (accessed on 20 September 2024).


| Step | Calculation Method | Equation |
|---|---|---|
| Utilizing Google Earth to understand the geographic extent. | N/A |
| Multiplying the area (A) by the average population density (D) as per [42]. | |
| Survey data were used to calculate a weighted average of family sizes as per [42]. | |
| Dividing the entire population (P) by the typical family size (M). | |
| Utilizing survey data on car ownership to calculate a weighted average per the questionnaire. | |
| Multiplying the number of families overall (F) by the typical car ownership (O). | |
| Multiplying the total number of cars (C) by the conversion percentage to EVs (T). | |
| Survey data will be used to calculate a weighted average of trip lengths as per the questionnaire. | |
| Multiplying the EV consumption rate (R) by (L). | |
| Dividing the average car battery capacity (BC) by the daily CBC. | |
| Dividing BC by the charger power (CP). | |
| Dividing the operational hours by the hours needed for a full charge (HF). | |
| Multiplying the number of car slots (CSs) by the number of complete charging cycles (Nf). | |
| Multiplying the station capacity per day (SD) by the average recharging days (RDs). | |
| Dividing the expected number of EVs (E) by the station capacity (SC). | |
| Increasing the number of stations (NS) by 10% to account for maintenance. |
| PV Panel Type | N-type Mono-Crystalline |
|---|---|
| Maximum power at STC (W) | 630 Wp |
| Module efficiency (%) | 22.54% |
| PTC power rating (W) | 474 |
| Optimum operating current (Imp) | 13.69 A |
| Optimum operating voltage (Vmp) | 46.02 V |
| Short-circuit current (Isc) | 14.39 A |
| Open-circuit voltage (Voc) | 55.85 V |
| Nominal operating cell temperature (NOCT) (°C) | 45–85 |
| North to north Shortest distance (black) = 16.00 km Shortest period (red) = 0.335 h |  |
| North to middle Shortest distance (black) = 24.73 km Shortest period (red) = 0.444 h |  |
| Middle to middle Shortest distance (black) = 9.581 km Shortest period (red) = 0.164 h |  |
| Southern to northern Shortest distance (black) = 37.77 km Shortest period (red) = 0.564 h |  |
| Southern to middle Shortest distance (black) = 16 km Shortest period (red) = 0.324 h | 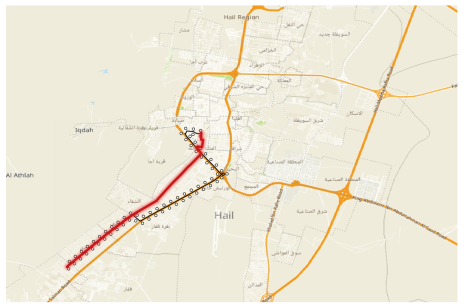 |
| Southern to southern Shortest distance (black) = 19.35 km Shortest period (red) = 0.291 h |  |
| Share of Private Charging (%) | 0 | 20 | 40 | 60 |
|---|---|---|---|---|
| Zone 4 | 7 | 6 | 5 | 4 |
| Zone 6 | 6 | 5 | 4 | 3 |
| Zone 7 | 6 | 5 | 4 | 3 |
| Zone 8 | 5 | 4 | 3 | 3 |
| Zone 9 | 3 | 2 | 2 | 2 |
| Variable Parameter | Value | Description |
|---|---|---|
| Vehicle type | Sedan, truck, and bus | Different vehicle categories. |
| Car battery capacity, BC (kWh) | Compact car (25, 50), sedan (75), and luxury SUV (100) | Varying battery capacities for each vehicle type [47]. |
| Charging requirement (kW) | 7, 15, and 25 | Maximum charging rates for vehicles. |
| Consumption rate, R (kWh/km) | 0.05 to 0.40 | Energy consumption per kilometer. |
| Charging probability | Varies hourly (0.05 to 0.9) | Probability of vehicle charging at each hour. |
| Area Overview | Total Surface Area (m2) | Quantity of Modules |
|---|---|---|
| Carport 01 | 523.6 | 44 × 2 × 2 = 176 |
| Carport 02 | 255.9 | 43 × 2 = 86 |
| Carport 03 | 238.0 | 80 × 1 = 80 |
| Carport 04 | 238.0 | 80 × 1 = 80 |
| Carport 05 | 426.0 | 80 × 2 = 160 |
| Carport 06 | 1204.9 | 135 × 3 = 405 |
| Carport 07 | 321.9 | 125 × 1 = 125 |
| Total combined PV module area | 3108.2 | 1112 |
| Number of PV Modules | 1112 | |
|---|---|---|
| PV generator output | 1112 × 0.630 = 700.56 | kWp |
| PV generator surface | 3308.2 | m2 |
| Number of inverters [48] | 6 GW100K-HT × 100 | kW |
| No. of vehicles | Up to 2400 * | EV/day e-Charge |
| Global radiation—horizontal, kWh/m2 | 2221 |
| Deviation from the standard spectrum, kWh/m2 | −22.21 |
| Ground reflection (albedo), kWh/m2 | 3.34 |
| Orientation and inclination of the module surface, kWh/m2 | 8.08 |
| Global radiation at the module, kWh/m2 | 2210 |
| Available solar energy, 2210 kWh/m2 × 3108.4 m2 = 6,869,564 kWh | |
| STC conversion (rated efficiency of module, 22.54%), MWh | −5322.052 |
| Rated PV electricity, MWh | 1548.340 |
| Low-light performance, kWh | 7702 |
| Deviation from the nominal module temperature, kWh | −103,840 |
| Diodes, kWh | −7262 |
| Mismatch (manufacturer information), kWh | −28,902 |
| Mismatch (configuration/shading), kWh | −5746 |
| PV energy (DC) without inverter down-regulation, MWh | 1410.455 |
| Down-regulation on account of max. AC power/cos phi, kWh | −480 |
| MPP matching, kWh | −2138 |
| PV electricity (DC) (energy at the inverter input), MWh | 1407.837 |
| Input voltage deviates from the rated voltage, kWh | −1989 |
| DC/AC conversion, kWh | −32,189 |
| Standby consumption (inverter), kWh | −107 |
| Total cable losses, kWh | 0.00 |
| PV energy (AC) minus standby use, MWh | 1373.659 |
| PV Generator energy (AC grid), MWh | 1373.552 |
| Charge at beginning, kWh | 54,000 | 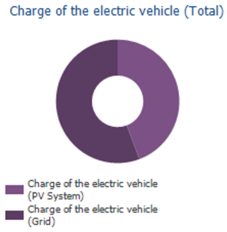 |
| 3069.628 | |
| 1359.120 | |
| Charge of the EV (grid), MWh/year | 1710.508 | |
| Losses due to charging/discharging, kWh/year | 276,925 | |
| Losses in battery, kWh/year | 218,703 | |
| Consumption due to kilometers driven, MWh | 2628.000 | |
| Mileage per year, km | 10,950,000 | |
| Mileage per year from PV, km | 4,848,262 |
| Start of operation of the system | 10/4/2025 |
| PV generator output, kWp | 700.56 |
| Assessment period, years | 30 |
| Interest on capital (%) | 1 |
| PV generator energy (AC grid), MWh/year | 1373.659 |
| Direct own use, kWh/year | 11,838 |
| Charge of the EV, MWh/year | 1359.120 |
| Grid feed-in, kWh/year | 2700 |
| Auxiliary electricity consumption (annual), kWh/year | 25,500 |
| Own power consumption (%) | 99.80 |
| Solar fraction (%) | 44.30 |
| Yield factor, kWh/kWp | 1961 |
| PR (%) | 88.70 |
| Yield reduction due to shading, %/Year | 0.3 |
| CO₂ emissions avoided, kg/year | 645,569 |
Disclaimer/Publisher’s Note: The statements, opinions and data contained in all publications are solely those of the individual author(s) and contributor(s) and not of MDPI and/or the editor(s). MDPI and/or the editor(s) disclaim responsibility for any injury to people or property resulting from any ideas, methods, instructions or products referred to in the content. |
© 2025 by the authors. Licensee MDPI, Basel, Switzerland. This article is an open access article distributed under the terms and conditions of the Creative Commons Attribution (CC BY) license (https://creativecommons.org/licenses/by/4.0/).
Share and Cite
Al-fouzan, A.A.; Almasri, R.A. Influencing Factors of Solar-Powered Electric Vehicle Charging Stations in Hail City, Saudi Arabia. Appl. Sci. 2025, 15, 7108. https://doi.org/10.3390/app15137108
Al-fouzan AA, Almasri RA. Influencing Factors of Solar-Powered Electric Vehicle Charging Stations in Hail City, Saudi Arabia. Applied Sciences. 2025; 15(13):7108. https://doi.org/10.3390/app15137108
Chicago/Turabian StyleAl-fouzan, Abdulmohsen A., and Radwan A. Almasri. 2025. "Influencing Factors of Solar-Powered Electric Vehicle Charging Stations in Hail City, Saudi Arabia" Applied Sciences 15, no. 13: 7108. https://doi.org/10.3390/app15137108
APA StyleAl-fouzan, A. A., & Almasri, R. A. (2025). Influencing Factors of Solar-Powered Electric Vehicle Charging Stations in Hail City, Saudi Arabia. Applied Sciences, 15(13), 7108. https://doi.org/10.3390/app15137108