Article

A Gamified AI-Driven System for Depression Monitoring and Management

1
Department of Computer Science and Software Engineering, Auckland University of Technology, Auckland 1010, New Zealand
2
Department of Computer Engineering, Amirkabir University of Technology, Tehran 15875-4413, Iran
3
School of Information Technology, Deakin University, Burwood, VIC 3125, Australia
4
Department of Data Science and Artificial Intelligence, Auckland University of Technology, Auckland 1010, New Zealand
*
Author to whom correspondence should be addressed.
Appl. Sci. 2025, 15(13), 7088; https://doi.org/10.3390/app15137088
Submission received: 16 May 2025 / Revised: 19 June 2025 / Accepted: 22 June 2025 / Published: 24 June 2025
(This article belongs to the Special Issue Advanced IoT/ICT Technologies in Smart Systems)

Abstract

Depression affects millions of people worldwide and remains a significant challenge in mental health care. Despite advances in pharmacological and psychotherapeutic treatments, there is a critical need for accessible and engaging tools that help individuals manage their mental health in real time. This paper presents a novel gamified, AI-driven system embedded within Internet of Things (IoT)-enabled environments to address this gap. The proposed platform combines micro-games, adaptive surveys, sensor data, and AI analytics to support personalized and context-aware depression monitoring and self-regulation. Unlike traditional static models, this system continuously tracks behavioral, cognitive, and environmental patterns. This data is then used to deliver timely, tailored interventions. One of its key strengths is a research-ready design that enables real-time simulation, algorithm testing, and hypothesis exploration without relying on large-scale human trials. This makes it easier to study cognitive and emotional trends and improve AI models efficiently. The system is grounded in metacognitive principles. It promotes user engagement and self-awareness through interactive feedback and reflection. Gamification improves the user experience without compromising clinical relevance. We present a unified framework, robust evaluation methods, and insights into scalable mental health solutions. Combining AI, IoT, and gamification, this platform offers a promising new approach for smart, responsive, and data-driven mental health support in modern living environments.

1. Introduction

Depression affects over 280 million people worldwide and is a major global health challenge. It is marked by ongoing sadness, distorted thinking, and a loss of interest or pleasure. Beyond its personal toll, depression has wide-reaching social and economic impacts [1]. Many people still lack acceptable treatment due to barriers like limited access, high costs, and a lack of personalized care. Digital mental health tools offer scalable alternatives but often fail to keep users engaged, adapt to individual needs, or use real-life behavioral and contextual data effectively [2].
To address these limitations, recent work has explored complementary approaches. Gamification enhances engagement and adherence by embedding therapeutic goals into interactive micro-games [3]. Environmental sensing captures contextual variables such as temperature and humidity, which influence mood fluctuations [4]. Ecological momentary assessments (EMAs), implemented via adaptive daily surveys, support real-time self-reflection and minimize recall bias [5]. Furthermore, artificial intelligence (AI) enables dynamic behavior modeling over time, supporting early detection of mental health deterioration and delivering personalized feedback.
The significance of this research lies in its holistic integration of these complementary strategies. While prior studies have examined these components in isolation, few have unified them into a coherent, interactive, and research-ready platform. The core objective of this study is to design, implement, and evaluate an AI-driven framework that synthesizes gamification, adaptive assessment, and environmental sensing to support both individual self-regulation and scalable mental health research.
To guide this investigation, we pose the following research questions:
  • RQ1:Can integrating gamified micro-interventions, adaptive ecological surveys, and environmental sensing enhance the early detection of depressive symptom patterns?
  • RQ2: How can an AI-enabled digital mental health system dynamically personalize user experiences based on multimodal behavioral and contextual inputs?
  • RQ3: How can such a system support end-user self-regulation and researcher-led experimentation within the same operational framework?
To address these questions, we developed a modular digital platform comprising a mobile app, a secure cloud-based infrastructure, and an AI-powered analytics engine. The system collects multimodal data through cognitive games, adaptive daily surveys, and environmental sensors. A synthetic dataset was generated to simulate diverse behavioral patterns, and predictive models were trained using stratified sampling and cross-validation. The platform was evaluated through scenario-based simulations to assess its capability for pattern recognition, risk estimation, and personalized feedback delivery.
This research illustrates how a digital mental health tool can serve therapeutic and research functions by embedding real-time analytics, adaptive user feedback, and simulation tools into a unified system. The platform’s design fosters self-awareness and metacognitive regulation, helping users shift from maladaptive thought patterns to healthier strategies while enabling researchers to refine algorithms and hypotheses in real time, iteratively. While synthetic data enables controlled testing of the system’s logic and AI models, future studies will involve empirical validation using real-world behavioral and physiological data. This will allow for evaluation under naturalistic conditions and improve clinical applicability.
This work makes three key contributions:
  • System design: A novel, AI-driven architecture integrating gamified micro-interventions, adaptive surveys, and environmental data for depression monitoring.
  • Simulation and evaluation framework: A synthetic data pipeline for safe, large-scale testing and validation of mental health algorithms.
  • Dual functionality: A unified platform serving user self-regulation and researcher experimentation, simultaneously advancing clinical and scientific goals.
This paper is structured as follows: Section 2 reviews foundational literature on gamification, EMAs, and AI in mental health. Section 3 outlines the system architecture and design rationale. Section 4 presents the experimental methodology, and Section 5 discusses key challenges and future directions. Through this integrative framework, we aim to inform the development of responsive, scalable, and clinically relevant digital mental health solutions.

2. Background and Related Works

This section reviews foundational work on digital mental health tools, focusing on gamification, adaptive daily surveys, AI-based personalization, and the role of environmental features. These themes inform the design and direction of the proposed system and highlight critical areas where existing approaches can be extended or improved.

2.1. Gamification in Mental Health Tools

Gamification, applying game design elements such as rewards, feedback, and progression, has gained traction in digital mental health interventions. Systems like SuperBetter and SPARX have demonstrated measurable improvements in resilience and mood, showing that game-like experiences can enhance user motivation and therapeutic outcomes [6,7].
However, many implementations adopt a fixed design that does not evolve with the user’s emotional state, preferences, or behavioral changes over time [3,8]. This static approach may limit sustained engagement, particularly for users experiencing mood or cognitive functioning fluctuations. Emerging studies advocate for more adaptive frameworks in which gamified elements adjust based on user behavior or input and where AI plays a central role in guiding difficulty, pacing, and feedback [9,10]. Recent reviews have emphasized the need for personalization in digital interventions to maintain user interest and relevance over time [11].

2.2. Adaptive Daily Surveys for Emotional Monitoring

Daily surveys are a widely used tool for emotional check-ins in mobile mental health applications, ranging from structured clinical scales like the Patient Health Questionnaire (PHQ-9) and Generalized Anxiety Disorder scale (GAD-7) to app-specific, simplified self-report instruments. These tools facilitate self-reflection, early symptom recognition, and tracking emotional trends over time [12].
Nonetheless, survey fatigue is a common concern, especially when users are presented with the same set of questions each day. Repetitive and non-contextual prompts can lead to disengagement or incomplete data capture [13]. Researchers have explored adaptive surveys that personalize content based on prior responses, mood history, or contextual factors such as time of day or recent behavior [14,15]. Adaptive assessments have also shown promise in improving both adherence and the ecological validity of collected data, especially when aligned with users’ daily routines [16]. When thoughtfully combined with gamification elements and feedback mechanisms, adaptive surveys can enhance user experience while preserving data richness and emotional accuracy.

2.3. AI for Personalized Depression Support

Artificial intelligence has become essential for identifying depression-related signals from diverse data sources. Techniques such as natural language processing (NLP), supervised learning, and deep neural networks have been applied to detect depressive symptoms from text entries, speech patterns, facial expressions, and mobile usage data [17].
Many approaches rely on passive data collection and generalized models, which may not fully capture individual variations in emotional expression or symptom progression [18]. A growing number of research points toward the benefits of integrating self-report data, behavioral patterns, and environmental signals to create more comprehensive, responsive systems [19]. In particular, in depression, combining multiple data streams and incorporating adaptive learning techniques, such as reinforcement learning, can significantly improve early detection and personalized feedback. Some studies also stress the importance of explainable AI (XAI) to increase user trust and interpretability in clinical contexts [20].
Recent large-scale advancements further support this direction. Zhong et al. [21] introduced a conversational system using large language models (LLMs) that achieved 89% precision in depression detection, outperforming standard clinical tools like the PHQ-9. Similarly, Qiu et al. [22] developed EmoAgent, a multi-agent AI framework designed to ensure emotional safety and stability during human–AI interaction. These systems demonstrate the growing feasibility of real-time, AI-guided mental health monitoring and validate our system’s integration of adaptive feedback and explainability.

2.4. Environmental Context: Temperature and Mood

Environmental conditions, especially temperature, play a substantial role in shaping emotional states. Elevated temperatures have been linked to psychological distress, irritability, and reduced cognitive performance due to their physiological impact [23,24]. Conversely, moderate temperatures have been associated with greater emotional stability and improved mood regulation [25].
Seasonal changes, including variations in sunlight and temperature, have also been implicated in depressive conditions such as seasonal affective disorder (SAD), which tends to peak in winter months [26]. Despite this, many digital mental health systems do not consider the environmental context when assessing or responding to user states. Integrating environmental data streams such as weather or ambient light may enable more context-sensitive interventions and help explain periodic mood shifts [27]. This presents a largely untapped opportunity to enhance the timing and relevance of mental health support, particularly for users sensitive to seasonal or climatic factors.
Complementing these findings, wearable-based sensing has shown promise in capturing environmental and physiological data relevant to mental well-being. For instance, Bloomfield et al. [28] reported that sleep quality indicators captured by the Oura Ring, such as duration, heart rate variability (HRV), and respiratory rate, correlated with perceived stress. Tang et al. [29] developed a deep learning–enabled smart garment that identified sleep stages with 98.6% accuracy, while Fonseka and Woo [30] demonstrated successful clinical applications of wearable pulse-oximetry for home-based mental health assessment. These advances support our inclusion of ambient and sleep-related sensing for enhanced mood–state prediction.

2.5. Motivation and Research Direction

These studies establish a solid foundation for digital mental health tools. However, there remains a need for systems that can dynamically adapt to individual users, integrate diverse data types, and balance clinical utility with user engagement. Current tools often operate within narrow design scopes, focusing either on passive sensing, static interventions, or gamification in isolation, without offering a holistic, interactive, and research-ready platform.
Furthermore, while many systems are designed for clinical efficacy, few prioritize user agency, data transparency, or long-term engagement strategies, all critical for sustained use in real-world settings. This research addresses these gaps by proposing an integrated system that combines gamified micro-interventions, adaptive self-reporting, environmental sensing, and AI-driven analytics. The goal is to support users and researchers through a flexible, modular architecture that enhances engagement, personalization, and scientific exploration in depression monitoring and management.

3. Materials and Methods: A Gamified AI-Driven System

This section describes the proposed gamified, AI-driven system for depression monitoring and intervention. Developed with React Native 0.78 and Expo for cross-platform access, it leverages AWS for secure, scalable data processing, real-time analytics, and synthetic data generation. The system integrates therapeutic gameplay, adaptive surveys, environmental context, and AI analytics into a unified digital mental health solution.

3.1. System Architecture

The system employs a microservices-based, cloud-centric architecture grounded in human-computer interaction and cognitive behavioral design principles [31,32]. It consists of three core layers:
  • Multi-platform application: A cross-compatible user interface supporting Android, iOS, and web platforms to ensure broad accessibility.
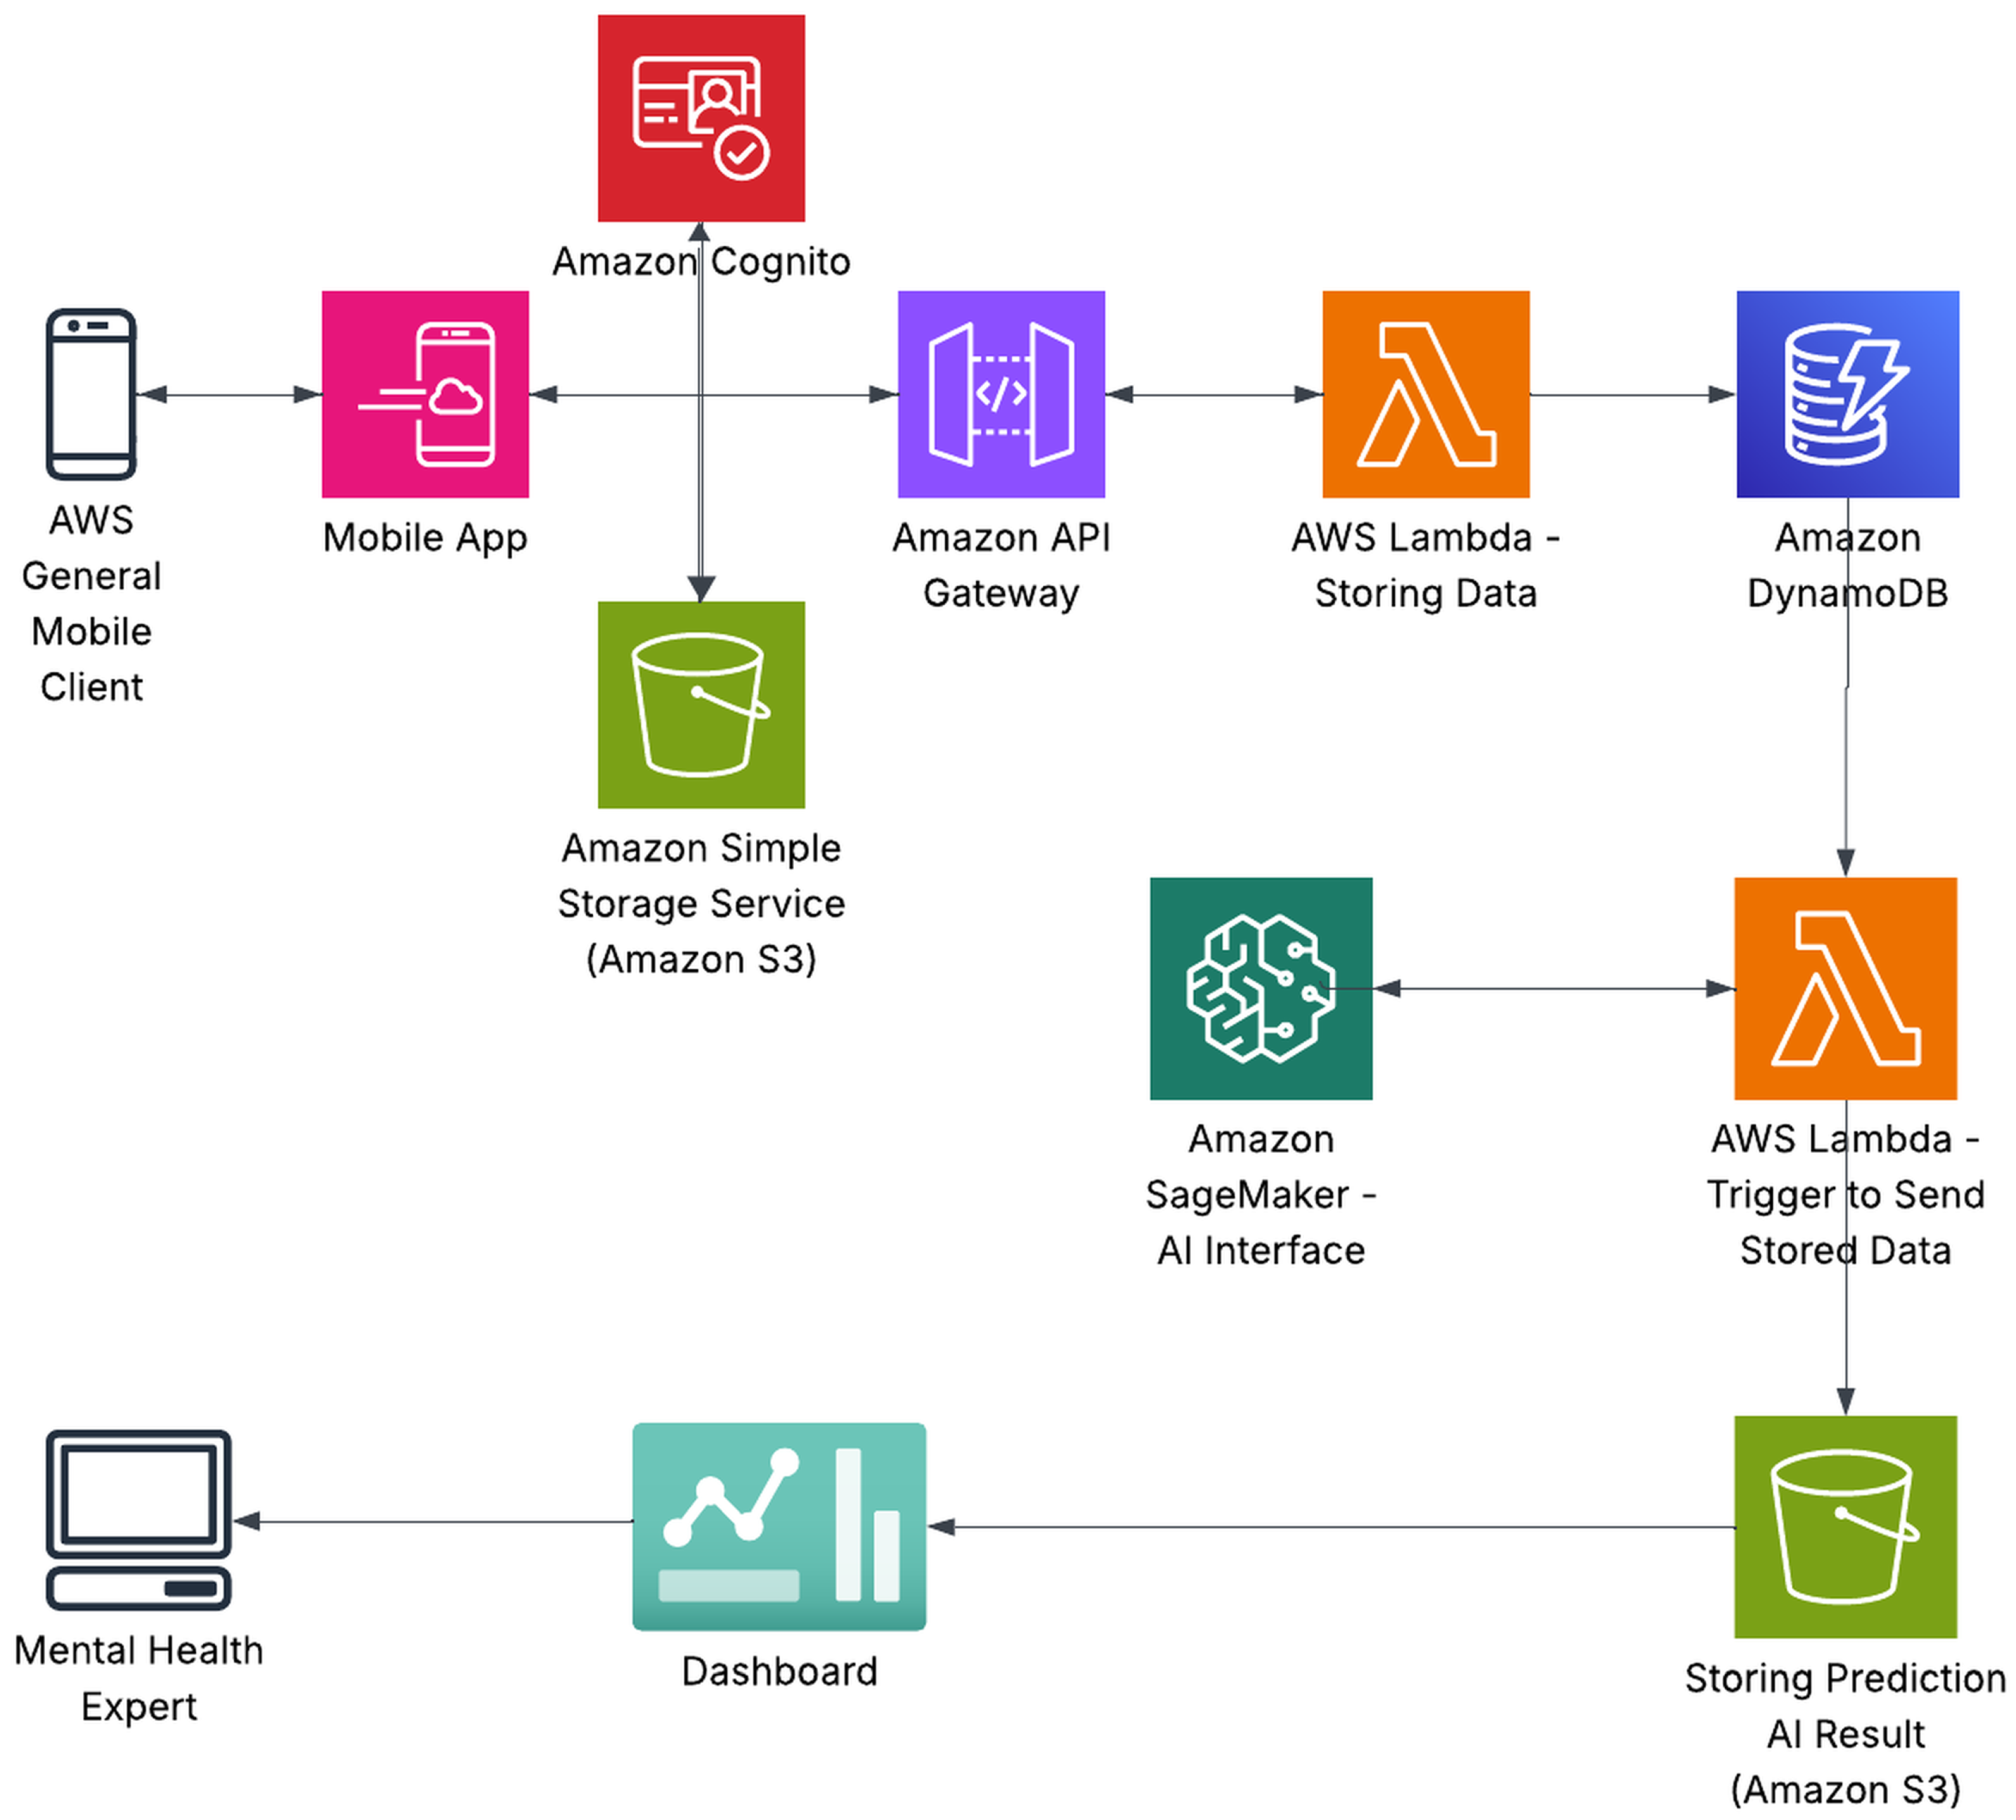
  • Cloud-based infrastructure: A secure and scalable back end hosted on AWS, utilizing DynamoDB (a NoSQL database) for efficient data storage and management. This infrastructure supports API services, user authentication, and real-time data processing.
  • AI analytics and simulation core: This layer leverages AWS SageMaker to implement machine learning models that analyze user behavioral patterns, estimate risk levels related to depressive symptom severity and relapse, and simulate synthetic scenarios for testing intervention strategies. The risk estimation component assesses the likelihood of adverse mental health episodes, enabling timely personalized interventions.

3.1.1. Multi-Platform Application

The application, developed with React Native and Expo, captures comprehensive behavioral data using therapeutic micro-games, mood self-assessments, and adaptive surveys. Location-based services, including weather data, capture environmental context to support affective state modeling. All user interactions, timestamps, game metrics, and emotional feedback are securely transmitted via AWS API Gateway.

3.1.2. Cloud-Based Infrastructure

AWS services [31,32] underpin the system’s back end, enabling efficient data handling and intelligent processing:
  • API gateway: Manages secure requests between front-end and back-end.
  • Lambda functions: Processes incoming data and triggers downstream workflows.
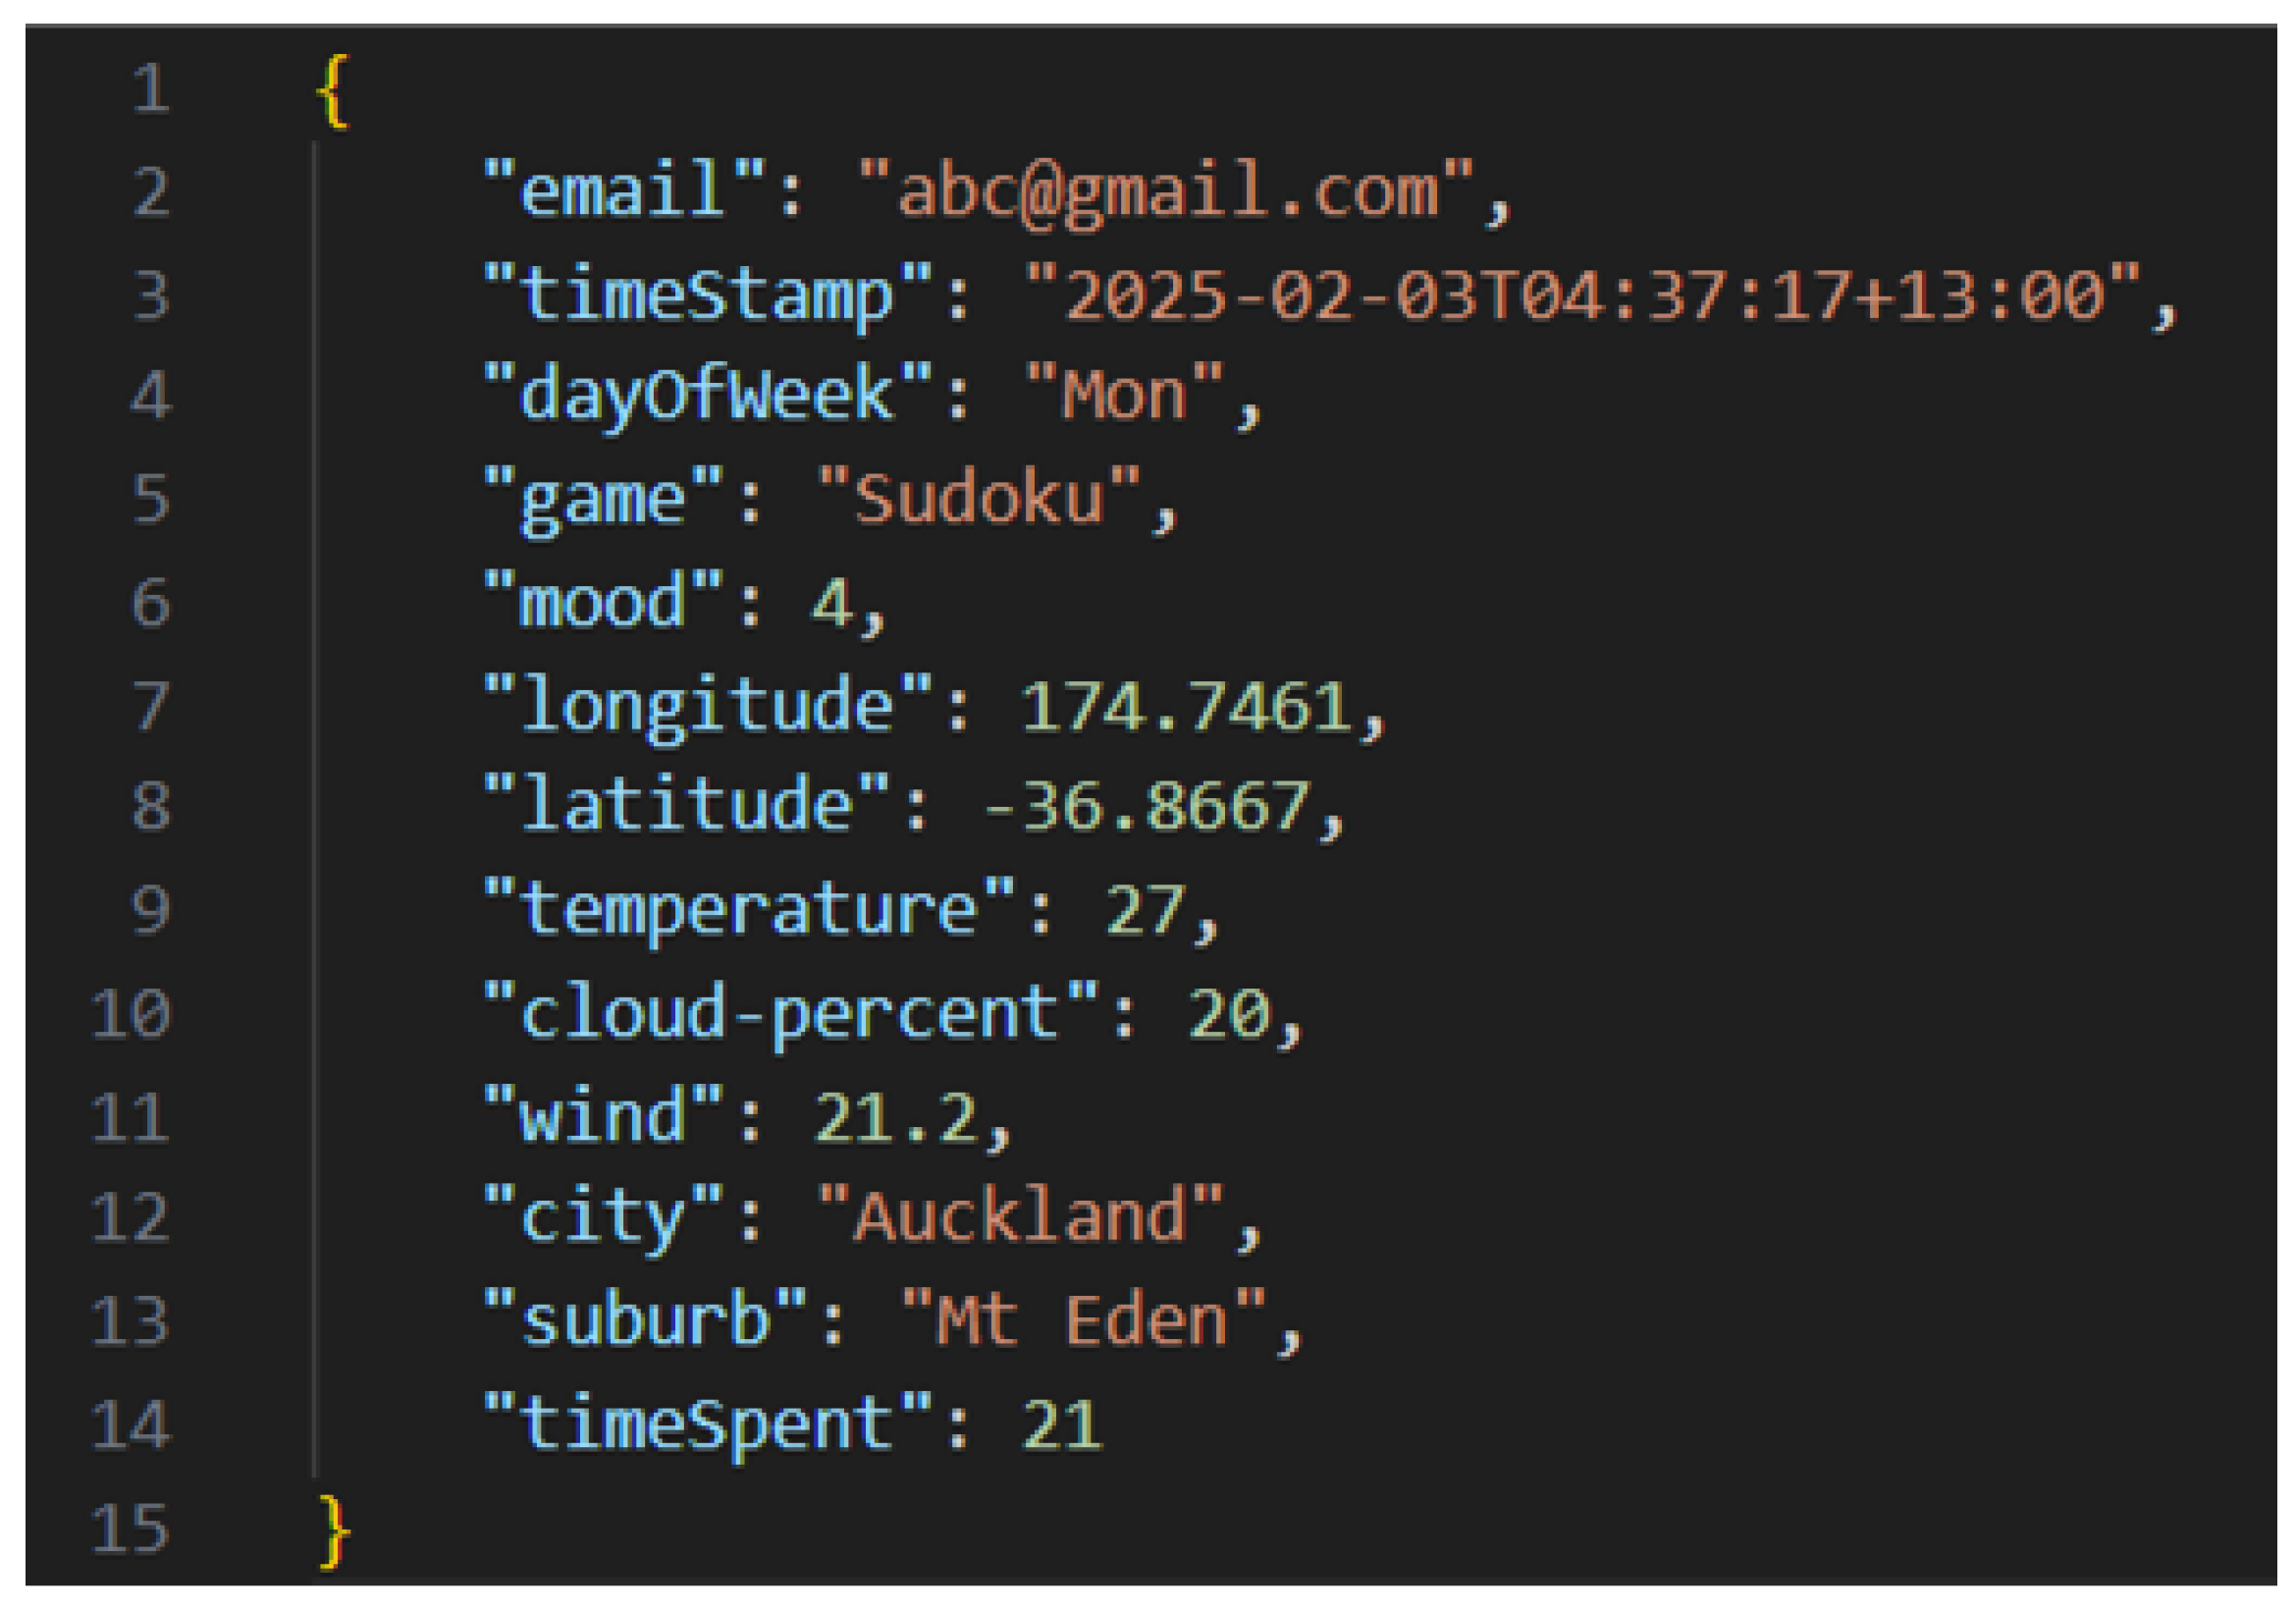
  • DynamoDB: Stores structured user records, including mood logs and environmental readings.
  • Cognito: Handles authentication and personalized user access.
  • SageMaker: Facilitates model training, simulation, and batch inference.
Figure 1 illustrates the system architecture, including the flow from front-end data capture to AI-powered insights.

3.1.3. AI Analytics and Simulation Core

The back-end infrastructure supports advanced analytics through AWS SageMaker and Python-based ML integrations. Data fusion and time-series modeling are employed to identify behavioral trends, predict mood variations, and deliver tailored feedback. AI models are trained to analyze combined indicators, including gameplay performance, survey responses, and environmental variables, offering insights into individual mental health trajectories. Figure 2 displays a snapshot of stored user data, capturing gameplay metrics, mood ratings, and contextual information.

3.2. System Component

The proposed system includes therapeutic micro-games, adaptive daily surveys, environmental data collection via location services, and AI-driven analytics. Figure 3 shows the main application interface, allowing users to select games while weather data is contextualized in real time.
Key components of the system are as follows:
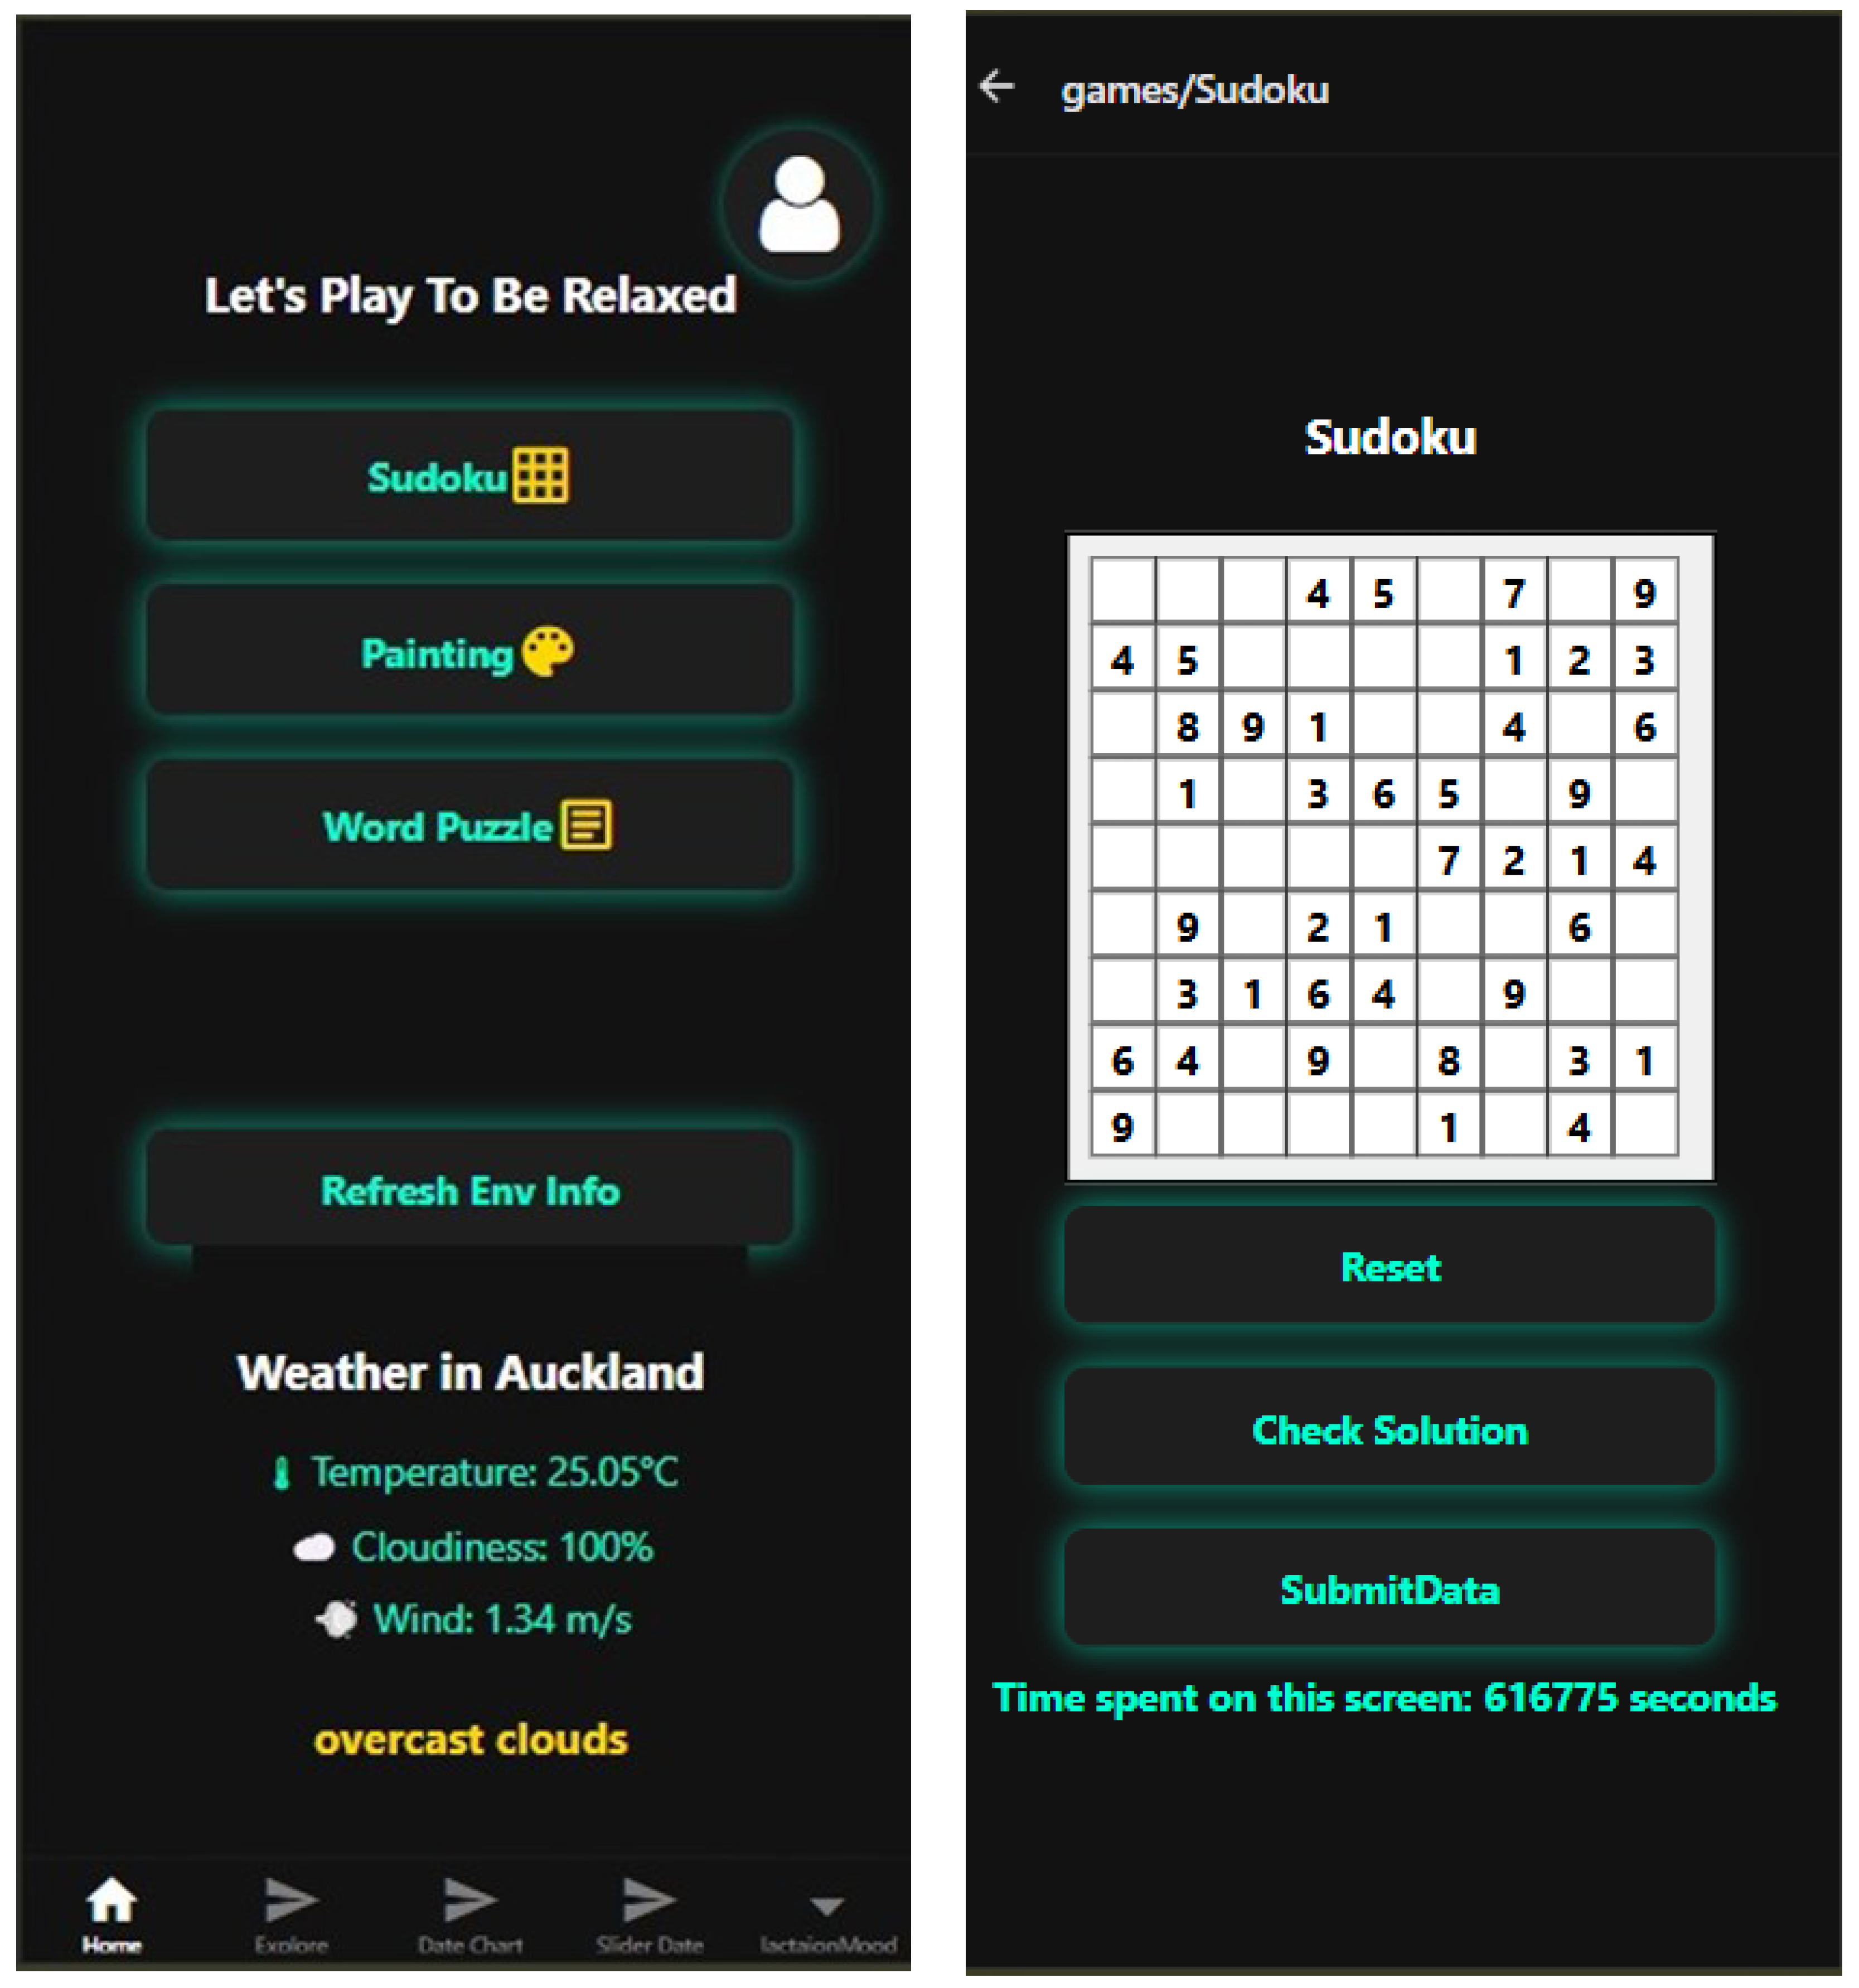
  • Therapeutic micro-games: The system incorporates lightweight micro-games designed to assess and support cognitive and emotional functioning. These games target attention span, decision-making speed, working memory, and error sensitivity, domains that are frequently affected by depression and stress-related disorders. Prior research has demonstrated that game-based tasks can capture fine-grained behavioral markers and serve as engaging interventions to support emotion regulation and cognitive flexibility [33,34]. Short, interactive games reduce friction and increase adherence, making them suitable for frequent self-monitoring and low-intensity therapeutic engagement. Figure 3 illustrates an example game interface.
  • Adaptive daily surveys: The platform employs short daily self-report surveys grounded in EMA principles, focusing on core themes such as mood, stress levels, energy, sleep quality, social interaction, and cognitive clarity. Survey questions are context-aware and adapt dynamically based on user history and behavioral data, ensuring relevance while reducing repetition and survey fatigue. This adaptive approach enables high-frequency yet low-burden mental health monitoring, enhancing the granularity and accuracy of symptom tracking [35].
  • Environmental context awareness: Real-time environmental data, including temperature, humidity, and light exposure, are collected to provide contextual layers for emotional assessment. This data is correlated with user-reported mood states to explore environmental influences on mental well-being.
  • AI-driven analytics: The platform leverages machine learning models to integrate data from micro-game performance, adaptive surveys, and environmental sensors. These models first identify hidden behavioral patterns and correlations, such as changes in cognitive speed, mood variability, and environmental influences, indicative of emerging depressive trends. By learning from historical data, the system can predict potential mental health risks and deliver real-time, personalized feedback aligned with each user’s evolving profile.

3.3. Embedded Research Capabilities

The system includes a synthetic data generation module to support robust algorithm validation by simulating user data across various depression states. This enables thorough model evaluation without relying on real participants. Dynamic simulation protocols allow researchers to explore scenarios like rapid mood decline or gradual recovery, offering insights into symptom progression and intervention effects. Interactive dashboards display aggregated insights, such as cognitive–emotional patterns and population trends, aiding hypothesis testing and real-time validation of adaptive interventions.
Collectively, these components create a scalable, adaptable framework that combines AI analytics with a user-centered design to improve depression support and research.

3.4. Technical Implementation Details

All modeling, data simulation, and evaluation processes were implemented in Python 3.10. The primary tools used include the following:
  • scikit-learn 1.4 for random forest and logistic regression models.
  • TensorFlow 2.15 for the feedforward neural network model.
  • NumPy 1.26, Pandas 2.2, and Matplotlib 3.8 for data processing and visualization.
  • eli5 for permutation-based feature importance analysis.

4. Results: Simulation-Based Evaluation of Depression Detection Models

4.1. Evaluation Objectives

This study presents a conceptual evaluation of an AI-augmented system for depression monitoring, using synthetic data to simulate behavioral, cognitive, and contextual variability. The evaluation is structured to assess:
  • The capacity of AI models to classify depressive states from multimodal data.
  • The feasibility of adaptive survey logic under evolving user states.
  • The interpretability and robustness of learned models via visual analytics and feature attribution.

4.2. Data Simulation Framework

A synthetic dataset was generated to simulate 3000 virtual users across multiple sessions. Each user profile contains both static (such as baseline cognitive score) and dynamic variables (such as mood score and reaction time). Environmental conditions (such as temperature and humidity) and task metrics (such as accuracy and response latency) were also included, informed by empirical ranges from prior clinical and digital mental health studies [4,12,16].
Variables were sampled using Gaussian or uniform distributions depending on empirical variability, with relationships between features (such as sleep and mood, temperature and stress) encoded based on findings from previous literature [23,25,27]. Environmental parameters (temperature, humidity) and performance metrics (accuracy, latency) were correlated with vital variables using probabilistic mappings to simulate realistic behavioral patterns.
A continuous depression-level score was assigned to each user based on the aggregation of relevant behavioral and environmental indicators. This score was binarized using the median as a threshold to create a balanced binary classification task. Users with scores above the median were labeled as depressed, and those below as healthy. This approach establishes a synthetic ground truth for classification and enables model performance evaluation under controlled conditions.

Synthetic Dataset Structure

The dataset included the following main categories of features:
  • Behavioral features: game accuracy, average response latency, error rate, and interaction frequency, representing engagement and performance under cognitive load.
  • Cognitive features: baseline cognitive score, working memory load, and attention span indicators were sampled from normal distributions informed by psychological literature.
  • Emotional states: self-reported mood, stress level, and energy level, generated dynamically across sessions to simulate fluctuating affective profiles.
  • Contextual features: temperature, humidity, and time of day correlated probabilistically with mood and behavioral responses based on findings from environmental psychology studies.
  • Temporal dynamics: each synthetic user had 10–30 sessions over time to introduce variability in longitudinal patterns (such as fatigue, recovery trends, or mood swings).
The synthetic data schema emulated real-world variability by combining continuous, ordinal, and binary variables. Gaussian noise and mild correlations (r = 0.3–0.6) were injected between key variables (poor sleep and mood or between temperature and stress) to reflect plausible, ecologically valid relationships observed in prior literature. These features were selected based on their relevance to depressive symptomatology. For example, response latency and game accuracy are linked to psychomotor slowing in depression, while mood variability, stress, and low energy are core affective indicators. Contextual variables like temperature and time of day affect circadian rhythms and mood regulation. Together, these multimodal inputs support realistic simulation of depression-related behavioral and cognitive states. Table 1 summarizes the structure of the synthetic dataset.

4.3. Machine Learning Pipeline

4.3.1. Preprocessing

All features were normalized using z-score standardization to ensure comparability across scales. The dataset was split into training (80%) and testing (20%) subsets using stratified sampling to maintain class distribution. Cross-validation was subsequently employed to validate generalizability.

4.3.2. Model Selection and Training

Three supervised classification models were implemented as follows. Each model was trained on the preprocessed feature set, and hyperparameters were manually configured to reduce overfitting while ensuring competitive baseline performance.
  • Random forest: An ensemble of 100 decision trees using Gini impurity for feature splitting.
  • Logistic regression: A regularized linear model optimized with the LBFGS solver.
  • Neural network: A feedforward network with two hidden layers (64 and 32 neurons) using ReLU activation and trained with the Adam optimizer.

4.3.3. Results Summary

Table 2 summarizes the classification performance across three machine learning models. The random forest model achieved the highest overall accuracy (0.88) and F1 score (0.878), suggesting it offered the most balanced performance in terms of precision and recall. The neural network model showed the highest ROC-AUC (0.931), indicating strong discriminative ability and potential for detecting subtle depressive patterns. While its F1 score was slightly lower than that of random forest, its sensitivity to class separation could prove valuable in future real-world scenarios.
While the logistic regression model was less accurate overall, its simplicity and interpretability may be advantageous in clinical or resource-constrained settings. These findings highlight a trade-off between accuracy and interpretability that will be further evaluated in real-world studies.
In addition to classification metrics, our feature importance analysis (Figure 4) showed that mood score and environmental features, such as temperature, were the most influential predictors. This confirms the value of multimodal data integration.
Furthermore, the adaptive survey simulation over a 12-week virtual period demonstrated the system’s capacity to adjust to evolving user states, reducing question fatigue while maintaining data relevance. This validates the theoretical design of the adaptive EMA logic embedded in the platform.
Together, these results establish the proof-of-concept value of the proposed system. The combination of high model performance, real-time personalization, and adaptive feedback highlights the system’s potential as both a research platform and a low-intensity self-regulation tool for depression support.

4.3.4. Visualization and Feature Importance

Figure 5 presents the ROC curves for all models. The neural network achieved the best area under the curve (AUC), followed closely by random forest. The confusion matrices shown in Figure 6 offer additional insight into each classifier’s predictive performance and behavior, highlighting their strengths and weaknesses in classifying the data.
To assess the contribution of individual features to model predictions, we applied permutation-based feature importance analysis, which measures performance degradation when a feature’s values are randomly shuffled. Figure 4 shows results across all three models, using the F1 score as the evaluation metric.
Across models, temperature, humidity, and mood score emerged as the most influential predictors. These findings align with research linking psychomotor retardation, affective disturbances, and cognitive dysfunction to depression. In contrast, temperature and humidity had lower importance, indicating a more indirect influence in the simulated context.

4.4. Depression Scoring and Classification Algorithm

To assess depressive states, we followed a structured process involving data fusion, composite scoring, and supervised classification:
  • Feature aggregation: Each synthetic user session included behavioral (such as game accuracy and response latency), cognitive (such as baseline cognitive score, attention span), and contextual (such as temperature and humidity) variables.
  • Weighted composite scoring: A continuous depression score D i was calculated for each user session using the following equation:
    D i = j = 1 n w j · x i j
    where x i j is the value of feature j for session i, and w j is its empirically assigned weight based on relevance in the literature. For instance, mood variability and energy received higher weights, while environmental features were assigned lower weights.
  • Normalization: Depression scores D i were min-max scaled to the [ 0 ,   1 ] range to standardize the output across sessions.
  • Label assignment: The normalized scores were binarized using the dataset median. Sessions with scores above the median were labeled as “depressed”, while those below were labeled as “non-depressed”. This binarization enabled the construction of a balanced binary classification task.
  • Model training: Supervised machine learning models—including random forest, logistic regression, and neural networks—were trained to predict the binary depression label using the complete feature set. We applied stratified sampling and cross-validation to ensure robustness and generalizability.

4.5. Adaptive Survey Logic Simulation

A longitudinal simulation was conducted over 12 virtual weeks to test adaptive survey logic. Survey branching conditions were activated based on trends in fatigue and affective variability. The adaptive system successfully adjusted question content and frequency in response to user state changes, supporting its theoretical responsiveness.

4.6. Ethical Considerations

The pilot study involves no real-time data collection or live participants, relying entirely on synthetic data. Ethical considerations ensure that the synthetic data generation process remains unbiased and representative of real-world scenarios. Future real-world data collection deployments will adhere to established ethical standards, including informed consent and data privacy regulations. All analyses were conducted on fully synthetic data. No human subjects were involved. Future deployments will adhere to ethical research standards, including informed consent, data minimization, anonymization, and regulatory compliance, such as GDPR and HIPAA.

5. Discussion

The proposed system offers a robust and novel digital mental health monitoring approach by integrating gamification, adaptive EMAs, and AI-driven analytics within an IoT-enabled framework. This section discusses the system’s performance, deployment implications, and potential extensions.
The system integrates adaptive self-reporting, gamified micro-interventions, and contextual sensing into a modular, real-time platform. Our simulation results confirm the feasibility of using multimodal data to classify depressive patterns with high accuracy.

5.1. Validity of Synthetic Evaluation

Synthetic data enables flexible, early-stage evaluation by facilitating scenario testing, algorithm validation, and stress testing without raising privacy or ethical concerns. Our synthetic dataset was designed to capture realistic behavioral, cognitive, and environmental variability based on empirical ranges reported in prior literature. This approach supports construct validity by simulating plausible depressive states, although it cannot fully replicate the complexity and unpredictability of real-world human behavior.
Model evaluation across three distinct classifiers, random forest, logistic regression, and neural networks, showed consistently strong performance, with the neural network slightly outperforming others (ROC-AUC: 0.931; F1 score: 0.860). These results suggest that the chosen feature space is informative and that depressive patterns are learnable under simulated conditions. We used stratified sampling, cross-validation, and identical training inputs across models to strengthen internal validity and ensure fair comparisons.
To further validate the models’ design, the data were simulated using parameter distributions derived from mental health studies. This grounding in empirical findings adds realism to the simulation process and offers confidence in early system performance.
However, generalizability (external validity) remains a key limitation. While the synthetic data reflects diverse behavioral profiles, it may omit latent factors in real populations, such as cultural influences or clinical comorbidities. We aim to address this by validating the platform in upcoming user studies and providing naturalistic data for fine-tuning the models. Ultimately, the synthetic framework enables agile testing of both system logic and adaptive workflows before ethical and logistical challenges of real-world trials arise.
While synthetic evaluation offers a valuable foundation for prototyping and testing, it is not a substitute for longitudinal, real-world validation. These results provide a proof of concept. They are intended to guide future research using real-world data.

5.2. Adaptive and Context-Aware Modeling

The system’s ability to simulate adaptive surveys over time demonstrates its potential for tracking evolving user states. The survey engine’s successful dynamic reconfiguration based on mood and fatigue validates its applicability for long-term mental health monitoring. Additionally, incorporating environmental variables (temperature, humidity) as contextual factors enhances ecological validity, with their impact on model outputs supporting existing research on environmental mood correlations.
This adaptive logic reduces user burden by limiting unnecessary or repetitive prompts and improves the accuracy and personalization of emotional tracking over time. These features position the platform as a sustainable digital mental health support tool, especially in populations prone to disengagement from traditional, rigid app-based assessments.

5.3. Research Utility and Generalizability

The system’s simulation and dashboard modules turn it into an active research platform, enabling continuous monitoring, performance analysis, and hypothesis testing without repeated real-world trials.
Including visual analytics, such as confusion matrices, ROC curves, and feature importance plots, allows researchers to interpret model behavior and evaluate decision confidence under different scenarios.
However, generalizability is limited by synthetic data, and real-world applications must address issues like missing data, compliance variability, cultural differences, and comorbidities.
A future extension could incorporate transfer learning techniques to adapt the pre-trained models to real-world contexts through transfer learning, improving the practical utility of the system in diverse populations.
Another limitation of this work is the lack of direct benchmarking against existing digital mental health tools or clinical gold standards such as PHQ-9, GAD-7, or commercial platforms like Woebot and Wysa. This was primarily due to the synthetic nature of the dataset and the early-stage focus on system architecture and feasibility. Future work will involve empirical benchmarking using both self-report tools and clinician-validated assessments to compare performance and user outcomes.
At this stage, the objective of the research is to test the hypothesis of having a gamified AI-driven system for depression monitoring and management, and further studies using real data and involving human interaction are required for the system’s design and validation.

6. Conclusions

This study presents a gamified, AI-driven system for monitoring and managing depression, integrating therapeutic micro-games, adaptive ecological momentary assessments, environmental context sensing, and machine learning analytics. Evaluated using synthetic data, the platform was rigorously tested for classification accuracy, adaptability, and research potential without immediate real-world data collection.
Evaluation results demonstrated high classification accuracy across models, with neural networks achieving an ROC-AUC of 0.931. Feature importance analysis confirmed the relevance of cognitive, emotional, and environmental variables, validating the platform’s multimodal design. Neural networks and random forest models outperformed logistic regression across all metrics. While logistic regression offered interpretability, it performed less well on both the F1 score and ROC-AUC. Temperature, humidity, and mood score were identified as the most influential features, consistent with established clinical indicators of depression.
Beyond prediction, the system innovates in adaptive user interaction. Importantly, this system is not intended to replace specialized human intervention but to act as a complementary tool. It offers scalable, real-time support that can bridge gaps in care or assist in self-regulation between professional sessions, particularly in underserved or low-resource contexts. The longitudinal simulation of survey branching and real-time question adaptation validates the logic engine, which is crucial for sustained user engagement and high-quality data collection. Integrating environmental variables like temperature and humidity adds context-awareness to mental health assessment.
The system’s dual functionality, supporting both real-time user feedback and research experimentation, makes it a flexible platform for advancing mental health technologies.

Future Work

The next phase will involve real-world pilot deployments to assess system performance with live data, evaluate long-term user engagement, and improve model generalizability. Integration with passive sensing via wearables and smartphones, including objective monitoring of sleep, activity, and physiological signals, will enhance multimodal data collection. The platform’s potential to address other conditions, such as anxiety and stress, will also be explored, advancing it from a conceptual prototype to a scalable clinical tool. This will support more precise, continuous monitoring and improve model robustness in real-world settings.
We plan to conduct empirical benchmarking using established clinical metrics (e.g., PHQ-9 accuracy, engagement retention, symptom tracking sensitivity), comparing our system with tools like Woebot, Wysa, and Moodpath [17].

Author Contributions

Conceptualization, S.Z. and A.R.; methodology, S.Z.; software, A.R.; validation, S.Z. and A.R.; resources, S.Z.; writing—original draft preparation, S.Z.; writing—review and editing, M.N., R.S. and S.M.; visualization, S.Z. and A.R.; supervision, M.N., R.S. and S.M.; project administration, M.N. and R.S. All authors have read and agreed to the published version of the manuscript.

Funding

This research received no external funding.

Data Availability Statement

The data presented in this study are available on request from the corresponding author. The data are not publicly available due to the code being long and complex, which requires careful handling and documentation to ensure proper usage.

Conflicts of Interest

The authors declare no conflicts of interest.

References

  1. World Health Organization. Depressive Disorder (Depression). 2023. Available online: https://www.who.int/news-room/fact-sheets/detail/depression (accessed on 16 May 2025).
  2. Larsen, M.E.; Huckvale, K.; Nicholas, J.; Torous, J.; Birrell, L.; Li, E.; Reda, B. Using science to sell apps: Evaluation of mental health app store quality claims. NPJ Digit. Med. 2019, 2, 18. [Google Scholar] [CrossRef] [PubMed]
  3. Fleming, T.M.; Bavin, L.; Stasiak, K.; Hermansson-Webb, E.; Merry, S.N.; Cheek, C.; Lucassen, M.; Lau, H.M.; Pollmuller, B.; Hetrick, S. Serious games and gamification for mental health: Current status and promising directions. Front. Psychiatry 2017, 7, 215. [Google Scholar] [CrossRef]
  4. Zamani, S.; Nguyen, M.; Sinha, R. Integrating Environmental Data for Mental Health Monitoring: A Data-Driven IoT-Based Approach. Appl. Sci. 2025, 15, 912. [Google Scholar] [CrossRef]
  5. Ng, M.Y.; Frederick, J.A.; Fisher, A.J.; Allen, N.B.; Pettit, J.W.; McMakin, D.L. Identifying Person-Specific Drivers of Depression in Adolescents: Protocol for a Smartphone-Based Ecological Momentary Assessment and Passive Sensing Study. JMIR Res. Protoc. 2024, 13, e43931. [Google Scholar] [CrossRef]
  6. Roepke, A.M.; Jaffee, S.R.; Riffle, O.M.; McGonigal, J.; Broome, R.; Maxwell, B. Randomized controlled trial of SuperBetter, a smartphone-based/internet-based self-help tool to reduce depressive symptoms. Games Health J. 2015, 4, 235–246. [Google Scholar] [CrossRef] [PubMed]
  7. Merry, S.N.; Stasiak, K.; Shepherd, M.; Frampton, C.; Fleming, T.; Lucassen, M.F. The effectiveness of SPARX, a computerised self help intervention for adolescents seeking help for depression: Randomised controlled non-inferiority trial. BMJ 2012, 344, e2598. [Google Scholar] [CrossRef]
  8. Wasil, A.R.; Gillespie, S.; Patel, R.; Petre, A.; Venturo-Conerly, K.E.; Shingleton, R.M.; Weisz, J.R.; DeRubeis, R.J. Reassessing evidence-based content in popular smartphone apps for depression and anxiety: Developing and applying user-adjusted analyses. J. Consult. Clin. Psychol. 2020, 88, 983. [Google Scholar] [CrossRef]
  9. Tondello, G.F.; Nacke, L.E. Player characteristics and video game preferences. In Proceedings of the Annual Symposium on Computer-Human Interaction in Play, Barcelona, Spain, 22–25 October 2019; pp. 365–378. [Google Scholar]
  10. Cheng, P.; Luik, A.I.; Fellman-Couture, C.; Peterson, E.; Joseph, C.L.; Tallent, G.; Tran, K.M.; Ahmedani, B.K.; Roehrs, T.; Roth, T.; et al. Efficacy of digital CBT for insomnia to reduce depression across demographic groups: A randomized trial. Psychol. Med. 2019, 49, 491–500. [Google Scholar] [CrossRef]
  11. Torous, J.; Myrick, K.J.; Rauseo-Ricupero, N.; Firth, J. Digital mental health and COVID-19: Using technology today to accelerate the curve on access and quality tomorrow. JMIR Ment. Health 2020, 7, e18848. [Google Scholar] [CrossRef]
  12. Kramer, A.D.; Guillory, J.E.; Hancock, J.T. Experimental evidence of massive-scale emotional contagion through social networks. Proc. Natl. Acad. Sci. USA 2014, 111, 8788–8790. [Google Scholar] [CrossRef]
  13. Wahle, F.; Kowatsch, T.; Fleisch, E.; Rufer, M.; Weidt, S. Mobile sensing and support for people with depression: A pilot trial in the wild. JMIR MHealth UHealth 2016, 4, e5960. [Google Scholar] [CrossRef]
  14. Rosenblum, M.; Miller, P.; Reist, B.; Stuart, E.A.; Thieme, M.; Louis, T.A. Adaptive design in surveys and clinical trials: Similarities, differences and opportunities for cross-fertilization. J. R. Stat. Soc. Ser. A Stat. Soc. 2019, 182, 963–982. [Google Scholar] [CrossRef]
  15. Rintala, A.; Wampers, M.; Myin-Germeys, I.; Viechtbauer, W. Response compliance and predictors thereof in studies using the experience sampling method. Psychol. Assess. 2019, 31, 226. [Google Scholar] [CrossRef]
  16. Mohr, D.C.; Zhang, M.; Schueller, S.M. Personal sensing: Understanding mental health using ubiquitous sensors and machine learning. Annu. Rev. Clin. Psychol. 2017, 13, 23–47. [Google Scholar] [CrossRef]
  17. Fitzpatrick, K.K.; Darcy, A.; Vierhile, M. Delivering cognitive behavior therapy to young adults with symptoms of depression and anxiety using a fully automated conversational agent (Woebot): A randomized controlled trial. JMIR Ment. Health 2017, 4, e7785. [Google Scholar] [CrossRef] [PubMed]
  18. Kumar, A.; Nayar, K.R. COVID 19 and its mental health consequences. J. Ment. Health 2021, 30, 1–2. [Google Scholar] [CrossRef] [PubMed]
  19. Zamani, S.; Sinha, R.; Nguyen, M.; Madanian, S. Enhancing emotional well-being with IoT data solutions for depression: A systematic review. IEEE J. Biomed. Health Inform. 2025, 29, 1919–1930. [Google Scholar] [CrossRef]
  20. Holzinger, A.; Biemann, C.; Pattichis, C.S.; Kell, D.B. What do we need to build explainable AI systems for the medical domain? arXiv 2017, arXiv:1712.09923. [Google Scholar]
  21. Zhong, Z.; Wang, Z. Intelligent Depression Prevention via LLM-Based Dialogue Analysis: Overcoming the Limitations of Scale-Dependent Diagnosis through Precise Emotional Pattern Recognition. arXiv 2025, arXiv:2504.16504. [Google Scholar]
  22. Qiu, J.; He, Y.; Juan, X.; Wang, Y.; Liu, Y.; Yao, Z.; Wu, Y.; Jiang, X.; Yang, L.; Wang, M. EmoAgent: Assessing and Safeguarding Human-AI Interaction for Mental Health Safety. arXiv 2025, arXiv:2504.09689. [Google Scholar]
  23. Hou, Y.; Chen, W.; Chen, S.; Liu, X.; Zhu, Y.; Cui, X.; Cao, B. Associations between indoor thermal environment assessment, mental health, and insomnia in winter. Sustain. Cities Soc. 2024, 114, 105751. [Google Scholar] [CrossRef]
  24. Obradovich, N.; Migliorini, R.; Paulus, M.P.; Rahwan, I. Empirical evidence of mental health risks posed by climate change. Proc. Natl. Acad. Sci. USA 2018, 115, 10953–10958. [Google Scholar] [CrossRef] [PubMed]
  25. Noelke, C.; McGovern, M.; Corsi, D.J.; Jimenez, M.P.; Stern, A.; Wing, I.S.; Berkman, L. Increasing ambient temperature reduces emotional well-being. Environ. Res. 2016, 151, 124–129. [Google Scholar] [CrossRef]
  26. Melrose, S. Seasonal affective disorder: An overview of assessment and treatment approaches. Depress. Res. Treat. 2015, 2015, 178564. [Google Scholar] [CrossRef]
  27. McLeod, K.; Spachos, P.; Plataniotis, K.N. Smartphone-based wellness assessment using mobile environmental sensors. IEEE Syst. J. 2020, 15, 1989–1999. [Google Scholar] [CrossRef]
  28. Bloomfield, L.S.; Fudolig, M.I.; Kim, J.; Llorin, J.; Lovato, J.L.; McGinnis, E.W.; McGinnis, R.S.; Price, M.; Ricketts, T.H.; Dodds, P.S.; et al. Predicting stress in first-year college students using sleep data from wearable devices. PLoS Digit. Health 2024, 3, e0000473. [Google Scholar] [CrossRef]
  29. Tang, C.; Yi, W.; Xu, M.; Jin, Y.; Zhang, Z.; Chen, X.; Liao, C.; Kang, M.; Gao, S.; Smielewski, P.; et al. A deep learning–enabled smart garment for accurate and versatile monitoring of sleep conditions in daily life. Proc. Natl. Acad. Sci. USA 2025, 122, e2420498122. [Google Scholar] [CrossRef] [PubMed]
  30. Fonseka, L.N.; Woo, B.K. Wearables in schizophrenia: Update on current and future clinical applications. JMIR MHealth UHealth 2022, 10, e35600. [Google Scholar] [CrossRef]
  31. Voon, L. How Human-Centered Design Can Help Public Agencies Design Better Digital Services. 2022. Available online: https://aws.amazon.com/cn/blogs/publicsector/how-human-centered-design-help-public-agencies-design-better-digital-services/ (accessed on 16 May 2025).
  32. Garvin, C. Transforming Student Wellbeing Support with Amazon Bedrock and SXP.ai. 2025. Available online: https://aws.amazon.com/cn/blogs/publicsector/transforming-student-wellbeing-support-with-amazon-bedrock-and-sxp-ai/ (accessed on 16 May 2025).
  33. Pine, D.S.; Cohen, J.A. Cognitive behavioral therapy, serotonin, and neural mechanisms of depression: The role of learning. Psychol. Med. 2011, 41, 1219–1230. [Google Scholar]
  34. Holtz, B.E.; Murray, J.A.; Hershey, T. Serious games for cognitive training in mental health conditions: A systematic review. JMIR Ment. Health 2021, 8, e22007. [Google Scholar]
  35. Shiffman, S.; Stone, A.A.; Hufford, M.R. Ecological Momentary Assessment. Annu. Rev. Clin. Psychol. 2008, 4, 1–32. [Google Scholar] [CrossRef] [PubMed]
Figure 1. Physical view of the system architecture showing mobile front-end, AWS back-end integration, and AI analytics components.
Applsci 15 07088 g001
Figure 2. Sample of stored user data including mood rating, location, and gameplay interaction timestamps.
Applsci 15 07088 g002
Figure 3. Main application interface showing game selection and real-time weather contextualization, and the game page (Sudoku).
Applsci 15 07088 g003
Figure 4. Feature importance based on permutation analysis. Mood score, game accuracy, and temperature are among the top contributors to prediction performance. This highlights the value of integrating behavioral, cognitive, and environmental data.
Applsci 15 07088 g004
Figure 5. ROC curves for all three models. The neural network shows the highest AUC, indicating strong discriminative performance. Random forest also performs well across all thresholds. Logistic regression has lower sensitivity, especially at lower thresholds.
Applsci 15 07088 g005
Figure 6. Confusion matrices for each classifier, showing predicted vs. actual labels. Random forest and neural network both achieve high accuracy, with minimal false negatives. Logistic regression shows more misclassifications, particularly in the depressed class.
Applsci 15 07088 g006
Table 1. Structure of the synthetic dataset categorized by feature, data type, and generation method.
CategoryFeature NameData TypeGeneration Method
BehavioralGame AccuracyContinuousSampled from a normal distribution
Response LatencyContinuousSampled from normal a distribution
Error RateContinuousDerived from gameplay
Interaction FrequencyCountPoisson distribution
CognitiveBaseline cognitive scoreContinuousSampled from a normal distribution
Working Memory LoadOrdinalMapped from the cognitive scale
Attention SpanOrdinalMapped from EMA
EmotionalMood ScoreContinuousFluctuates per session
Stress LevelOrdinalDependent on temperature and performance
Energy LevelOrdinalCorrelated with stress and activity
ContextualTemperatureContinuousRealistic seasonal values
HumidityContinuousRealistic seasonal values
Time of DayCategoricalRandom morning/afternoon/evening split
TemporalSession Index (1–30)IntegerSequential with session-specific noise
Table 2. Model performance on simulated depression dataset.
ModelAccuracyPrecisionRecallF1 ScoreROC-AUC
Random Forest0.8800.8870.8690.8780.915
Logistic Regression0.6700.6850.6160.6490.723
Neural Network0.8650.8830.8380.8600.931
Disclaimer/Publisher’s Note: The statements, opinions and data contained in all publications are solely those of the individual author(s) and contributor(s) and not of MDPI and/or the editor(s). MDPI and/or the editor(s) disclaim responsibility for any injury to people or property resulting from any ideas, methods, instructions or products referred to in the content.

