Abstract
Modern physical protection systems (PPSs) play a pivotal role in safeguarding critical infrastructure and maintaining public safety. Yet increasingly complex system architectures and evolving threat landscapes pose significant vulnerability challenges to PPSs. Conventional vulnerability assessment methods predominantly rely on expert knowledge or single-path analysis, which inadequately captures complex inter-component relationships and the impact of uncertainties on PPS vulnerabilities. To bridge this gap, this paper introduces a hybrid analytical framework synergizing complex network theory with fuzzy Petri net (FPN). The proposed method operates through two integrated phases: (1) constructing topological models of PPS using complex network theory to characterize component interrelationships, and (2) incorporating FPN to establish vulnerability propagation models that simulate cascading effects and quantify overall system vulnerability. Compared with conventional methods, the proposed approach demonstrates superior effectiveness in identifying critical vulnerability points within the system, providing a scientifically grounded foundation for enhancing PPS security and implementing risk control measures.
1. Introduction
With the rapid development of society and the continuous advancement of technology, the physical protection system (PPS) has been playing an increasingly important role in areas such as critical infrastructure protection, public security management, and smart city construction. Integrating various technological measures including video surveillance, intrusion detection, and access control, the PPS provides crucial support for safeguarding social security, and preventing, and responding to diverse security threats. However, with the continuous expansion of system scale and increasing complexity, the PPS itself faces numerous vulnerability issues [1]. These system vulnerabilities may originate from hardware failures, software system flaws, network communication defects, or even human operational errors. If these vulnerabilities are maliciously exploited, they may lead to system malfunctions, data breaches, or even trigger severe security incidents [2]. Therefore, conducting scientific and comprehensive vulnerability assessments of PPSs, identifying system weaknesses, and implementing effective protective measures are of significant importance for enhancing overall system security.
Traditional vulnerability assessment methods for PPSs can be primarily categorized into two types. The first type involves establishing an indicator system for system components, typically using weighted calculation methods to progressively assess vulnerabilities from basic components to subsystems and ultimately to the complete physical protection system [3,4,5]. This approach offers simplicity and intuitiveness when dealing with a relatively simple PPS. Its notable drawbacks are as follows: (1) such methods assume independence among system components, neglecting their complex interrelationships; (2) they focus on the types and quantities of physical protection system components while overlooking the system’s spatial characteristics.
The second category analyzes the shortest intrusion path in the PPS, evaluating system vulnerability by connecting components from outer to inner layers to form a quantifiable pathway. These methods are primarily represented by the Estimate of Adversary Sequence Interruption (EASI) method and its derivatives [2]. The advantage of this approach lies in its partial mitigation of the subjectivity inherent in expert judgment, while quantitatively reflecting how spatial configurations affect PPS vulnerability in path selection. Notable limitations include the following: (1) The EASI method and its extensions (e.g., System Analysis of Vulnerability to Intrusion, SAVI) predominantly focus on shortest-path analysis, neglecting alternative intrusion paths and their interdependencies. (2) These methods typically assume independence among component vulnerabilities, failing to account for vulnerability propagation and accumulation effects within the system. This assumption may lead to underestimation of overall system vulnerability.
To address these issues, this paper proposes a vulnerability assessment method for PPS based on complex network theory and fuzzy Petri net (FPN). Complex network theory effectively characterizes inter-component relationships, providing a powerful tool for modeling PPS topology, while FPN theory simulates vulnerability propagation processes and quantitatively evaluates overall system vulnerability. The integrated approach demonstrates enhanced adaptability and flexibility, enabling more comprehensive and accurate PPS vulnerability assessment to inform security protection and risk control. The primary contributions of this work include the following:
- (1)
- A complex network-based PPS topology modeling method characterizing inter-component relationships;
- (2)
- A fuzzy Petri net-driven vulnerability propagation model to simulate cascading failure mechanisms and quantify systemic risks.
- (3)
- Demonstration of method validity through case studies illustrating vulnerability assessment reasoning and computation processes.
The remainder of this paper is organized as follows: Section 2 reviews the relevant literature, highlighting advancements and limitations in existing research. Section 3 elaborates on the theoretical foundations of the proposed assessment model, including complex network theory and the FPN theory. Section 4 details the construction of a vulnerability assessment model specifically tailored to PPS. Section 5 demonstrates the model’s application through a representative case study, validating its practicality. Finally, Section 6 presents the key findings and outlines directions for future research.
2. Literature Review
Vulnerability assessment of PPSs serves as a critical component in ensuring system security and reliability. Existing research methods can be primarily categorized into two groups: component-based assessment approaches and intrusion path-based assessment approaches. This section provides a review of these two methodologies.
2.1. Component-Based PPS Assessment Methods
Drago et al. [6] proposed a model-driven approach to support PPS design and evaluation, which assesses vulnerability of different system configurations through Unified Modeling Language (UML) models and Bayesian network models representing threats, protective facilities, assets, and their relationships. Čakija et al. [7] addressed the computational intensity of traditional PPS by introducing a domain experience exploration method that optimizes the search for optimal solutions, thereby significantly reducing assessment computations. Moo et al. [8] applied PPS vulnerability assessment methods to a typical small nuclear research reactor’s physical protection system, identifying through simulations that nuclear facility barriers were vulnerable to shaped charge TNT threats. Gregoire [9] demonstrated the application of defense-in-depth principles to traditional PPSs, using nuclear facility protection systems as an example to categorize detection, delay, and response functions of multi-layered barriers, offering new perspectives for nuclear physical security. Complementing these developments, Kapusta et al. [10] presented assessment methods using integrated simulation tools and dynamic risk modeling, which were employed to evaluate and optimize the effectiveness of a nuclear power plant PPS while investigating how to maintain equivalent protection levels with reduced response personnel costs. Yaseen et al. [11] conducted vulnerability assessments of PPSs at nuclear and radiological facilities using traditional threat analysis and component-based analysis of PPS configurations.
2.2. Intrusion Path-Based Analysis Methods
Intrusion path-based vulnerability assessment methods for PPS currently represent the predominant research direction. These research methods originated from the EASI model developed by Sandia National laboratories (SNL), which evaluates protection vulnerability along a designated path under specified threat scenarios [4,12]. Subsequently, SNL developed the SAVI, Very-Simplified EASI (VEASI), Multipath Very-simplified EASI (MP-VEASI), and Analytic System and Software for Evaluating Safeguards and Security (ASSESS) models as enhanced and simplified versions of the original EASI framework [12,13,14]. Other researchers have also conducted studies based on the EASI model, with Andiwijayakusuma et al. being the first to apply it to calculate vulnerability in nuclear reactor PPSs [15]. The team later developed a multi-path model for nuclear facility PPSs that identifies paths with the lowest interruption probabilities. Zou et al. [16] addressed vulnerable path assessment in a PPS through a heuristic path-finding algorithm that analyzes adversary attack paths, using detection and interruption probabilities as heuristic information based on design-based threats. They subsequently established a virtual environment-based method for PPS design, analysis, and training exercises. Yang Jun et al. [17] proposed an adaptive probability mapping matrix search algorithm for PPS vulnerability analysis, which identifies critical adversary paths from a risk perspective. Later, they developed a heuristic backward path search algorithm incorporating the EASI model to evaluate the remaining delay time after critical detection points. Zhang et al. [18] optimized PPS communication probabilities based on intrusion modeling theory, considering the equivalence between communication delay time and timely response time, thereby improving the accuracy of interruption probability assessment. Wadoud et al. [19,20] designed a PPS for nuclear facilities that integrates multiple advanced technologies, evaluated its security using the EASI methodology, and subsequently collaborated with other researchers to assess a hypothetical nuclear research center using the SAVI method. Li et al. [21] developed an EASI-based three-dimensional method for identifying PPS vulnerability paths that incorporates both aerial and underwater threat response capabilities. Kapusta et al. [11] enhanced the EASI method to include the evaluation of cyber-attack response capabilities in PPS.
3. Theoretical Foundations
The proposed vulnerability assessment framework integrates complex network theory, fuzzy production rule (FPR), and fuzzy Petri net (FPN) theory to enable systematic modeling, vulnerability propagation simulation, and quantitative evaluation. This section delineates the fundamental concepts of these three theoretical pillars and their synergistic application logic.
3.1. Complex Network Theory
Complex network theory serves as a fundamental theoretical framework for studying the topological structure and dynamic behavior of large-scale, nonlinear interactive systems, with its core method employing graph theory models to characterize inter-component relationships [22,23]. Formally, a complex network can be defined as a weighted directed graph G = (N, E) [24,25], where
- (1)
- Node set N represents physical or functional components.
- (2)
- Edge set E denotes inter-component relationships with weights quantifying interaction intensity or propagation likelihood.
In public transportation planning, researchers have adopted the Space-L complex network modeling method to analyze bus routes and stations. This method constructs topological models of transit networks by treating bus stations as nodes and adjacency relationships between stations as edges [26,27]. Similarly, in PPSs, protection zones and their connecting pathways can be abstracted as nodes and edges in complex networks, making the Space-L method applicable for protection system modeling. The core principle states that an edge exists between two nodes if direct or indirect connecting paths exist between them, while no edge is established for nodes without physical connections in real environments [28]. This modeling approach effectively characterizes PPS topology, providing a foundation for subsequent vulnerability analysis.
Figure 1a shows a schematic diagram of a physical protection system (PPS), where red lines indicate inter-zone connecting paths. As illustrated in Figure 1a, nodes n1 and n2 represent vehicle and pedestrian access points on the perimeter, providing access to n3 (an outdoor area within the PPS) and, subsequently, to n4 (internal building passageways), ultimately leading to zones n5 and n6 (rooms housing critical assets). Figure 1b demonstrates its complex network representation, where directional edges encode reachability relationships between zones.
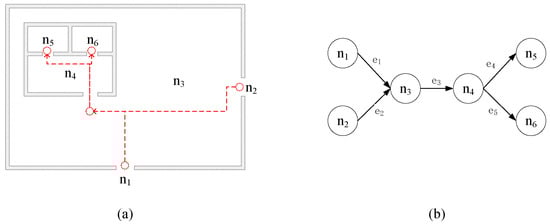
Figure 1.
Example of physical protection system modeling under Space L rule. (a) shows a schematic diagram of a physical protection system (PPS), where red lines indicate inter-zone connecting paths. As illustrated in (a), nodes n1 and n2 represent vehicle and pedestrian access points on the perimeter, providing access to n3 (an outdoor area within the PPS) and, subsequently, to n4 (internal building passageways), ultimately leading to zones n5 and n6 (rooms housing critical assets). (b) demonstrates its complex network representation, where directional edges encode reachability relationships between zones.
In complex networks, heterogeneous node/edge significance necessitates quantified characterization. This study employs the following statistically validated metrics to evaluate topological criticality [29]:
- (1)
- Degree Centrality (K)The degree Ki of node i refers to the number of other nodes that are directly connected to it. It reflects the level of connectivity of the node within the network. A higher degree indicates that the node has more connections with other nodes, implying a greater involvement or centrality in the network structure.
- (2)
- Average Path Length (L)Average path length is defined as the mean value of the shortest paths between all node pairs in the network. In our study, the complex network contains designated source and target nodes. We specifically define this metric as the average length of the shortest directed paths from all source nodes to the target node.
- (3)
- Betweenness Centrality (B)Node betweenness represents the frequency with which a node appears in all shortest paths. For our framework, we calculate node betweenness as the proportion of source-to-target shortest paths that pass through a given node. Higher betweenness values indicate greater nodal influence within the network.
- (4)
- Node Importance (ND)Node importance measures the significance of nodes within the network. Following complex network theory, we integrate node degree (Ki) and betweenness centrality (Bi) to compute node importance [30], as shown in Equation (1):where NDi denotes the criticality of node i, Bi′ represents the normalized betweenness centrality, defined as , and Ki′ corresponds to the normalized degree centrality, calculated as , for i = 1, 2, …, n.
- (5)
- Edge Importance (Sij)Edge importance quantifies the significance of edges within the network. The importance of an edge is determined by the importance of its connected nodes—edges linking more important nodes have higher importance. We calculate edge importance based on the importance scores of its terminal nodes, as shown in Equation (2):where Sij denotes the criticality of the edge connecting nodes i and j, with i, j ∈ {1, 2, …, n}.
3.2. FPN and FPR
Fuzzy Petri net (FPN) has been extensively applied in the domains of social safety and risk assessment [31], where researchers have utilized fuzzy Petri net for safety evaluations of long-distance oil pipelines [32], PPSs for petroleum industrial facilities in high-risk areas [33], chemical production processes [34], railway infrastructure [35], and air traffic management systems [36].
Following the complex network-based modeling of PPS topology, it is essential to model both vulnerability generation and propagation during intrusion processes. In risk assessment, a conventional approach integrates fuzzy production rule (FPR) and fuzzy Petri net, where fuzzy production rule establishes causality for vulnerability triggering and diffusion, while fuzzy Petri net quantifies propagation pathways and overall system risk—collectively termed fuzzy production rule-based fuzzy Petri net [31,37].
Within the risk assessment literature, definitions and representations of this fuzzy Petri net variant exhibit minor variations while maintaining consistent functional principles. The standard definition characterizes fuzzy production rule-based fuzzy Petri net as an eleven-tuple network, structured as follows [34]:
- (1)
- P = {p1, p2, …, pn} is a finite nonempty set of places represented by circles;
- (2)
- T = {t1, t2, …, tn} is a finite nonempty set of transitions that are represented as rectangles;
- (3)
- D = {d1, d2, …, dn} is a finite nonempty set of propositions, where there is a one-to-one mapping between P and D;
- (4)
- β: P → D is an association function, a bijective mapping from places to propositions;
- (5)
- α: P → [0, 1] is a truth degree function that maps each place to a real value in [0, 1], i.e., α(pi) indicates the truth degree of proposition β(pi), where β(pi) ∈ D;
- (6)
- I: P × T → {0, 1} is an n × m input matrix, that is, iij records whether a directed arc exists from pi to tj (i = 1, 2, …, n; j = 1, 2, …, m), where
- (7)
- O: T × P → {0, 1} is an n × m output matrix, in which oij records whether a directed arc exists from tj to pi (i = 1, 2, …, n; j = 1, 2, …, m), where
- (8)
- W: P × T → [0, 1], is an n × m weight function, where wij is the weight of an arc from pi to tj;
- (9)
- µ: µ → (0, 1] is the threshold vector, µ=(µ1, µ2, …, µn), where µj is the threshold of tj;
- (10)
- CF: T × P → [0, 1] is a confidence function and expressed as a m × n matrix CF = [cfij]m×n. The element cfij ∈ [0, 1] is the certainty factor of the rule corresponding to tj, which indicates the confidence of β(pi) after the reasoning rule associated with tj is enabled;
- (11)
- M = (m1, m2, …, mn)T is a state vector, where mi = α(pi) ∈ [0, 1], with the initial state vector denoted as M0.
Fuzzy production rule enables the representation of uncertain, ambiguous knowledge and facilitates fuzzy reasoning processes [38]. In vulnerability assessment frameworks, Fuzzy production rule establishes causal relationships governing vulnerability triggering and propagation mechanisms. These rules incorporate two fundamental fuzzy inference operators—AND and OR—which correspond to distinct Petri net structural configurations when formalized within a fuzzy Petri net framework [33,39].
- AND rule: IF d1(α1, w11) AND d2(α2, w21) AND … AND dk(αk, wk1), then dg(αg, cfg1, µ1);
- OR rule: IF d1(α1) OR d2(α2) OR … OR dk (αk), then dg(αg, cfg1, cfg2 … cfgk, µ1, µ2 … µk).
- The fuzzy Petri net transformed from the “AND” rule is shown in Figure 2, where,
In the AND fuzzy Petri net model, a transition t can be fired when α1w1 + α2w2 + … + αkwk > µ, indicating that this fuzzy inference can occur.
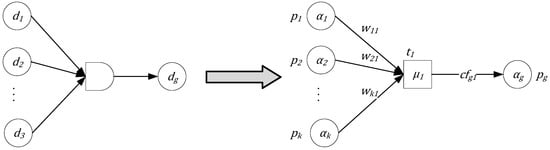
Figure 2.
FPN model of AND fuzzy production rule.
The fuzzy Petri net transformed from the OR rule is shown in Figure 3, where
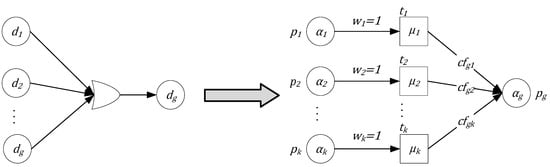
Figure 3.
FPN model of OR fuzzy production rule.
In the OR fuzzy Petri net model, a transition t can be fired when αm > µm, indicating that this fuzzy inference can occur.
4. Assessment Framework Based on Complex Networks and Fuzzy Petri Nets
This section proposes a vulnerability assessment framework for PPSs, integrating complex network theory with FPN. The framework’s core method employs system topology modeling, vulnerability rule inference, and dynamic propagation simulation to achieve a multidimensional assessment, from structural analysis to risk quantification.
The key implementation steps are as follows:
- (1)
- Topological ModelingConstructing a directed network representation of PPS using complex network theory (Section 4.1).
- (2)
- Rule-Based Vulnerability InferenceDefining vulnerability propagation logic through FPR (Section 4.2).
- (3)
- Dynamic Risk PropagationDeveloping dynamic propagation models based on FPN. (Section 4.3).
The complete workflow is illustrated in Figure 4. Section 4.1, Section 4.2 and Section 4.3 detail implementation protocols, parametric definitions, and computational workflows for each phase.
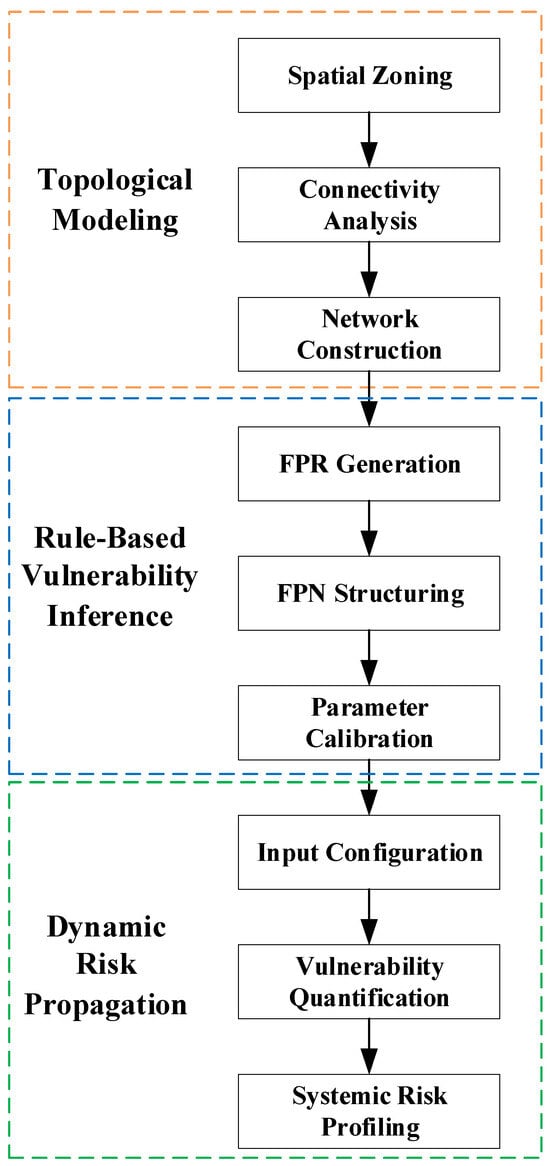
Figure 4.
Evaluation Flowchart.
4.1. Complex Network-Based Topological Modeling
Classical security systems are spatially and functionally stratified into four concentric defense layers (from outer to inner): Perimeter, Surveillance Zone, Protection Zone, and Restricted Zone. A successful intrusion typically requires sequential breaching of these four layers. Each layer comprises multiple subzones:
- (1)
- Perimeter: Includes fencing/walls and access points for vehicles and personnel.
- (2)
- Surveillance Zone: Area between perimeter and buildings, including gathering points, parking lots, and outdoor pathways.
- (3)
- Protection Zone: The building area containing critical assets, including building exteriors and internal passageways.
- (4)
- Restricted Zone: Specific rooms containing core assets; unauthorized access to this zone signifies system failure.
It should be noted that a Protection Zone may encompass multiple buildings, while a Restricted Zone may involve several rooms. This multi-layered spatial configuration significantly increases the complexity of physical protection systems.
Based on the spatial layout and functional characteristics of the PPS, the system can be abstracted as a directed graph G = (N, E), where
- (1)
- Node N: represents sub-areas with defined functions and spatial boundaries within each PPS protection layer.
- (2)
- Edge E: denotes the pathways primarily connecting different functional areas within the PPS.
In the PPS complex network model, the graph contains multiple source nodes (representing Perimeter sub-areas) and terminal nodes (representing Restricted Zones that house critical assets). A connected path from source to terminal nodes constitutes a complete intrusion path, with multiple potential paths existing between them.
Based on the Chinese national standards GB 50348-2018 [40] and GJB 7674-2012 [41], along with industry standards such as GAT 1093-2013 [42], GJB 6118-2007 [43], GAT 1399.1-2017 [44], GAT 1399.2-2017 [45], and GAT 992-2012 [46], and incorporating field investigations of PPSs at various military-industrial facilities, museums, large stadiums, and educational institutions, a two-level indicator system has been developed, as detailed in Appendix A. This system is designed to quantify the protective capacity of sub-areas represented by nodes. The first-level indicators define the PPS protection zones, which form nodes and edges within the complex network, while the second-level indicators correspond to specific PPS components and their attributes that affect the protective capabilities at the first level.
Second-level indicators are further classified into three dimensions: Detection, Delay, and Response. According to Appendix A Table A1, evaluators can quantify the protective capability of security zones represented by first-level indicators, with this quantified result defined as the protection score in this study. The protection scores serve as critical input parameters for the FPN model used to evaluate overall system vulnerability.
4.2. FPR-Driven Vulnerability Propagation Logic
FPR employs fuzzy inference to model the causal logic of PPS failures. To enable fuzzy inference, we extend the complex network model of PPS beyond basic nodes (N) and edges (E) with the following definitions:
- (1)
- Intrusion Path (R): Intrusion Path Set R comprises all possible paths (r1–rn) from potential entry points to critical asset locations, with each individual intrusion path rm representing a complete route from a specific entry point to a particular critical asset location.
- (2)
- Protection Chain (C): Protection Chain Set C consists of all protection chains (c1–cn). An individual protection chain cm is defined as the collection of all intrusion paths from potential entry points to a particular critical asset. A PPS containing multiple critical assets is considered to have multiple protection chains.
Consider the network in Figure 1b: Restricted Zones n5, n6 store critical assets A, B, with n1, n2 as intrusion origins. This system contains four intrusion paths and two protection chains, as shown in Table 1.

Table 1.
Intrusion path and protection chain of the PPS in Figure 1.
Based on FPR inference rules and system characteristics, we define four failure propositions:
- (1)
- Component Failure: edge/node security compromise
- (2)
- Path Failure: security breach along an intrusion path R
- (3)
- Chain Failure: compromise of a protection chain c
- (4)
- System Failure: global security collapse
In accordance with the established reasoning framework, Figure 1b’s components are formally mapped as nodes (p1/d1–p6/d6), edges (p7/d7–p11/d11), paths (p12/d12–p15/d15), protection chains (p16/d16–p17/d17), and system failure (p18/d18). Table 2 exemplifies these propositions using the Figure 1b network.
Table 2.
Correspondence between places and propositions of the PPS in Figure 1.
The inference process is outlined as follows: The vulnerability of edges and nodes, reflecting their likelihood of failure, enables the derivation of intrusion path vulnerability. This, in turn, allows the calculation of the vulnerability of the protection chain that encompasses these intrusion paths. Ultimately, the overall vulnerability of the PPS can be inferred from the vulnerabilities of these protection chains.
- Node/Edge → Path: AND logic governs the inference, as all components must fail to compromise a path.
- Path → Chain: OR logic applies, breaching one path suffices to compromise a chain.
- Chain → System: Two mission-driven logics exist: (1) AND: System vulnerability scales with partial asset loss (e.g., redundant systems); (2) OR: Any chain failure triggers total system failure (e.g., critical infrastructure)
For the Figure 1b case study, taking intrusion path r1 as an example, if all security zones (n1, n3, n4, n5) and connecting paths (e1, e3, e4) experience a protection failure, the entire path is considered compromised, which follows the “AND” rule in FPR. Table 1 presents the corresponding proposition numbers for these events. Thus, the complete causal logic for the failure of path r1 is expressed in FPR as
d1 and d7 and d3 and d9 and d4 and d10 and d5 Then d12
For protection chain c1, intruders reaching critical room n5 through either path r1 or r2 follow FPR’s “OR” rule, expressed formally as
d12 or d13 then d16
Similarly, the complete inference process is as shown in Table 3:
Table 3.
Inference process of the PPS in Figure 1.
4.3. Dynamic Risk Quantification via FPN Simulation
According to the FPR in Section 4.2, Table 1, and Figure 2 and Figure 3, the FPN shown in Figure 5 can be obtained.:
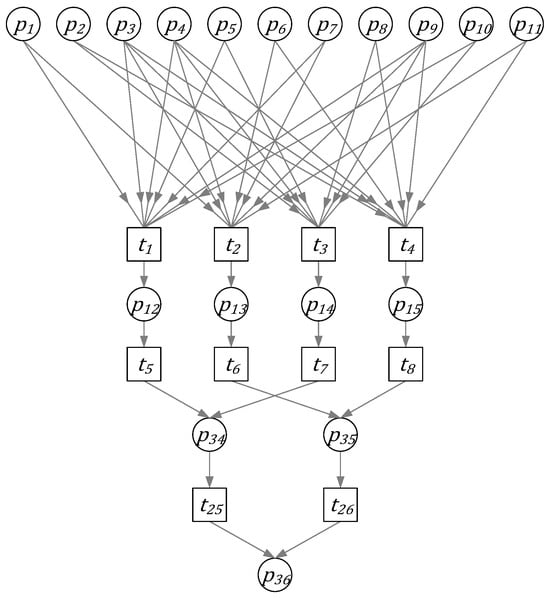
Figure 5.
FPN corresponding to the FPR shown in Section 4.2.
Building upon the FPN modeling principles detailed in Section 2 and referencing the works of Zhou et al. [33] and Guo et al. [32], this framework additionally requires initialization of the following parameters: Transition thresholds μj, Transition certainty factors cfij, Arc weights wij, and Initial marking vector M0.
Following the parameter configuration by Zhou et al. [33], we set μ = 0.05 and cf = 1 uniformly. The arc weight w has two calculation methods: (1) weights for node/edge-to-path vulnerability inference, determined by nodal/edge importance; (2) weights in AND-logic for protection chain places, determined by asset value or stakeholder priorities in the PPS.
For method (1), Section 3.1 presents our importance calculation: let xᵢ denote the importance value of the corresponding edge/node of place pᵢ (xi may take the value of either NDi or Sij), then the arc weight to transition tⱼ is
The initial truth degree mi for input places is calculated as
where yi ∈ [0, 10] represents the protection score of subzone i (Section 4.1). Non-input places initialize to mi = 0.
The classical computation method for output place truth degrees typically uses matrix operations to calculate the output vector Mn at system stability from the initial vector M0 [32,33]. However, as the number of places in FPN increases, the computational complexity of matrix operations grows significantly, making this approach impractical for FPN modeling and inference in complex PPS.
To address this limitation, we adopt the method proposed by Wang et al. [34], which computes vulnerability propagation values layer-by-layer at the transition level, enabling the efficient derivation of output place truth degrees. The FPN output place truth degree mn ∈ [0, 1] indicates higher PPS vulnerability as the values increase. Following the conventional 5-level risk assessment classification, the truth degree is divided into five equal levels, where higher values indicate greater vulnerability levels, necessitating more immediate and essential mitigation actions [33]. We propose the grading criteria for PPS vulnerability assessment, as shown in Table 4:
Table 4.
Vulnerability ratings.
5. Example and Validation
In this section, we first demonstrate the complete assessment process using a basic PPS and then conduct simulation experiments based on an institutional PPS to validate the effectiveness of the proposed method.
5.1. Illustrative Example
To validate the efficacy of the proposed vulnerability assessment method, this section conducts a case study on a representative security system. Following the analytical framework established in Section 3.1, the system is spatially and functionally divided into four defense layers with the following configurations:
- (1)
- Perimeter: includes one personnel access point, one vehicle passage, and perimeter fencing.
- (2)
- Surveillance Zone: comprises a parking lot and an open plaza.
- (3)
- Protection Zone: houses critical assets across two buildings (A and B).
- (4)
- Restricted Zone: contains an archive room in Building A and a data center in Building B.
This multilayered defense architecture exemplifies typical security system configurations, effectively demonstrating the method’s applicability to complex systems. Subsequent subsections perform vulnerability assessment using the integrated complex network and FPN framework.
Based on the system’s topological structure, Figure 6 illustrates its complex network representation.
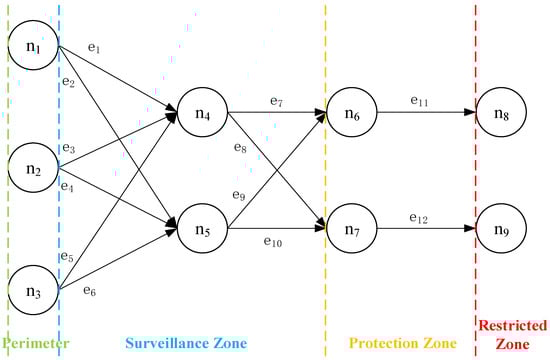
Figure 6.
Complex network diagram.
The various zones of the PPS are represented as n1 − n9 in the complex network. The protection regions corresponding to each node in Figure 6 are shown in Table 5, and the edges indicate the connectivity paths between the regions.
Table 5.
Component areas of the example PPS.
Based on the intrusion paths of attackers in the physical protection system (PPS), with reference to the descriptions in Figure 6 and Section 4.2, we enumerate 12 intrusion paths from perimeter layers to restricted zones and 2 protection chains in Table 6:
Table 6.
Intrusion path and protection chain of the example PPS.
The FPR propositions obtained accordingly and their correspondence with the FPN Places are shown in Table 7:
Table 7.
Places and vulnerability propositions.
The inferential relationship between propositions is as shown in Table 8:
Table 8.
Inference process of the example PPS.
This leads to the FPN model shown in Figure 7:
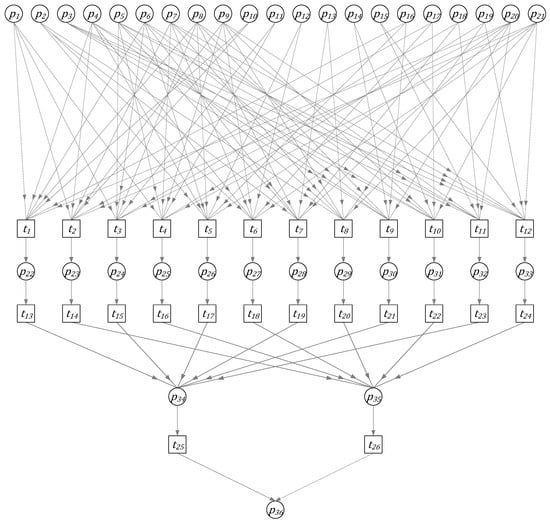
Figure 7.
FPN model diagram for security system.
Based on Equations (1), (2), and (7), the weights of the libraries in the FPN are computed, and the results are presented in Table 9:
Table 9.
Weighting of the route protection failure input place.
Using Appendix A Table A1 and Equation (8), the value of the input place is derived, as presented in Table 10:
Table 10.
Truth degree of input places.
After the FPN calculation, the truth degree obtained for Places p22–p36 is shown in Table 11:
Table 11.
Truth degree of places p22–p36.
Comparative analysis of Table 4, Table 5, Table 6, Table 7 and Table 11 yields three critical inferences:
- (1)
- The system exhibits moderate vulnerability (m36 = 0.406), necessitating scheduled risk mitigation measures.
- (2)
- Among all protection chains, c2 (associated with the data center) demonstrates the highest vulnerability, surpassing c1 (critical room). Data centers should be better protected.
- (3)
- Intrusion path r10 presents the most critical risk among 12 identified paths, warranting prioritized reinforcement of its constituent components.
- (4)
- Node n4 exhibits the highest vulnerability score of 0.575, approaching high vulnerability, which indicates insufficient protective capabilities in the parking lot. The PPS network diagram reveals that half of all intrusion paths include node n4, demonstrating its high importance within the overall PPS. Given the parking lot’s high importance and vulnerability, priority should be given to enhancing its security facilities and means of protection.
5.2. Simulation Validation
For model validation purposes, an organization’s PPS was selected and simulated in AnyLogic 8.8.6 environment, with our vulnerability assessment framework examined specifically through intrusion path analysis. First, we evaluated the PPS using our proposed method, then simulated the intrusion processes, with model validation achieved through a comparative analysis of the assessment and simulation results. The PPS layout is shown in Figure 8a, a 3D simulation view in Figure 8b, and the intrusion behavior workflow in Figure 8c. The PPS’s complex network diagram is shown in Figure 9, where dotted lines indicate underpasses. Appendix B Table A2 presents the node/edge configurations, intrusion paths, and protection chains within the complex network. The PPS vulnerability assessment results are provided in Appendix C Table A3.
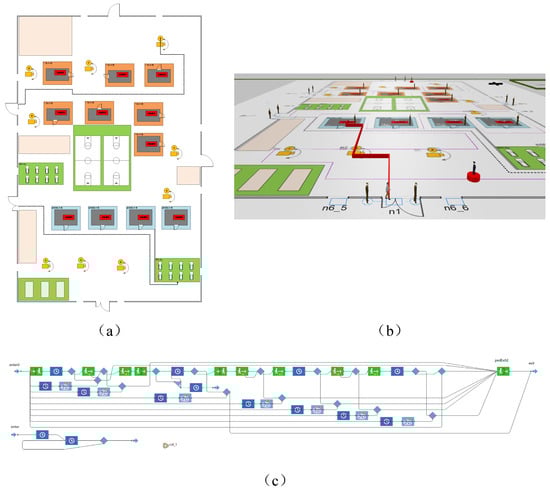
Figure 8.
Structure of an organization’s PPS. The PPS layout is shown in (a), a 3D simulation view in (b), and the intrusion behavior workflow in (c).
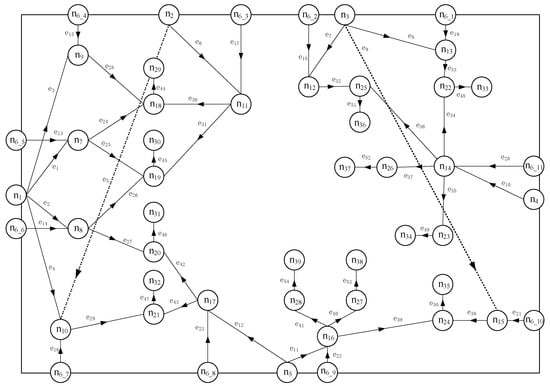
Figure 9.
Complex network diagram of an organization’s PPS. The PPS’s complex network diagram is shown in Figure 9, where dotted lines indicate underpasses.
We conducted 1000 simulated intrusions for each of the system’s 41 routes and documented the results. The assessment results obtained using our proposed method are presented in Appendix B Table A2, while the software simulation results are shown in Appendix D Table A4 (route/edge simulations) and A5 (intrusion path simulations). The simulation results showed weaker interception probabilities for nodes n10, n12, n16, n20, n23, and n27, as well as for edges e8, e9, e23, e43, e44, and e48, which were consistent with their vulnerability rankings in our assessment model. The five paths with the lowest interception probabilities (r39, r38, r11, r18, r10) reflect inadequate protection, corresponding to the top five most vulnerable locations in protection route failures, as indicated in Appendix C from our assessment method.
6. Conclusions
This study proposes a vulnerability assessment method for physical protection systems (PPSs) that integrates complex network theory and fuzzy Petri net (FPN). Through multidimensional modeling and dynamic propagation simulation, it addresses the limitations of conventional methods in component correlation analysis, uncertainty handling, and dynamic adaptability. The results demonstrate that this method effectively evaluates the overall vulnerability level of PPS and identifies high-risk assets and key system vulnerabilities. The assessment outcomes provide reliable guidance for the construction of PPSs. The methodological innovation not only enhances the accuracy of the assessment but also establishes a new theoretical paradigm and technical approach for PPS vulnerability research.
Specifically, complex network theory models the global logical structure and inter-regional relationships of PPSs, FPR formalize the causal relationships in vulnerability propagation, while FPN simulate the cumulative effects of vulnerability propagation through dynamic algorithms—collectively establishing a systematic framework for the complex assessment of PPS vulnerability.
We demonstrate the complete assessment process through a case study of a classical PPS. Future work will focus on refining the methodology to enhance its applicability to atypical PPS with distinctive features, such as those that incorporate unique topographic characteristics, such as cliffs and coastlines.
Author Contributions
Methodology, S.C., H.J. and Z.W.; Validation, X.T.; Writing—review & editing, S.C. and B.J. All authors have read and agreed to the published version of the manuscript.
Funding
This research was funded by “Security Engineering Double First-Class Special Project of People’s Public Security University of China” NO. 2023SYL08 and “Theoretical and Practical Research on Virtual Reality Technology in Public Safety Education and Training” No. 20230086.
Institutional Review Board Statement
Not applicable.
Informed Consent Statement
Not applicable.
Data Availability Statement
No data were used for the research described in the article.
Acknowledgments
The authors wish to express their appreciation to Chen for her valuable experience and advice.
Conflicts of Interest
The authors declare no conflict of interest.
Appendix A
Table A1.
Indicator system.
Table A1.
Indicator system.
| Zone (Primary Indicators) | Components (Secondary Indicators) | Points |
|---|---|---|
| Personnel Access Points (10 points) | Visitor and personnel identification | 2 |
| Contraband detection for individuals | 1.5 | |
| Security checkpoint screening | 2 | |
| Physical delay mechanisms | 1.5 | |
| Guard response capability | 1.5 | |
| Guard communication effectiveness | 1.5 | |
| Vehicle Access Points (10 points) | Vehicle identification | 1.5 |
| Occupant verification | 1.5 | |
| Vehicular contraband inspection | 1.5 | |
| Security personnel detection proficiency | 1 | |
| Physical delay mechanisms | 1.5 | |
| Guard response capability | 1.5 | |
| Guard communication effectiveness | 1.5 | |
| Perimeter Fencing/Walls (10 points) | Outdoor sensor performance | 3 |
| Perimeter barrier delay efficiency | 2 | |
| Patrol team intervention latency | 2.5 | |
| Perimeter communication network integrity | 2.5 | |
| Parking lots (10 points) | Parking lot video surveillance | 2 |
| Security patrol monitoring | 2 | |
| Vehicle movement control | 2 | |
| Guard force deployment density | 2 | |
| Guard communication effectiveness | 2 | |
| Public Gathering Zones (10 points) | Crowd area video analytics | 2 |
| Security patrol frequency | 2 | |
| Physical access control measures | 2 | |
| Comprehensive guard competency | 2 | |
| Guard communication effectiveness | 2 | |
| Building Exterior Security Zone (10 points) | Visitor-Personnel Identity Correlation | 2 |
| Intrusion detection performance | 2 | |
| Exterior patrol effectiveness | 1.5 | |
| Structural delay mechanisms | 1.5 | |
| Perimeter guard capability | 1.5 | |
| Guard communication effectiveness | 1.5 | |
| Critical Rooms (10 points) | Indoor sensor detection accuracy | 2 |
| Room-specific video monitoring | 1.5 | |
| Guard patrol verification | 1.5 | |
| Compartmentalized delay systems | 1.5 | |
| Configuration of guards | 2 | |
| communications capability | 1.5 | |
| Outdoor Pathways (10 points) | Outdoor Pathway Video Surveillance | 2 |
| Route patrol intensity | 2 | |
| Pathway obstruction effectiveness | 2 | |
| Guard post placement | 2 | |
| Guard communication effectiveness | 2 | |
| Indoor Pathways (10 points) | Indoor pathway video surveillance | 2 |
| Route patrol intensity | 2 | |
| Physical delay mechanisms | 2 | |
| Guard post placement | 2 | |
| Communication response reliability | 2 |
Appendix B
Table A2.
Complex network composition.
Table A2.
Complex network composition.
| Number | Description | Number | Description |
|---|---|---|---|
| n1 | South Gate | r8 | n2 → e6 → n11 → e30 → n18 → e44 → n29 |
| n2 | West Gate 1 | r9 | n2 → e6 → n11 → e31 → n19 → e45 → n30 |
| n3 | West Gate 2 | r10 | n3 → e7 → n12 → e32 → n25 → e51 → n36 |
| n4 | North Gate | r11 | n3 → e8 → n13 → e33 → n22 → e48 → n33 |
| n5 | East Gate | r12 | n3 → e9 → n15 → e38 → n24 → e50 → n35 |
| n6 | Perimeter Fence | r13 | n4 → e10 → n14 → e34 → n22 → e48 → n33 |
| n7 | Holding Point A | r14 | n4 → e10 → n14 → e35 → n23 → e49 → n34 |
| n8 | Holding Point B | r15 | n4 → e10 → n14 → e36 → n25 → e51 → n36 |
| n9 | Holding Point C | r16 | n4 → e10 → n14 → e37 → n26 → e52 → n37 |
| n10 | Parking Lot A | r17 | n5 → e11 → n16 → e39 → n24 → e50 → n35 |
| n11 | Parking Lot B | r18 | n5 → e11 → n16 → e40 → n27 → e53 → n38 |
| n12 | Holding Point D | r19 | n5 → e11 → n16 → e41 → n28 → e54 → n39 |
| n13 | Holding Point E | r20 | n5 → e12 → n17 → e42 → n20 → e46 → n31 |
| n14 | Cafeteria | r21 | n5 → e12 → n17 → e43 → n21 → e47 → n32 |
| n15 | Holding Point F | r22 | n6_5 → e13 → n7 → e24 → n18 → e44 → n29 |
| n16 | Holding Point G | r23 | n6_5 → e13 → n7 → e25 → n19 → e45 → n30 |
| n17 | Holding Point H | r24 | n6_6 → e14 → n8 → e26 → n19 → e45 → n30 |
| n18 | Building A | r25 | n6_6 → e14 → n8 → e27 → n20 → e46 → n31 |
| n19 | Building B | r26 | n6_4 → e15 → n9 → e28 → n18 → e44 → n29 |
| n20 | Building C | r27 | n6_7 → e16 → n10 → e29 → n21 → e47 → n32 |
| n21 | Building D | r28 | n6_3 → e17 → n11 → e30 → n18 → e44 → n29 |
| n22 | Workshop 1 | r29 | n6_3 → e17 → n11 → e31 → n19 → e45 → n30 |
| n23 | Workshop 2 | r30 | n6_2 → e18 → n12 → e32 → n25 → e51 → n36 |
| n24 | Workshop 3 | r31 | n6_1 → e19 → n13 → e33 → n22 → e48 → n33 |
| n25 | Workshop 4 | r32 | n6_11 → e20 → n14 → e34 → n22 → e48 → n33 |
| n26 | Workshop 5 | r33 | n6_11 → e20 → n14 → e35 → n23 → e49 → n34 |
| n27 | Workshop 6 | r34 | n6_11 → e20 → n14 → e36 → n25 → e51 → n36 |
| n28 | Workshop 7 | r35 | n6_11 → e20 → n14 → e37 → n26 → e52 → n37 |
| n29 | Building A Room | r36 | n6_10 → e21 → n15 → e38 → n24 → e50 → n35 |
| n30 | Building B Room | r37 | n6_9 → e22 → n16 → e39 → n24 → e50 → n35 |
| n31 | Building C Room | r38 | n6_9 → e22 → n16 → e40 → n27 → e53 → n38 |
| n32 | Building D Room | r39 | n6_9 → e22 → n16 → e41 → n28 → e54 → n39 |
| n33 | Workshop 1 Room | r40 | n6_8 → e23 → n17 → e42 → n20 → e46 → n31 |
| n34 | Workshop 2 Room | r41 | n6_8 → e23 → n17 → e43 → n21 → e47 → n32 |
| n35 | Workshop 3 Room | c1 | r1, r8, r5, r22, r26, r28 |
| n36 | Workshop 4 Room | c2 | r2, r3, r9, r23, r24, r29 |
| n37 | Workshop 5 Room | c3 | r4, r20, r25, r40 |
| n38 | Workshop 6 Room | c4 | r6, r7, r21, r27, r41 |
| n39 | Workshop 7 Room | c5 | r11, r13, r31, r32 |
| e1-e54 | Interregional pathways | c6 | r14, r33 |
| r1 | n1 → e1 → n7 → e24 → n18 → e44 → n29 | c7 | r12, r17, r36, r37 |
| r2 | n1 → e1 → n7 → e25 → n19 → e45 → n30 | c8 | r10, r15, r30, r34 |
| r3 | n1 → e2 → n8 → e26 → n19 → e45 → n30 | c9 | r16, r35 |
| r4 | n1 → e2 → n8 → e27 → n20 → e46 → n31 | c10 | r18, r38 |
| r5 | n1 → e3 → n9 → e28 → n18 → e44 → n29 | c11 | r19, r39 |
| r6 | n1 → e4 → n10 → e29 → n21 → e47 → n32 | PPS | c1, c2, c3, c4, c5, c6, c7, c8, c9, c10, c11 |
| r7 | n2 → e5 → n10 → e29 → n21 → e47 → n32 |
Appendix C
Table A3.
Vulnerability Distribution of PPS.
Table A3.
Vulnerability Distribution of PPS.
| Number | Value | Number | Value | Number | Value | Number | Value |
|---|---|---|---|---|---|---|---|
| n1 | 0.4 | n38 | 0.2 | e36 | 0.4 | r19 | 0.608 |
| n2 | 0.6 | n39 | 0.4 | e37 | 0.8 | r20 | 0.526 |
| n3 | 0.7 | e1 | 0.4 | e38 | 0.7 | r21 | 0.484 |
| n4 | 0.5 | e2 | 0.4 | e39 | 0.4 | r22 | 0.532 |
| n5 | 0.5 | e3 | 0.5 | e40 | 0.5 | r23 | 0.477 |
| n6 | 0.5 | e4 | 0.5 | e41 | 0.7 | r24 | 0.502 |
| n7 | 0.6 | e5 | 0.6 | e42 | 0.6 | r25 | 0.585 |
| n8 | 0.5 | e6 | 0.5 | e43 | 0.7 | r26 | 0.546 |
| n9 | 0.6 | e7 | 0.4 | e44 | 0.5 | r27 | 0.515 |
| n10 | 0.5 | e8 | 0.5 | e45 | 0.6 | r28 | 0.498 |
| n11 | 0.4 | e9 | 0.4 | e46 | 0.7 | r29 | 0.446 |
| n12 | 0.3 | e10 | 0.5 | e47 | 0.4 | r30 | 0.559 |
| n13 | 0.7 | e11 | 0.6 | e48 | 0.5 | r31 | 0.476 |
| n14 | 0.8 | e12 | 0.5 | e49 | 0.3 | r32 | 0.504 |
| n15 | 0.8 | e13 | 0.4 | e50 | 0.4 | r33 | 0.505 |
| n16 | 0.5 | e14 | 0.3 | e51 | 0.3 | r34 | 0.477 |
| n17 | 0.5 | e15 | 0.4 | e52 | 0.5 | r35 | 0.507 |
| n18 | 0.5 | e16 | 0.5 | e53 | 0.6 | r36 | 0.453 |
| n19 | 0.6 | e17 | 0.4 | e54 | 0.5 | r37 | 0.547 |
| n20 | 0.5 | e18 | 0.4 | r1 | 0.520 | r38 | 0.620 |
| n21 | 0.6 | e19 | 0.6 | r2 | 0.457 | r39 | 0.624 |
| n22 | 0.4 | e20 | 0.7 | r3 | 0.493 | r40 | 0.584 |
| n23 | 0.5 | e21 | 0.8 | r4 | 0.589 | r41 | 0.551 |
| n24 | 0.5 | e22 | 0.6 | r5 | 0.535 | c1 | 0.546 |
| n25 | 0.7 | e23 | 0.4 | r6 | 0.524 | c2 | 0.502 |
| n26 | 0.5 | e24 | 0.8 | r7 | 0.548 | c3 | 0.589 |
| n27 | 0.3 | e25 | 0.6 | r8 | 0.498 | c4 | 0.551 |
| n28 | 0.8 | e26 | 0.5 | r9 | 0.433 | c5 | 0.535 |
| n29 | 0.7 | e27 | 0.8 | r10 | 0.615 | c6 | 0.505 |
| n30 | 0.6 | e28 | 0.3 | r11 | 0.535 | c7 | 0.547 |
| n31 | 0.4 | e29 | 0.7 | r12 | 0.524 | c8 | 0.615 |
| n32 | 0.4 | e30 | 0.7 | r13 | 0.481 | c9 | 0.507 |
| n33 | 0.5 | e31 | 0.8 | r14 | 0.480 | c10 | 0.62 |
| n34 | 0.8 | e32 | 0.6 | r15 | 0.443 | c11 | 0.624 |
| n35 | 0.6 | e33 | 0.8 | r16 | 0.482 | PPS | 0.624 |
| n36 | 0.6 | e34 | 0.4 | r17 | 0.509 | ||
| n37 | 0.3 | e35 | 0.5 | r18 | 0.603 |
Appendix D
Table A4.
Node/Edge simulation results.
Table A4.
Node/Edge simulation results.
| Node/ Edge | Successful Intrusions | Failed Intrusions | Interception Probability | Node /Edge | Successful Intrusions | Failed Intrusions | Interception Probability |
|---|---|---|---|---|---|---|---|
| n1 | 3688 | 2312 | 0.385 | e4 | 313 | 319 | 0.505 |
| n2 | 2127 | 873 | 0.291 | e5 | 234 | 474 | 0.669 |
| n3 | 2063 | 937 | 0.312 | e6 | 472 | 947 | 0.667 |
| n4 | 2259 | 1741 | 0.435 | e7 | 448 | 254 | 0.362 |
| n5 | 3405 | 1595 | 0.319 | e8 | 526 | 160 | 0.233 |
| n6_1 | 656 | 344 | 0.344 | e9 | 520 | 155 | 0.230 |
| n6_2 | 636 | 364 | 0.364 | e10 | 1091 | 1168 | 0.517 |
| n6_3 | 1276 | 724 | 0.362 | e11 | 1101 | 933 | 0.459 |
| n6_4 | 673 | 327 | 0.327 | e12 | 626 | 745 | 0.543 |
| n6_5 | 1291 | 709 | 0.355 | e13 | 363 | 928 | 0.719 |
| n6_6 | 1264 | 736 | 0.368 | e14 | 604 | 660 | 0.522 |
| n6_7 | 668 | 332 | 0.332 | e15 | 369 | 304 | 0.452 |
| n6_8 | 1273 | 727 | 0.364 | e16 | 219 | 449 | 0.672 |
| n6_9 | 1955 | 1045 | 0.348 | e17 | 574 | 702 | 0.550 |
| n6_10 | 657 | 343 | 0.343 | e18 | 334 | 302 | 0.475 |
| n6_11 | 2582 | 1418 | 0.355 | e19 | 286 | 370 | 0.564 |
| n7 | 426 | 412 | 0.492 | e20 | 1371 | 1211 | 0.469 |
| n8 | 764 | 395 | 0.341 | e21 | 305 | 352 | 0.536 |
| n9 | 485 | 218 | 0.310 | e22 | 1273 | 682 | 0.349 |
| n10 | 597 | 169 | 0.221 | e23 | 1273 | 0 | 0.000 |
| n11 | 767 | 279 | 0.267 | e24 | 122 | 108 | 0.470 |
| n12 | 587 | 195 | 0.249 | e25 | 55 | 141 | 0.719 |
| n13 | 558 | 254 | 0.313 | e26 | 186 | 178 | 0.489 |
| n14 | 1714 | 748 | 0.304 | e27 | 233 | 167 | 0.418 |
| n15 | 598 | 227 | 0.275 | e28 | 129 | 356 | 0.734 |
| n16 | 2374 | 0 | 0.000 | e29 | 135 | 462 | 0.774 |
| n17 | 920 | 979 | 0.516 | e30 | 97 | 271 | 0.736 |
| n18 | 186 | 162 | 0.466 | e31 | 99 | 300 | 0.752 |
| n19 | 215 | 125 | 0.368 | e32 | 343 | 244 | 0.416 |
| n20 | 369 | 112 | 0.233 | e33 | 158 | 400 | 0.717 |
| n21 | 297 | 163 | 0.354 | e34 | 110 | 307 | 0.736 |
| n22 | 182 | 86 | 0.321 | e35 | 116 | 314 | 0.730 |
| n23 | 116 | 0 | 0.000 | e36 | 3 | 417 | 0.993 |
| n24 | 212 | 160 | 0.430 | e37 | 124 | 323 | 0.723 |
| n25 | 224 | 122 | 0.353 | e38 | 156 | 442 | 0.739 |
| n26 | 82 | 42 | 0.339 | e39 | 216 | 578 | 0.728 |
| n27 | 356 | 112 | 0.239 | e40 | 468 | 314 | 0.402 |
| n28 | 308 | 162 | 0.345 | e41 | 470 | 328 | 0.411 |
| n29 | 101 | 85 | 0.457 | e42 | 248 | 248 | 0.500 |
| n30 | 43 | 32 | 0.427 | e43 | 325 | 99 | 0.233 |
| n31 | 97 | 75 | 0.436 | e44 | 186 | 0 | 0.000 |
| n32 | 24 | 10 | 0.294 | e45 | 75 | 140 | 0.651 |
| n33 | 78 | 69 | 0.469 | e46 | 172 | 197 | 0.534 |
| n34 | 43 | 21 | 0.328 | e47 | 34 | 263 | 0.886 |
| n35 | 50 | 29 | 0.367 | e48 | 147 | 35 | 0.192 |
| n36 | 67 | 54 | 0.446 | e49 | 64 | 52 | 0.448 |
| n37 | 16 | 27 | 0.628 | e50 | 79 | 133 | 0.627 |
| n38 | 110 | 55 | 0.333 | e51 | 121 | 103 | 0.460 |
| n39 | 111 | 54 | 0.327 | e52 | 43 | 39 | 0.476 |
| e1 | 475 | 750 | 0.612 | e53 | 165 | 191 | 0.537 |
| e2 | 555 | 667 | 0.546 | e54 | 165 | 143 | 0.464 |
| e3 | 334 | 275 | 0.452 |
Table A5.
Intrusion Path simulation results.
Table A5.
Intrusion Path simulation results.
| Node /Edge | Successful Intrusions | Failed Intrusions | Interception Probability | Node /Edge | Successful Intrusions | Failed Intrusions | Interception Probability |
|---|---|---|---|---|---|---|---|
| r1 | 24 | 976 | 0.976 | r22 | 20 | 980 | 0.98 |
| r2 | 8 | 992 | 0.992 | r23 | 8 | 992 | 0.992 |
| r3 | 14 | 986 | 0.986 | r24 | 20 | 980 | 0.98 |
| r4 | 15 | 985 | 0.985 | r25 | 30 | 970 | 0.97 |
| r5 | 22 | 978 | 0.978 | r26 | 32 | 968 | 0.968 |
| r6 | 4 | 996 | 0.996 | r27 | 2 | 998 | 0.998 |
| r7 | 7 | 993 | 0.993 | r28 | 23 | 977 | 0.977 |
| r8 | 18 | 982 | 0.982 | r29 | 17 | 983 | 0.983 |
| r9 | 15 | 985 | 0.985 | r30 | 32 | 968 | 0.968 |
| r10 | 37 | 963 | 0.963 | r31 | 30 | 970 | 0.97 |
| r11 | 52 | 948 | 0.948 | r32 | 23 | 977 | 0.977 |
| r12 | 16 | 984 | 0.984 | r33 | 18 | 982 | 0.982 |
| r13 | 17 | 983 | 0.983 | r34 | 3 | 997 | 0.997 |
| r14 | 18 | 982 | 0.982 | r35 | 23 | 977 | 0.977 |
| r15 | 4 | 996 | 0.996 | r36 | 7 | 993 | 0.993 |
| r16 | 15 | 985 | 0.985 | r37 | 13 | 987 | 0.987 |
| r17 | 10 | 990 | 0.99 | r38 | 59 | 941 | 0.941 |
| r18 | 38 | 962 | 0.962 | r39 | 63 | 937 | 0.937 |
| r19 | 34 | 966 | 0.966 | r40 | 22 | 978 | 0.978 |
| r20 | 26 | 974 | 0.974 | r41 | 20 | 980 | 0.98 |
| r21 | 13 | 987 | 0.987 |
References
- Zhang, J.; Liu, J.; Liu, Y.; Wang, Z.; Chen, H.; Wang, B.; Liu, X. Using 3D model and simulation to support the force-on-force test of physical protection system. IEEE Access 2021, 9, 63833–63840. [Google Scholar] [CrossRef]
- Zeng, T.; Yang, X.; Wan, Y.; Mao, Y.; Liu, Z. Effectiveness assessment of improvement measures in physical protection system monitoring center. Kerntechnik 2021, 86, 33–38. [Google Scholar] [CrossRef]
- Garcia, M.L. Vulnerability Assessment of Physical Protection Systems; Elsevier: Amsterdam, The Netherlands, 2005. [Google Scholar]
- Garcia, M.L. Design and Evaluation of Physical Protection Systems; Elsevier: Amsterdam, The Netherlands, 2007. [Google Scholar]
- Vintr, Z.; Vintr, M.; Malach, J. Evaluation of physical protection system effectiveness. In Proceedings of the 2012 IEEE International Carnahan Conference on Security Technology (ICCST), Newton, MA, USA, 15–18 October 2012; pp. 15–21. [Google Scholar]
- Drago, A.; Marrone, S.; Mazzocca, N.; Nardone, R.; Tedesco, A.; Vittorini, V. A model-driven approach for vulnerability evaluation of modern physical protection systems. Softw. Syst. Model. 2019, 18, 523–556. [Google Scholar] [CrossRef]
- Čakija, D.; Ban, Ž.; Golub, M.; Čakija, D. Optimizing physical protection system using domain experienced exploration method. Autom. Časopis Autom. Mjer. Elektron. Računarstvo Komun. 2020, 61, 207–218. [Google Scholar] [CrossRef]
- Moo, J.H.; Chirayath, S.S.; Cho, S.G. Physical protection system vulnerability assessment of a small nuclear research reactor due to TNT-shaped charge impact on its reinforced concrete wall. Nucl. Eng. Technol. 2022, 54, 2135–2146. [Google Scholar] [CrossRef]
- Gregoire, O. The application of defence in depth in nuclear security. In Proceedings of the 42nd Annual CNS Conference and 47th CNS/CNA Student Conference: Shifting the Paradigm of Thought, Saint John, NB, Canada, 4–7 June 2023; Canadian Nuclear Society: Toronto, ON, Canada, 2023; pp. 4–8. [Google Scholar]
- Kapusta, J.; Bauer, W.; Baranowski, J. Evaluation of the Effectiveness Of Physical Protection Systems with Consideration of its Cyber-Resilience. In Proceedings of the 2023 27th International Conference on Methods and Models in Automation and Robotics (MMAR), Międzyzdroje, Poland, 22–25 August 2023; pp. 457–461. [Google Scholar]
- Yaseen, A.T.; Jarry, A.M. Designing a Physical Protection System for a Nuclear or Radiological Site or Facility (Threat Analysis and Evaluation). In Proceedings of the 16th Arab Conference on the Peaceful Uses of Atomic Energy, Amman, Jordan, 15–19 December 2024. [Google Scholar]
- Winblad, A.E. The SAVI vulnerability assessment model. Nucl. Mater. Manag. 1987, 16, 24–28. [Google Scholar]
- Snell, M.K. Multipath Very-Simplified Estimate of Adversary Sequence Interruption v. 2.1; No. MP VEASI; 005477IBMPC00; Sandia National Lab.(SNL-NM): Albuquerque, NM, USA, 2017.
- O’Connor, S.L.; Whitehead, D.W.; Potter, C.S., III. Nuclear Power Plant Security Assessment Technical Manual; No. SAND2007-5591; Sandia National Laboratories (SNL): Albuquerque, NM, USA; Livermore, CA, USA, 2007.
- Andiwijayakusuma, D.; Mardhi, A.; Asmoro, T.; Setiadipura, T.; Purqon, A.; Su’ud, Z. Physical protection system effectiveness calculation in nuclear reactor facility using EASI code: Case study sabotage scenario. J. Phys. Conf. Ser. 2021, 2072, 012010. [Google Scholar] [CrossRef]
- Zou, B.; Yang, M.; Zhang, Y.; Benjamin, E.R.; Tan, K.; Wu, W.; Yoshikawa, H. Evaluation of vulnerable path: Using heuristic path-finding algorithm in physical protection system of nuclear power plant. Int. J. Crit. Infrastruct. Prot. 2018, 23, 90–99. [Google Scholar] [CrossRef]
- Yang, J.; Wang, J.; Wei, G.; Yang, M.; Lu, H. An adaptive probabilistic mapping matrix search algorithm for vulnerability analysis of PPS. Ann. Nucl. Energy 2019, 131, 433–442. [Google Scholar] [CrossRef]
- Jiwei, Z.; Shunlong, J.; Jian, L.; Zhang, L.; Huaping, C.; Xiaofeng, L. Optimization of communication probability in effectiveness evaluation of physical protection system. IEEE Access 2020, 8, 228199–228205. [Google Scholar] [CrossRef]
- Wadoud, A.A.; Alhawsawi, A.M.; Ghandourah, E.; Abdel-Rahman, M.A. A detection and defense security system design for nuclear waste storage against stealth terrorists attack. Kerntechnik 2024, 89, 426–437. [Google Scholar] [CrossRef]
- Wadoud, A.A.; Saleh, A.A.; Abdel-Rahman, M.A. Risk analysis and protection in case of intrusion of nuclear facilities. Kerntechnik 2025, 90, 217–230. [Google Scholar] [CrossRef]
- Li, A.; Deng, Y. A 3D most vulnerable path search method for physical protection systems based on the EASI model. IEEE Access 2025, 13, 37457–37466. [Google Scholar] [CrossRef]
- Artime, O.; Grassia, M.; De Domenico, M.; Gleeson, J.P.; Makse, H.A.; Mangioni, G.; Perc, M.; Radicchi, F. Robustness and resilience of complex networks. Nat. Rev. Phys. 2024, 6, 114–131. [Google Scholar] [CrossRef]
- Yu, X.; Wu, Y.; Meng, F.; Zhou, X.; Liu, S.; Huang, Y.; Wu, X. A review of graph and complex network theory in water distribution networks: Mathematical foundation, application and prospects. Water Res. 2024, 253, 121238. [Google Scholar] [CrossRef] [PubMed]
- Tang, Y.; Dai, G.; Zhou, Y.; Huang, Y.; Zhou, D. Conflicting evidence fusion using a correlation coefficient-based approach in complex network. Chaos Solitons Fractals 2023, 176, 114087. [Google Scholar] [CrossRef]
- Lü, J.; Wen, G.; Lu, R.; Wang, Y.; Zhang, S. Networked knowledge and complex networks: An engineering view. IEEE/CAA J. Autom. Sin. 2022, 9, 1366–1383. [Google Scholar] [CrossRef]
- Lin, J.; Ban, Y. Complex network topology of transportation systems. Transp. Rev. 2013, 33, 658–685. [Google Scholar] [CrossRef]
- Porta, S.; Latora, V.; Crucitti, P. The network analysis of urban streets: A primal approach. In Environment and Planning; SAGE Publications Ltd.: London, UK, 2012; pp. 247–276. [Google Scholar]
- Li, J.J. Research on Construction Method and Application of Complex Public Transport Network Model. Master’s Thesis, Dalian Maritime University, Dalian, China, 2023. [Google Scholar] [CrossRef]
- Börner, K.; Sanyal, S.; Vespignani, A. Network science. Annu. Rev. Inf. Sci. Technol. 2007, 41, 537–607. [Google Scholar] [CrossRef]
- Duan, J.Y.; Zheng, H.D. Vulnerability analysis method for complex networks based on node importance. Control Eng. China 2020, 4, 692–696. [Google Scholar] [CrossRef]
- Kabir, S.; Papadopoulos, Y. Applications of Bayesian networks and Petri nets in safety, reliability, and risk assessments: A review. Saf. Sci. 2019, 115, 154–175. [Google Scholar] [CrossRef]
- Guo, Y.; Meng, X.; Wang, D.; Meng, T.; Liu, S.; He, R. Comprehensive risk evaluation of long-distance oil and gas transportation pipelines using a fuzzy Petri net model. J. Nat. Gas. Sci. Eng. 2016, 33, 18–29. [Google Scholar] [CrossRef]
- Zhou, J.; Reniers, G.; Zhang, L. A weighted fuzzy Petri-net based approach for security risk assessment in the chemical industry. Chem. Eng. Sci. 2017, 174, 136–145. [Google Scholar] [CrossRef]
- Wang, X.; Lu, F.; Zhou, M.; Zeng, Q. A synergy-effect-incorporated fuzzy Petri net modeling paradigm with application in risk assessment. Expert. Syst. Appl. 2022, 199, 117037. [Google Scholar] [CrossRef]
- Lin, J.; Li, Q.; Wang, Y. Comprehensive evaluation of intrinsic safety of railway facilities and equipment based on improved cloud model-fuzzy Petri net. Proc. Inst. Mech. Eng. Part O J. Risk Reliab. 2025, 239, 298–309. [Google Scholar] [CrossRef]
- Yang, B.; Zhang, X.; Liu, Y.; Gao, Z.; Ye, M. Airspace Safety Assessment and Risk Estimation based on the Fuzzy Petri Net Model with Multi-Risk Factor Analysis. Transp. Res. Rec. 2024, 2679, 718–732. [Google Scholar] [CrossRef]
- Liu, H.C.; Liu, L.; Lin, Q.L.; Liu, N. Knowledge acquisition and representation using fuzzy evidential reasoning and dynamic adaptive fuzzy Petri nets. IEEE Trans. Cybern. 2012, 43, 1059–1072. [Google Scholar] [CrossRef]
- Jiang, W.; Zhou, K.Q.; Sarkheyli-Hägele, A.; Zain, A.M. Modeling, reasoning, and application of fuzzy Petri net model: A survey. Artif. Intell. Rev. 2022, 55, 6567–6605. [Google Scholar] [CrossRef]
- Xu, X.G.; Shi, H.; Xu, D.H.; Liu, H.C. Picture fuzzy Petri nets for knowledge representation and acquisition in considering conflicting opinions. Appl. Sci. 2019, 9, 983. [Google Scholar] [CrossRef]
- GB 50348-2018; Technical Standard for Security Engineering. State Administration for Market Regulation, Standardization Administration of China: Beijing, China, 2018.
- GJB 7674-2012; Guide for Inspection of Physical Protection of Military Nuclear Materials. Equipment Development Department of the Central Military Commission: Beijing, China, 2012.
- GJB 6118-2007; Guide for Access Control of Physical Protection System of Military Nuclear Material. Equipment Development Department of the Central Military Commission: Beijing, China, 2007.
- GAT 1093-2013; Technical Requirements for Face Recognition System For Access Control. Ministry of Public Security of the People’s Republic of China: Beijing, China, 2013.
- GAT 1399.1-2017; Video and Image Analysis System for Public Security—Part 1: General Technical Requirements. Ministry of Public Security of the People’s Republic of China: Beijing, China, 2017.
- GAT 1399.2-2017; Video and Image Analysis System for Public Security—Part 2: Technical Specifications for Analysis and Description of Video and Image Content. Ministry of Public Security of the People’s Republic of China: Beijing, China, 2017.
- GAT 992-2012; Technical Requirements for Access Control Devices in Parking Lots. Ministry of Public Security of the People’s Republic of China: Beijing, China, 2012.
Disclaimer/Publisher’s Note: The statements, opinions and data contained in all publications are solely those of the individual author(s) and contributor(s) and not of MDPI and/or the editor(s). MDPI and/or the editor(s) disclaim responsibility for any injury to people or property resulting from any ideas, methods, instructions or products referred to in the content. |
© 2025 by the authors. Licensee MDPI, Basel, Switzerland. This article is an open access article distributed under the terms and conditions of the Creative Commons Attribution (CC BY) license (https://creativecommons.org/licenses/by/4.0/).