Abstract
In reactive power compensators applied in drives with asynchronous motors, a control strategy focusing on the compensation of higher-order current harmonics is implemented. Control schemes of such compensators typically employ low-pass Butterworth filters with fixed cut-off frequencies to isolate the reactive power component. However, the impact of alternative filter types on compensator performance remains insufficiently explored. Furthermore, in the control systems under consideration, stator phase current signals of the asynchronous motor are used as reference inputs. This approach proves effective under the steady-state operating conditions of the drive. Under non-steady-state operating conditions—typical for traction drive systems—this approach becomes ineffective due to the increased complexity in obtaining accurate reference current signals. As a result, the performance of the filters also deteriorates. It is therefore proposed to investigate the impact of alternative filter types on the efficiency of compensator operation. To address this challenge, the following strategies are suggested: implement higher-order harmonic compensation in the system of stator phase supply voltages of the asynchronous motor; use the control signals from the Field-Oriented Control (FOC) algorithm as reference inputs; and adapt the cut-off frequencies of the filters dynamically to match the frequency of the supply voltage. The simulation results indicate that the use of an elliptic filter in compensator control systems yielded the highest effectiveness. Moreover, the results confirmed the efficiency of the proposed solutions under both steady-state and non-steady-state operating conditions of the traction drive. These approaches support the development of reactive power compensators integrated into traction drive systems for railway rolling stock.
1. Introduction
The railway sector remains one of the most energy-intensive branches of the economy. The largest share of energy consumption in rail transport is attributed to train traction, specifically to the operation of the traction drive systems of rolling stock. Therefore, improving the technical and operational performance of rolling stock by reducing energy consumption is a strategic priority for railways in every country worldwide [1,2].
The traction drive of railway rolling stock is the single largest consumer of energy within the railway infrastructure. Consequently, enhancing its energy performance constitutes the highest-priority direction in addressing the challenge of reducing energy consumption in the railway transport sector [3,4].
Addressing this challenge is further complicated by the operational characteristics of rolling stock. During service, the dynamic properties of the rolling stock are subject to continuous variation [5,6,7]. This results in continuous fluctuations in load, which in turn lead to persistent transient processes and, consequently, to a reduction in the energy efficiency of the traction drive system of the rolling stock.
Asynchronous motors [8], synchronous motors [9,10], and series-excited direct current motors [11] are used as traction machines in the traction drive systems of rolling stock. Among these, asynchronous (induction) motors are the most widely applied in traction systems for railway transport.
The traction drive system with asynchronous motors can be conventionally divided into two main components: the input stage and the output stage. The output stage, which includes the traction motors and output power converters, accounts for the largest share of energy consumption within the traction system. Therefore, this study focuses exclusively on the output stage of the traction drive for subsequent analysis and modeling.
The output power converter in the traction drive system is implemented as a standalone inverter. Its operation is typically controlled using a pulse-width modulation (PWM) algorithm. This control approach introduces higher-order current harmonics into the output stage of the traction drive. Although increasing the PWM switching frequency reduces the amplitude of these harmonics, it simultaneously leads to greater switching losses in the inverter’s power transistors [12]. Moreover, the switching frequency of traction inverters is typically limited to 1 kHz [12], which is significantly lower than that of general-purpose drives. As a result, power losses in the traction drive system of rolling stock increased substantially.
An analysis of operational factors and the structure of traction drive components reveals the following:
- Non-linear current–voltage characteristics of the inverter’s power transistors are primary sources of higher-order current harmonics.
- Variations in the dynamic behavior of the train lead to instability in the loading conditions of the traction drive. This results in continuous transient processes within the system, which in turn affect the harmonic content of the stator phase currents in the traction motor.
The presence of higher-order harmonics in the stator phase voltages of an asynchronous motor leads to increased power losses within the machine. This effect can be attributed to the following factors:
- An increase in the temperature of the motor windings [13], which results in a rise in their ohmic resistance.
- An increase in magnetic (core) losses in the motor steel laminations [14], which are frequency-dependent and grow with the order of the harmonic components.
In addition, the presence of higher-order harmonics in the stator phase voltages causes torque ripple generation [15], which leads to power losses in the mechanical part of the drive. It should also be noted that the temperature rise in the motor windings—induced by the higher-order harmonic components of the phase currents—can result in insulation overheating. This reduces the motor’s reliability and may ultimately lead to fault conditions or failure.
The analysis indicates that improving the energy efficiency of the traction drive requires targeted measures to mitigate higher-order harmonics in the stator phase current spectra of the traction motor. In electrical systems, this is typically achieved through the implementation of various reactive power compensators. The power stage of such compensators is commonly realized in the form of active filters [16,17].
According to Parseval’s theorem [18], filtering can be performed either in the frequency domain or in the time domain. In the context of active filter control systems used in reactive power compensators, adaptive filtering techniques are employed to implement frequency-domain filtering. These techniques include the least mean squares (LMSs) adaptive method [19,20,21], predictive filtering based on forecasting of the controlled variable [22,23], as well as Kalman filtering [24,25] and Wiener filtering [26,27].
The methods generally offer higher filtering accuracy compared to time-domain approaches; however, they also present several critical limitations. The first limitation is associated with low convergence rates, leading to prolonged transient behavior during filter adaptation [28]. This issue is particularly relevant in traction drive systems, where unstable operating modes frequently occur due to varying service conditions of the rolling stock. The second limitation also arises from operational characteristics. Traction drives typically utilize either Field-Oriented Control (FOC) [29] or direct torque control (DTC) [30,31]. In both cases, the stator phase voltage frequency is proportional to the rotor speed of the asynchronous motor, which continuously varies during operation. This variability complicates the synthesis of accurate stator current reference signals required for implementing adaptive filtering algorithms.
Time-domain filtering methods offer faster convergence and facilitate easier synthesis of reference signals for stator phase currents. When using time-domain filtering, control systems for active power filters can be developed based on strategies such as the instantaneous reactive power compensation scheme (p–q control) [31,32,33,34] and the instantaneous active and reactive current control scheme (Id–Iq control) [35,36,37].
A common feature of the control strategies is the calculation and extraction—via appropriate filters—of the reactive power to be compensated. Based on this quantity, control signals for the active power filter are synthesized. In harmonic compensation scenarios, where the source of distortion is non-linear loading, low-pass filters are typically employed. To attenuate higher-frequency voltage harmonics, filters with higher cut-off frequencies are used. The studies cited in this context frequently utilize Butterworth filters of the fourth or fifth order.
In addition to the commonly used Butterworth approximation, other filter approximations exist, including the Chebyshev [38], Cauer (elliptic) [38], and Bessel [39] types. These approximations serve as the basis for synthesizing Chebyshev Type I and Type II filters, Cauer (elliptic) filters, and Bessel filters. Each of these filter types exhibits different ripple characteristics within both the passband and the stopband, as well as different transition bandwidths between these regions. These factors directly influence filtering quality and, consequently, the performance of the reactive power compensator. A key limitation observed in the reviewed studies on time-domain reactive power compensation methods is the use of filters with fixed cut-off frequencies. Given that the supply voltage frequency in traction drive systems is subject to continuous variation, employing filters with static cut-off frequencies is inappropriate in such applications, as this introduces filtering errors. This, in turn, reduces the effectiveness of reactive power compensation.
In summary, the review of studies dedicated to reactive power compensation methods based on time-domain filtering reveals two key limitations. First, the influence of filter type on the performance of reactive power compensator control systems has not been thoroughly investigated. Second, the filters in these studies are typically designed with fixed cut-off frequencies, which hinders the compensator’s ability to operate correctly under varying frequencies of the monitored signals.
The objective of this study is to investigate the influence of filter type on the performance of reactive power compensator control systems in traction drives of railway rolling stock equipped with asynchronous motors.
The research contributions of the article are as follows:
- A novel approach is proposed in which, instead of compensating higher-order voltage harmonics within the line voltage system, compensation is performed within the stator phase voltage system.
- For the examined filter types, a structural scheme is developed that enables dynamic adaptation of the filter cut-off frequencies to variations in the supply frequency of the asynchronous motor.
- An algorithm is proposed for evaluating convergence, defined as the time required for the modulus of the spatial vectors of the stator currents in the studied configuration to match those in a reference system powered by pure sinusoidal voltages.
- The effect of the filter approximation method on the reactive power compensator’s effectiveness is thoroughly investigated.
- Within an FOC framework, the impact of adapting the filter cut-off frequency to the supply frequency is assessed with respect to efficiency, torque ripple coefficient, convergence behavior, and total harmonic distortion (THD).
The structure of the paper is as follows: Section 2 provides the rationale for selecting the power circuit configuration and the control strategy of the reactive power compensator. It also presents the derivation of transfer functions for high-frequency filters and the development of an integrated model of the output stage of the traction drive system incorporating the compensator. Section 3 presents the simulation results and their subsequent analysis. Section 4 is devoted to the discussion of the obtained findings and their comparison with the results reported in related studies. Finally, the paper concludes with Section 5, which summarizes the main conclusions.
2. Materials and Methods
As a prototype, the traction drive output section of the DS-3 series electric locomotive (produced by Dnepropetrovsk Electric Locomotive Plant, Dnipro, Ukraine jointly with Siemens, Munich, Germany) was chosen. The traction drive system of the DS-3 series electric locomotive uses a vector control system for induction motors.
To simplify the research, we made the following assumptions:
- Autonomous voltage inverter receives power directly from the DC link.
- The induction motor for the traction drive system serves as a linear load.
The traction drive of the specified electric locomotive uses induction motors of STA-1200 series (Smelyansky Electromechanical Plant Ltd., Smila, Ukraine), parameters of which are given in Table 1 [14].

Table 1.
Parameters of the induction motor series STA-1200 (Smelyansky Electromechanical Plant Ltd., Smila, Ukraine) [14].
Bipolar insulated gate transistor (IGBT) modules 5SNA 1200G450350 (ABB, Västerås, Sweden) are used as power transistors on this electric locomotive, the parameters of which are given in Table 2 [29].

Table 2.
Parameters of the IGBT module 5SNA 1200G450350 (ABB, Västerås, Sweden) [29].
2.1. Justification for the Selection of the Reactive Power Compensator Topology and Development of Its Integration Scheme into the Power Circuit of the Traction Drive
The analysis indicates that, in the system considered, the primary source of higher-order harmonics is the inverter, as the non-linear processes within the asynchronous motor are not considered. Consequently, in this context, the task of reactive power compensation is reduced to the elimination of higher-order harmonics from the supply voltage system of the asynchronous motor. To enhance the energy efficiency of the traction drive, it is therefore necessary to ensure a sinusoidal waveform of the stator phase currents. The method aimed at maintaining a sinusoidal load current waveform in the presence of harmonic distortions in the voltage supply—assuming a linear load—is commonly referred to as harmonic damping of the supply voltage.
In [40], a connection scheme for integrating a reactive power compensator into the traction drive power circuit was proposed, based on damping higher-order harmonics of the supply voltage. This approach was developed for the case in which the load is powered by a voltage source with a constant frequency. In that study, the reference signals were chosen as sinusoidal line voltages with a fixed frequency. Such an approach is valid only under the assumption that the traction drive operates at a constant shaft rotation speed of the asynchronous motor. Under these conditions, the compensator is activated only after the transient modes have ended, and reactive power compensation is performed exclusively during the steady-state operation.
In traction drive systems, the reference rotational speed of the asynchronous motor shaft continuously varies, which inherently results in the presence of non-steady-state operating conditions. Therefore, to enhance the overall efficiency of the traction drive, reactive power compensation must be implemented not only during the steady-state operation but also under transient and dynamically changing conditions.
In a traction drive system employing FOC, the following condition must be satisfied:
where ψnom is the nominal value of the flux linkage of the induction motor magnetization circuit, Usm is the amplitude of the stator phase voltage, and ωk is the angular frequency of the stator phase voltage.
Under conditions of continuous variation in the stator phase voltage frequency, fulfilling condition (1) for harmonic compensation in the line voltage system of the asynchronous motor becomes a complex task. Therefore, it is proposed to perform higher-order harmonic compensation directly within the line voltage system of the motor’s supply. To facilitate this, the use of a delta configuration for the secondary windings of the transformer—through which the compensator is connected to the traction drive’s power circuit—is recommended. This choice is justified by the fact that in a delta connection, the line voltages are equal to the phase voltages.
In the proposed compensation scheme, it is recommended to use voltage signals as reference inputs and to perform compensation of higher-order harmonic components within the phase supply voltages. Accordingly, the proposed configuration for integrating the power stage of the reactive power compensator into the input section of the traction drive is illustrated in Figure 1.
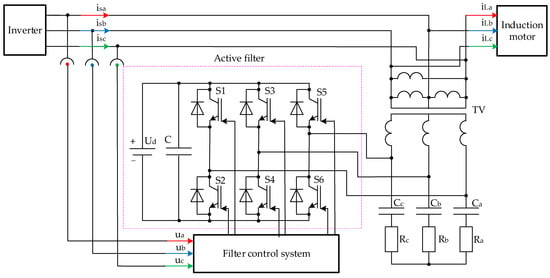
Figure 1.
Connection circuit proposed for linking up the power section of the reactive power compensator with the output section of the traction drive.
In Figure 1, the power stage of the active filter is implemented using IGBT power transistors VT1–VT6. The voltage Ud represents the voltage drop across the DC link. Capacitor C functions as a barrier that prevents higher-order current harmonics from propagating from the inverter’s power circuit into the DC link. The transformer TV is employed to match the amplitude levels of the stator phase currents of the asynchronous motor and the compensating currents.
To provide a conduction path for higher-order current harmonics within the compensator’s power circuit and to ensure their transfer into the active filter stage, passive high-frequency filters are employed. These filters, composed of elements Ra, Rb, Rc, Ca, Cb and Cc, are tuned to the fundamental frequency of the supply voltage system. The phase voltages of the inverter shown in Figure 1 are denoted as ua, ub, and uc.
The calculation of the components of the compensator’s power stage is provided below in the subsection “Development of the Simulation Model of the Traction Drive”.
2.2. Justification of the Power Circuit Topology for the Reactive Power Compensator and Integration Scheme into the Traction Drive Power System
Since most of the control strategies that considered filtering the higher current harmonics in the time domain are implemented based on the instantaneous power theory (p–q theory), in this paper the method of controlling the instantaneous reactive power in the p–q coordinates is chosen as the control strategy for the reactive power compensator [34].
Since in the implementation of this method the calculation of the controlled parameters expressed in abc coordinates is carried out in αβ coordinates, the direct Clark transformation should be applied to the input values. In this case, the input variables are the inverter phase voltages ua, ub, and uc. The values of the inverter phase voltages in αβ coordinates have the following form [29]:
where ua, ub, and uc are phase voltages of the induction motor stator in abc coordinates.
As stated in Section 2.1, the filter control system implements the compensation principle based on the determination of the stator phase voltages. The structure of such a control system is shown in Figure 2. An important part of such a control system is the phase-locked loop (PLL) circuit.
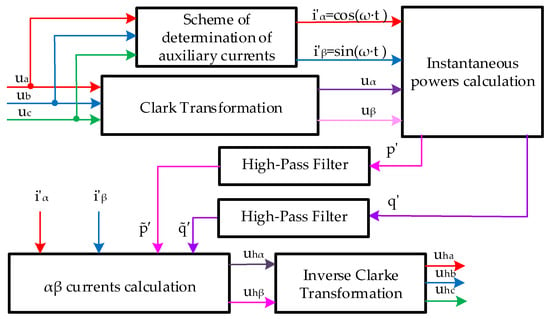
Figure 2.
Voltage-based control of the active filter.
An important part of such a control system is the phase-locked loop (PLL) circuit. The PLL block is a synchronization circuit that automatically determines the system frequency and phase angle of the main component of the three-phase common input signal direct sequence. In this case, these are the three-phase measured phase voltages ua, ub, and uc. The PLL also generates auxiliary currents [40]:
where ω is the angular frequency of the induction motor supply voltage.
These currents are necessary to calculate the values of auxiliary instantaneous active power p’ and auxiliary instantaneous reactive power q’ (Figure 1). The specified powers are calculated as follows [40]:
where uα and uβ are the phase voltages of the induction motor stator in αβ coordinates, and and are the auxiliary currents calculated according to Equation (4).
FOC or DTC are used in the traction drive [29,30]. In these systems, the system frequency and phase angle of the three-phase total input main component in the direct sequence are determined based on the rotation frequency of the induction motor shaft. Therefore, it is not advisable to determine these parameters again. Consequently, when constructing a reactive power compensator for the traction drive, functions of the PLL circuit will be limited only to generating auxiliary currents and (Figure 3).

Figure 3.
Functional structural circuit of auxiliary current determination.
The controller determines “instantaneously” and continuously the harmonic content of the measured voltage (uf+uh) on the phases to which the active filter is connected. If the phase voltage is balanced, i.e., does not contain negative sequence and/or zero sequence components at the fundamental frequency, the difference between the measured voltage and the output of this positive sequence detector corresponds to the harmonic voltage uh, i.e., [40]:
where uk is the phase voltage of the k-th phase, and u′k is the desired phase voltage of the k-th phase.
Harmonic voltage uh for the specified strategy of control in the αβ coordinate system is determined as follows [40]:
where and are the auxiliary currents calculated according to Equation (3) and and are the auxiliary instantaneous active power at the output of the high frequency filter and auxiliary instantaneous reactive power at the output of the high frequency filter, respectively.
To convert the obtained values of harmonic voltages expressed in αβ coordinates to abc coordinates, we use the inverse Clark transformation [29]:
High-pass filters separate the oscillatory components of the auxiliary real power (p′) and auxiliary instantaneous reactive power and fictitious power (q′), which are calculated using the auxiliary currents and . Signals and are generated in the auxiliary current determination circuit as built from the auxiliary positive sequence current component at the fundamental frequency. Thus, the average real power , together with the average fictitious power , constitute the main positive sequence power component of the measured phase voltage.
2.3. Development of the Active Filter Voltage Control Circuit
Figure 4 shows the active filter voltage control circuit. This circuit compares the compensation voltage uhi with the actual phase voltage ui. Each phase voltage ui is determined at the point of active filter installation. Then, the difference signal Δui is added to the reference voltage signal uei. As a result, three current controllers produce a three-phase reference voltage. Then, each reference voltage value u*i is compared with a periodic triangle-shaped signal having a repetition rate equal to 20·fnom (fnom is the nominal frequency of phase voltages of the induction motor stator) to generate gate signals for IGBT.
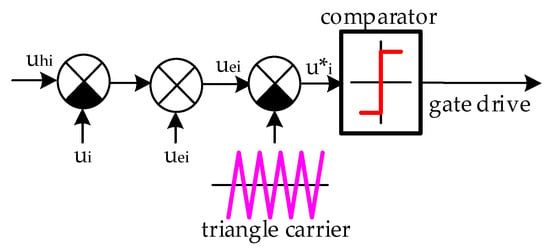
Figure 4.
Current control voltage for one phase.
2.4. Determining the Parameters of Filter Transfer Functions
In this paper, we consider the operation of the compensator control system with the following types of high-frequency filters: Butterworth filter, direct Chebyshev filter, inverse Chebyshev filter, Bessel filter, and elliptic filter (Cauer filter). Since the active filter control systems of the compensator in the considered works used Butterworth filters of the fourth or fifth order, in this work all filters were designed from the fifth order. The nominal supply frequency of the induction motor was taken as the cut-off frequency fcut = fnom = 55.8 Hz. The calculation of the transfer function parameters is provided in Appendix A. In its general form, the transfer function of a fifth-order filter can be expressed as follows:
The structural circuit of the filter is based on the method of sequential integration (Figure 5) [41].

Figure 5.
High-pass filter structural circuit.
2.5. Development of a Simulation Model of the Traction Drive Without a Control System
The simulation model of the inverter was developed in the MATLAB18b/Simscape/Specialized Power Systems environment. The power stage of the inverter is implemented using “IGBT/Diode” components, while the pulse-width modulation (PWM) algorithm is realized using the “PWM Generator (2-level)” block.
In the development of the comprehensive model of the traction drive’s output section (Figure 6), a simulation model of the asynchronous motor implemented in three-phase coordinates was used, as described in [14]. This model is not presented in detail in the current work, as it has been extensively documented in the referenced study. The validation of this model was carried out in the study [14], where the simulation results under nominal operating conditions—namely, the amplitudes of stator phase currents, rotor speed, and electromagnetic torque—were compared with the manufacturer’s data. The deviation in the amplitude of the stator phase currents was 1.7%, in the rotor speed 0.3%, and in the torque 0.74%, indicating a high level of accuracy in the obtained results. It is important to note that the stator and rotor windings of the asynchronous motor in this model were implemented using the MATLAB18b/Simscape/Specialized Power Systems environment, while all other components were developed within the MATLAB18b/Simulink environment. The parameters of the STA-1200 series asynchronous motor required for the development of the simulation model are listed in Table 1. In the comprehensive traction drive model, the simulation model of the asynchronous motor’s output section is incorporated within the “Asynchronous Motor” block, while the simulation model of the standalone voltage inverter is embedded in the “Inverter” block.
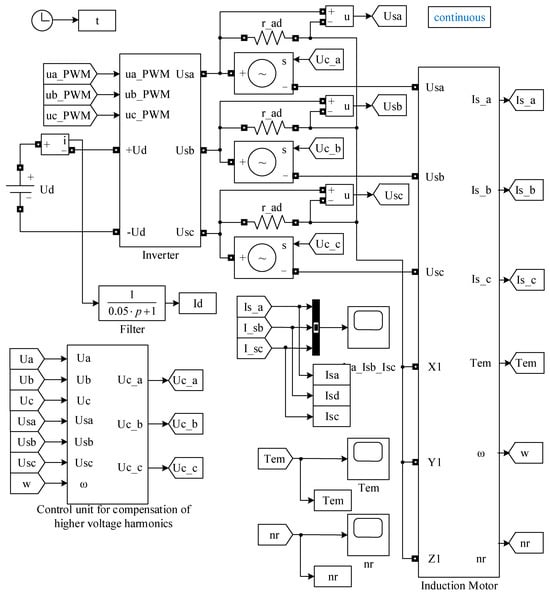
Figure 6.
Comprehensive simulation model of the traction drive with field-oriented control and reactive power compensator.
Since the comprehensive model of the traction drive output section utilizes elements from the MATLAB18b/Simscape/Specialized Power Systems library and operates in continuous-time mode, the simulation was implemented using a continuous solver. The “Voltage Harmonic Compensation Control Block” (Figure 6) emulates the functionality of the harmonic voltage compensation control scheme (Figure 2). The operational principle of this control scheme involves comparing a reference signal u with the signal uh generated by the reactive power compensator’s control system. The resulting error signal is then fed into a PWM modulator. The output of the modulator provides gate signals for the transistors of the active filter.
As the objective of the active filter is to eliminate higher-order harmonics in the stator voltage system of the asynchronous motor, the reference signals are proposed to be the fundamental components of the three-phase supply voltage system, defined as follows: Ua = Unom·exp(j0°), Ub = Unom·exp(−j120°), Uc = Unom·exp(j120°). These reference voltages represent an ideal sinusoidal supply and serve as the basis for maintaining voltage quality in the stator circuit.
In the process of developing the simulation model within the MATLAB18b/Simulink environment, it is technically incorrect to connect multiple voltage sources in parallel. Since the power circuit of the compensator is implemented as an inverter, the configuration shown in Figure 1 is not suitable for direct simulation due to these limitations. Consequently, two alternative implementation approaches for modeling the compensator’s power circuit are proposed:
- By using a controlled voltage source connected in opposition to the stator phase voltages of the asynchronous motor.
- By employing a controlled current source.
The comprehensive model (Figure 6) employs the Controlled Voltage Source component from the MATLAB18b/Simscape/Specialized Power Systems library to implement the power section of the reactive power compensator. The traction drive is powered by a DC link. In the integrated model (Figure 6), the DC link is represented by the DC Voltage Source element from the MATLAB18b/Simscape/Specialized Power Systems library. The value of the DC Voltage Source corresponds to the nominal instantaneous line voltage of the asynchronous motor 2642 B.
The Id signal is used to calculate the active power consumed by the traction drive. It is measured using an ammeter connected to the inverter’s power supply circuit. To prevent the penetration of alternating current components into the DC link, a large-capacitance capacitor is typically connected in parallel with the inverter terminals. However, in the MATLAB18b/Simscape/Specialized Power Systems environment, it is not feasible to connect a capacitor directly in parallel with the DC Voltage Source element.
As an alternative, a low-pass RC filter can be employed, with a cut-off frequency lower than that of the first harmonic. In such a filter, resistor R is connected in series with the DC Voltage Source, while capacitor C is connected in parallel. Nevertheless, placing R in series introduces additional power losses, which in turn leads to errors in determining the actual power drawn by the traction drive from the DC link.
In the simulation model (Figure 6), the operation of the low-pass filter is emulated by a first-order aperiodic circuit placed downstream of the ammeter. The time constant of this aperiodic circuit is set to 0.05 s, which corresponds to a low-pass filter cut-off frequency of 20 Hz.
To obtain the values of the stator phase voltages, we used voltmeters with a parallel connection of resistors r_ad with resistances of 10 kΩ. To display the simulation results, we used the elements of MATLAB18b/Simulink “Scope” library. The values of the stator phase currents are displayed in “Scope Isa_Isb_Isc”, the values of the torque are displayed in “Scope Tem”, and the values of the shaft rotation frequency of the induction motor are displayed in “Scope nr”.
Since the focus of this study is the damping of higher-order harmonics in the stator phase voltages, it is proposed to implement the compensator’s power circuit using a controlled voltage source. The control voltage applied to the input of the controlled voltage source, exemplified for phase a, is determined as follows:
where uha is the voltage coming from the reactive power compensator control system.
In the general form, the transfer function of a fifth-order filter can be described by Equation (8). As demonstrated in Appendix A, both the numerator and denominator coefficients of the transfer function change when converting a low-pass prototype filter to a high-frequency filter, since these coefficients are functions of the cut-off angular frequency. When the supply voltage frequency changes, the filter’s cut-off frequency also varies, resulting in corresponding changes to the numerator and denominator coefficients. Figure 7 presents the simulation model of the high-frequency filter, in which the transfer function coefficients are expressed as functions of the prototype filter parameters and the instantaneous supply frequency [41].
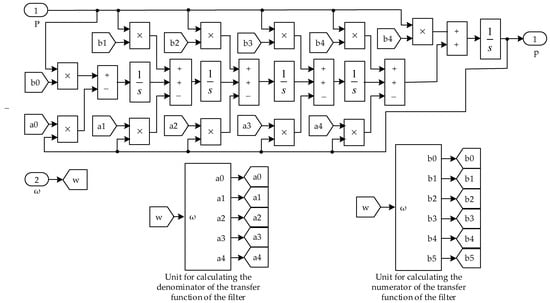
Figure 7.
High-pass filter simulation model.
The simulation model of the high-frequency filter was developed in the MATLAB18b/Simulink environment. To switch from one filter type to another, it is necessary to replace the prototype filter coefficients within the “Unit for calculating the denominator of the transfer function of the filter” and the “Unit for calculating the numerator of the transfer function of the filter.”
The DS-3 series electric locomotive, the traction drive of which is used in this study as a prototype, is operated with the use of field-oriented control. The structural circuit of the classical field-oriented control is shown in Figure 8 [29].
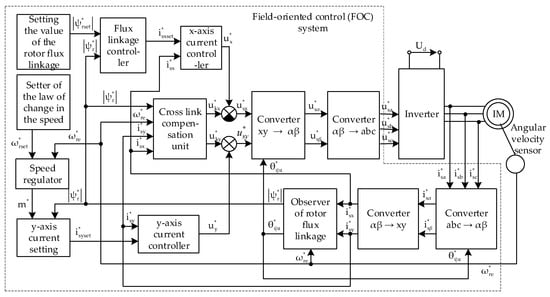
Figure 8.
Structural circuit of the traction drive output section with field-oriented control [29].
The algorithm for calculating the parameters of the FOC system is presented in [29]. Therefore, in the present study, the parameter calculations and simulation model of the FOC system are not provided. During the development of the simulation model of the output stage of the traction drive, which incorporates the field-oriented control and a reactive power compensator, the components outlined by dashed lines in Figure 8 were grouped into a single functional block.
In the development of the compensator circuit for damping higher harmonics, which will be used in a drive with FOC, there is a problem of determining the values of reference (desired) phase voltages of the induction motor stator. This problem is related to the fact that in such a drive, the frequency of the supply voltage system of the induction motor stator is constantly changing. If the first harmonics of the reference phase voltages supplying the induction motor stator are chosen as the values, then it is necessary to apply spectral analysis methods. This will lead to many calculations and, as a result, to a significant increase in the time of information processing. This circumstance worsens the compensator convergence.
The algorithm proposed for determining the values of the induction motor stator reference phase voltages was developed based on the following considerations:
1. Angular frequency of the first harmonics of the stator phase voltages is equal to the electrical angular frequency of the coordinate system rotation in FOC. In other words, the expressions for determining the first harmonics of the stator phase voltages can be written as follows:
where Usm is the amplitude of phase voltages and ωk is the angular rotation frequency of the coordinate system of the field-oriented control system.
Denoting ωk·t = θr as the angle of FOC coordinate system rotation, we obtain:
Signal θr in the FOC system is determined to perform the inverse Park and Clark transformations. Therefore, it is not necessary to use additional units in the simulation model to determine this signal.
2. When determining the amplitude of phase voltages, the following circumstance was considered. When designing the control system, it is essential to maintain the relationship between the amplitude and the angular frequency, which is defined by expression (1).
Because in the FOC system all quantities are determined in relative units and the nominal value of the flux linkage of the induction motor magnetizing circuit is set equal to unity, the amplitude of the phase voltages is determined as follows:
where Ud is the constant voltage of the inverter.
3. To connect the compensator to the traction drive circuit, we use a transformer (see Figure 1). Primary windings of the transformer are connected in a “star” formation and the secondary windings are connected in a “delta” formation. This means that a system of linear voltages will be supplied to the induction motor phase from the transformer. In this case, the phase A of the induction motor will be supplied from the transformer with the linear voltage UBA, to phase B—UCB, and to phase C—UAC. The ratio between the phase and linear voltages is as follows:
Therefore, to account for the phase shift when transitioning from phase linear to voltages, the phase of each linear voltage in the system of Equation (13) should be reduced by an angle of π/6. To match the amplitude levels when transitioning from phase linear to voltages, each amplitude of the linear voltage in the system of Equation (13) should be divided by √3.
Then, after fulfilling the above conditions for the system of Equation (13) and after substituting expression (12) into it instead of the amplitudes of the phase voltages, the system of reference phase voltages will be as follows:
That is, the simulation model of the traction drive with FOC and reactive power compensator must be supplemented with a block for implementing Equation (14).
The comprehensive simulation model of the traction drive output section without FOC (Figure 6) is supplemented with the “FOC” unit, from which the following signals are derived:
- ua_PWM, ub_PWM, ub_PWM are the autonomous voltage inverter control signals.
- teta_r is the angle of coordinate plane rotation in the field-oriented control system.
- wk is the angular velocity of coordinate plane rotation in the field-oriented control system.
It should also be noted that wk signal in the “FOC” unit is determined in relative units. Therefore, in the “Control unit for compensation of higher voltage harmonics”, this signal is multiplied by the nominal value of the electrical angular frequency—350 rad/s.
The traction motor of the STA-1200 series has a nominal power output of 1200 kW. Consequently, conducting experimental research on a locomotive traction drive is energy-intensive and, therefore, costly. Moreover, integrating hardware components that implement the proposed technical solutions requires formal approvals from both the manufacturer and operating organizations. As a result, testing the proposed solutions on existing rolling stock presents significant challenges. The development of a prototype is further hindered by the following factors:
- Developing a full-scale model of a traction drive using a real traction motor, as previously noted, is highly energy-intensive and financially demanding.
- Constructing a scaled-down model of a traction drive is also challenging due to the following consideration: in contrast to conventional industrial asynchronous motors, traction motors are designed to operate at frequencies exceeding their nominal values. To develop a scaled prototype, it would be necessary to manufacture a custom motor with appropriately scaled parameters. However, producing a prototype asynchronous motor is equally costly, as such a product would be considered non-standard and non-serial by the manufacturer.
The use of a standard industrial asynchronous motor to develop a scaled-down prototype of the traction drive may yield inaccurate results when operating at frequencies above the motor’s nominal range. Therefore, in this study, the authors have limited the scope of the investigation to simulation-based modeling only.
In summary, the following key contributions should be highlighted based on the results presented in this section. In contrast to previous studies focused on harmonic voltage compensation in power systems with linear loads [40], this work introduces the following original contributions:
- It is proposed to perform harmonic compensation not in the system of line voltages but directly within the stator phase voltages of the inverter. To enable this, the traditional star connection of the secondary windings of the coupling transformer has been replaced with a delta connection.
- It is proposed to replace current-based reference signals with voltage-based references, utilizing control voltage signals generated by the FOC algorithm.
- A generalized fifth-order transfer function-based filter architecture has been developed, enabling the dynamic adaptation of the filter’s cut-off frequency to the varying frequency of the supply voltage. This architecture allows for the analysis of the compensator control system with different types of filters without requiring changes to the structural model.
The proposed contributions enhance the efficiency of higher-order voltage harmonic compensation in the traction drive system and enable effective compensation under both steady-state and transient operating conditions.
3. Simulation Results
In order to determine the influence of adapting the filter cut-off frequency to the supply voltage frequency of the induction motor, simulations were conducted for the following operating modes of the traction drive: when the motor shaft speed is in a steady state, when the motor shaft speed in a steady state is below the nominal value, and when the motor shaft speed in a steady state is above the nominal value.
3.1. Simulation Results in a Circuit with FOC at Rated Motor Shaft Rotation Frequency
The performance of the traction drive system with FOC was investigated at the nominal rotor speed of the motor under five different scenarios: with a Butterworth filter in the reactive power compensator, with a direct Chebyshev filter in the reactive power compensator, with an inverse Chebyshev filter in the reactive power compensator, with a Bessel filter in the reactive power compensator, with an elliptic filter in the reactive power compensator.
For the circuits with compensators, the investigations were carried out at a fixed and adapted filter cut-off frequency to the motor shaft rotation speed.
The simulation was carried out for the following conditions:
- Inverter supply voltage Ud = √2·Unom = 2645 V.
- PWM frequency fPWM = 20·fnom = 1116 Hz.
- Static drive torque Tc = 10,324 N·m.
- Angular frequency of the motor supply voltage in steady mode ωr = 348.7 rad/s, which corresponds to the nominal frequency of the supply voltage fnom = 55.8 Hz.
- Acceleration of the motor shaft rotation is chosen to be equal to aω = 0.333 rad/s2.
- The delay time of the speed controller is chosen to be equal to 0.7 s.
From the time diagrams of the torque in stable mode, we obtained maximum (Tmax) and minimum (Tmin) torque values (Appendix A). Based on these values, we calculated the average values (Tav), the ripple values (ΔTav), and the ripple factor (kp) of the torque. The average torque value was calculated by the formula:
The magnitude of the torque ripple was calculated as follows:
The torque ripple factor was calculated as follows:
Since the drive has symmetrical windings and symmetrical inverter arms Isa = Isb = Isc = Is, for all five cases in stable mode, the amplitude–frequency spectrum was calculated for the stator in phase a, on the basis of which the THD was calculated for the first 40 harmonics using the formula [28]:
where Is(i) is the higher harmonics of the stator phase current.
For all five cases in the stable mode, the values of the consumed current Id were determined on the simulation model. Based on the obtained values of the consumed current Id the values of the consumed power P1 were calculated (Appendix C). As a result of the simulation, the values of the motor shaft rotation frequency were also obtained for all cases nr. The calculated useful motor shaft power was determined as follows:
The efficiency of the output section of the drive is calculated as follows:
The convergence time was calculated based on the following considerations. It would be an optimal solution to determine the convergence time under the condition of coincidence of the forms of the stator phase currents with the desired forms of these quantities. The desired forms can be the forms of the stator currents obtained when the induction motor is powered from a sinusoidal voltage system. In the simulation model, such a system of phase currents can be easily obtained by replacing a three-phase inverter with a three-phase system of supply voltages. But here a problem arises related to the fact that the presence of filters in the compensator leads to a change in the phase shift between the voltage and current of the corresponding phases. Therefore, with this approach, it is quite difficult to determine the convergence time.
It is proposed to determine the convergence time when the amplitudes of the spatial vectors of the stator phase currents coincide in the case of powering the drive from a sinusoidal voltage system and using the drive circuit with a compensator.
The amplitude of the stator phase current spatial vector can be determined as follows [29]:
where Isα is the projection of the stator phase current spatial vector onto the α axis and Isβ is the projection of the stator phase current spatial vector onto the β axis.
Projections of the stator phase current spatial vector onto the α and β axes are determined as follows [29]:
where Isa, Isb, and Isc are the phase currents of the induction motor stator.
In accordance with Equations (21) and (22), time diagrams of the amplitudes of the spatial vectors of the stator phase currents were built for the case when the drive is powered from a sinusoidal voltage system and the drive circuit with a compensator.
As a result of the simulation, the values of the motor shaft rotation frequency were also obtained for all cases nr. All the results described above are presented in Table 3.

Table 3.
Results of traction drive output section parameters calculation with FOC in the presence of a compensator (nominal mode).
The analysis of the results shown in Table 3 was carried out according to four criteria (in order of the criterion importance):
- The largest value of efficiency.
- The smallest value of the torque ripple factor.
- The shortest convergence time for a stable mode.
- The shortest convergence time during motor acceleration.
The analysis of the results presented in Table 4 showed that the drive circuit with FOC in the presence of a compensator with elliptic filter with adapted cut-off frequency has the highest efficiency value, the lowest values of the torque ripple factor, convergence time in stable mode, and convergence time during motor acceleration.
At JSC “Ukrzaliznytsia”, 14 DS-3 series electric locomotives are operated at the Kyiv-Pasazhyrskyi locomotive depot. According to post-repair test data from this depot in 2024, the torque ripple coefficient for the traction drives of these locomotives without compensators ranged from 27.5% to 30.5%. As a result of the simulation, this parameter was calculated as 29.3%, which confirms the high accuracy of the obtained result.
3.2. Simulation Results in a Circuit with FOC at a Steady Motor Rotation Frequency, Which Is Lower than the Nominal Rotation Frequency
The performance of the traction drive system with FOC at the nominal shaft speed of the motor was investigated for five distinct cases: with a Butterworth filter in the reactive power compensator, with a direct Chebyshev filter in the reactive power compensator, with an inverse Chebyshev filter in the reactive power compensator, with a Bessel filter in the reactive power compensator, with an elliptic filter in the reactive power compensator.
For circuits with compensators, the investigations were conducted at a fixed and adapted filter cut-off frequency to the motor shaft rotation frequency. The simulation was carried out for the following conditions:
- PWM frequency fPWM = 20·fnom = 1116 Hz.
- Static drive torque Tc = 10,324 N·m.
- Angular rotation frequency of the motor shaft in a stable mode ωr = 174.6 rad/s, which corresponds to the nominal frequency of the supply voltage fnom = 27.9 Hz.
- Since in FOC ψμ = const, ωr = 0.5·ωrnom, then in accordance with Equation (1), the supply voltage of the inverter Ud = 0.5·√2·Unom = 1322.5 V.
- Acceleration of the motor shaft rotation is chosen equal to aω = 0.333 rad/s2.
- Delay time of switching on the speed controller is chosen equal to 0.7 s.
The analysis of the results presented in Table 4 showed that the drive circuit with FOC in the presence of a compensator with elliptic filter with adapted cut-off frequency has the highest efficiency value, as well as the lowest values of the torque ripple factor and convergence time in stable mode.

Table 4.
Calculation results of the parameters of the traction drive output section with FOC in the presence of a compensator (when the motor supply frequency in stable mode is less than the nominal frequency).
Table 4.
Calculation results of the parameters of the traction drive output section with FOC in the presence of a compensator (when the motor supply frequency in stable mode is less than the nominal frequency).
| Parameter | Circuit that Includes a Compensator with Butterworth Filter | Circuit that Includes a Direct Chebyshev Filter | Circuit that Includes an Inverse Chebyshev Filter | Circuit that Includes a Compensator with Bessel Filter | Circuit that Includes a Compensator with an Elliptic Filter | |||||
|---|---|---|---|---|---|---|---|---|---|---|
| const | var | const | var | const | var | const | var | const | var | |
| Average torque value Tav, N·m | 10,320 | 10,320 | 10,320 | 10,320 | 10,320 | 10,320 | 10,320 | 10,320 | 10,320 | 10,320 |
| Torque ripple value ΔTav, N·m | 20.31 | 15.51 | 21.21 | 15.77 | 21.19 | 15.79 | 17.57 | 20.21 | 19.85 | 14.59 |
| Torque ripple factor kp, % | 0.32 | 0.3 | 0.158 | 0.15 | 0.158 | 0.151 | 0.158 | 0.157 | 0.158 | 0.145 |
| Motor shaft rotation frequency nr, rpm | 548 | 548 | 548 | 548 | 548 | 548 | 548 | 548 | 548 | 548 |
| Useful power P2, kW | 592.2 | 592.2 | 592.2 | 592.2 | 592.2 | 592.2 | 592.2 | 592.2 | 592.2 | 592.2 |
| Consumed current Id, A | 485.83 | 484.95 | 485.44 | 484.9 | 485.23 | 484.52 | 484.68 | 484.41 | 484.79 | 484.14 |
| Consumed power P1, kW | 667.2 | 666.0 | 666.7 | 665.9 | 666.4 | 665.39 | 665.62 | 665.24 | 665.77 | 664.87 |
| THD, % | 1.65 | 1.46 | 1.63 | 1.45 | 1.5 | 1.44 | 1.42 | 1.41 | 1.39 | 1.36 |
| Efficiency η, % | 88.76 | 88.92 | 88.83 | 88.93 | 88.87 | 89.0 | 88.97 | 89.02 | 88.95 | 89.05 |
| Convergence time for stable mode tconv_st, s | 0.304 | 0.214 | 0.296 | 0.211 | 0.252 | 0.212 | 0.246 | 0.222 | 0.239 | 0.197 |
| Convergence time for motor acceleration tconv_ac, s | 2.2 | 0.545 | 2.2 | 0.528 | 2.2 | 0.534 | 2.2 | 0.317 | 2.2 | 0.428 |
However, the Bessel filter has a minimum convergence time during motor acceleration. The presence of filters with adapted cut-off frequency in the compensator compared to a fixed frequency leads to:
- Increase in drive efficiency.
- Reduction in torque ripple factor both in stable mode (Table 4) and during motor acceleration.
- Reduction in THD.
- Reduction in convergence time both for stable mode and for motor acceleration.
3.3. Simulation Results in a Circuit with FOC at a Steady Motor Shaft Rotation Frequency, Which Is Greater than the Nominal
The operation of the traction drive system with FOC was studied at the nominal shaft rotation frequency of the motor for five scenarios: with a Butterworth filter in the reactive power compensator, with a direct Chebyshev filter in the reactive power compensator, with an inverse Chebyshev filter in the reactive power compensator, with a Bessel filter in the reactive power compensator, with an elliptic filter in the reactive power compensator. For the circuits with compensators, the studies were conducted at a fixed and adapted filter cut-off frequency to the motor shaft rotation frequency.
The simulation was carried out for the following conditions:
- PWM frequency fPWM = 20·fnom = 1116 Hz.
- Static drive torque Tc = 10,324 N·m.
- Angular rotation frequency of the motor shaft in stable mode ωr = 174.6 rad/s, which corresponds to the nominal frequency of the supply voltage fnom = 27.9 Hz.
- Since in the FOC ψμ = const, ωr = 1.25·ωrnom, then in accordance with Equation (1), the inverter supply voltage Ud = 1.25·√2·Unom = 3036.25 V.
- Acceleration of the motor shaft rotation is chosen equal to aω = 0.333 rad/s2.
- Delay time of switching on the speed controller is chosen equal to 0.7 s.
The simulation was conducted using the same program as in the previous cases. Since the quality of the torque and stator phase current diagrams of the induction motor does not differ from those obtained in Section 3.1, it is not advisable to present them. An exception was made for the case with the Bessel filter, where the system operation became unstable. All data required for the calculations are provided in Table 5. The calculation results, obtained using the methodology outlined in the previous subsection, are also included in Table 5.

Table 5.
Calculation results of the parameters of the traction drive output section with FOC in the presence of a compensator (when the motor supply frequency in stable mode is higher than the nominal frequency).
The analysis of the results presented in Table 5 was carried out according to four criteria (in order of the criterion importance):
- The highest efficiency value.
- The lowest torque ripple factor.
- Minimum convergence time for stable mode.
- Minimum convergence time during motor acceleration.
The analysis of the results presented in Table 5 showed that the drive circuit with FOC in the presence of a compensator with elliptic filter with the adapted cut-off frequency has the highest efficiency value, as well as the smallest values of the torque ripple factor, convergence time in stable mode and during motor acceleration. The drive circuit with FOC in the presence of a compensator with an elliptic filter with a fixed cut-off frequency has the highest efficiency value and the smallest value of torque ripple. However, when using the Bessel filter with adapted frequency in the compensator, the drive circuit becomes unstable. Therefore, the use of the Bessel filter in the compensator to damp higher harmonics of the supply voltage in the traction drive output section with FOC is impractical. The presence of filters with adapted cut-off frequency in the compensator compared to a fixed frequency leads to:
- Increase in drive efficiency.
- Decrease in torque ripple factor both in stable mode (Table 6) and during motor acceleration.
 Table 6. Comparative performance analysis of traction drive systems equipped with reactive power compensators under different control strategy implementations.
 - Decrease in THD.
- Decrease in convergence time both for stable mode and for motor acceleration.
In this paper, we assumed that the load for the traction drive is a constant static moment. Moreover, this moment was determined without considering the weight of the locomotive, the weight of the train, and the profile of the track section. Additionally, the operational factors that cause stochastic changes in the voltage in the DC link and the load on the motor shaft were not considered. The authors acknowledge that when considering operational factors, the parameters of the traction drive with the compensator calculated in this study will undergo quantitative changes. The purpose of this study was to provide a methodology for assessing the effect of filters with different types of approximations on the efficiency of the compensator in the traction drive system and to choose the optimal technical solution when synthesizing compensation circuits. The assessment of the effect of the filters with different approximation types on the efficiency of the compensator in a traction drive system with due consideration of operational factors, is a topic for further studies.
4. Discussion
The traction drive system represents a distinct class of automated electric drives. This distinction is determined by several factors:
- In contrast to most industrial electric drive systems, traction drives operate under conditions where the traction motor may function at frequencies exceeding its nominal value.
- Traction drives are continuously subjected to non-steady-state operating modes caused by various operational factors.
The aforementioned factors complicate the design and implementation of reactive power compensators in traction drive systems. Moreover, conducting experimental studies on real traction drives is highly energy intensive. Therefore, simulation-based modeling is considered a more practical and efficient approach for conducting such investigations.
The analysis of the obtained results under steady-state conditions at the nominal supply frequency of the asynchronous motor (Table 3, Table 4 and Table 5), as well as at frequencies below and above nominal, has shown that using filters with an adaptive cut-off frequency in the compensator control scheme within an FOC system enhances both efficiency (η) and THD. Furthermore, implementing Butterworth filters, Chebyshev Type I and II filters, and elliptic filters in the compensator control structure contributes to a reduction in torque ripple and convergence time under both steady-state and transient operating modes of the traction drive.
At nominal and sub-nominal supply frequencies, these improvements also apply to Bessel filters. However, at super-nominal frequencies, the traction drive operation with Bessel-filter-based compensator control becomes unstable, indicating a limitation of this filter type under such conditions.
The comparison results of the performance indicators of the traction drive equipped with a reactive power compensator—based on the implementation of the higher-order harmonic damping algorithm of the supply voltage—with those of the traction drive using adaptive control algorithms [28] are presented in Table 6.
The analysis of the results presented in Table 6 indicates that the best performance parameters among the adaptive filtering methods are achieved using the Wiener filter. In contrast, within the framework of the harmonic damping strategy, the most effective control performance is observed with the implementation of an elliptic filter. A comparison of these two control strategies shows that the Wiener adaptive filter provides superior outcomes in terms of THD and torque ripple coefficient. On the other hand, the harmonic damping algorithm employing an elliptic filter results in a shorter convergence time under steady-state operating conditions.
The application of adaptive filtering for harmonic compensation under non-steady-state operating conditions becomes significantly more complex. This complexity arises from the fact that obtaining reference current signals, which is essential for adaptive filtering, is a non-trivial task requiring considerable computation time. Consequently, this increases the convergence time of the algorithms, which is a critical limitation in traction drive systems. This drawback is not present in the case of implementing a harmonic damping algorithm, as the reference voltage signals are synthesized by the FOC system.
5. Conclusions
The analysis revealed that compensating higher-order harmonics in the traction drive system is more effective in the time domain than in the frequency domain. This study substantiates the choice of a control strategy for the compensator, which is based on damping higher-order harmonics in the phase supply voltage of the asynchronous traction motor. A connection scheme for integrating the compensator into the power circuits of the traction drive is proposed, along with the structural diagram of the compensator control system.
An algorithm for synthesizing reference voltage signals is also proposed, based on the use of FOC signals. This approach reduces the implementation time of the control system algorithm and, consequently, improves convergence. As a result, the compensator can be effectively used under both steady-state and non-steady-state operating conditions of the traction drive system.
A generalized structure of the transfer functions for filters was developed, enabling dynamic adaptation of the cut-off frequency in response to variations in the supply frequency of the asynchronous motor, without the need to modify the filter structure itself. This is a critical factor for improving the performance of the compensator at supply frequencies different from the nominal value. A simulation model of the traction motor with FOC was developed using MATLAB18b software.
A novel method for determining convergence was proposed—defined as the time at which the magnitudes of the spatial vectors of the stator currents in the studied circuit match those in a reference system powered by a sinusoidal voltage source. This approach simplifies the procedure and increases the accuracy of convergence time estimation.
Based on the simulation results, the following performance metrics were calculated: torque ripple coefficient, efficiency of the output section of the traction drive, THD, and convergence time.
The analysis of the results obtained at the nominal supply frequency of the asynchronous motor, as well as at frequencies below and above nominal, demonstrated that the use of filters with an adaptive cut-off frequency in the compensator control scheme leads to improved efficiency, reduced THD, and lower torque ripple coefficient. The THD value did not exceed 2% in any of the cases, while the torque ripple coefficient remained at 0.3% under steady-state operating conditions.
The analysis of the traction drive performance indicators with a reactive power compensator revealed that the most effective solution is the implementation of an elliptic filter in the compensator control scheme. The control scheme incorporating the elliptic filter demonstrated the highest efficiency and superior convergence compared to schemes utilizing other types of filters.
A logical continuation of this research involves efforts aimed at improving the energy efficiency of traction drive systems for electric rolling stock equipped with alternative types of traction motors—such as permanent magnet synchronous motors (PMSMs)—and controlled by different strategies, including direct torque control (DTC). Moreover, the findings of this study may be applied to enhance the effectiveness of other reactive power compensation methods, such as the modified d–q method, instantaneous reactive power control in p–q coordinates, and instantaneous reactive power control in extended p–q–r coordinates.
Author Contributions
Conceptualization, R.M., S.G. and V.L.; methodology, R.M., S.G. and V.L.; software, R.M., S.G. and V.L.; validation, R.M., S.G. and V.L.; formal analysis, R.M., S.G. and V.L.; investigation, R.M., S.G. and V.L.; resources, R.M., S.G. and V.L.; data curation, R.M., S.G. and V.L.; writing—original draft preparation, R.M., S.G. and V.L.; writing—review and editing, R.M., S.G. and V.L.; visualization, R.M., S.G. and V.L.; supervision, R.M., S.G. and V.L.; project administration, R.M., S.G. and V.L. All authors have read and agreed to the published version of the manuscript.
Funding
This research received no external funding.
Institutional Review Board Statement
Not applicable.
Informed Consent Statement
Not applicable.
Data Availability Statement
Data is contained within the article.
Conflicts of Interest
The authors declare no conflicts of interest.
Appendix A
Appendix A.1. Butterworth Filter
Since filter order n = 5, i.e., is an odd number, the transfer function of the normalized Butterworth filter is written as follows [38]:
In Equation (10), θk is determined as follows:
For the fifth-order filter (n = 5), we get:
After transformations, we get:
Filter scaling is performed as follows. When transitioning from a normalized filter to a high-pass filter, the variable s in Equation (A4) should be replaced with the corresponding expression:
where ωcut is the high-pass filter cut-off frequency.
The amplitude–frequency response (AFR) of the filter was determined as follows:
where Re(ω) and Im(ω) are real and fictitious parts of the normalized Butterworth filter transfer function.
The AFR of the Butterworth high-pass filter is shown in Figure A4a.
As can be seen from Figure 8, the AFR of the Butterworth high-pass filter has a smooth character in both the passband and the stopband.
Appendix A.2. Direct Chebyshev Filter
The transfer function of a normalized direct Chebyshev filter is written as follows [38]:
where:
In Equations (A9) and (A10), parameter ε is an oscillation parameter that characterizes the maximum relative attenuation Amax in the passband and is determined in accordance with the expression:
Taking Amax = 0.1 dB, we obtained the oscillation parameter ε = 0.15262. The results of calculating the transfer function parameters of the normalized direct Chebyshev filter are summarized in Table A1.

Table A1.
Calculation results of the parameters of the transfer function for the normalized direct Chebyshev filter.
Table A1.
Calculation results of the parameters of the transfer function for the normalized direct Chebyshev filter.
| k | σk | ωk | sk = σk + j·ωk |
|---|---|---|---|
| 1 | −0.167 | 1.08 | −0.167 + j·1.08 |
| 2 | −0.436 | 0.668 | −0.436 + j·0.668 |
| 3 | −0.539 | 0 | −0.539 |
| 4 | −0.436 | −0.668 | −0.436 − j·0.668 |
| 5 | −0.167 | −1.08 | −0.167 − j·1.08 |
The filter gain was determined as follows:
After substituting the obtained values of the transfer function parameters of the normalized direct Chebyshev filter (Table A1) into Equation (A7), we obtain:
Filter scaling is performed by substituting Equation (A5) into Equation (A13). The expression for calculating the frequency response of the direct Chebyshev filter of high frequencies is obtained in accordance with Equation (A7). The AFR of the direct Chebyshev high-pass filter is shown in Figure A1b. As can be seen in Figure A1b, the AFR of the direct high-pass Chebyshev filter has a smooth character in the stopband, and there are oscillations in the passband.
Appendix A.3. Inverse Chebyshev Filter
To obtain the transfer function of the inverse Chebyshev high-pass filter, the transfer function of the direct Chebyshev low-pass filter should be subtracted from unity [38]. In other words, the algorithm for obtaining the transfer function of the inverse Chebyshev high-pass filter is as follows:
- In the transfer function of the normalized inverse Chebyshev low-pass filter, transition to the given cut-off frequency is performed by substituting the value into the following:
- 2.
- The resulting expression is subtracted from 1 to obtain the transfer function of the high-pass inverse Chebyshev filter.
The AFR of the inverse Chebyshev high-pass filter is obtained according to Equation (15). The AFR of the inverse Chebyshev high-pass filter is shown in Figure A1c.
As can be seen from Figure A1c, the AFR of the inverse Chebyshev high-pass filter has a smooth character in the passband, and there are oscillations in the stopband.
Appendix A.4. Bessel Filter
The transfer function of the normalized Bessel filter is written as follows [39]:
where is the n-th order Bessel polynomial.
Knowing that the Bessel polynomials for n = 1 and n = 2 are as follows:
The n-th order Bessel polynomial can be found using the following recurrence equation:
For a filter with n = 5, the Bessel polynomial is written as follows:
The transfer function of the normalized Bessel filter of order n = 5 is written as follows:
The filter scaling is performed by substituting Equation (A5) into Equation (A19). The expression for calculating the AFR of high-pass Bessel filter is obtained in accordance with Equation (A16). The AFR of high-pass Bessel filter is shown in Figure A1d.
As can be seen from Figure A1d, the AFR of high-pass Bessel filter has a smooth character both in the stopband and in the passband.
Appendix A.5. Elliptic Filter
The initial data for calculating the elliptic filter [38] are cut-off frequency ω0, specified transition band ω1, permissible distortion in the passband Rp, and the required suppression in the stopband Rs. The normalized elliptic low-pass filter was calculated based on the following corridor of its AFR: ωp = 1 rad, ωs = 1.37 rad, Gp = 0.9772 p.u., Gs = 0.01 p.u. The parameters of the filter corridor are as follows:
We have checked the filter order compliance with the given AFR corridor of the elliptic low-pass filter. To achieve this, we first calculate the full and complementary elliptic integrals using the Landen transform [42]:
Then, the filter order is as follows:
Since it was assumed that all the filters under study in this paper should have n = 5 order, the parameters of the elliptic low-pass filter AFR corridor were selected correctly.
The elliptic filter module was recalculated. It was previously assumed that N = 2·L + r, where L = 2, r = 1. In this case:
The k module is recalculated as follows:
Calculation of the elliptic functions sn was carried out using Landen transformation [42].
Calculation of filter zeros and poles. Filter zeros were calculated as follows:
Calculation of filter poles. For this purpose, it was pre-calculated:
Filter poles were calculated as follows:
Transfer characteristics were calculated based on the biquadrate form according to the following equation:
The transfer factor at zero frequency H(0) was determined as follows:
where σi = Re(pi) and ωi = Im(pi).
Since it was not necessary to calculate the odd-order filter (Gp)1−r, after substituting Equations (A27), (A28), (A30)–(A32) and (A34) into Equation (A33), we obtained the transfer function of the normalized elliptic low frequencies filter:
Filter scaling was performed by substituting Equation (A5) into Equation (A35).
The expression for calculating the AFR of high-pass elliptic filter was obtained according to Equation (A6). The AFR of high-pass elliptic filter has oscillations in both the stopband and the passband (Figure A1e).
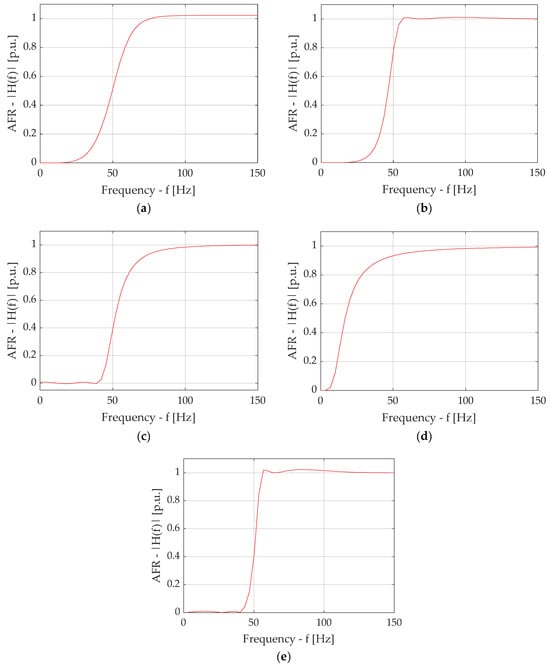
Figure A1.
Amplitude–frequency characteristics of the filters: Butterworth filter (a); Chebyshev Type I (b) and Chebyshev Type II (c) filters; Bessel filter (d); and elliptic filter (e).
Appendix B
Figure A2, Figure A3, Figure A4, Figure A5, Figure A6, Figure A7, Figure A8, Figure A9, Figure A10, Figure A11, Figure A12, Figure A13, Figure A14, Figure A15, Figure A16 and Figure A17 show simulation results for a circuit with FOC at the nominal value of the frequency of the IM supply voltage in stable mode.
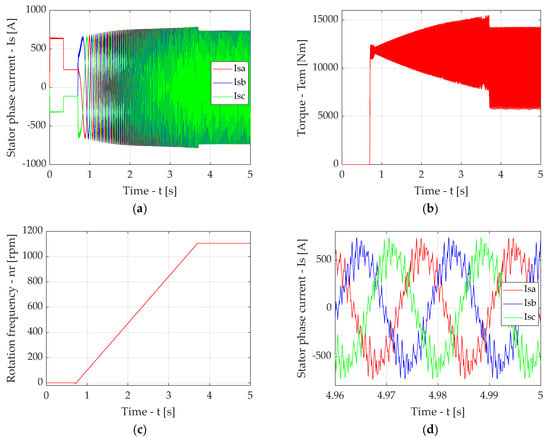
Figure A2.
Simulation results for the traction drive output section with FOC without a compensator: time diagrams of induction motor stator phase currents (a), time diagram of torque (b), time diagram of motor shaft rotation frequency (c), time diagrams of induction motor stator phase currents in stable mode (d).
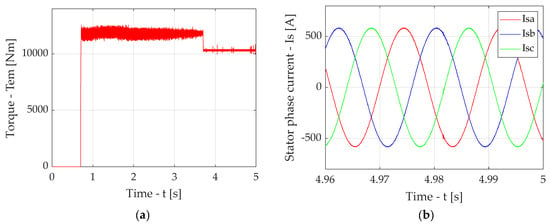
Figure A3.
Simulation results for the case of traction drive output section with FOC in the presence of a compensator with Butterworth filter with a fixed cut-off frequency: diagram torque (a), diagrams of induction motor stator phase currents in stable mode (b).
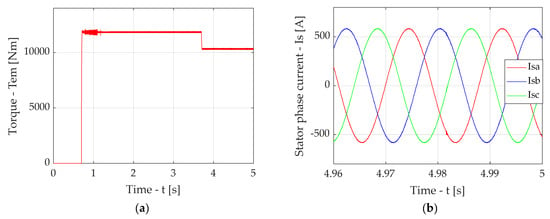
Figure A4.
Simulation results for the case of traction drive output section with FOC in the presence of a compensator with Butterworth filter with an adapted cut-off frequency: time diagram torque (a), diagrams of induction motor stator phase currents in stable mode (b).
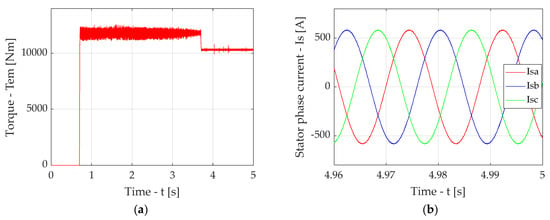
Figure A5.
Simulation results for the case of traction drive output section with FOC in the presence of a compensator with a direct Chebyshev filter with a fixed cut-off frequency: diagram torque (a), time diagrams of induction motor stator phase currents in stable mode (b).
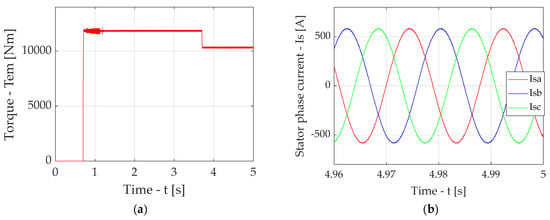
Figure A6.
Simulation results for the case of traction drive output section with FOC in the presence of a compensator with a direct Chebyshev filter with an adapted cut-off frequency: diagram torque (a), diagrams of induction motor stator phase currents in stable mode (b).
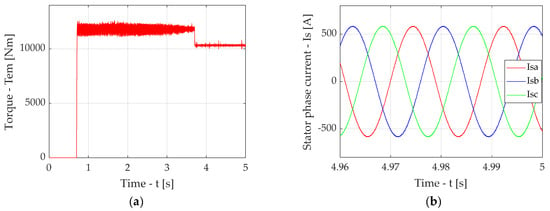
Figure A7.
Simulation results for the case of traction drive output section with FOC in the presence of a compensator with inverse Chebyshev filter with a fixed cut-off frequency: diagram torque (a), diagrams of induction motor stator phase currents in stable mode (b).
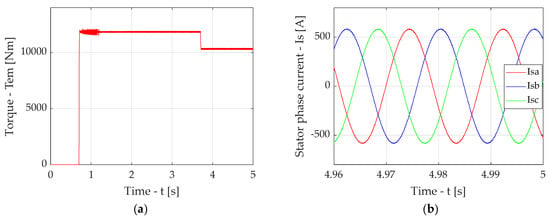
Figure A8.
Simulation results for the case of traction drive output section with FOC in the presence of a compensator with inverse Chebyshev filter with an adapted cut-off frequency: diagram torque (a), diagrams of induction motor stator phase currents in stable mode (b).
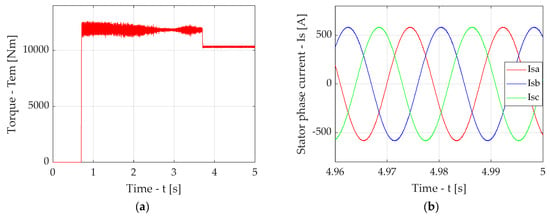
Figure A9.
Simulation results for the case of traction drive output section with FOC in the presence of a compensator with Bessel filter with a fixed cut-off frequency: diagram of torque (a), diagrams of induction motor stator phase currents in stable mode (b).
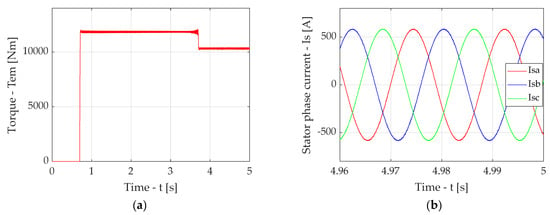
Figure A10.
Simulation results for the case of traction drive output section with FOC in the presence of a compensator with Bessel filter with an adapted cut-off frequency: diagram of torque (a), diagrams of induction motor stator phase currents in stable mode (b).
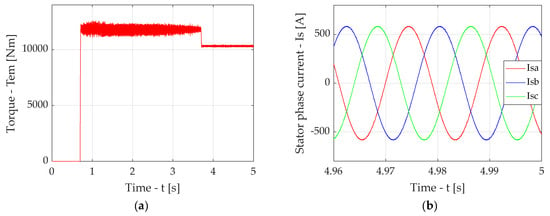
Figure A11.
Simulation results for the case of traction drive output section with FOC in the presence of a compensator with elliptic filter with a fixed cut-off frequency: diagram of torque (a), diagrams of induction motor stator phase currents in stable mode (b).
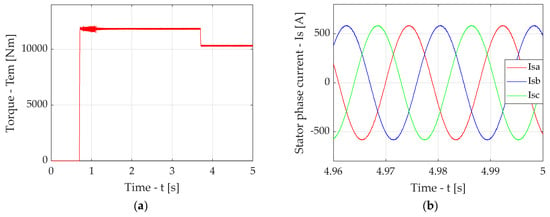
Figure A12.
Simulation results for the case of traction drive output section with FOC in the presence of a compensator with elliptic filter with an adapted cut-off frequency: diagram torque (a), diagrams of induction motor stator phase currents in stable mode (b).
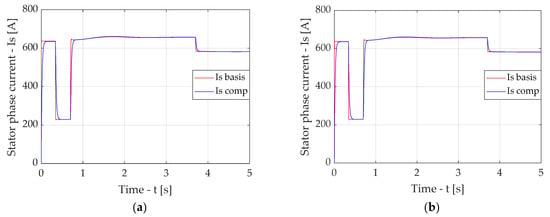
Figure A13.
Time diagrams of spatial vector amplitudes of stator phase currents of the drive with FOC and power supply from a sinusoidal voltage system (Is basis) and the drive circuit in the presence of a compensator (Is comp) with Butterworth filter (nominal mode): at a fixed filter cut-off frequency (a), at an adapted filter cut-off frequency (b).
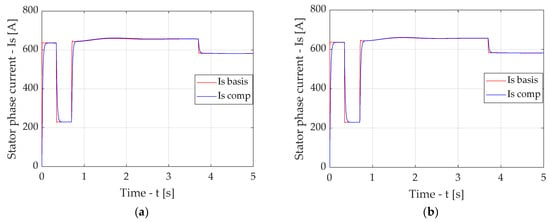
Figure A14.
Time diagrams of spatial vector amplitudes of stator phase currents of the drive with FOC and power supply from a sinusoidal voltage system (Is basis) and the drive circuit in the presence of a compensator (Is comp) with a direct Chebyshev filter (nominal mode): at a fixed filter cut-off frequency (a), at an adapted filter cut-off frequency (b).
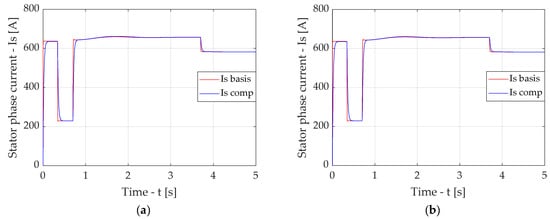
Figure A15.
Time diagrams of spatial vector amplitudes of stator phase currents of the drive with FOC and power supply from a sinusoidal voltage system (Is basis) and the drive circuit in the presence of a compensator (Is comp) with an inverse Chebyshev filter (nominal mode): at a fixed filter cut-off frequency (a), at an adapted filter cut-off frequency (b).
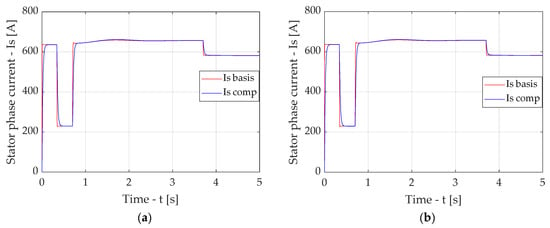
Figure A16.
Time diagrams of spatial vector amplitudes of stator phase currents of the drive with FOC and power supply from a sinusoidal voltage system (Is basis) and the drive circuit in the presence of a compensator (Is comp) with Bessel filter (nominal mode): at a fixed filter cut-off frequency (a), at an adapted filter cut-off frequency (b).
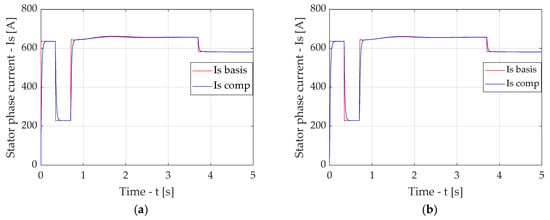
Figure A17.
Time diagrams of spatial vector amplitudes of stator phase currents of the drive with FOC and power supply from a sinusoidal voltage system (Is basis) and the drive circuit in the presence of a compensator (Is comp) with elliptic filter: at a fixed filter cut-off frequency (nominal mode (a), at an adapted filter cut-off frequency (b).
Appendix C
For the case of the circuit without a compensator, the consumed power was determined as follows:
where Id is the value of the consumed current and Ud is the value of the inverter supply voltage. As mentioned above, Ud = 2645 V.
For the cases of circuits with compensators, the consumed power was determined based on the following considerations. The power part of the drive with a compensator consists of the power part without a compensator and the power part of the compensator itself, which is additional inverter, transformer, and RC-high frequency filters (Figure 1). To simplify the modeling on the comprehensive model (Figure 6), the inverter was replaced by three controlled voltage sources. It follows that using the determined value of the consumed current Id for cases 2–6, it is possible to calculate the power consumed by the power part of the drive P1′ based on Equation (A36) without considering the power consumed by the inverter of the compensator PC1, i.e.,:
Power losses in TV transformer were determined based on its energy efficiency. The full rated power of the transformer should be slightly greater than the full rated power of the traction motor. The full rated power of the traction motor is as follows:
where Pnom is the rated power of the traction motor (Table 1), cosφ is the power factor of the traction motor (Table 1), and η is the efficiency factor of the traction motor (Table 1).
A three-phase transformer with a full power of 1600 V·A was selected from the standard series [43]. The losses in such a transformer should not exceed 1%. In further calculations of the power consumed by the compensator, the losses in the transformer will be considered as 1% of the power consumed by the traction motor, i.e.,:
To simplify the calculations, the transformation coefficient TV is taken equal to 1 (K;TV = 1).
The power consumed by the inverter is equal to the power losses in the inverter. The power losses in the inverter can be divided into static and switching losses. Static losses are power losses caused by the flow of current through the inverter elements. Dynamic losses depend on the parasitic values of the capacitance and inductance of the p-n junctions and the rate of increase in the current and voltage in the inverter elements. In this paper, dynamic losses are neglected, since their magnitude is much smaller than static losses and switching losses [44].
To account for the static power consumed by the power part of the compensator, the following considerations were considered:
- The power part of the compensator is powered by a direct current link, the voltage which is equal to Ud.
- The power circuit of the compensator is assembled according to the bridge circuit made on IGBT modules of the same series as the autonomous voltage inverter (parameters of the IGBT transistor and the reverse diode are given in Table 2).
The current equal to the phase current of the induction motor will flow through the open transistor. Since the drive has symmetrical windings and symmetrical inverter arms, then Isa = Isb = Isc = Is.
When implementing the algorithm, a mode with a pulse duty cycle was selected (50% of the time in the pulse period is occupied by the pulse duration, and 50% by the pause).
Static power losses of one IGBT transistor are determined as follows [44]:
where UCE(on) is the transistor collector–emitter voltage in the open state, IC is the average value of the collector current over the period, S = 0.5 is the pulse duty cycle, and Tj = 125 °C is the transistor temperature.
Since the current, the collector current of the transistor has a non-sinusoidal shape, its average value over the period is determined as follows [44]:
where Is(i) is the higher harmonics of the stator phase current, I is the harmonic sequential number, N = 40 is the number of harmonics, ω = 2·π·f is the fundamental harmonic angular frequency, and f is the fundamental harmonic frequency.
As can be seen from Equation (A38), the collector–emitter voltage of the transistor in the open state is a function of the collector current average value (IC) and transistor temperature (Tj). The collector–emitter voltage values of a transistor in the conducting state can be determined based on the average values of the collector current over one period [12].
A static power loss of a single reverse diode is determined as follows [44]:
where UVD is the forward diode voltage and IVD = IC is the average value of the forward diode current over the period.
Power losses when the transistor is switched on [44] are as follows:
where Eon is the energy loss for the switching transistor (Table 2), f is the fundamental frequency value, and K is the number of PWM pulses.
The power loss for switching off the transistor [44] is as follows:
where Eon is the energy loss for switching off the transistor (Table 2).
Total losses in one transistor are as follows:
The diode recovery power loss is as follows:
where Erev is the diode recovery energy loss (Table 2).
Total losses in one diode are as follows:
Since the inverter circuit consists of six IGBTs and six reverse diodes, the total power loss in the inverter can be determined as follows:
In order to prevent the DC current components from entering the compensator inverter, high frequency RC-filters are used in the output section of the drive with a reactive power compensator (Figure 2). These filters are tuned to a cut-off frequency, which is 10 times lower than the rotation frequency of the induction motor. In other words, the cut-off frequency of the filter is equal to fRC = 0.1·fnom = 0.1·55.8 = 5.58 Hz. The active resistance of the filter resistor Rf is chosen to be 56 Ω. Then, the capacitance of the filter capacitor Cf will be equal to Cf = 1/(fRC·Rf) = 3200 μF.
Since the high-pass filter will suppress harmonics with frequencies lower than 5.58 Hz, only the zero harmonic of the current (its DC component) will flow through the filter resistor Rf. The higher harmonic components of the current will flow through the capacitor Cf. Then, the power loss in the filter resistor Rf can be determined as follows:
where Rf = 56 Ω is the active resistance of the filter resistor and Isi(0) is the constant component of the current of the induction motor stator i-th phase.
The power loss in the capacitor is determined by the tangent of the dielectric loss angle, which is a characteristic of the dielectric used in the capacitor. Since in the dielectrics, which are used in high-voltage capacitors the dielectric loss angle tends to 90°, the cosine of this angle tends to zero. Thus, the power loss in the capacitor is so small that it can be neglected.
Consequently, the total power loss of the compensator can be determined as follows:
Since three high-frequency RC-filters are used in the compensator (one for each phase), a factor of 3 is used in Equation (A50) before the power losses in the filter resistor.
Then, the power consumed by the output section of the filter can be determined according to the following equation:
References
- Cipolletta, G.; Delle Femine, A.; Gallo, D.; Luiso, M.; Landi, C. Design of a stationary energy recovery system in rail transport. Energies 2021, 14, 2560. [Google Scholar] [CrossRef]
- Gorobchenko, O.; Fomin, O.; Gritsuk, I.; Saravas, V.; Grytsuk, Y.; Bulgakov, M.; Volodarets, M.; Zinchenko, D. Intelligent locomotive decision support system structure development and operation quality assessment. In Proceedings of the 2018 IEEE 3rd International Conference on Intelligent Energy and Power Systems (IEPS), Kharkiv, Ukraine, 10–14 September 2018; IEEE: Piscataway, NJ, USA, 2018; pp. 239–243. [Google Scholar] [CrossRef]
- Zhu, C.; Lu, J.; Li, X. Review of Studies on Energy-Efficient Train Operation in High-Speed Railways. IEEJ Trans. Electr. Electron. Eng. 2023, 18, 451–462. [Google Scholar] [CrossRef]
- Polater, N.; Tricoli, P. Technical review of traction drive systems for light railways. Energies 2022, 15, 3187. [Google Scholar] [CrossRef]
- Gerlici, J.; Lovska, A.; Vatulia, G.; Pavliuchenkov, M.; Kravchenko, O.; Solčanský, S. Situational adaptation of the open wagon body to container transportation. Appl. Sci. 2023, 13, 8605. [Google Scholar] [CrossRef]
- Panchenko, S.; Gerlici, J.; Vatulia, G.; Lovska, A.; Pavliuchenkov, M.; Kravchenko, K. The Analysis of the Loading and the Strength of the FLAT RACK Removable Module with Viscoelastic Bonds in the Fittings. Appl. Sci. 2022, 13, 79. [Google Scholar] [CrossRef]
- Lovskaya, A. Assessment of dynamic efforts to bodies of wagons at transportation with railway ferries. East. Eur. J. Enterp. Technol. 2014, 3, 36–41. [Google Scholar] [CrossRef]
- Ronanki, D. Overview of rolling stock. In Transportation Electrification: Breakthroughs in Electrified Vehicles, Aircraft, Rolling Stock, and Watercraft; Wiley: Hoboken, NJ, USA, 2022; pp. 249–281. [Google Scholar] [CrossRef]
- Liubarskyi, B.G.; Overianova, L.V.; Riabov, I.S.; Iakunin, D.I.; Ostroverkh, O.O.; Voronin, Y.V. Estimation of the main dimensions of the traction permanent magnet-assisted synchronous reluctance motor. Electr. Eng. Electromechanics 2021, 2, 3–8. [Google Scholar] [CrossRef]
- Liubarskyi, B.; Demydov, O.; Yeritsyan, B.; Nuriiev, R.; Iakunin, D. Determining electrical losses of the traction drive of electric train based on a synchronous motor with excitation from permanent magnets. East. Eur. J. Enterp. Technol. 2018, 2, 29–39. [Google Scholar] [CrossRef][Green Version]
- Sekino, Y.; Ewald, S.; Yamamoto, S.; Iwamoto, S.; Uchida, T.; Okumura, K.; Kusunoki, Y.; Onozawa, Y.; Kimura, H.; Kobayashi, Y.; et al. 3.3 kV all SiC module with 2nd generation trench gate SiC MOSFETs for traction. In Proceedings of the PCIM Europe 2022; International Exhibition and Conference for Power Electronics, Intelligent Motion, Renewable Energy and Energy Management, Nuremberg, Germany, 10–12 May 2022; VDE: Offenbach, Germany, 2022; pp. 1–7. [Google Scholar] [CrossRef]
- Goolak, S.; Kyrychenko, M. Thermal Model of the Output Traction Converter of an Electric Locomotive with Induction Motors. Probl. Energeticii Reg. 2022, 3, 1–16. [Google Scholar] [CrossRef]
- Liubarskyi, B.; Petrenko, O.; Iakunin, D.; Dubinina, O. Optimization of thermal modes and cooling systems of the in-duction traction engines of trams. East. Eur. J. Enterp. Technol. 2017, 3, 59–67. [Google Scholar] [CrossRef][Green Version]
- Goolak, S.; Riabov, I.; Gorobchenko, O.; Yurchenko, V.; Nezlina, O. Improvement of the model of an asynchronous traction motor of an electric locomotive by taking into account power losses. Prz. Elektrotechniczny 2022, 98, 1–10. [Google Scholar] [CrossRef]
- Goolak, S.; Gubarevych, O.; Gorobchenko, O.; Nevedrov, O.; Kamchatna-Stepanova, K. Investigation of the influence of the quality of the power supply system on the characteristics of an asynchronous motor with a squirrel-cage rotor. Prz. Elektrotechniczny 2022, 98, 142–148. [Google Scholar] [CrossRef]
- Das, S.R.; Ray, P.K.; Sahoo, A.K.; Ramasubbareddy, S.; Babu, T.S.; Kumar, N.M.; Elavarasan, R.M.; Mihet-Popa, L. A comprehensive survey on different control strategies and applications of active power filters for power quality improvement. Energies 2021, 14, 4589. [Google Scholar] [CrossRef]
- Raman, R.; Sadhu, P.K.; Kumar, R.; Rangarajan, S.S.; Subramaniam, U.; Collins, E.R.; Senjyu, T. Feasible Evaluation and Implementation of Shunt Active Filter for Harmonic Mitigation in Induction Heating System. Electronics 2022, 11, 3464. [Google Scholar] [CrossRef]
- Xu, Z.; Lu, P.; Cai, Y.; Li, J.; Yang, T.; Wu, Y.; Wang, R. An efficient channel imbalance estimation method based on subadditivity of linear normed space of sub-band spectrum for azimuth multichannel SAR. Remote Sens. 2023, 15, 1561. [Google Scholar] [CrossRef]
- Zhang, X.; Ding, F. Optimal adaptive filtering algorithm by using the fractional-order derivative. IEEE Signal Process. Lett. 2021, 29, 399–403. [Google Scholar] [CrossRef]
- Li, M.; Liu, X. Iterative identification methods for a class of bilinear systems by using the particle filtering technique. Int. J. Adapt. Control Signal Process. 2021, 35, 2056–2074. [Google Scholar] [CrossRef]
- Pan, Y.; Shi, T.; Ortega, R. Comparative analysis of parameter convergence for several least-squares estimation schemes. IEEE Trans. Autom. Control 2023, 69, 3341–3348. [Google Scholar] [CrossRef]
- Ma, P.; Wang, L. Filtering-based recursive least squares estimation approaches for multivariate equation-error systems by using the multiinnovation theory. Int. J. Adapt. Control Signal Process. 2021, 35, 1898–1915. [Google Scholar] [CrossRef]
- Paleologu, C.; Benesty, J.; Ciochină, S. Data-reuse recursive least-squares algorithms. IEEE Signal Process. Lett. 2022, 29, 752–756. [Google Scholar] [CrossRef]
- Diaz, M.; Charbonnel, P.É.; Chamoin, L. A new Kalman filter approach for structural parameter tracking: Application to the monitoring of damaging structures tested on shaking-tables. Mech. Syst. Signal Process. 2023, 182, 109529. [Google Scholar] [CrossRef]
- Locorotondo, E.; Lutzemberger, G.; Pugi, L. State-of-charge estimation based on model-adaptive Kalman filters. Proc. Inst. Mech. Eng. Part I J. Syst. Control Eng. 2021, 235, 1272–1286. [Google Scholar] [CrossRef]
- Niu, Z.H.; Yang, Y.B. Defense against adversarial attacks with efficient frequency-adaptive compression and reconstruction. Pattern Recognit. 2023, 138, 109382. [Google Scholar] [CrossRef]
- Garg, A. Speech enhancement using long short term memory with trained speech features and adaptive wiener filter. Multimed. Tools Appl. 2023, 82, 3647–3675. [Google Scholar] [CrossRef]
- Goolak, S. Improving the Efficiency of Electric Rolling Stock Operation Through the Use of Adaptive Filtering Methods for High Harmonic Current Components in Traction Drive Systems. Probl. Energeticii Reg. 2023, 60, 1–13. [Google Scholar] [CrossRef]
- Goolak, S.; Liubarskyi, B.; Riabov, I.; Lukoševičius, V.; Keršys, A.; Kilikevičius, S. Analysis of the efficiency of traction drive control systems of electric locomotives with asynchronous traction motors. Energies 2023, 16, 3689. [Google Scholar] [CrossRef]
- Goolak, S.; Liubarskyi, B.; Riabov, I.; Chepurna, N.; Pohosov, O. Simulation of a direct torque control system in the presence of winding asymmetry in induction motor. Eng. Res. Express 2023, 5, 025070. [Google Scholar] [CrossRef]
- Benbouhenni, H.; Bizon, N.; Colak, I.; Iliescu, M.; Thounthong, P. A new direct torque control of an efficient and cost-effective traction system using two squirrel cage induction motors feed by a single inverter. Electr. Power Compon. Syst. 2024, 1–21. [Google Scholar] [CrossRef]
- Kumar, V.; Singh, M. Reactive power compensation using derated power generation mode of modified P&O algorithm in grid-interfaced PV system. Renew. Energy 2021, 178, 108–117. [Google Scholar] [CrossRef]
- Wang, Y.; Li, Y.; Huang, S. An improved sliding mode direct power control strategy based on reactive power compensation for Vienna rectifier. IEEE Access 2022, 10, 15469–15477. [Google Scholar] [CrossRef]
- Gupta, Y.; Parganiha, N.; Rathore, A.K.; Doolla, S. An improved reactive power sharing method for an islanded microgrid. IEEE Trans. Ind. Appl. 2021, 57, 2954–2963. [Google Scholar] [CrossRef]
- Khan, A.; Jaffery, M.H.; Javed, Y.; Arshad, J.; Rehman, A.U.; Khan, R.; Bajaj, M.; Kaabar, M.K. Hardware-in-the-Loop Implementation and Performance Evaluation of Three-Phase Hybrid Shunt Active Power Filter for Power Quality Improvement. Math. Probl. Eng. 2021, 2021, 8032793. [Google Scholar] [CrossRef]
- Dadhich, A.; Sharma, J.; Kumawat, S.; Tandon, A. Power Quality Improvement in 3-Φ Power System with Shunt Active Filter Using Synchronous Detection Method. Int. J. Electr. Electron. Comput. 2021, 6, 92–95. [Google Scholar] [CrossRef]
- Mishra, A.K.; Ray, P.K.; Patra, A.K.; Mallick, R.K.; Das, S.R. Self-tuned PI Controller Based Hybrid Shunt Active Power Filter for Power Quality Enhancement. In Advances in Electrical Control and Signal Systems: Select Proceedings of AECSS 2019; Springer: Singapore, 2019; pp. 315–327. [Google Scholar] [CrossRef]
- Ge, Z.; Guo, H.; Wang, T.; Yang, Z. Universal graph filter design based on Butterworth, Chebyshev, and Elliptic functions. Circuits Syst. Signal Process. 2023, 42, 564–579. [Google Scholar] [CrossRef]
- Verma, S.; Randhawa, R.; Kaur, H. Filtering investigation for enhanced performance of MZM–MZI integrated switching network. J. Opt. 2023, 52, 417–423. [Google Scholar] [CrossRef]
- Nwokolo, E.; Chinaeke-Ogbuka, I.; Ajibo, A.; Ogbuka, C.; Ogbuefi, U.; Ejiogu, E. Performance comparison of sliding mode and instantaneous reactive power theory control techniques for three-phase active power filter. Int. J. Electr. Electron. Eng. Telecommun. 2021, 10, 83–90. [Google Scholar] [CrossRef]
- Goolak, S. To the Choice of Filter Approximation in the Synthesis of the Reactive Power Compensator Control System. In Proceedings of the Transport Means-Proceedings of the 28th International Scientific Conference 2024, Kaunas, Lithuania, 2–4 October 2024; pp. 192–197. [Google Scholar] [CrossRef]
- Boukraa, S.; Cosgrove, C.; Maillard, J.M.; McCoy, B.M. Factorization of Ising correlations C (M, N) for ν = −k and M+ N odd, M ≤ N, T < T c and their lambda extensions. J. Phys. A Math. Theor. 2022, 55, 405204. [Google Scholar] [CrossRef]
- Laso, A.; Manana, M.; Martínez, R.; Sáez, J.A.; Cervero, D. A comparative between IEEE and EN in the transformer derating when supplying nonsinusoidal load current. A practical case (No. ART-2020-120578). Renew. Energy Power Qual. J. 2020, 18, 747–752. [Google Scholar] [CrossRef]
- Wang, F.; Song, Y.; Dou, W.; Zheng, Z.; Li, Z.; Li, B.; Liu, J. High Power Density IGBT Loss Calculation Model and Analysis. Energies 2025, 18, 997. [Google Scholar] [CrossRef]
Disclaimer/Publisher’s Note: The statements, opinions and data contained in all publications are solely those of the individual author(s) and contributor(s) and not of MDPI and/or the editor(s). MDPI and/or the editor(s) disclaim responsibility for any injury to people or property resulting from any ideas, methods, instructions or products referred to in the content. |
© 2025 by the authors. Licensee MDPI, Basel, Switzerland. This article is an open access article distributed under the terms and conditions of the Creative Commons Attribution (CC BY) license (https://creativecommons.org/licenses/by/4.0/).