1. Introduction
Production and operations management are driven by a combination of three key factors: the accelerating digitisation of industrial processes, the growing need for flexible adaptation to disruptions in production processes, and supply chain management [
1]. This new operating paradigm has reshaped traditional competitive priorities, where quality, operational, supply, flexibility and cost strategies have become central elements of decisions that directly contribute to the development of unique manufacturing capabilities in industries [
2].
Industrialisation has radically transformed the production landscape, offering significant gains in efficiency and productivity [
3]. However, these benefits come with complex challenges, such as reliance on advanced technological systems that can fail, demanding lead times that complicate logistics, constant pressure to meet high quality standards, and inefficiencies in space utilisation [
4]. Effective management of these issues is essential to ensure that companies not only survive, but thrive in an increasingly demanding competitive environment, so the key lies in balancing technological innovation with robust oversight and proactive strategies that minimise operational risks and maximise efficiency throughout the production chain [
5].
To reduce production costs and optimise operating times, it is essential to achieve a proper balance between man, machine and material, which can be achieved through an efficient plant layout design in industry [
6]. According to [
7], the effectiveness of production factors is maximised when they operate in an appropriate space, which allows the manufacturing processes to be controlled and secured. Therefore, it is essential to implement a distribution scheme per workstation and operation that minimises high production costs and reduces time and productivity loss, which are common problems in the industry that can be solved with proper space planning [
8].
In general, manufacturing industries play a key role in the overall economic development of countries, especially the glass industry, providing essential materials for multiple sectors, from construction to advanced technology. Internationally, demand for glass products continues to grow, driven by technological innovations and sustainable infrastructure needs [
9]. However, to remain competitive in this dynamic market, companies in the sector face the constant challenge of optimising their production processes and operational efficiency. In the national context, the glass industry in countries such as Colombia has shown a significant evolution, adapting to sustainability and energy efficiency trends, highlighting the importance of advanced manufacturing practices.
Systematic layout planning (SLP), developed by Richard Muther in 1968, is a key methodology to maximise resource efficiency by strategically organising work areas and industrial equipment [
7,
10]. This tool combines quantitative and qualitative analyses, encompassing not only the physical dimensions of the plant, but also the interrelationships between areas, material flow, worker ergonomics, and specific process and storage requirements [
11]. By integrating these aspects, SLP fosters competitiveness and continuous improvement, helping organisations to respond effectively to the demands of an ever-changing industrial environment [
12].
According to the authors of [
13], they used the systematic layout planning (SLP) technique to develop an optimised plant layout. This methodology allowed for a detailed analysis of the material flow and interrelationships between activities, resulting in a significant reduction in distances travelled and an increase in productivity. As a result, a design was selected that reduced the total distance travelled during manufacturing by 339.05 metres. In addition, material flow was optimised by integrating previously separate areas and eliminating waste associated with movement and transportation. Together, these improvements contributed to a marked increase in overall plant productivity.
According to [
14], the implementation of the systematic layout planning (SLP) methodology resulted in a 10.06% increase in freed space, reaching a total of 2.16 m
2. In addition, the late delivery rate was reduced to 3.71%, representing a variation of 10.98%. Although an occupancy rate of 89.94% was achieved in the racks, the objective of freeing up 12% of the space was not met.
Technological evolution has significantly transformed the way design and layout processes are approached in the business environment. While physical tools such as plans, drawings and mock-ups were traditionally relied upon to present proposals to management, the advent of simulation software has revolutionised this field. In that sense, simulation means replicating a physical system in a virtual system that mimics real production systems [
15].
The current technological revolution involves the application of simulation tools which are key to analysing and improving processes and which end up being essential instruments that allow professionals not only to model diverse scenarios, but also to rigorously analyse the behaviour of systems under multiple conditions. Their ability to perform detailed evaluations, optimise designs and inform decisions has positioned them as indispensable tools in contemporary system design [
16].
Taking as a central axis that simulating helps to replicate real productive systems, discrete event simulation (DES) should be given relevance as an advanced methodology that models complex systems through sequential events, facilitating the analysis of critical interrelationships and the evaluation of alternative scenarios [
17]. This tool is key to optimise decision-making in dynamic environments such as logistics and supply chain management, contributing to strategic planning and operational improvement [
18].
A prominent example of DES is the use of FlexSim V 22.2.0, software used to optimise production lines [
19]. In one case, a military factory used FlexSim to improve four production lines, addressing productivity and cost issues. The simulation revealed that only 10% of the time was spent on manufacturing, while 90% was spent on activities such as warehousing and transportation [
20]. This approach allowed balancing processes, increasing efficiency and reducing costs, demonstrating the effectiveness of simulation in improving logistics and production systems [
19].
The study focuses on a company that manufactures bevelled mirrors, carved mirrors and glass for dining rooms, which is facing space management and material handling problems in its plant. The current distribution of machines and storage areas generates inefficient flows, increasing transfer times and affecting productivity. A reorganisation that optimises the location of equipment and logistics areas could reduce unnecessary movements, eliminate downtime and improve the overall performance of the production system.
In addition, the company distributes materials such as aluminium tubes and faces challenges in the production flow. Some products complete all stages, while others only go through partial processes, resulting in long waiting times between stages. These delays, together with the limited space between stages and the accumulation of glass in process, hinder the transit of personnel and the movement of semi-finished products. The reorganisation of the plant through methodologies such as SLP and DES will improve the layout of the space, integrating operational efficiency with better conditions for staff and consolidating productivity.
2. Methodology
The study is based on plant layout analysis and system simulation methodologies proposed in [
7,
21], applied to a company in the glass sector. Initially, the resources, capacities and current situation of the organisation were evaluated by means of a detailed diagnosis. For the construction of the simulation model, the system analysis methodology was followed, from the definition of the system to the coding in FlexSim V 22.2.0. The case study analysed the production process of specialised glass, considering stages such as bevelling, polishing and carving, integrated with logistics, distribution and storage. Data were collected on processing times, operational capacities, available resources and demand, complemented with block diagrams of the processes.
Statistical analysis of production times was performed in RStudio V 4.4.1 and ProModel with Stat-Fit V 9.3.0.2051, determining key data distributions to develop the model in FlexSim. Subsequently, the model was validated by defining the optimal number of repetitions according to a specific formula, ensuring its accuracy and reliability. The Distribution Planning (SLP) methodology was used to optimise material flow and equipment layout.
The SLP (systematic layout planning) methodology was evaluated with a structured approach that seeks to optimise the physical layout of the company belonging to the glass industry sector, where it is crucial to ensure efficient material flows and reduce travel times. This method emphasises human interactions, ensuring safe and ergonomic handling of materials. The application of SLP allows the development of designs that promote productivity, safety and comfort within workspaces.
Within the analysis, key tools are used, such as the activity relationship diagram, which organises tasks according to their level of connection to identify activities that should be close to each other. The dimensionless block diagram facilitates the visualisation of functional areas in the form of blocks to assess preliminary configurations. The path and activity relationship diagram analyses the physical movements within the plant, and the space relationship diagram details the spatial relationships between zones.
Finally, the relative adjacency method integrates these diagrams to prioritise the proximity between areas according to their essential, important or desirable relationships. This methodology allows the development of layout designs that maximise operational efficiency, people’s well-being and the rational use of space, guaranteeing an optimal solution for the specific needs of the company.
2.1. Sector Analysis
The sectoral study covers three key levels: international, national and local, providing a comprehensive diagnosis of the glass industry landscape. This analysis identifies market opportunities and assesses the strengths and weaknesses of the sector. The research is supported by official sources such as the National Administrative Department of Statistics (DANE) and the Observatory of Economic Complexity (OEC), which ensure the quality and reliability of the data analysed.
2.2. General Characteristics of the Company
2.2.1. Background and Current Situation
The company is located in Sincelejo-Sucre, standing out for its specialised work in the production of bevelled mirrors, carved mirrors, glass for dining rooms and the distribution of aluminium tubes. The evaluation of the organisation was carried out through interviews with the owner, visits to the facilities and analysis of internal documents, which allowed us to obtain a detailed vision of its resources, capacities, performance and positioning in the department of Sucre, identifying its current challenges.
2.2.2. Supply Chain Analysis
A thorough analysis of the organisation’s supply chain revealed a structure composed of three fundamental links: suppliers, production and distribution. Suppliers supply essential raw materials such as glass and aluminium; the former goes through the manufacturing and design process; and finally, the finished products reach the market through a direct distribution channel that serves three main segments: natural customers, construction companies and wholesale customers.
2.2.3. Product Identification and Description
This section provides a detailed description of the company’s main products, such as bevelled mirrors, dining table glass and polished mirrors. Based on an analysis of their manufacturing processes, the key stages are documented, from the selection and cutting of the glass to the final finishes such as bevelling, cutting and grinding. This approach provides an understanding of the distinctive characteristics of each product and the techniques used to ensure its quality and aesthetics, providing a solid basis for identifying opportunities for improvement in production processes.
Detailing each type of product, for example, for the manufacture of bevelled mirrors, is a process involving several key stages, each of which contributes to the final aesthetic result. These mirrors are distinguished by their angled edges. In the cutting stage, the glass is cut to the exact dimensions required for the mirror. This is done with absolute precision on a specialised cutting table. After cutting, the edges of the glass are bevelled. This is carried out on a bevelling machine, which polishes the edges to the desired angle and width. In addition to improving aesthetics, this process eliminates any roughness, reducing the risk of cuts when handling the mirror.
As a culminating stage, both the vitreous surface and the bevelled edges are polished. The polisher and discs are used to remove any residual bevelling marks and to achieve a smooth, shiny finish.
Now, for the dining glass product, an essential component in glass dining tables involves a detailed process that ensures both the aesthetics and functionality of the final product. The process begins with cutting the glass to the dimensions required for the dining table. This stage is critical to ensure that the glass fits perfectly into the frame or base intended for it:
Glass selection: Glass of the appropriate quality and thickness is chosen, capable of withstanding everyday weight and use.
Measuring and marking: The exact dimensions of the glass are carefully marked on the glass surface, using precise measuring tools and glass markers.
Cutting: A specialised glass cutting tool is used, following the marked lines, to make a clean and precise cut.
Once the cutting is finished, the polishing stage begins, which uses two machines called “octopus” to smooth the cut edges, eliminating any irregularities or roughness. After the polishing process is completed, the glass is then carved and decorative designs or textures are added to the surface of the glass, which can be customised according to the customer’s specific requirements or pre-determined design:
A design is selected or created for carving, which can range from simple patterns to complex and detailed motifs.
Using specialised tools, the design is meticulously carved onto the surface of the glass.
After carving, the glass undergoes a grinding process, which consists of lightly abrading the surface of the glass with a grinding cabin. This technique creates a satin or matte effect on certain areas of the glass, highlighting the carved details and creating an attractive visual contrast.
As with the polished mirror, the process begins by selecting a sheet of glass of the appropriate quality and thickness for the mirror to be created. This sheet of glass will serve as the base of the mirror. Precision cutting is crucial to obtain the exact dimensions required for the specific project or to fit the specifications:
Measuring and marking: Special glass rulers and markers are used to mark the cutting lines according to the desired dimensions.
Cutting: On the cutting table, the marked lines are followed to cut the glass. Uniform pressure is applied along the cutting line to facilitate a clean separation of the material.
After cutting the glass to the required size, polishing the edges follows. This stage is essential not only to improve the aesthetics of the mirror but also to ensure that the edges are safe to the touch, eliminating any roughness that could result in cuts or damage.
Specialised machinery is used to smooth the cut edges of the glass. This process can vary in intensity, depending on the desired smoothness and finish of the edges.
2.2.4. Methods and Time Study
To determine standard production times, a time and methods study was carried out, analysing the flow of materials and their transport problems. Fifteen samples were collected using back-to-zero timing, measuring specific activities and restarting the stopwatch at each repetition. The calculation considered parameters such as work rate, overtime and slack according to Niebel’s methodology [
22]. This analysis made it possible to identify problems, propose improvements and establish the real times of each process, increasing productivity and efficiency.
For the calculation of the atmospheric clearance, the following equation and parameters were considered for outdoor environments with solar loading. The Wet Bulb Globe Temperature (WBGT) is defined as follows:
where
NWB: Natural wet bulb temperature;
GT: Globe temperature;
DB: Dry bulb temperature.
2.2.5. Diagnosis of the Current Situation
The diagnosis assessed the plant’s capacity to produce various products in an 8-h shift with 7 workers, comparing the theoretical capacity with the real values. Using Equation (2), the efficiency per product was analysed, identifying discrepancies, bottlenecks and problems in material flows and transfers, pointing out key areas to improve the production system:
where
Sum of cycle times;
K: Number of stations;
C: Production capacity of the system (bottleneck).
2.2.6. Proposal
In order to evaluate the layout design proposals, using the proposed methodologies, the following stages were developed:
Analysis of relationships between activities: Relationships between activities were analysed to determine an appropriate location.
Dimensionless block diagram: Initial design alternatives were generated using block organisation.
Relational diagram of paths and activities: The interactions between the different areas were represented, considering the proportionality of the real physical space.
Relational space diagram: A scaled diagram reflecting the size of each area of the company was drawn up.
Statistical analysis: A goodness-of-fit test was conducted using ProModel’s Stat-Fit tool.
Design in FlexSim V 22.2.0: Simulation models of both the current and proposed design were built, allowing the efficiency of the new design to be evaluated and adjustments to be made prior to implementation.
Model validation: The variables and parameters necessary to ensure an accurate representation of the simulated model were established. The optimal number of repetitions was initially determined using Equation (3) in order to validate the behaviour of the simulation model.
N = Optimal number of runs;
= Standard deviation;
E = The acceptable margin of error or desired accuracy;
Z_(α⁄2) = The critical value of the standard normal distribution corresponding to the desired confidence level.
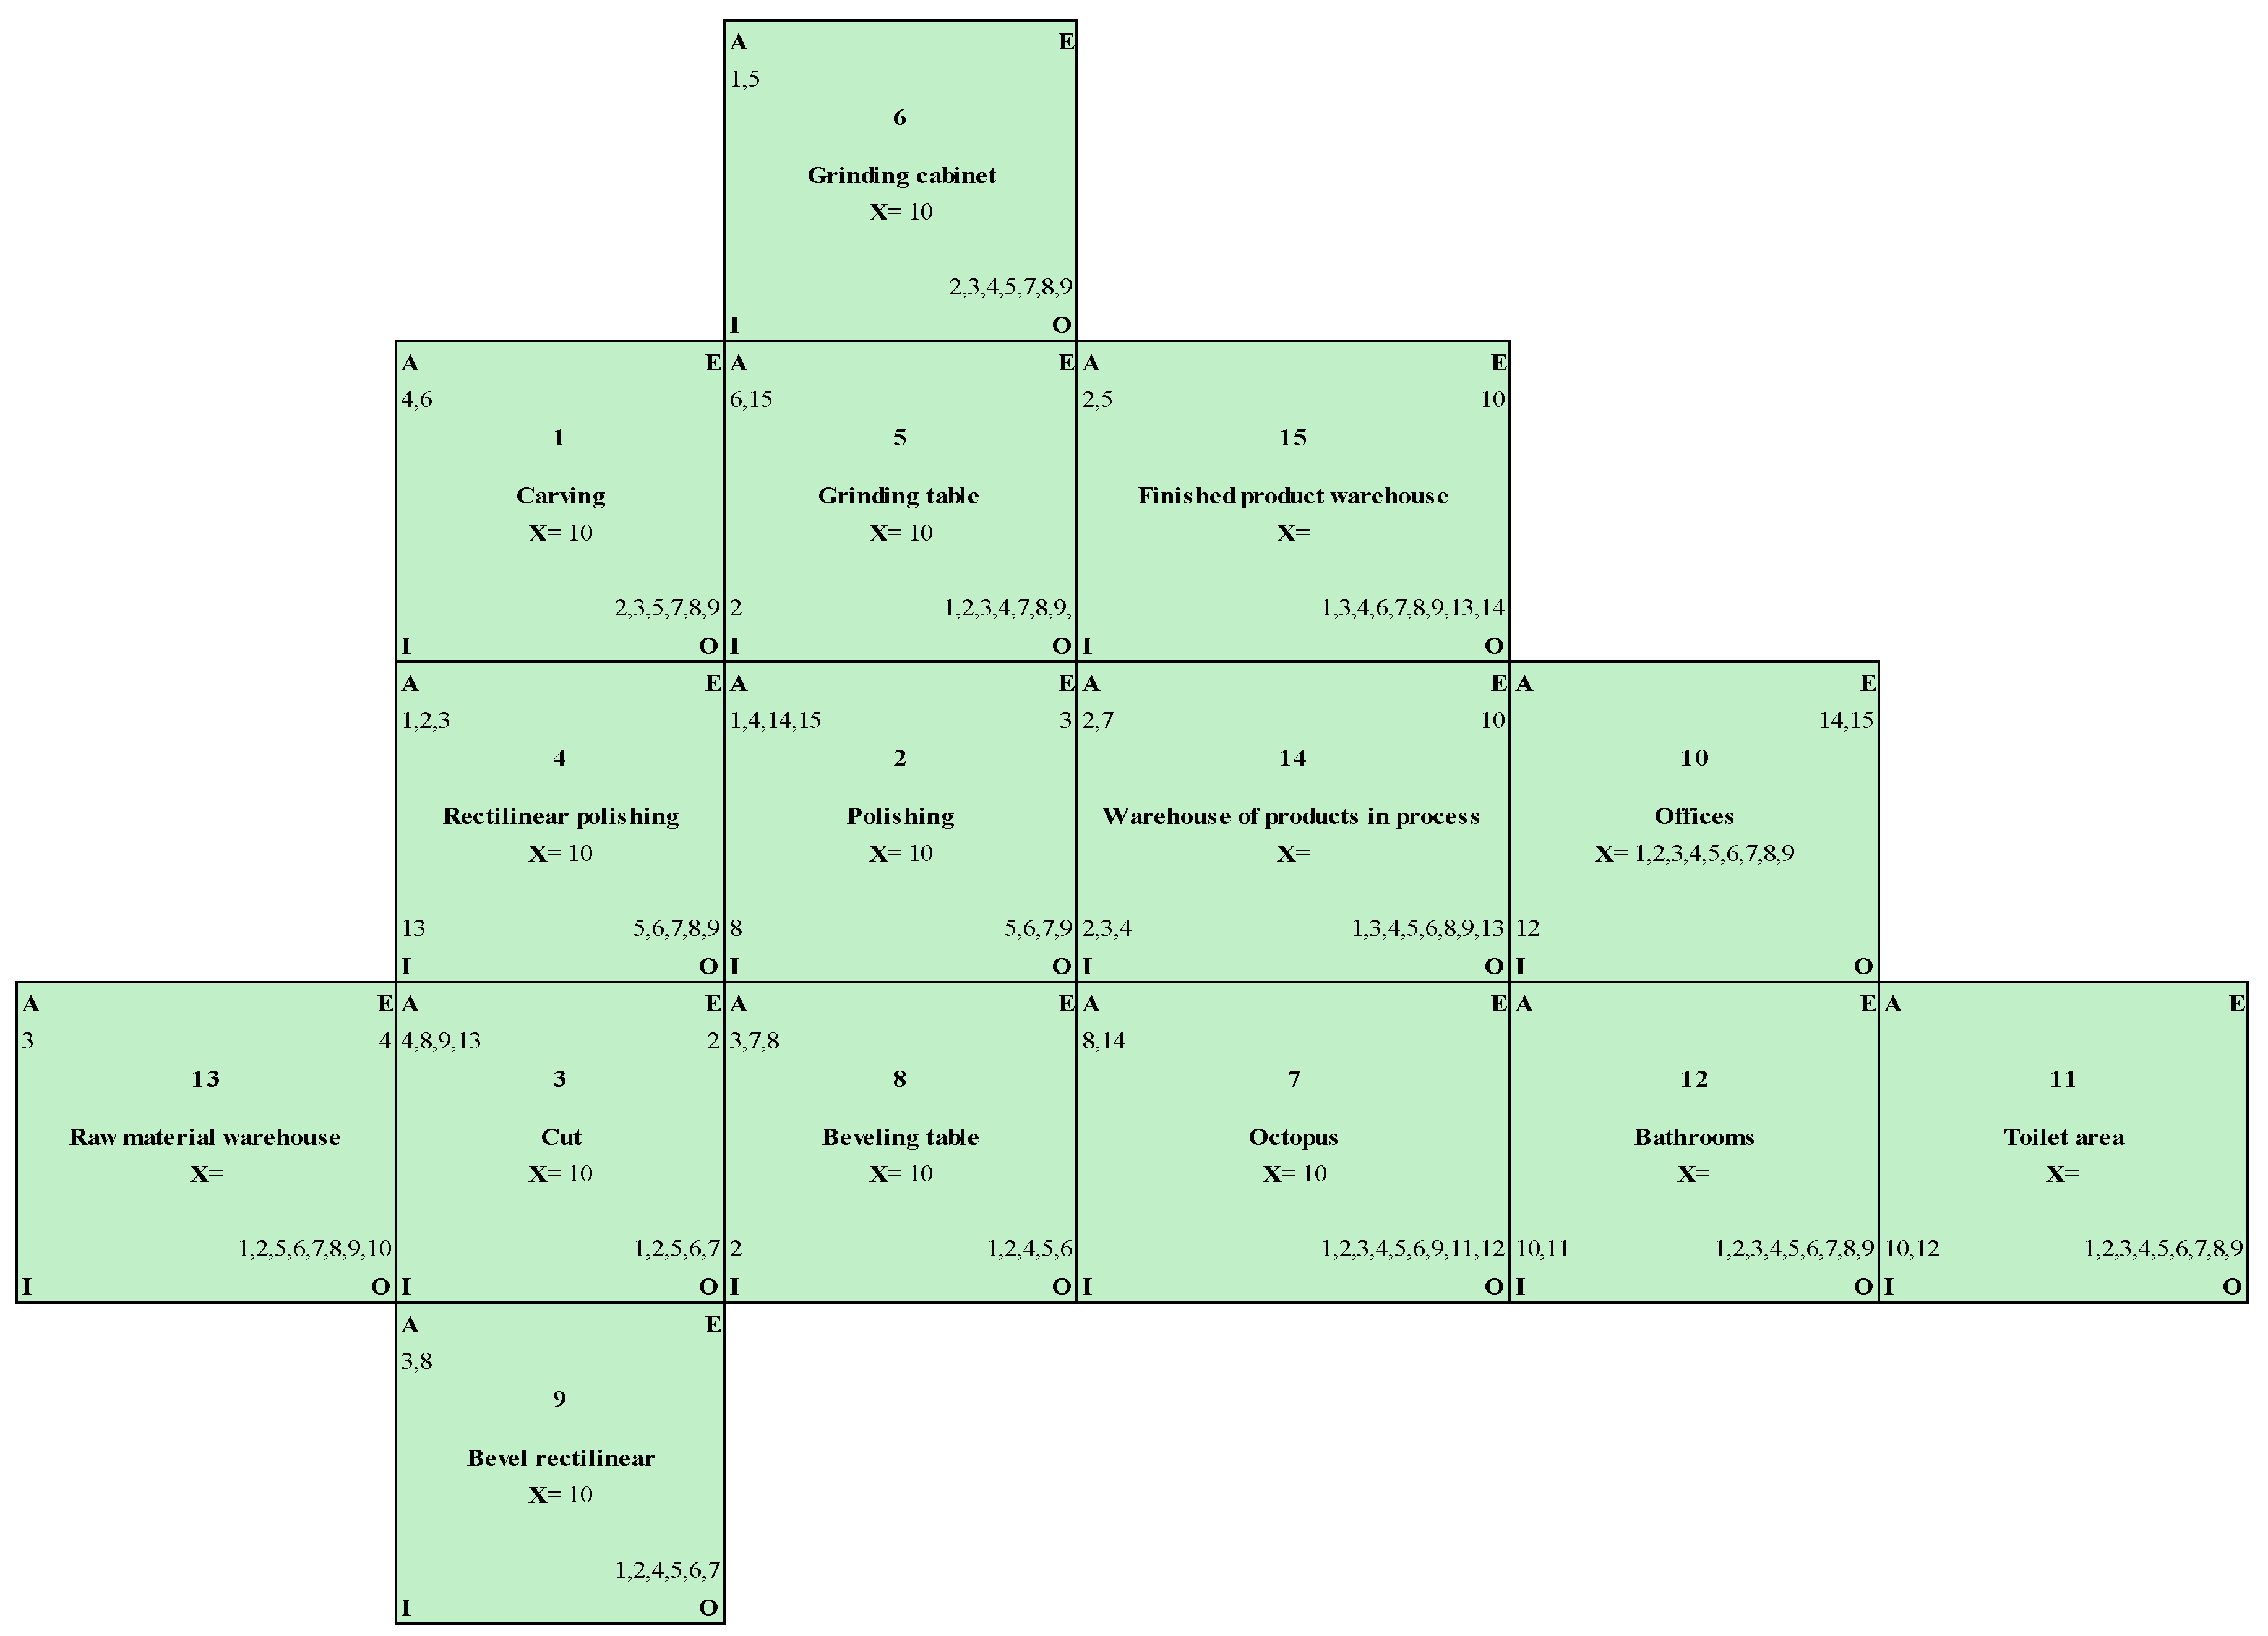
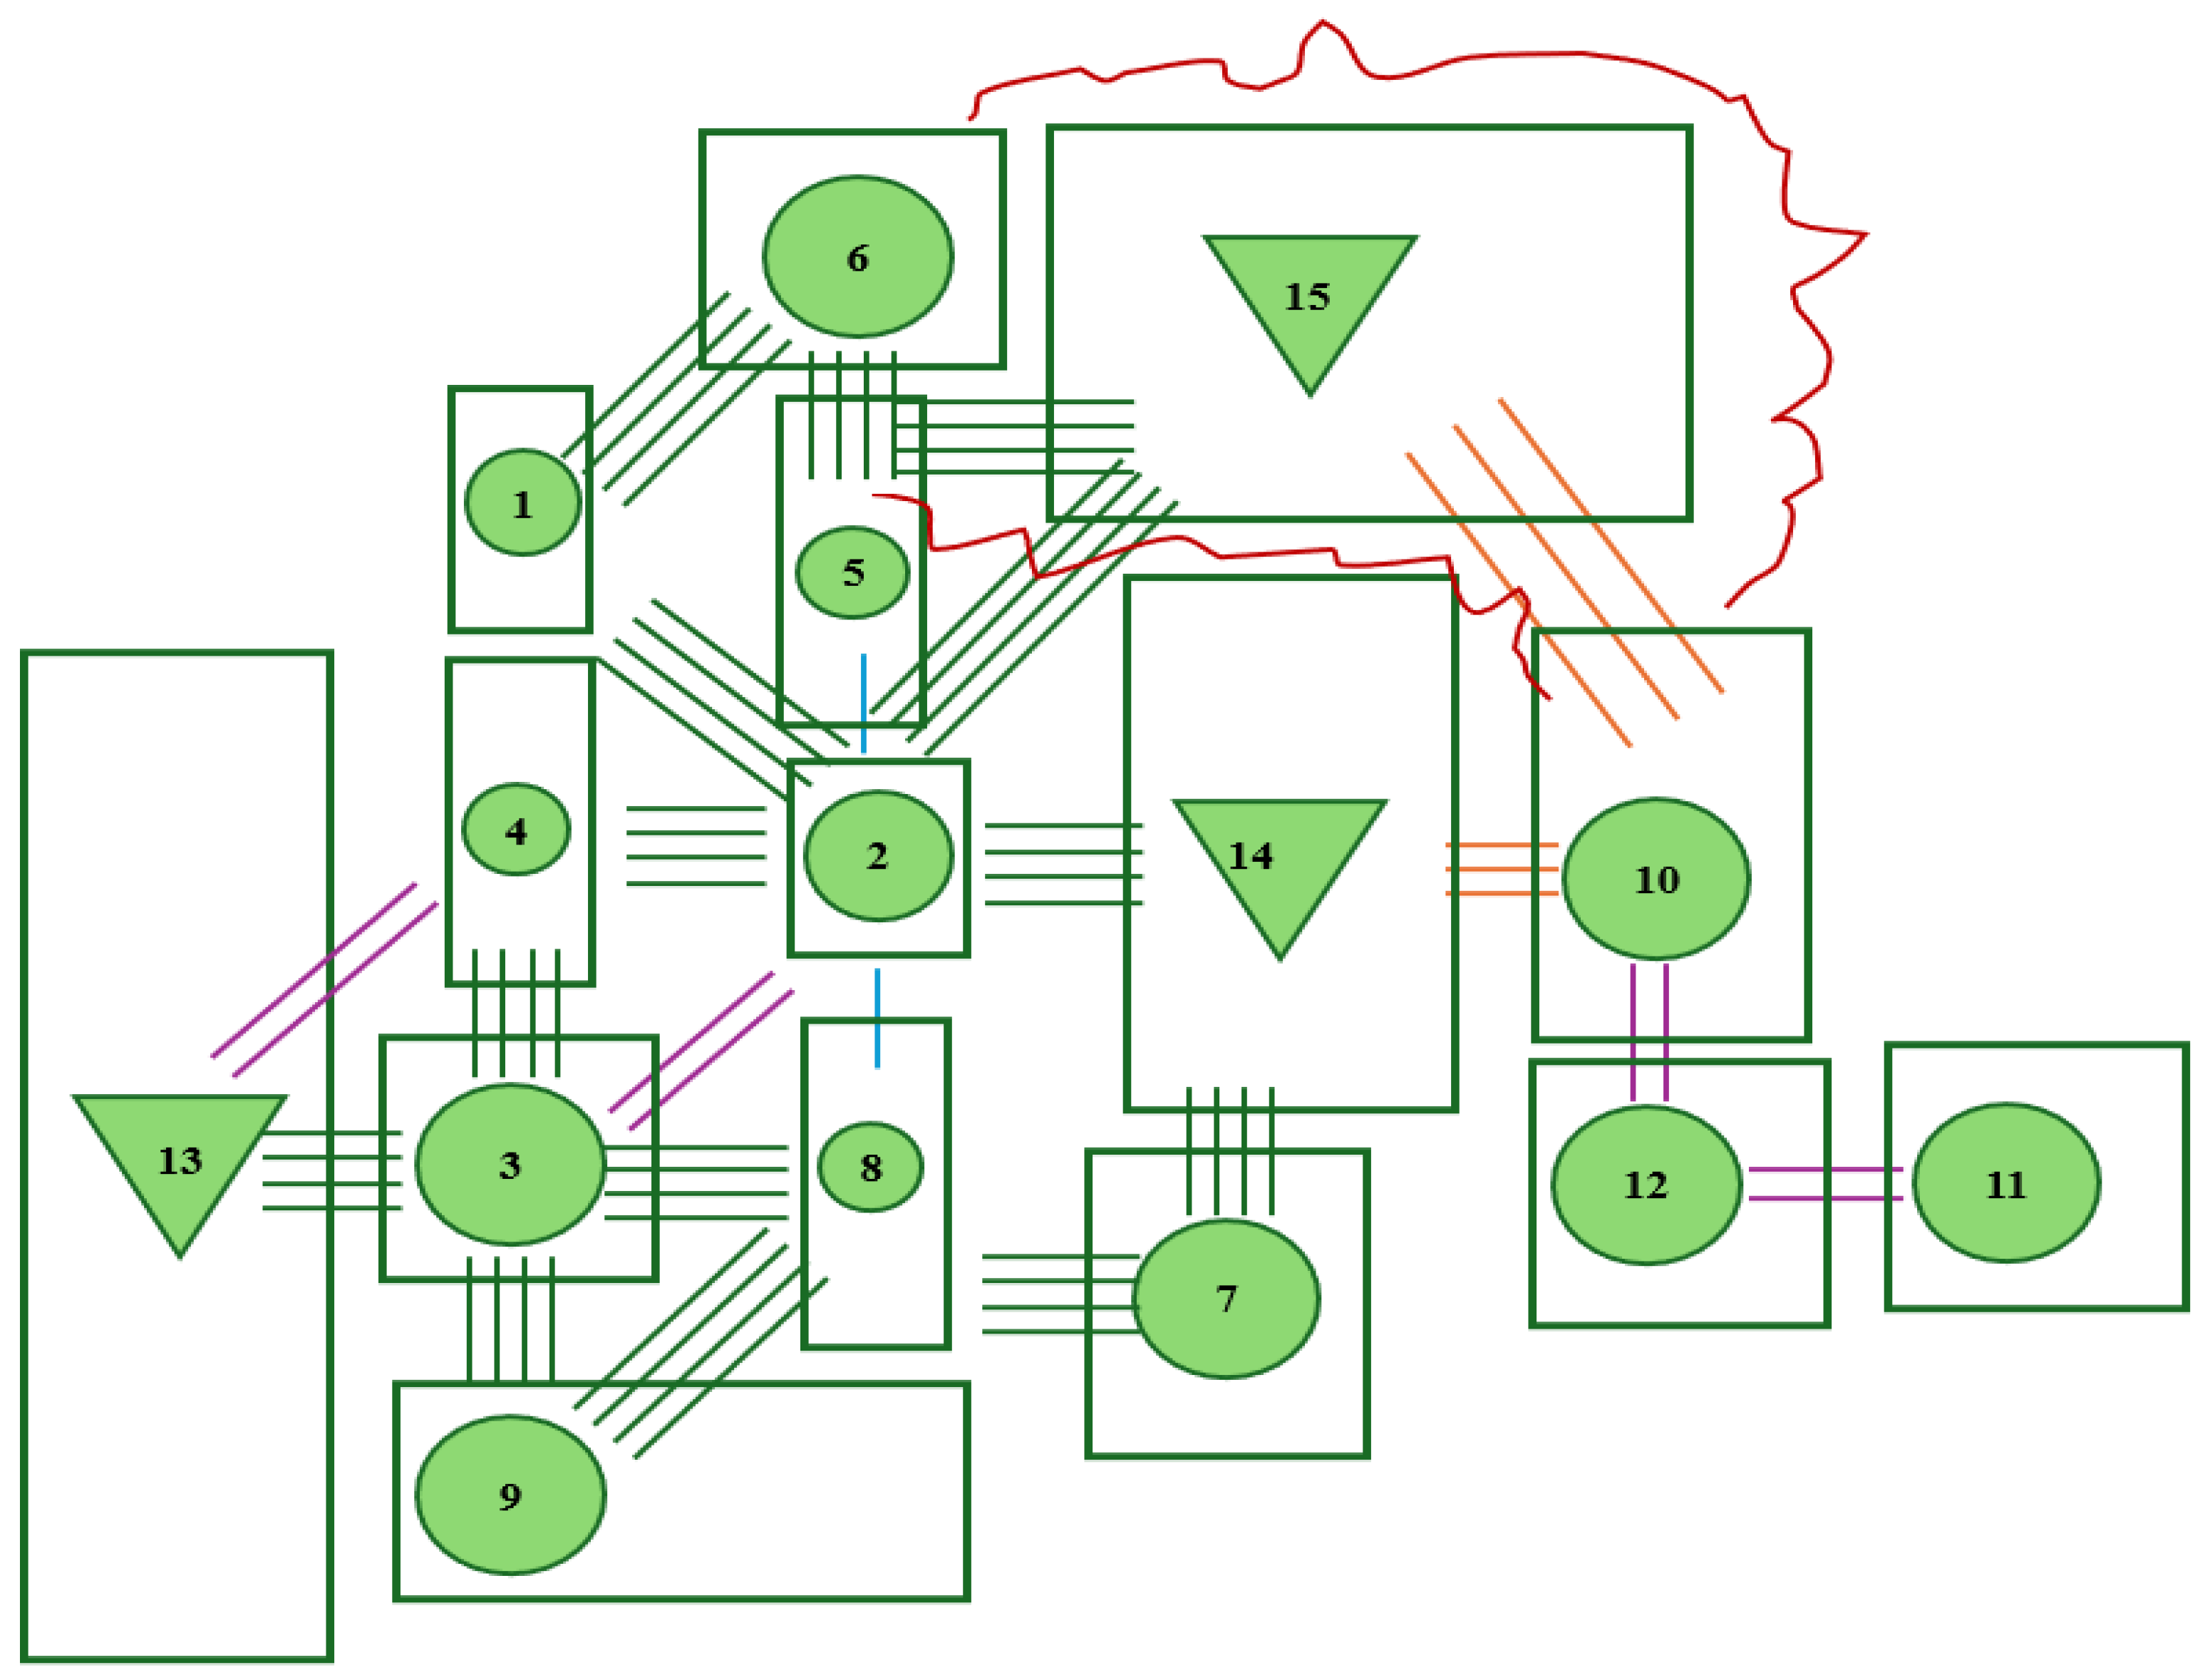
To evaluate the proposals, the relative adjacency method is applied using Equation (4), which weights the importance of the relationships between areas according to assigned values: A (4), E (3), I (2), O (1) and X (−1). This approach, based on the flow between areas and desired proximity, uses a dimensionless diagram to represent priorities. Areas “A” (absolutely necessary) are indicated with 4 straight lines, “E” with 3, “I” with 2, “O” with 1, while “U” has no graphical representation, and “X” (not desirable) is shown with a zigzag line. This analysis selects the proposal with the highest relative efficiency.
where
E is the efficiency,
n is the number of areas, f is the area flow from
i to
j,
X adjacency according to the values or weighting of the letters A, E, I, O, X.
3. Results
3.1. Sector Analysis
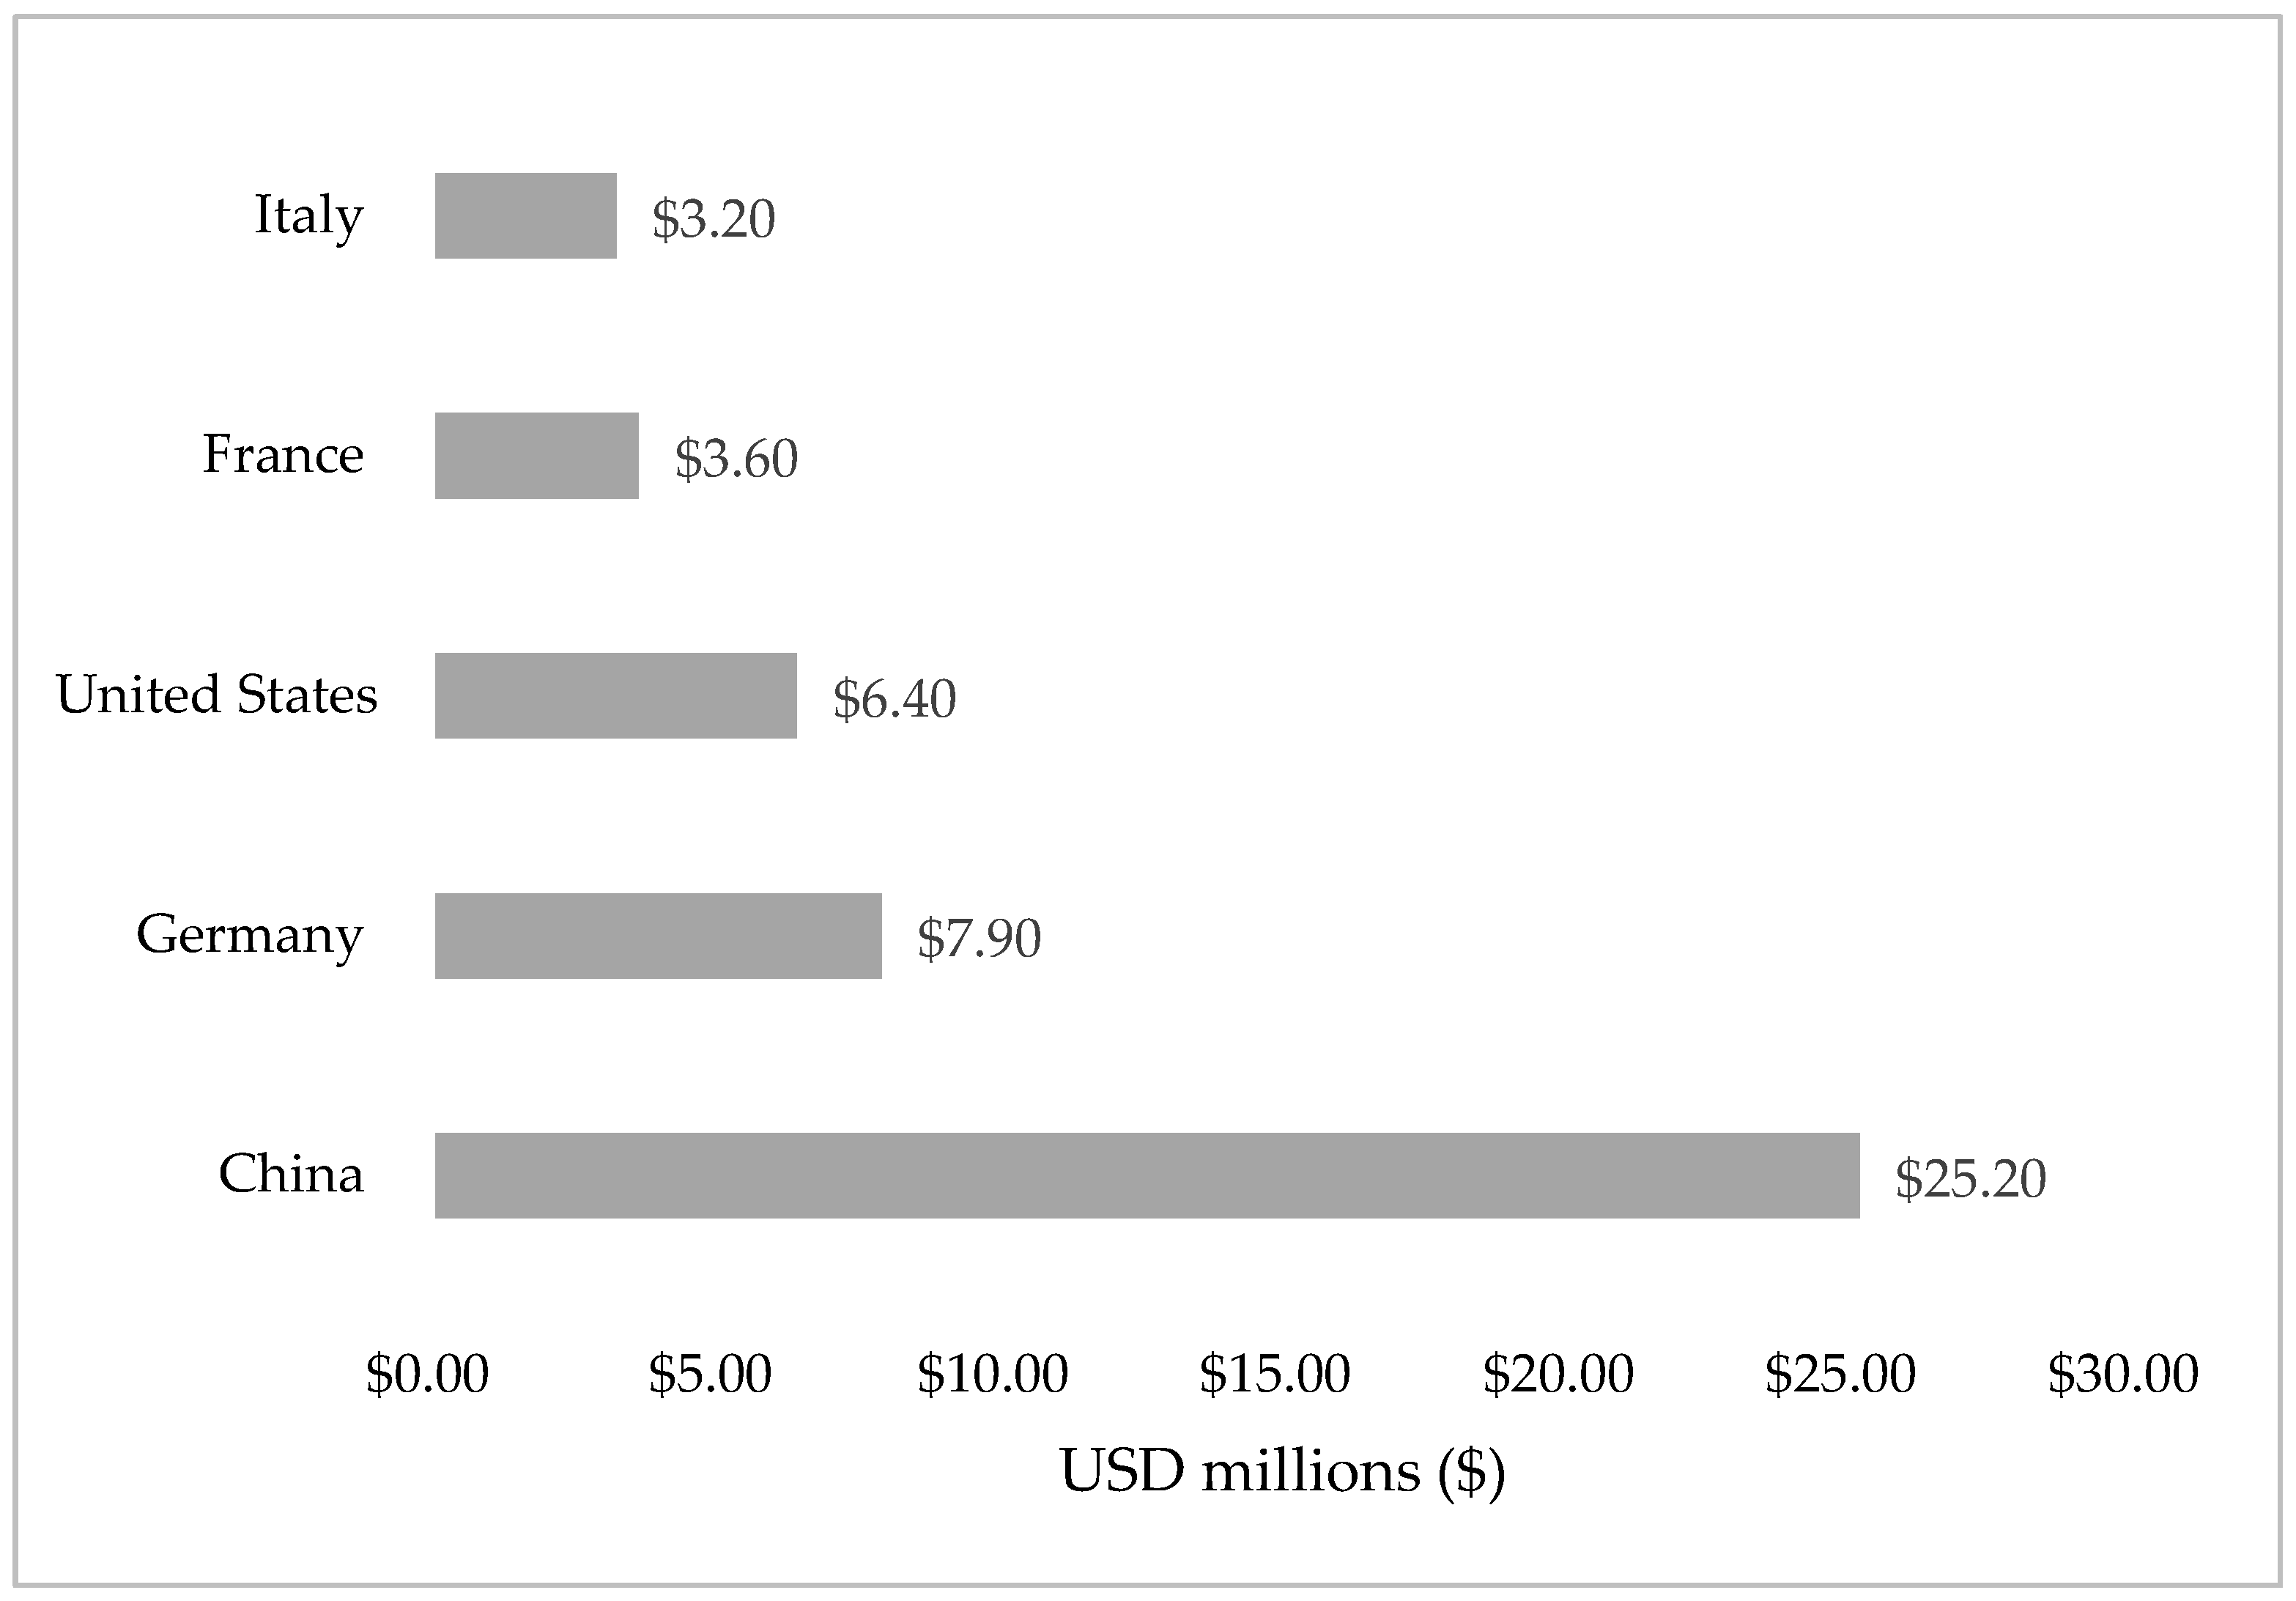
In the context of international trade, glass has established itself as a key product in export and import dynamics. The main exporters of glass in 2022 were China, with
$25.2 billion, followed by Germany with
$7.92 billion, the United States with
$6.41 billion, France with
$3.6 billion and Italy with
$3.2 billion [
23], see
Figure 1.
Figure 2 shows that Colombia exported
$171 million worth of glass, making it the world’s 48th largest exporter of this product in 2023. During the same year, glass was ranked as the country’s 31st most exported product [
23]. The main destinations for these exports were the United States (
$74.4M), Mexico (
$19.6M), Ecuador (
$18.6M), Chile (
$8.57M) and Peru (
$8.53M).
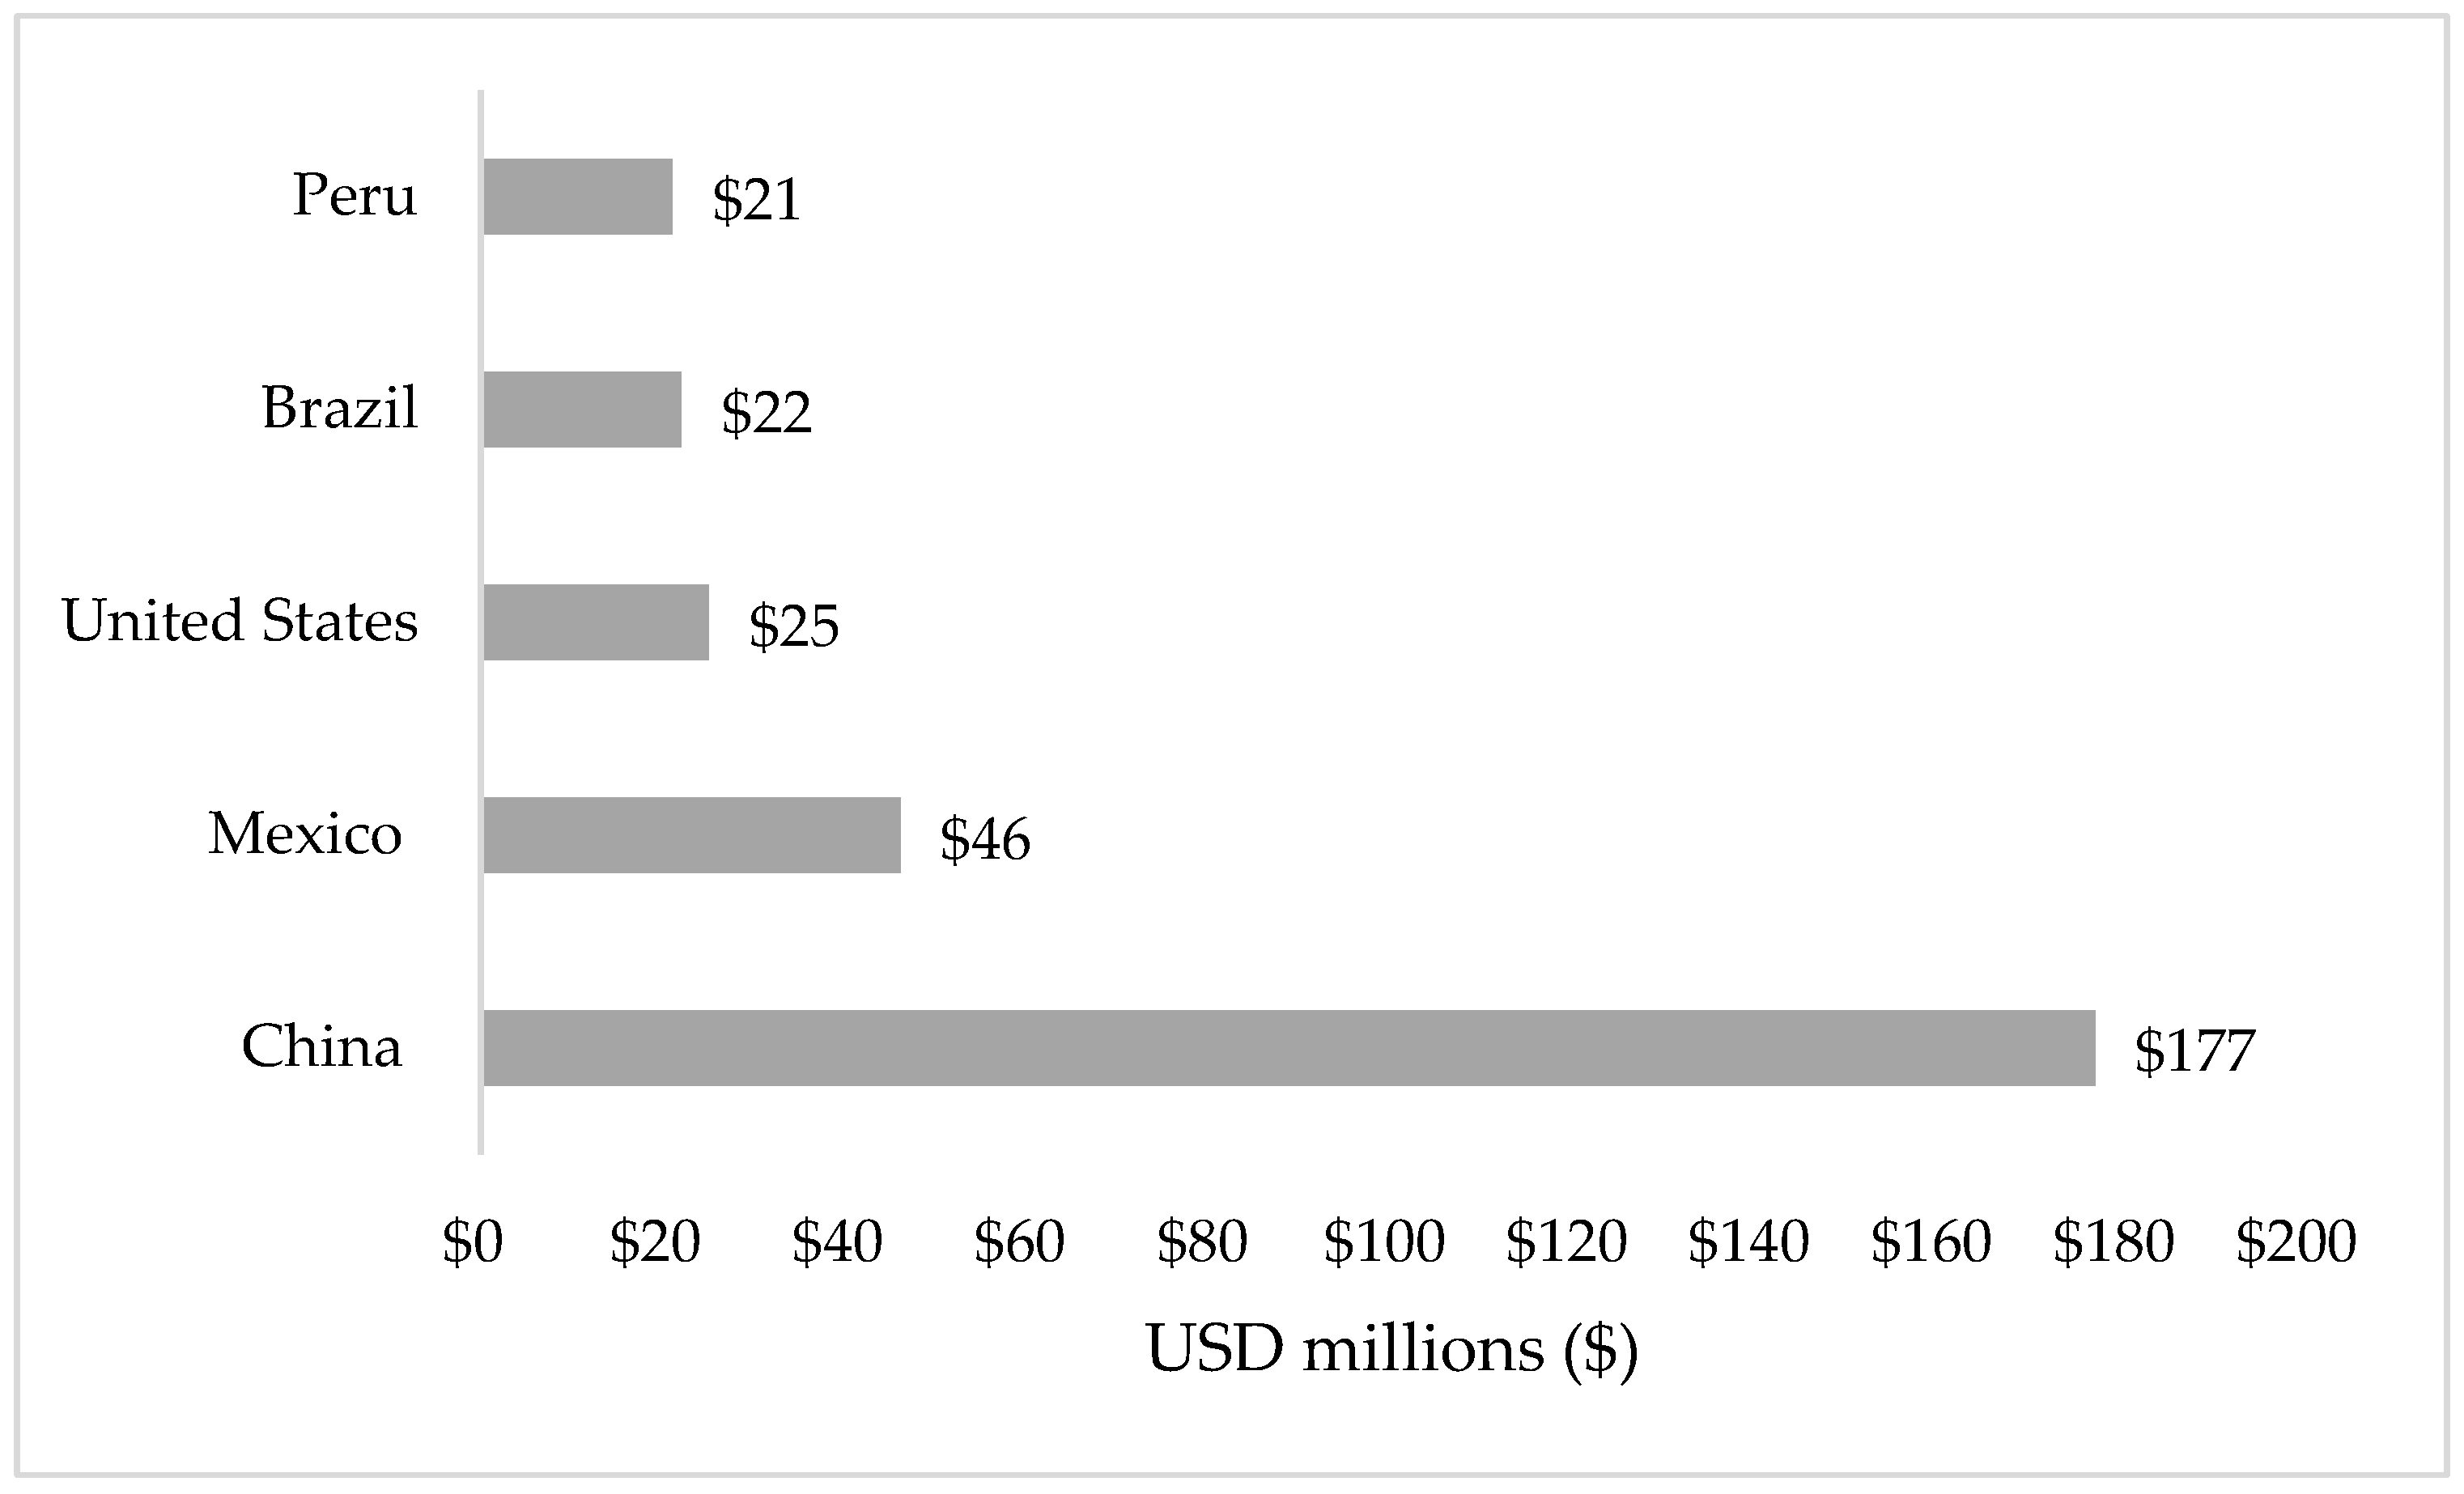
Figure 3 shows that Colombia in 2020 achieved a prominent position in the international trade of glass, registering imports worth
$371 million. This volume made it the 45th largest importer in the world in this sector. Within the Colombian market, glass was positioned as the 37th most demanded product from abroad. Colombia’s main trading partners in this area were China, which led sales with
$177 million, followed by Mexico with
$46.2 million and the United States with
$25 million. Brazil and Peru completed the group of the five largest suppliers, with exports valued at
$21.9 million and
$20.9 million, respectively [
23].
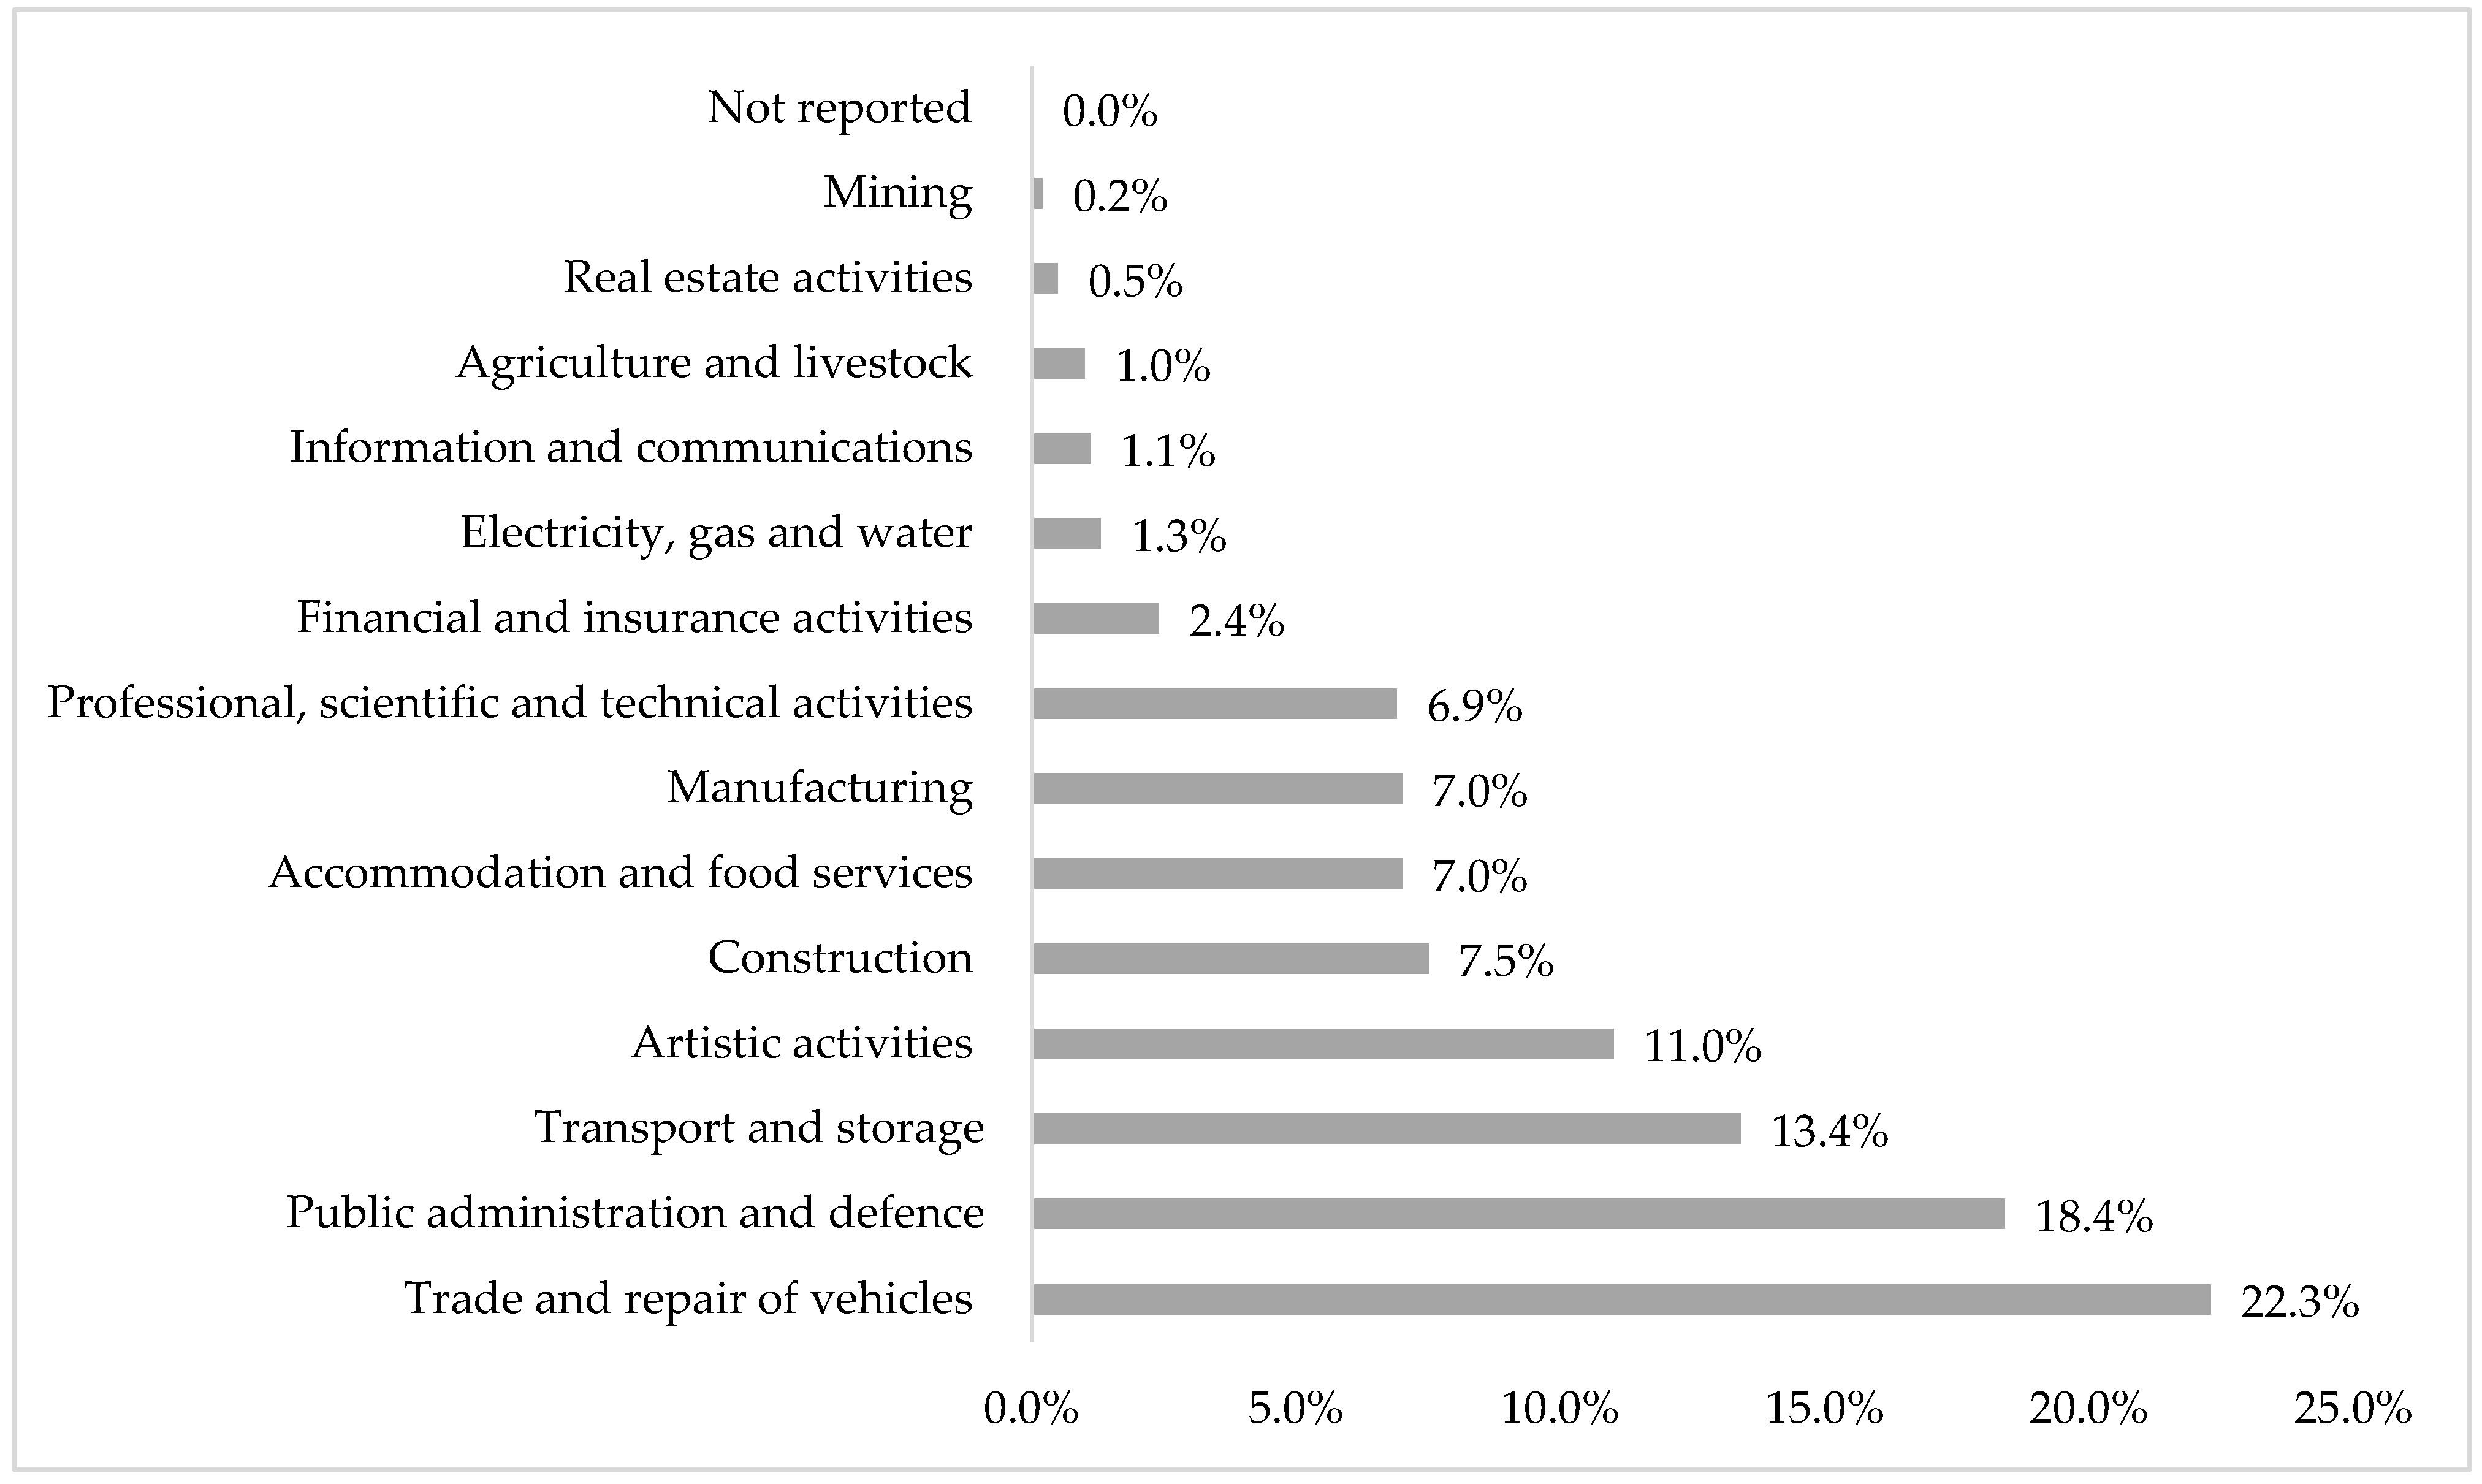
Exports from the department of Sucre have played a modest but significant role in the Colombian trade landscape. During the period 2013–2023, the manufacturing industries sector accounted for 6.45% of the total number of employed people in Sucre, taking as a central axis that in this industry is the glass sector [
24]. These data are presented in
Figure 4.
3.2. General Characteristics of the Company
The company is located in Sincelejo-Sucre and specialises in the manufacture of bevelled mirrors, carved mirrors and dining room glass, as well as distributing aluminium tubes. However, it faces challenges in its plant layout and material handling, which leads to inefficient flows, long waiting times between stages, and space management that hampers staff mobility and the movement of semi-finished products.
Its supply chain includes key suppliers such as Tecnoglass S.A.S., Vidrios y Aluminios del Pacífico, and Cristalería Peldar for glass, while Andesia Aluminios supplies the aluminium tubes. The operation starts with the reception of raw materials, followed by specific processes for each product. For example, bevelled mirror includes cutting, bevelling and polishing; dining room glass incorporates carving and decorative grinding, and polished mirror undergoes cutting and edge treatment to ensure safety and aesthetics.
Each finished product undergoes verification and inspection before being stored for distribution. These processes reflect the company’s focus on the quality and customization of its products, while highlighting the need to optimise its operations to improve overall efficiency.
3.2.1. Time Study
A time study was carried out in the production plant using the back-to-zero timing method, which measures the time of each activity from start to finish, restarting the stopwatch for subsequent activities. During the visit, 15 representative samples were taken from the processes of each product. The estimated times provided by the operators were 5.53 min for cutting, 15.23 min for bevelling and 10.55 min for polishing the bevelled mirror; 5.53 min for cutting, 10.55 min for polishing, 20 min for carving and 15 min for grinding the dining glass; and 5 min for cutting and 10 min for polishing the polished mirror.
The calculation of the actual times was based on parameters such as the assessment of the work rate and additional times, expressed in percentages, as well as on the times (TO), (TN) and (TE). The results indicated that the average actual time to manufacture a bevelled mirror is 17.82 min, for the dining glass it is 12.13 min and for the polished mirror it is 7.98 min.
For the validation of the time study, the product with the highest number of stages is taken to describe the process. The times recorded are detailed in
Table 1 below.
The reference data for the time study analysis are based on the estimates provided by the operator responsible for providing the general information. According to these estimates, the time required for the cutting process is 5.53 min, for polishing it is 10.55 min, for carving it is 20 min and for grinding it is 15 min.
Calculation of Observed Time, Normal Time, Standard Time and Complementary Time
To start calculating the times, it is necessary to consider certain parameters that must be taken into account in order to make these calculations, namely the assessment of the work rate and the additional times (expressed in percentages).
Pace rating is the rating that the analyst assigns to workers based on observation of how they perform their duties. Generally, analysts with extensive experience in time study assign ratings according to their own criteria. However, the ILO has established a standard rating for those analysts who lack such experience in order to ensure a successful evaluation, and it was this rating that was taken into account in conducting the study.
Table 2 illustrates the standard rating provided by the ILO [
22].
Table 2 illustrates the rating that the time study analyst applies to assess the pace at which workers carry out each of their operations. Based on this, a reference value is used and assigned a score of 100. This value represents the ideal time that reflects the optimal performance of a worker in the activity he/she is performing. This valuation is necessary to calculate the normal time (NT) within the time study, which is obtained by multiplying the observed time by the assigned rating.
Another parameter to take into account is the supplementary time to be added to the normal time, which is crucial in the study. For the elaboration of these supplements, the table defined by the ILO [
22] was taken into account.
Table 3 illustrates the additional times or gaps that must be considered when implementing the time study if the worker is a man, which is fundamental for calculating the standard time within the process.
Figure 4 below shows the time gaps identified in the study carried out in the company.
For the calculation of the atmospheric conditions clearance, Equation (1) is used; to identify the corresponding value to solve the equation, the thermal comfort zone graph from [
22] is used. In the case of the production plant of the company under study, the dry bulb temperature is around 95°F (35°), the wet bulb 86°F (30 °C) and relative humidity is 75%. Considering this analysis, we proceed to solve the equation:
The atmospheric conditions in the company are identified as 27 °C. With these parameters in consideration, we proceed to calculate the observed, normal, standard and complementary times for each of the stages of the bevelled mirror, dining glass and polished mirror products.
Table 4 below shows the calculation for the dining glass product.
The observed time (OT) is the average of the timed time.
The normal time (TN) is the product of the TO and the valuation. This valuation is assigned by the analyst who performed the time study.
The standard time (TE) is the product of the TN and the supplementary %.
The additional time (OT) is the sum of the TN plus the overtime value.
The standard time represents the time needed to carry out this analysis, as it determines the actual time required to produce the dining glass. This time takes into account the theoretical duration of all the stages, as well as any downtime that may arise due to certain time margins, such as the personal needs or physical conditions of the worker. For this case, the actual time taken to make the product is 12.13 min per product.
3.3. Diagnosis of the Current Situation
The company operates Monday to Friday on an 8-h shift with a team of 7 workers. The plant is 16.24 × 22.08 metres, but the current layout of machines and storage areas has limitations that affect operational efficiency. Inefficient material flows and unnecessary transfer times are key issues impacting productivity.
It is necessary to reorganise the equipment and collection areas to reduce unnecessary movements and handling, eliminating downtime and improving overall performance. The performance of the system was evaluated using Equation (1), obtaining an efficiency of 73% for the bevelled mirror, 64% for the dining glass and 78% for the polished mirror. In addition, the location of the toilets and washroom area between production and storage hinders the workflow. For the analysis of the design and processing times, Revit and FlexSim V 22.2.0 tools were used.
3.4. Basis for the Construction of the Simulation Model of the Real Plant
3.4.1. Development of the Goodness of Fit Test
Once the data corresponding to the process time variable for each of the stages analysed in the StatFit tool had been integrated, a goodness-of-fit test was performed to determine the behaviour of the data by means of statistical analysis. The distribution that obtained the best percentage of fit was selected for use.
Table 5 shows the distributions obtained for each stage of the outputs.
Once the distributions to which the data fit were obtained, the model was coded in FlexSim V 22.2.0 software. An analysis of the data for each of the types of products available to the company was carried out using the Stat-Fit interface that is integrated in promodel, in which the behaviour of the data along the process stages is evidenced.
3.4.2. System Validation
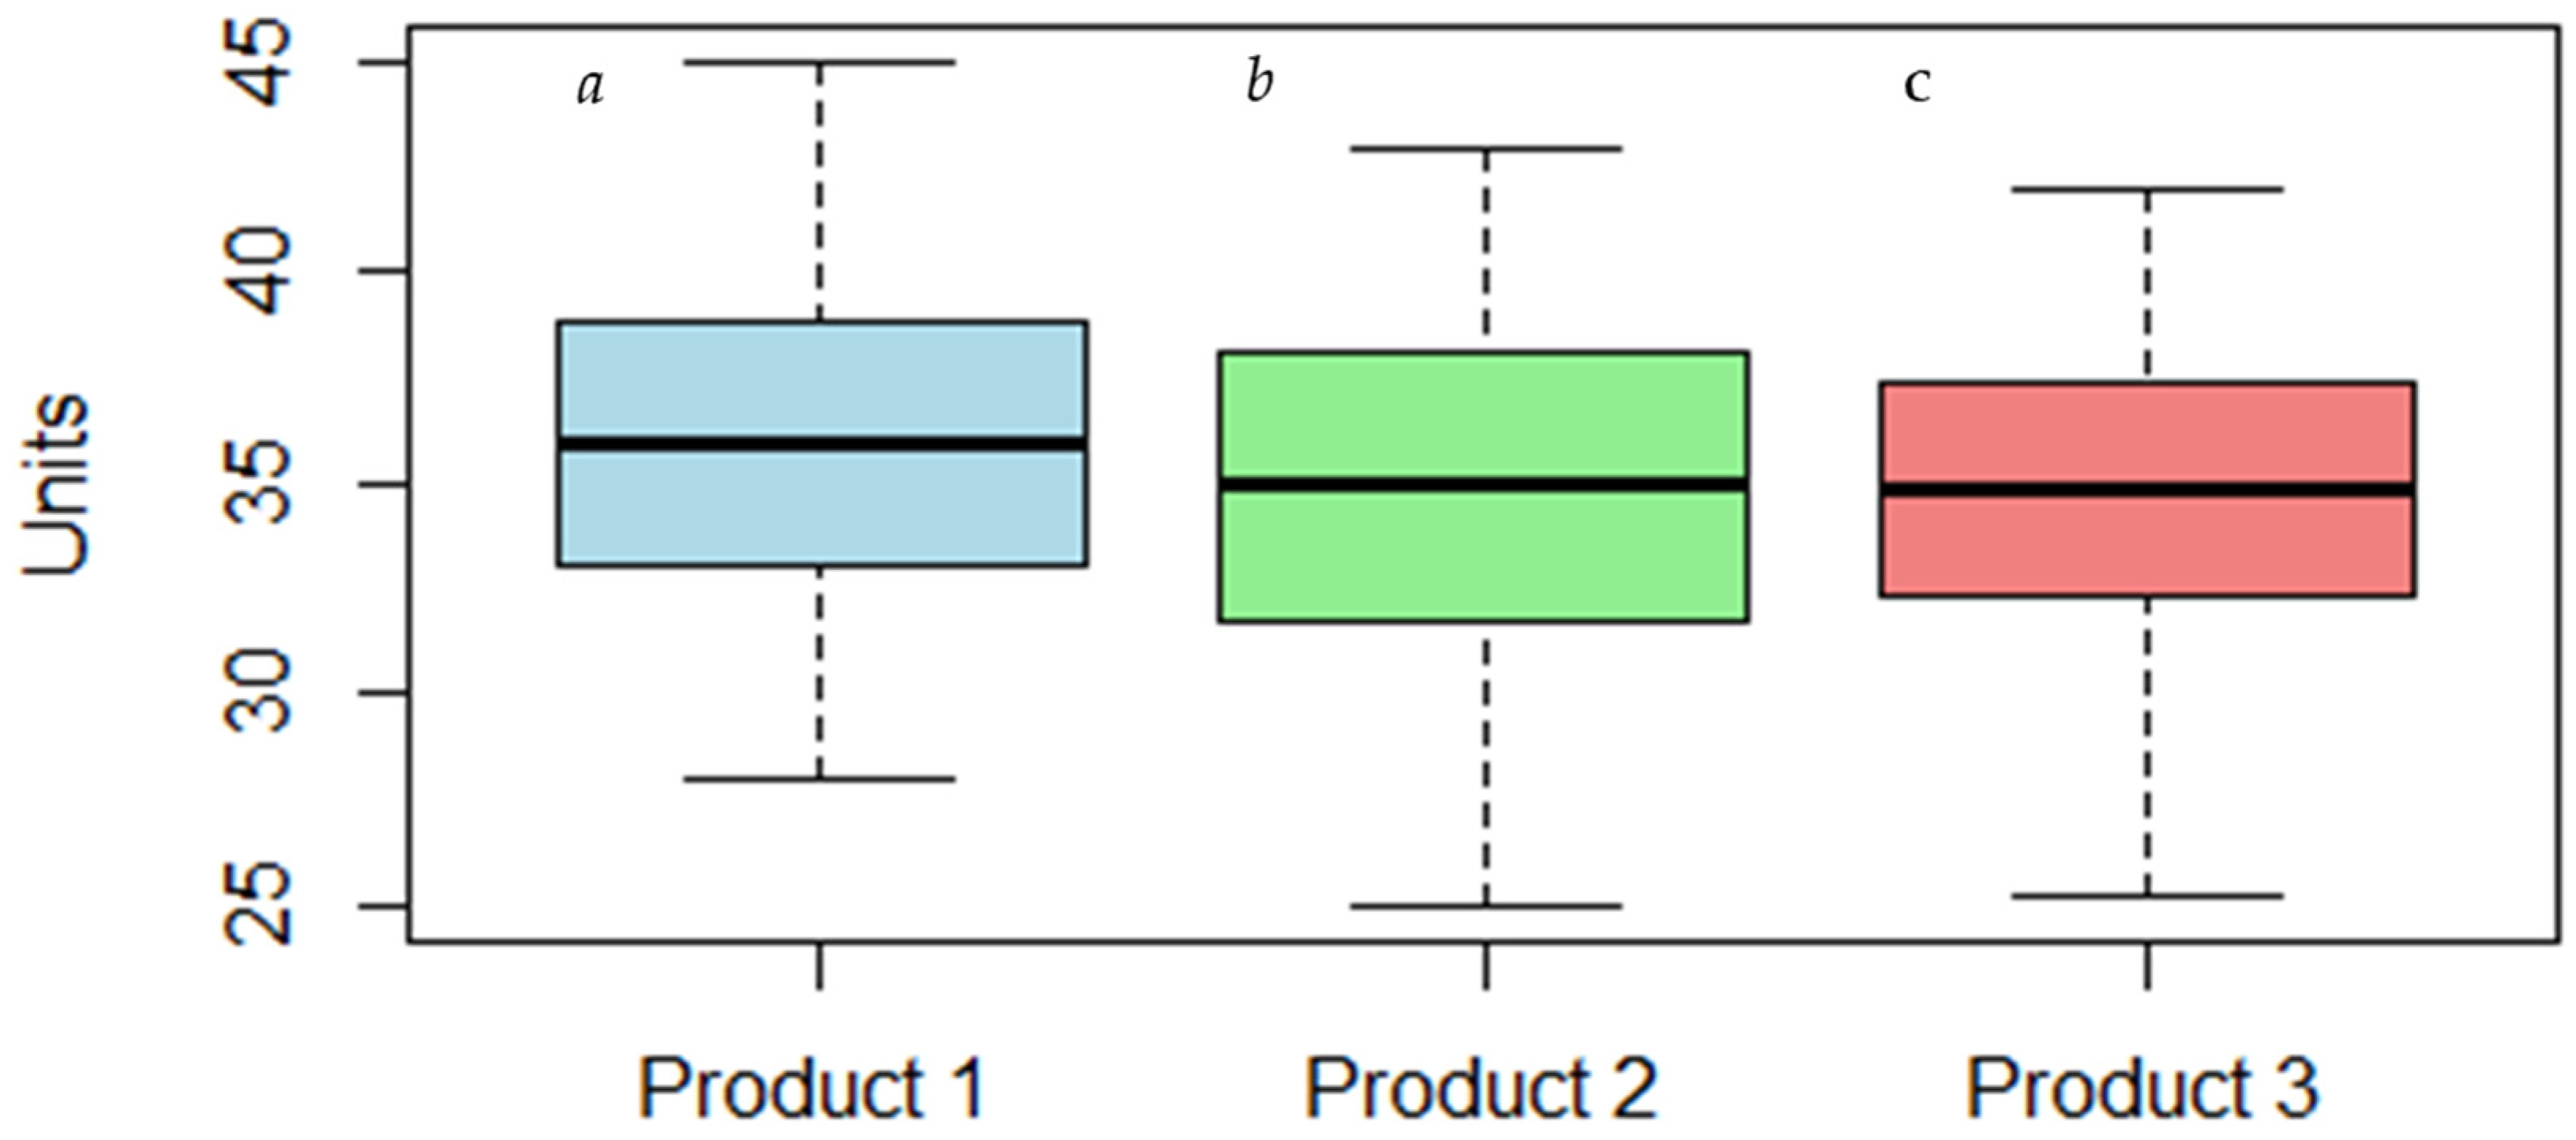
To determine the optimum number of replicates per run, initial calculations were performed using Equation (3) with a significance level of 5% and a margin of error of 0.5%. The results indicated that the optimum number of replicates was 382 for the bevelled mirror, 379 for the dining glass and 380 for the polished mirror. Subsequently, a Z-hypothesis test was applied to compare the means of the real and simulated units in each case. The variances for the bevelled mirror were 21.98 (actual) and 24.83 (simulated), giving a Z-value of 0.7472. For the dining glass, the variances were 20.34 (actual) and 24.65 (simulated), with a Z-value of 0.5444. Finally, for the polished mirror, the variances were 18.76 (actual) and 24.75 (simulated), with a Z-value of 0.5813. In all cases, the Z-values were within the acceptance limits, indicating that there is insufficient evidence to reject the null hypothesis and confirming the homogeneity in the dispersion of both data sets.
Figure 5 shows the data and corresponding experimental plots for each product using the RStudio tool:
Figure 5a corresponds to the bevelled mirror,
Figure 5b to the polished mirror and
Figure 5c to the dining glass. The results show a 95% confidence interval, which means that it is within the acceptance limits.
3.5. Application of the SLP Methodology
Table 6 shows the specific dimensions of each work area within the plant, expressed in square metres. These measurements are essential for the efficient planning and management of the operations in each space, which will allow the layout design to be optimised.
Figure 6,
Figure 7,
Figure 8 and
Figure 9 present the diagrams developed with the SLP methodology. In
Figure 6 initial alternatives are generated using blocks to schematise the areas of the plant.
Figure 7 shows the dimensionless diagram, where central numbers identify areas and the extremes represent their relationships.
Figure 8 visualises interactions between functional areas through a relational path diagram, using lines to indicate the intensity of the relationships. Finally,
Figure 9 represents to scale the size and distribution of the areas, reflecting the needs of each department.
3.5.1. Proposals
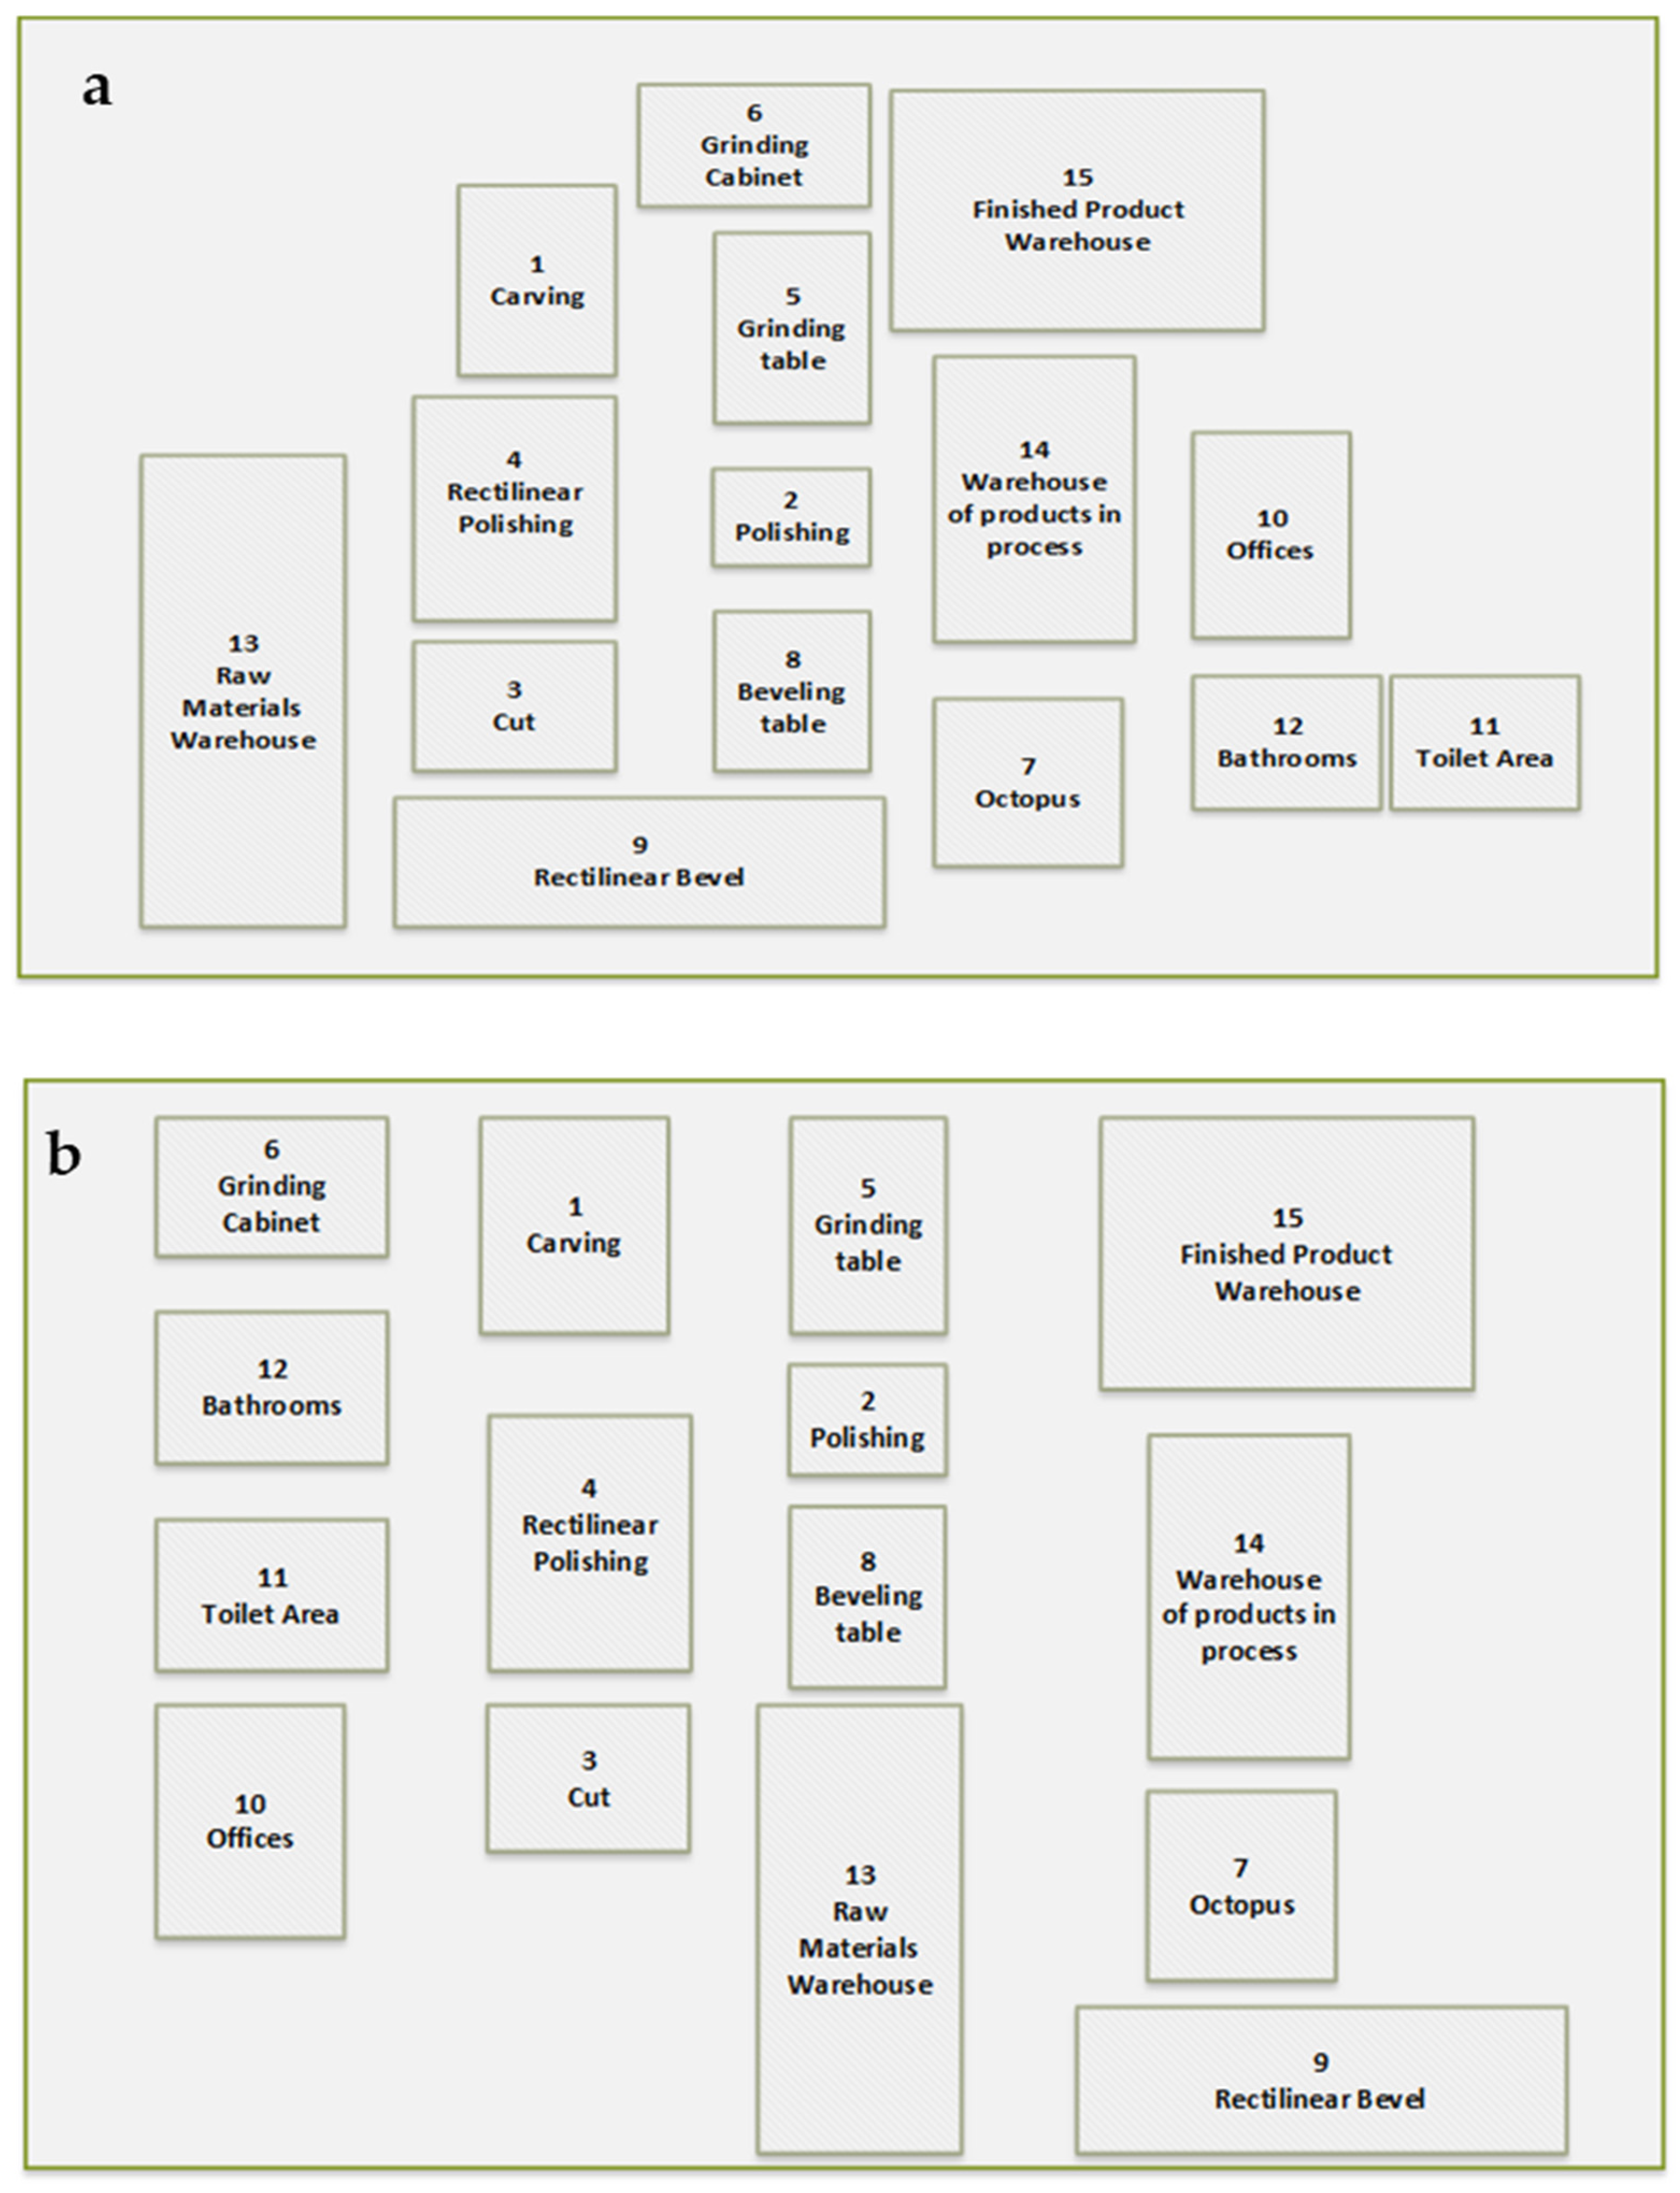
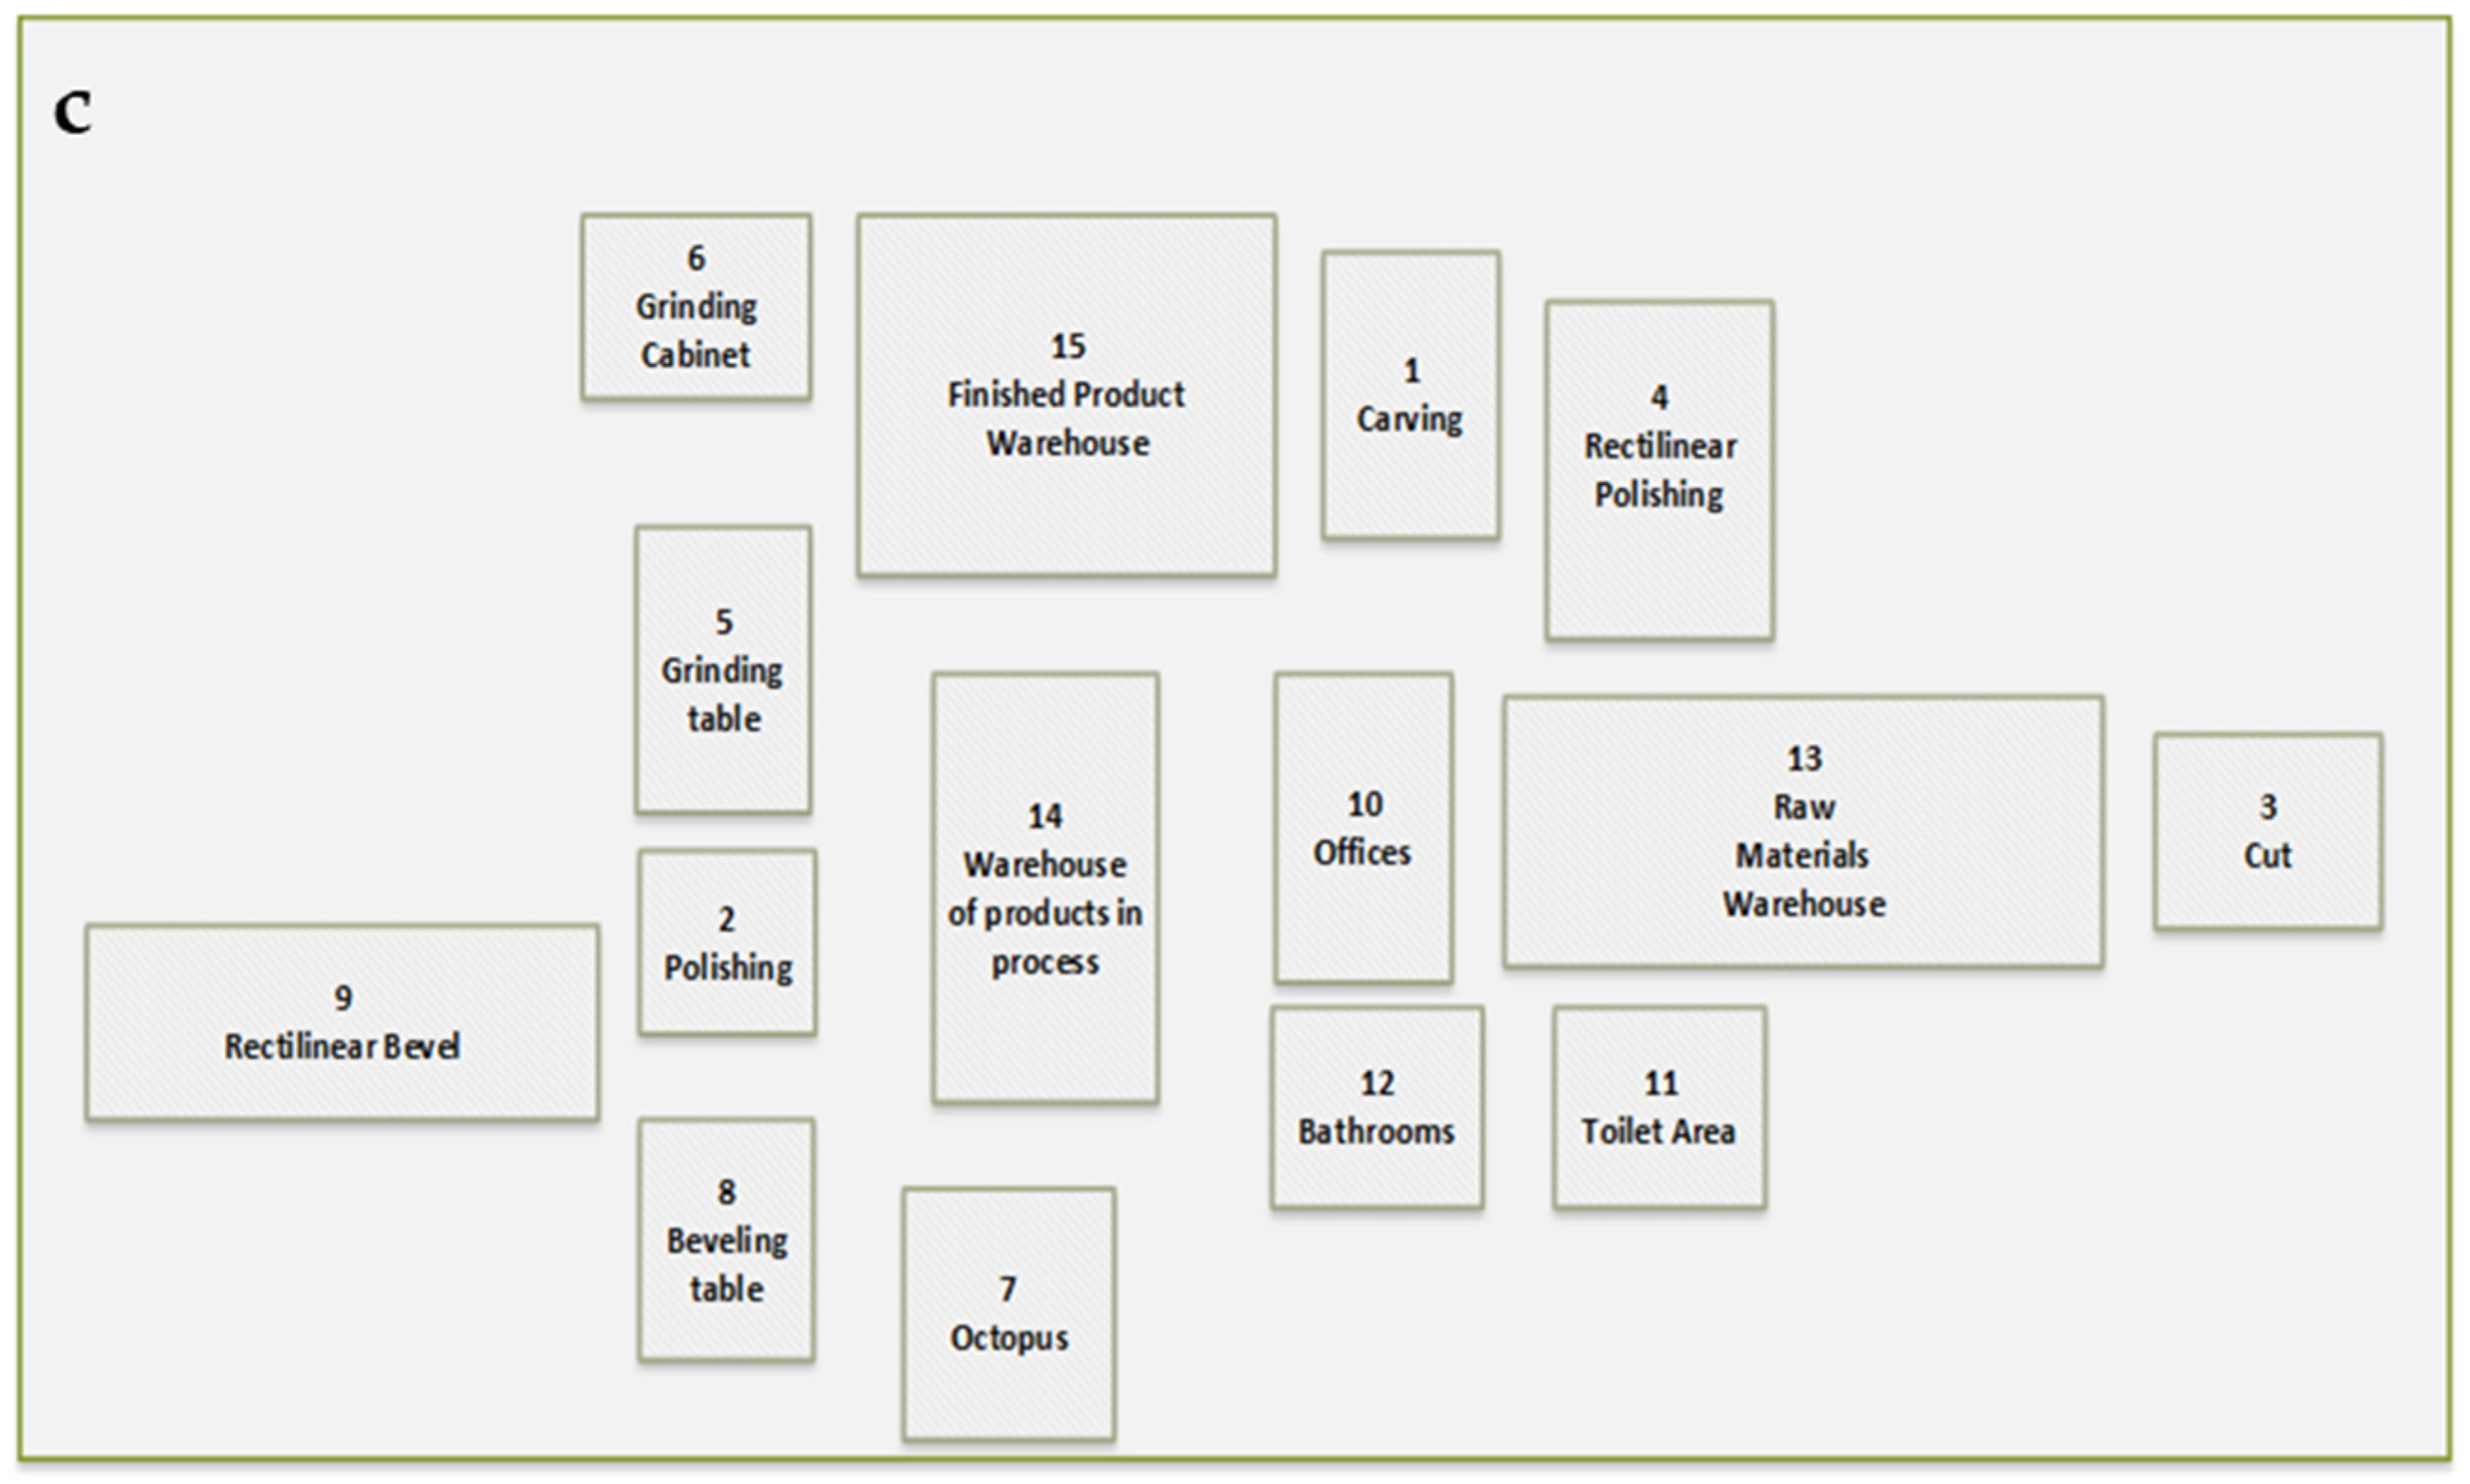
Based on the elaboration of the relational and relational diagrams of spaces, 3 proposals for the layout of the plant are drawn up, obtained using the SLP methodology. These are shown in
Figure 10.
3.5.2. Efficiency Evaluation and Choice of Proposals
Based on the weights, the efficiency of each proposal is calculated.
Table 4 shows the results for each proposal where Fij represents the set of existing relationships based on the analysis of the relational diagram of paths and activities. This analysis includes the level of importance of these relationships, the corresponding value according to their level of importance, and the adjacency in each of the proposals, that is, the closeness of each of the proposed cases with respect to Fij.
Table 7 evaluates each of the proposals, and the analysis of these evaluations is presented in
Table 8 The relevant summations and calculations were made according to Equation (4), resulting in a Fij value of 78.
Table 5 shows that design 1 demonstrated an efficiency rate of 90% with respect to relative adjacency, compared to 79% and 65% for the other proposals, respectively.
3.6. Designs Developed in FlexSim Software
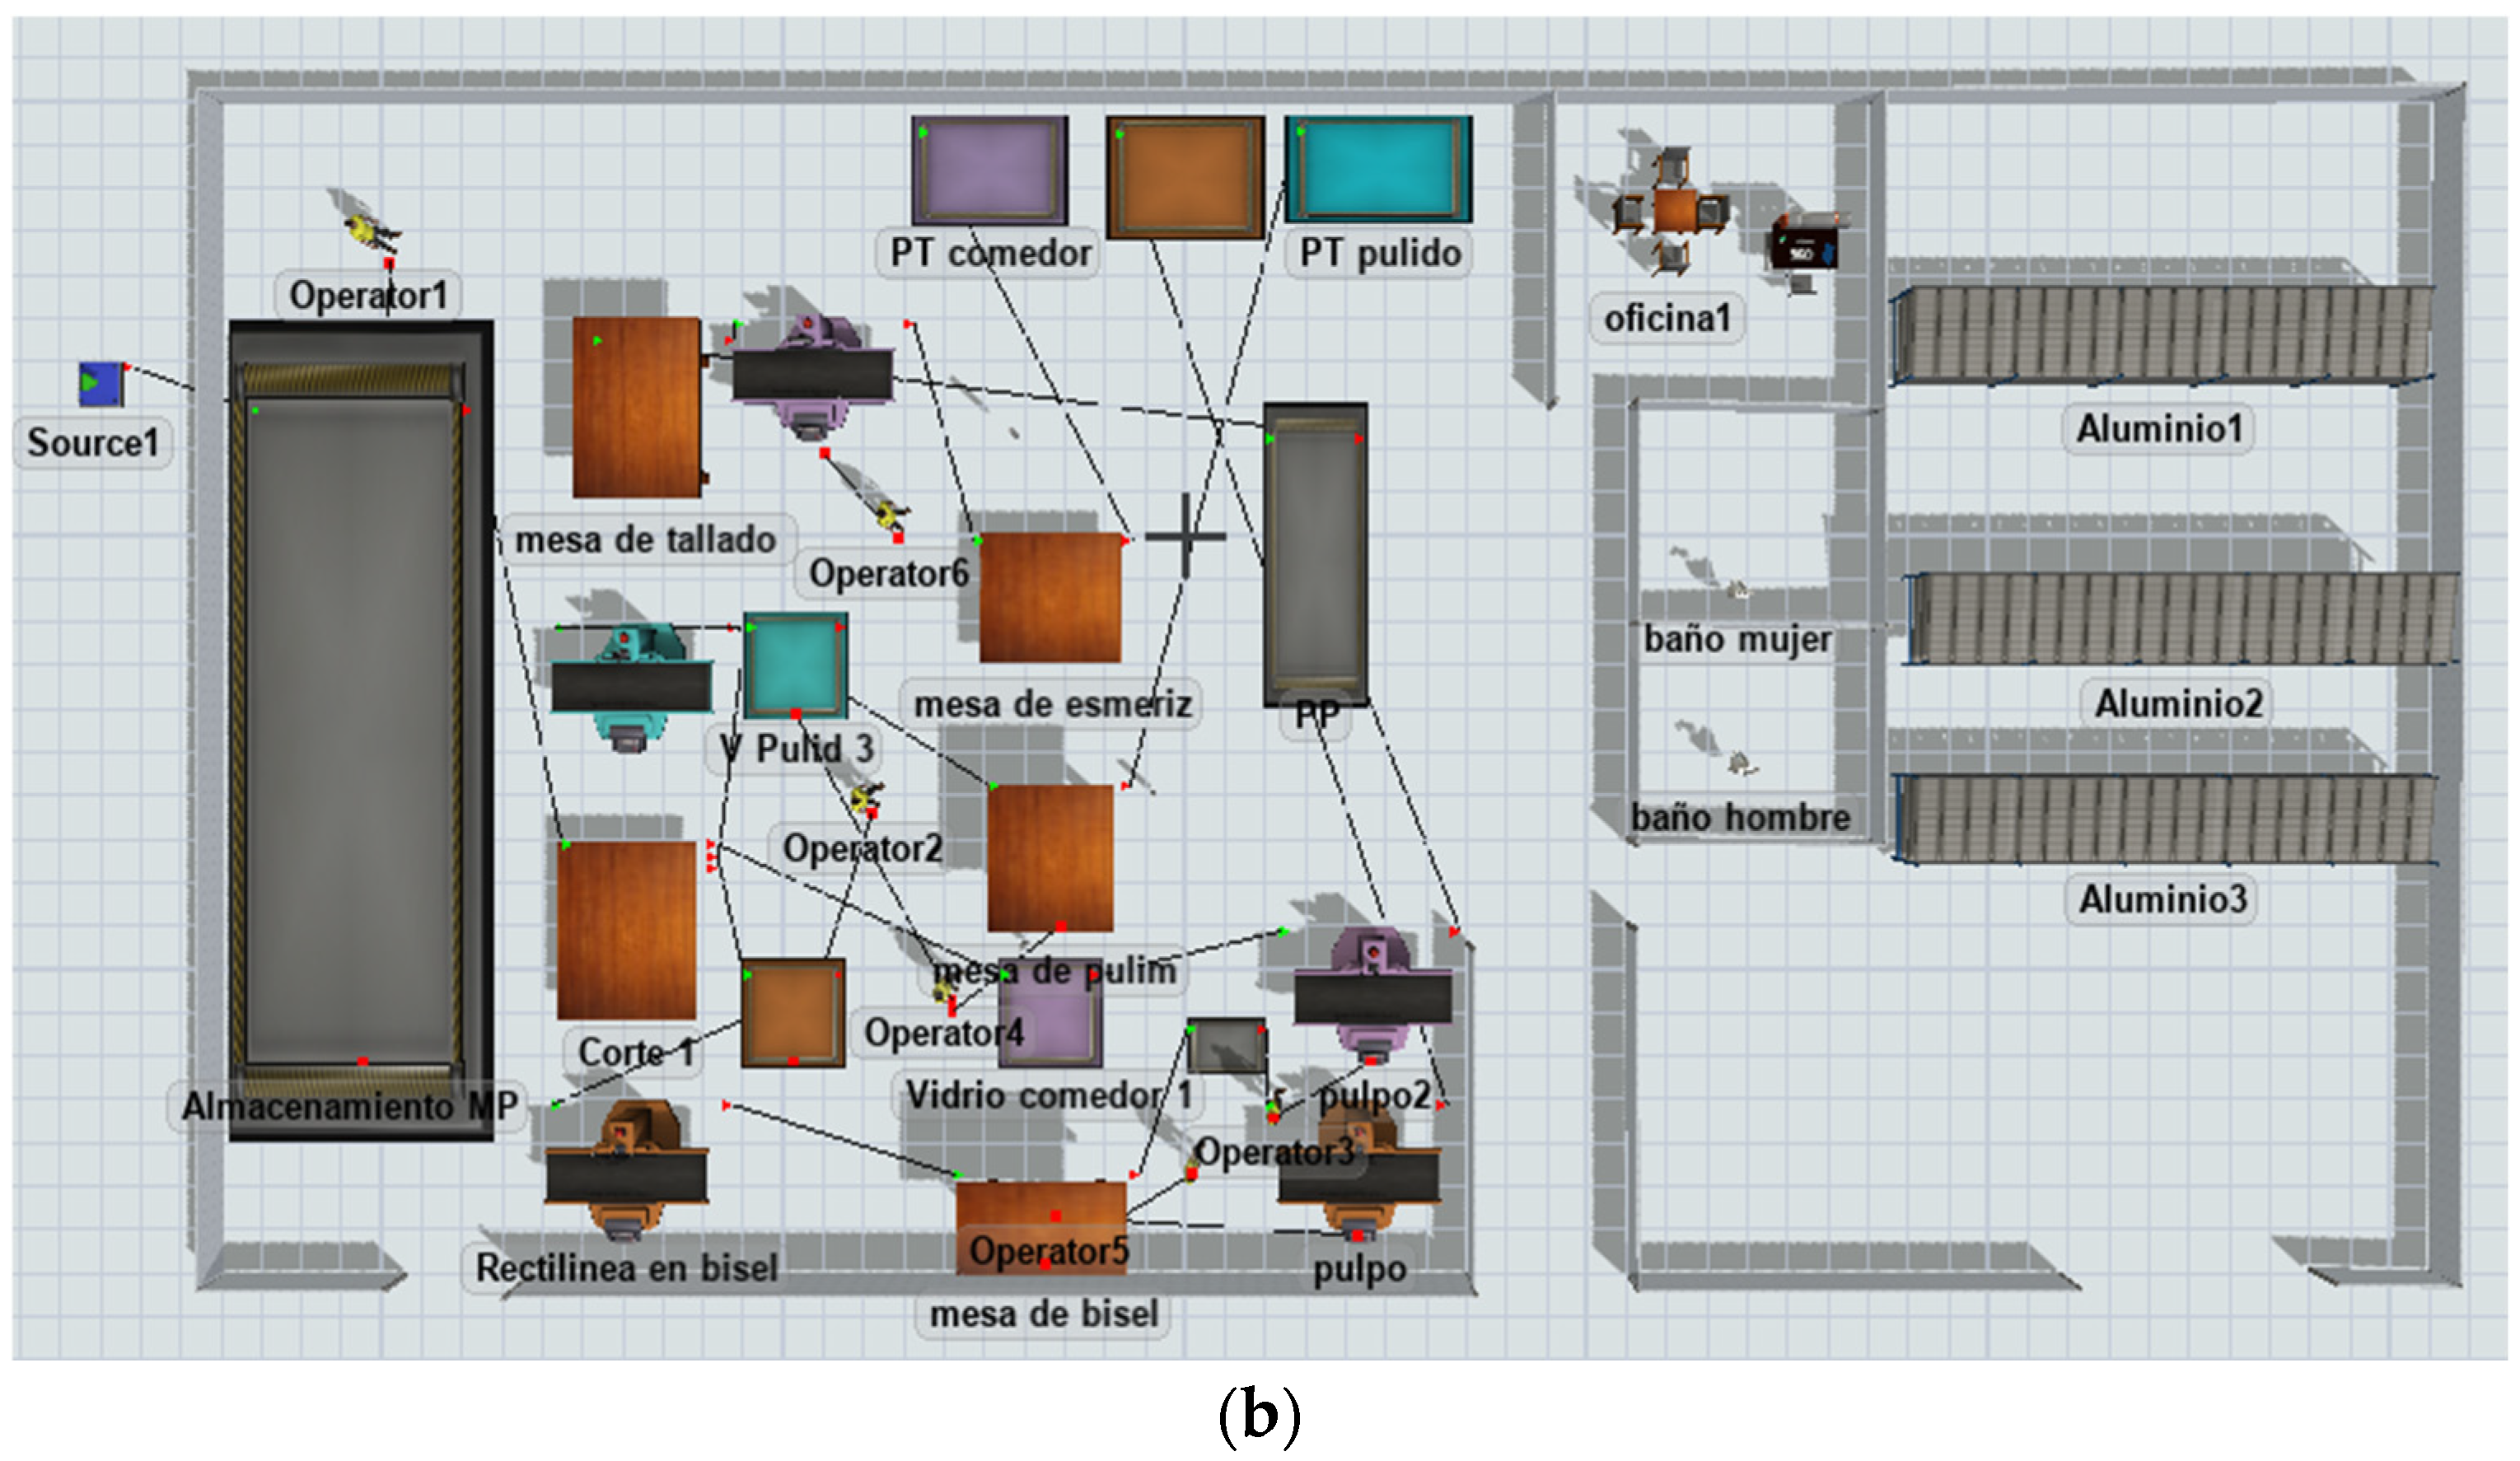
The actual layout design was developed in FlexSim software, specifying the operation time of each machine during a working day from 7:00 AM to 6:30 PM. The system includes 1 Source, 9 Queue and 10 Processor, with a logical order and location of machines and operators shown in
Figure 11a. The proposed design, “Design 1”, which achieved the best efficiency, maintains the components of the actual layout, respecting the arrangement of machines and operators, as shown in
Figure 11b.
Evaluation of the Final Plant Layout Design
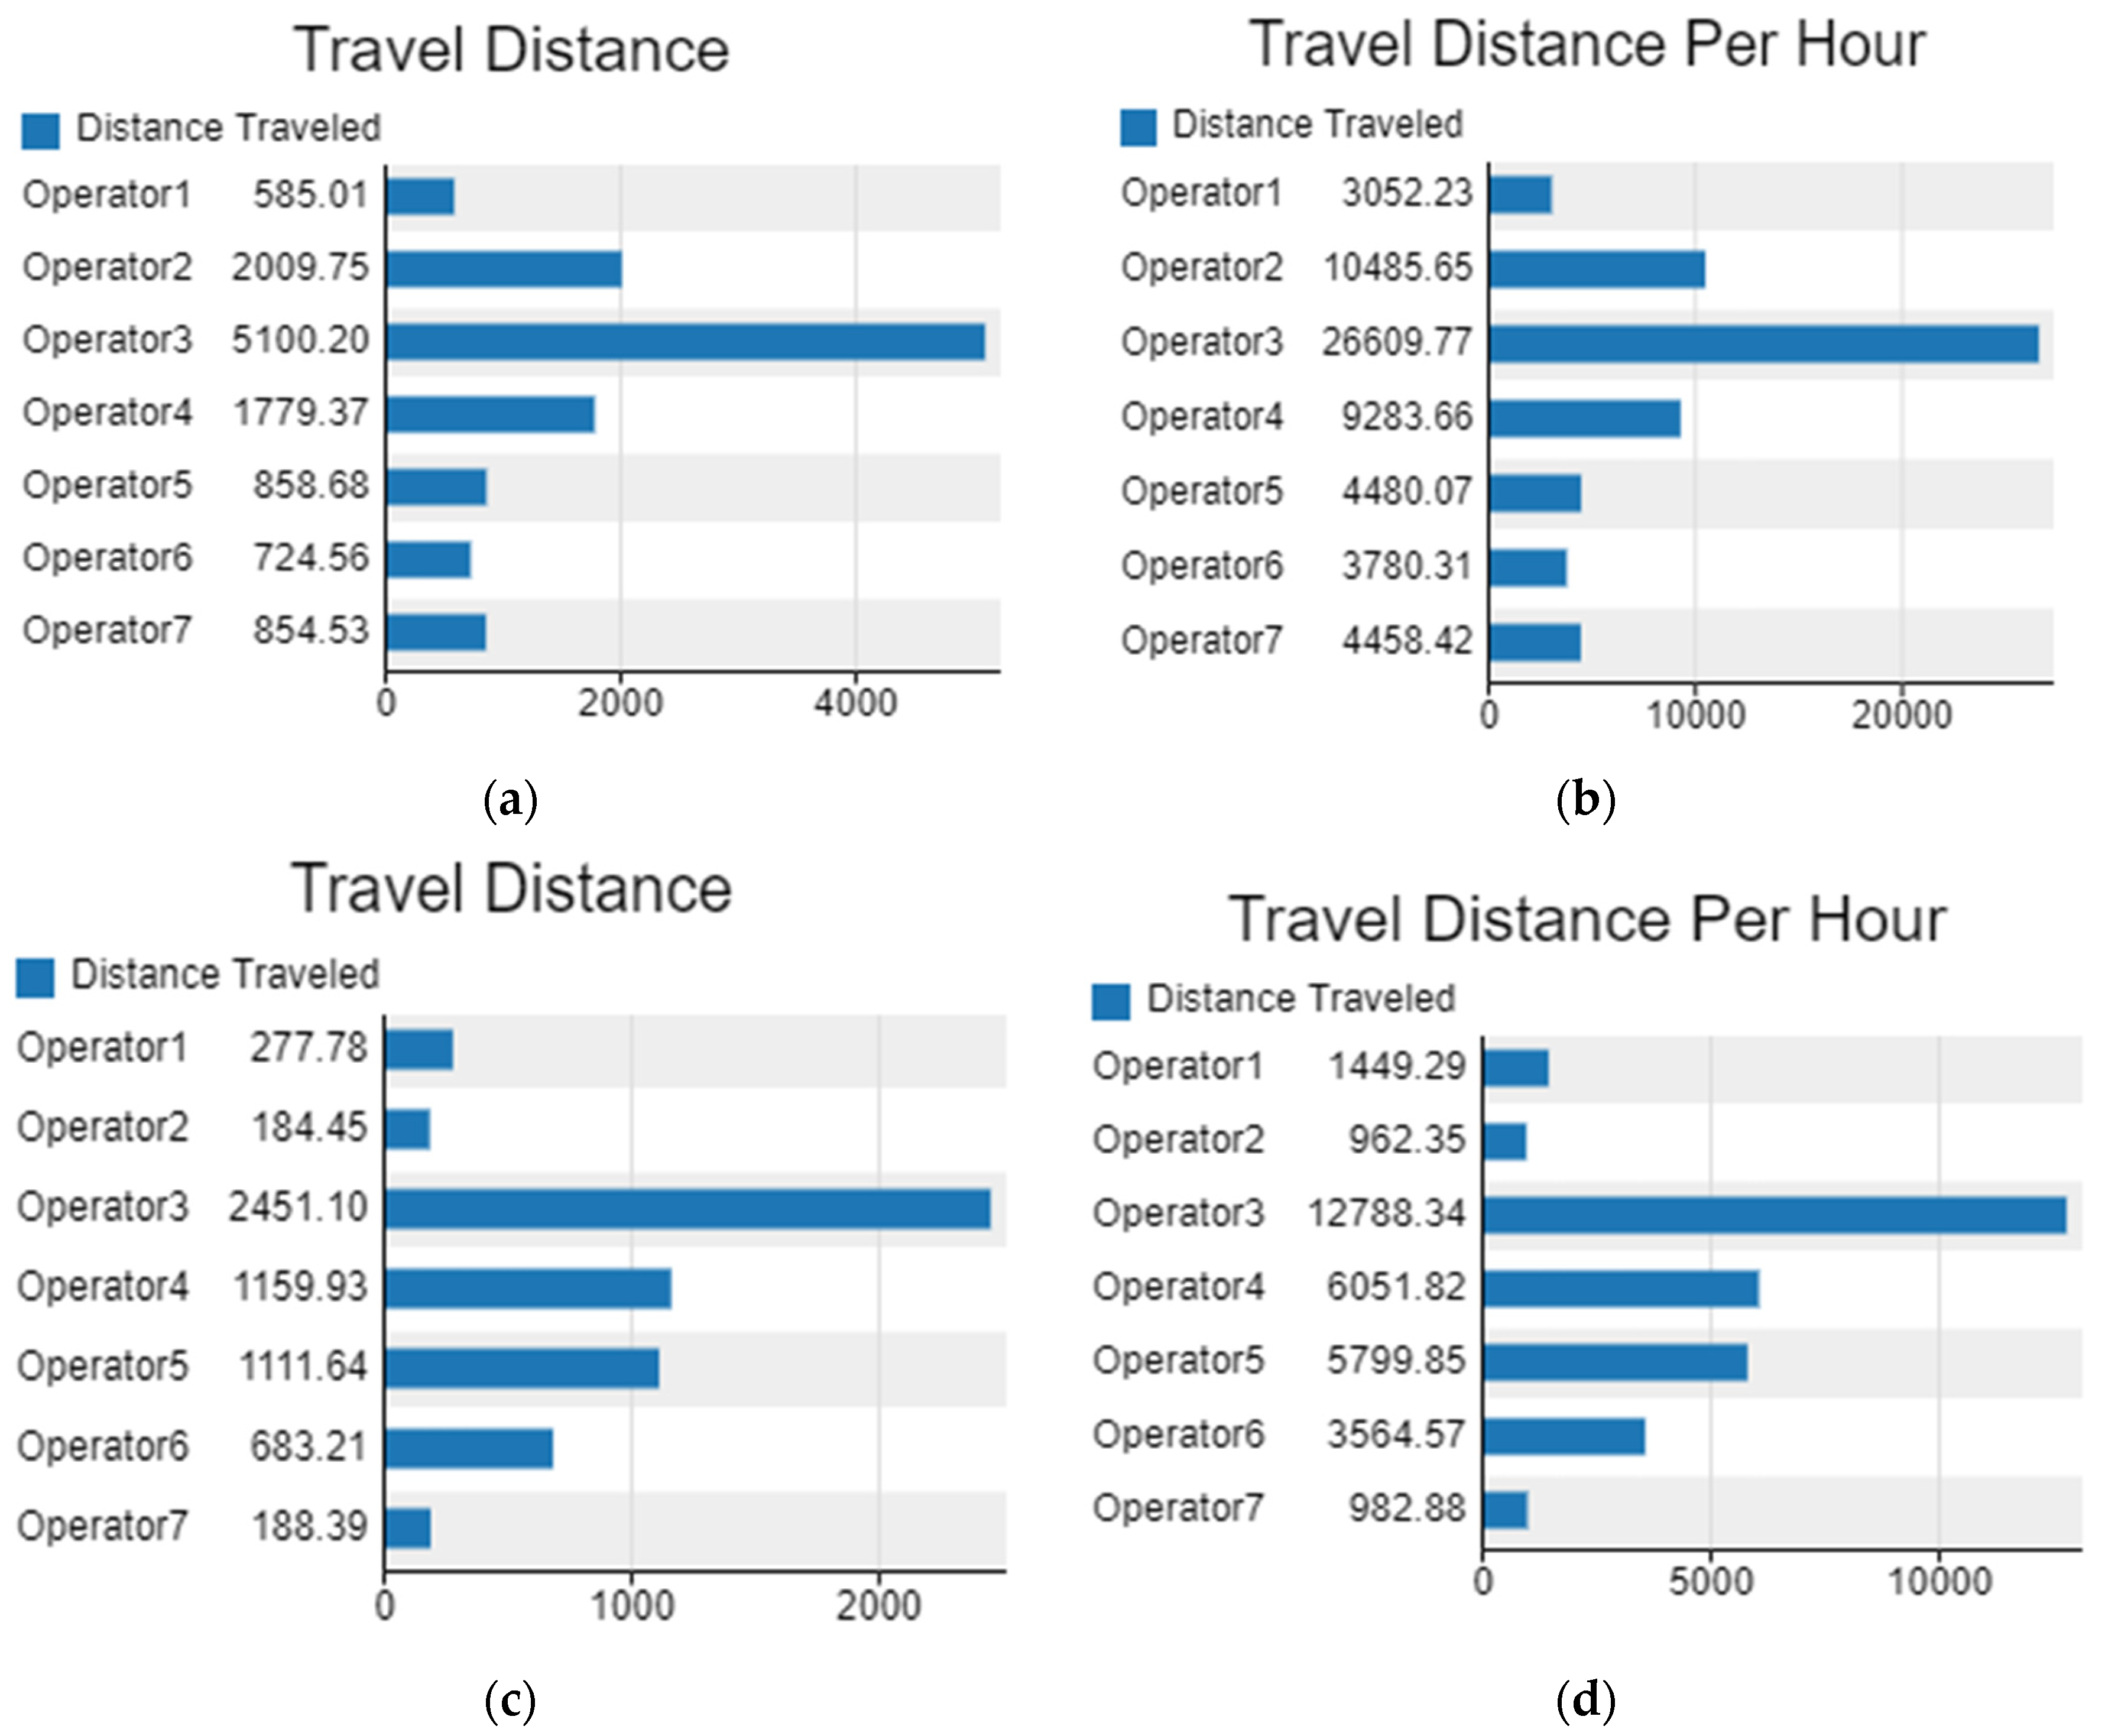
Figure 12a,b, shows the evaluation of the workers’ route in the actual layout of the company, as well as the distance travelled in metres per hour worked for each worker. On the other hand,
Figure 12c,d shows the same route, but in relation to the proposed layout.
The analysis of distances travelled by the operators in
Figure 12a,c shows significant improvements in the proposed design compared to the actual design. In the case of operator 3, who had to travel the longest distance from one machine to another, it can be seen that he decreased his travel distance from 5100.20 to 2451.10, reflecting an improvement in the layout of the system. This reduction represents a 51.94% decrease in the distance travelled by operator 3. In addition, the proposed design achieves a more balanced distribution of loads. While in the actual design the distances varied drastically between operators, in the proposed design the distances are more uniform, which improves productivity and reduces physical wear and tear. Generally speaking, comparing the distance per hour of the operators in the process stages of the real design and the proposed design, from operator 1 to 7 there is a sum of 62,150.11 in the real design and 31,599.10 in the proposed design, obtaining a difference of 30,551.01 distance/hour of the operators. This means that there was an improvement of 49.16% from one design to the other.
These results are consistent with the findings of another recent study. Work by [
25] showed that the implementation of systematic layout planning (SLP) and simulation for the industrial production of lettuce in greenhouses achieved an efficiency improvement of 67.31% compared to an initial design. In addition, the optimal design not only improved the utilization of greenhouse space, but also reduced the labour intensity of the workers. On the other hand, Ref. [
26] found that the application of the SLP method and simulation with Petri net and FlexSim significantly improved equipment utilisation and solved problems of blockage and imbalance in production in the framework of logistical planning of wind energy bearing production plans.
According to the authors of [
27], they demonstrated that the selection of layout designs based on movement efficiency, effective space utilization and no overlapping flow directions can significantly improve efficiency and reduce space wastage. In this study, the third design alternative was selected with a score of 30.40% due to its high movement efficiency, no overlapping transfer points, optimal space allocation and minimal space loss.
All in all, this analysis highlights the importance of implementing planning and simulation methods in the design of production systems. Improved efficiency, space utilization and reduced labour intensity are key aspects that have been demonstrated in various research studies. These findings underline the relevance of adopting systematic and data-driven approaches to optimise processes and improve productivity in different industrial contexts.
4. Conclusions
The implementation of the systematic layout planning (SLP) methodology and the discrete simulation allowed us to evaluate a significant improvement in the operational efficiency of the glass plant studied. The final redesign proposal showed a reduction of 52% in the distances travelled by workers in the simulation model, optimising the flow of materials and balancing the workload among operators. This demonstrates the potential effectiveness of integrating planning and simulation methodologies to improve productivity in manufacturing environments.
Through the analysis and reconfiguration of the plant layout, a more efficient distribution of work areas was achieved, minimising downtime and improving equipment layout, as follows:
The final design, with 90% efficiency in terms of relative adjacency, reduced congestion in the production area and improved the flow of personnel and semi-finished products, which has a positive impact on space management and operational fluidity.
The integration of advanced tools such as Stat-Fit, RStudio, ProModel and FlexSim allowed for rigorous statistical analysis and scenario simulation, optimising and validating the redesign proposal with high accuracy.
The evaluation of the models through hypothesis testing and efficiency analysis confirmed the effectiveness of these methodologies for strategic decision-making in industrial plant layout, driving digital transformation in glass manufacturing.
Although the SLP methodology and FlexSim simulation are well-known tools, their integration into the redesign of a glass company’s plant represents an innovation in optimising material flows and improving operational efficiency. This holistic approach not only validates the effectiveness of these methodologies in a real-world environment, but also provides a replicable model for other manufacturing industries.
It is acknowledged that the study does not introduce new theoretical knowledge in the field of plant layout or discrete event simulation. The research focuses on the practical application of existing methodologies, which limits its theoretical contribution. The results obtained are highly conditioned by the specific data of the company studied, which may limit the generalisability of the findings to other industries or different contexts. Despite not introducing methodological or theoretical innovations, the contribution of the study lies in the effective application of known tools to improve operational efficiency in the glass industry. The integration of SLP and FlexSim provides a practical and replicable model that can be adapted and validated in other industrial contexts, offering a solid basis for future research and applications.


 ,
, 


