Article

Research on the Mechanical Behavior and Rockburst Risk of the Deep-Buried Roadway at the Stratigraphical Boundary of Different Lithologies

1
Department of Resources and Safety Engineering, University of Science and Technology Beijing, Beijing 100083, China
2
Key Laboratory of Ministry of Education for Efficient Mining and Safety of Metal Mines, USTB, Beijing 100083, China
3
Aluminum Corporation of China Limited, Beijing 100082, China
4
Faculty of Land Resources Engineering, Kunming University of Science and Technology, Kunming 650093, China
5
Key Laboratory of Geohazard Forecast and Geoecological Restoration in Plateau Mountainous Area, Ministry of Natural Resources of the People’s Republic of China, Kunming 650093, China
6
Information Institution of Ministry of Emergency Management, Beijing 100029, China
*
Author to whom correspondence should be addressed.
Appl. Sci. 2025, 15(13), 7026; https://doi.org/10.3390/app15137026
Submission received: 12 May 2025 / Revised: 7 June 2025 / Accepted: 12 June 2025 / Published: 22 June 2025

Abstract

It has been found in engineering practice that the degree of rockburst risk increases when roadway excavation occurs near the stratigraphical boundary of different lithologies. This study uses the 1276 m deep-buried roadway of a lead–zinc mine in Yunnan, China, as its engineering background. Based on a numerical analysis of this case, it investigates the mechanical behavior of surrounding rocks in different lithological formations and explores the causes of excavation-induced rockburst. Additionally, by changing the excavation strategy in a numerical simulation, the influence of the direction of roadway excavation on the degree of rockburst risk in the construction of different lithological formations is assessed. The results are summarized as follows: (1) When the tunnel passes from the C1b stratum (limestone) to the D3zg stratum (dolomite), an abnormal stress zone forms in the roof rock strata of the D3zg stratum (the lower plate of the stratum boundary). The rockburst risk level was evaluated by introducing the numerical rockburst index in this abnormal stress zone, which aligns closely with on-site rockburst investigation results. The rockburst risk is the greatest in the abnormal stress zone, which provides an external energy storage environment for the development of rockburst disasters. (2) Near the stratum boundary, the rockburst risk level when excavating from the D3zg stratum to the C1b stratum is greater than that when excavating from the C1b stratum to the D3zg stratum. The direction of tunnel excavation significantly affects the rockburst risk level during construction that crosses different lithological strata. These findings can provide a theoretical basis for the construction design of similar underground projects.

1. Introduction

Rockburst is a dynamic geological hazard in which elastic strain energy accumulated in rock mass is suddenly and violently released due to an external disturbance, resulting in the bursting and ejection of the surrounding rock [1,2]. With the rapid development of the domestic economy in China, various rock mass engineering projects, such as hydroelectric power stations, transportation tunnels, metal and non-metal mines, and underground repositories for nuclear waste disposal, are developing to great depths at an unprecedented speed [3]. More than 40 percent of underground mines built since the 1950s have transitioned or are gradually transitioning to deep mining, with about 30 mines across the country involved in underground construction projects being deeper than 1000 m, and approximately 10 of these mines were constructed at depths exceeding 1300 m, making ultra-deep mining increasingly common [4]. However, as the depth of the mine increases, the in situ stress rises dramatically, and the challenges of controlling the stability of the surrounding rock in affected roadways, chambers, and mining areas become increasingly apparent. High stress levels intensify ground pressure activity and, thus, increase the likelihood of rockburst disasters occurring, posing substantial challenges to the safety of deep mining. More than 20 underground metal mines in China have experienced or are currently experiencing rockburst disasters, and the number of mines affected by rockburst in the past 30 years has shown an upward trend [5]. Therefore, given the practical requirements of ultra-deep mining, the risk assessment of the rockburst hazard has become both necessary and urgent.
With the rapid development of computational technology and a greater understanding of the rockburst mechanism, many scholars and engineers have employed numerical simulation methods to assess rockburst risk [6,7,8,9]. The central concept of this method is to establish a quantitative relationship between rockburst risk parameters (e.g., rockburst location, rockburst severity, etc.) and numerical indexes; by analyzing the spatial distribution range of these numerical indexes, the location of a potential rockburst and the extent of anticipated damage can be effectively determined [10]. Kusui et al. [11] combined model experiments and numerical simulation techniques to study the mechanical response characteristics of rock surrounding tunnels during the fracture process, and they found that the ratio of compressive strength to induced stress (the maximum tangential stress around the surrounding rock) varies during the progressive destabilization of the rock surrounding the tunnel. The critical value for this ratio (a function related to the uniaxial compressive strength) was proposed to identify the cause of the instability and failure, based on which the surrounding rock failure process could be predicted. Zhang et al. [12] first proposed the Failure Approach Index (FAI), a model which they used to evaluate the stability of the underground powerhouse, water inlet, and diversion tunnel of Jinping II Hydropower Station. The FAI was later used to simulate the evolution of the “11–28” structure-type rockburst at Jinping II Hydropower Station [13]. To study the rockburst risk and dynamic response characteristics of the surrounding rock under dynamic loading, Wang et al. proposed a damage risk index based on the Mohr–Coulomb criterion, which enables the prediction of potential rockburst locations and their intensity [14]. Guo et al. [15] used ANSYS software (16.0) combined with rockburst index criteria to predict the possible locations and intensity of potential rockbursts in the rock surrounding a deep-buried tunnel in a folded tectonic zone rock mass. Yang et al. [16] evaluated the rockburst risk of horizontally lined and vertically lined models of strongly and weakly interbedded rock mass in a comparison based on the finite element method combined with the Turchaninov criterion. Cai et al. [17,18] used FLAC3D software(2018) to calculate the accumulated energy of the disturbed surrounding rock and used seismology theory to predict the degree of rockburst risk at each mining level. Sepehri et al. [19,20] constructed a real three-dimensional geo-mechanical model of a diamond mine in Canada, and they used the tangential stress criterion and the Burst Potential Index (BPI) based on the energy principle to evaluate the degree of rockburst risk in the stope and the roadway and identify potential rockburst risk areas. Based on theoretical analysis and numerical simulation, Ma et al. [21] studied the distribution characteristics of high-stress-concentration zones and elastic strain energy of surrounding rock around sharply inclined thin vein mining, and they analyzed the rockburst risks of stope with different mining sequences. Wang et al. [22] predicted the rockburst of the surrounding rock in the roadway of the Linglong Gold Mine based on strain energy analysis using three-dimensional numerical simulation. Weng et al. [23] introduced the strain energy density index (SED) in the numerical simulation to research the characteristics of energy accumulation and dissipation in the process of dynamic instability, and the simulation results were in better agreement with the field observation. Xu et al. [24] introduced the rock ultimate energy storage rate in conventional triaxial loading and unloading tests and proposed a new Rockburst Energy Release Rate index (RBERR) for assessing rockburst risk. Adopting a three-dimensional discrete element method and an independently developed multi-factor rockburst criterion, Zhu et al. [25] researched and analyzed the distribution of stress field, energy characteristics, damage characteristics, and the degree of rockburst risk of the surrounding rock of the tunnel under the conditions of in situ stress at different buried depths. Xue et al. [26] considered that the rockburst risk is directly proportional to the maximum energy density and inversely proportional to the distance between the location of the maximum energy density and the free face, proposing a new energy density criterion, and combined with the numerical simulation method and the independently proposed energy density criterion, the effect of the tunnel mining sequence on the rockburst risk of the pillar was examined.
As mentioned above, most research has focused on the rockburst risk assessment of a single roadway or stope with consistent lithology. However, few efforts have been made to evaluate the rockburst risk of deep-buried roadways under multi-stratigraphic tectonics. There are differences in the rockburst characteristics that occur when constructing in hard, harder, and soft rock, and the rockburst risk varies when excavating from soft rock towards hard rock or in the opposite direction. Feng et al. [3] described the situation of the rockburst that occurred in interbedded siltstone and sandstone formations in the N-J hydroelectric power station in Pakistan, and the rockburst risk from sandstone to siltstone is higher than during excavation from siltstone to sandstone. Therefore, rockburst risk assessment for deep-buried roadways traversing the vicinity of the stratigraphic boundary under multi-stratigraphic tectonics is of great engineering significance. This study is based on a developing roadway near the 14# exploration line in the middle section of 1104 of the Huize lead–zinc mine, which crosses different formations as the engineering background and establishes a three-dimensional geo-mechanical model through the actual engineering geological investigation on site.
Based on the results of the geo-stress measurement and rock mechanics laboratory tests, and combined with the relevant rockburst criteria, this study uses theoretical analysis and numerical simulation to investigate the mechanical characteristics of the surrounding rock and the degree of rockburst risk as the deep-buried roadway passes through the multi-stratigraphic tectonics from the perspective of the internal and external causes of rockburst. The rockburst risk assessment flowchart for this study is shown in Figure 1.

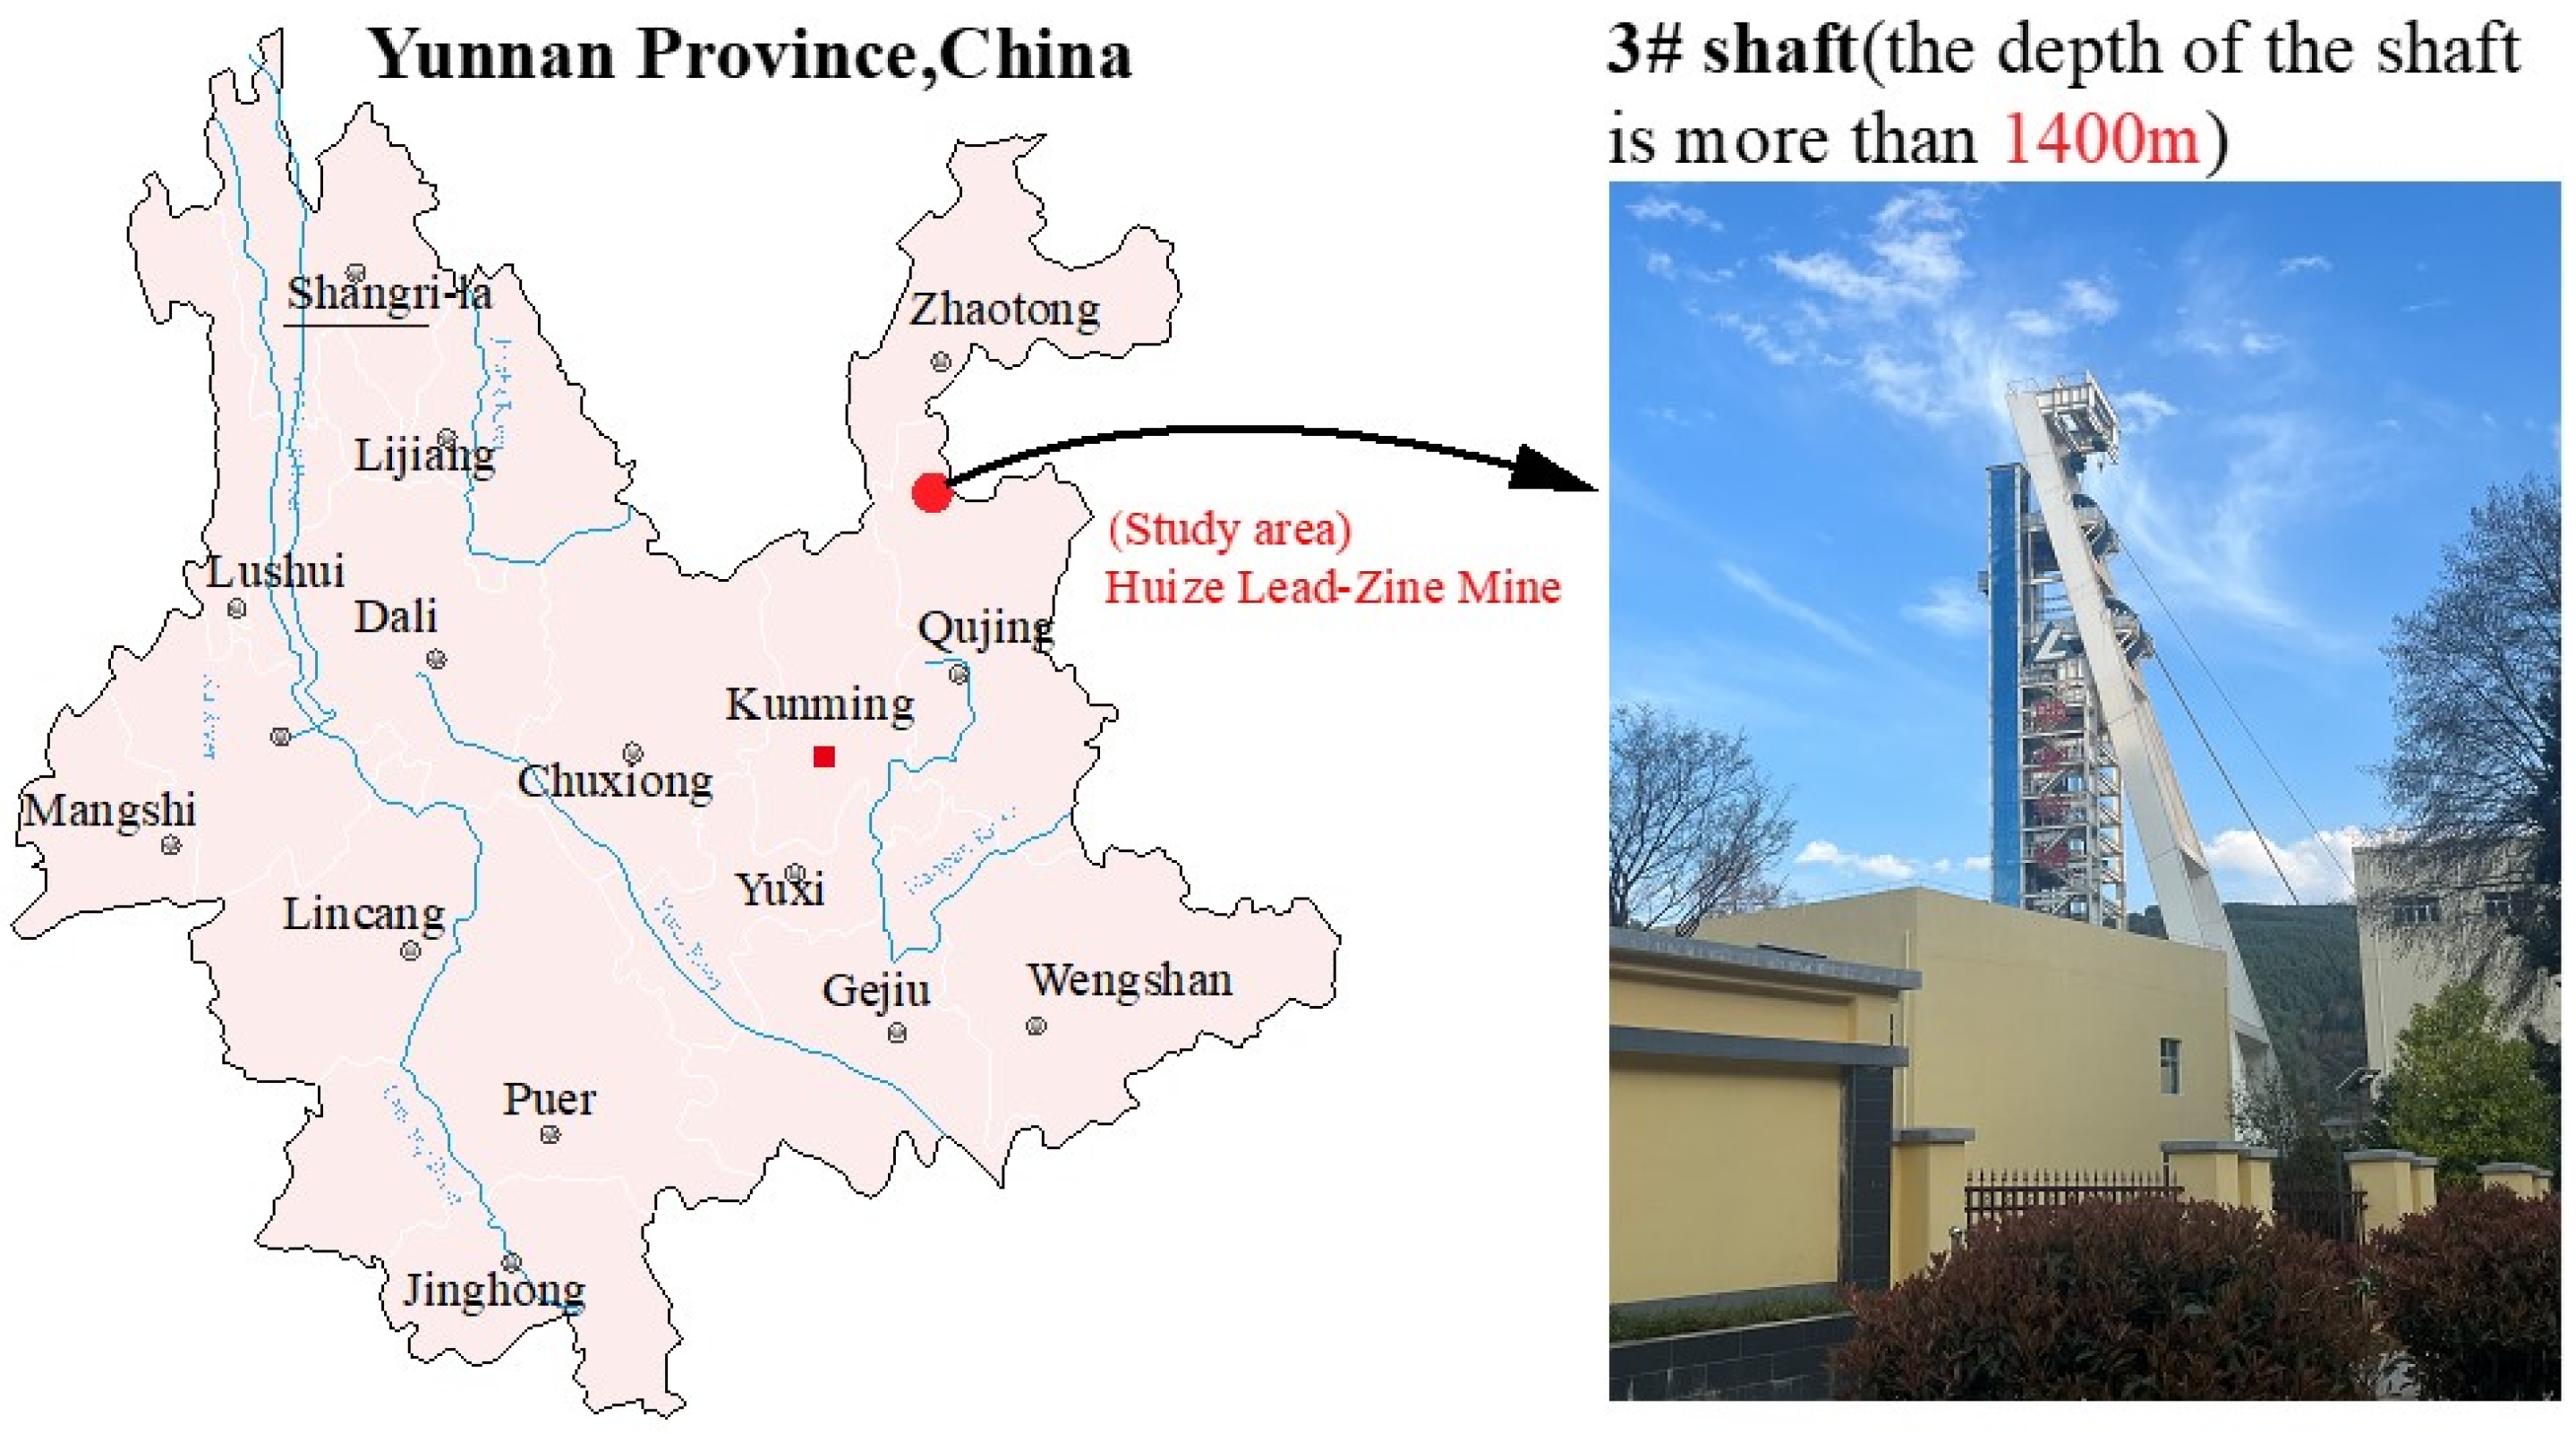
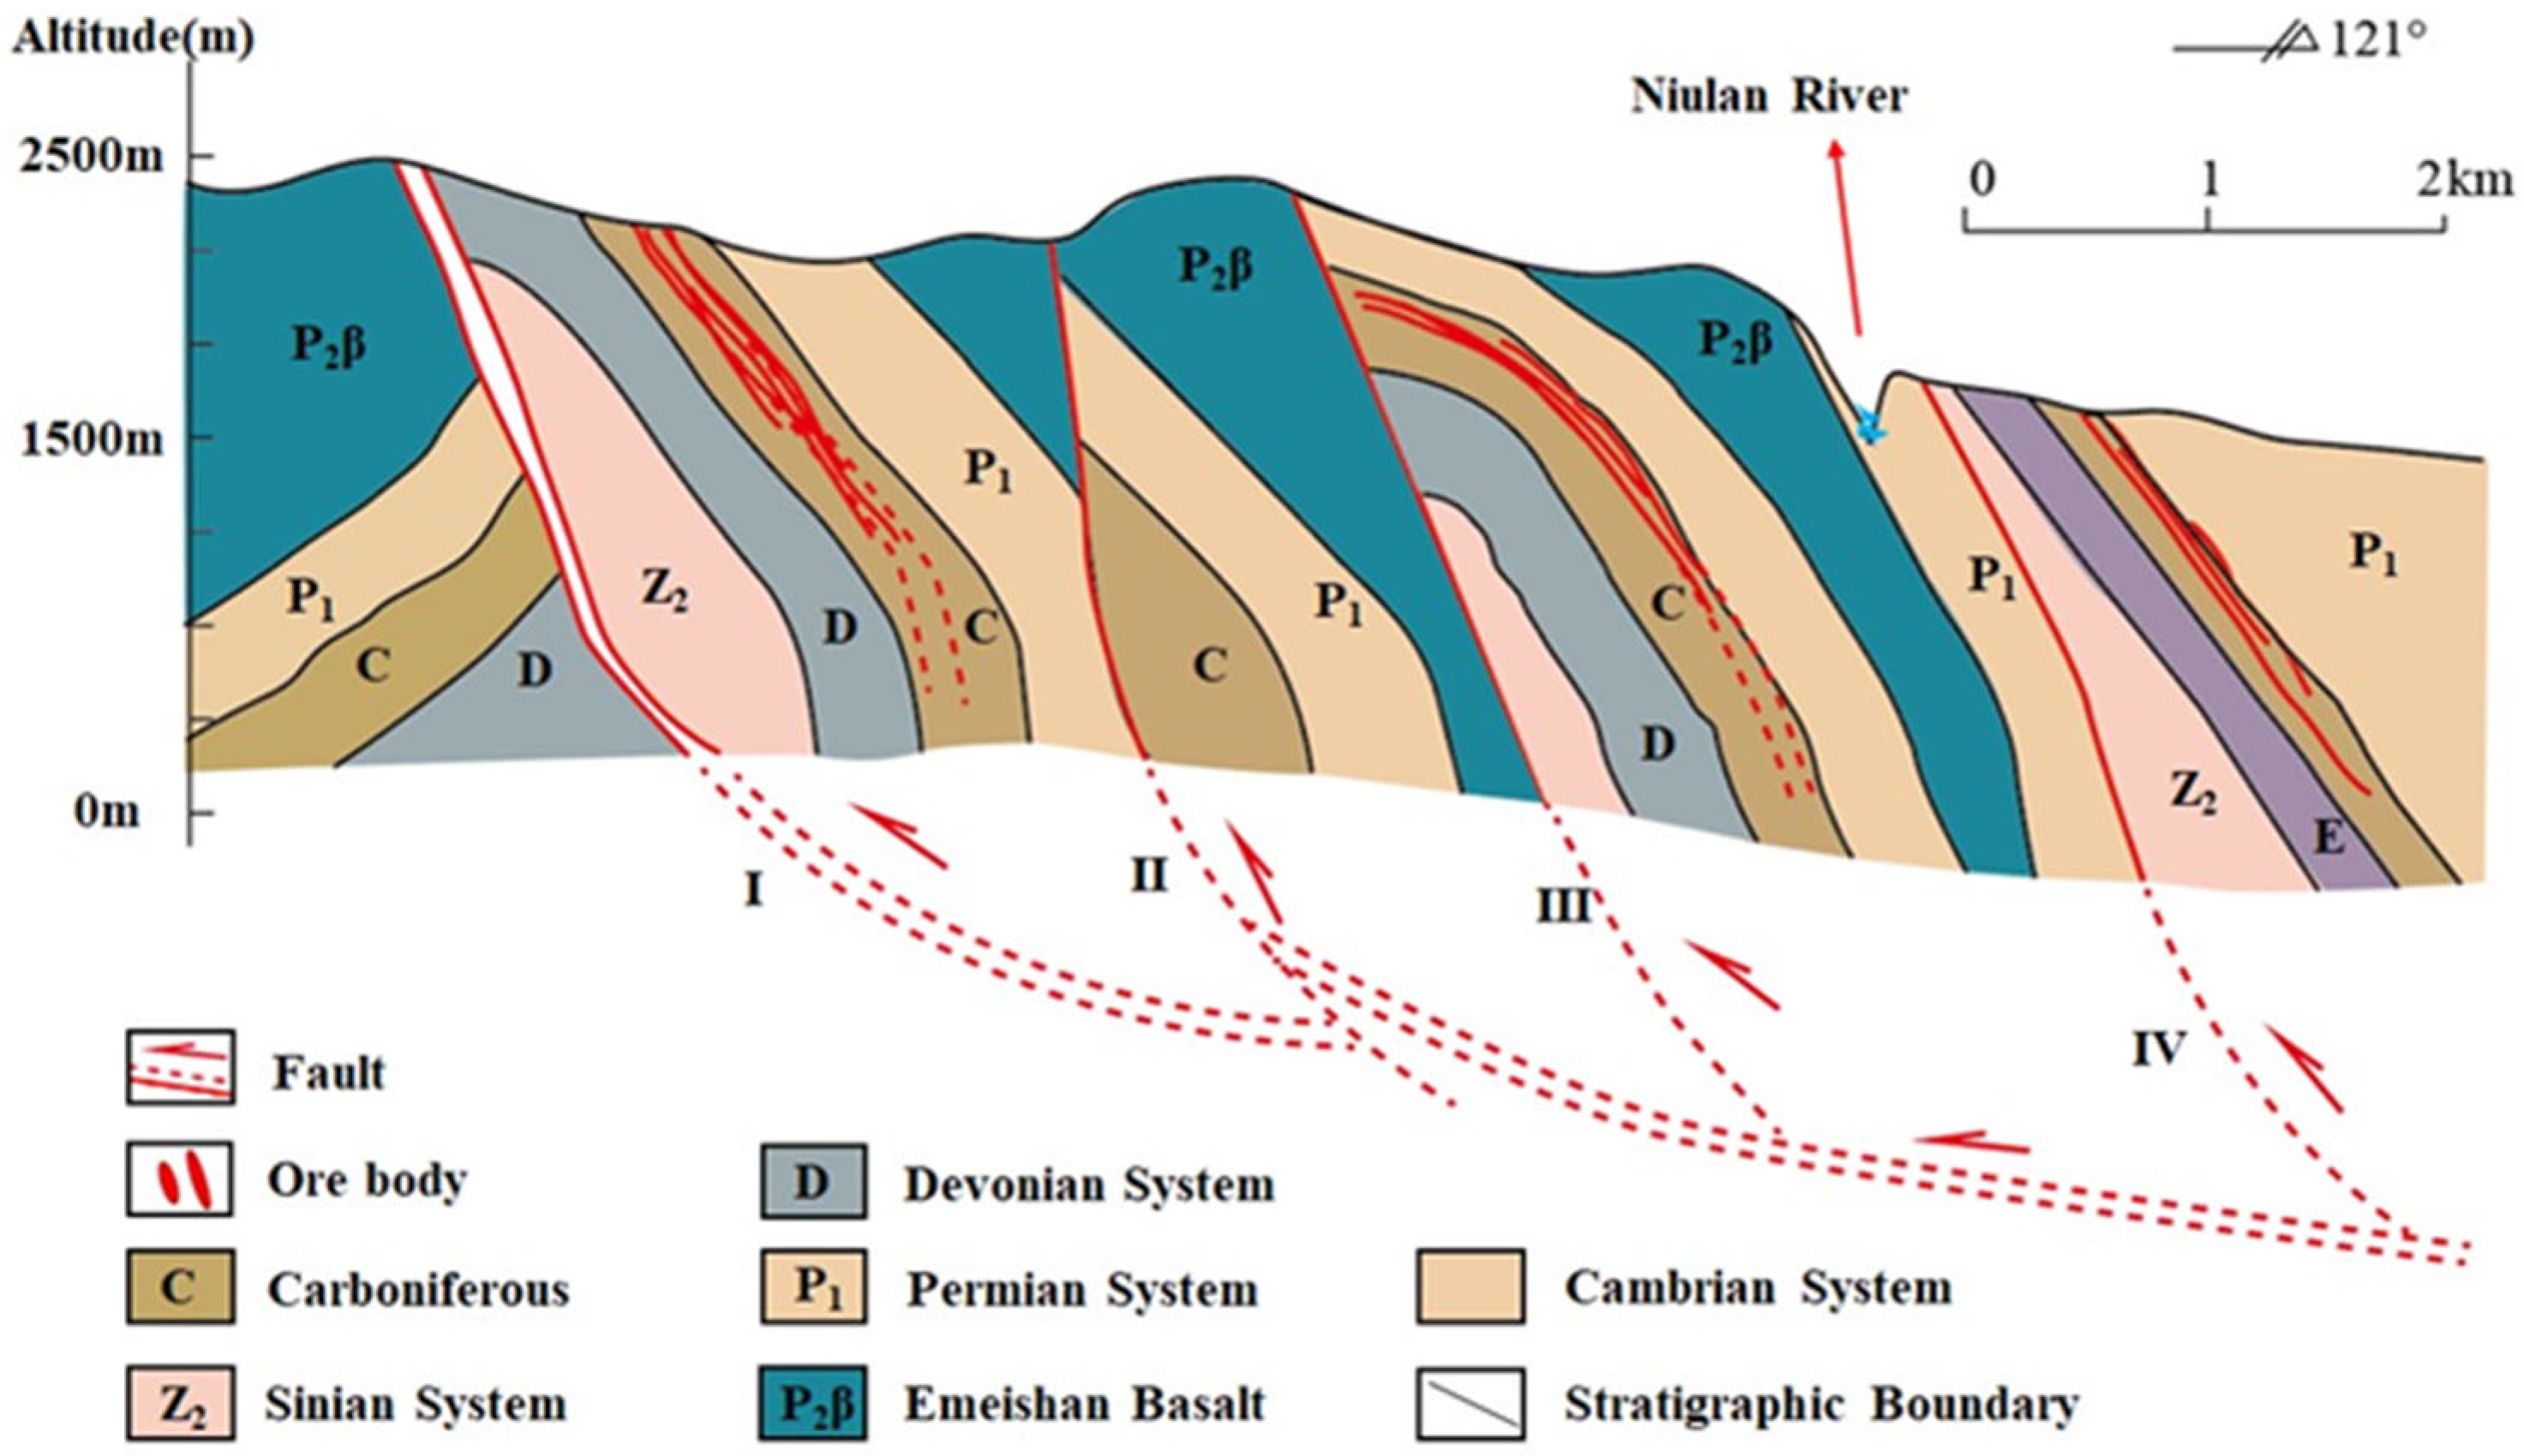
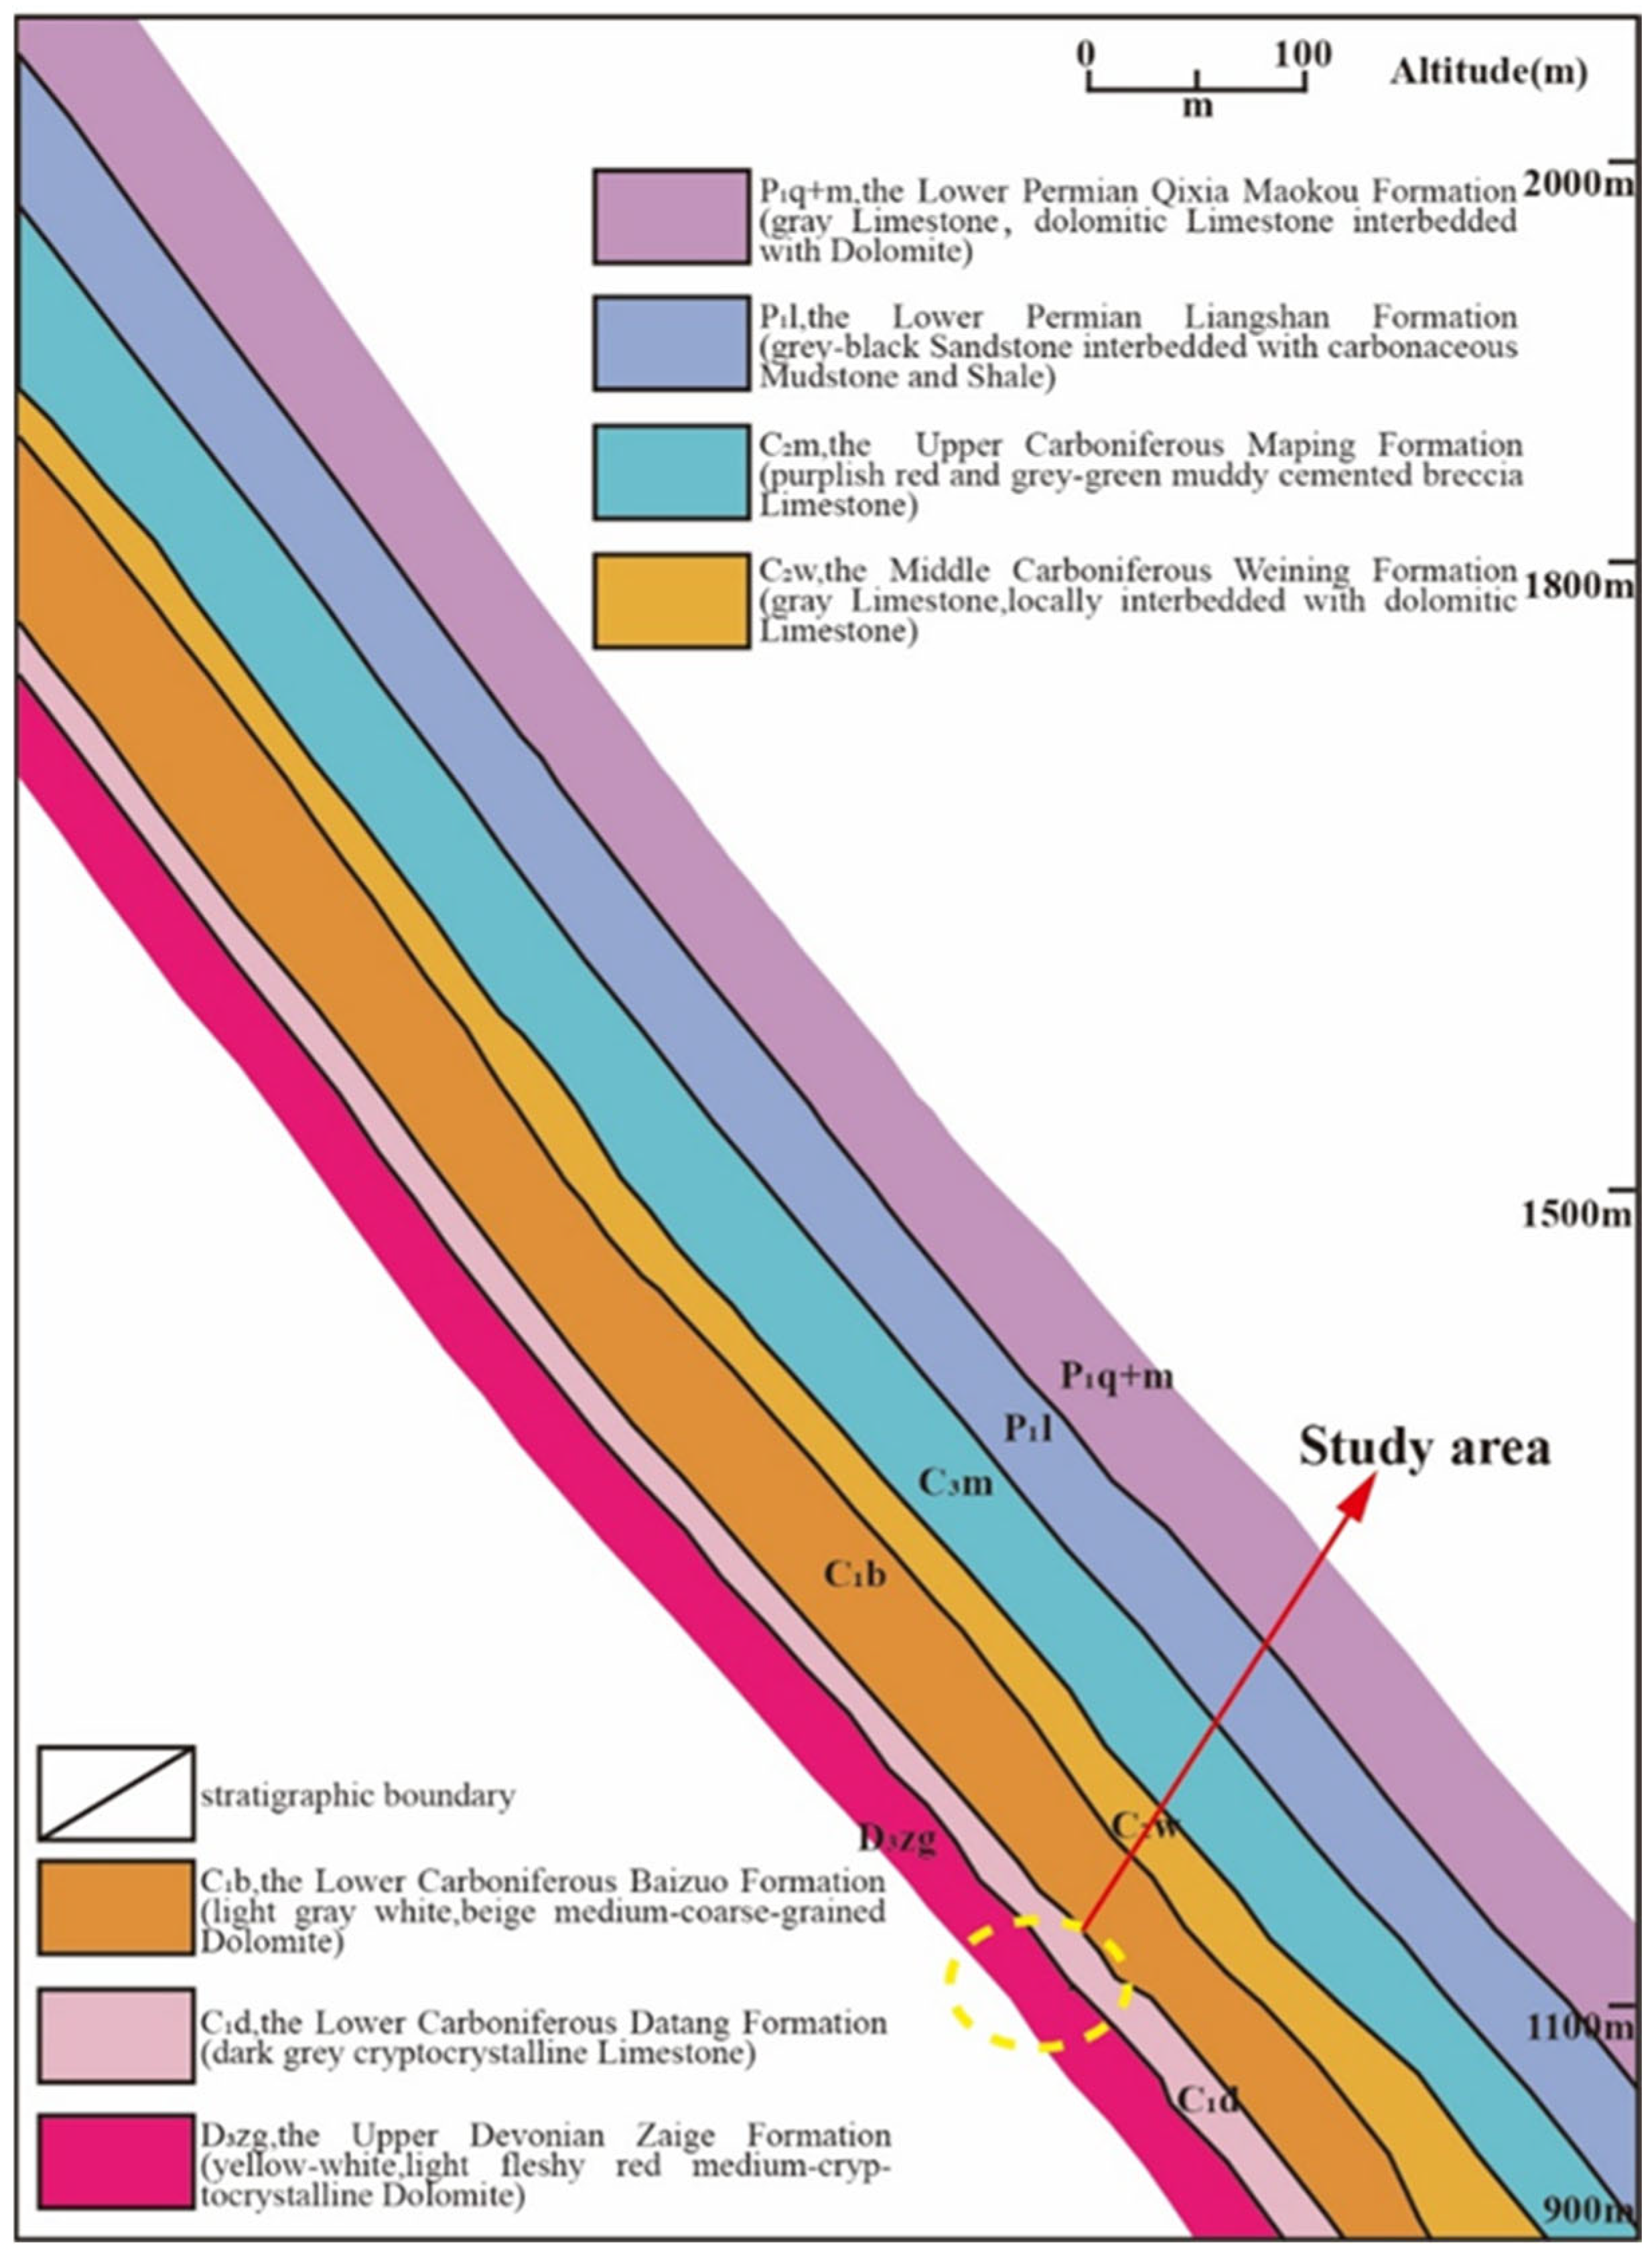
2. Engineering Overview

The Huize lead–zinc mine is located in Qujing City, Yunnan Province, China, where the depth of the 3# shaft exceeds 1400 m. The location of the mine is shown in Figure 2. The mine area is 4.5 km long from east to west and 3 km wide from north to south, covering an area of about 13.5 square kilometers. Currently, the mining depth has exceeded 1500 m and is gradually entering the 1500–2500 m deep mining stage. According to the previous geo-stress measurement report, the stress of deep surrounding rock is dominated by horizontal stress, and the maximum horizontal principal stress has reached 60.5 MPa. The increase in mining depth brings great challenges to the safety and efficiency of deep mining.
The ore body is mainly located in the upper Paleozoic Carboniferous Baizuo Formation, with tectonic development and complex geological conditions in the mining area; the geological tectonic section of the mining area is shown in Figure 3. Figure 4 shows the longitudinal geological profile of the study area, and the study area is in the stage of exploration and mining; the elevation is about 1104 m and the mining depth is about 1276 m. From the geological profile, the exploration and mining of the mine take place in the complex geological environment of multi-stratified formations.

3. Study on Rockburst Potential Assessment Based on Rock Mechanics Tests

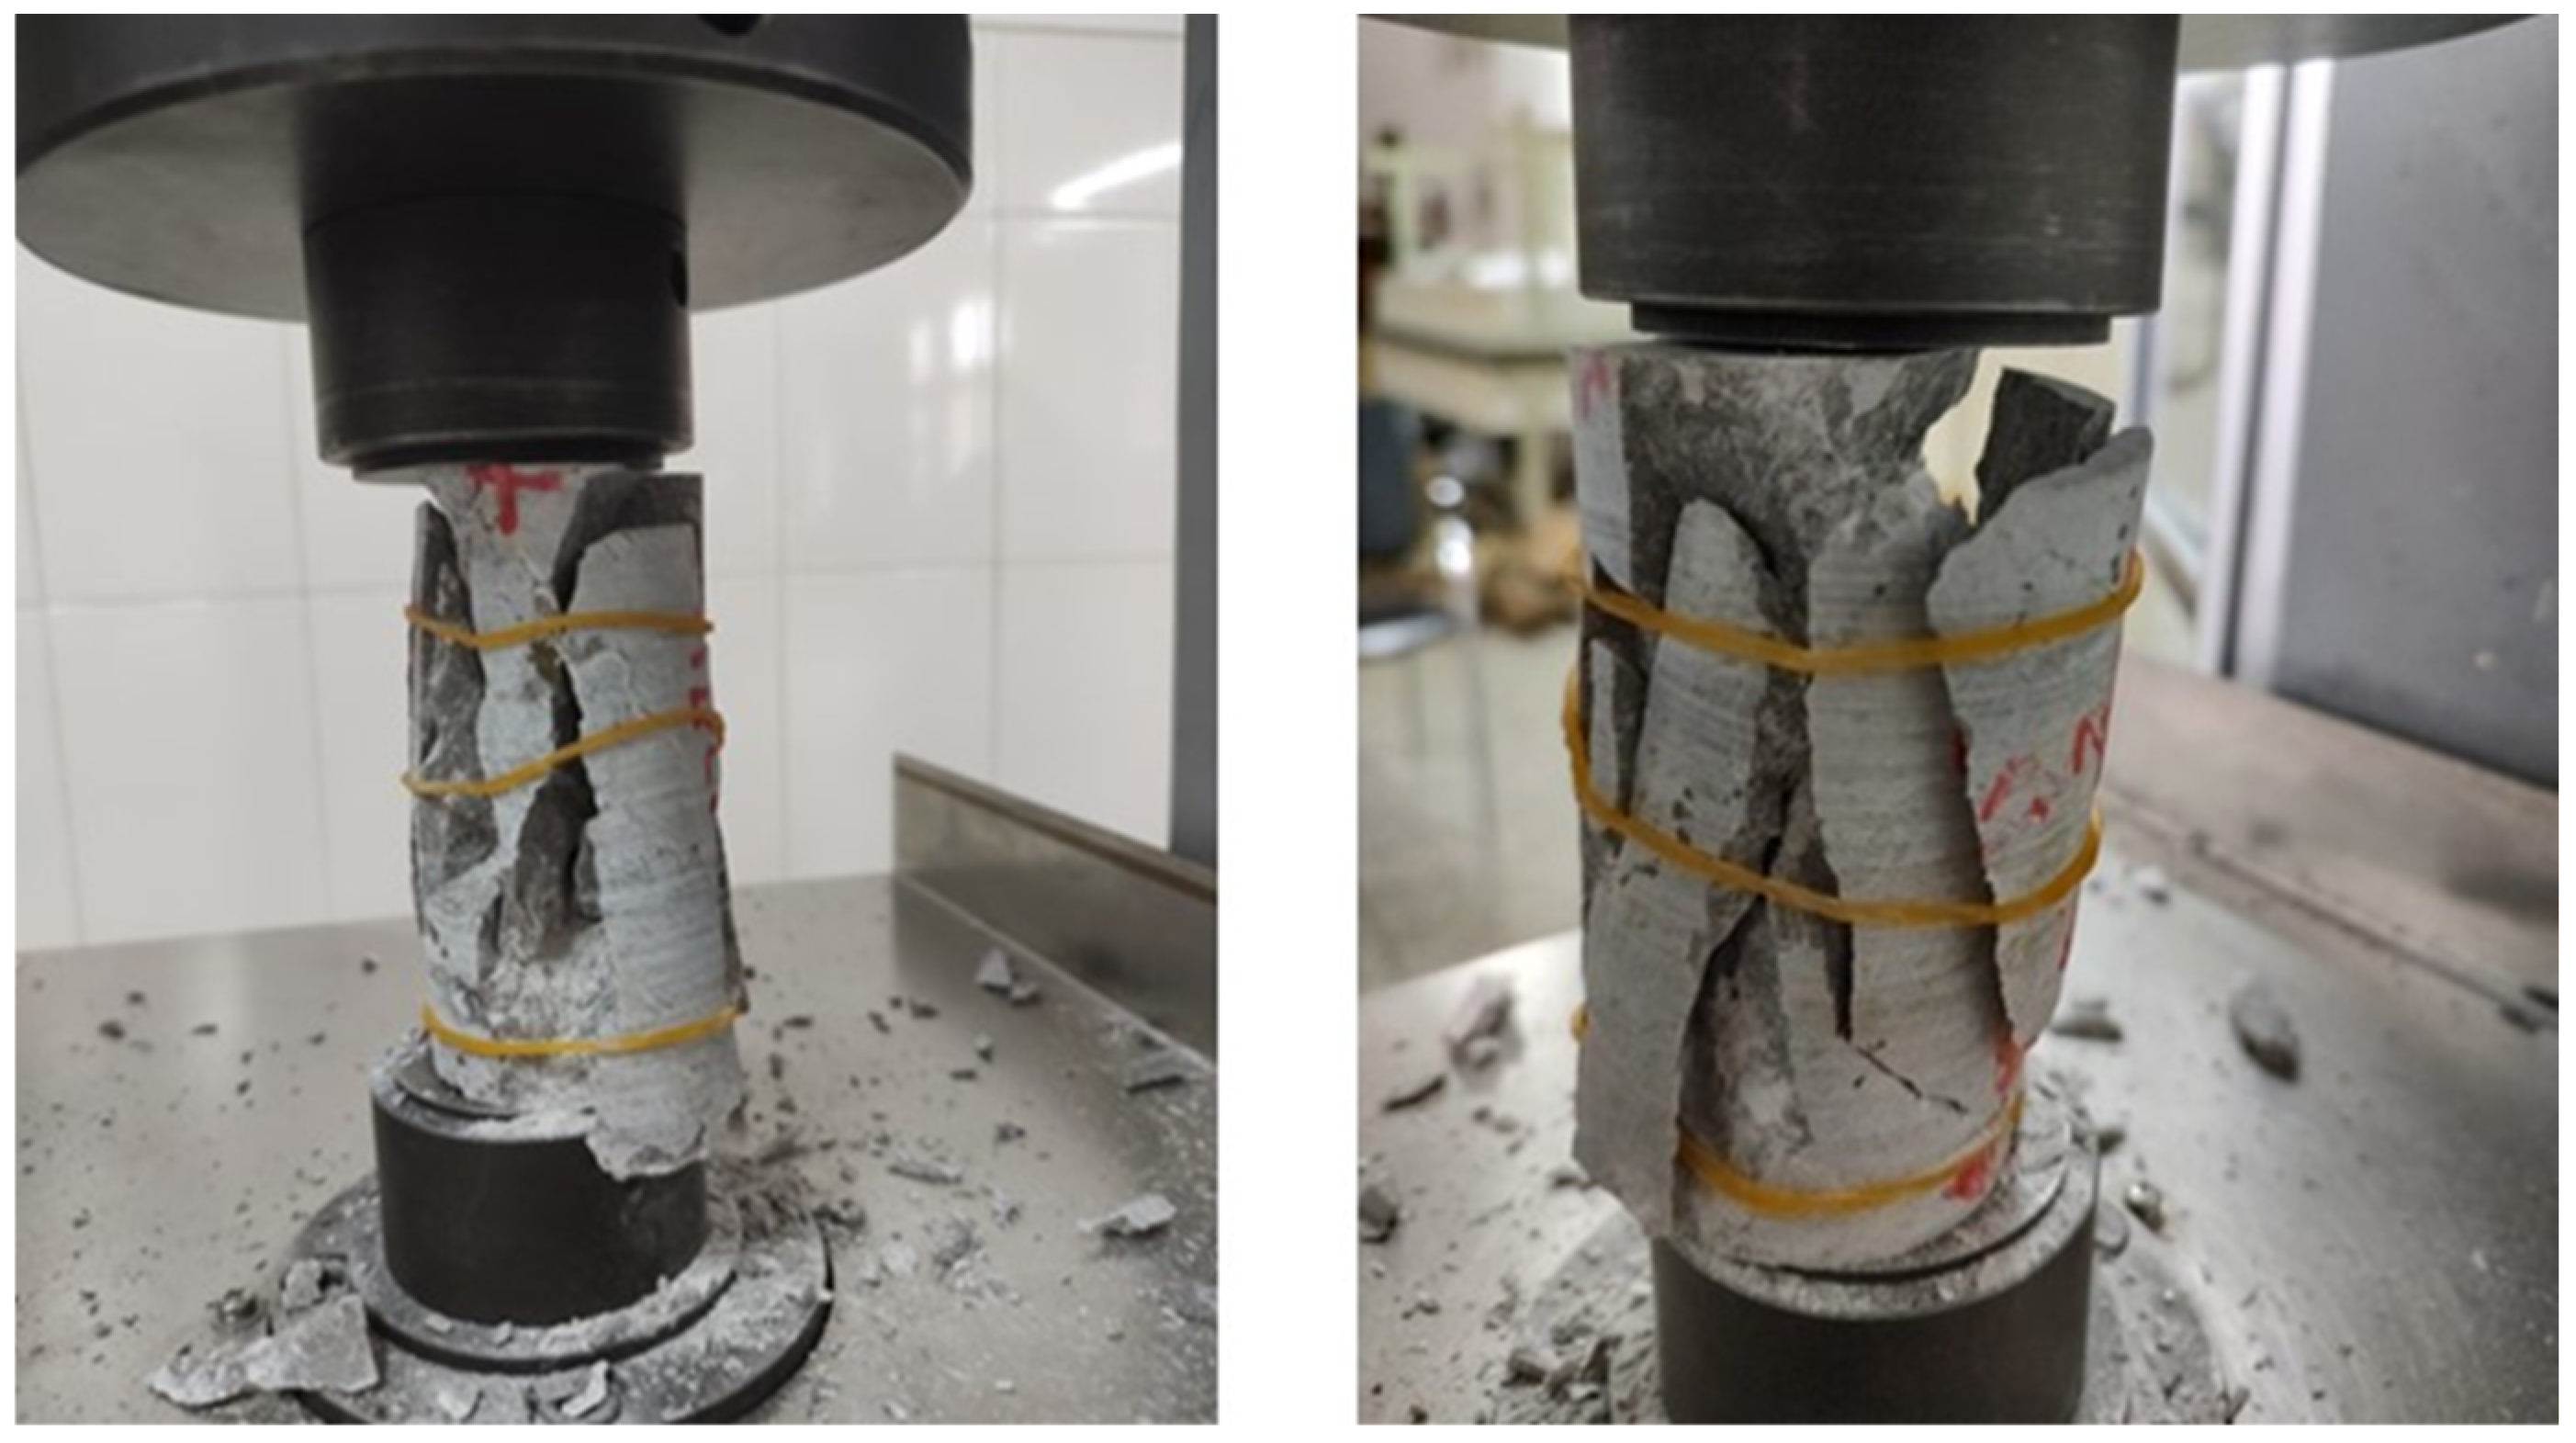
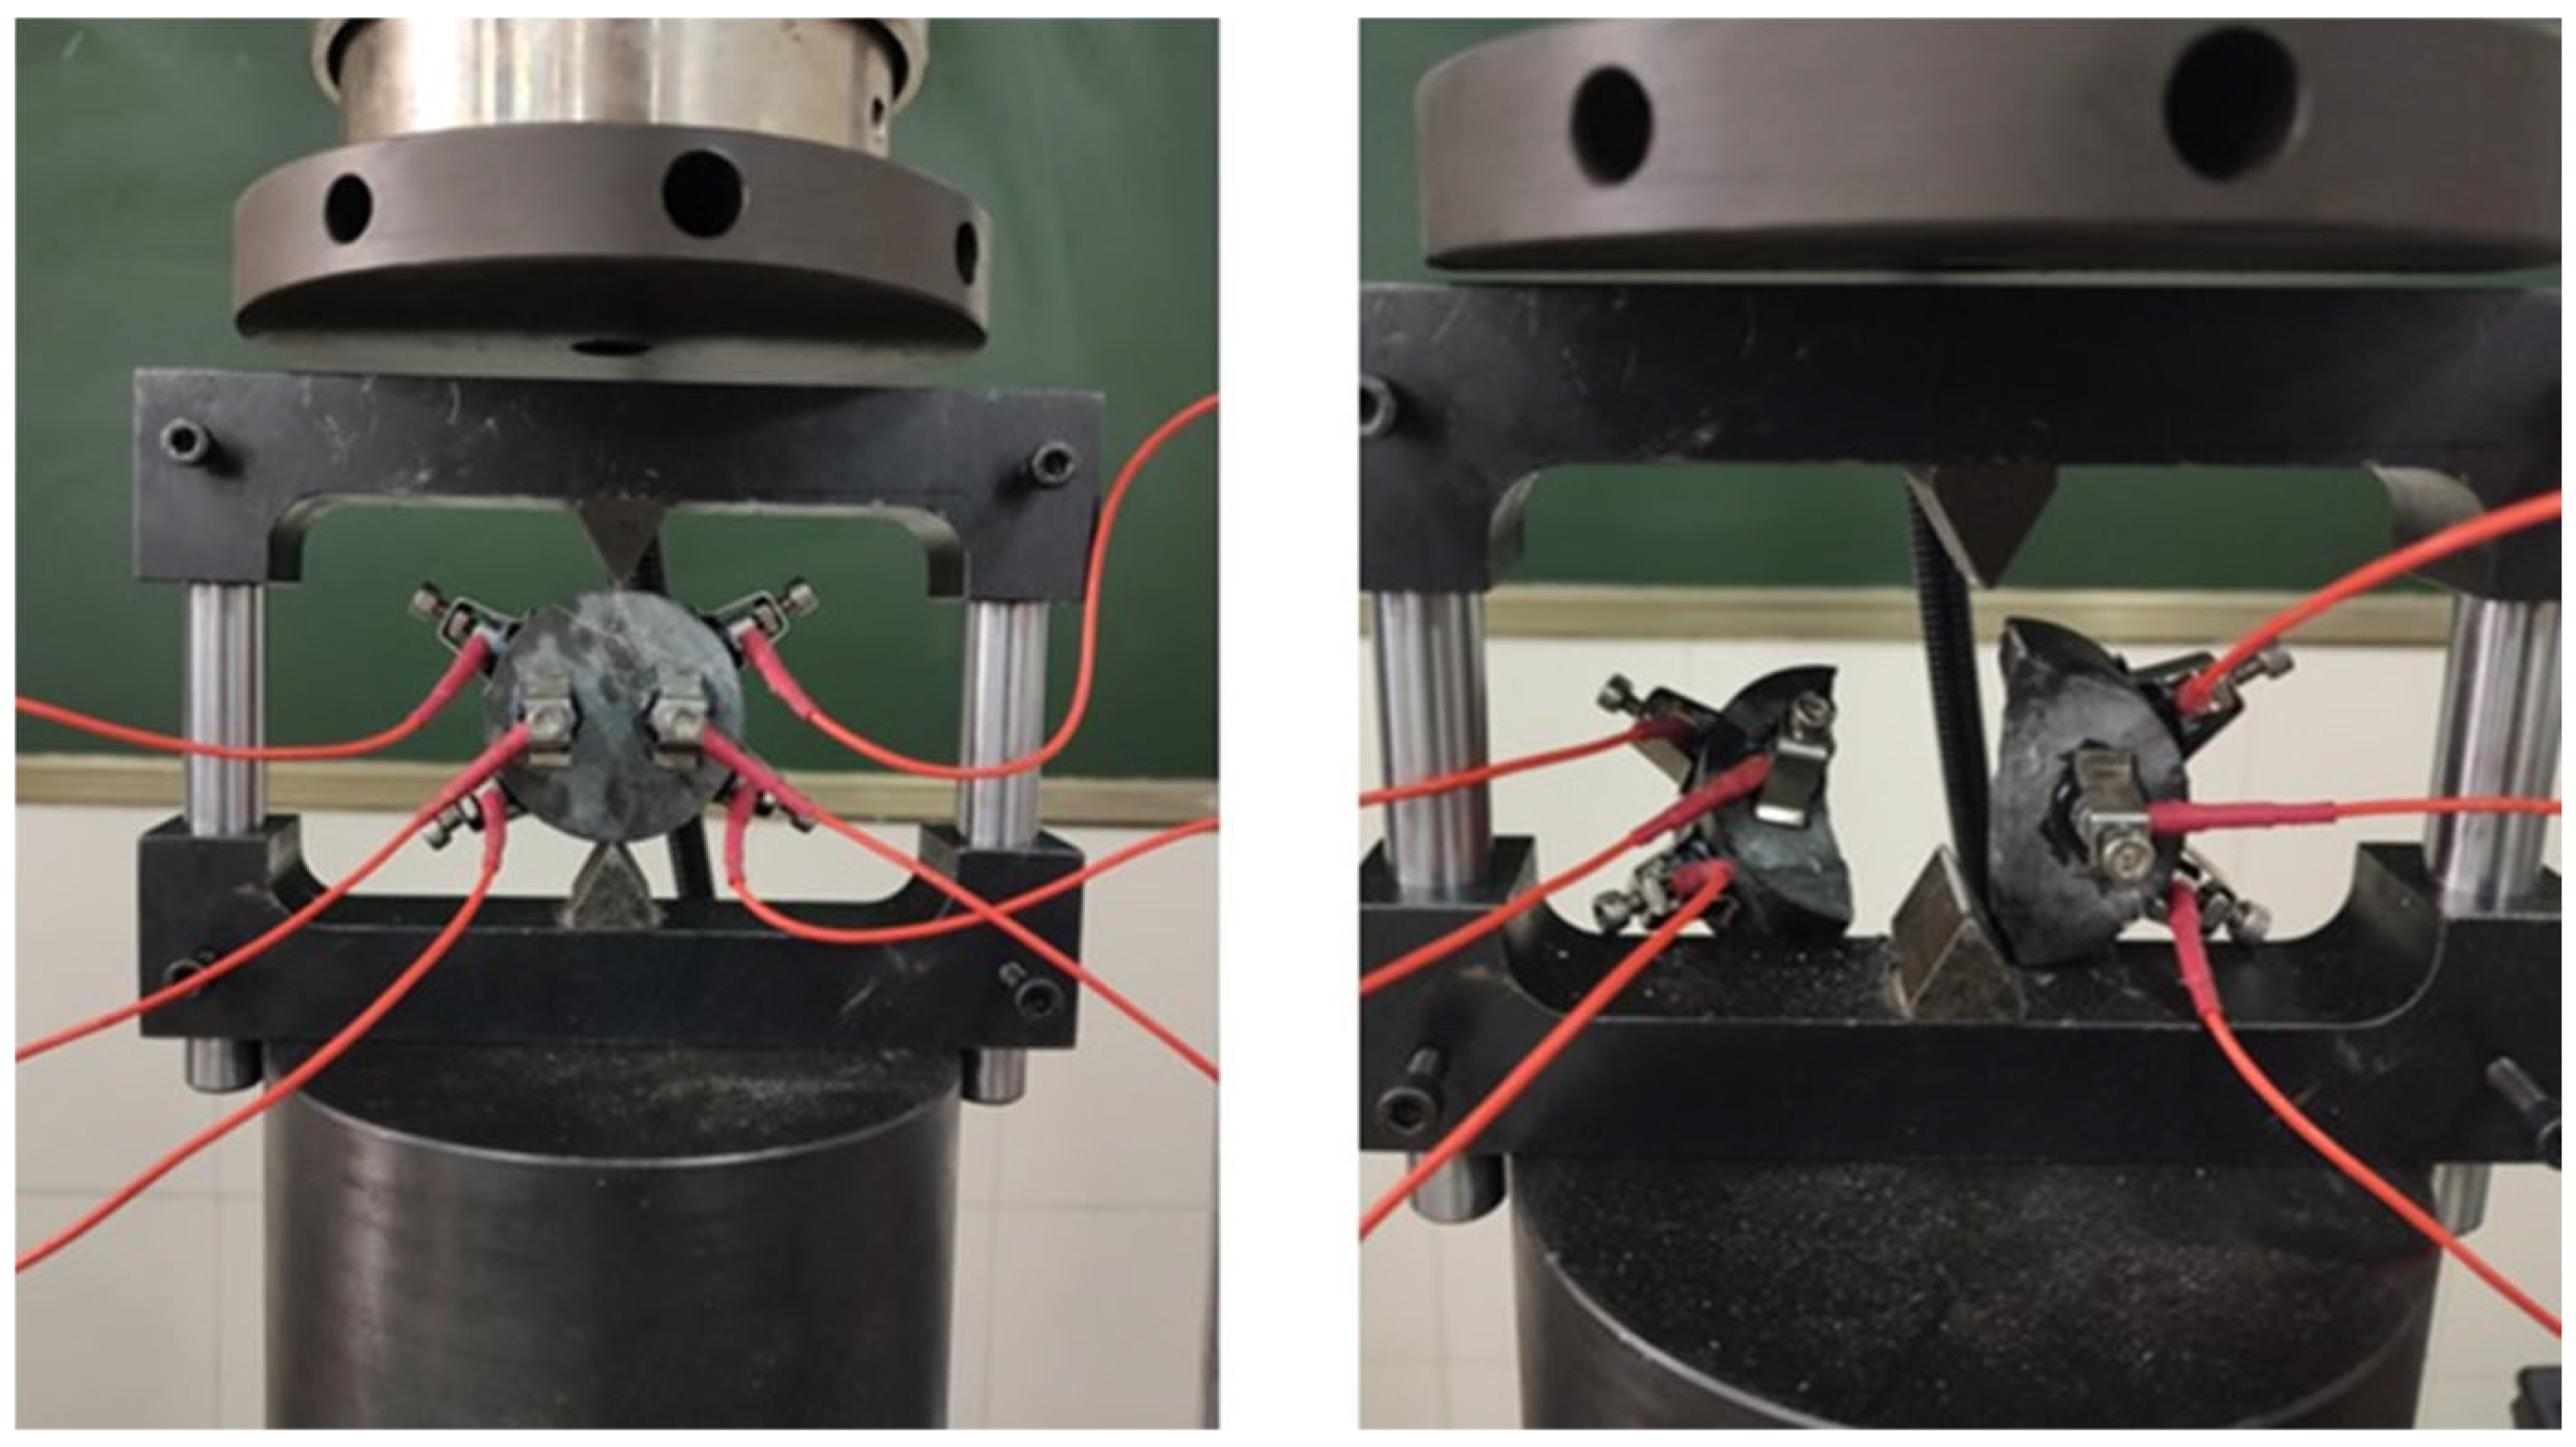
3.1. Study on Basic Mechanical Properties of the Rock

To obtain the basic mechanical properties of the rock mass in different formations, rock cores were taken on site near the developing entry of the 14# exploration line in the middle section of 1104, and photographs of the on-site coring are shown in Figure 5. The on-site rock core was processed to meet standard dimensions and requirements. The test loading system used a YAW-600 microcomputer-controlled electro-hydraulic servo rock testing machine, the loading method was displacement-controlled loading, and the loading rate was 0.2 mm/min. The calculations of the uniaxial compression and deformation test results are shown in Table 1, and the Brazilian split test results are shown in Table 2. Some failure photos after the uniaxial compression test are shown in Figure 6, and some of the failure photos after the Brazilian splitting test are shown in Figure 7.

3.2. Assessment of Rockburst Potential Based on Rock Mechanics Test Results

Zhang et al. [28] systematically generalized and summarized the evaluation indexes of rockburst potential and provided an understanding of the concept of rockburst potential. The evaluation of rockburst potential is mainly performed through the mechanical properties of the rock itself to assess the properties of the rock in a certain condition, which tends to occur to different degrees of the rockburst; i.e., this represents the internal cause of rockburst. In this study, the brittleness index and the maximum stored elastic strain energy index were used to assess the rockburst potential of the D3zg formation (dolomite) and C1d formation (limestone). The results of the assessment of rockburst potential of different stratigraphic rock properties are shown in Table 3.
The results of the brittleness index criterion indicate that the D3zg formation (dolomite) tends to suffer from a moderate-level rockburst, and the C1d formation (limestone) tends to suffer from a slight-level rockburst. Predictions based on the maximum stored elastic strain energy index indicate that the D3zg formation (dolomite) tends to suffer from a slight rockburst, and the C1d formation (limestone) tends to suffer from a slight rockburst. Combined with the brittleness index criterion and the maximum stored elastic strain energy index results, the D3zg formation and the C1d formation have rockburst potential. However, the occurrence of rockburst must be evaluated in conjunction with the on-site geological conditions, stress states, construction factors, and other relevant parameters to achieve a comprehensive assessment.

4. Geomechanics Modelling Establishment of Different Lithologies

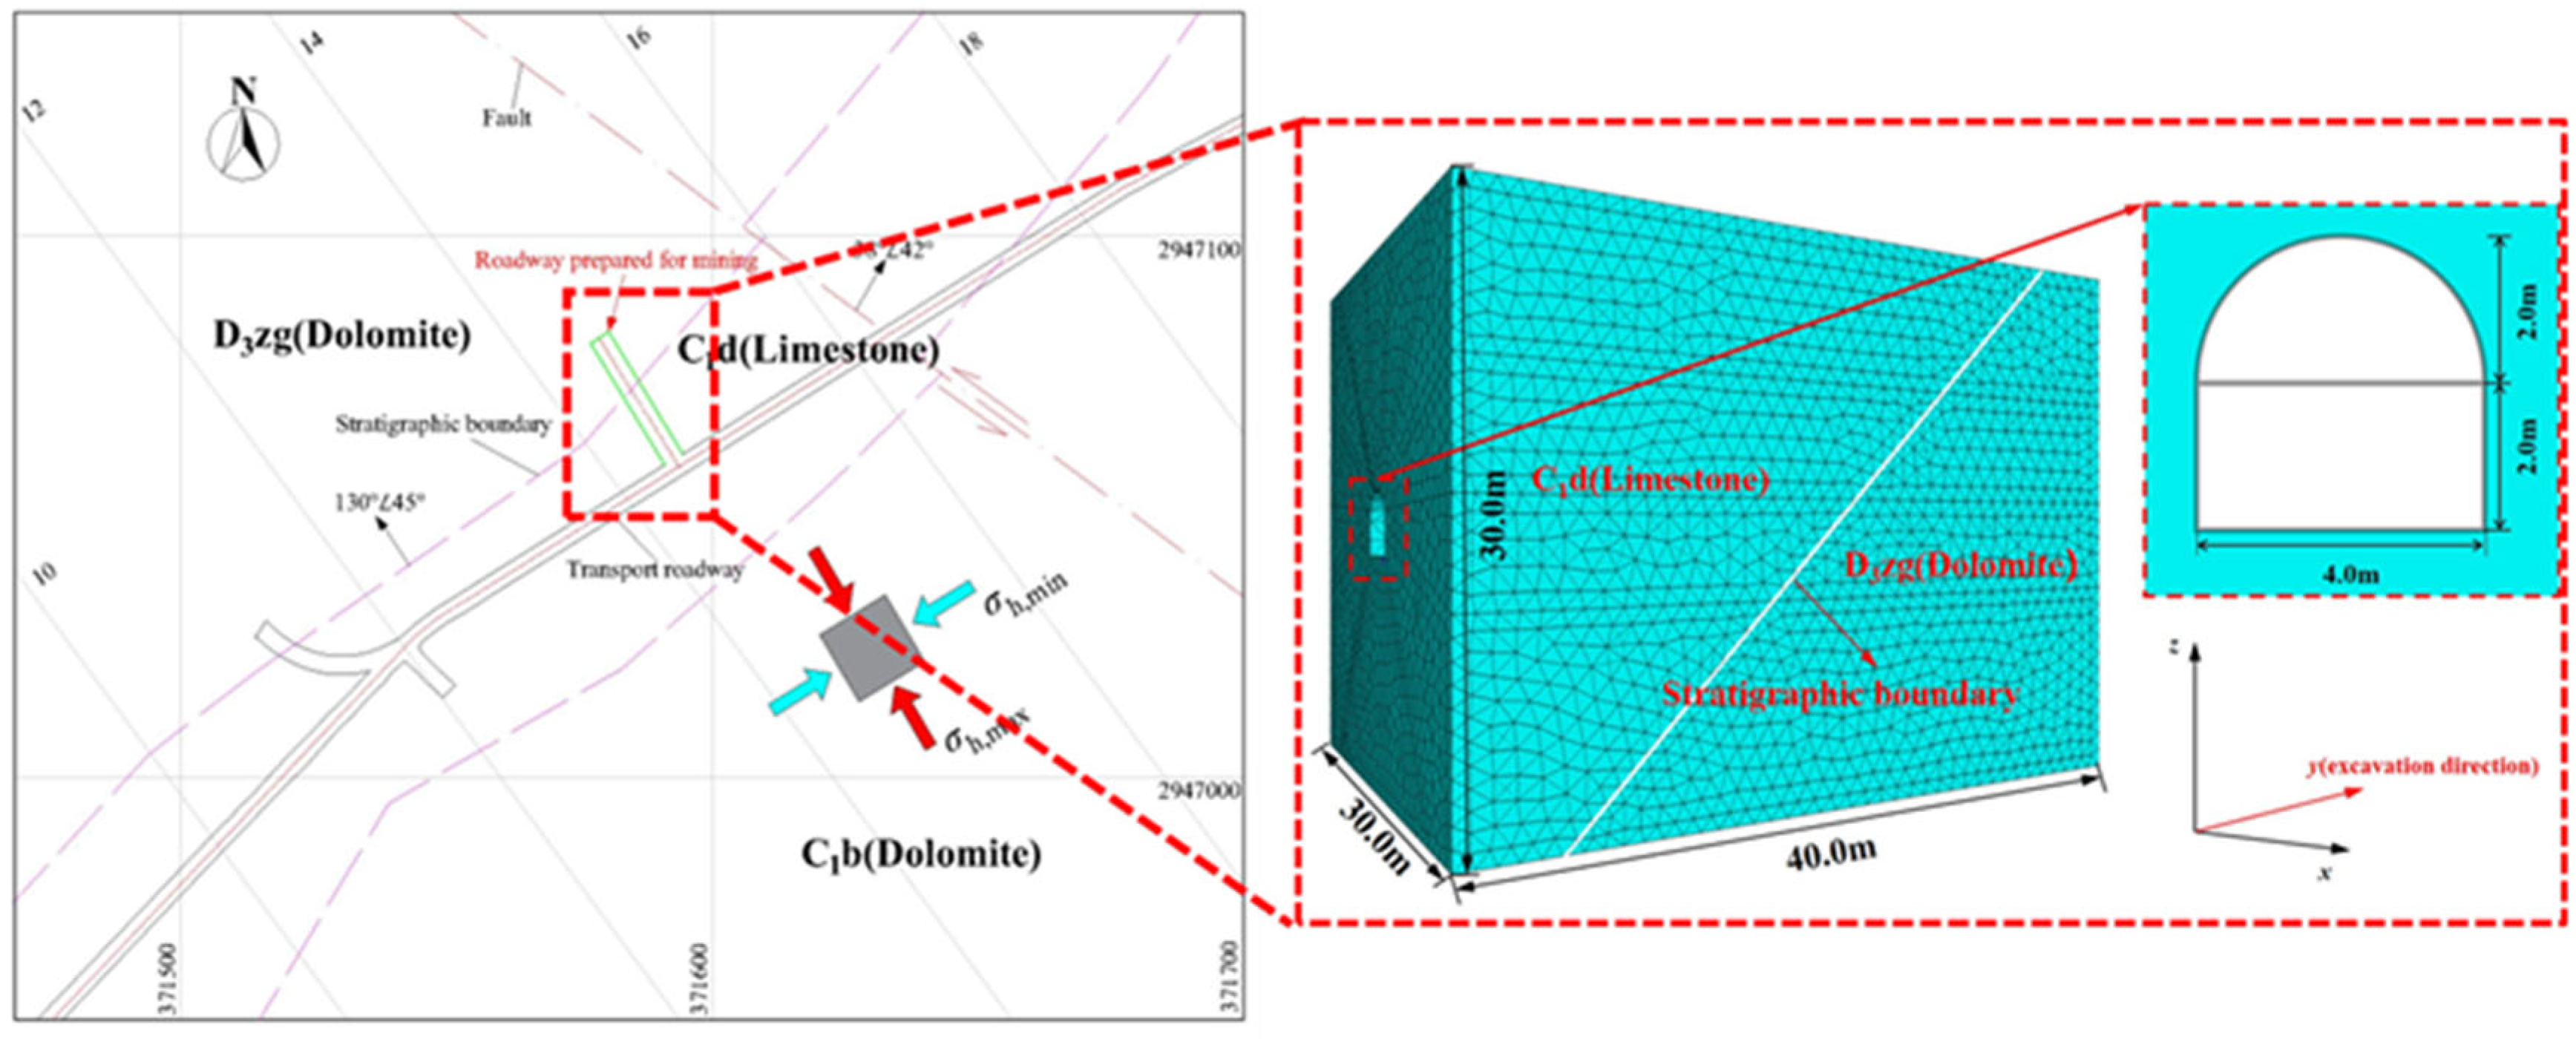
4.1. Construction of Geometric Models

As a discrete element method code, 3DEC (7.0) software is used to solve the responses of discontinuous media under static or dynamic loading. Its built-in FISH function permits the user to develop user-defined functions and variables to cater to a wide range of simulation demands. The bonded-block model (BBM) is used in this study to simulate the rock mass, which is built by bonding a series of polygonal blocks (tetrahedral blocks are used in this study) through the contact surfaces. The BBM technique allows the computational model to be discretized into a collection of discrete blocks cut by a finite structural plane, thus capturing the macro-mechanical features of the rock mass while reflecting the micro-behavior of the friction between the smaller blocks [25].
To study the mechanical behavior of surrounding rocks in deep-buried roadways traversing multi-stratigraphic tectonics and to assess the rockburst risk in the vicinity of the traversing stratigraphic boundary, the working conditions of the developing entry through the C1b (limestone) and D3zg (dolomite) at the same time near the 14# exploration line of the 1104 middle section (depth-buried 1276 m) of the Huize lead–zinc mine were taken as the background for the research. The location of the corresponding three-dimensional geological model is marked in Figure 8. The shape and size of the actual excavated roadway are simplified, considering Saint-Venant’s Principle and the scope of excavation influence, to eliminate the boundary effect generated by the calculation. The calculation model was established with dimensions of 30 m × 30 m × 40 m. The shape of the roadway is a straight-walled arch with dimensions of 4 m × 4 m, and the numerical model of the roadway excavation is shown in Figure 8.

4.2. Numerical Model Parameter Matching

Since the collected rock samples are detached from the environment in which the rock mass exists and are limited by the structural characteristics and size effect of the rock samples, the rock strength determined by laboratory rock mechanics tests is generally lower than the strength of the rock mass in the field [29]. Therefore, it cannot be used directly for numerical simulation calculations. Accordingly, the Hoek–Brown strength criterion was used to correct the rock’s mechanical parameters. The deformation modulus of the rock mass was modeled as the correlation between the modulus of the rock mass and the modulus of the intact rock by using the geological strength index (GSI) based on many years of research on the strength criterion of the rock mass by E. Hoek et al. The expression of the calculation is shown in (1) [30], and the strength of the rock mass was calculated using Equation (2) [31]. The calculated mechanical parameters of the rock mass after reduction based on the Hoek–Brown criterion are shown in Table 4.
E rm E i = 0.02 + 1 D / 2 1 + e ( 60 + 15 D G S I ) / 11
σ cmass = σ c i m b + 4 s a m b 8 s 2 ( 1 + a ) ( 2 + a ) m b 4 + s s 1
m b = m i exp G S I 100 28 14 D
s = exp G S I 100 9 3 D
a = 1 2 + 1 6 e G S I 15 e 20 3
where GSI is the geological strength index of the rock mass, determined by the field investigation; D is the mining disturbance coefficient; mb, s, a are the material constants of the rock mass; σcmass is the uniaxial compressive strength of the rock mass, MPa; σci is the uniaxial compressive strength of the intact rock, MPa; Erm is the modulus of the rock mass, GPa; and Ei is the modulus of the intact rock, GPa.
A Mohr–Coulomb constitutive model is assigned to the block elements, and a Mohr–Coulomb slip model is adopted for the contact elements. The behavior of the rock mass is controlled by parameters that are assigned to different models and can be divided into the following two groups: (1) Block element model parameters: density, bulk modulus, shear modulus, cohesion, angle of internal friction and tensile strength. (2) Contact model parameters: normal stiffness, shear stiffness, cohesion, internal friction angle, and tensile strength. Based on the rock mechanics parameters calculated from the laboratory tests, K, G, Kn, and Ks were calculated using the following equations
K = E 3 ( 1 2 μ )
G = E 2 ( 1 + μ )
K n = 10 K + 3 4 G Δ z min
K s = 0.4 K n
Other parameters required in 3DEC can be obtained from simulated rock mass compression tests. The mechanical properties of the rock mass exhibit a size effect and tend to stabilize when the size of the rock mass increases to a certain extent. This minimum size is called the representative elementary volume (REV) [32]. In this study, we refer to the REV dimension selected by Sun et al. [33]. Based on a series of uniaxial compression tests for numerical simulation, the other parameters required for numerical simulation were inverted, as shown in Table 5.

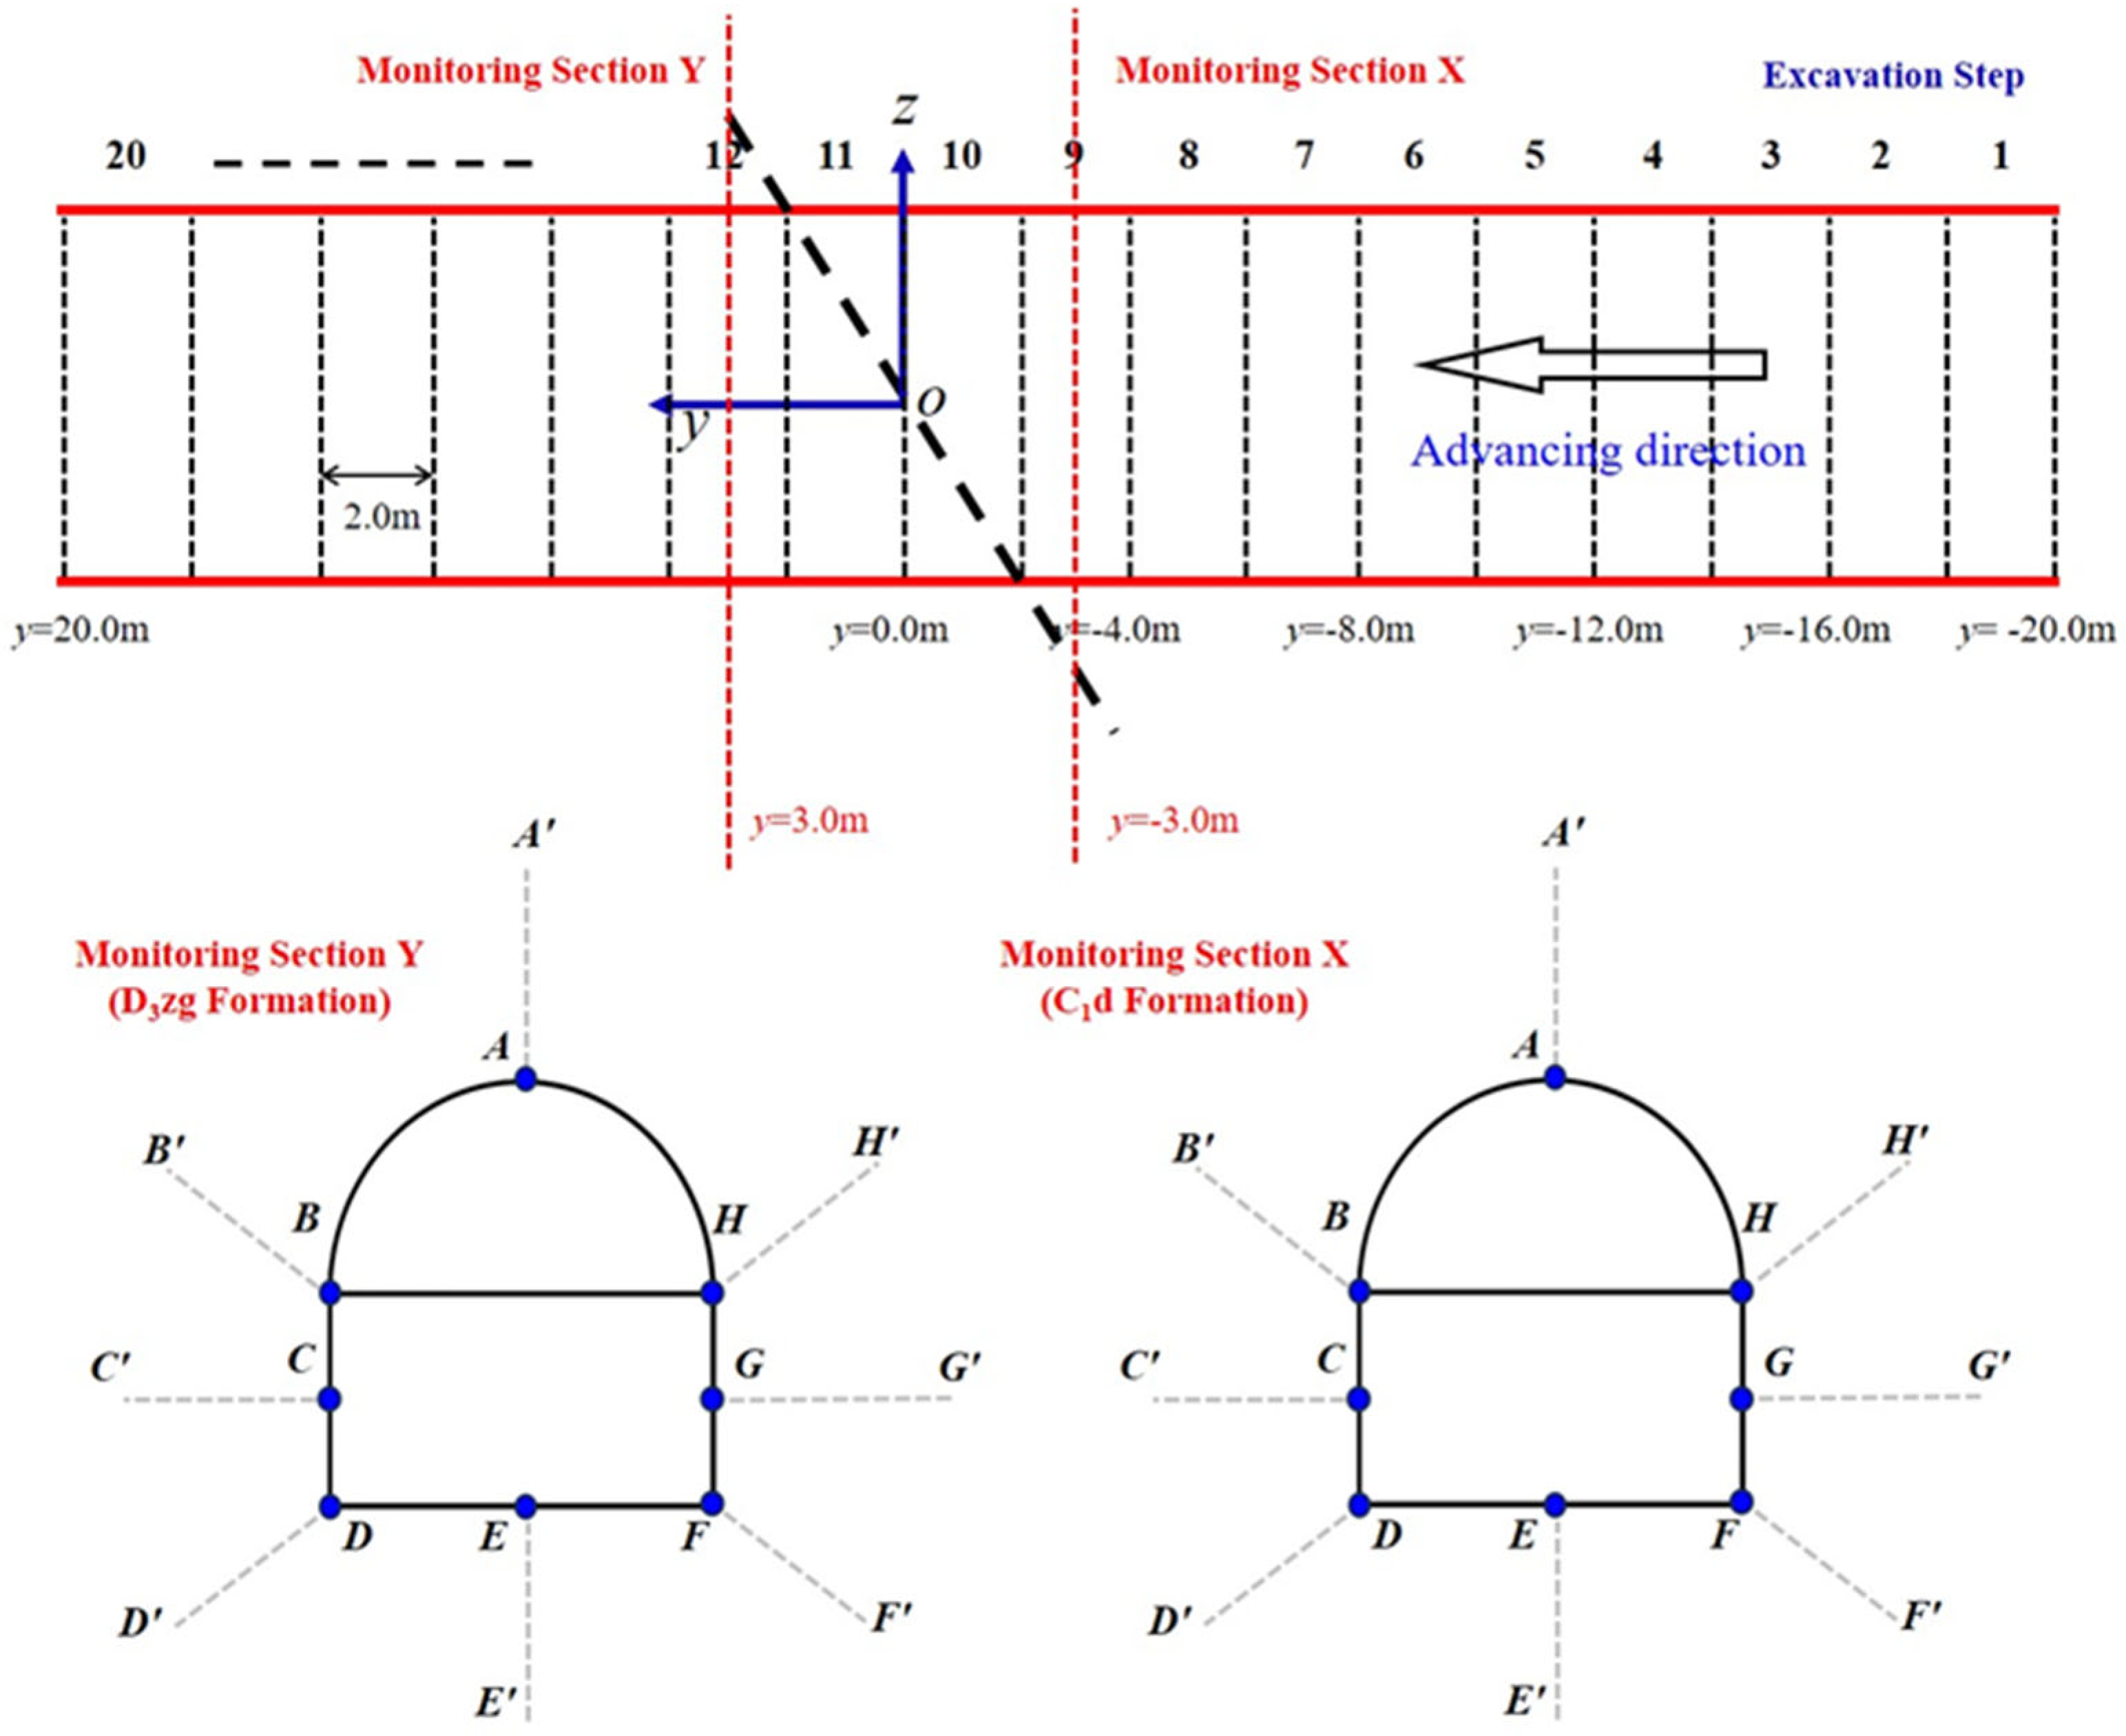
4.3. Boundary Conditions and Monitoring Scheme

According to the geo-stress measurements, the deep geo-stress field is dominated by horizontal stress, and the maximum horizontal principal stress (σh,max), the minimum horizontal principal stress (σh,min) and the vertical principal stress (σv) all increase with depth and in an approximately linear relationship. Based on previous on-site geo-stress measurement results, the model expression for the geo-stress field at the mine site is shown in Equation (10):
σ h , max = 0.0293 H 0.1709 σ h , min = 0.0223 H + 0.2562 σ v = 0.02 H 0.1613
where σh,max is the maximum horizontal principal stress, MPa; σh,min is the minimum horizontal principal stress, MPa; σv is the vertical principal stress, MPa; H is the buried depth.
The result of fitting the in situ stress in the middle section of 1104 (the burial depth is about 1276 m) is considered the excavation boundary of the numerical model; the distribution of the in situ stress is shown in Figure 9. In this research, the excavation direction (y-direction) is set to 40 m total, excavated in increments of 2 m each time, with a total of 20 excavations, and the numerical simulation of the excavation scheme is shown in Figure 10. Meanwhile, for the research of the mechanical behavior and rockburst risk of the deep-buried roadway traversing different formations near the stratigraphic boundary, y = −3 m (C1d) and y = 3 m (D3zg) are selected as the monitoring section X and the monitoring section Y, and the detailed monitoring scheme is shown in Figure 10.

5. Analysis and Discussion of Numerical Simulation Results

5.1. Study on Mechanical Behavior Characteristics of the Surrounding Rock at Stratigraphic Boundary

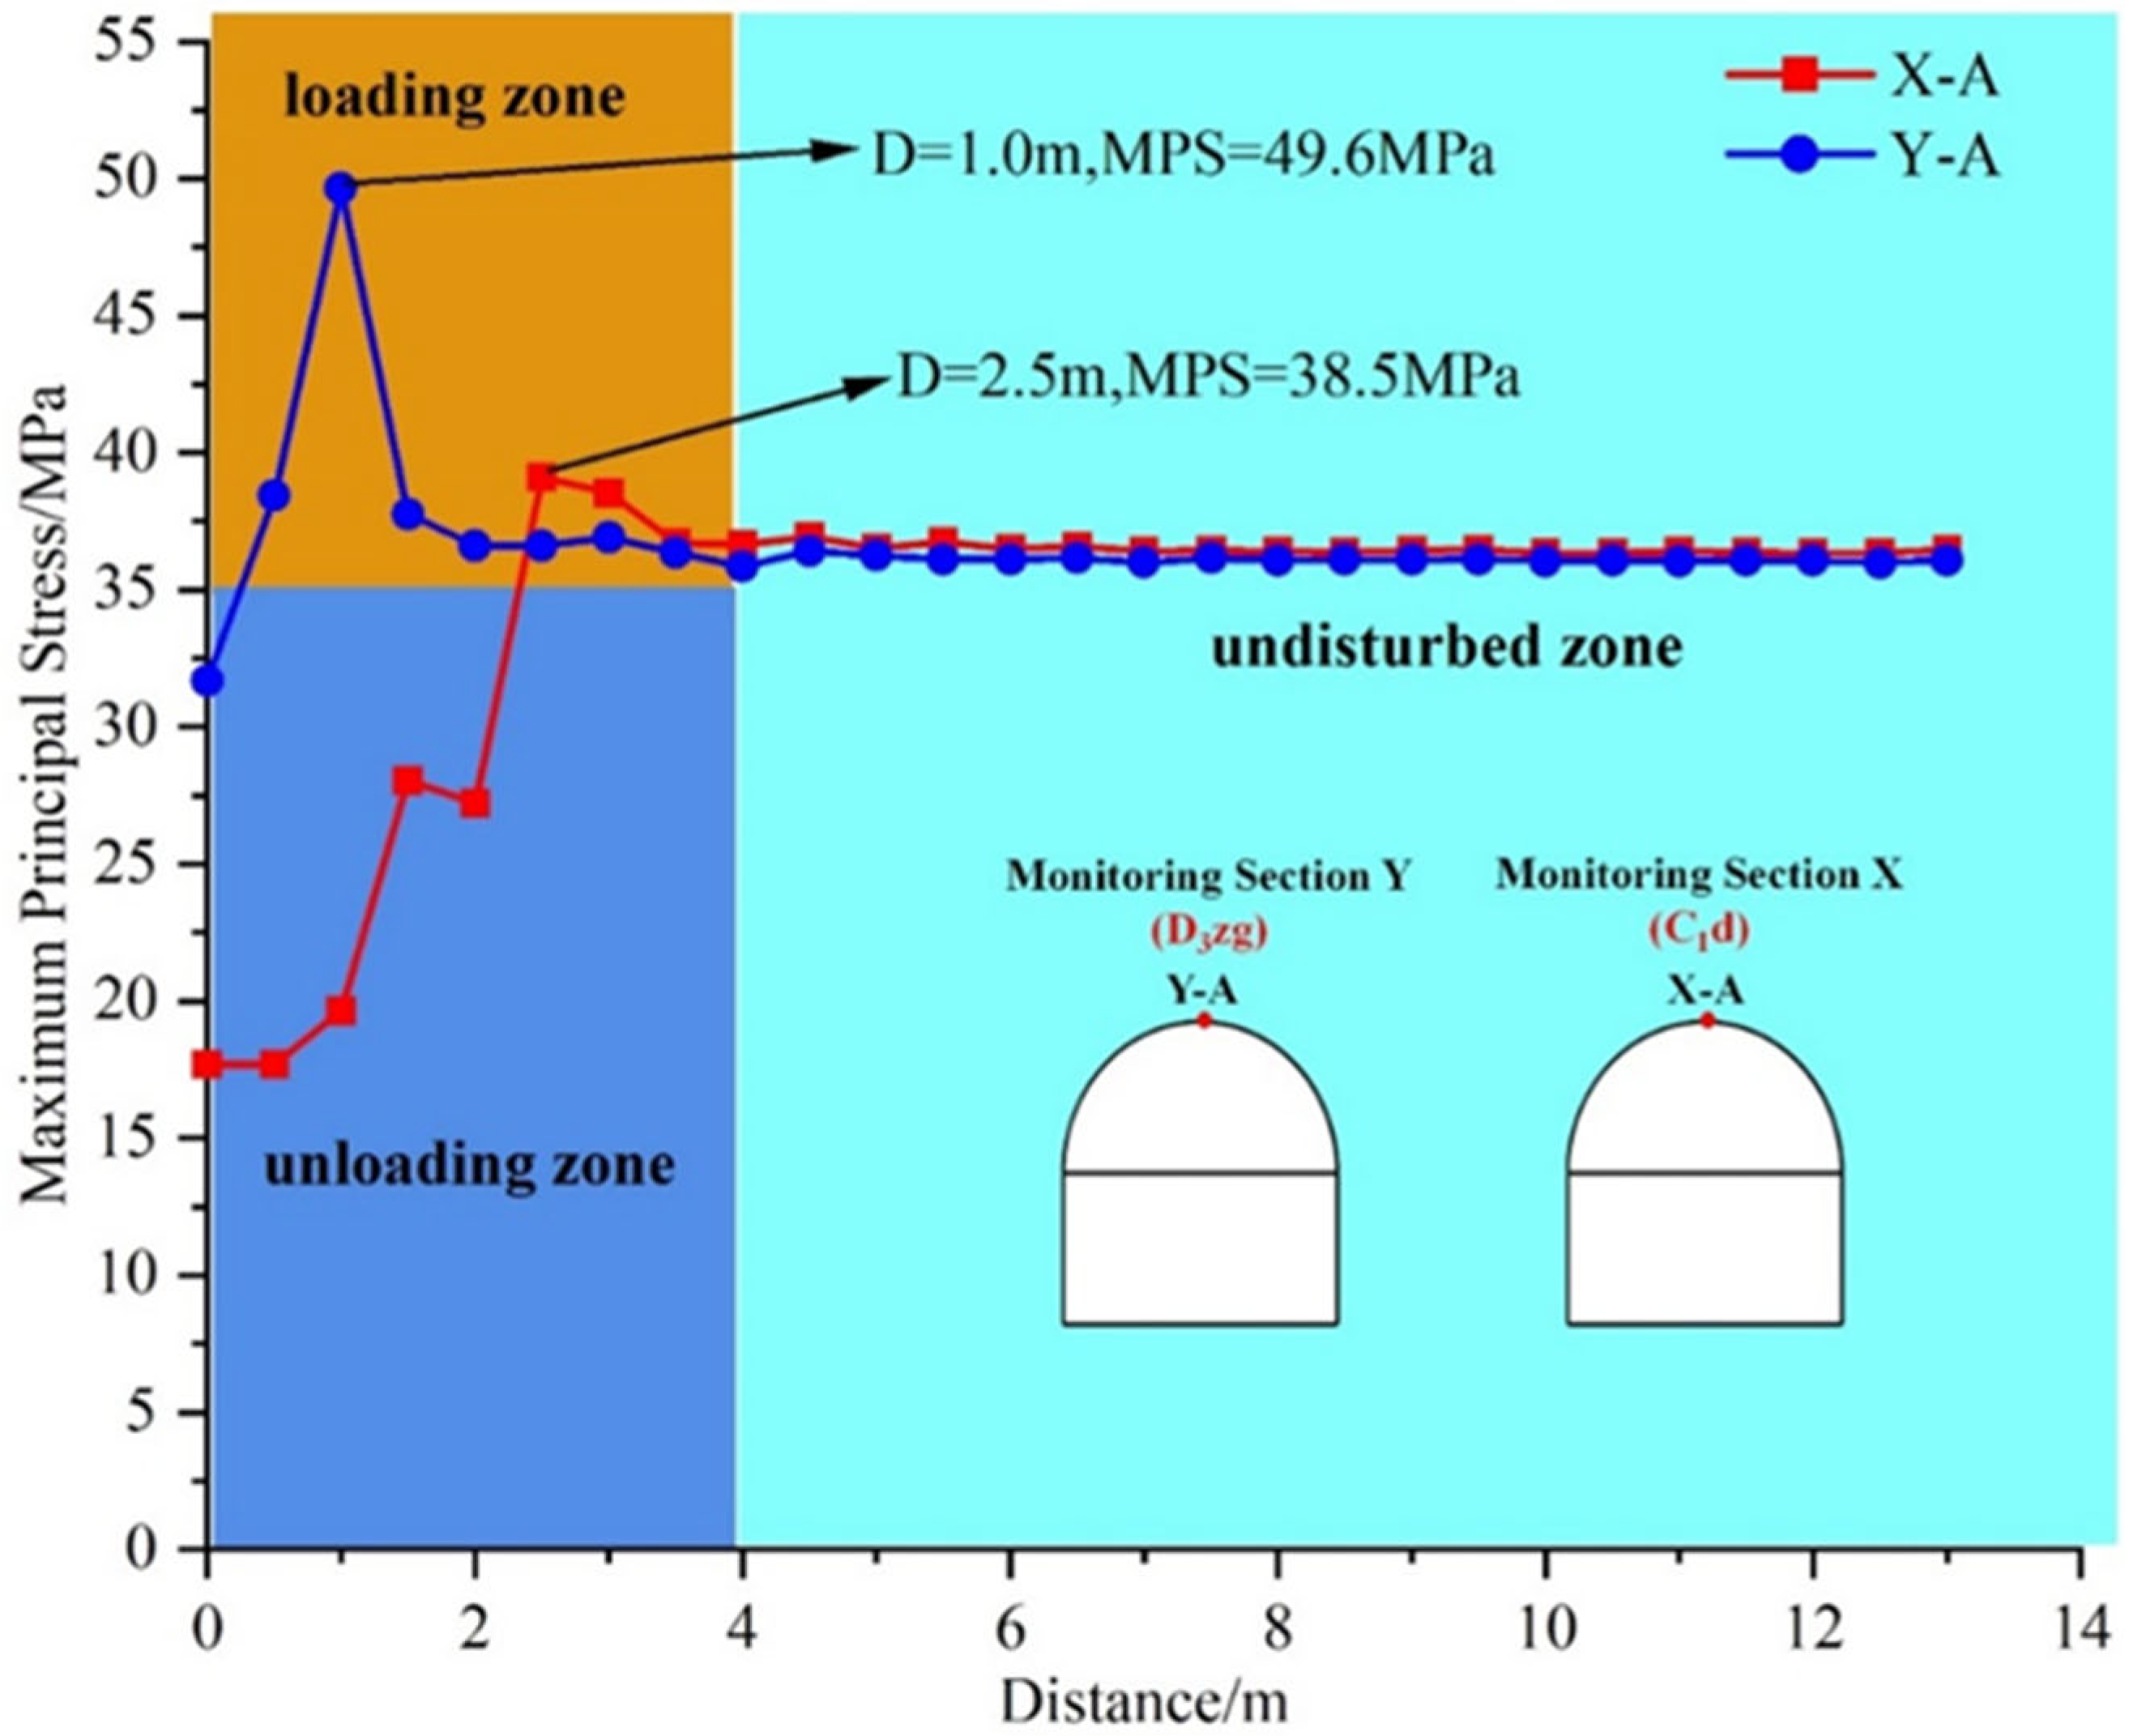
5.1.1. Study on the Distribution Characteristics and Evolution Law of the Stress Field

Since the model has a symmetry, the maximum principal stress field distribution and evolution characteristics of the surrounding rock on the right side of the roadway were recorded, and the numerical simulation results are shown in Figure 11. When the roadway crosses C1d (limestone), the stress state of the surrounding rock around the excavation profile surface changes significantly (three-directional stress state becomes two-directional or one-directional stress state) due to the excavation unloading effect, which breaks the initial stable state of the rock mass, and the properties of the rock mass gradually deteriorate. When the disturbed stress on the rock mass exceeds the ultimate strength of the rock mass, the rock mass undergoes instability damage and gradually transitions to the residual flow stage, and the bearing capacity of the rock mass is substantially weakened. Therefore, it can be seen from Figure 11 (excavation step 1) that the rock mass near the excavation profile appears to have a large stress release zone transferred toward the deep rock mass. As the tunnel face advances, the distribution pattern of the stress field of the surrounding rock around the roadway tends to be stable, and there is an obvious local stress concentration area near the arch top and arch bottom at a distance of about 3 m from the excavation-free surface. When the roadway crosses the stratigraphic boundary (excavation step 12), a local abnormal stress zone is formed in the lower plate of the stratigraphic boundary (D3zg). The stress concentration phenomenon in the area is significant, and the maximum principal stress reaches 68.5 MPa.
There are differences in the distribution characteristics of the surrounding rock stress field of the roadway in different formations when crossing the stratigraphic boundary. To quantitatively investigate the relationship between the two, monitoring point A (vault) on monitoring section X (C1d formation) and monitoring point A (vault) on monitoring section Y (D3zg formation) of the roadway were selected to analyze the variation curves of the secondary stress field of the surrounding rock when traversing different formations, as shown in Figure 12. Monitoring point X-A (monitoring point A on monitoring section X) reaches the peak at the position of 3 m around the roadway, which is 2 m farther than the peak stress position (1 m) of monitoring point Y-A (monitoring point A on monitoring section Y). However, the maximum principal stress at monitoring point X-A is 38.5 MPa, which is 28.8% lower than that at monitoring point Y-A (49.6 MPa). It can be seen that the region of stress concentration in the C1d formation is relatively far from the excavation surface, but the stress level is lower. In contrast, the stress concentration region in the D3zg formation is closer to the excavation face, but the stress level is higher. In addition, the concept of Stress Concentration Degree (SCD) is introduced to study the stress characteristics at different locations of the excavation profile surface. The SCD expression is shown in (11):
S C D = σ σ = > 1   stress   concentration = 1   in - situ   stress ( undisturbed )   < 1   stress   release
where σ’ is the maximum principal stress of the rock unit after being disturbed by excavation, MPa; σ is the maximum principal stress of the rock unit in the original rock stress state, MPa.
The monitoring scheme is shown in Figure 10, where monitoring section X is located in the C1d formation (limestone), and monitoring section Y is located in the D3zg formation (dolomite). Meanwhile, to study the stress characteristics of surrounding rock at different distances from the excavation face, the maximum principal stresses at different distances from the monitoring line (A-A’, B-B’, C-C’, D-D’, E-E’, F-F’, G-G’) were recorded to calculate the corresponding SCD, and the results are shown in Figure 13 (according to previous studies, the region 0–1.5 m from the monitoring line is considered a key stress zone [34]). On the roadway profile face, the surrounding rock of different strata is in a stress-released state, with greater stress release around the surrounding rock of the C1d formation, with the greatest stress release at the arch bottom (point E), which is close to zero. At 0.5 m from the roadway, the stress state of the surrounding rock vault A in the D3zg formation changes and is in the state of stress concentration, while all other points are still in the state of stress release. At 1.0 m from the roadway, at vault point A in the D3zg formation reaches a peak SCD value of 1.3. The vault region of the D3zg formation exhibits a significantly higher degree of stress concentration compared to other positions along the roadway and is the main location of the abnormal stress zone.. In contrast, the surrounding rock of the C1d formation is mainly in the state of stress release near the free face, and the range of the stress release zone is larger than that in the D3zg formation, as also observed in Figure 11.
It can be concluded that differences exist in the stress field distribution characteristics of the surrounding rock when the roadway crosses different formations. When the roadway does not cross the stratigraphic boundary and remains within the C1d formation, the stress release zone in the surrounding rock is wider, and the stress concentration zone is located farther away from the free face of the excavation, in contrast, with relatively low stress accumulation. Conversely, when the roadway crosses into the D3zg formation, the stress release zone is significantly smaller, and the stress concentration zone is located closer to the free face of the excavation, with a relatively high degree of stress accumulation. In addition, when the roadway crosses the stratigraphic boundary, an abnormal stress zone (associated with a local region of relatively hard rock) is formed in the lower plate of the stratigraphic boundary. This zone is primarily concentrated near the vault, making the rock mass in this area more susceptible to cumulative damage. Meanwhile, this abnormal stress zone creates a favorable external environment and mechanical conditions for the accumulation of high energy, thus increasing the risk of rockburst disasters.

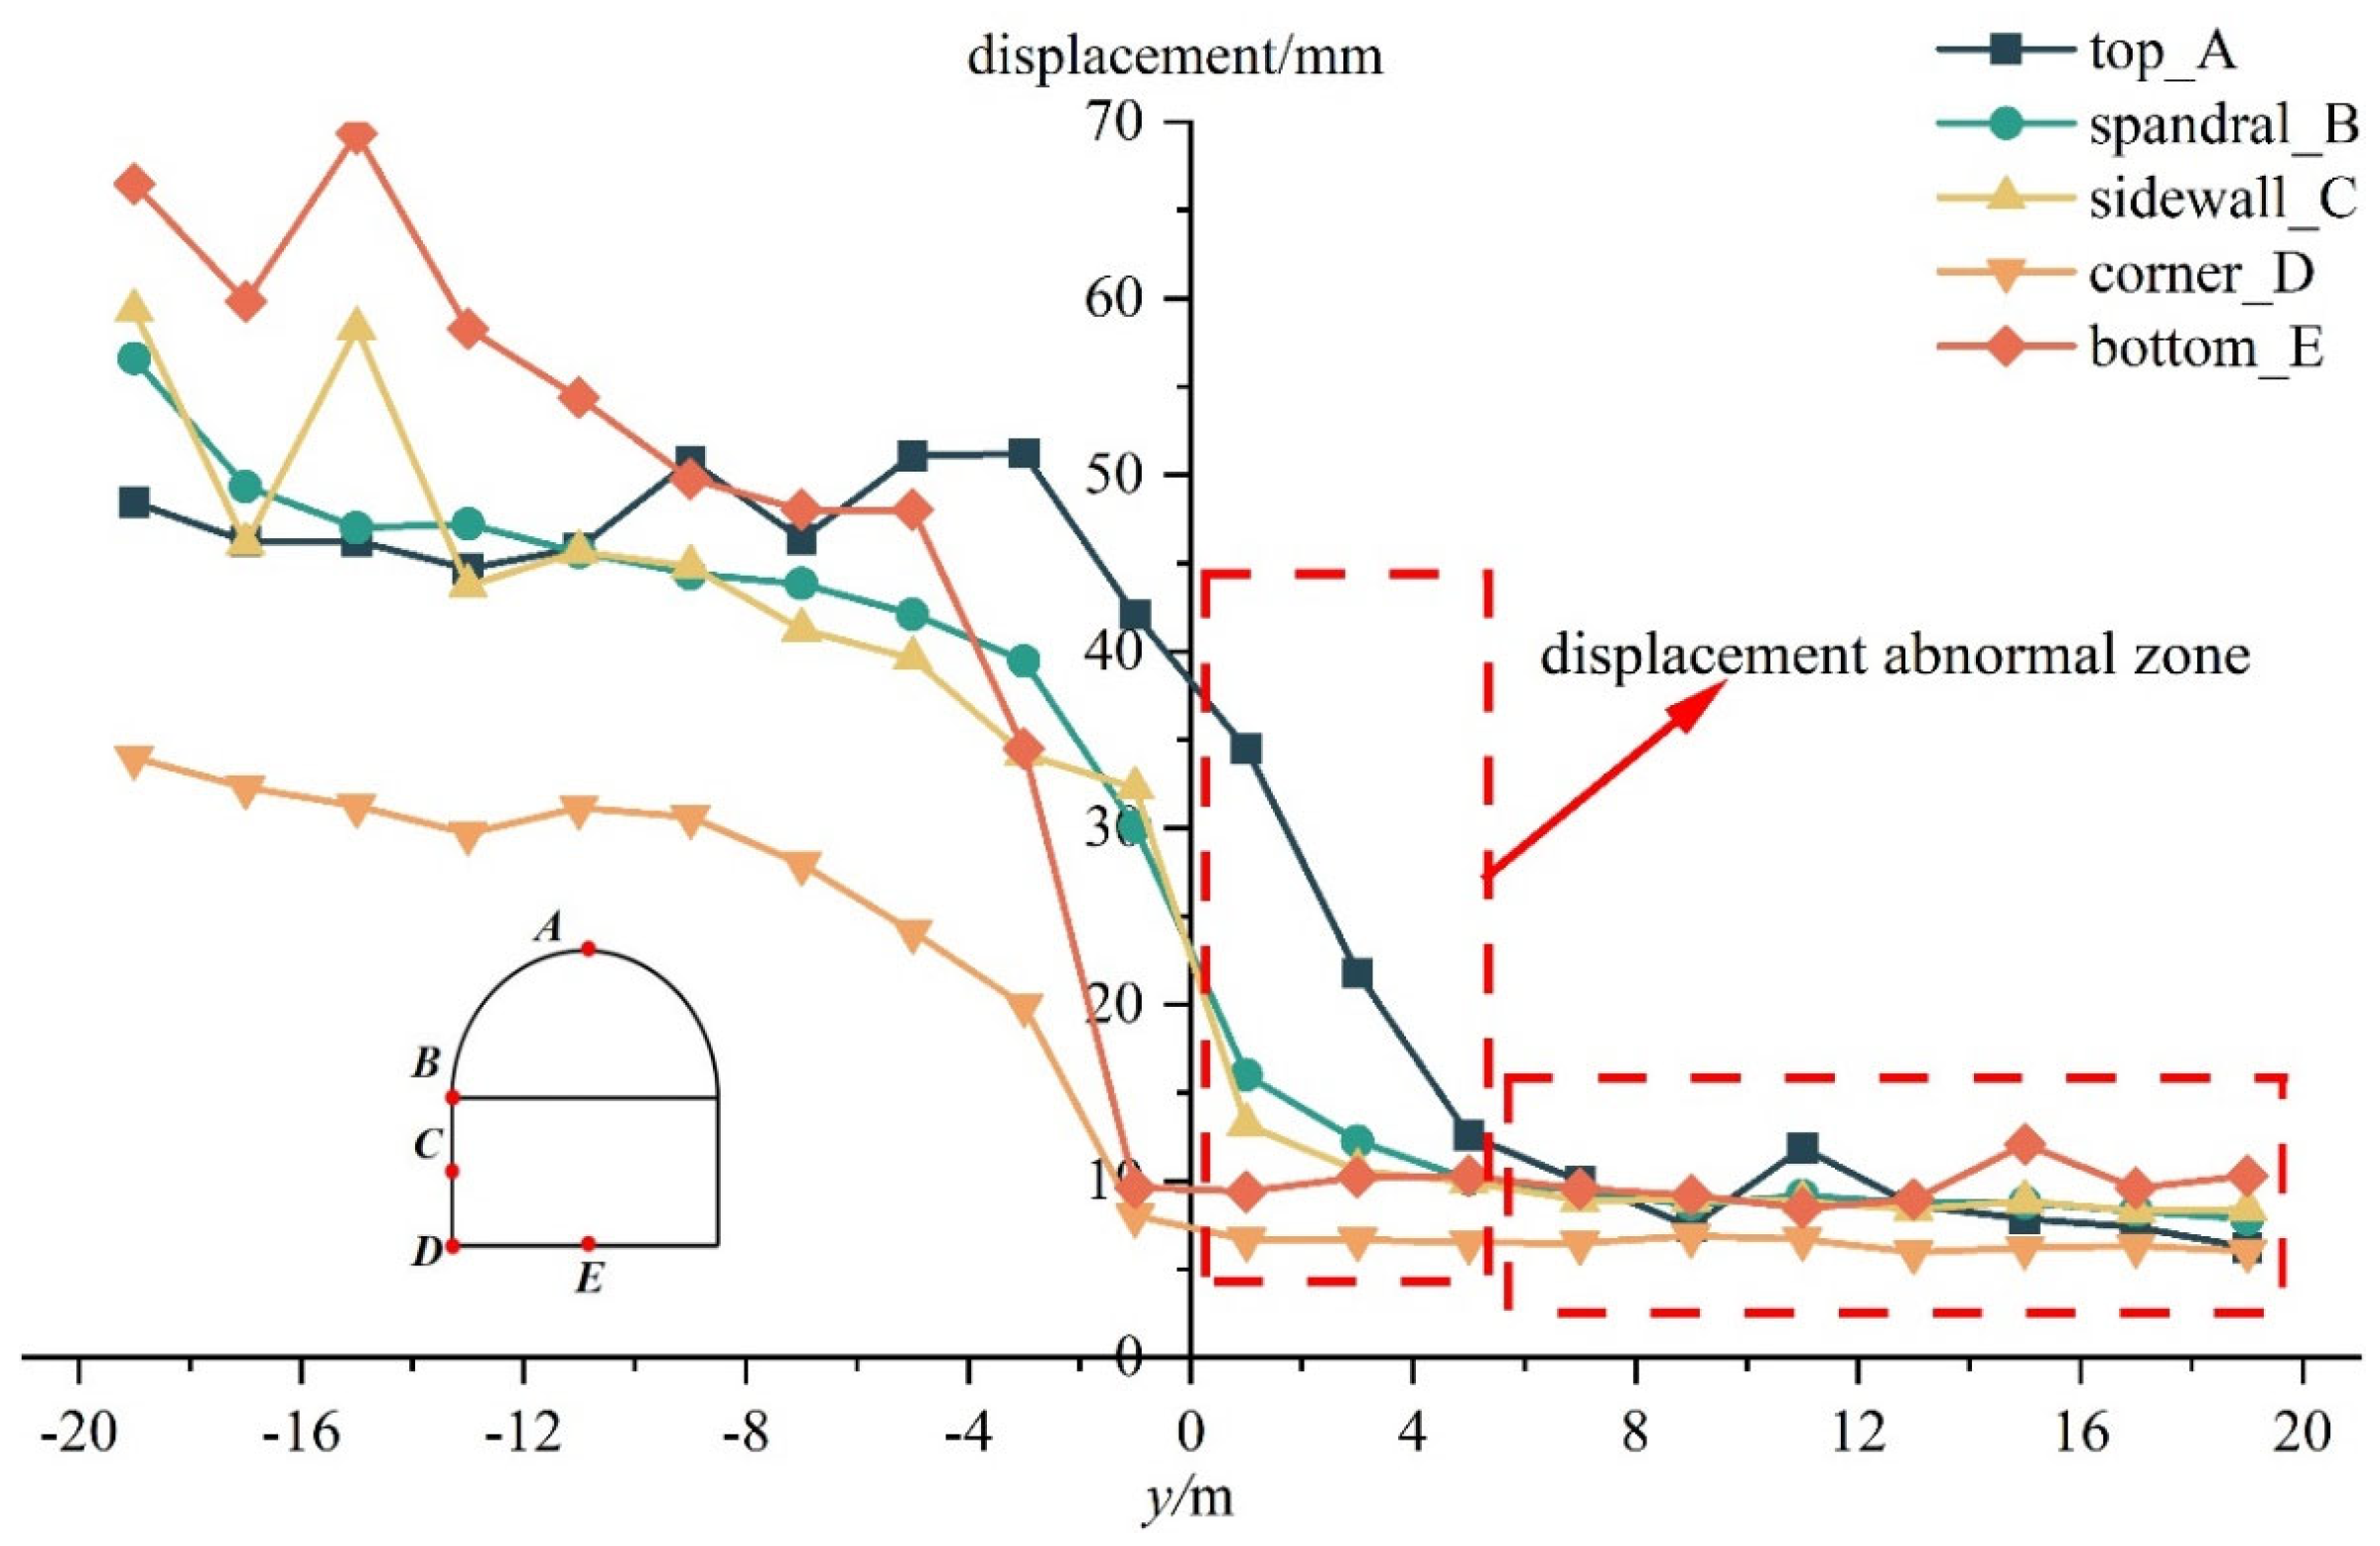
5.1.2. Study on the Distribution Characteristics and Evolution Law of Displacement Field

The distribution and evolution patterns of the displacement field during roadway excavation are crucial for researching surrounding rock stability. To study the deformation characteristics of the roadway when passing through different formations, a total of five monitoring points, A (arch top), B (arch shoulder), C (side wall), D (arch foot), and E (arch bottom), were selected on the profile surface of the roadway. The monitoring sections were selected as y = −19 m, y = −17 m, y = 19 m, with an interval of 2 m for one section, to capture the deformation behavior of the surrounding rock in the whole excavation region. The displacement values at different monitoring points in different monitoring sections are plotted in Figure 14. With the continuous advancement of the excavation process, in the C1d formation, the displacement at the arch bottom is the largest, reaching 69.3 mm, while the displacement at the arch foot is the smallest; in the D3zg formation, the displacement of the arch top is relatively larger, reaching 34.4 mm, while the arch foot again exhibits the smallest displacement. Overall, the displacements in the surrounding rock of the C1d formation are greater than those in the D3zg formation, as shown in Figure 14.
Figure 15 shows a radar map of the surrounding rock displacement distribution at different monitoring sections. The starting position (0°) corresponds to the right arch shoulder, 90° corresponds to the arch top, and 270° corresponds to the arch bottom. The displacement of the surrounding rock around the C1d formation (monitoring section X) is larger, and the deformation area is wider, while the displacement of the surrounding rock around the D3zg formation (monitoring section Y) is mainly concentrated near the vault region—specifically, the left side of the vault (105°) and the midpoint between the right arch shoulder and the arch top (45°). The minimum displacement in the D3zg formation is 6.7 mm. The maximum displacement near the arch top on the left side (105°) is 30.2 mm, which is 23.5 mm greater than the minimum. Similarly, the maximum displacement at the midpoint between the right arch shoulder and the arch top (45°) is 29.5 mm, 22.8 mm greater than the minimum. Therefore, it is essential to pay close attention to localized large-deformation areas during construction and to implement appropriate support measures if necessary.
The above analysis shows clear differences in the displacement field distribution of surrounding rock when the roadway crosses different formations. In the C1d formation, deformation is more widespread; in the D3zg formation, it is concentrated near the arch. The displacement is significantly affected by lithological differences. Additionally, greater deformation is observed in the harder formations near the stratigraphic boundary than in other regions of the same formation. This may be because the relatively softer formation near the boundary produces larger displacement and exerts compressive stress on the harder formation, forming a displacement anomaly zone near the boundary. The arch top area shows particularly pronounced displacement, as indicated in Figure 14. When combined with the distribution of the abnormal stress zone, it is evident that the vault region near the stratigraphic boundary should be a key focus during construction.

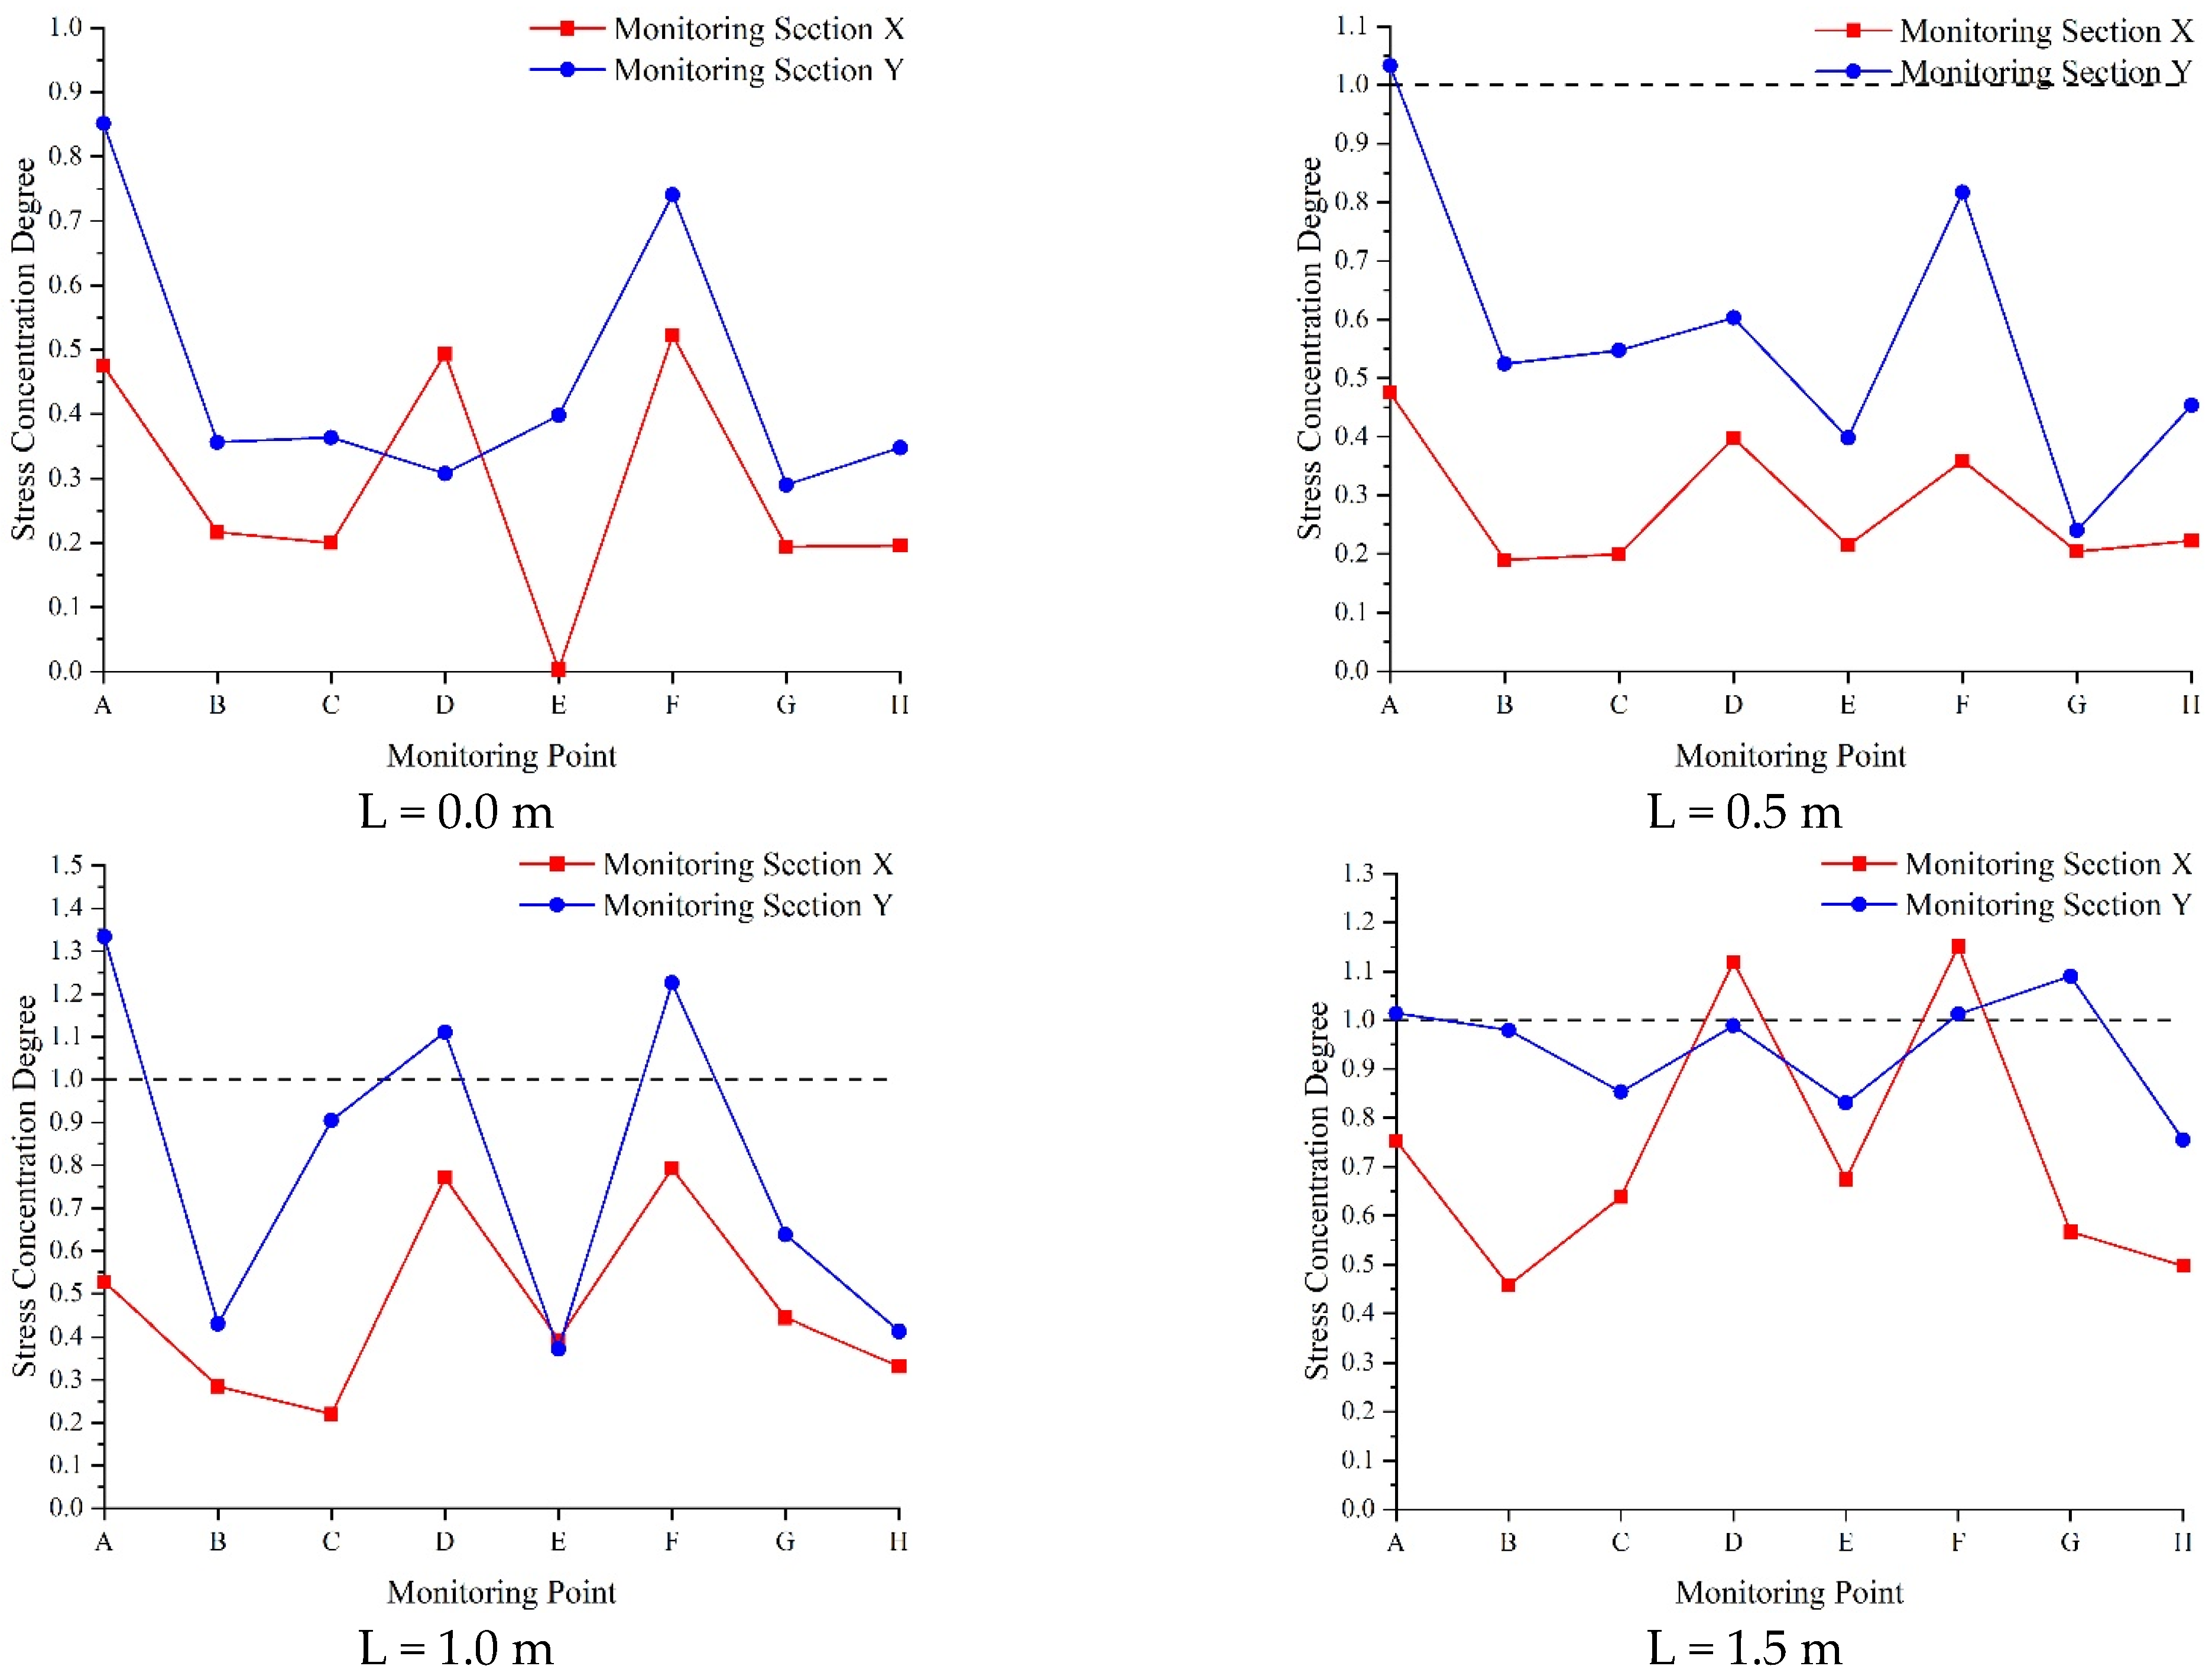
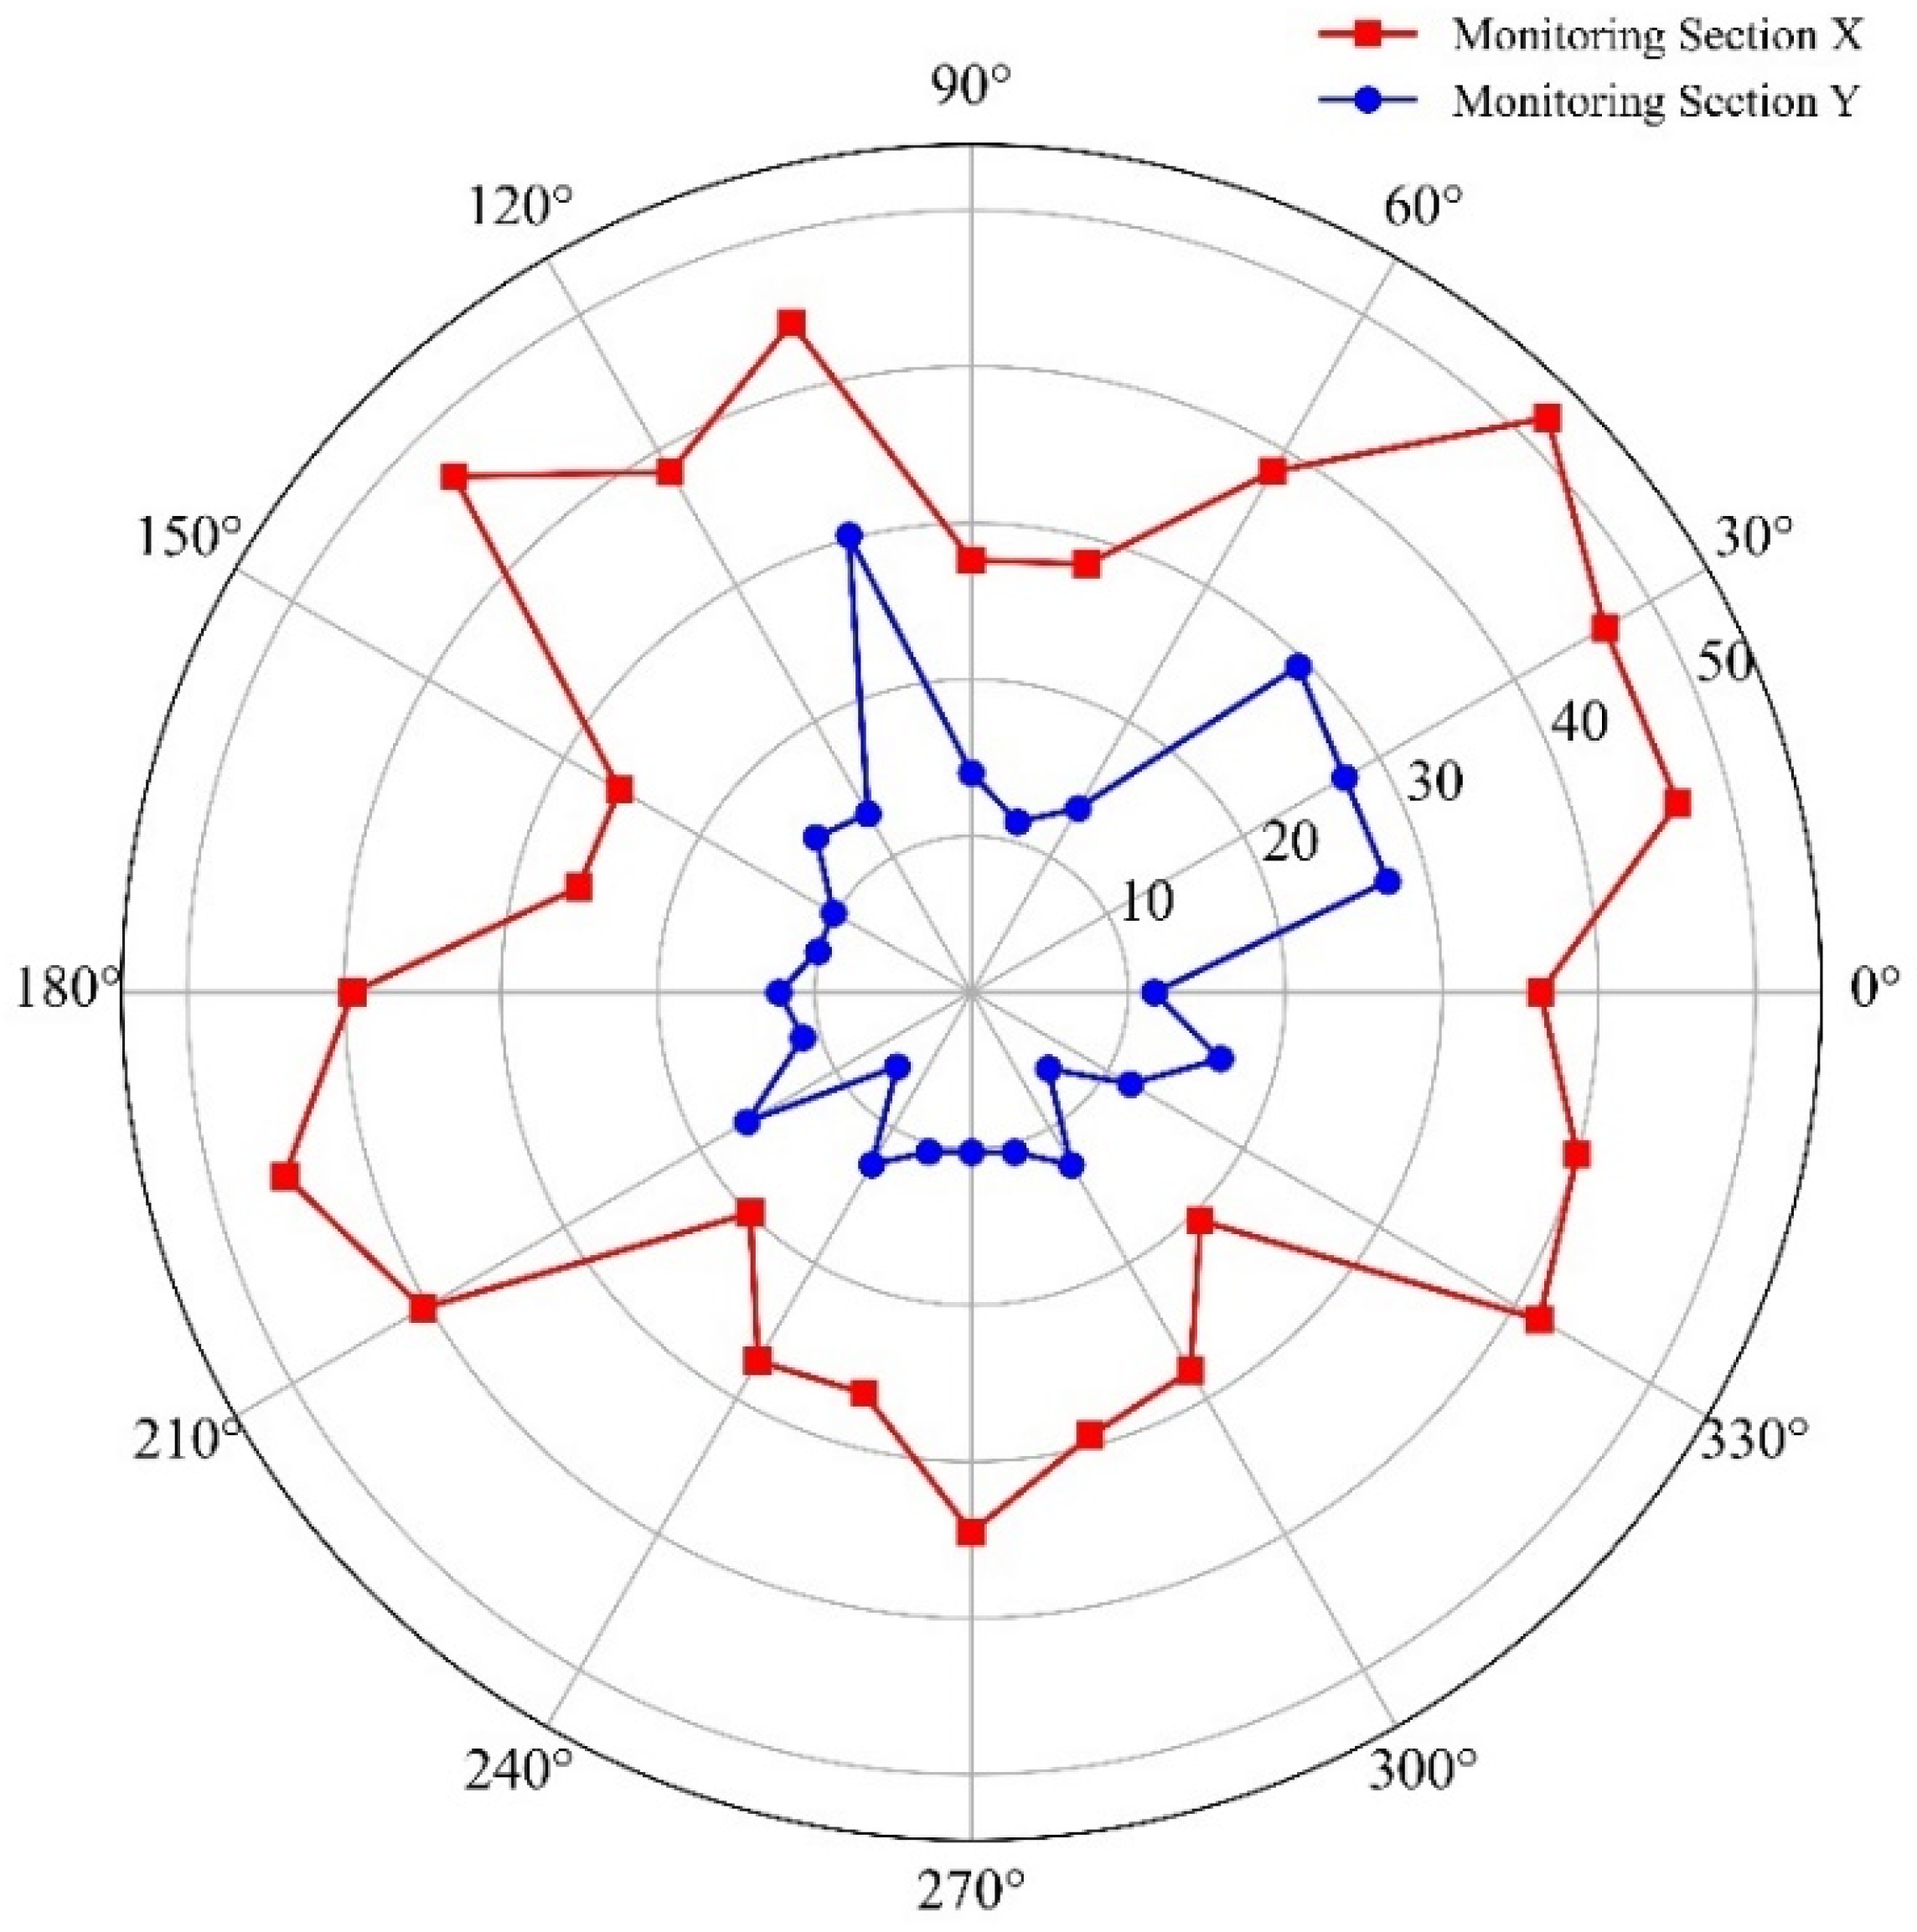
5.2. Analysis of Rockburst Risk Assessment for the Deep-Buried Roadway Crossing Stratigraphic Boundary

Rockburst is a sudden geological disaster influenced by multiple factors and characterized by randomness and complexity. First, evaluating the risk of rockburst requires assessing the rockburst potential, i.e., the internal causes of rockburst occurrence. Rockburst potential is defined as the tendency and intensity of a rock to experience rockburst under specific geological and mechanical conditions [28]. To quantitatively evaluate rockburst potential, brittleness and energy indexes were introduced in the previous section to assess the intrinsic properties of rocks that tend to induce rockburst under certain conditions, based on an understanding of their mechanical behavior. However, rocks with high rockburst potential are still subject to external factors in the field, and predicting rockburst in engineering practice solely based on potential evaluation is inappropriate. With the long-term development of geo-stress measurement and numerical simulation technologies, many researchers have achieved qualitative and quantitative predictions of the location and intensity of rockburst by combining numerical simulation and field measurement [8]. Rockburst is mainly due to variations in geo-stress caused by deep rock excavation, so many researchers have proposed numerical evaluation indexes of rockburst risk through the relationship between the stress environment and rock strength, and the main forms are σθ/σc (Russenes criterion), σc/σ1 (Barton criterion), (σθ + σl)/σc (Turchaninov criterion) and their similar expressions [9,10]. These indexes reflect that a corresponding rockburst level is likely to occur when the applied stress approaches or exceeds the rock strength threshold. While some expressions are structurally similar, their threshold values for predicting different levels of rockburst may vary. This variation is primarily because the critical values of these indexes are often derived from empirical data in specific engineering contexts or industries [9]. Therefore, appropriate calibration is necessary for practical engineering applications, based on actual rockburst cases observed on site. Castro et al. considered the effect of deviatoric stress and proposed the Brittle Shear Rate (BSR) index to evaluate the rockburst risk [26]; the expression of BSR is shown in (12). Vennes et al. [35] based their calculation on the BSR to evaluate the effect of large-scale destress blasting on the release effect of the mining area.
B S R = σ 1 - σ 3 σ c = > 0.7 Serious   Rockburst 0.6 ~ 0.7 Moderate   Rockburst   0.45 ~ 0.6 Light   Rockburst 0.35 ~ 0.45 No   Rockburst
Evaluate the applicability of rockburst risk indexes and their value ranges of values based on those proposed by many scholars through the stress–intensity relationship. In the rockburst risk assessment of the Huize lead–zinc mine, it was found that the Barton criterion significantly overestimates the likelihood of rockburst occurrence at the site. The Russenes criterion, which is expressed in terms of tangential and radial stresses in the surrounding rock, is difficult to implement in numerical simulations due to the requirement for coordinate transformation [36]. The BSR index, proposed by Castro, was found to more accurately describe the rockburst characteristics at this site. Based on the applicability analysis of the rockburst criteria, the BSR index is selected as the preferred indicator for rockburst risk assessment at this location. The FISH function in the 3DEC software was used for secondary development to enable BSR visualization. Figure 16 shows the results of the rockburst risk assessment in different formations after roadway excavation.
According to the BSR index contour results, when the roadway crosses the C1d formation, the maximum BSR value reaches 0.50 at approximately 3 m from the arch top and arch bottom of the roadway, indicating a slight rockburst risk. The BSR value at the arch bottom is higher than at the arch top, implying a greater likelihood of rockburst in that location. This corresponds with site observations and worker descriptions in the 1104 section northeast of the vein near the 14# exploration line, where a slight rockburst occurred: a brittle cracking sound was heard from the roadway roof, but no rock mass was ejected. When the roadway transitions from the C1d formation to the D3zg formation, the BSR index peaks near the stratigraphic boundary (close to the D3zg side), reaching a maximum value of 0.551, which also corresponds to a slight rockburst risk. Figure 17 shows rupture features observed in the rock mass near the stratigraphic boundary, which agree well with the numerical simulation results, indicating that the BSR index is a reliable predictor of rockburst risk. The likelihood of rockburst decreases as the roadway moves further away from the stratigraphic boundary within the D3zg formation. Comparing the BSR index contour maps for the C1d and D3zg formations, the larger BSR values in the harder D3zg formation are concentrated closer to the excavation surface, whereas in the softer C1d formation, the higher BSR values are distributed further from the excavation surface. Based on the BSR index distribution, the rockburst risk in the D3zg formation is more severe than that in the C1d formation, mainly due to the proximity of high-risk zones to the excavation surface. The rockburst risk assessment results provide guidance for field construction, allowing timely implementation of support measures at locations with elevated rockburst risk. Figure 18 shows a comparison of the roadway before and after the application of timely support measures.
To evaluate the influence of different excavation directions on the rockburst risk of the surrounding rock, a geological model simulating excavation from the D3zg formation (relatively hard rock) to the C1d formation (relatively soft rock) was constructed, based on possible field construction conditions, while keeping all other parameters identical to the previous model. The simulation results of the rockburst risk assessment for different excavation directions are shown in Figure 19. When the roadway is excavated from the D3zg formation to the C1d formation, the maximum BSR index at the stratigraphic boundary reaches 0.619, indicating a moderate rockburst risk. Compared with excavation from the C1d formation to the D3zg formation, the zones with the highest rockburst risk in both scenarios are located near the stratigraphic boundary adjacent to the harder rock formation. Additionally, the rockburst risk is higher when excavating from harder rock into softer rock than in the reverse direction. Based on the combined results of numerical simulation and field observations, special attention should be given to evaluating the rockburst risk near stratigraphic boundaries when the excavation traverses formations with different lithologies. Corresponding rockburst prevention and control measures should be implemented when necessary during the construction process.

6. Conclusions

Firstly, based on the rock mechanics laboratory test results, the brittleness index and energy index were used to qualitatively analyze and evaluate the rockburst potential of different stratigraphic lithologies. Secondly, a three-dimensional discrete element method was applied to model and analyze the excavation process of the deep-buried roadway traversing multi-stratigraphic tectonics, using the developing entry near the 14# exploration line in the middle section of 1104 of the Huize lead–zinc mine as the engineering background, in order to investigate the mechanical behavior of the surrounding rock during roadway excavation and to assess the degree of rockburst risk. The main findings are as follows:
(1)
Based on the results of the rock mechanics laboratory tests, and combined with the brittleness index and the maximum stored elastic strain energy index criteria, it was found that the D3zg formation (dolomite) is prone to slight to moderate rockburst, while the C1d formation (limestone) is prone to slight rockburst. From the perspective of internal causative factors, both formations possess rockburst potential.
(2)
Differences in the distribution characteristics of the surrounding rock stress field were observed when the roadway crossed different formations. In the C1d formation, the stress release zone is larger, the stress concentration zone is located farther from the excavation surface, and the degree of stress accumulation is relatively low. In contrast, in the D3zg formation, the stress release zone is smaller, the stress concentration zone is closer to the excavation surface, and the degree of stress accumulation is relatively high. Additionally, when the roadway crosses the stratigraphic boundary, an abnormal stress zone forms in the lower plate (the relatively harder formation), primarily concentrated near the vault. This stress abnormal zone provides favorable external conditions for energy accumulation, thus increasing the likelihood of rockburst disasters.
(3)
The surrounding rock displacement is significantly affected by lithological differences, particularly in formations with a low elastic modulus. Furthermore, the displacement in the high-modulus rock near the stratigraphic boundary is greater than in other locations within the same formation. This may be attributed to the larger displacement of the lower-modulus rock squeezing the harder rock, a phenomenon particularly evident near the vault.
(4)
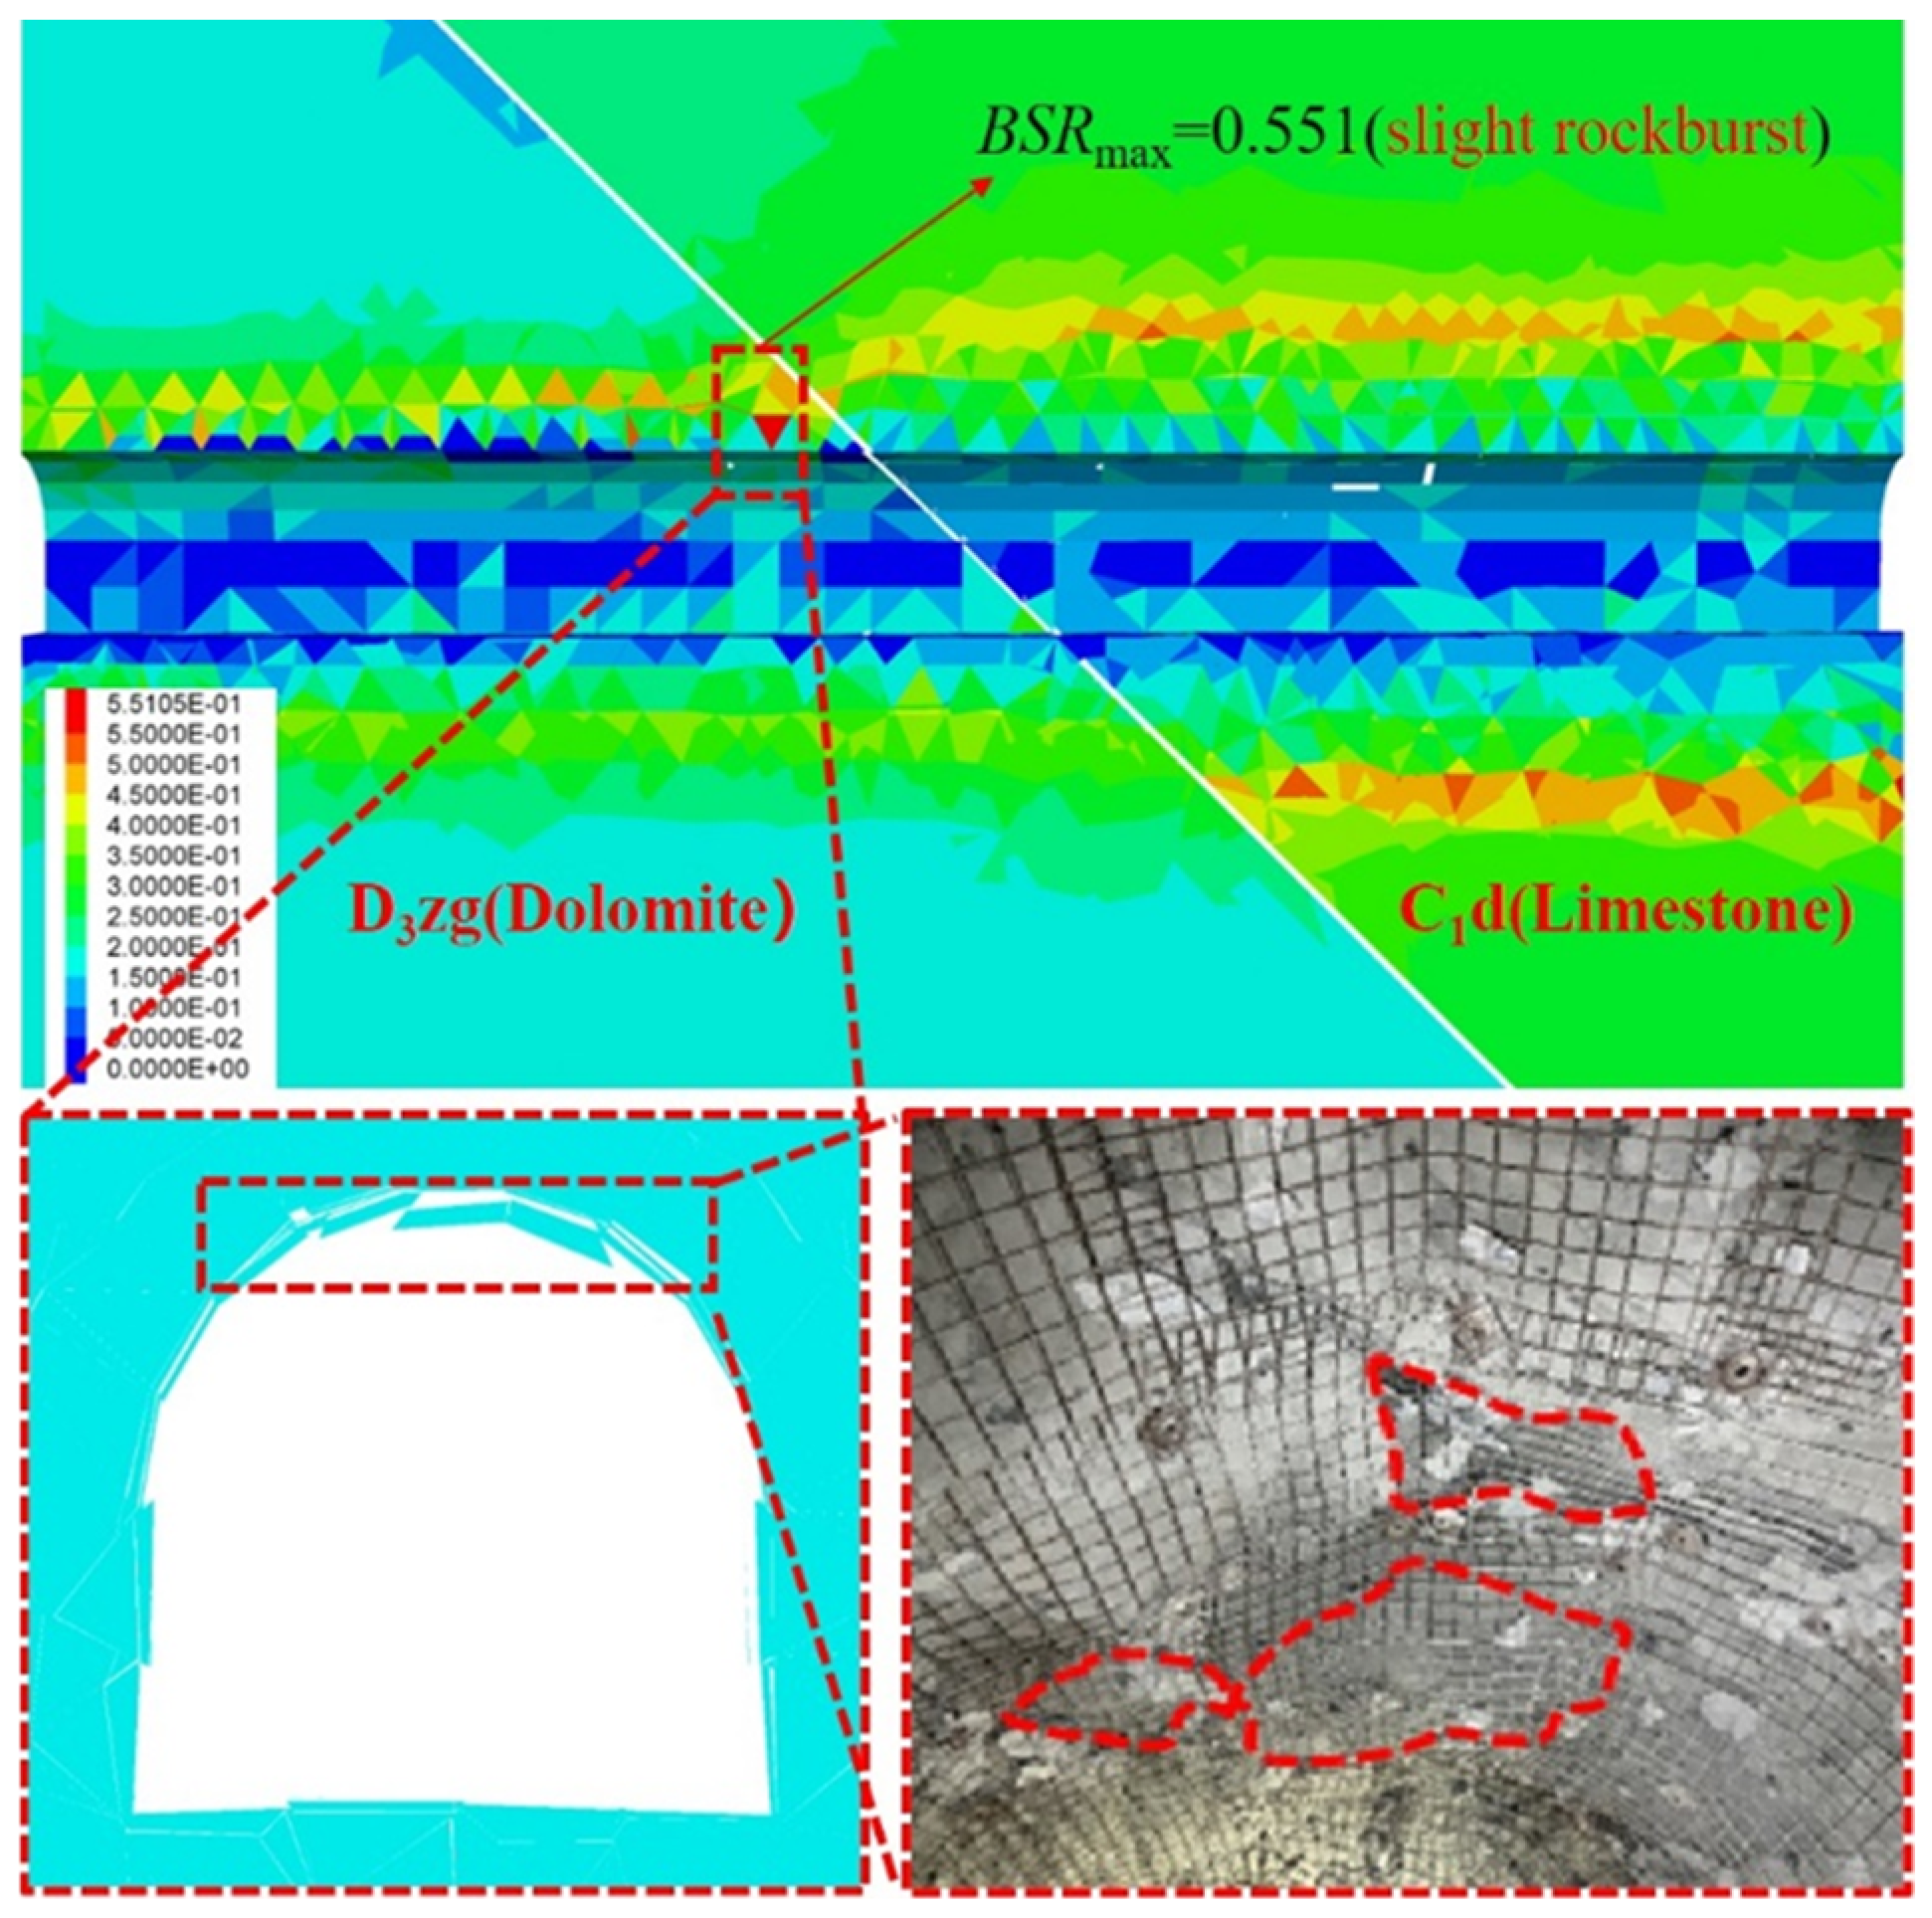
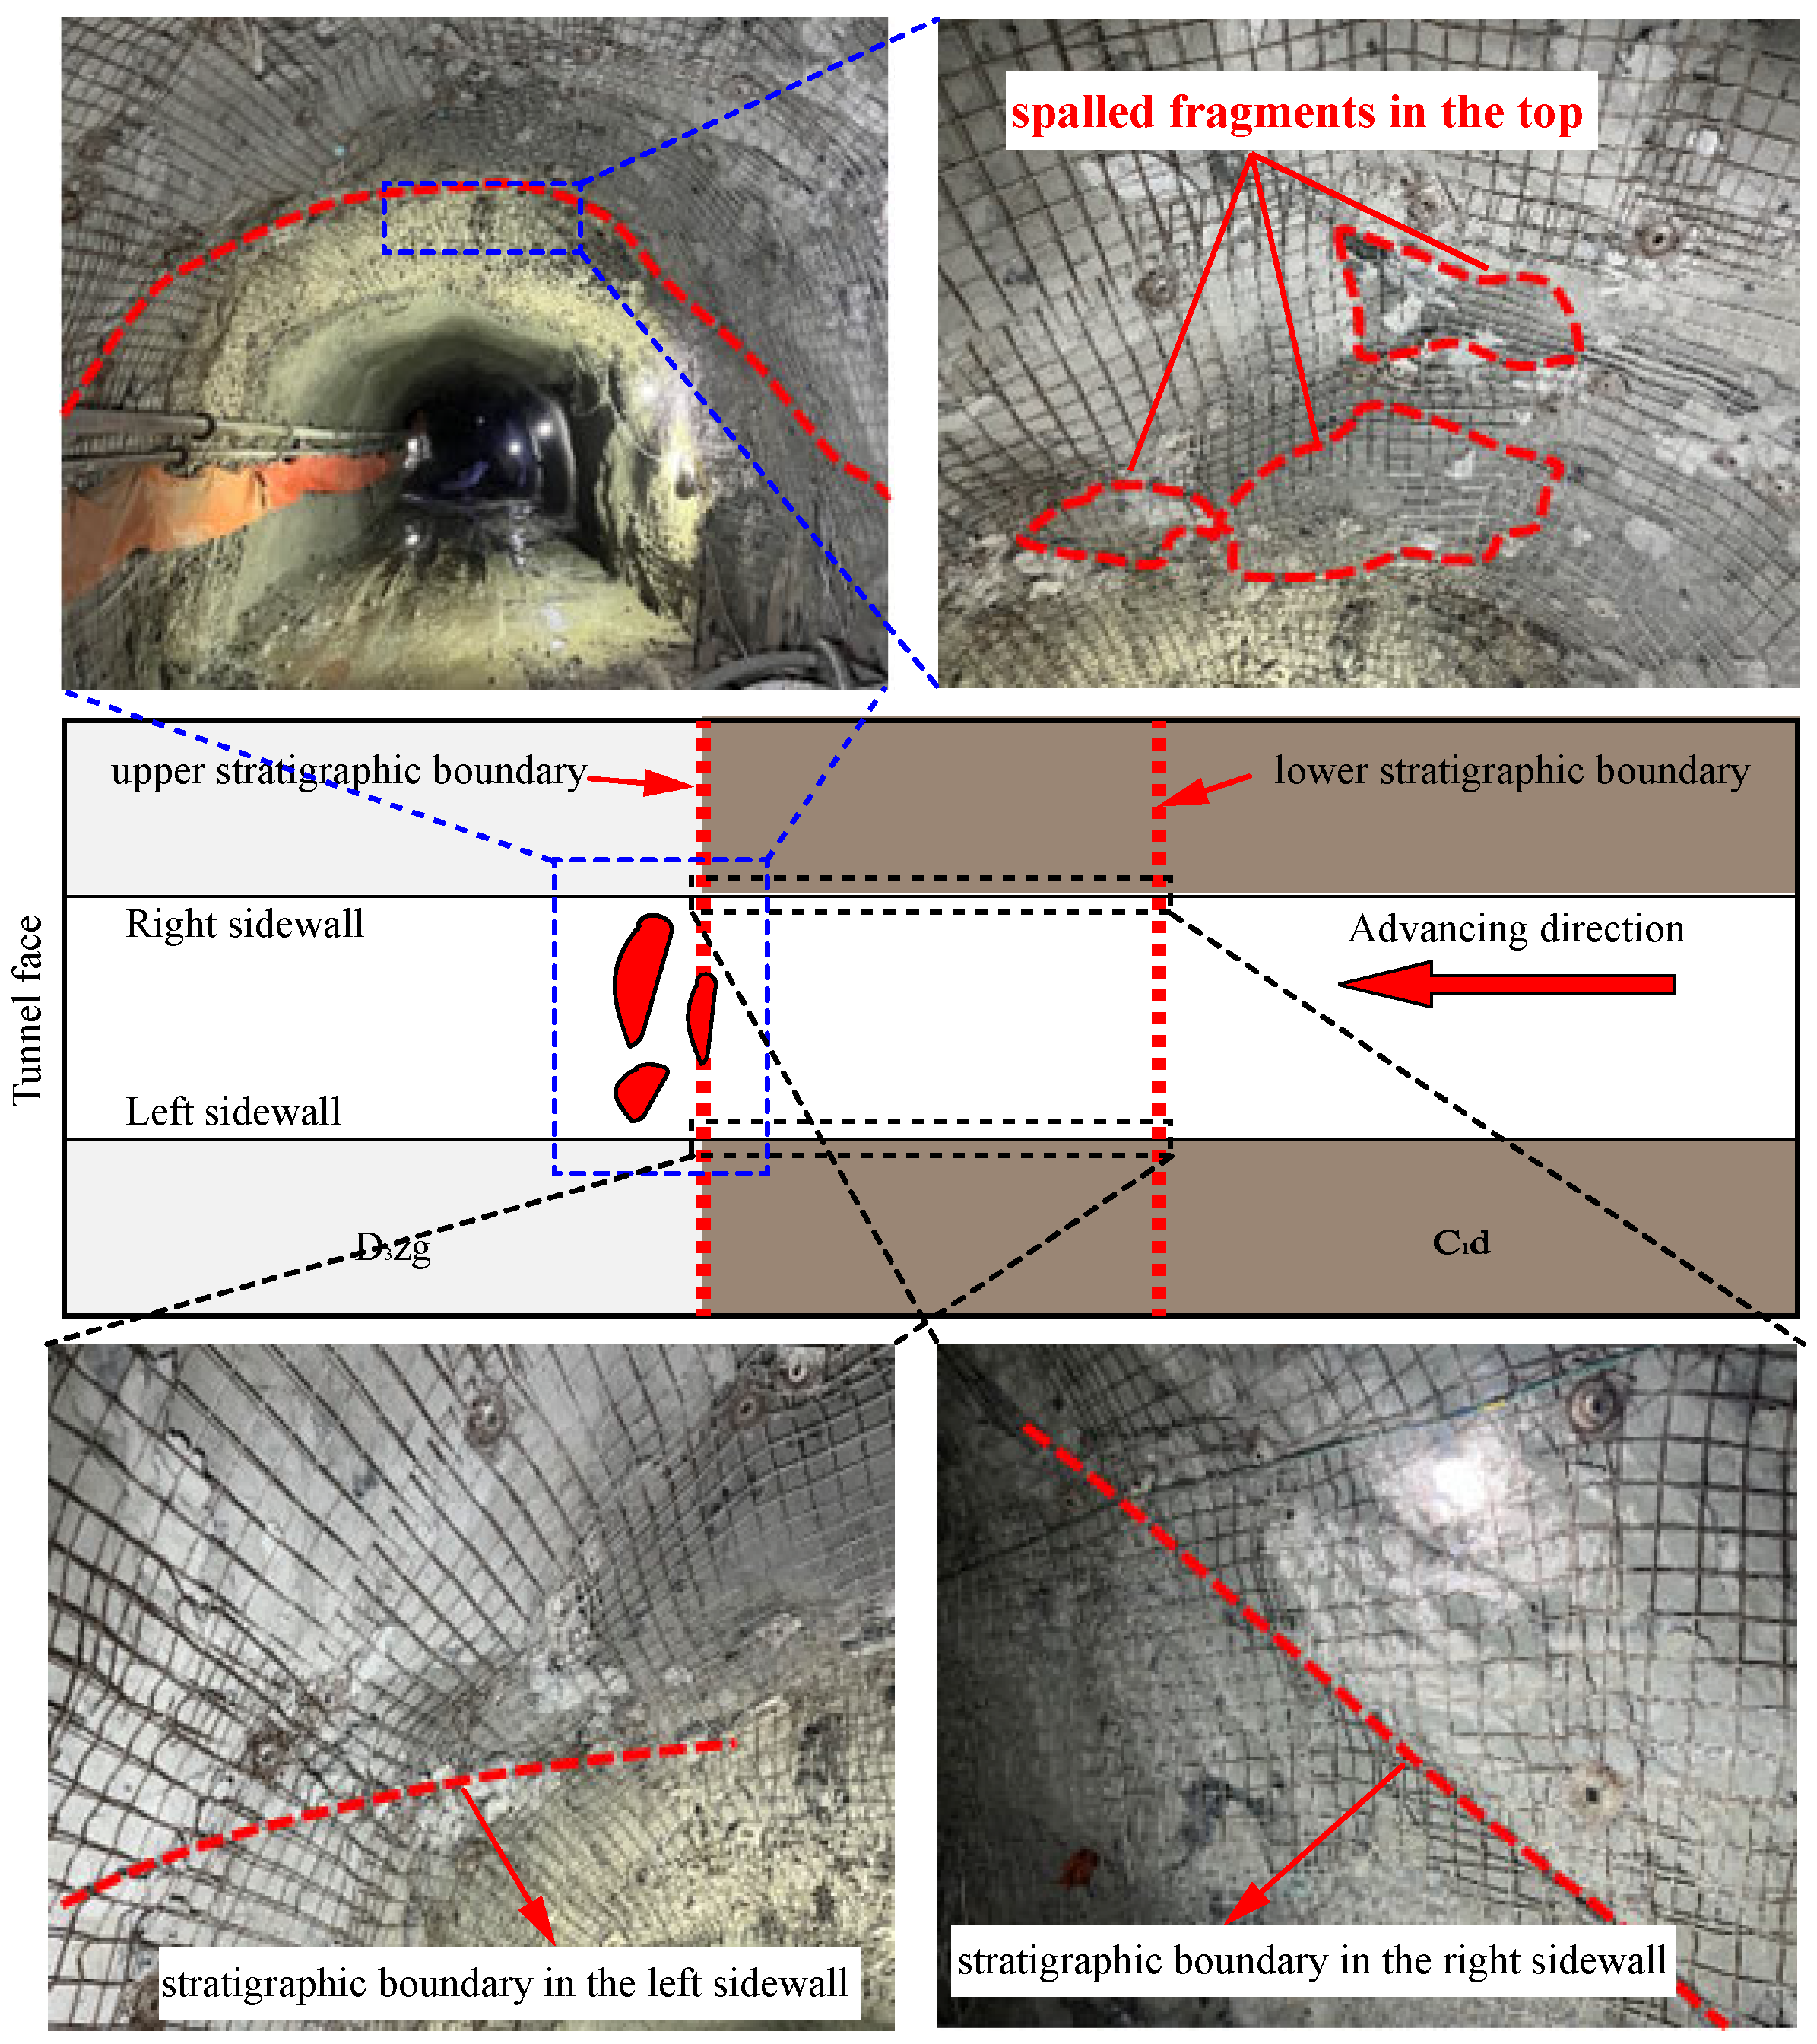
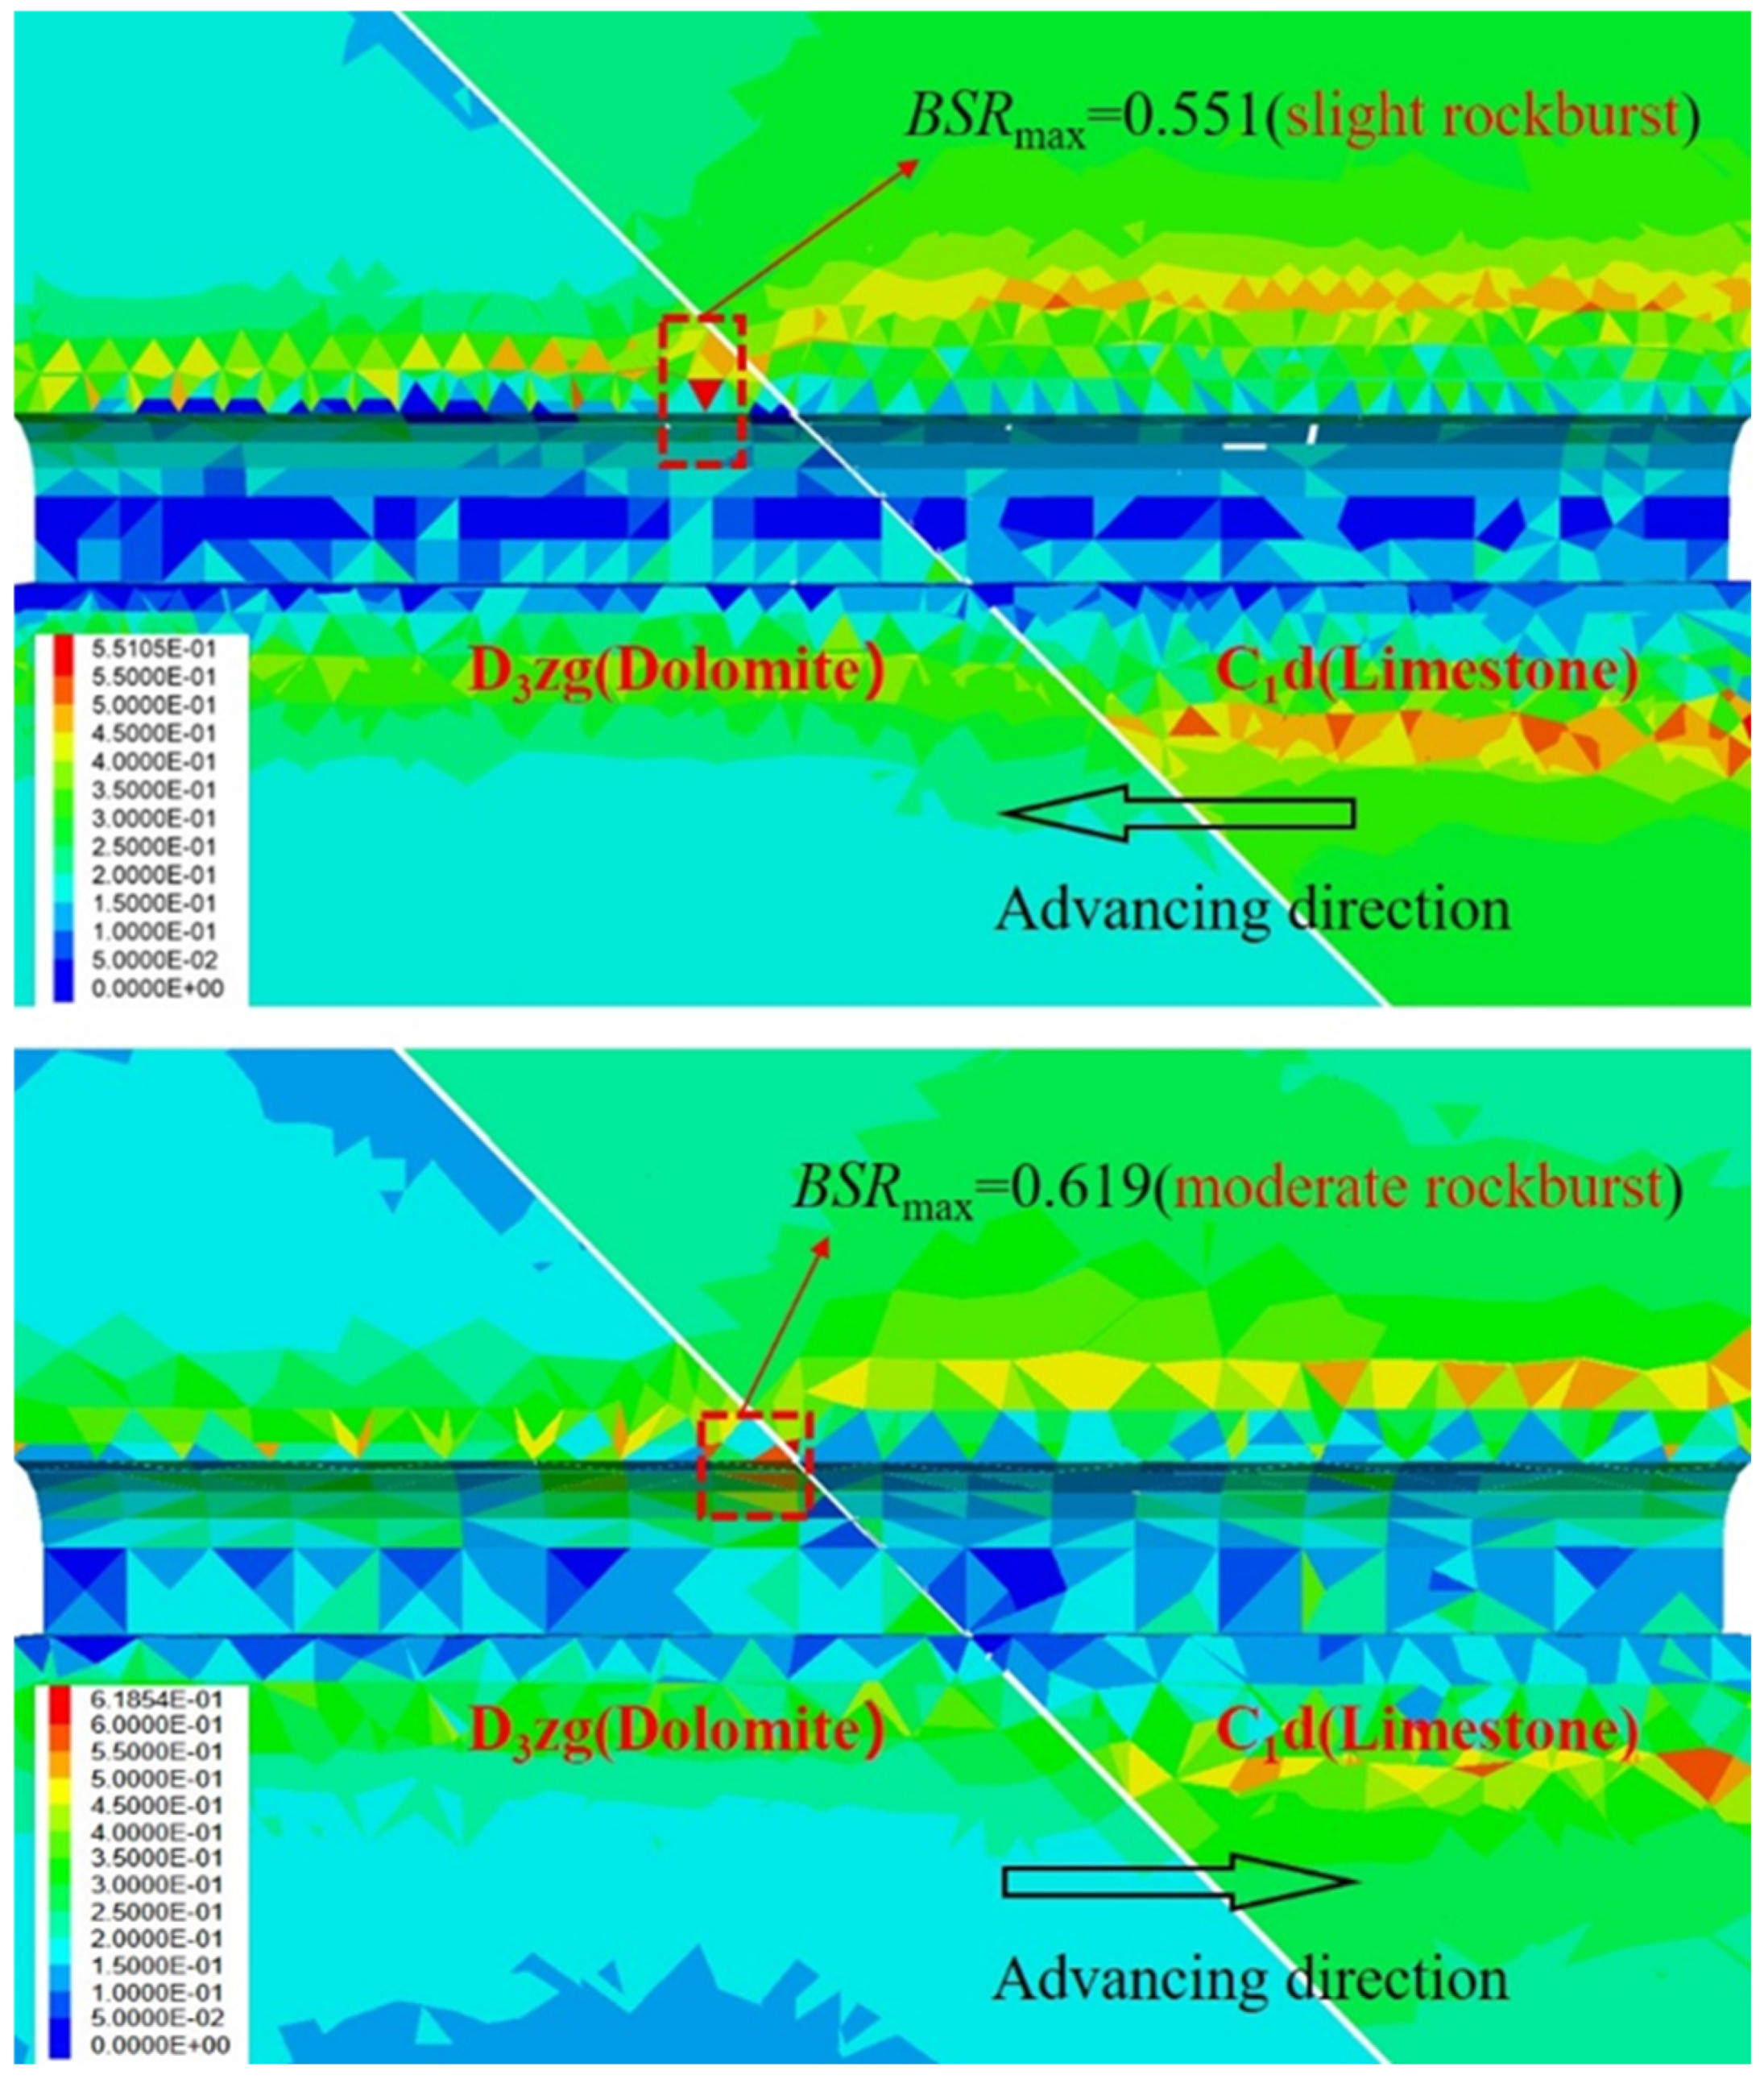
When the roadway is located in the C1d formation, larger BSR values are distributed farther from the excavation surface. In the D3zg formation, larger BSR values appear closer to the excavation face, indicating a higher rockburst risk in the D3zg formation compared to the C1d formation. In the scenario where the roadway is excavated from the C1d formation to the D3zg formation, the BSR index peaks near the arch top adjacent to the stratigraphic boundary (close to the D3zg formation), reaching a maximum of 0.551, which corresponds to a slight rockburst risk. However, when the excavation direction is reversed (from D3zg to C1d), the BSR index peaks at 0.619, indicating a moderate rockburst risk, which is higher in magnitude. These simulation results demonstrate that the direction of roadway excavation affects the level of rockburst risk, especially when crossing multi-stratigraphic tectonic zones with differing lithologies.

Author Contributions

S.W. contributed to writing—review and editing, resources, supervision, and funding acquisition. L.X. and S.H. was involved in conceptualization, methodology, data curation, software, writing—original draft preparation. C.C. helped in writing—review and editing, supervision, and data curation. G.Z. helped in writing—review and editing, supervision, and data curation. All authors have read and agreed to the published version of the manuscript.

Funding

This work was funded by the National Natural Science Foundation of China (51934003), Yunnan Innovation Team (202105AE160023), Yunnan Major Scientific and Technological Projects (202202AG050014, 202102AF080001), S&T Innovation and Development Project of Information Institution of Ministry of Emergency Management (2024502), Key Laboratory of Geohazard Forecast and Geoecological Restoration in Plateau Mountainous Area, Ministry of Natural Resources of the People’s Republic of China, and Yunnan Key Laboratory of Geohazard Forecast and Geoecological Restoration in Plateau Mountainous Area. The authors are grateful for this financial support.

Institutional Review Board Statement

Not applicable.

Informed Consent Statement

Not applicable.

Data Availability Statement

The original contributions presented in this study are included in the article. Further inquiries can be directed to the corresponding authors.

Acknowledgments

We appreciate the support and assistance provided by Huize Lead Zinc Mine during the research process.

Conflicts of Interest

The authors declare no conflicts of interest.

References

  1. He, M.; Cheng, T.; Qiao, Y.; Li, H. A review of rockburst: Experiments, theories, and simulations. J. Rock Mech. Geotech. Eng. 2023, 15, 1312–1353. [Google Scholar] [CrossRef]
  2. Su, G.; Li, P.; Xu, H.; Liu, X. A two-step method for predicting rockburst using sound signals. Acta Geotech. 2023, 19, 273–303. [Google Scholar] [CrossRef]
  3. Feng, X.T.; Xiao, Y.X.; Feng, G.L.; Yao, Z.B.; Chen, B.R.; Yang, C.X.; Su, G.S. Study on the development process of rockbursts. Chin. J. Rock Mech. Eng. 2019, 38, 649–673. [Google Scholar]
  4. Yu, Q. Study on Rockburst Nucleation Process and Early Warning Method of Deep-Buried Tnnels. Ph.D. Thesis, Dalian University of Technology, Dalian, China, 2016. [Google Scholar]
  5. Jiang, F.F.; Zhou, H.; Liu, C.; Sheng, J. Progress, prediction and prevention of rockbursts in underground metal mines. Chin. J. Rock Mech. Eng. 2019, 38, 956–972. [Google Scholar]
  6. Askaripour, M.; Saeidi, A.; Rouleau, A.; Mercier-Langevin, P. Rockburst in underground excavations: A review of mechanism, classification, and prediction methods. Undergr. Space 2022, 7, 577–607. [Google Scholar] [CrossRef]
  7. Li, P.; Chen, B.; Zhou, Y.; Xiao, Y.; Feng, G.; Zhu, G. Research progress of rockburst prediction and early warning in hard rock underground engineering. J. China Coal Soc. 2019, 44, 447–465. [Google Scholar]
  8. Wang, J.; Apel, D.B.; Pu, Y.; Hall, R.; Wei, C.; Sepehri, M. Numerical modeling for rockbursts: A state-of-the-art review. J. Rock Mech. Geotech. Eng. 2021, 13, 457–478. [Google Scholar] [CrossRef]
  9. Zhou, J.; Li, X.; Mitri, H.S. Evaluation method of rockburst: State-of-the-art literature review. Tunn. Undergr. Space Technol. 2018, 81, 632–659. [Google Scholar] [CrossRef]
  10. Liang, W.Z.; Zhao, G.Y. A review of long-term and short-term rockburst risk evaluations in deep hard rock. Chin. J. Rock Mech. Eng. 2022, 41, 19–39. [Google Scholar]
  11. Kusui, A.; Villaescusa, E.; Funatsu, T. Mechanical behaviour of scaled-down unsupported tunnel walls in hard rock under high stress. Tunn. Undergr. Space Technol. 2016, 60, 30–40. [Google Scholar] [CrossRef]
  12. Zhang, C.Q.; Zhou, H.; Feng, X.T. An Index for Estimating the Stability of Brittle Surrounding Rock Mass: FAI and its Engineering Application. Rock Mech. Rock Eng. 2011, 44, 401–414. [Google Scholar] [CrossRef]
  13. Zhang, C.Q.; Feng, X.T.; Zhou, H.; Qiu, S.L.; Wu, W.P. Rockmass damage development following two extremely intense rockbursts in deep tunnels at Jinping II hydropower station, southwestern China. Bull. Eng. Geol. Environ. 2013, 72, 237–247. [Google Scholar] [CrossRef]
  14. Wang, Z.; Dou, L.; Li, J.; Kang, K.; Feng, L. Numerical investigation of damage risks of roadway surrounding rocks under oblique incident dynamic loads. Shock. Vib. 2017, 2017, 6298372. [Google Scholar] [CrossRef]
  15. Guo, C.B.; Zhang, Y.S.; Jiang, L.W.; Sun, D.S.; Xiong, T.Y.; Du, Y.B.; Zheng, G. Research on rockburst mechanism and profile suitability of deep-buried tunnel in fold structure body. Chin. J. Rock Mech. Eng. 2012, 31, 2758–2766. [Google Scholar]
  16. Yang, J.; Chen, W.; Tan, X.; Yang, D. Analytical estimation of stress distribution in interbedded layers and its implication to rockburst in strong layer. Tunn. Undergr. Space Technol. 2017, 81, 289–295. [Google Scholar] [CrossRef]
  17. Cai, M.F. Prediction and prevention of rockburst in metal mines—A case study of Sanshandao gold mine. J. Rock Mech. Geotech. Eng. 2016, 8, 204–211. [Google Scholar] [CrossRef]
  18. Cai, M.F.; Ji, D.; Guo, Q.F. Study of rockburst prediction based on in-situ stress measurement and theory of energy accumulation caused by mining disturbance. Chin. J. Rock Mech. Eng. 2013, 32, 1973–1980. [Google Scholar]
  19. Sepehri, M. Finite Element Analysis Model for Determination of In-Situ and Mining Induced Stresses as a Function of Two different Mining Methods Used at Diavik Diamond Mine. Ph.D. Thesis, University of Alberta, Edmonton, AL, Canada, 2016. [Google Scholar]
  20. Sepehri, M.; Apel, D.B.; Adeeb, S.; Leveille, P.; Hall, R.A. Evaluation of mining-induced energy and rockburst prediction at a diamond mine in Canada using a full 3D elastoplastic finite element model. Eng. Geol. 2020, 266, 105457. [Google Scholar] [CrossRef]
  21. Ma, Y.; Liu, C.; Wu, F.; Li, X.; Glowacz, A. Rockburst Characteristics and Mechanisms during Steeply Inclined Thin Veins Mining: A Case Study in Zhazixi Antimony Mine, China. Shock. Vib. 2018, 2018, 1–16. [Google Scholar] [CrossRef]
  22. Wang, J.-A.; Park, H.D. Comprehensive prediction of rockburst based on analysis of strain energy in rocks. Tunn. Undergr. Space Technol. 2001, 16, 49–57. [Google Scholar] [CrossRef]
  23. Weng, L.; Huang, L.; Taheri, A.; Li, X. Rockburst characteristics and numerical simulation based on a strain energy density index: A case study of a roadway in Linglong gold mine, China. Tunn. Undergr. Space Technol. 2017, 69, 223–232. [Google Scholar] [CrossRef]
  24. Xu, J.; Jiang, J.; Xu, N.; Liu, Q.; Gao, Y. A new energy index for evaluating the tendency of rockburst and its engineering application. Eng. Geol. 2017, 230, 46–54. [Google Scholar] [CrossRef]
  25. Zhu, B.; Fan, J.; Shi, X.; Liu, P.; Guo, J. Study on rockburst proneness of deep tunnel under different geo-stress conditions based on DEM. Geotech. Geol. Eng. 2022, 40, 1373–1386. [Google Scholar] [CrossRef]
  26. Xue, Y.; Cao, Z.; Du, F.; Zhu, L. The influence of the backfilling roadway driving sequence on the rockburst risk of a coal pillar based on an energy density criterion. Sustainability 2018, 10, 2609. [Google Scholar] [CrossRef]
  27. Luo, P.; Fang, X.; Li, D.; Yu, Y.; Li, H.; Cui, P.; Ma, J. Evaluation of excavation method on point load strength of rocks with poor geological conditions in a deep metal mine. Geomech. Geophys. Geo-Energy Geo-Resour. 2023, 9, 90. [Google Scholar] [CrossRef]
  28. Zhang, C.Q.; Lu, J.J.; Chen, J.; Zhou, H.; Yang, F.J. Discussion on rock burst proneness indexes and their relation. Rock Soil Mech. 2017, 38, 1397–1404. [Google Scholar]
  29. Xia, Z.Y. Study on Instability Mechanism and Prevention Measure of Extraction Structure in Block Caving Mine. Ph.D. Thesis, University of Science and Technology Beijing, Beijing China, 2021. [Google Scholar]
  30. Hoek, E.; Diederichs, M.S. Empirical estimation of rock mass modulus. Int. J. Rock Mech. Min. Sci. 2006, 43, 203–215. [Google Scholar] [CrossRef]
  31. Hoek, E.; Carranza-Torres, C.; Corkum, B. Hoek-Brown failure criterion–2002 Edition. In Proceedings of the Fifth North American Rock Mechanics Symposium, Toronto, ON, Canada, 7–10 July 2002; Volume 1, pp. 267–273. [Google Scholar]
  32. Gao, Y.H. Study on Determining Representative Elementary Volume of Equivalent Rock Mass and the Mechanical Behavior of Joints. Ph.D. Thesis, University of Science and Technology Beijing, Beijing, China, 2015. [Google Scholar]
  33. Sun, X.; Li, G.; Zhao, C.; Liu, Y.; Miao, C. Investigation of Deep Mine Shaft Stability in Alternating Hard and Soft Rock Strata Using Three-Dimensional Numerical Modeling. Processes 2018, 7, 2. [Google Scholar] [CrossRef]
  34. Sakhno, I.; Sakhno, S.; Isaienkov, O.; Petrenko, A. Research on influence of stress-strain evolution in immediate floor before and after excavation face on origin floor heave in coal mines roadways. IOP Conf. Ser.: Earth Environ. Sci. 2024, 145, 012026. [Google Scholar] [CrossRef]
  35. Vennes, I.; Mitri, H. Geomechanical effects of stress shadow created by large-scale destress blasting. J. Rock Mech. Geotech. Eng. 2017, 9, 1085–1093. [Google Scholar] [CrossRef]
  36. Xu, B.; Xie, H.P.; Tu, Y.J. Numerical simulation of rockburst stress state during excavation of underground powerhouse of pubugou hydropower station. Chin. J. Rock Mech. Eng. 2017, 26, 2894–2900. [Google Scholar]
Figure 1. The rockburst risk assessment flowchart.
Applsci 15 07026 g001
Figure 2. Location diagram of Huize lead–zinc mine.
Applsci 15 07026 g002
Figure 3. Longitudinal profile of the geological structure of Huize lead–zinc mine [27].
Applsci 15 07026 g003
Figure 4. Longitudinal profile of the geological structure in the study area (provided by CINF Engineering Co., Ltd. (Changsha, China) and modified and redrawn according to Luo et al. [27]).
Applsci 15 07026 g004
Figure 5. On-site coring photographs.
Applsci 15 07026 g005
Figure 6. Failure photos after partial uniaxial compression test.
Applsci 15 07026 g006
Figure 7. Failure photos after partial Brazilian split test.
Applsci 15 07026 g007
Figure 8. Schematic diagram of the actual working condition and numerical model establishment.
Applsci 15 07026 g008
Figure 9. Schematic diagram of in situ stress distribution.
Applsci 15 07026 g009
Figure 10. Schematic diagram of the numerical simulation of the excavation and monitoring scheme.
Applsci 15 07026 g010
Figure 11. Distribution and evolution of surrounding rock stress field (unit: Pa).
Applsci 15 07026 g011
Figure 12. Distribution curve of the secondary stress field in the vault at different monitoring sections.
Applsci 15 07026 g012
Figure 13. Stress Concentration Degree of the monitoring characteristic points at different distances.
Applsci 15 07026 g013
Figure 14. Displacement curves of characteristic monitoring points of surrounding rock at different locations.
Applsci 15 07026 g014
Figure 15. Radar map of surrounding rock displacement distribution at different monitoring sections (unit: mm).
Applsci 15 07026 g015
Figure 16. Contour of BSR index distribution after completion of excavation.
Applsci 15 07026 g016
Figure 17. Field geological structure and signs of rupture characteristics.
Applsci 15 07026 g017
Figure 18. Before and after support of the deep-buried roadway: (a) before support; (b) after support.
Applsci 15 07026 g018
Figure 19. Comparison of rockburst risk assessment results for surrounding rock in different excavation directions.
Applsci 15 07026 g019
Table 1. Uniaxial compression test and deformation test results statistical table.
LithologySample NumberDiameter (mm)Height (mm)Peak Load (kN)UCS
(MPa)
E
(GPa)
Poisson
DolomiteBY-148.50100.10208.10112.4662.100.42
BY-248.50100.10164.1088.6856.960.34
BY-348.5099.90126.7868.5054.260.26
BY-448.7399.97213.83114.4862.790.38
BY-548.9299.84187.9899.8759.040.29
Average 96.8059.030.34
LimestoneHY-148.70100.0084.3353.5934.470.40
HY-248.70100.2096.1259.4841.570.23
HY-348.60100.00139.7078.0239.830.32
HY-448.69100.34164.7360.5237.770.24
HY-547.19100.24178.6255.3432.840.28
Average 61.3937.300.29
Note: UCS indicates uniaxial compressive strength; E indicates elastic modulus.
Table 2. Brazilian splitting test results statistical table.
LithologySample NumberDiameter (mm)Height (mm)Peak Load (kN)UTS (MPa)
DolomiteBY-649.9024.7012.126.26
BY-749.9525.029.614.90
BY-849.9024.908.604.41
BY-950.1324.7512.916.62
BY-1048.3024.9013.387.03
Average 5.85
LimestoneHY-650.0224.819.835.04
HY-747.1425.0310.835.84
HY-849.6125.0210.885.58
HY-949.6224.9711.655.99
HY-1048.6224.987.844.11
Average 5.31
Note: UTS indicates uniaxial tensile strength.
Table 3. Evaluation of rockburst potential of different stratigraphic lithologies.
Rockburst Potential CriterionLithologyBrittleness Index Criterion
ExpressionValueRockburst
Classification
Brittleness index criterion [28]D3zg U C S U T S = < 7 . 2           No   Rockburst 7 . 2 ~ 16 . 5       Light   Rockburst   16 . 5 ~ 22 . 5   Moderate   Rockburst > 22 . 5                 Serious   Rockburst 16.55Moderate
C1d11.56Light
Maximum stored elastic strain energy index
ExpressionValueRockburst
classification
Energy index criteria [10]D3zg U C S 2 2 E = < 40                 No   Rockburst 40 ~ 100       Light   Rockburst   100 ~ 200   Moderate   Rockburst > 200               Serious   Rockburst 79.37Light
C1d50.52Light
Table 4. Statistical table of mechanical parameters of the rock mass after reduction.
LithologyIntact RockGSIHoek–Brown Parameters Rock Mass
UCS
(MPa)
E
(GPa)
mimbsaDUCSrm
(MPa)
Erm
(GPa)
D3zg96.8059.0365121.7540.00630.5020.77.5915.67
C1d61.3937.3055100.8440.00150.5040.72.295.51
Table 5. Summary of rock mass parameters in numerical modelling.
LithologyBlock PropertiesContact Properties
Density
(kg/m3)
K
(GPa)
G
(GPa)
Cb
(MPa)
φbσbt
(MPa)
Kn
(GPa
/m)
Ks
(GPa
/m)
Cb
(MPa)
φcσct
(MPa)
C1d27394.372.142.3025.520.11239.095.60.30250.10
D3zg272916.325.853.7734.790.35828.3331.30.95300.30
Disclaimer/Publisher’s Note: The statements, opinions and data contained in all publications are solely those of the individual author(s) and contributor(s) and not of MDPI and/or the editor(s). MDPI and/or the editor(s) disclaim responsibility for any injury to people or property resulting from any ideas, methods, instructions or products referred to in the content.

