Abstract
Digital data protection is crucial to prevent unauthorized modifications and tampering. A secure, reliable, and efficient encryption technique is needed to safeguard digital images. This paper proposes a novel MS Circle Map-based image encryption algorithm, integrating chaotic dynamics for enhanced security. The encryption process begins by transforming the plain image matrix into a row vector. A secret key is then used as the initial condition for the MS Circle Map to generate a chaotic keystream. The encryption is performed through pixel diffusion using an XOR operation between the pixel intensity vector and the keystream, ensuring high randomness. The proposed method features a large key space, high key sensitivity, and strong resistance to brute force, statistical, and differential attacks. Performance evaluation through key space analysis, initial value sensitivity, entropy, correlation coefficient, NPCR, and UACI shows that the encrypted image using MS Circle Map has strong security properties. Meanwhile, the quality test results based on MSE and PSNR values confirm that the decrypted image is exactly the same as the original image.
1. Introduction
Currently, communication and information technology is developing very rapidly. This development can be seen by the ease of obtaining information with the internet. The internet is a medium that can facilitate its users in obtaining various information and communication processes from any part of the world and at any time. Someone can easily send personal data to others so that the data can be widely distributed on the internet.
Highly confidential personal data need to be secured from the threat of manipulation or data theft. This aims to ensure that the data are not known by unauthorized parties. Digital images are one form of digital data or information that is often targeted by crime. Cryptography is a reliable, safe, and fast security technique that can be implemented on digital images. The cryptography process is basically very simple. The original data or information is called plaintext, while the data or information that has been encoded is called ciphertext. In this case, the original image acts as plaintext. Encryption is the process of changing the original image into an encrypted image. Meanwhile, the reverse process, namely, decryption, is the process of changing the encrypted image back into the original image. The algorithm for transforming plaintext into ciphertext is called a cipher.
The performance of an algorithm can be seen from the security resistance of the algorithm to attacks and its computation time. Although image encryption algorithms require a small key space and long computation time, they produce well-encrypted data. However, digital image encryption is preferred because it has a faster time and maintains security [1]. The use of chaos-based image encryption is one solution to the problem of image security.
Researchers [2] developed the Logistic–Gauss Map Algorithm. The Logistic–Gauss Map Algorithm works by composing the Logistic map and Gauss map functions to produce a key space of and a key sensitivity value of . This algorithm is difficult to attack with brute force attacks. In addition, testing attacks on encrypted image data using statistical attacks and differential attacks shows that this algorithm has high durability.
Recent studies have introduced new chaotic encryption techniques that further enhance security and efficiency. Alexan et al. [3] proposed a color image encryption scheme utilizing the KAA map combined with multiple chaotic maps, achieving a high level of security through Shannon’s confusion and diffusion principles. Meanwhile, Erkan et al. [4] developed the 2D eπ-map, a chaotic encryption approach based on Euler and Pi numbers, incorporating a novel diffusion technique called ‘bit reversion’ to manipulate pixel values. These innovations highlight the continuous evolution of chaos-based encryption, reinforcing the significance of developing more robust and efficient encryption methods such as the proposed MS Circle Map in this study.
The algorithm is sequentially arranged between the logistic map and Chebyshev map [5]. This method is used to ensure the transmission of medical images. First, the image is encrypted with the logistic map. Then, the encrypted image is generated, and then, the encrypted image is encrypted again with the Chebyshev map. In other words, the medical image is encrypted in two steps using two functions. The same method is used in the decryption process. This algorithm has four parameters. When the parameter value for the logistic map is set to an impossible value, the image is no longer secure. In addition, it also takes longer to perform the encryption technique twice.
The author in [6] proposed image encryption by combining the logistic map and Henon map, a process in which the image is converted into a matrix and randomized using the logistic map algorithm and continued with the XOR process for each pixel bit using the Henon map algorithm. Feng, W. et al. [7] proposed a new image encryption algorithm by constructing a hyperchaotic map called 2D-SQPM and then developed an image encryption algorithm based on 2D-SQPM and a pixel fusion strategy (IEASP). At initialization, an initial secret key is input to 2D-SQPM to generate a keystream, and, then, this keystream is used to encrypt each image. For each image, IEASP completes the encryption through pixel fusion and two rounds of vector-level image filtering, chaotic pixel superposition, and intra-vector quick scrambling. Feng, W. et al. [8] developed a multi-image encryption algorithm based on the new fractional-order 3D Lorenz chaotic system and 2D-SCPM.
Other researchers have proposed encryption algorithms using the chaos logistic map and deoxyribonucleic acid (DNA) encoding functions to improve the security level of image encryption algorithms. DNA encoding is used to scramble pixel values into DNA bases and scramble them in DNA addition, DNA complement, and exclusive or (XOR) operations. Meanwhile, the logistic function is used as a keystream generator required in DNA complement and XOR operations [9]. There has been some research on chaos function-based encryption algorithms, such as those using the chaos function logistic map [10], which produces a key space of ; those using the Maria Suryadi (MS) map [11,12], which produces a keyspace of ; those using the Gauss Iterated map [13], which has a Number of Pixel Change Rate (NPCR) value of 93. 6% and Unified Averaged Changed Intensity (UACI) of 27.9%; those using Gauss and Circle [14], which produces a key space of 2.6244 × 101269 [15]; and those which develop an image encryption algorithm using the logistic map and Piecewise Linear Chaotic map, which has a key sensitivity value of 10−10 resistance to brute force attack.
In this study, digital image encryption and decryption were carried out through the composition of MS Map and Circle Map functions. The developed algorithm aims to improve security resilience against various attacks and speed up the process time in digital image encryption. The performance of the proposed algorithm was tested using initial value sensitivity level analysis, key space analysis, histogram, correlation, entropy, NPCR, UACI, Mean Square Error (MSE), and Peak Signal to Noise Ratio (PSNR).
In previous studies, image encryption using the Tent map with a key space of 2106, an entropy value of 7.999876, and correlation coefficients near zero demonstrated strong resistance to brute force and statistical analysis attacks [16]. Similarly, MS Map encryption resulted in a key space of 3.24 × 10634, key sensitivity of 10−17, and uniform distribution in encrypted images, making it resistant to known-plaintext and brute-force attacks [11]. In comparison, Henon–Tent map encryption achieved a key space of 1060, entropy of 7.9992, and key sensitivity of 10−16, with an NPCR of 99.61% and UACI of 33.46%, making it resistant to brute force, chosen-plaintext, and chosen-ciphertext attacks [17]. More recently, a hybrid MS-Tent map encryption algorithm was designed with an even larger key space of 1.05 × 10959, key sensitivity of 10−17, and near-zero correlation coefficients, proving its robustness against brute-force and statistical attacks [18]. These comparisons highlight that the MS Circle Map encryption algorithm not only offers superior security through a significantly larger key space but also enhances resistance to various cryptanalysis attacks, making it a highly efficient and secure method for digital image encryption.
Recent advancements in image encryption have extensively explored pixel scrambling and diffusion techniques to enhance security. An encryption method using Hilbert curve-based pixel scrambling and dynamic DNA coding-based pixel diffusion demonstrated strong security performance [19]. A nonlinear relationship between flux and memristor charge was introduced into the 4D hyperchaotic Liu system, combining chaotic dynamics with DNA sequence operations and SHA-256 for encryption [20]. An image encryption algorithm was developed by integrating 2D compressive sensing with a 6D hyperchaotic system-based index sequence, enabling the encryption of two different color images simultaneously [21].
To address performance limitations, an image encryption technique using compressive sensing (CS) was proposed [22]. The wavelet packet transform (WPT) matrix was generated from the Xorshift algorithm, with confusion performed using 2D Cat-Throp mapping, followed by sparse coefficient matrix processing and hybrid bidirectional diffusion. The encrypted data were then embedded into a carrier image selected from a publicly accessible database, utilizing HT embedding in a newly introduced YCbCr orthogonal color space [22]. More recently, a novel 2D Log-Logistic-Sine Chaotic Map (2D-LLSCM) was introduced. By combining a chaotic matrix with a nonlinear log-polar transformation, this approach achieved enhanced image scrambling and diffusion, further improving encryption security [23].
In this study, we propose a new chaotic function called MS Circle Map and develop a novel digital image encryption and decryption algorithm that integrates the chaotic dynamics of the MS Map and Circle Map. Additionally, we implement a software prototype for encryption and decryption on a Windows operating system, demonstrating high resistance to brute-force, statistical, and differential attacks. The rest of this paper is organized as follows: Section 2 describes the proposed MS Circle Map-based image encryption and decryption algorithm, along with its mathematical foundations and software implementation. Section 3 presents the experimental setup, simulation results, and performance evaluation. Finally, Section 4 provides the conclusion and discusses potential future research directions.
The key contribution of this study lies in the development of the MS Circle Map as a new chaotic function for keystream generation, ensuring strong randomness and security. Based on this function, we propose an image encryption and decryption algorithm designed to enhance security and computational efficiency. Furthermore, we implement a software prototype on the Windows operating system to demonstrate the practicality of the proposed method, showcasing its resistance to brute force, statistical, and differential attacks. These contributions reinforce the significance of chaos-based encryption in securing digital images against modern cryptographic threats.
2. Materials and Methods
2.1. Cryptography
According to Schneier [24], Cryptography is the science and art of learning how to maintain the security of a message. Meanwhile, Menezes et al. [25] define cryptography as a field that studies mathematical techniques related to aspects of data security, such as confidentiality, validity, integrity, and authentication.
Apart from aiming to provide security and confidentiality of information, another goal of cryptography is to provide data integrity services, namely, to ensure that the message remains original or that the message has not been manipulated. Authentication is used to ensure that both the communicating party and the source of the information are correct. Non-repudiation is intended to prevent communicating entities from making communication errors, namely, the sender of the message denying sending the message or the receiver of the message denying receiving the message [26].
The original data or information is called plaintext, while the data or information that was encoded is called ciphertext. The process of converting plaintext into ciphertext is called encryption. However, the reverse process of converting ciphertext into plaintext is called decryption. The encryption and decryption process requires a key that is only known by the sender or receiver [27].
2.2. MS Map and Circle Map
First, we will introduce two chaos maps that will be used in MS Circle Map. MS Circle Map is a new function obtained from the combination of two chaotic functions from MS Map and Circle Map.
Chaos map is currently very developed and widely used for image encryption. In image encryption algorithms, chaos map plays an important role in producing chaotic sequences that will be used for keystream. Therefore, we chose the recently introduced chaos map function, namely, MS Circle Map, chosen because of its simplicity, ease of implementation, and efficiency in producing chaotic sequences. This is shown in the extraordinary chaotic behavior, which is characterized by a dense bifurcation diagram, a consistently positive Lyapunov Exponent value, and the NIST test produced by MS Circle Map being random.
Among the two chaos maps mentioned above, we introduce MS Map first. MS Map is one of the new chaotic maps modified from logistic map. The modification is performed by changing the general form of the logistic map [8,9]. MS Map can be seen in Equation (1) below:
with the definition of x mod 1 as shown in Equation (2) [28]:
mod 1 is imposed on the modified form so that its domain and codomain lie in the interval (0, 1), or, in other words, the generated keystream taken is only its decimal value. For any x number, x mod 1 is all positive real numbers smaller than 1.
The MS Map function consists of three key parameters: x0, r, and λ. The domains of these parameters are defined as x0 ∈ (0, 1) and r, λ ∈ R. The parameter x0 serves as the initial value, while r and λ function as control parameters. To ensure optimal randomness in the generated keystream, the condition r > λ must be satisfied, as the selection of r and λ directly influences the chaotic behavior of the MS Map function.
Another chaotic map employed in our study is Circle Map. Circle Map is a one-dimensional function that maps a circle to itself. The Circle Map Equation with Equation (3) is as follows [28]:
mod 1 is the decimal part of a number, so the value of the map is always lower than 1 but not less than 0, and the K ∈ R parameter. Meanwhile, Ω is in the interval 0 ≤ Ω ≤ 1, and, since this is the single sum term in modulo 1, all other values of Ω are already represented by this interval.
A very interesting characteristic of the Circle Map is that it has infinite chaos possibilities. If a person wants to obtain a high-enough Lyapunov exponent, she/he can choose high or low (negative), because the value of K moves away from 0, and the exponent keeps increasing. The Ω value of the Circle Map also decreases as K moves away from 0 [29].
2.3. MS Circle Map
The new chaos function in this research was formulated through the composition process of two chaos functions: MS Map and Circle Map chaos functions. The composition process of MS Map and Circle Map chaos functions can be done because both have the same degree and dimension. If the Circle Map function is expressed as f(x) and the MS Map function as g(x), then the composition function of Circle Map and MS Map is expressed as MS Circle Map function. This function is a recursive function that can be seen in the equation below (4) [30], with for and as the initial value, ], , and in real numbers.
The results of mathematical and statistical tests of this function show that it is chaotic [31], so the function can be further used as a keystream generator for encryption and decryption processes. The proposed MS Circle Map is characterized by five key parameters x0, r, λ, K, and Ω, allowing it to generate a significantly large key space. This extensive key space enhances its resistance to brute force attacks, making it more secure compared to traditional chaotic maps with fewer parameters. The increased complexity and unpredictability of the keystream further strengthen the encryption process, ensuring high security for digital image encryption.
2.4. Mathematical Features of MS Circle Map
The MS Circle Map used in our image encryption algorithm has good chaotic properties for image encryption. Whether a keystream sequence is random or not can be seen from the selection of initial values and control parameters. It can be seen in the bifurcation diagram, where the periodic points of a dense map indicate that the resulting keystream is likely to be very random, as shown in Figure 1. In addition to randomness, sensitivity to initial values and control parameters is a property of chaotic maps that is highly expected in the MS Circle Map. Sensitivity to initial values can be seen from the positive Lyapunov exponent value, as shown in Figure 2. By using the MS Circle Map to design a digital image encryption algorithm, it not only produces highly random encrypted images but can also effectively resist numerous attacks targeting secret keys [30].
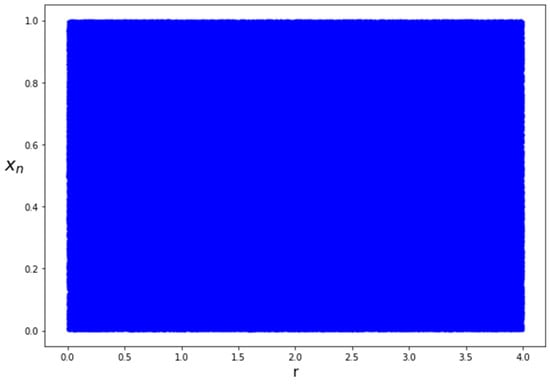
Figure 1.
MS Circle Map bifurcation diagram.
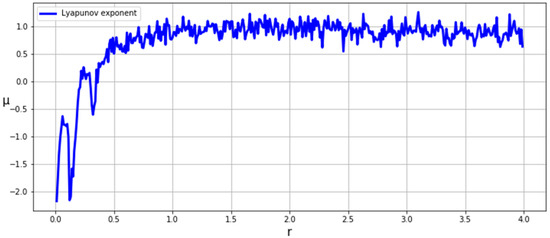
Figure 2.
Lyapunov exponent of the MS Circle Map.
The parameters x0, r, λ, K, and Ω were selected within specific ranges as they produce highly random keystream values compared to other ranges. These selections were based on the presence of dense bifurcation values and a positive Lyapunov Exponent, ensuring a high level of chaotic behavior for the encryption process. The chaotic nature of the MS Circle Map makes it suitable for encryption, as a small deviation in these parameters leads to significant differences in the keystream, which enhances security against cryptographic attacks.
2.5. NIST Test
The quality of random sequence generator can be tested by using NIST Test. NIST test aims to evaluate the chaotic level of MS Circle Map [10,11]. In this NIST test, a sequence of 1,000,000 bits was used. The NIST test series is a statistical package consisting of 16 tests [32]. For each test, if the p-value obtained is greater than the threshold value of 0.01, the test item is considered random. The test results are shown in Table 1. It can be seen that all binary sequences generated by MS Circle Map pass the test. This shows that the MS Circle Map function is effective and can ensure the randomness of chaotic sequences better.

Table 1.
NIST randomness test result of the MS Circle Map.
2.6. Encryption and Decryption Algorithms
The encryption process was performed on the original image (confidential data) using the keystream generated by the MS Circle Map chaos function. The encryption process can be seen in Figure 3 and the decryption process in Figure 4. The encryption methods of digital images are as shown in Figure 3. The encryption process begins by generating the keystream using the MS Circle Map function. The number of keystream elements required is M × N, according to the number of pixels in the plain image. The keystream is generated using Equation (4) by entering the key parameter values first, then the keystream will be generated. Because the MS Circle Map function uses the modulo 1 (mod 1) operation, the resulting keystream is a real number that lies between 0 and 1. To convert it to an integer with a value of 0 to 255, the keystream was then multiplied by 106. After that, the result was floored to remove fractional values and obtain a series of integers. Furthermore, from this result, a modulo 256 (mod 256) operation was performed, so that the final result of the keystream conversion can be substituted into each image pixel that has a value in the range of 0 to 255.
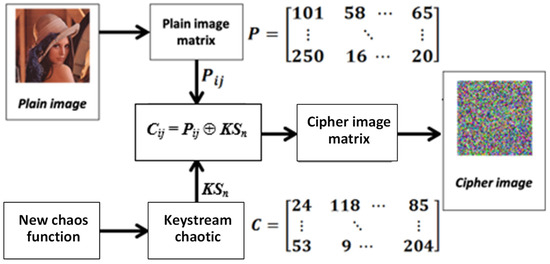
Figure 3.
Digital image encryption process based on MS Circle Map.
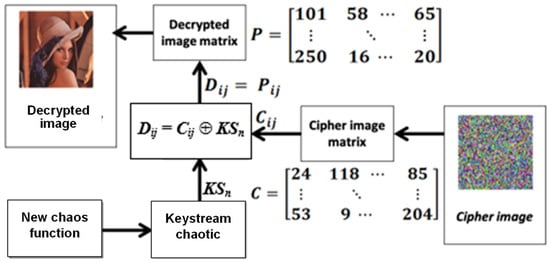
Figure 4.
Digital image decryption process based on MS Circle Map.
The next step is the substitution encryption process using the XOR operation between the pixel value (Pij) at the coordinate position (i,j) of the plain image with one keystream element value in pairs. The XOR substitution operation was carried out pixel by pixel using Equation (5), starting from the first pixel to the last pixel until the encrypted image is obtained.
in which KSn is the nth key in the keystream KS, and Cij is the pixel cipher value (encrypted pixel value) located at coordinates (i,j).
The implementation of the image encryption chart in Figure 3 can be performed using Algorithm 1. In steps 3 to 6, the user can choose which keystream element will be used in the encryption process by entering the value t. Steps 7 to 14 show the keystream generation process, referring to Equation (4) (steps 9 and 10) and also the pixel-by-pixel encryption process based on Equation (5) (step 11). Despite this quadratic complexity, the algorithm remains computationally feasible for practical image sizes due to its efficient keystream generation and XOR-based operations.
| Algorithm 1: Image Encryption Process |
| Input: parameters and plain image Output: Encrypted Image
|
Next, to decrypt the image, the process is the reverse of the image encryption process as shown in Figure 4 and can be implemented using Algorithm 2. The decryption process was carried out by using the same key parameter values as those used during the encryption process, and the cipher image became input data. All steps carried out in Algorithm 2 are the same as in Algorithm 1. The only difference is the decryption process in step 11, which applies Equation (6).
where KSn is the nth key in the keystream KS, and Cij and Dij are the pixel values of the cipher image and decrypted image, respectively.
| Algorithm 2: Image Decryption Process |
| Input: parameters and plain image Output: Encrypted Image
|
2.7. Test Data
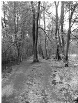
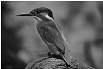
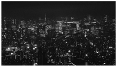
The test data used were 30 digital images, which include color and grayscale images. The test data are tropical beach.png, jungle.bmp, Bird.png, Village.bmp, and City.png. with each type of image having three different sizes. The five types of images were chosen because they have a wide variety of shape, color, and texture features and information. The color and grayscale image test data can be seen in Table 2 and Table 3 below:
Table 2.
Color image test data.
Table 3.
Grayscale image test data.
3. Results and Discussion
The implementation of Algorithm 1 for image encryption and Algorithm 2 for image decryption was carried out using the Python 3.13.3 programming language on a computer with the following specifications: i5-7200U Intel(R) Core (TM), @ 2.50GHz 2.70 GHz CPU, 8.00 GB Memory (RAM), Windows 10 Home Operating System, and 64 bit Single Language. The results presented and analyzed in this section are examples of results obtained using one combination value of the five key parameters: x0 = 0.9, λ = 2.1, Ω = 0.5, K = 1000, and r = 3.8. These key parameter values must be the same during the encryption and decryption processes. Furthermore, to test the resilience of encrypted and decrypted images against attacks, it is necessary to conduct analyses such as initial value sensitivity, uniformity, correlation, differential analysis, key space, image quality, and encryption–decryption process time.
3.1. Visual Effect
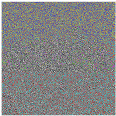
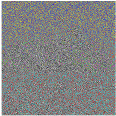
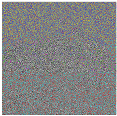
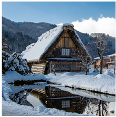
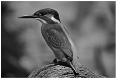
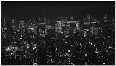
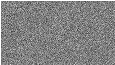
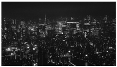
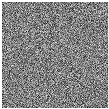
In order to ensure that the MS Circle Map function effectively protects any information contained in an image, all of the information in the encrypted image must be completely obscured and visually unreadable. For example, see Figure 5, where (a) and (d) are the original color and grayscale images, respectively, (b) and (e) represent the results of the encrypted color image and the encrypted grayscale image. In both images, all information is completely scrambled and absolutely unreadable. Using the same parameter values during the encryption process, Figure 5c,f show the decrypted color and grayscale images, respectively. Visually, from both images, all information can be restored as in the original images. The examples described above show that the key stream generated by the MS Circle Map function has excellent image encryption and decryption capabilities and can thus provide effective protection of the information contained in the image.
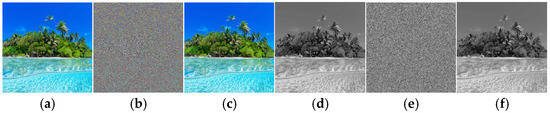
Figure 5.
Example of (a) original color image, (b) color image encrypted, (c) color image decrypted, (d) original grayscale image, (e) grayscale image encrypted, and (f) grayscale image decrypted.
3.2. Image Quality Analysis
Digital image quality analysis is performed using the Peak Signal to Noise Ratio (PSNR) test to determine the quality of encrypted and decrypted images. The PSNR testing refers to the Mean Square Error (MSE) value. The MSE and PSNR values can be calculated through Equations (7) and (8) [33], where N is the number of pixels in the image, and xi and yi are the values of the ith pixel of the original and encrypted/decrypted images, respectively. The quality of the decrypted image will be exactly the same as the original image when the MSE value is equal to zero (MSE = 0) and the PSNR value is equal to infinity (PSNR = ∞). On the other hand, for encrypted images, the higher the MSE value and the closer the PSNR value is to zero, the better the quality and security level of an encrypted image. In other words, the information contained in the encrypted image becomes increasingly difficult to read, the level of security is higher, and making it more difficult for unauthorized parties to access the original image data.
Table 4 shows the measurement results of MSE and PSNR values of 30 encrypted images. It can be seen that the MSE values of all images are very large in the range of 7792 > MSE < 15,456, and the PSNR values are very small in the range of 6.23 dB > PSNR < 9.22 dB. These values indicate that the quality of information security in encrypted images is very good.
Table 4.
Value of MSE and PSNR of encrypted image.
Furthermore, the measurement results of MSE and PSNR values of 30 decrypted images are described in Table 5. It can be seen that the MSE values of all decrypted images are zero and the PSNR values are dB. These values indicate that the quality of the decrypted images is very good, where all information can be restored as the original without any errors.
Table 5.
Value of MSE and PSNR of decrypted image.
3.3. Key Space
A brute force attack is performed by trying all possible combinations of key parameter values to perform decryption to obtain the original image. To reduce the chances of a successful brute force attack, the keystream generating function must have a larger key space. The key space states the total number of different combinations of key parameter values that can be used to perform image encryption and decryption [30]. The proposed MS Circle Map function as a keystream generator has six parameters: ,, and iteration i, with its domain , and , assuming that, in a programming language (such as Python), the maximum value of a float type number is . Meanwhile, the real numbers in the interval (0,1) have the precision level up to , and integer data have the possible value of Referring to the assumptions above, then, overall, the key combination or key space of the MS Circle Map function that can be used to encrypt and decrypt images is as follows:
In addition, if the function used is only MS Map or Circle Map or a sequential combination of MS Map and Circle Map, then the key space that can be generated is shown in Table 6. From this table, it can be seen that the key space of the MS Circle Map function is greater than the key space of the MS Map function, Circle Map function, and the sequential combination of the MS Map + Circle Map functions. This means that the MS Circle Map function is more secure against brute force attacks.
Table 6.
Comparison of chaotic function key spaces.
3.4. Key Sensitivity
The key sensitivity of the MS Circle Map function can be tested by decrypting the encrypted image using a different key parameter value (fake key) from the original key when used in the encryption process. The goal is to find out how much the difference in value between the original and fake keys is so that the encrypted image can be restored to the original image. The difference in value is stated as key sensitivity.
Table 7 illustrates an example of a key sensitivity test on four images: two color images and two grayscale images. In the first column is the original image, and the second column shows the encrypted image using the key parameter values: λ = 2.14365, Ω = 0.5984736, K = 1000, r = 3.85942, and the initial value with a precision of 16 digits . In the last three columns are the decrypted images using the same λ, Ω, K, and r values as during the encryption process, but with different values. The third column visualizes the decrypted image using the value or , where this value has a difference of from its original key value. Despite a difference of , all encrypted images were not successfully opened. The fourth column presents the encrypted image using the value or , where this value has a difference of from its original key value. Even with a smaller difference of , the encrypted image is still protected and cannot be restored to the original image. Furthermore, if the value is used with a difference of () or smaller than , the encrypted image is successfully cracked, and the information contained in it can be known. The decryption results are shown in the fifth column.
Table 7.
Initial value sensitivity.
Sensitivity testing for other key parameters was also carried out as described above. All of them showed a sensitivity level of . Thus, it can be concluded that the MS Circle Map has a key sensitivity of . This means that an encrypted image can only be decrypted if all key parameter values are found to be exactly the same or have a difference of less than compared to the original key parameter values. This also proves that a small change in the key parameter value will produce a very different keystream and can minimize the possibility of a brute force attack.
3.5. Goodness of Fit Test
Statistical tests are methods used to evaluate security by analyzing the statistical properties of encrypted images. These tests determine whether an encrypted image can effectively hide the statistical characteristics of the original image, making it difficult to analyze and decrypt. In other words, statistical tests can be performed to measure the resilience of encrypted images to statistical attacks. Goodness of fit is one of the statistical tests that analyzes the uniformity of color intensity distribution in encrypted images. The more uniform the distribution, the more difficult it is for statistical attacks to occur.
Color and grayscale images have intensity values ranging from 0 to 255 for each pixel color component. This means that there are 256 frequency classes with 255 degrees of freedom and a significance level of 1%, so the critical value obtained is 310.457388. The occurrence of each value of the pixel color component will be grouped according to its class and is called the observed frequency. The expected frequency for each class is calculated in the same way: (column total × row total)/(grand total).
Table 8 presents the results of the χ2 test on encrypted color and grayscale images. Table 8 presents the χ2 test results on encrypted color and grayscale images. The test results indicate that, for all tested images, the χ2 values are smaller than the critical value, leading to the acceptance of the null hypothesis (H₀). This proves that each class of pixel color intensity values is uniformly distributed, so that the image encrypted by function A is resistant to statistical attacks.
Table 8.
Statistical test results of color and grayscale images.
3.6. Correlation Analysis
Correlation analysis is a method used to determine the direction and strength of the relationship between two variables or neighboring pixels in an image [32]. It always falls between −1 and 1: a value of +1 indicates a perfect positive correlation, −1 a perfect negative correlation, and 0 no correlation. The closer to +1 the correlation value, the higher the linear relationship between neighboring pixels in displaying information on features: objects, colors, and textures contained in an image. The greater the correlation value is close to +1, the higher the linear relationship between neighboring pixels in forming and displaying information on features: objects, colors, and textures contained in an image. Conversely, the smaller the correlation value is close to 0, the lower the linear relationship between neighboring pixels, and, in this case, no information can be read.
Table 9 shows the correlation coefficient of neighboring pixels in the original color images and their encrypted image, while Table 10 shows the correlation coefficient for grayscale images and their encrypted image. The correlation coefficient value is calculated in three directions: horizontal, diagonal, and vertical. In both tables, it can be seen that, for the original images, all correlation values are quite large, and some are close to 1. Meanwhile, in their encrypted images, all correlation values are very small and very close to 0. Based on the calculation results where the correlation of neighboring pixels of all encrypted images has a very small value approaching 0, it can be concluded that the encrypted images using the MS Circle Map function are invulnerable to statistical attacks.
Table 9.
Correlation coefficient of the color images.
Table 10.
Correlation coefficient of the grayscale images.
3.7. Entropy Analysis
Entropy analysis is a statistical method that can be used to measure the level of randomness in encrypted images [34]. A secure encrypted image should have an ideal entropy value equal to 8 [35]. The entropy value can be calculated using Equation (9), where Pi is the probability of occurrence of a pixel having the value i (i is the intensity value of the color component), and the constant 256 is the total variation in the value i in the image (for intensities encoded on 8 bits).
Table 11 illustrates the results of the entropy test of encrypted color and grayscale images. The entropy values of all encrypted images are close to the ideal value of 8, with an average value of 7.9997 for encrypted color images and 7.9995 for encrypted grayscale images. This entropy value proves that all pixels in the encrypted image are perfectly scrambled so that all information is unreadable and safe from statistical attacks.
Table 11.
Entropy values of encrypted color and grayscale images.
3.8. NPCR and UACI Tests
The NPCR (number of pixel change rate) and UACI (unified average changing intensity) are the most commonly used statistical standard test tools to analyze sensitivity and evaluate the resistance of encrypted images to differential attacks. The NPCR aims to calculate the number of pixels whose values differ from the total number of pixels in the image. In addition, this NPCR value serves as a reference to analyze whether small variations in pixel values in the original image can cause significant differences in the encrypted image. UACI measures the average intensity difference between two encrypted images where the original image has only one pixel value changed. In the context of image encryption, an ideal NPCR value is 100%, and an ideal UACI value is ≥33.4635%, which indicates that a single pixel change in the original image significantly impacts the encrypted image. The NPCR and UACI were calculated using Equations (10) and (11), respectively [26,34].
If two encrypted images are denoted by and , then their respective pixel values at coordinates are represented by and , with = 1 if , and = 0 if . W and H are the width and length of the encrypted image in pixels.
Table 12 shows the results of the NPCR and UACI calculations. All encrypted images have excellent NPCRs where the values are in the range of 99.59% to 99.62% and the overall average value is 99.61%. Furthermore, the UACI values for the 30 test images ranged from 28.67% to 40.40% and the average value is 33.14%. The average values of the NPCR and UACI show that both are close to their ideal values. Thus, it can be stated that there is a high level of change in the encrypted image when there is a slight modification in the original image. So, this means that the encrypted image using the MS Circle Map function provides strong resistance to differential attacks.
Table 12.
NPCR and UACI values of color images and grayscale images.
3.9. Performance Comparison
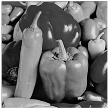
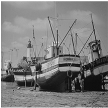
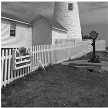
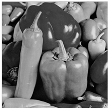
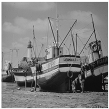
This section describes the performance measurement of the image encryption and decryption method based on the proposed MS Circle Map (MSCM) function using four images commonly used by other researchers. Furthermore, a comparison of its performance with several other methods is also described. The four images are Pepper, Butterfly, Boat, and Architecture, as shown in the first row of Table 13, where each has a size of 256 × 256 pixels. The second row shows the encryption results of each image using the key parameter values: x0 = 0.9, λ = 2.1, Ω = 0.5, K = 1000, and r = 3.8. The third row shows the decryption results when using the same key parameter values. However, if one of the key parameter values is different, a decryption error occurs. This is shown in the fourth row when using the values x0 + 10−15, λ + 10−15 in the fifth row, Ω + 10−18 in the sixth row, K + 10−13 in the seventh row, and r + 10−17 in the last row. These values indicate the sensitivity of each key parameter of the MSCM function.
Table 13.
Sensitivity of key parameters of the MSCM function.
A comparative analysis of the MSCM method was carried out against four other image encryption methods, as shown in Table 14. The entropy value in the fifth column is the average entropy of the four images (a)–(d) calculated using the MSCM method. This value is similar to the average entropy value in Table 11. When compared to the average entropy values in other methods, the MSCM is better than [36,37], and similar to [38].
Table 14.
Comparative analysis of entropy values.
Table 15 presents the NCPCR and UACI assessment results for the MSCM method (sixth column) and four other methods (in the last four columns). It can be seen that the average NPCR and UACI values for the MSCM method are very close to the ideal NPCR values of 99.6094% and UACI of 33.4635%. These values are not much different from the NPCR and UACI values of the other four methods.
Table 15.
Comparative analysis of NPCR and UACI values.
Table 16 describes the analysis of neighboring pixel correlation coefficients of encrypted images using the MSCM method and the methods developed in [36,37,38]. In the sixth column, it can be seen that the average correlation coefficient values of the MSCM in all directions have very small values and are relatively similar to the other four methods. This indicates that the MSCM has an exceptional capability in randomizing and eliminating the correlation of neighboring pixels, so that all information in the image is completely unreadable.
Table 16.
Comparative analysis of correlation coefficient values.
A comparative analysis of key sensitivity, key space, and complexity is given in Table 17. In the first row, the second column is the average key sensitivity of the MSCM of 10−15, where the MSCM has the same key sensitivity as the methods in [37,38]. This sensitivity is slightly lower than the method in [39]. Furthermore, the second row shows the key space of each method. The MSCM method has a much larger key space compared to the other six methods. Likewise, its complexity is lower than [36,40], while, in [37,38,39], the complexity is not stated.
Table 17.
Comparative analysis of key sensitivity, key space, and complexity.
3.10. Scalability and Computational Performance
Despite its advantages, the MS Circle Map-based encryption algorithm has some potential vulnerabilities. First, the encryption process is computationally intensive for large images, limiting its application in real-time encryption scenarios. Future work should explore algorithmic optimizations such as parallel computing or GPU acceleration to enhance efficiency.
Second, although the algorithm demonstrates resistance to brute force, statistical, and differential attacks, further analysis is needed to evaluate its security against known-plaintext and chosen-plaintext attacks. These types of cryptanalysis could potentially reveal patterns in the keystream generation process, reducing the algorithm’s overall security.
Third, key sensitivity, while beneficial for encryption robustness, also introduces a potential challenge in key synchronization, particularly in noisy transmission channels. If small errors occur during key transmission, the decryption process may fail, leading to irrecoverable data loss. Implementing robust key management strategies could mitigate this issue.
Addressing these potential vulnerabilities through further cryptanalysis and performance optimizations will help refine the MS Circle Map encryption algorithm for broader real-world applications.
3.11. Practical Applications
The application of the MS Circle Map-based encryption algorithm extends beyond controlled experimental settings and is highly relevant for real-world scenarios. In the healthcare sector, medical image data, which contain sensitive patient information, must be securely stored and protected against unauthorized access. By encrypting these images before storage, hospitals and healthcare institutions can ensure compliance with data privacy regulations and prevent potential data breaches.
Beyond medical applications, this encryption technique can be utilized in the financial sector to secure sensitive customer data, such as identity documents, bank account details, and transaction records. Encrypting such data ensures that only authorized personnel have access, mitigating risks associated with identity theft and financial fraud.
Additionally, military and governmental agencies require robust encryption for securing classified digital imagery related to national security, surveillance, and protected communications. The MS Circle Map encryption method provides strong security for digital image confidentiality, ensuring privacy protection and safeguarding sensitive information against cyber threats.
With its strong resistance to brute force attacks, statistical analysis, and differential cryptanalysis, the MS Circle Map encryption algorithm presents a viable solution for real-world applications where data security is paramount.
4. Conclusions
This study proposed a novel image encryption algorithm based on the MS Circle Map, leveraging chaotic dynamics to enhance security. The motivation behind this work stems from the increasing need for robust digital image encryption techniques capable of resisting various attacks. The proposed algorithm effectively integrates the MS Circle Map as a keystream generator, ensuring high randomness and unpredictability in encryption.
Experimental results demonstrate that the algorithm exhibits high key sensitivity, a large key space, and strong resistance to brute force, statistical, and differential attacks. Performance evaluation through entropy analysis, correlation coefficients, the NPCR, UACI, PSNR, and MSE confirms its ability to maintain encryption quality while ensuring secure decryption. These findings highlight the significance of the proposed approach in improving the security of digital image transmission and storage.
However, this study has certain limitations. The computational complexity is O(n2), which may impact processing speed for large-scale images. Additionally, the algorithm has not been tested against noise attacks or known-plaintext attacks, which could be considered in future research. Potential follow-up studies could focus on optimizing execution time using parallel computing or GPU acceleration, extending the method to multi-channel image encryption, and testing its robustness under additional attack scenarios.
5. Patents
This encryption program prototype has been registered with the copyright certificate at the Directorate General of Intellectual Property Rights, Ministry of Law and Human Rights of the Republic of Indonesia, with the number EC00202310294.
Author Contributions
Conceptualization, S.M. (Suryadi MT) and S.M. (Sarifuddin Madenda); methodology, S.M. (Suryadi MT) and I.M.; software, I.M.; validation, S.M. (Suryadi MT), S.M. (Sarifuddin Madenda) and I.M.; formal analysis, S.M. (Sarifuddin Madenda) and S.M. (Suryadi MT); investigation, I.M.; resources, I.M.; data curation, I.M.; writing—original draft preparation, I.M.; writing—review and editing, I.M., S.M. (Sarifuddin Madenda) and S.M. (Suryadi MT); visualization, I.M.; supervision, S.M. (Sarifuddin Madenda), S.M. (Suryadi MT) and S.H.; project administration, I.M.; funding acquisition, S.M. (Sarifuddin Madenda) and S.H. All authors have read and agreed to the published version of the manuscript.
Funding
This research was funded by the Ministry of Education, Culture, Research, Technology and Higher Education with contract No. 155/e5/PG.02.00.PT/2022.
Institutional Review Board Statement
Not applicable.
Informed Consent Statement
Not applicable.
Data Availability Statement
The original contributions presented in this study are included in the article and Appendix A. Further inquiries can be directed to the corresponding authors.
Acknowledgments
Many thanks for the opportunity and support to the Ministry of Education, Culture, Research, Technology and Higher Education (DRTPM) TA 2022.
Conflicts of Interest
The authors declare no conflicts of interest.
Abbreviations
| NPCR | Number of pixel change rate |
| UACI | Unified average changing intensity |
| MSE | Mean Square Error |
| PSNR | Peak Signal to Noise Ratio |
| NIST | National Institute of Standards and Technology Test |
| DNA | Deoxyribonucleic acid |
| MS | Maria Suryadi |
| XOR | Exclusive OR |
Appendix A
Encryption and Decryption Software Development Prototype
The developed algorithm is implemented into a prototype of encryption and decryption software based on the proposed MS Circle Map function. The implementation of this prototype was carried out using the Python programming language version 3.7, and a Graphical User Interface (GUI) or program display was created to help facilitate this research.
The main page of the program can be seen in Figure A1, which has five main menus, namely, the image encryption menu, image decryption, quality test (histogram, correlation coefficient, MSE, and PSNR), randomness test (correlation distribution), and statistical test (Uniform, Entropy, UACI, and NPCR).
The “Image Encryption” menu is a digital image encryption process that works by inputting the original image and all parameters, and the output is the encrypted image. When the “Image Encryption” menu is selected, a new window will appear, as in Figure A2. The new window for this encryption process consists of five parts, namely, filling in the initial value, parameters, and i iteration. The “Open File” button is to read the image to be encrypted, while the “Run File” button is to run the encryption process. The “Save File” button is to save the encrypted image in the computer, and the “Exit” button is to close the window of the encryption process.
Selecting the image decryption menu button in the main window, as shown in Figure A1, will display the image decryption window in Figure A3. This window has the same menu display as the window for the image encryption process. The decryption process through the selection of the “Run File” button can be performed after filling in all the initial values and key parameters, as in the encryption process and reading the encrypted image. The result of the decryption process is shown on the right side of the encrypted image, as shown in Figure A3. The length of time of the decryption process is shown above the “Exit” button, which is 3.907 s.
Figure A1 also illustrates the main interface of the program, which consists of five main menus: image encryption, image decryption, quality testing, randomness testing (correlation distribution), and statistical testing. The quality testing menu evaluates the histogram, correlation coefficient, MSE, and PSNR of both encrypted and decrypted images. The randomness testing menu analyzes the correlation between the encrypted and original images, while the statistical testing menu assesses the results of uniformity, entropy, UACI, and NPCR between the two compared images.
Testing the quality of the decrypted image against the original image can be conducted by selecting the “Quality Test” button in the main window of Figure A1. The selection of the button displays a new window in Figure A4. This window has a menu with several buttons: “Open Plain Image File” button to read the original image used in the encryption process, “Open Encrypted/ Decrypted Image File” button to read the encrypted image or decrypted image, “Quality Test” button to run the test algorithms according to the input image, and “Exit” button to exit this window.
Next, testing the randomness of the pixel color intensity of the encrypted image can be performed by selecting the “Randomness Test” button on the main window of Figure A1. The selection of the button displays a new window in Figure A5. This window has several buttons: “Open the Image File”, “Correlation Distribution Test”, and “Exit”.
Statistical testing of the encrypted image can be performed by pressing the “Statistical Test” button on the main window of Figure A1. The selection of the button displays a new window shown in Figure A6. This window has several buttons: “ Open Tested Image 1”, “Open Tested Image 2”, “Statistical Test”, and “Exit”.
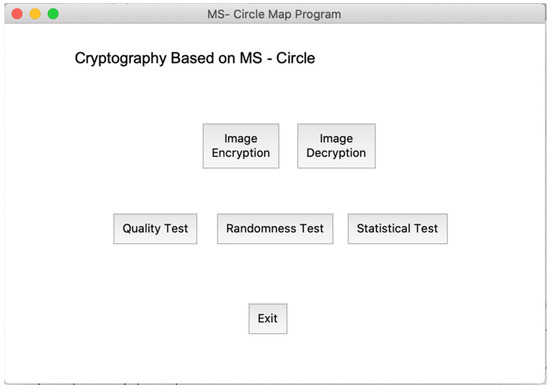
Figure A1.
MS Circle Map-based cryptography main menu.
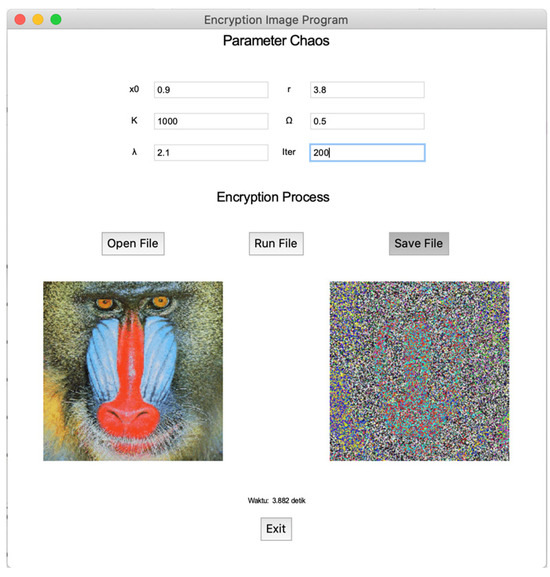
Figure A2.
Encryption program display.
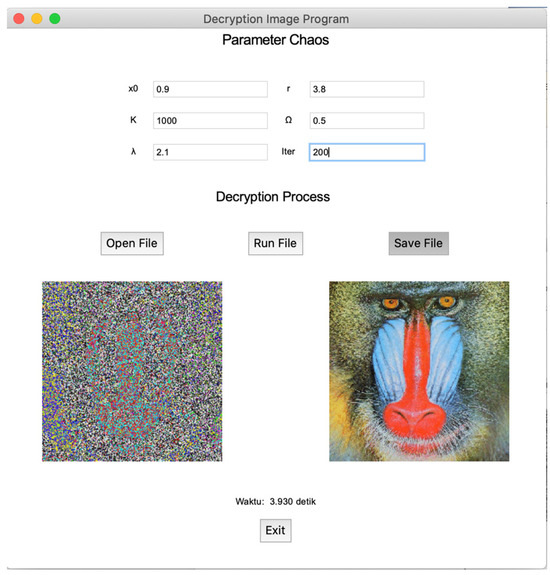
Figure A3.
Decryption program display.
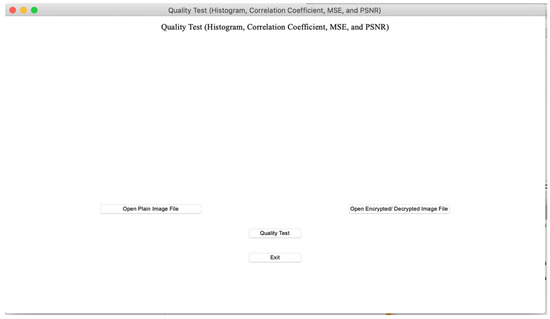
Figure A4.
Quality test menu display.
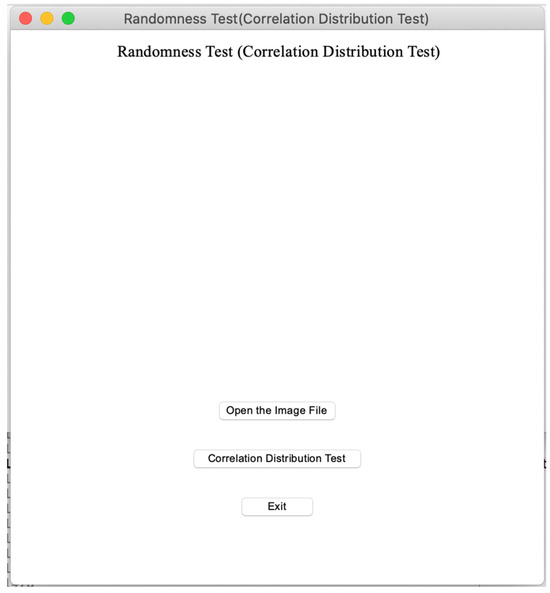
Figure A5.
Randomness test display.
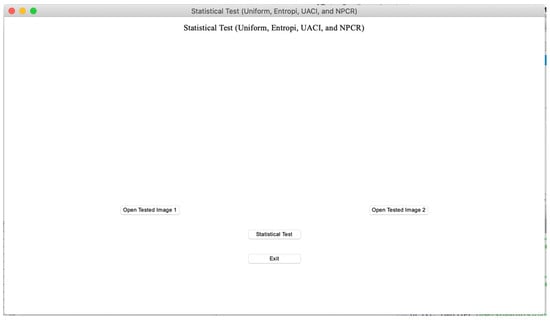
Figure A6.
Statistical test display.
References
- Pareek, N.K.; Patidar, V.; Sud, K.K. Image encryption using chaotic logistic map. Image Vis. Comput. 2006, 24, 926–934. [Google Scholar] [CrossRef]
- Kembaren, S.B.; Suryadi, S.; Triswanto, T. Implementasi algoritma enkripsi citra digital berbasis chaos menggunakan fungsi komposisi logistic dan gauss iterated map. Pros. Semin. Nas. Int. 2018, 1, 263–272. [Google Scholar]
- Alexan, W.; Elkandoz, M.; Mashaly, M.; Azab, E.; Aboshousha, A. Color image encryption through chaos and KAA map. IEEE Access 2023, 11, 11541–11554. [Google Scholar] [CrossRef]
- Erkan, U.; Toktas, A.; Toktas, F.; Alenezi, F. 2D eπ-map for image encryption. Inf. Sci. 2022, 589, 770–789. [Google Scholar] [CrossRef]
- Dai, Y.; Wang, X. Medical image encryption based on a composition of logistic maps and chebyshev maps. In Proceedings of the 2012 IEEE International Conference on Information and Automation, Shenyang, China, 6–8 June 2012. [Google Scholar]
- Arditaa, I.K.A.O.; Muliantara, A.; Putra, I.G.N.A.C.; Er, N.A.S.; Mahendra, I.B.M.; Supriana, I.W. Enkripsi Gambar Berdasarkan Modifikasi Bit Piksel Dengan Menggunakan Perpaduan Logistic Map Dan Henon Map. J. Elektron. Ilmu Komput. Udayana 2022, 11, 309–318. [Google Scholar] [CrossRef]
- Feng, W.; Zhang, J.; Chen, Y.; Qin, Z.; Zhang, Y.; Ahmad, M.; Woźniak, M. Exploiting robust quadratic polynomial hyperchaotic map and pixel fusion strategy for efficient image encryption. Expert Syst. Appl. 2024, 246, 123190. [Google Scholar] [CrossRef]
- Feng, W.; Wang, Q.; Liu, H.; Ren, Y.; Zhang, J.; Zhang, S.; Qian, K.; Wen, H. Exploiting newly designed fractional-order 3D Lorenz chaotic system and 2D discrete polynomial hyper-chaotic map for high-performance multi-image encryption. Fractal Fract. 2023, 7, 887. [Google Scholar] [CrossRef]
- Suryadi, M.T.; Satria, Y.; Fauzi, M. Implementation of digital image encryption algorithm using logistic function and DNA encoding. J. Phys. Conf. Ser. 2018, 974, 012028. [Google Scholar] [CrossRef]
- Suryadi, M.T.; Nurpeti, E. Performance of Chaos-Based Encryption Algorithm for Digital Image. J. Telecommun. Comput. Electron. Control 2014, 12, 675–682. [Google Scholar]
- Suryadi, M.; Irsan, M.Y.T.; Satria, Y. New modified map for digital image encryption and its performance. J. Phys. Conf. Ser. 2017, 893, 012050. [Google Scholar] [CrossRef]
- Suryadi, M.; Irsan, M.Y.T.; Satria, Y. Encryption Algorithm using New Modified map for digital image. In Proceedings of the IICMA, Depok, Indonesia, 3–4 November 2015; pp. 71–78. [Google Scholar]
- Sahay, A.; Pradhan, C. Multidimensional comparative analysis of image encryption using gauss iterated and logistic maps. In Proceedings of the 2017 International Conference on Communication and Signal Processing (ICCSP), Chennai, India, 6–8 April 2017; pp. 1347–1351. [Google Scholar] [CrossRef]
- Suryadi, M.T.; Satria, Y.; Hadidulqawi, A. Implementation of the Gauss-Circle Map for encrypting and embedding simultaneously on digital image and digital text. J. Phys. Conf. Ser. 2021, 1821, 012037. [Google Scholar] [CrossRef]
- Andrew, A.; Andrian, A.; Kuantan, S.; Setia, R.; Christnatalis, C. Pengacakan citra digital dengan menggunakan logistic map dan piecewise linear chaotic map. J. Teknol. Kesehat. Dan Ilmu Sos. 2019, 1, 96–102. [Google Scholar]
- Li, C.; Luo, G.; Qin, K.; Li, C. An image encryption scheme based on chaotic tent map. Nonlinear Dyn. 2017, 87, 127–133. [Google Scholar] [CrossRef]
- Kanwal, S.; Inam, S.; Othman, M.T.; Waqar, A.; Ibrahim, M.; Nawaz, F.; Nawaz, Z.; Hamam, H. An effective color image encryption based on Henon map, tent chaotic map, and orthogonal matrices. Sensors 2022, 22, 4359. [Google Scholar] [CrossRef]
- Sweetania, D.; MT, S.; Madenda, S. Development of a New Chaotic Function-based Algorithm for Encrypting Digital Images. Int. J. Adv. Comput. Sci. Appl. 2024, 15, 264–269. [Google Scholar] [CrossRef]
- Geng, S.; Li, J.; Zhang, X.; Wang, Y. An image encryption algorithm based on improved Hilbert curve scrambling and dynamic DNA coding. Entropy 2023, 25, 1178. [Google Scholar] [CrossRef]
- Yang, Y.; Wang, L.; Duan, S.; Luo, L. Dynamical analysis and image encryption application of a novel memristive hyperchaotic system. Opt. Laser Technol. 2021, 133, 106553. [Google Scholar] [CrossRef]
- Chai, X.; Wu, H.; Gan, Z.; Han, D.; Zhang, Y.; Chen, Y. An efficient approach for encrypting double color images into a visually meaningful cipher image using 2D compressive sensing. Inf. Sci. 2021, 556, 305–340. [Google Scholar] [CrossRef]
- Hu, X.; Jiang, D.; Ahmad, M.; Tsafack, N.; Zhu, L.; Zheng, M. Novel 3-D hyperchaotic map with hidden attractor and its application in meaningful image encryption. Nonlinear Dyn. 2023, 111, 19487–19512. [Google Scholar] [CrossRef]
- Wang, M.M.; Song, X.G.; Liu, S.H.; Zhao, X.Q.; Zhou, N.R. A novel 2D Log-Logistic–Sine chaotic map for image encryption. Nonlinear Dyn. 2025, 113, 2867–2896. [Google Scholar] [CrossRef]
- Schneier, B. Applied Cryptography: Protocols, Algorithms, and Source Code in C; John Wiley & Sons: Hoboken, NJ, USA, 2007. [Google Scholar]
- Menezes, A.J.; Van Oorschot, P.C.; Vanstone, S.A. Handbook of Applied Cryptography; CRC Press: Boca Raton, FL, USA, 2018. [Google Scholar]
- Kocarev, L.; Lian, S. Chaos-Based Cyrptography; Springer: Berlin/Heidelberg, Germany, 2011. [Google Scholar]
- Stallings, W. Cryptography and Network Security, 4/E; Pearson Education India: Tamil Nadu, India, 2014. [Google Scholar]
- Satria, Y.; Suryadi, M.; Solihat, I.M.; Prawadika, L.N.; Melvina, V. The composition of the improved logistic map and the ms map in generating a new chaotic function. J. Phys. Conf. Ser. 2020, 1490, 012046. [Google Scholar] [CrossRef]
- Boyland, P.L. Bifurcations of circle maps: Arnol’d tongues, bistability and rotation interval. Commun. Math. Phys. 1986, 106, 353–381. [Google Scholar] [CrossRef]
- Mursidah, I.; Suryadi, S.; Madenda, S.; Harmanto, S. A New Chaos Function Developed through the Composition of the MS Map and the Circle Map. In Proceedings of the International Conference on Mathematics and Learning Research, Surakarta, Indonesia, 29–30 August 2023; pp. 32–37. [Google Scholar]
- Suryadi, M.; Satria, Y.; Prawadika, L.N. An improvement on the chaotic behavior of the gauss map for cryptography purposes using the circle map combination. J. Phys. Conf. Ser. 2020, 1490, 012045. [Google Scholar] [CrossRef]
- Rukhin, A.; Soto, J.; Nechvatal, J.; Barker, E.; Leigh, S. A Statistical Test Suite for Random and Pseudorandom Number Generators for Cryptographic Applications; NIST Special Publication: Gaithersburg, MD, USA, 2010. [Google Scholar]
- Lone, P.N.; Singh, D.; Mir, U.H. A novel image encryption using random matrix affine cipher and the chaotic maps. J. Mod. Opt. 2021, 68, 507–521. [Google Scholar] [CrossRef]
- Fu, C.; Chen, J.-J.; Zou, H.; Meng, W.-H.; Zhan, Y.-F.; Yu, Y.-W. A chaos-based digital image encryption scheme with an improved diffusion strategy. Opt. Express 2012, 20, 2363–2378. [Google Scholar] [CrossRef]
- Benlashram, A.; Al-Ghamdi, M.; AlTalhi, R.; Laabidi, P.K. A novel approach of image encryption using pixel shuffling and 3d chaotic map. J. Phys. Conf. Ser. 2020, 1447, 012009. [Google Scholar] [CrossRef]
- Man, Z.; Li, J.; Di, X.; Sheng, Y.; Liu, Z. Double image encryption algorithm based on neural network and chaos. Chaos Solitons Fractals 2021, 152, 111318. [Google Scholar] [CrossRef]
- Feng, W.; Yang, J.; Zhao, X.; Qin, Z.; Zhang, J.; Zhu, Z.; Wen, H.; Qian, K. A Novel Multi-Channel Image Encryption Algorithm Leveraging Pixel Reorganization and Hyperchaotic Maps. Mathematics 2024, 12, 3917. [Google Scholar] [CrossRef]
- Qian, K.; Xiao, Y.; Wei, Y.; Liu, D.; Wang, Q.; Feng, W. A Robust Memristor-Enhanced Polynomial Hyper-Chaotic Map and Its Multi-Channel Image Encryption Application. Micromachines 2023, 14, 2090. [Google Scholar] [CrossRef]
- Qayyum, A.; Ahmad, J.; Boulila, W.; Rubaiee, S.; Arshad; Masood, F.; Khan, F.; Buchanan, W.J. Chaos-Based Confusion and Diffusion of Image Pixels Using Dynamic Substitution. IEEE Access 2020, 8, 140876–140895. [Google Scholar] [CrossRef]
- ElKamchouchi, D.; Mohamed, H.; Moussa, K. A bijective image encryption system based on hybrid chaotic map diffusion and DNA confusion. Entropy 2020, 22, 180. [Google Scholar] [CrossRef] [PubMed]


Disclaimer/Publisher’s Note: The statements, opinions and data contained in all publications are solely those of the individual author(s) and contributor(s) and not of MDPI and/or the editor(s). MDPI and/or the editor(s) disclaim responsibility for any injury to people or property resulting from any ideas, methods, instructions or products referred to in the content. |
© 2025 by the authors. Licensee MDPI, Basel, Switzerland. This article is an open access article distributed under the terms and conditions of the Creative Commons Attribution (CC BY) license (https://creativecommons.org/licenses/by/4.0/).