Article

Evaluation of the Variability of Micro and Macro Spray Parameters as a Function of Sampling Time Using a Laser Doppler Analyzer

Faculty of Civil Engineering, Mechanics and Petrochemistry, Institute of Mechanical Engineering, Warsaw University of Technology, Lukasiewicza 17, 09-400 Plock, Poland
*
Author to whom correspondence should be addressed.
Appl. Sci. 2025, 15(13), 6993; https://doi.org/10.3390/app15136993
Submission received: 20 May 2025 / Revised: 17 June 2025 / Accepted: 19 June 2025 / Published: 20 June 2025

Abstract

Determination of nozzle quality ratings based on macroscopic and microscopic parameters generally requires the use of separate measurement methods in research. The guiding idea determining the direction of the conducted research was to use a 2D (two-dimensional) laser analyzer LDA/PDA (laser Doppler anemometry/phase Doppler anemometry) to evaluate the values of selected micro and macro parameters (microstructure characterization with simultaneous evaluation of lateral distribution) of the spray. The research was conducted for variable measurement times. The main issue of the research was an attempt to reduce the measurement cycle time, important in the case of point tests performed with an analyzer. The scope of the conducted research covered three areas. In the first stage of the research, the variability of the coefficients characterizing the spray spectrum as a function of variable measurement time was analyzed. In the next, the value of the coefficient of transverse volume distribution (for a single sprayer) was determined. The results were determined on the basis of the volume diameters obtained from measuring the droplets with a 2D LDA/PDA analyzer. In the third stage, an attempt was made to combine the volume distribution results obtained for single nozzles on the boom. The results obtained were compared with those determined using a groove table. Both measurement methods used a different representativeness in volume measurement (sampling method and significantly different amounts of liquid analyzed); nevertheless, the results of the transverse volume distribution were found to be consistent.

1. Introduction

The spray nozzles of agricultural sprayers [1] are responsible for producing a jet of liquid with specific parameters. Their proper selection and correct functioning are the basis for optimal use of crop protection products [2,3,4]. To meet these requirements, spray nozzles must provide sufficiently high performance. New nozzles launched on the market are classified in terms of operating pressure, the type of jet produced, the size of droplets generated, and many other technical parameters. During the use of sprayers, it is also very important to ensure proper operation and periodic diagnostics of the spray nozzles [5,6,7,8,9,10].
Many research centers are studying the spray flux produced by nozzles, its optimization, and its impact on plants. The continuous development of agriculture determines the design of new solutions related to agricultural nozzles. In their article, Xue Li et al. describe the course of their research on a new two-stream nozzle capable of generating very fine droplets for use in greenhouse crops [11]. In their study, Gabriel Nii Laryea and Soo-Young No describe the use of electrostatic technology to improve spray application technology characterized by low energy expenditure and high efficiency of chemical use [12].
Depending on the treatments used, different types of spray nozzles are used. The most popular of these are flat-fan nozzles: standard, injector, ejector, and vortex nozzles [13]. The presented division of nozzles is made mainly on the basis of macroscopic and microscopic characteristics of the liquid jet produced. The main macroscopic parameters include the operating pressure [14], the unit jet output, the spray angle [15], and the coefficient of variation (CV) of the transverse distribution of the liquid [16,17]. Uniform distribution of the sprayed liquid ensures optimal use of the chemical, with effective chemical protection of plants, minimal costs associated with the use of the chemical, and low environmental pollution.
Determination of the coefficient of variation is carried out on standardized groove tables according to current standards. The CV value is determined for the entire spray boom (for all nozzles simultaneously) and for a single nozzle. In the latter case, we do not need to have a table with large dimensions. In order to obtain the CV index for the entire boom, the results of volume distribution tests determined for individual nozzles should be assembled on a so-called “virtual” spray boom. Nevertheless, in each of these two cases, we must have a standardized groove table.
Microscopic scale studies also play an important role. Droplet size is classified by the American Standard ASABE S572.1 [18]. The standard divides droplet size into eight ranges, starting from smallest to largest droplet size: extremely fine, very fine, fine, medium, coarse, very coarse, extremely coarse, ultra coarse. Droplet size is important in the process of applying chemicals. Droplets with small diameters (very fine, fine) evenly cover the surface of plants while ensuring optimal use of the chemical. However, due to their small size and thus light weight, they tend to drift. Large drops, on the other hand, do not drift as easily; however, their size makes their distribution on the plant surface uneven.
Testing the spectrum of droplets produced can be done using a variety of testing methods [19,20,21,22]. A widely used method is to measure the droplet size using water-sensitive paper [23,24,25]. In their work, Longo D. et al. designed and constructed a spray nozzle analysis station, in which the stream of liquid under test is directed at Petri dishes filled with silicone oil of appropriate viscosity and density [26,27]. Typical non-invasive methods include high-speed image analysis [28,29,30,31], laser diffraction (Malvern Spraytec) [32], and laser Doppler anemometry (2D LDA/PDA) methods [16,33]. Each of the methods mentioned has its advantages but also disadvantages and limitations. The PDA method works best for homogeneous and spherical droplets, while laser diffraction uses the matching method and so all droplets deviating from the assumed shape are excluded [34]. Therefore, it is very important to choose the right test method. The comparative studies conducted give information as to the advantages and disadvantages of the various measurement methods [35,36]. In their work, Privitera S. et al. compared four research methods: Liquid Immersion, laser diffraction, Phase Doppler Particle Analysis, and Shadowgraphy, which were used to study flat-fan nozzles [37].
The use of Doppler anemometry to study the spray stream provides information on, among other things, droplet velocity distribution; average diameter: D10, D20, D21, D30, D32; and average diameters in terms of volume: Dv0.1, Dv0.5 (VMD), Dv0.9, and Dv0.98 (μm).
In the conducted study, a 2D laser analyzer LDA/PDA was used to determine selected micro and macro parameters defining the quality of operation of flat-fan spray nozzles. The main parameters characterizing the spray flux were determined. The tests were carried out for different measurement times (from T = 120 to T = 10 s). Based on the specified volume diameters (D30), the volume distribution characterized by the coefficient of variation for a single sprayer was determined. In the final stage of the study, the results of the volume distribution obtained for individual nozzles were combined to evaluate the value of the coefficient of variation for a group of nozzles. The measurement results were compared with those obtained using a groove table.
The genesis of the research was an attempt to develop a method of measuring selected micro and macro parameters using a single measuring station. The aim of the study is to apply the 2D Laser Doppler Analyzer LDA/PDA in the research in the context of obtaining information about the characteristics of the atomized liquid with the simultaneous possibility of assessing the lateral distribution of the jet volume as a function of measurement time.

2. Materials and Methods

The subjects of the study were new flat-fan nozzles: injector nozzles, ejector nozzles, standard nozzles, and nozzles with a higher pressure range. The nozzles tested were randomly selected from a group of ten for each nozzle type.
The tests were carried out for nozzles with the following catalog names and parameters: 11001VS (TeeJet, Wheaton, IL, USA) with nozzle size 01 (orange), droplet size distribution in the range of 144–235 µm F (fine), and operating pressure in the range of 1–3 bar; 11002 AirMix (Agrotop GmbH, Obertraubling, Germany) with nozzle size 02 (yellow), a droplet size distribution in the range of 250–350 µm M (medium), and operating pressure in the range of 2–4 bar; 11003 AirMix (Agrotop GmbH, Obertraubling, Germany) with nozzle size 03 (blue), droplet size distribution in the range of 350–400 µm C (coarse), and an operating pressure in the range of 2–4 bar; RS11003 (Agro Technology MMAT, Leszno, Poland) with nozzle size 03, droplet size distribution in the range of 144–235 µm F (fine), and an operating pressure in the range of 3–4 bar; and EZ11003 (Agro Technology MMAT, Leszno, Poland) with nozzle size 03, droplet size distribution in the range of 350–400 µm C (coarse), and an operating pressure of 3–3.5 bar. The spray liquid was demineralized water with a temperature in the range of 19 to 20 °C. All tests were carried out over seven working days in a controlled laboratory environment with a temperature of 20 ± 2 °C and room relative humidity between 40 and 80%. The maintenance of the same laboratory conditions resulting from the intervals between tests was verified by conducting additional measurements for the nozzles tested earlier. Deviations between individual results for the same types of nozzles did not exceed ±5%. Before the start of the main tests, the discharge rate of the liquid from each nozzle was measured to verify the correctness of their output. Individual tests showed that the maximum deviation did not exceed ±3% from the values in the catalog data.
The study began by determining the variation of coefficients characterizing the spray spectrum in the form of average volume diameters Dv0.1, Dv0.5, and Dv0.9; relative span factor (RSF); arithmetic mean diameter (D10); volume diameter (D30); and percentage of total volume of droplets smaller than 100 µm (V100). All coefficients were tested as a function of variable measurement time. Then, based on the volumetric diameter of D30, the value of the coefficient of variation of the liquid distribution CV (for a single sprayer) was determined. In the final stage of the study, a composite of individual test results was performed to obtain the CV coefficient of variation for the spray boom section. The correctness of the obtained test results (CV coefficient for a single sprayer and for a virtual boom) was verified on a groove table. A diagram of the use of the two measurement methods is shown in the assembly (Figure 1).
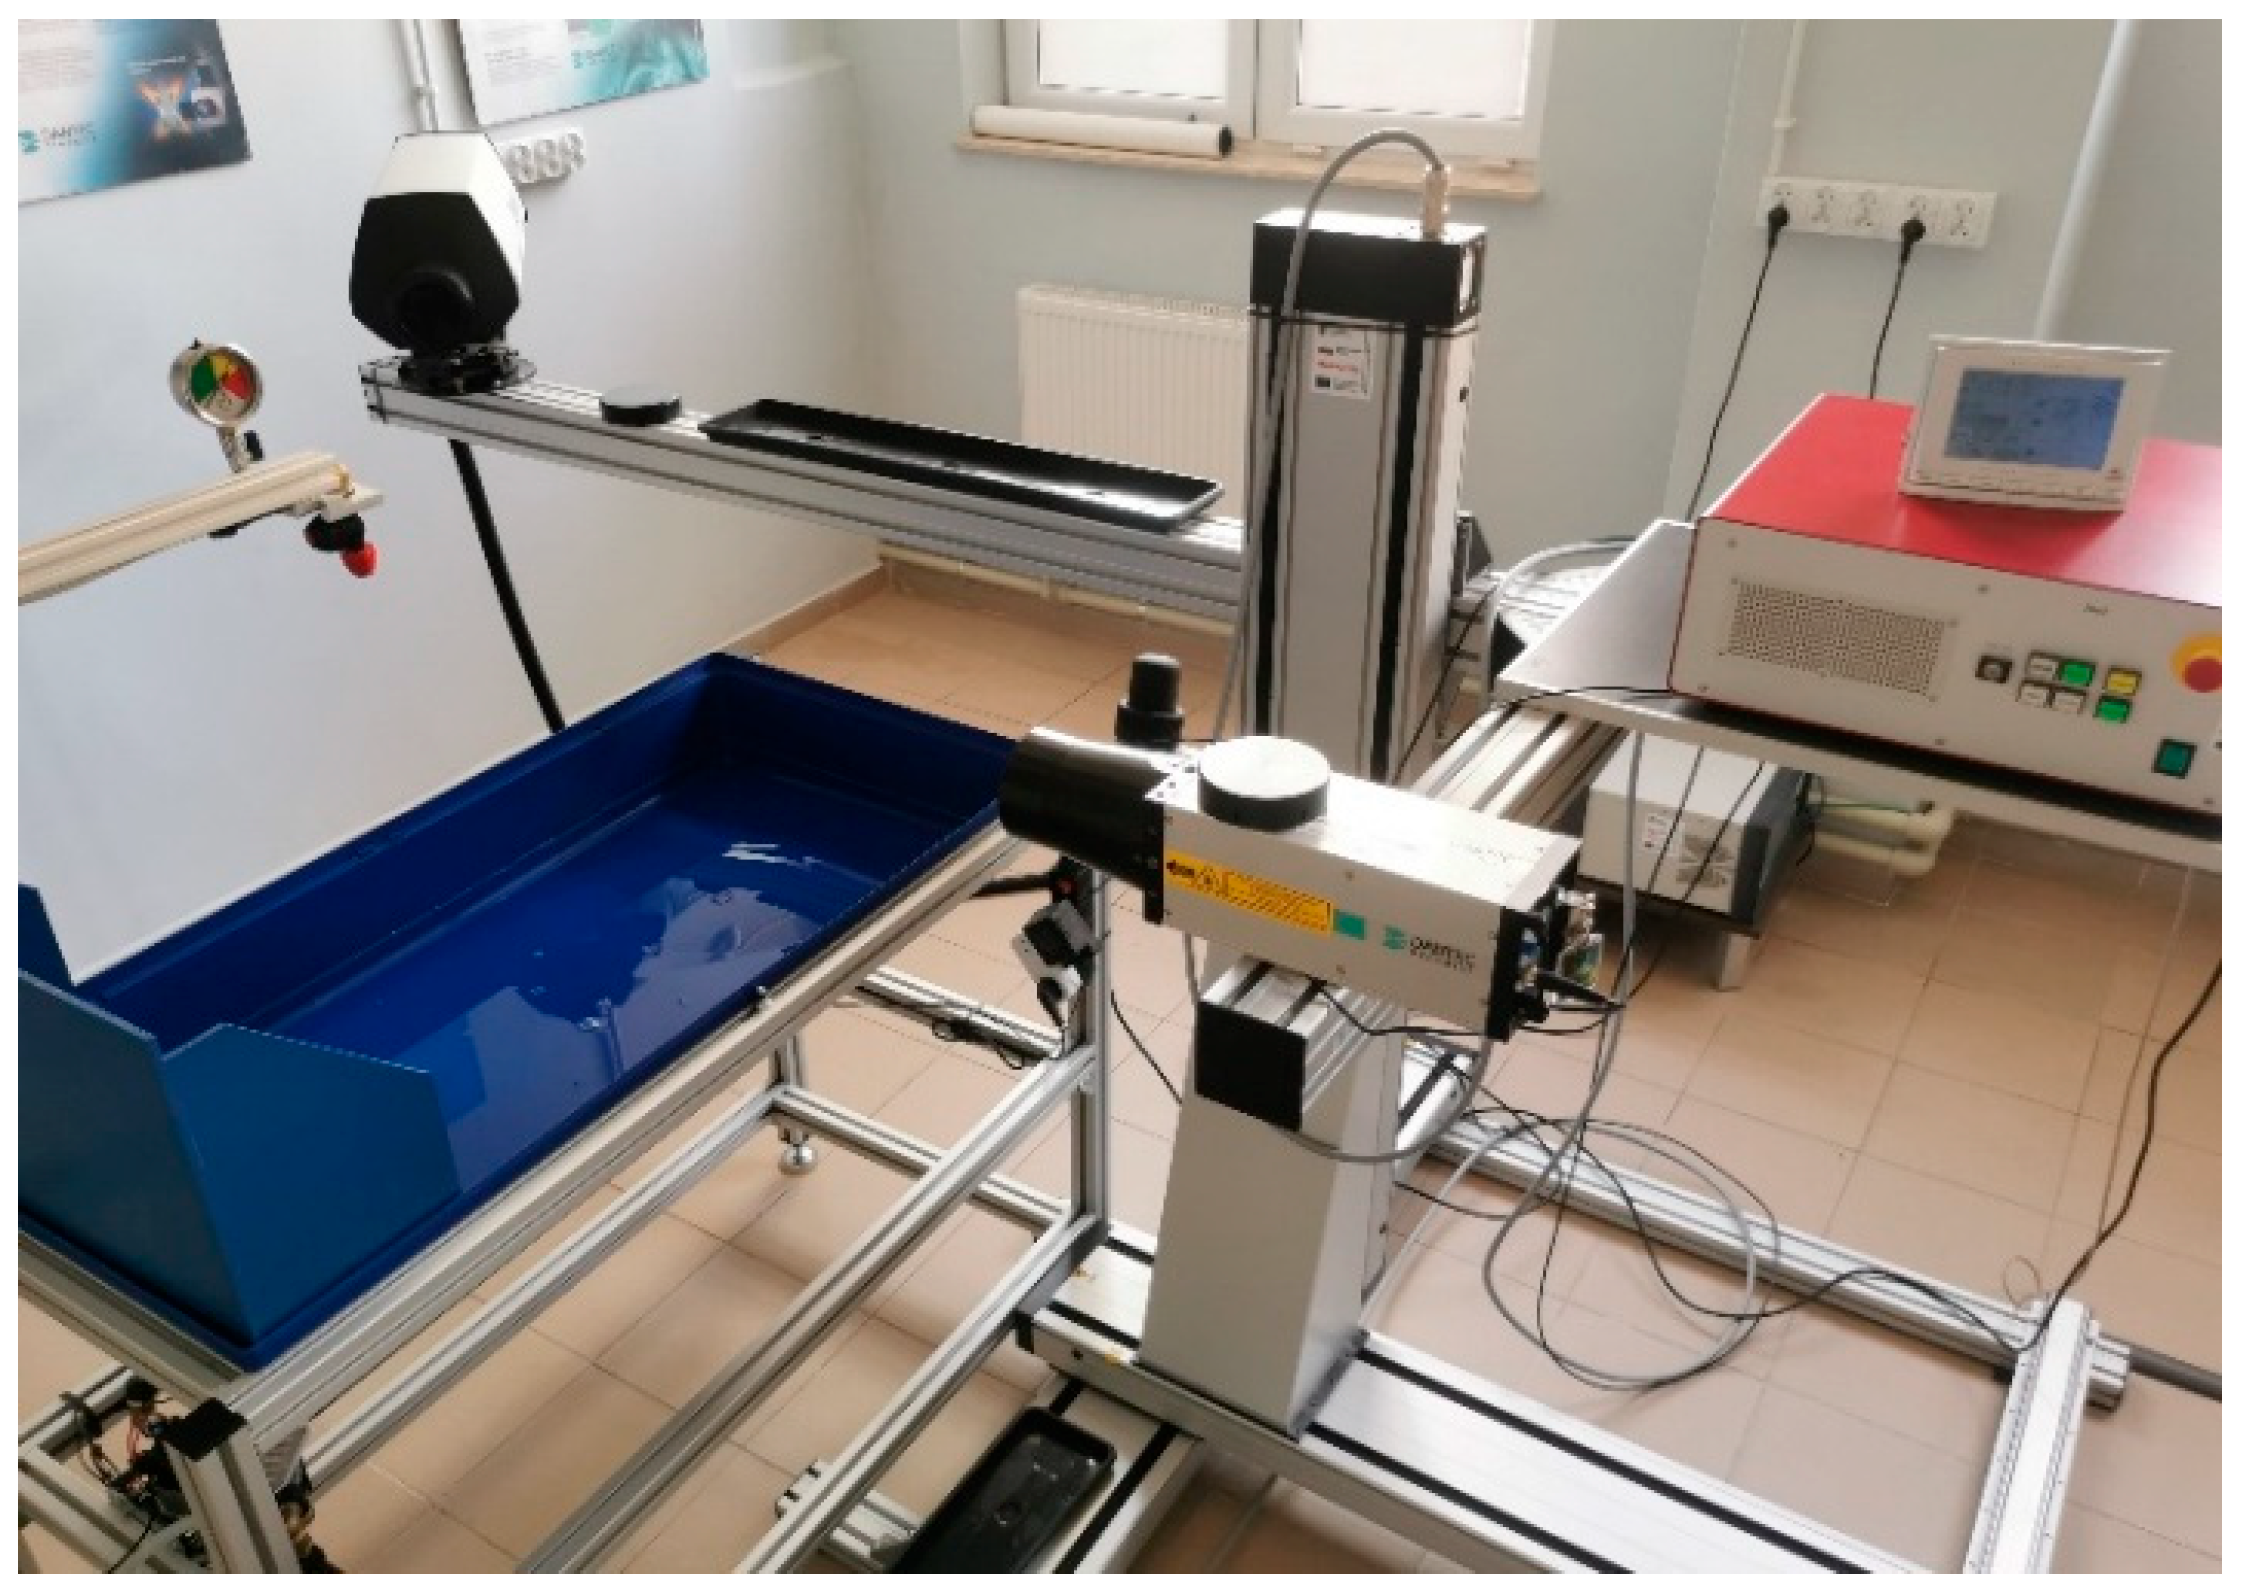
The study of the distribution of the spray spectrum as a function of a variable measurement time value was carried out using a 2D LDA/PDA laser droplet analyzer from Dantec Dynamics (Skovlunde, Denmark) (Figure 2) applying the following parameters (Table 1).
A study of the distribution of the spray spectrum for the individual nozzles was carried out along the y-measurement axis (Figure 3). The receiving probe in relation to the laser beam is located at an angle of 43.5°, which ensures the dominance of the light scattering mode refraction. In their work, Nuyttens D. et al. write that PDPA measurements are not based upon the scattered light intensity and, consequently, are not subject to errors from beam attenuation or deflection which occur in dense particle environments [38]. The intersecting laser beams create a measurement space (v) for the moving liquid particles. The measuring system of the bench is located on a movable triaxial crosshead providing movement of the laser beam (measurement space v) relative to the fluid stream under test. The measurement step value Δx = 25 mm corresponds to the distance between the center of the individual grooves on the groove table. The stepwise movement of the measuring point was carried out with a positioning accuracy of 10 µm. The measurement distance in the vertical axis (z) was h = 400 mm, which is in accordance with the range specified in ISO/FDIS 25358:2018 [39]. The liquid pressure for all the nozzles tested was 3 bar and within their operating range.
The pressure of the spray liquid was measured directly in front of the nozzle with an accuracy of 0.1 bar. Spray spectrum studies were conducted as a function of varying measurement time. The study began for a time of T = 120 s at each discrete measurement point. Subsequently, the tests were implemented for times T = (80, 60, 40, 20, 10) s. Time was measured to the nearest 0.1% for each time interval.
To determine the volume distribution, also known as the spray density, the coefficient of variation, denoted CV, should be used [40]. To calculate the CV, the standard deviation (σ) and volume ( V ¯ ) were determined using the following equations:
CV = σ V ¯ · 100 %
where σ is the standard deviation for the sample, and V ¯ is the arithmetic mean of the results.
σ = i = 1 n V i V ¯ 2 n 1
V ¯ = 1 n · i = 1 n V i
where V i is the volume of liquid in the i-th groove of the measurement table or the i-th measurement point using a 2D LDA/PDA analyzer, and n is the number of measurement points.
The coefficient of variation, CV (1), was determined from the standard deviation of the sample (2) and the arithmetic mean of the results (3).
In order to determine the conventional value of liquid volume for a given measurement point, the diameter D30 representing a homogeneous substitute collection of drops, with the same volumes, was used. The number of occurrences (counts) of droplets for a given measurement area was determined by varying the measurement time (from 120 to 10 s), the type of sprayer tested, and also the position of the measurement area with respect to the axis of the sprayer. Based on the volumes of liquid from the given measurement areas determined as a function of time, the value of the CV index for a given sprayer was calculated.
The CV value for the spray boom section was determined using the author’s computer program. Individual spray volumes obtained from the volumetric diameter D30 from successive PDA measurement points were aggregated to a groove width of 100 mm. The obtained CV result for a single nozzle was duplicated by the computer program so that the axes of the individual nozzles were 500 mm apart along the y-axis (as for real operating conditions), and the liquid streams for adjacent grooves overlapped (Figure 4). The area to be analyzed was determined by the coverage area of the central sprayer.
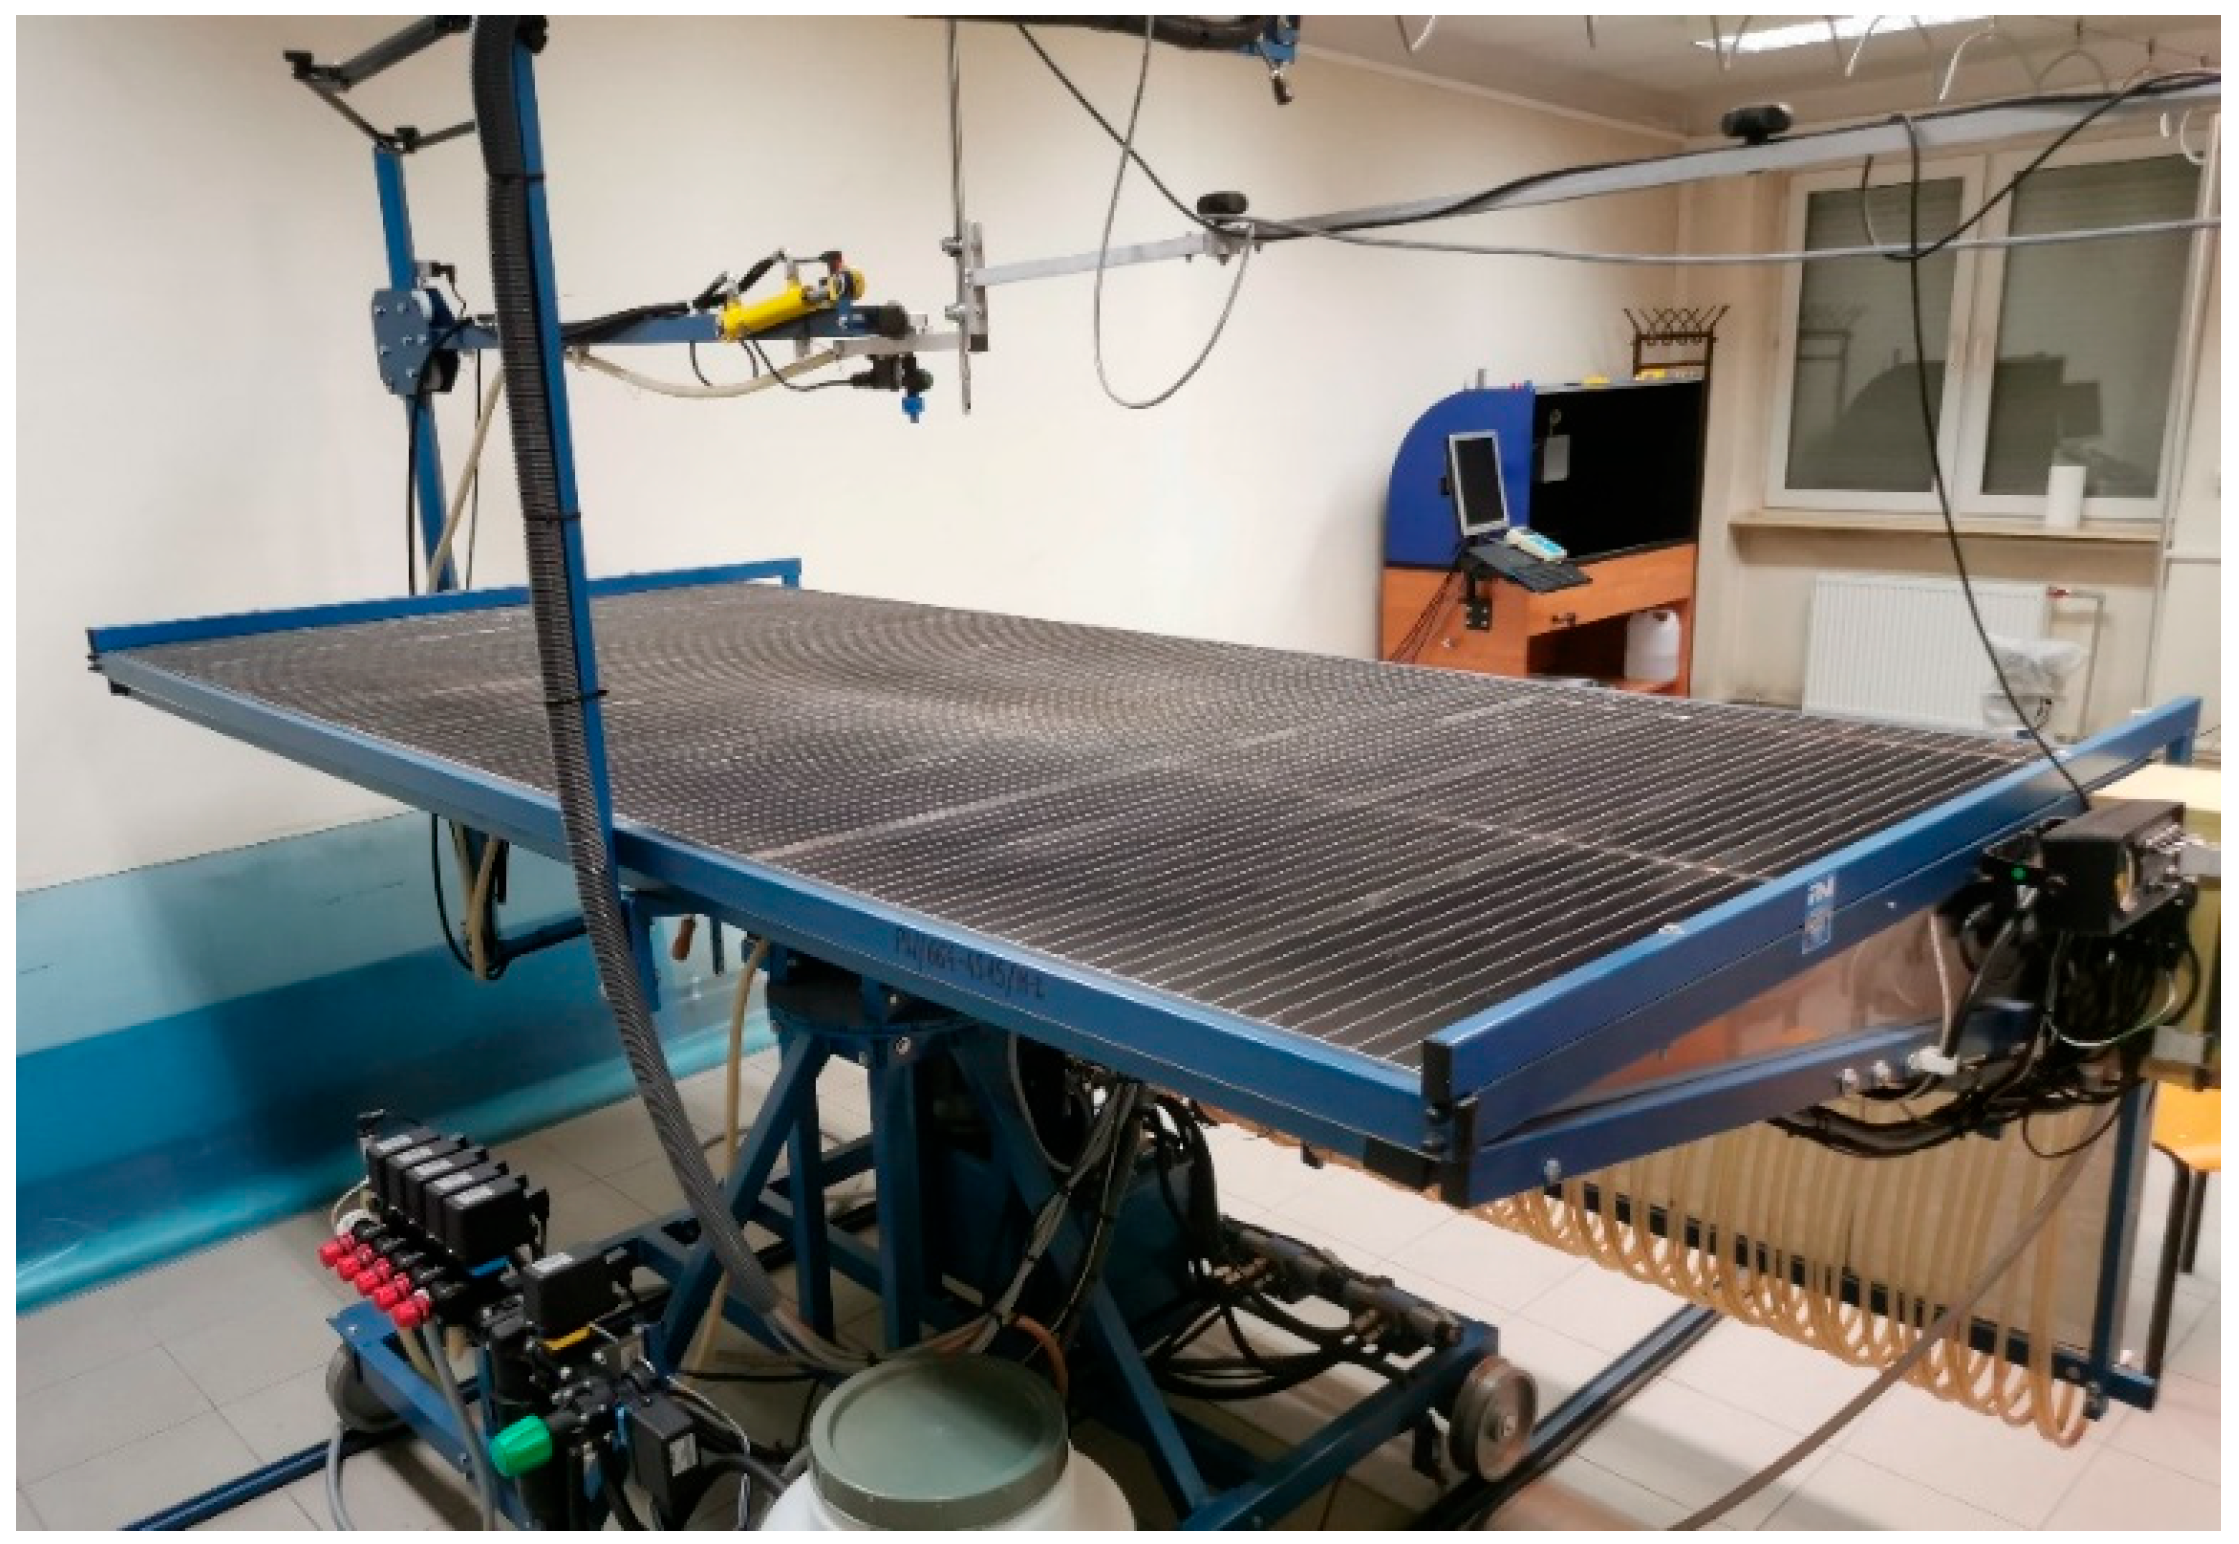
The comparative study of the coefficient of variation of liquid distribution was carried out on a groove table (Figure 5) with a groove width of 25 mm. The distance of the table surface from the nozzle was 400 mm (as in the PDA bench tests) measured to an accuracy of ±2 mm. The measurement time for all nozzles was the same and amounted to 120 s. Time was measured to the nearest 0.2 s. Accuracy of volume reading in a single measuring vessel was ±1 mL. The stand was equipped with a system that allowed for automation of measurements. Volume results from individual grooves were transferred to a computer workstation where the CV value for a single sprayer was determined.
From the group of measured micro parameters, volumetric diameters (Dv0.5, Dv0.9, Dv0.1) were analyzed in detail as a function of variable measurement time. For the evaluation of macro parameters, the transverse volume distribution for a single nozzle was analyzed. The CV coefficient obtained from the calculated volumes V (D30) was compared with with the CV coefficient of variation from the groove table. In the case of transverse distribution for the cross-section of a virtual beam, evaluation of the results was carried out in the context of differences in the coefficient of variation and the number of cylinders outside the tolerance of ±15% of the average volume value.

3. Results and Discussion

To achieve the first objective of evaluating the variation in spray spectrum coefficients as a function of varying measurement time values, laboratory tests were conducted for five flat-fan spray nozzles of different types using a 2D LDA/PDA laser analyzer. The measurement system was calibrated to provide repeatable measurements for each nozzle with a maximum deviation (Dv0.5) between measurements of ±5% for the same settings. Measurement conditions were a function of the variable measurement time with a minimum of 10,000 drops measured in the spray stream. The measurement time in a fixed step motion was set to be the same for all discrete spray stream measurement positions.
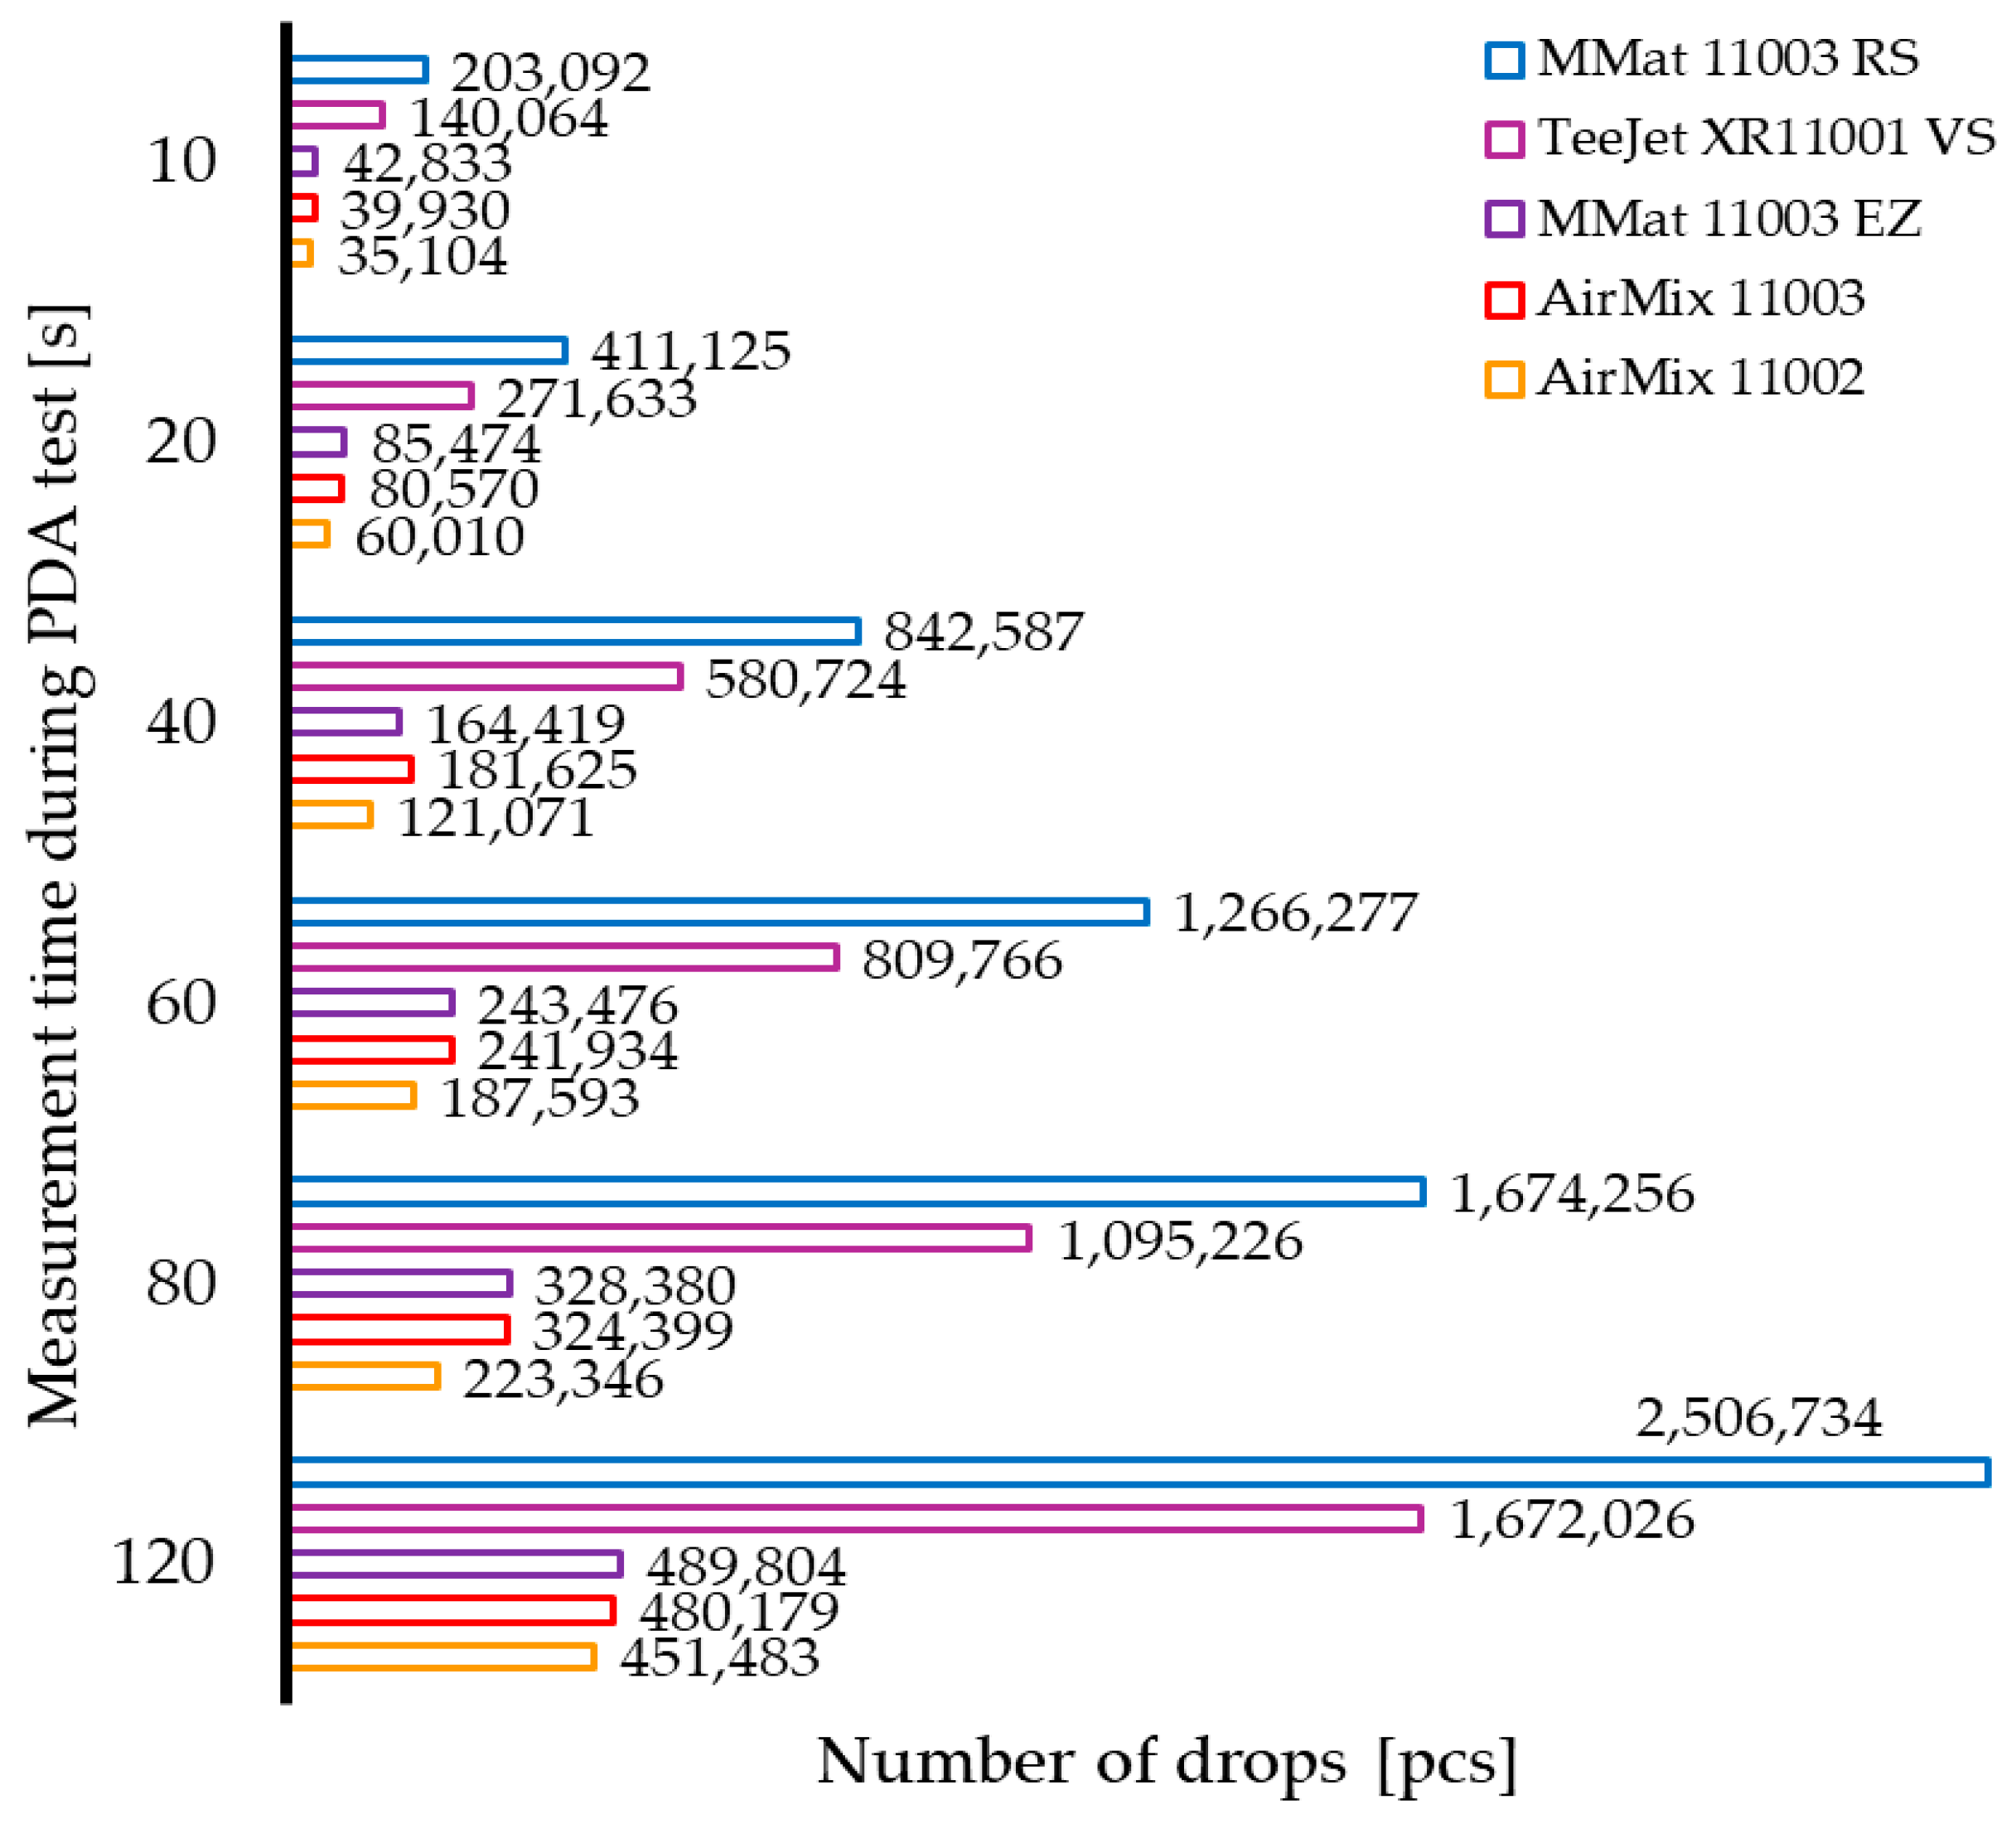
Table 2 presents the measurement results in numerical form. The table includes selected spray spectrum coefficients representing average values determined on the basis of results obtained from experimental data of actual diameters measured at successive measurement points during the PDA test in the spray stream. Measurements of droplet size and number were performed as a function of a variable measurement time. The results were presented for discrete time values T (120, 80, 60, 40, 20, 10) s. The characteristics are presented in the form of arithmetic (D10) and volumetric (D30) mean diameters; average volumetric diameters below which smaller droplets account for 10, 50 and 90% of the total volume (Dv0.1, Dv0.5, Dv0.9); relative span factor (RSF); and percentage of total volume of droplets smaller than 100 μm (V100). Table 3 and Table 4, for the selected nozzle (AirMix 11003), show the results from the full measurement range in the form of the number of measured droplets (Figure 6) and the coefficients of the spray spectrum (D30, Dv0.5, Dv0.9) at the measuring points of the jet for the T times adopted in the tests.
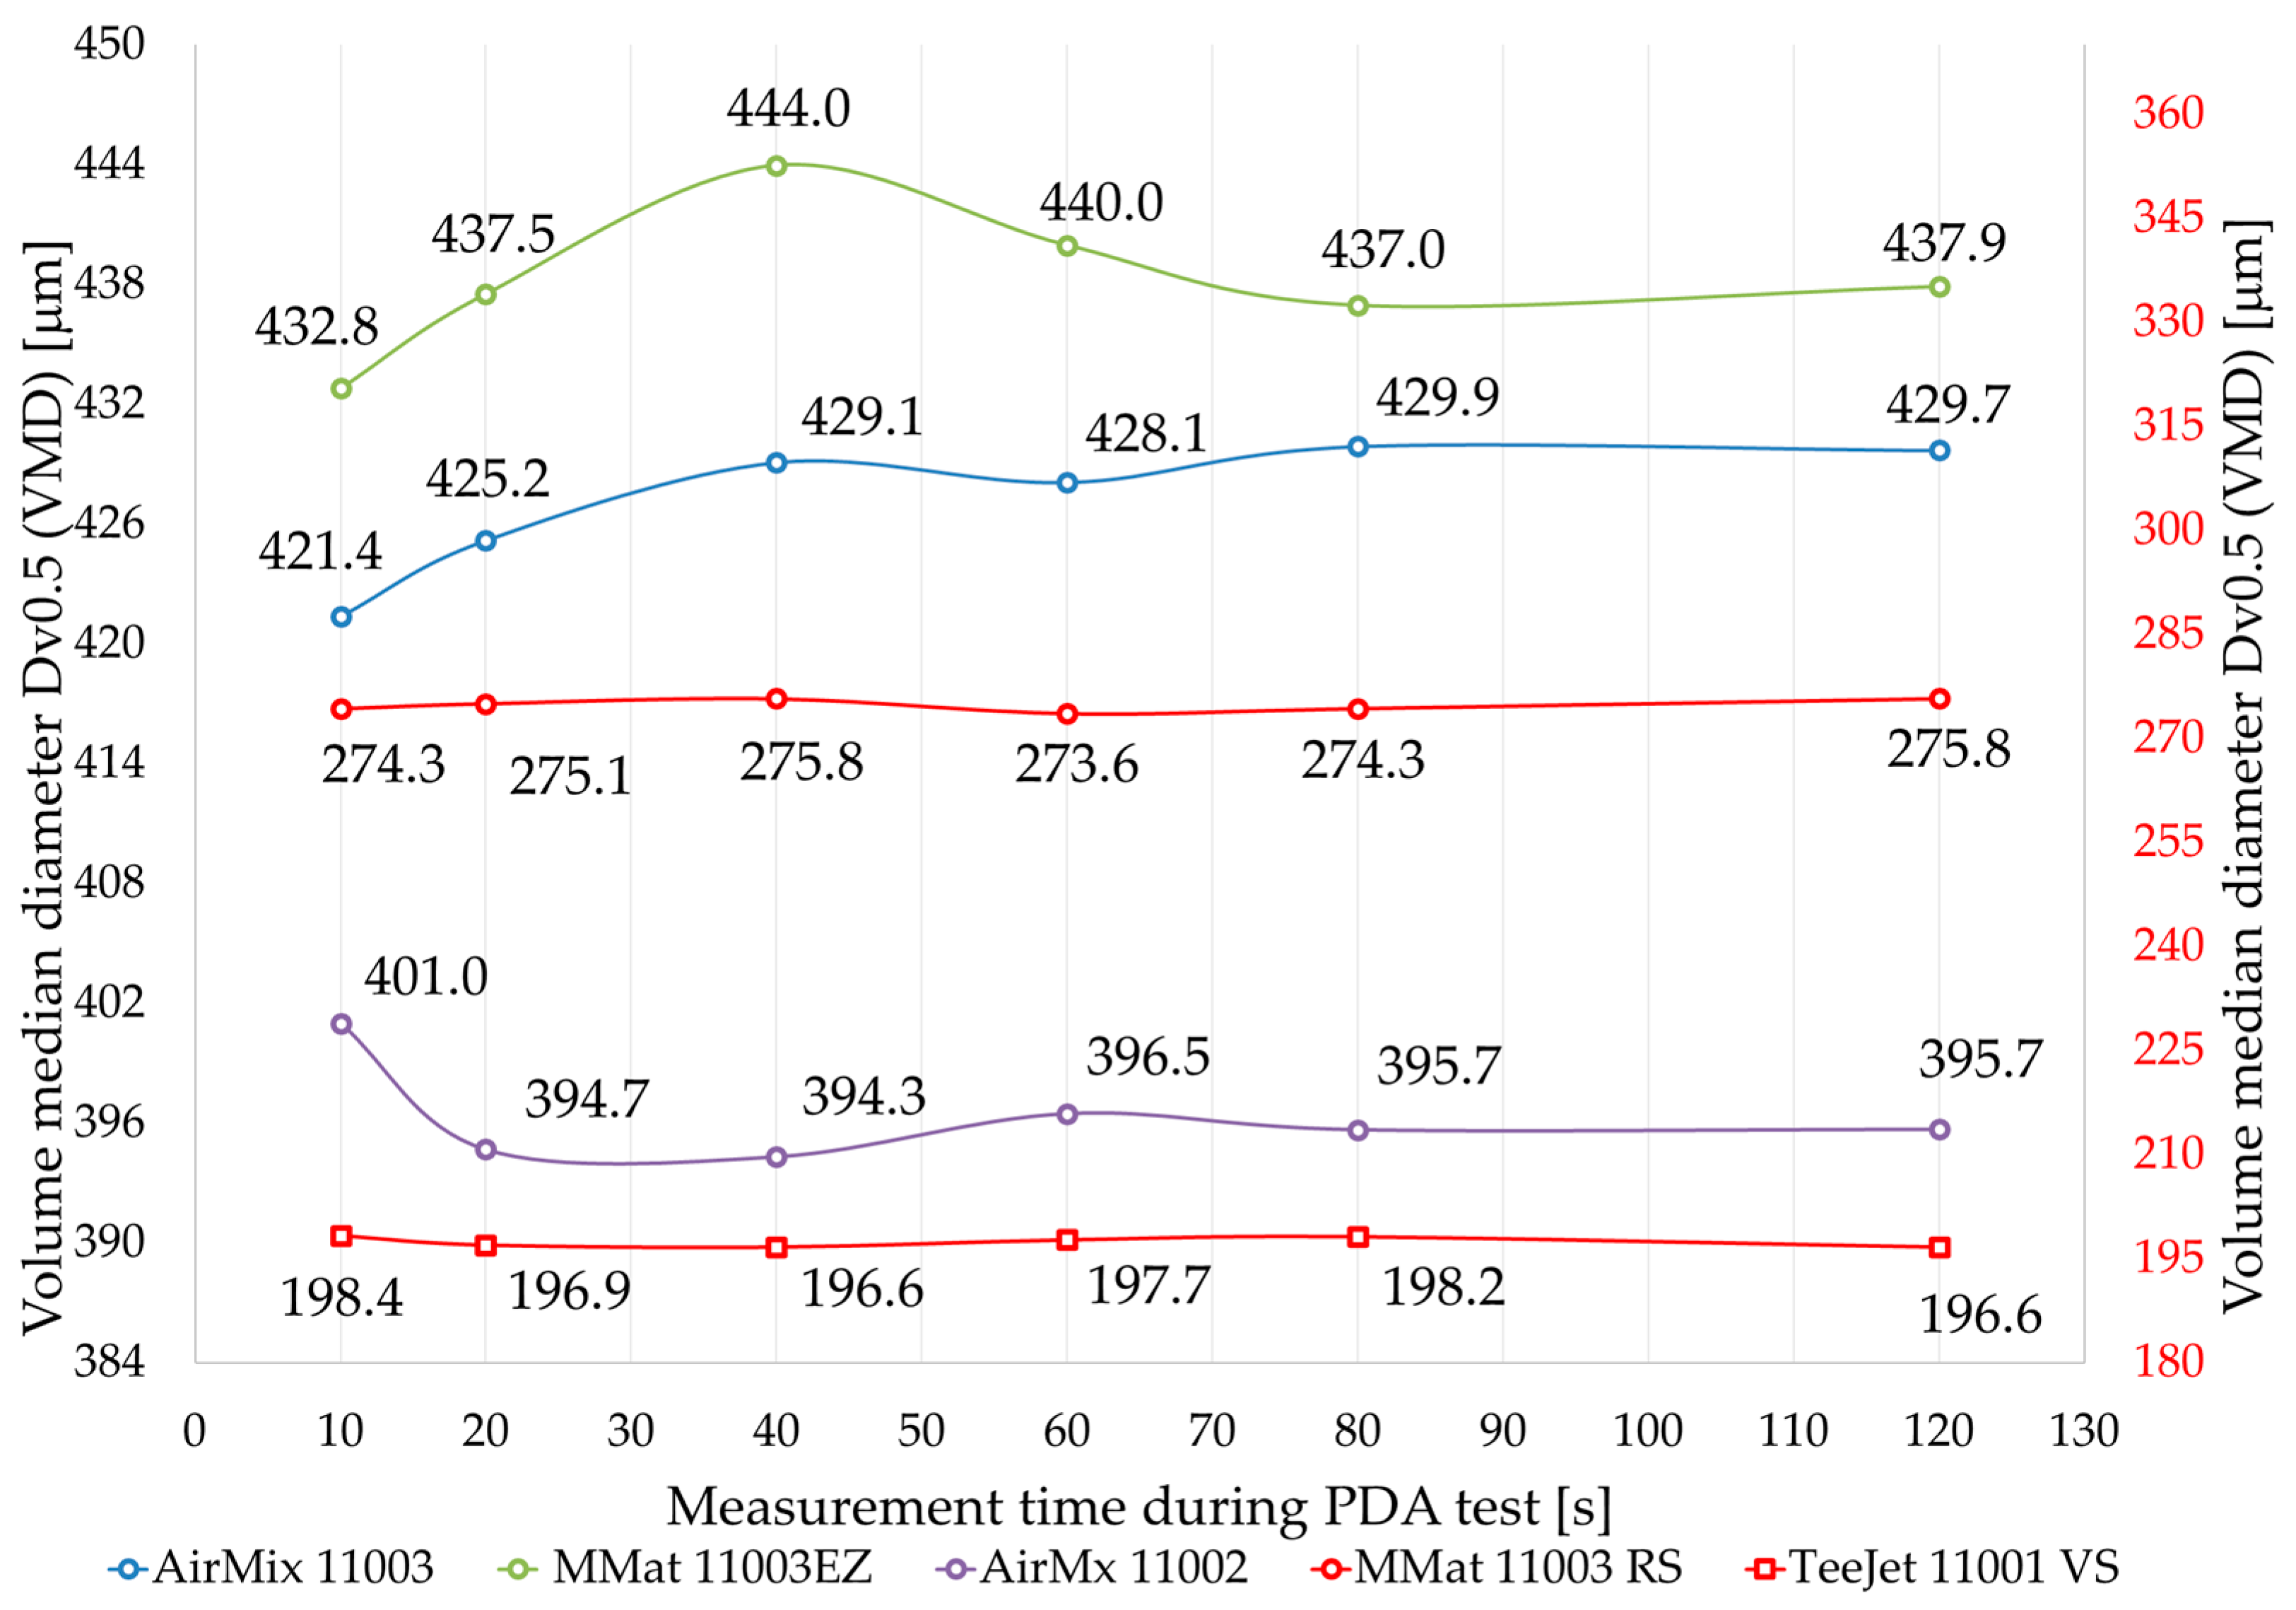
On the basis of the analysis of the test results (Table 2, Figure 7), it was found that the median volume diameter Dv0.5 (VMD) values varied depending on the adopted measurement time. The study shows that for a reduced value of measurement time, and thus a decrease in the number of measured drops in successive trials, the spread of the volume median value (difference between maximum and minimum value), respectively, was recorded in the range: (i) AirMix 11003—8.5 μm, (ii) MMat 11003EZ—11.2 μm, (iii) TeeJet 11001VS—1.8 μm, (iv) MMat 11003RS—2.2 μm, and (v) AirMix 11002—6.7 μm. The variability of the median volume expressed by the coefficient of variation was, respectively, (i) AirMix 11003—0.78%, (ii) MMat 11003EZ—0.84%, (iii) TeeJet 11001VS—0.4%, (iv) MMat 11003RS—0.32%, and (v) AirMix 11002—0.61%. The smallest differences in the relative values of the volumetric median were observed for a minimum of 185,000 drops measured in the fluid stream during the test. For nozzles with a predominant spectrum of coarse (C) and medium (M) droplets, i.e., AirMix (11002—0.8 μm, 11003—1.6 μm) and MMat (11003EZ—3 μm), such a condition was observed in the range from T = 120 s to T = 60 s of the test time. For nozzles with a dominant spectrum of fine droplets (F), i.e., for the MMat sprayer (11003RS—2.2 μm) over the full range of measurement times T = (120, 80, 60, 40, 20, 10) s and TeeJet sprayer (11001VS—1.6 μm) up to a minimum test time of T = 20 s, there was little variation in median volume diameter values over almost the entire range of measurement times.
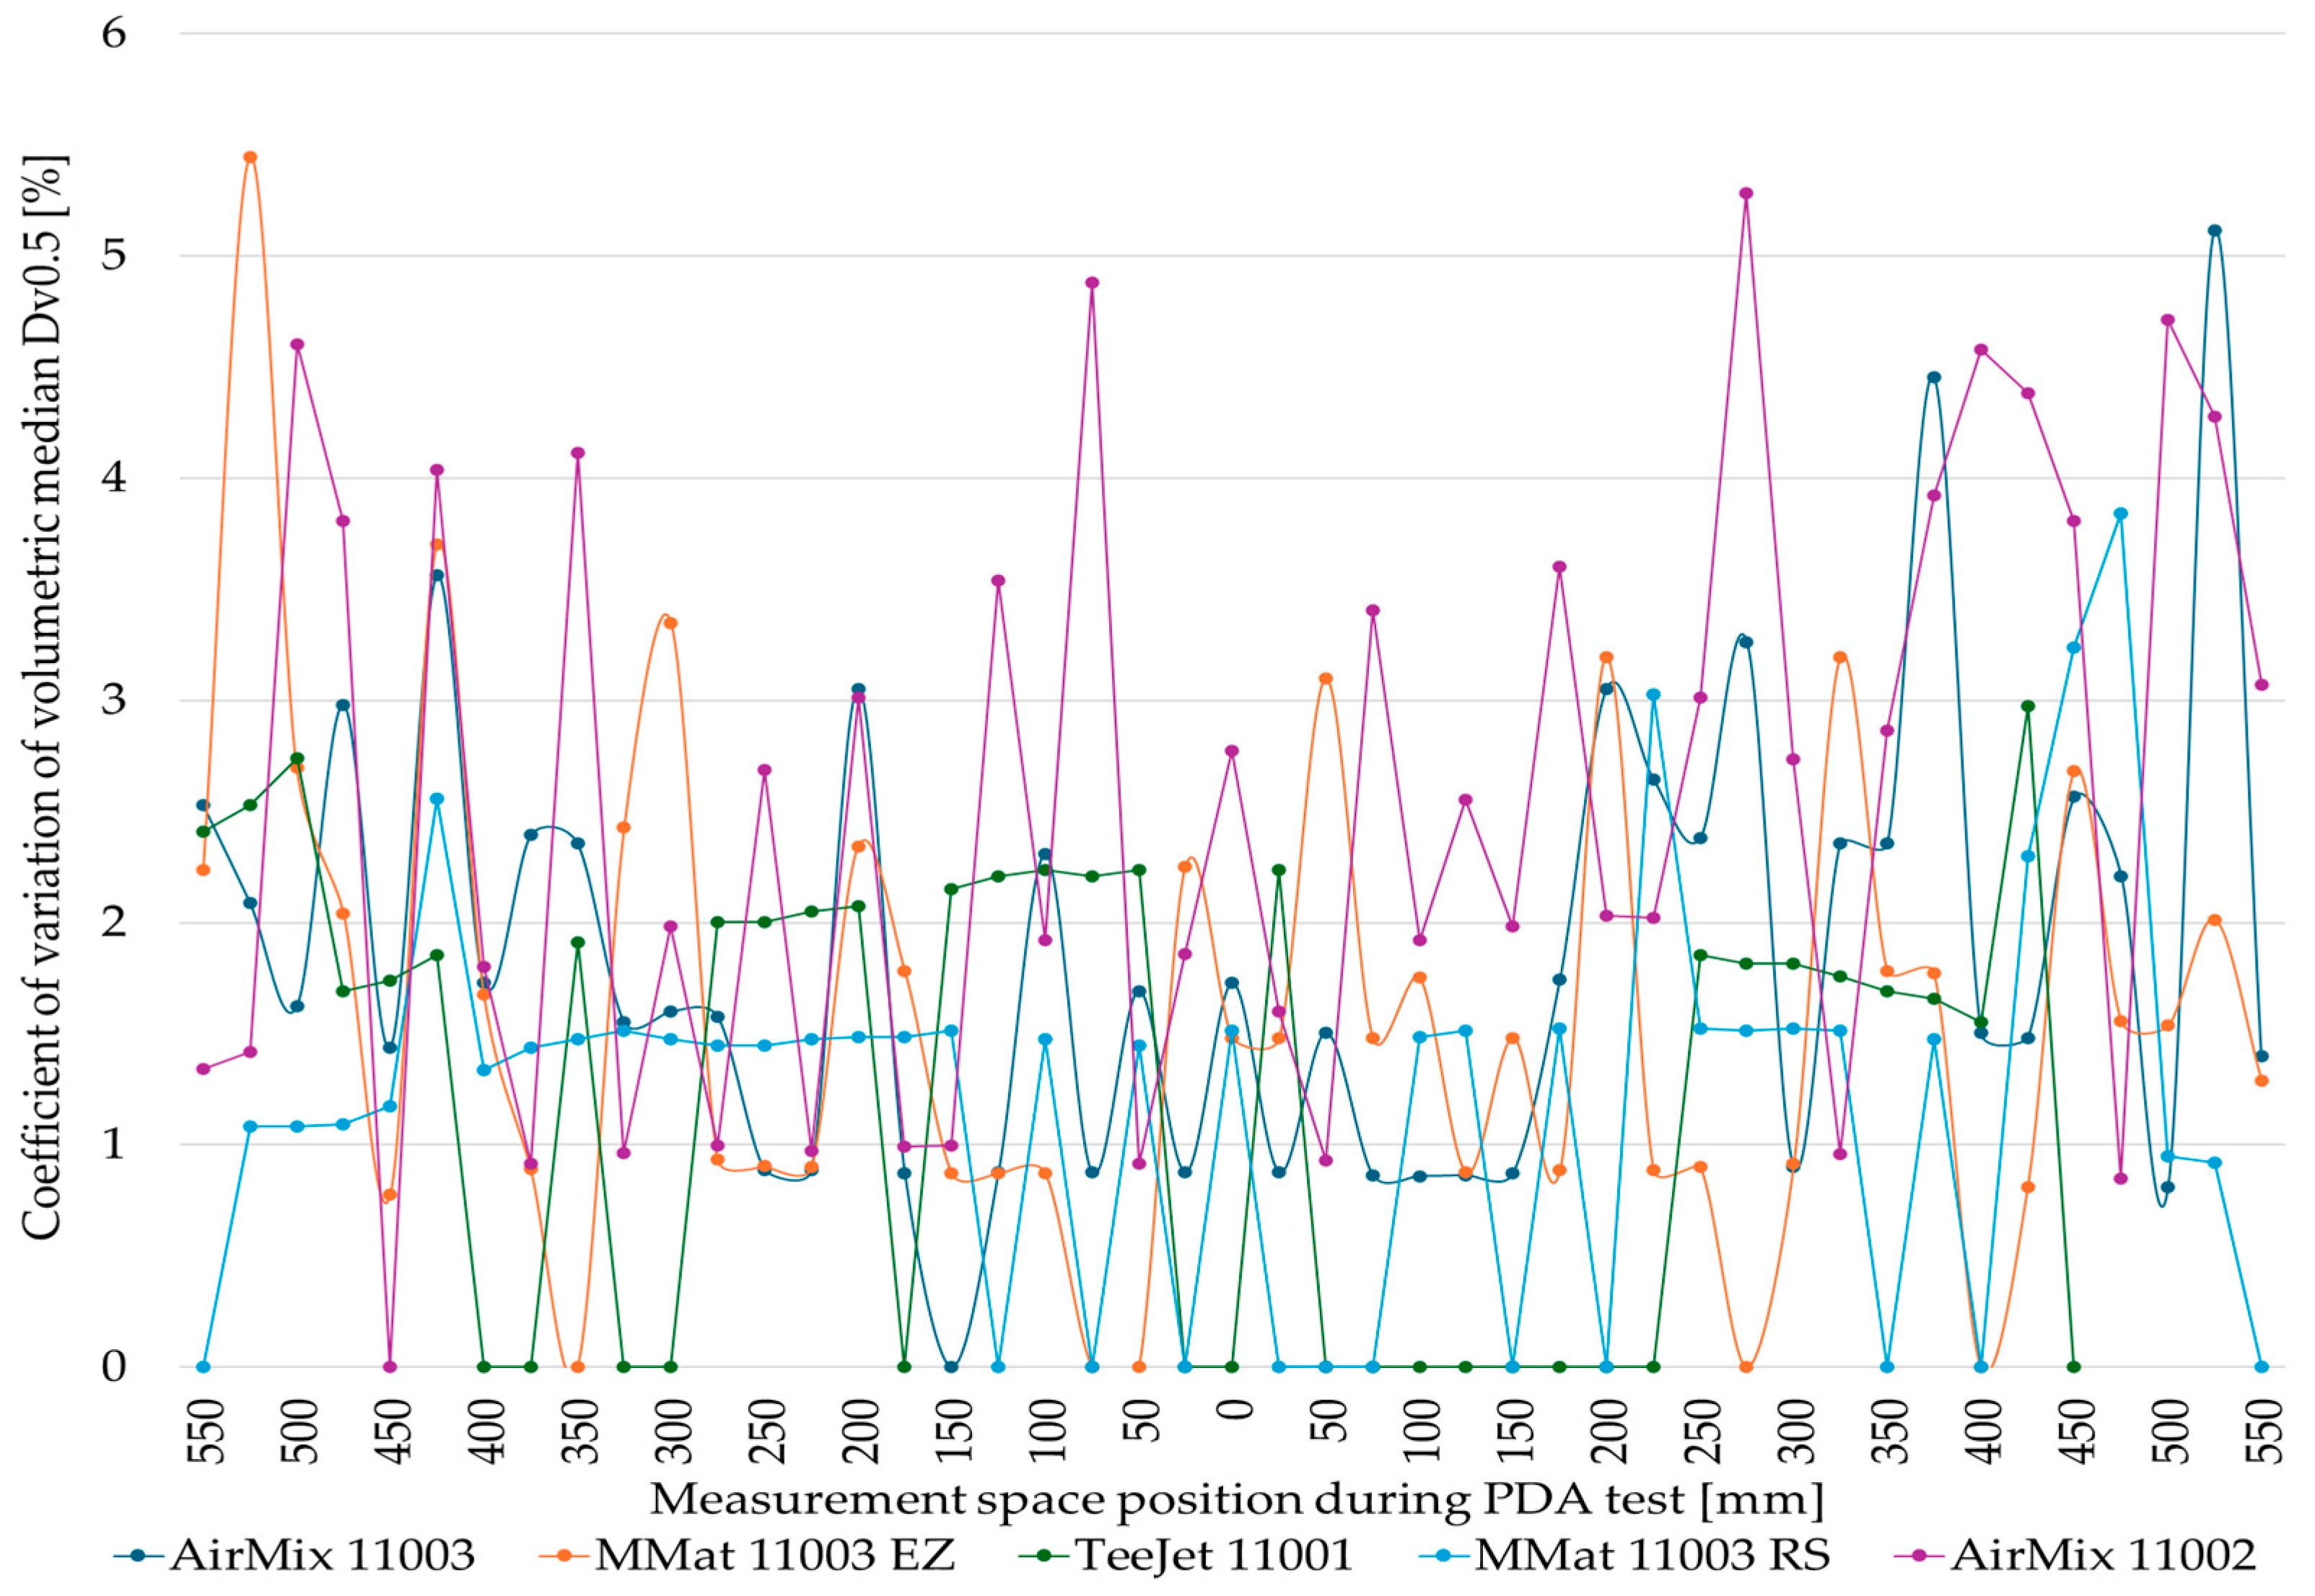
In the graph (Figure 8), the results of the median volume expressed by the coefficient of variation are presented. The results are summarized for a group of test nozzles, obtained in successive measurement cycles for a variable measurement time. For the six volumetric diameters (Dv0.5), depending on the time of the test run, the relative coefficients of the measure of the variations in their distribution (4) were calculated at the measurement points during the PDA test.
V D v 0.5 = S X ¯
where S is the sample standard deviation, and X ¯ is the arithmetic mean of the sample.
The results presented here indicate a relative variation in the median volume diameter of Dv0.5 of less than 10% (Figure 8). For the TeeJet 11001VS nozzle, the range of variation was 0–5.7%, while for the MMat 11003 RS nozzle, 0–5.6% was recorded. The results confirm the slight differences in the median volumetric diameter values presented and discussed above, determined as the average value for the entire fluid stream, almost over the entire range of measurement times. For nozzles with a larger range of diameters in the spectrum, i.e., the AirMix (11002, 11003) and MMat 11003 EZ, and the smaller number of droplets analyzed during the test (Table 1), clear differences were observed in the values of the relative coefficient taken as a measure of variation. Significant variability was noted at measurement points in areas from 150 to 550 mm away from the axis of the liquid stream for the left and right sides. The recorded changes indicate that the cause of this condition is primarily the decreasing number of droplets recorded in the liquid stream, caused by limiting the measurement time T. The reduction in their number at the measuring points as the distance from the axis of the liquid jet increases is also significant. This is a natural condition for flat-fan nozzles. For this group of nozzles, differences were already noted when analyzing the median average values for the entire spray, especially for the measurement time T = (40, 20, 10) s. Figure 9 presents the results of the median volume diameter Dv0.5 expressed by the coefficient of variation for limited test times T = (120, 80, 60) s. For the AirMix 11003 nozzle, the range of variation was 0–5.1%; for the MMat 11003 EZ nozzle, 0–5.4% was recorded; and for the AirMix 11002 nozzle, 0–4.7% was recorded. A marked decrease in the value of the coefficient of variation was found, suggesting greater stability of the volume median values in the adopted measurement time ranges T = (120, 80, 60) s throughout the entire study area.
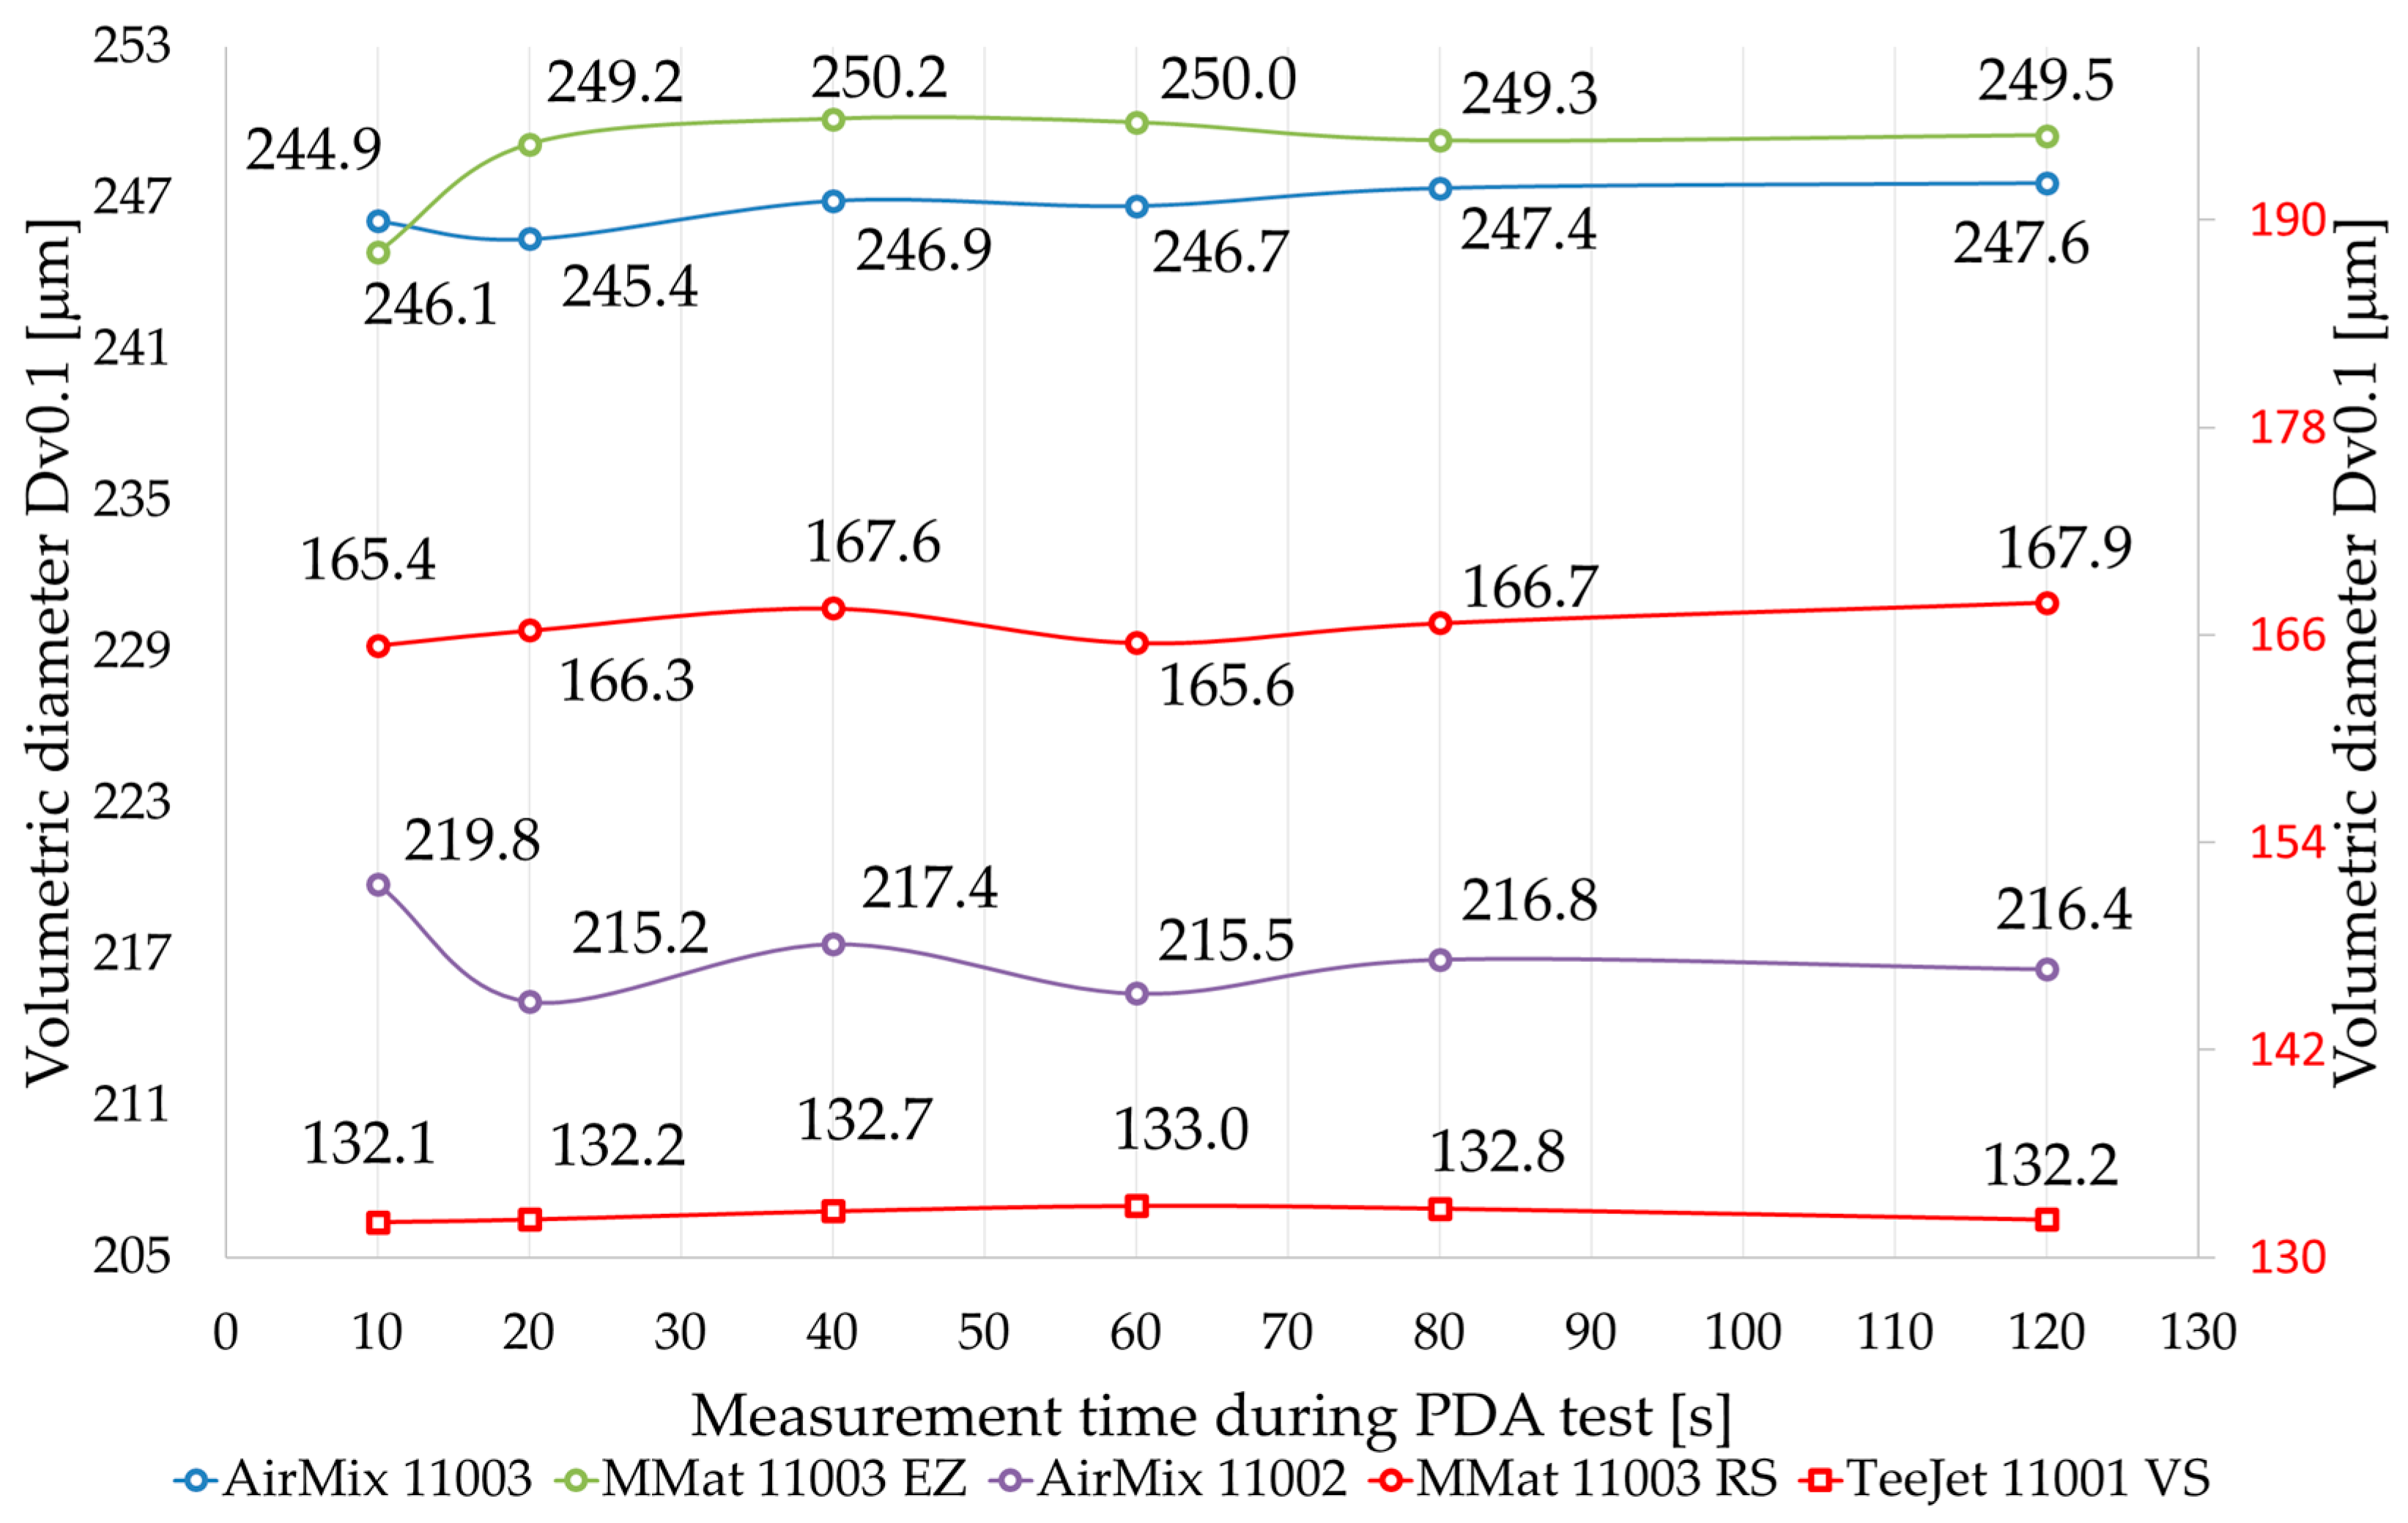
From the point of view of assessments of the droplet size spectrum, it is also important to analyze the values and variability of the volumetric diameters Dv0.1 and Dv0.9 (Figure 10 and Figure 11, Table 2). It is clear that the larger the value of Dv0.1, the lower the drift potential. In contrast, the higher the value of Dv0.9, the lower the number of droplets that provide adequate coverage. The coverage and effectiveness of the spray may be reduced because in some applications, there may not be enough droplets to adequately cover the surfaces being sprayed. When measuring the volume diameter Dv0.9, slight variations in its value were also observed for reduced time values, as follows: (i) AirMix 11003—13.2 μm, (ii) MMat 11003EZ—5.4 μm, (iii) TeeJet 11001VS—3.9 μm, (iv) MMat 11003RS—1.6 μm, and (v) AirMix 11002—13.9 μm. A similar nature of Dv0.9 variability was observed as in the case of the median volume diameters. As in the case of the median volume diameter, slight differences in the Dv0.9 volume diameter values were observed between T = 120 s and T = 60 s of the test time for nozzles with a dominant spectrum of coarse (C) and medium (M) droplets produced.
In the case of measuring the volumetric diameter Dv0.1, small changes were also observed in its value for the reduced value of time. The tests showed the following values: (i) AirMix 11003—2.2 μm, (ii) MMat 11003EZ—5.3 μm, (iii) TeeJet 11001VS—0.9 μm, (iv) MMat 11003RS—2.5 μm, (v) AirMix 11002—4.6 μm. The results of the measurements showed a similar nature of variation as in the case of volume median diameter and volume diameter Dv0.9.
Slight fluctuations in the spray spectrum of volume diameters (Dv0.5, Dv0.9, Dv0.1) across almost the entire range of measurement times T = (120, 80, 60, 40, 20, 10) s, provide stable relative span factor (RSF) results. The lower the relative span factor, the smaller the differences in droplet size. When considering the spray process, the phenomenon of liquid drift should be included in the evaluation of the spectrum. Wind has the greatest influence, but the effect of droplet size should also be considered. Small droplets, having a low mass compared to large ones, can stay in the air for a longer time. This results in a higher probability of drift due to wind. Another factor unfavorable to the drift phenomenon is humidity. During low humidity and therefore high temperature, small diameter droplets are exposed to vaporization. In this case, it is also important to evaluate the stability of the coefficient value as a percentage of the total volume of droplets smaller than 100 μm (V100). Despite limiting the measurement time in successive trials, stable and comparable values were obtained for each nozzle tested.
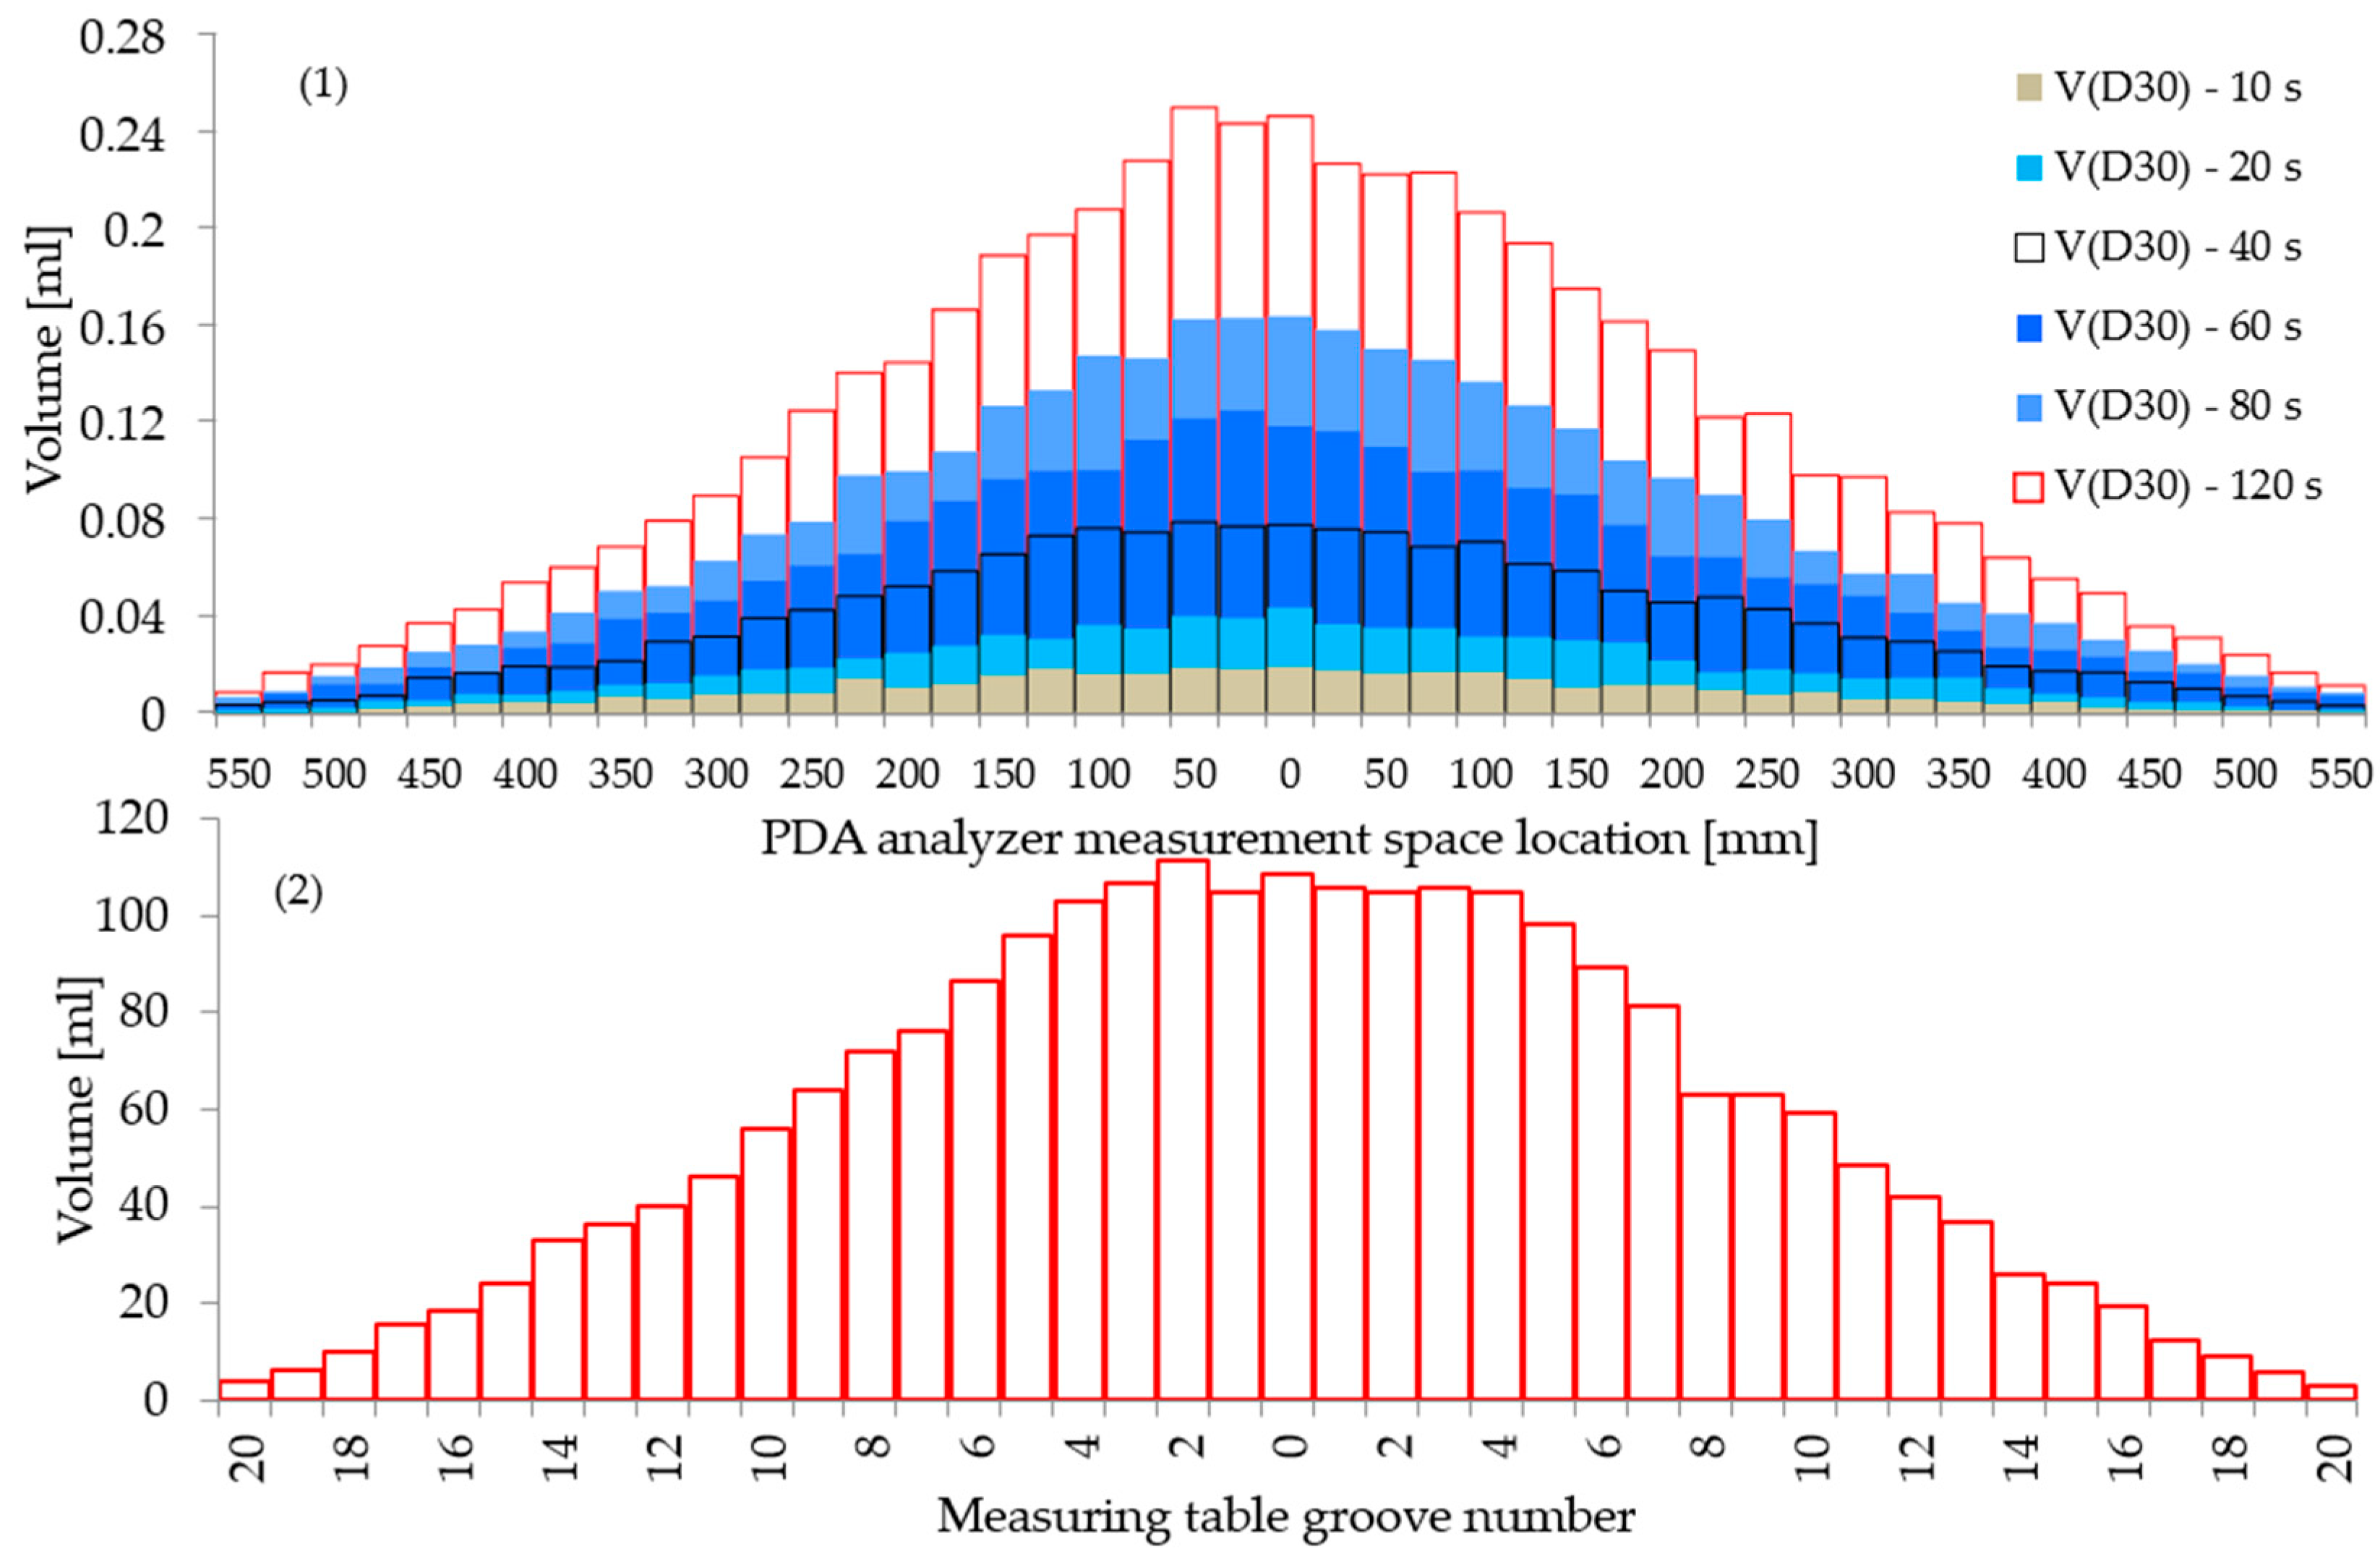
To achieve the second objective of determining the volume distribution and evaluating the variation of CV(D30) for a single nozzle as a function of varying measurement time, the average volumetric diameter D30 was used. The diameter represents a homogeneous set with the same number of drops and the same total volume of drops measured during tests performed with a PDA analyzer. The method for determining the volume distribution is presented in the works [16,40]. Based on the recorded droplet diameters, the volume of liquid at the assumed points of the liquid stream was calculated, which made it possible to assess its distribution. Verification of the obtained results and evaluation of their variability was carried out by conducting volume distribution tests on a bench equipped with a groove table. Preliminary results for such an innovative method of evaluating the volume distribution of sprayed liquids were presented in paper [40]. Histograms of the distribution of the volumes, based on PDA analyzer tests using a bench equipped with a groove table, for a nozzle (AirMix 11003) selected from the group of test nozzles, are presented in Figure 12.
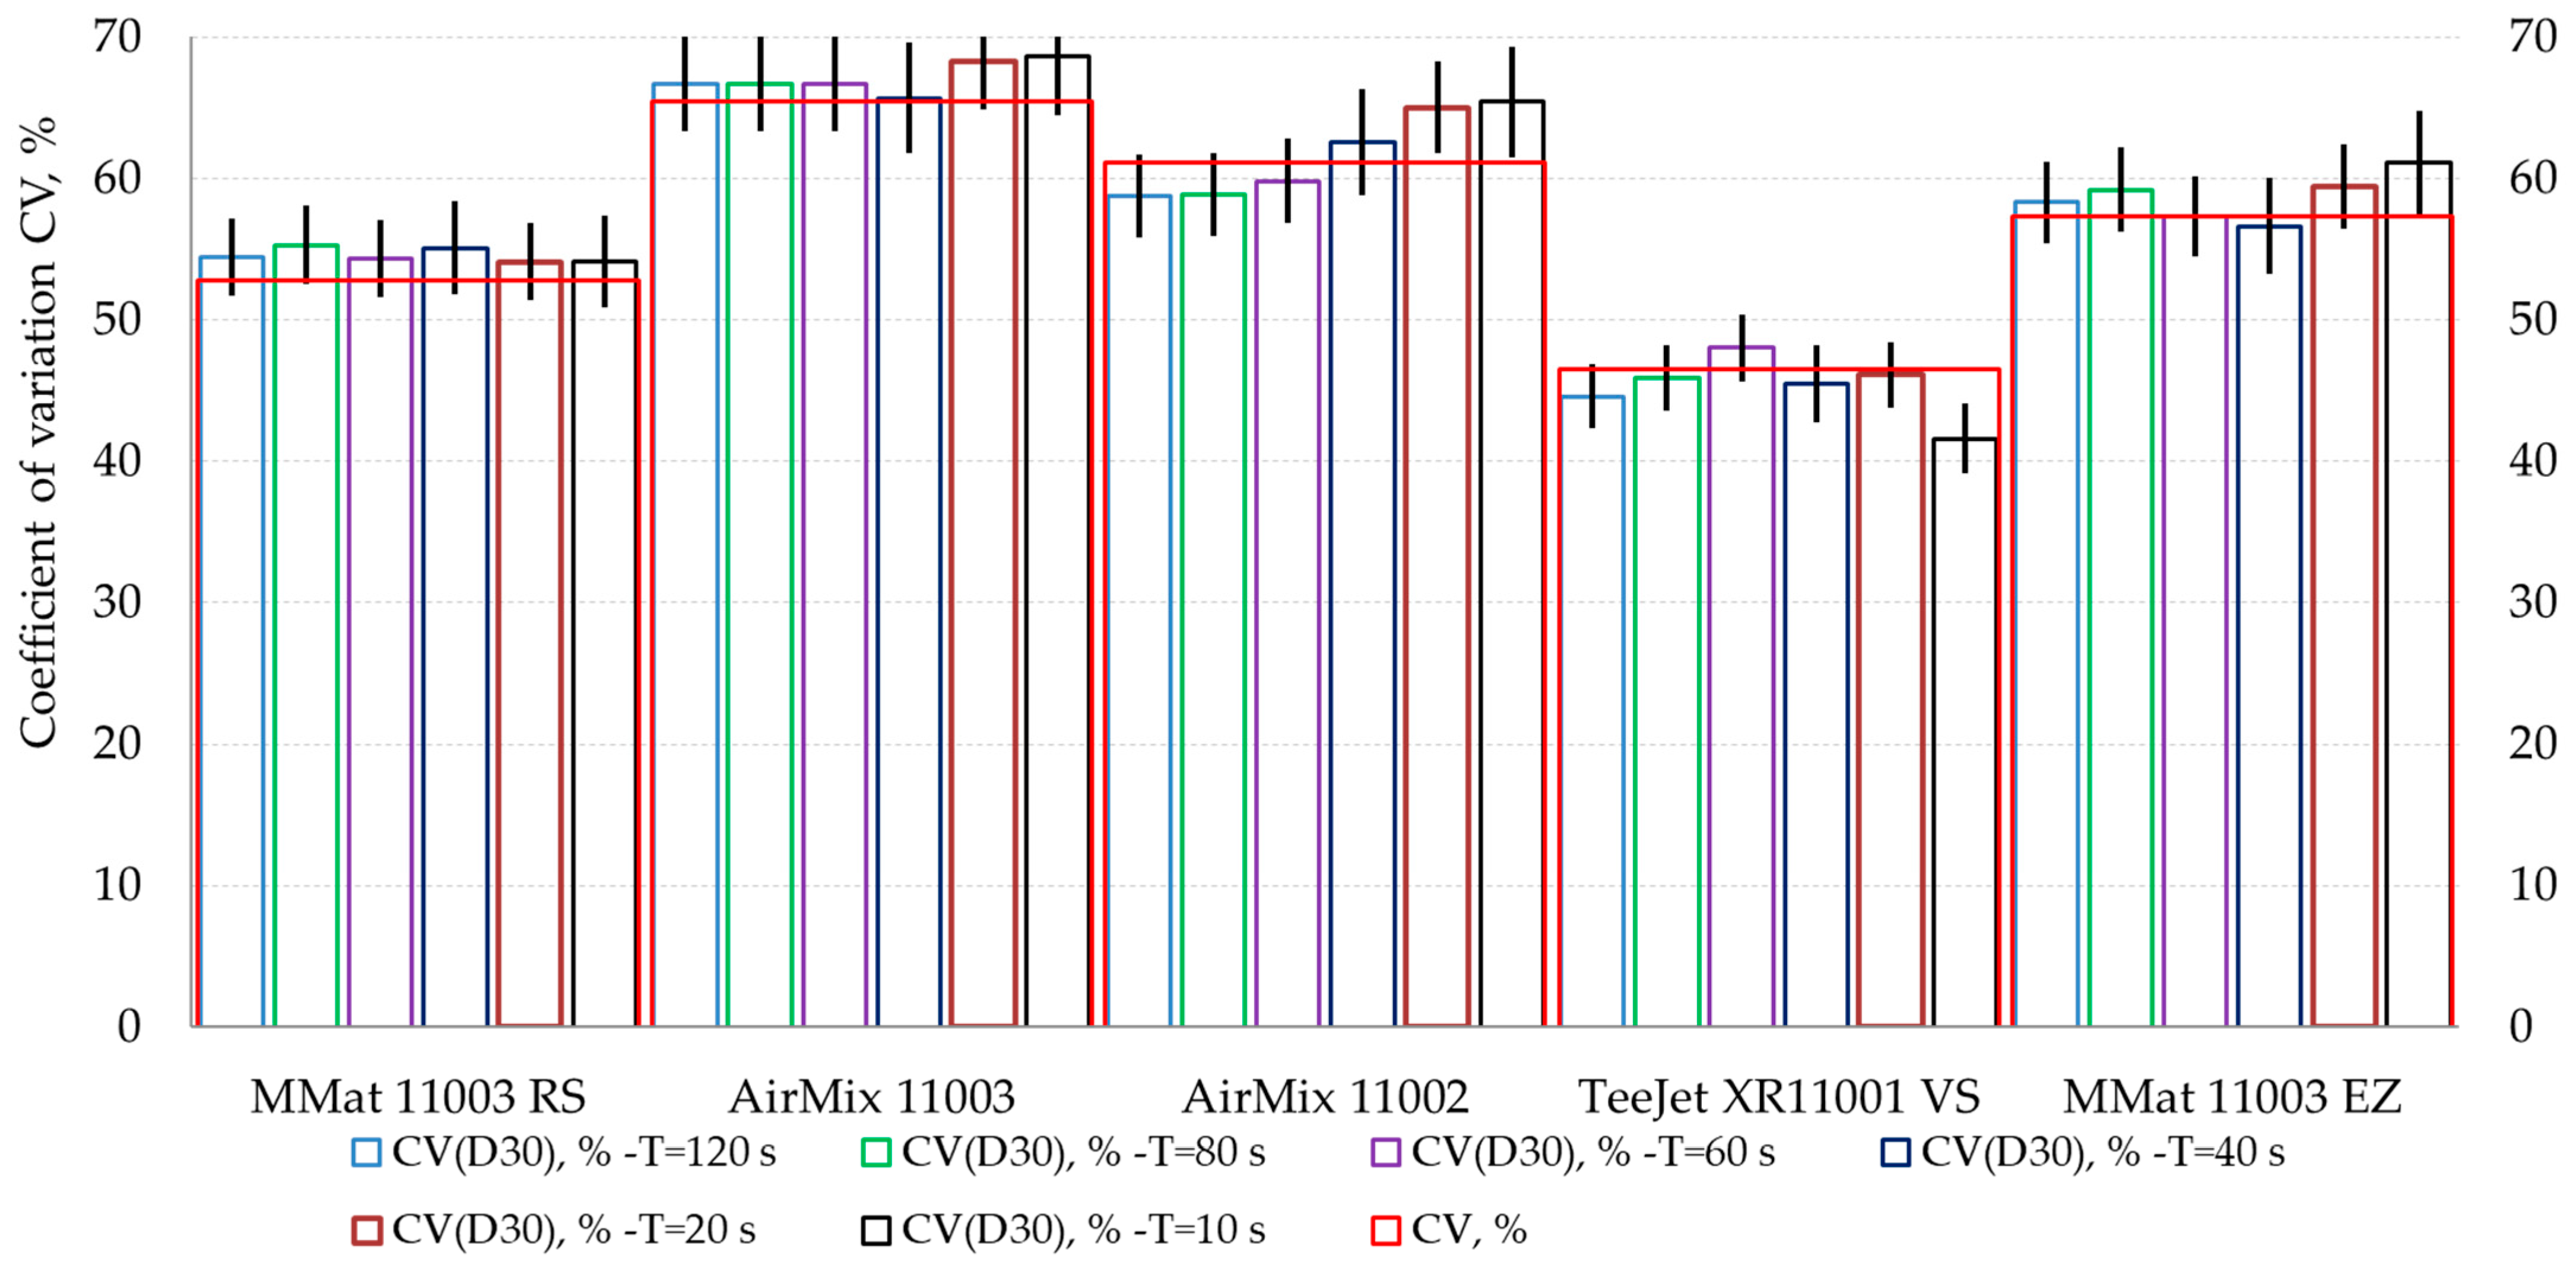
Given that the two measurement methods used different representative volume measurements (sampling method and significantly different volumes of liquids analyzed), regularity was observed in the evaluation of volume distributions during the study (Figure 12). The distributions were also found to be cyclical over the time intervals assumed in the study. However, as the measurement time was reduced (smaller droplet counts to determine the volume diameter of D30), there was little variation in the arrangement of the distribution, especially for the volumes representing neighboring measurement points. Table 5 and Figure 13 show the results of the measurements in the form of CV(D30) coefficients of variation, taken as a relative measure for evaluating volume distribution. The results were tabulated for discrete values of time T (120, 80, 60, 40, 20, 10) s. In order to validate the results obtained with the PDA analyzer, the results of the CV coefficients of variation, determined from the volumes measured on the bench equipped with the groove table, were also tabulated. Between the CV value obtained from the groove table tests and the maximum CV(D30), there was a gap expressed in percentage points: (i) AirMix 11003—2.7; (ii) MMat 11003EZ—4.0; (iii) TeeJet 11001VS—1.7; (iv) MMat 11003RS—2.2; (v) AirMix 11002—5.3. A similar trend in the variability of the coefficient results was noted as in the evaluation of differences in median volume diameter. The AirMix (11002, 11003) and MMat 11003EZ nozzle group had greater stability of results and smaller differences in coefficient of variation values within the range of measurement times adopted in the study from T = (120, 80, 60) s. In these time ranges, the difference values recorded were (i) AirMix 11003—0.8; (ii) AirMix 11002—1.3; and (iii) MMat 11003EZ—2.1 percentage points. For nozzles with smaller diameters in the spectrum, regularity was observed in the evaluation of differences in coefficient of variation values. For the MMat 11003RS nozzle, this was 3.7 percentage points over the full range of measurement times T = (120, 80, 60, 40, 20, 10) s. For the TeeJet 11001VS nozzle, this was 1.9 percentage points over the range of measurement times T = (120, 80, 60, 40, 20) s.
The third objective was an attempt to combine the results of transverse volume distribution obtained for single nozzles on the boom and comparing them with test results obtained on the groove table. The idea behind the proposed concept was to use the volume distribution results determined from the volume diameters (D30). From the volumes of liquid collected from the individual grooves of the table and the volumes of liquid during the PDA test, so-called “virtual” spray booms were constructed. Based on the results obtained in this way, the values of the coefficients of variation of the distribution (Table 6) were calculated for the boom section.
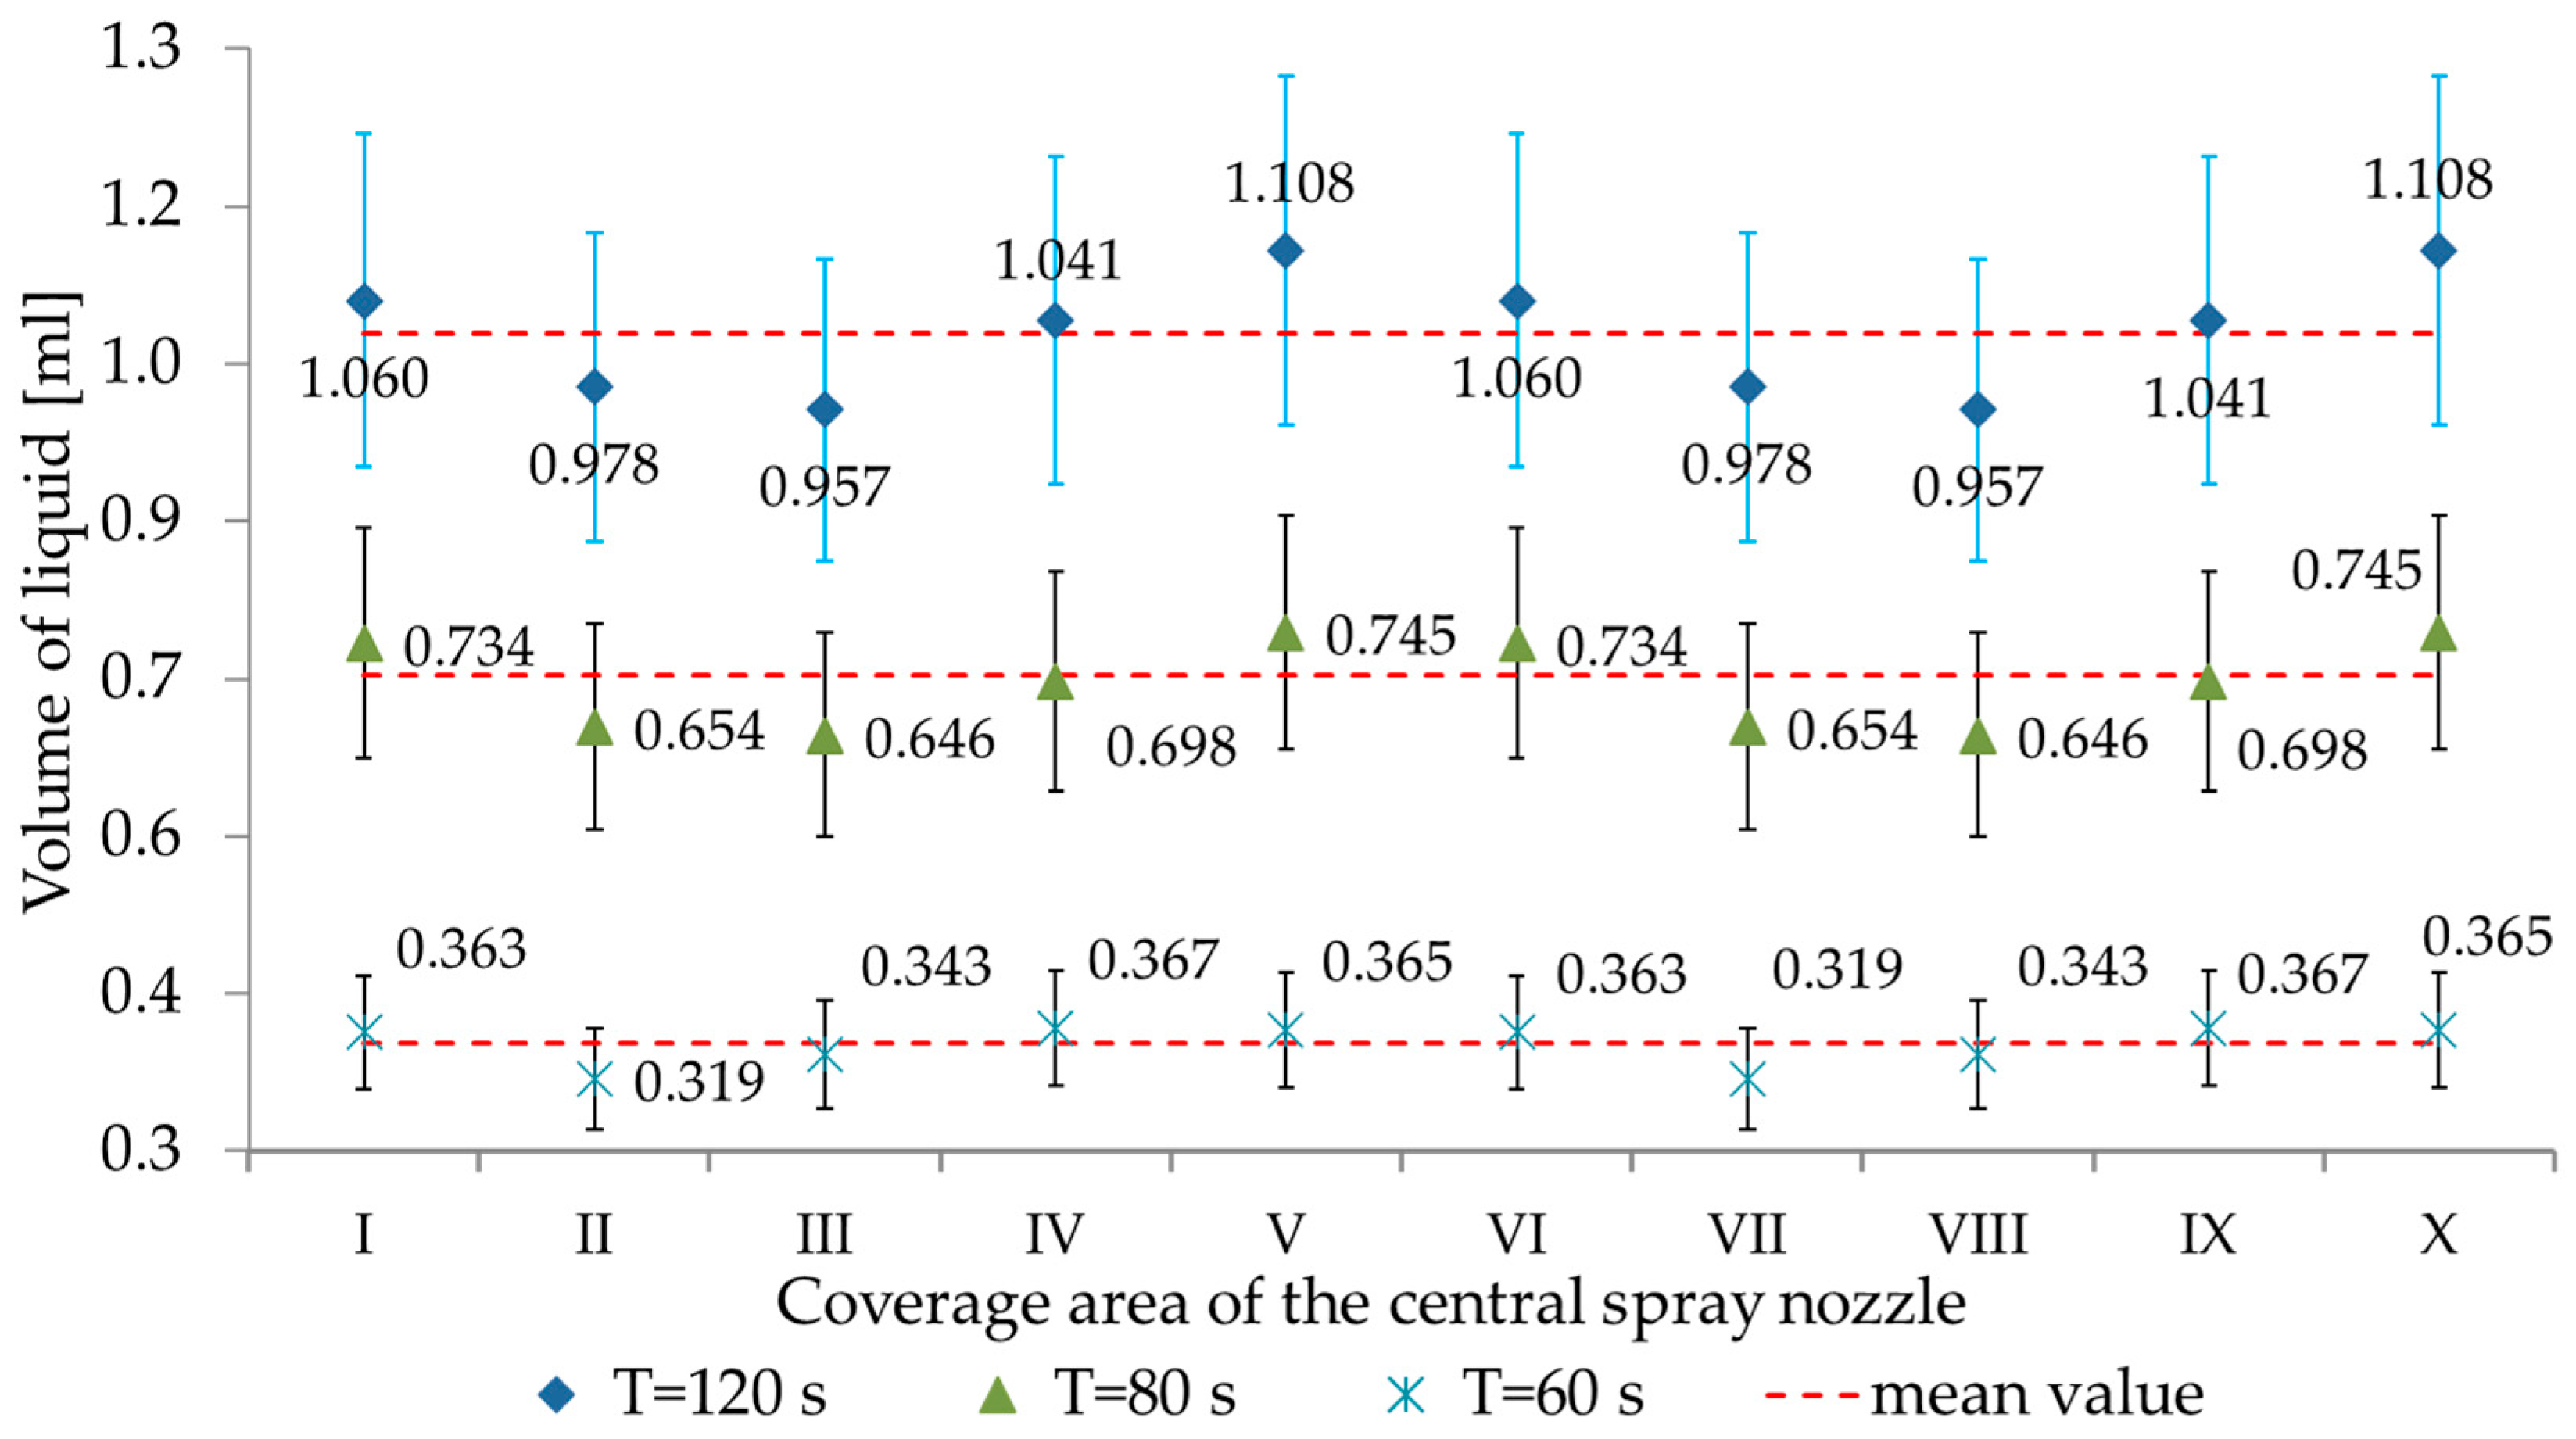
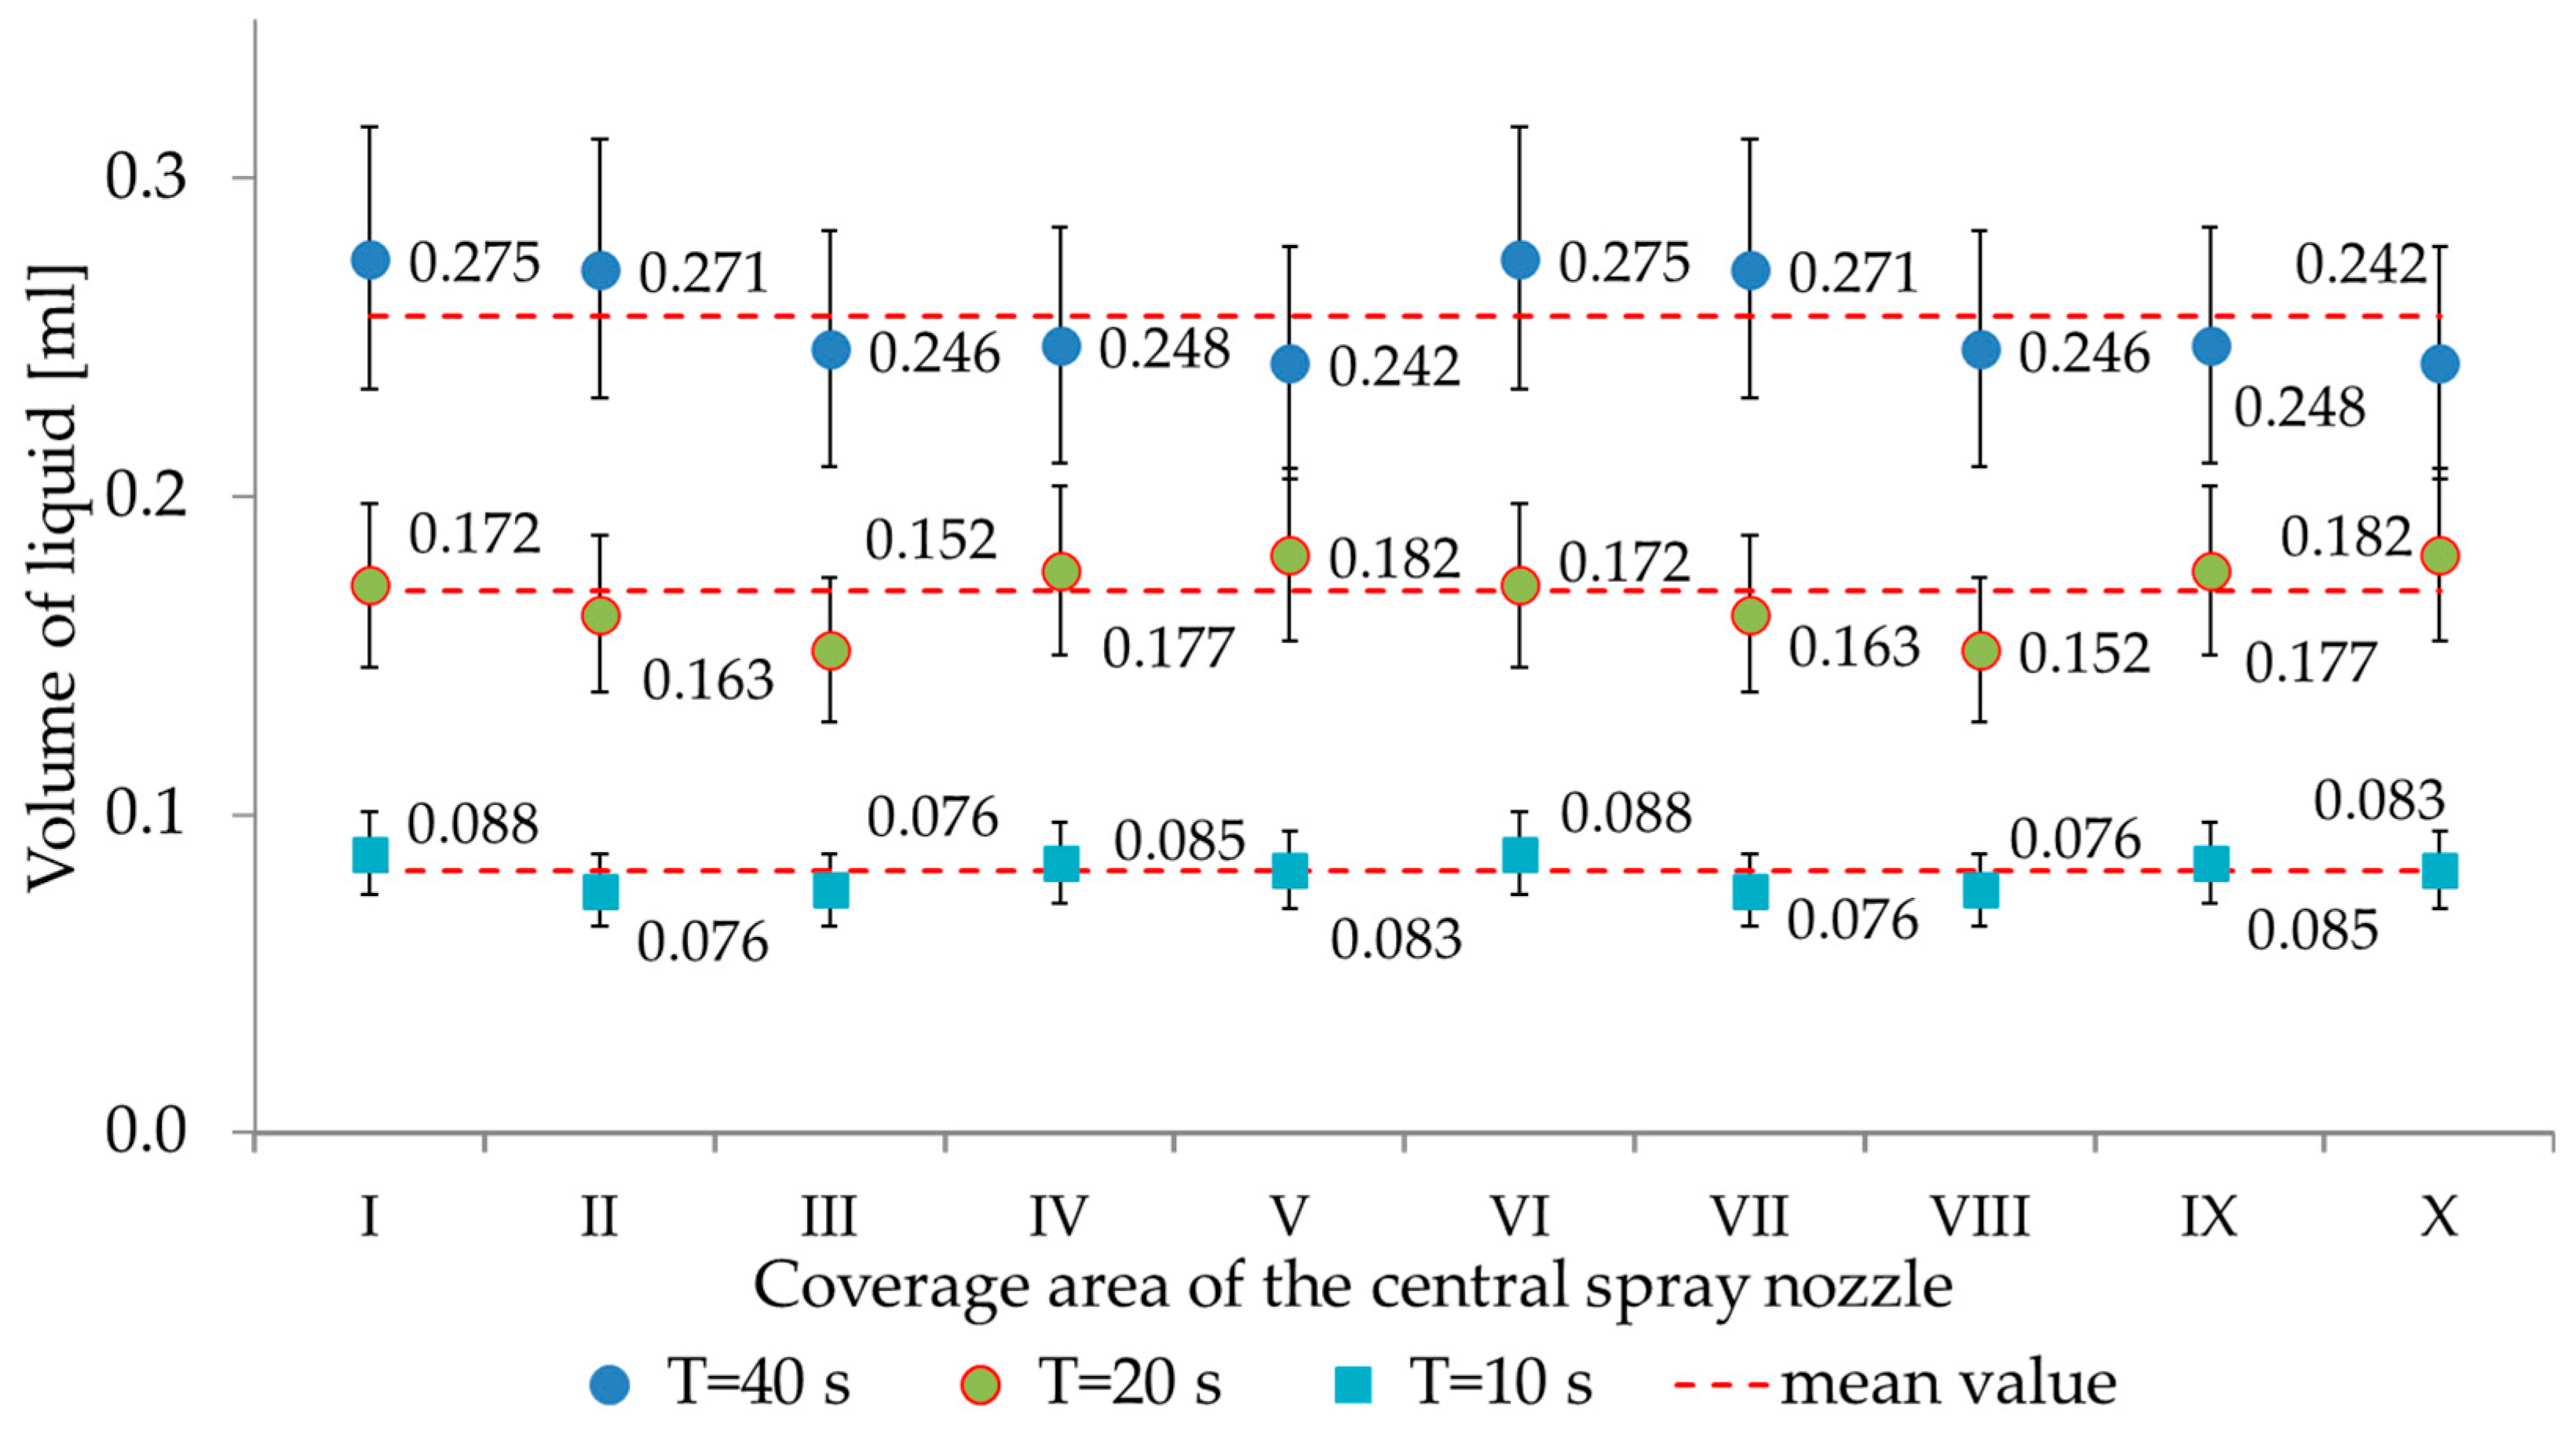
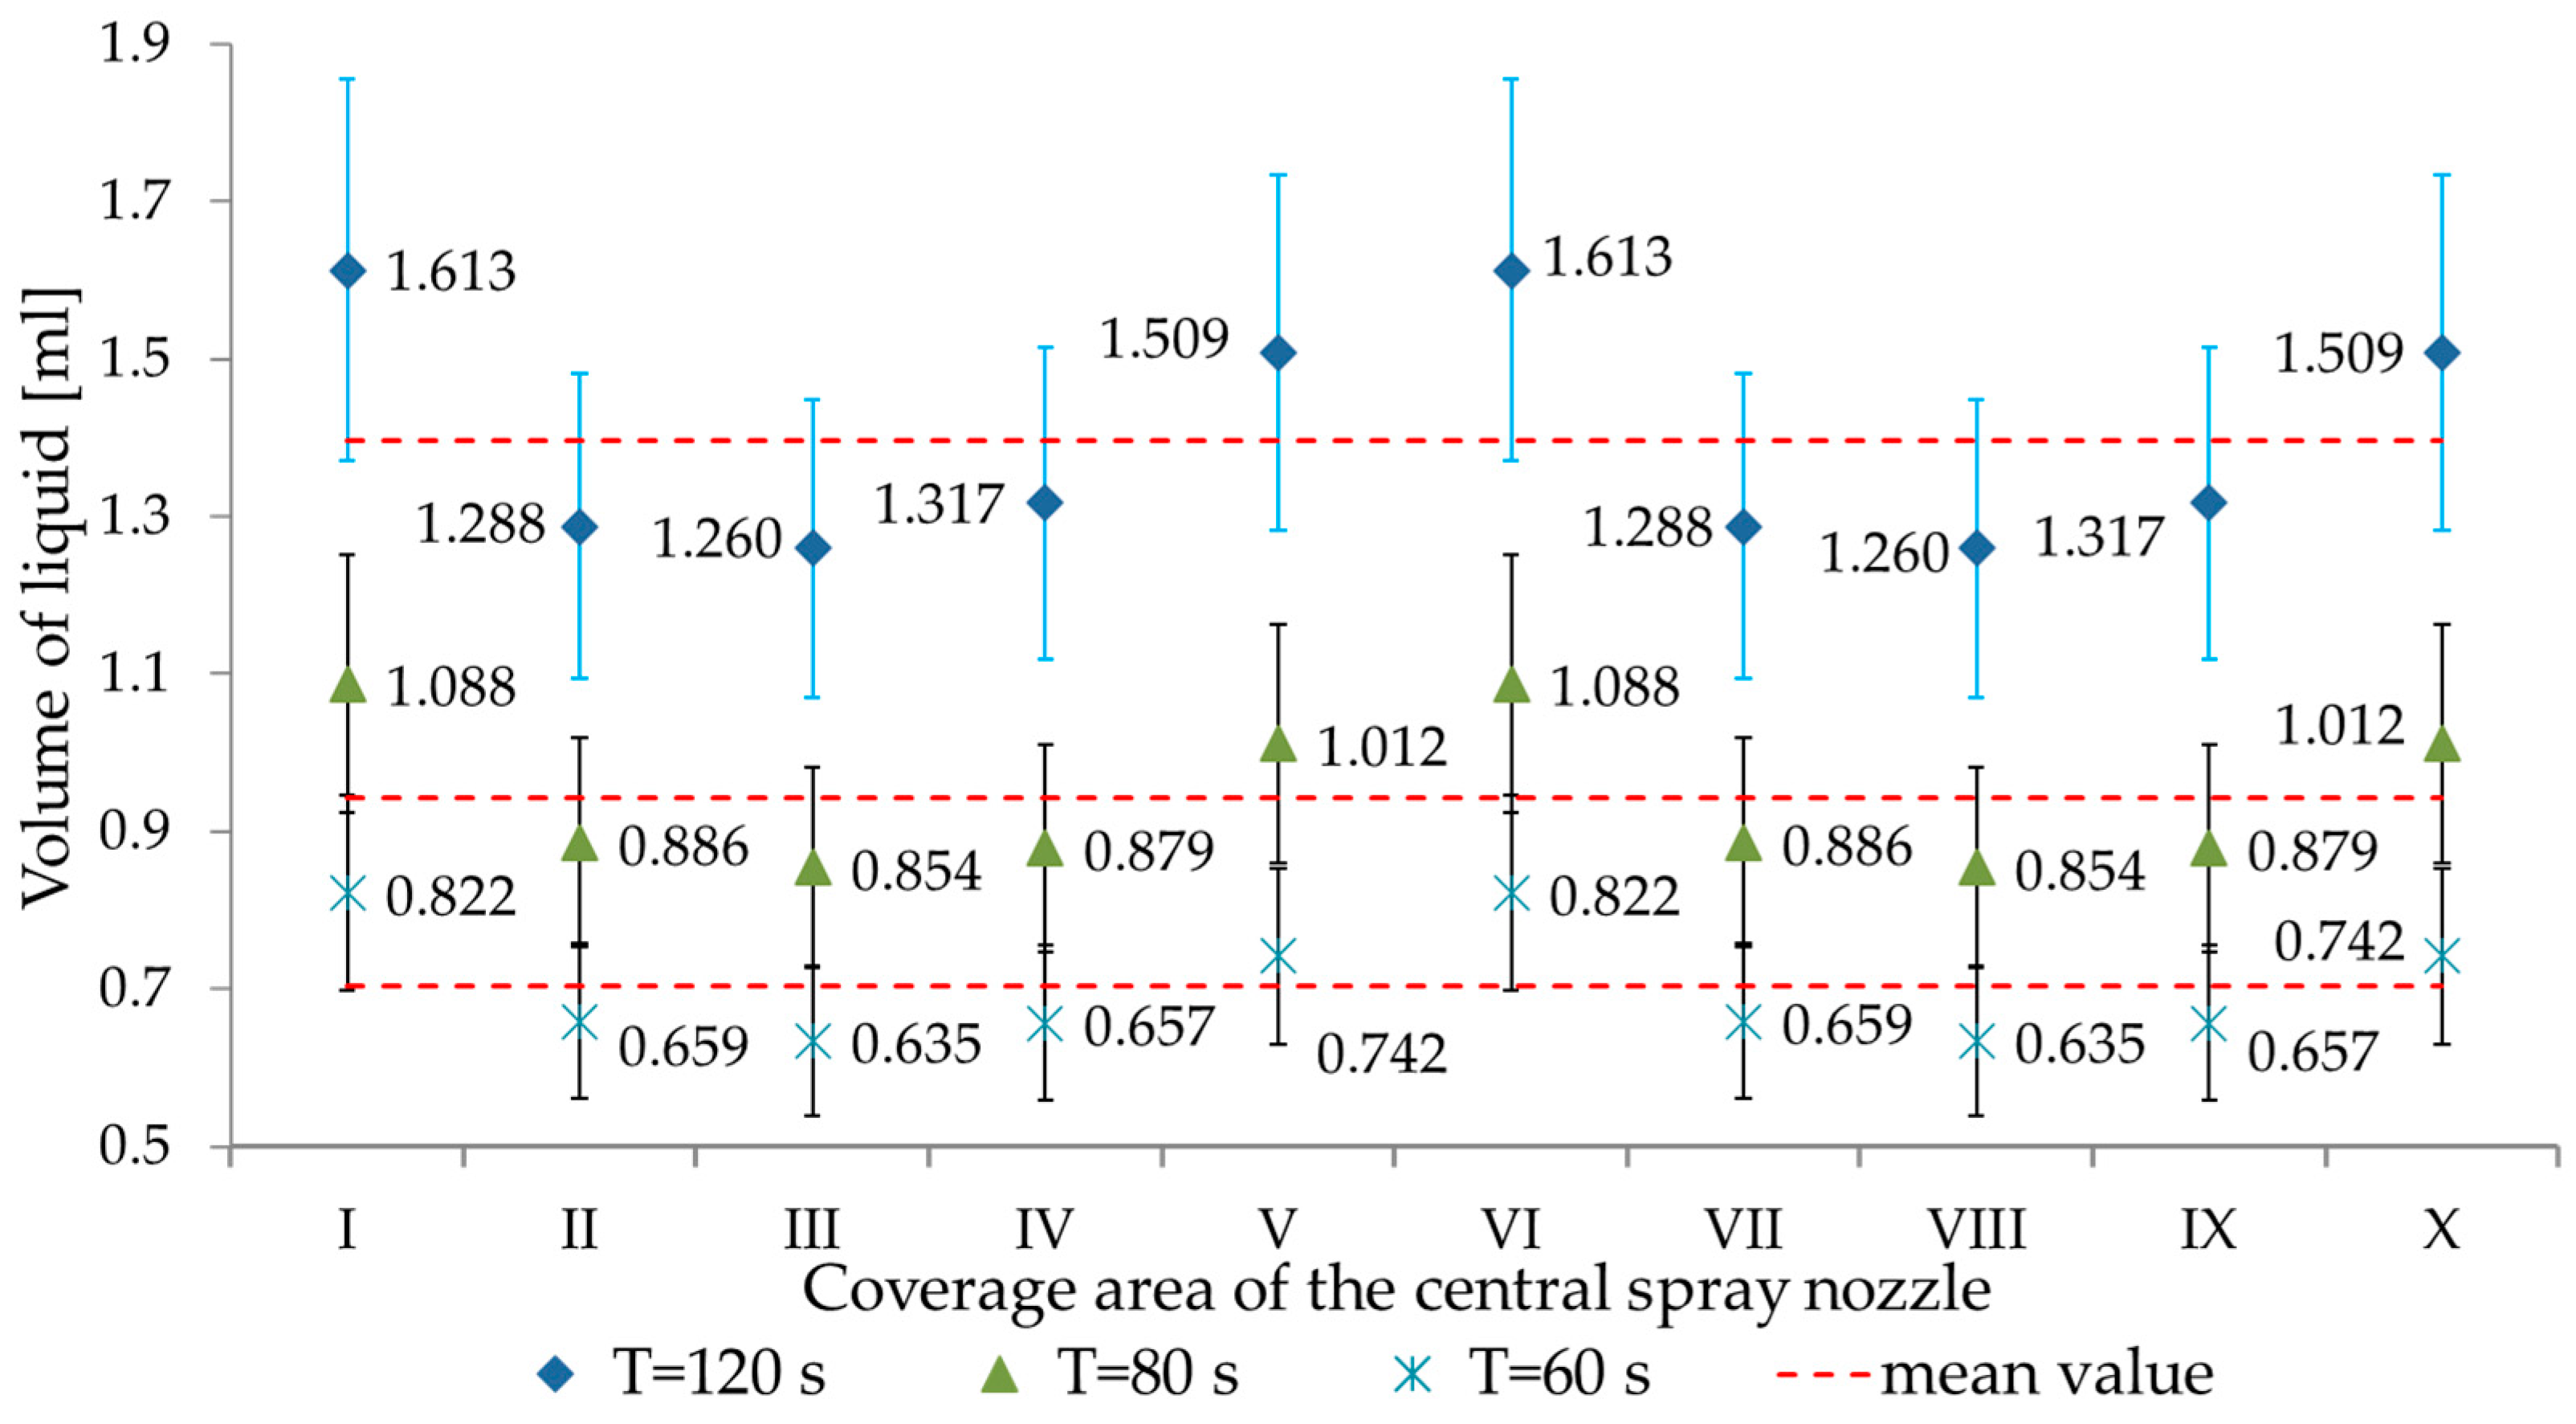
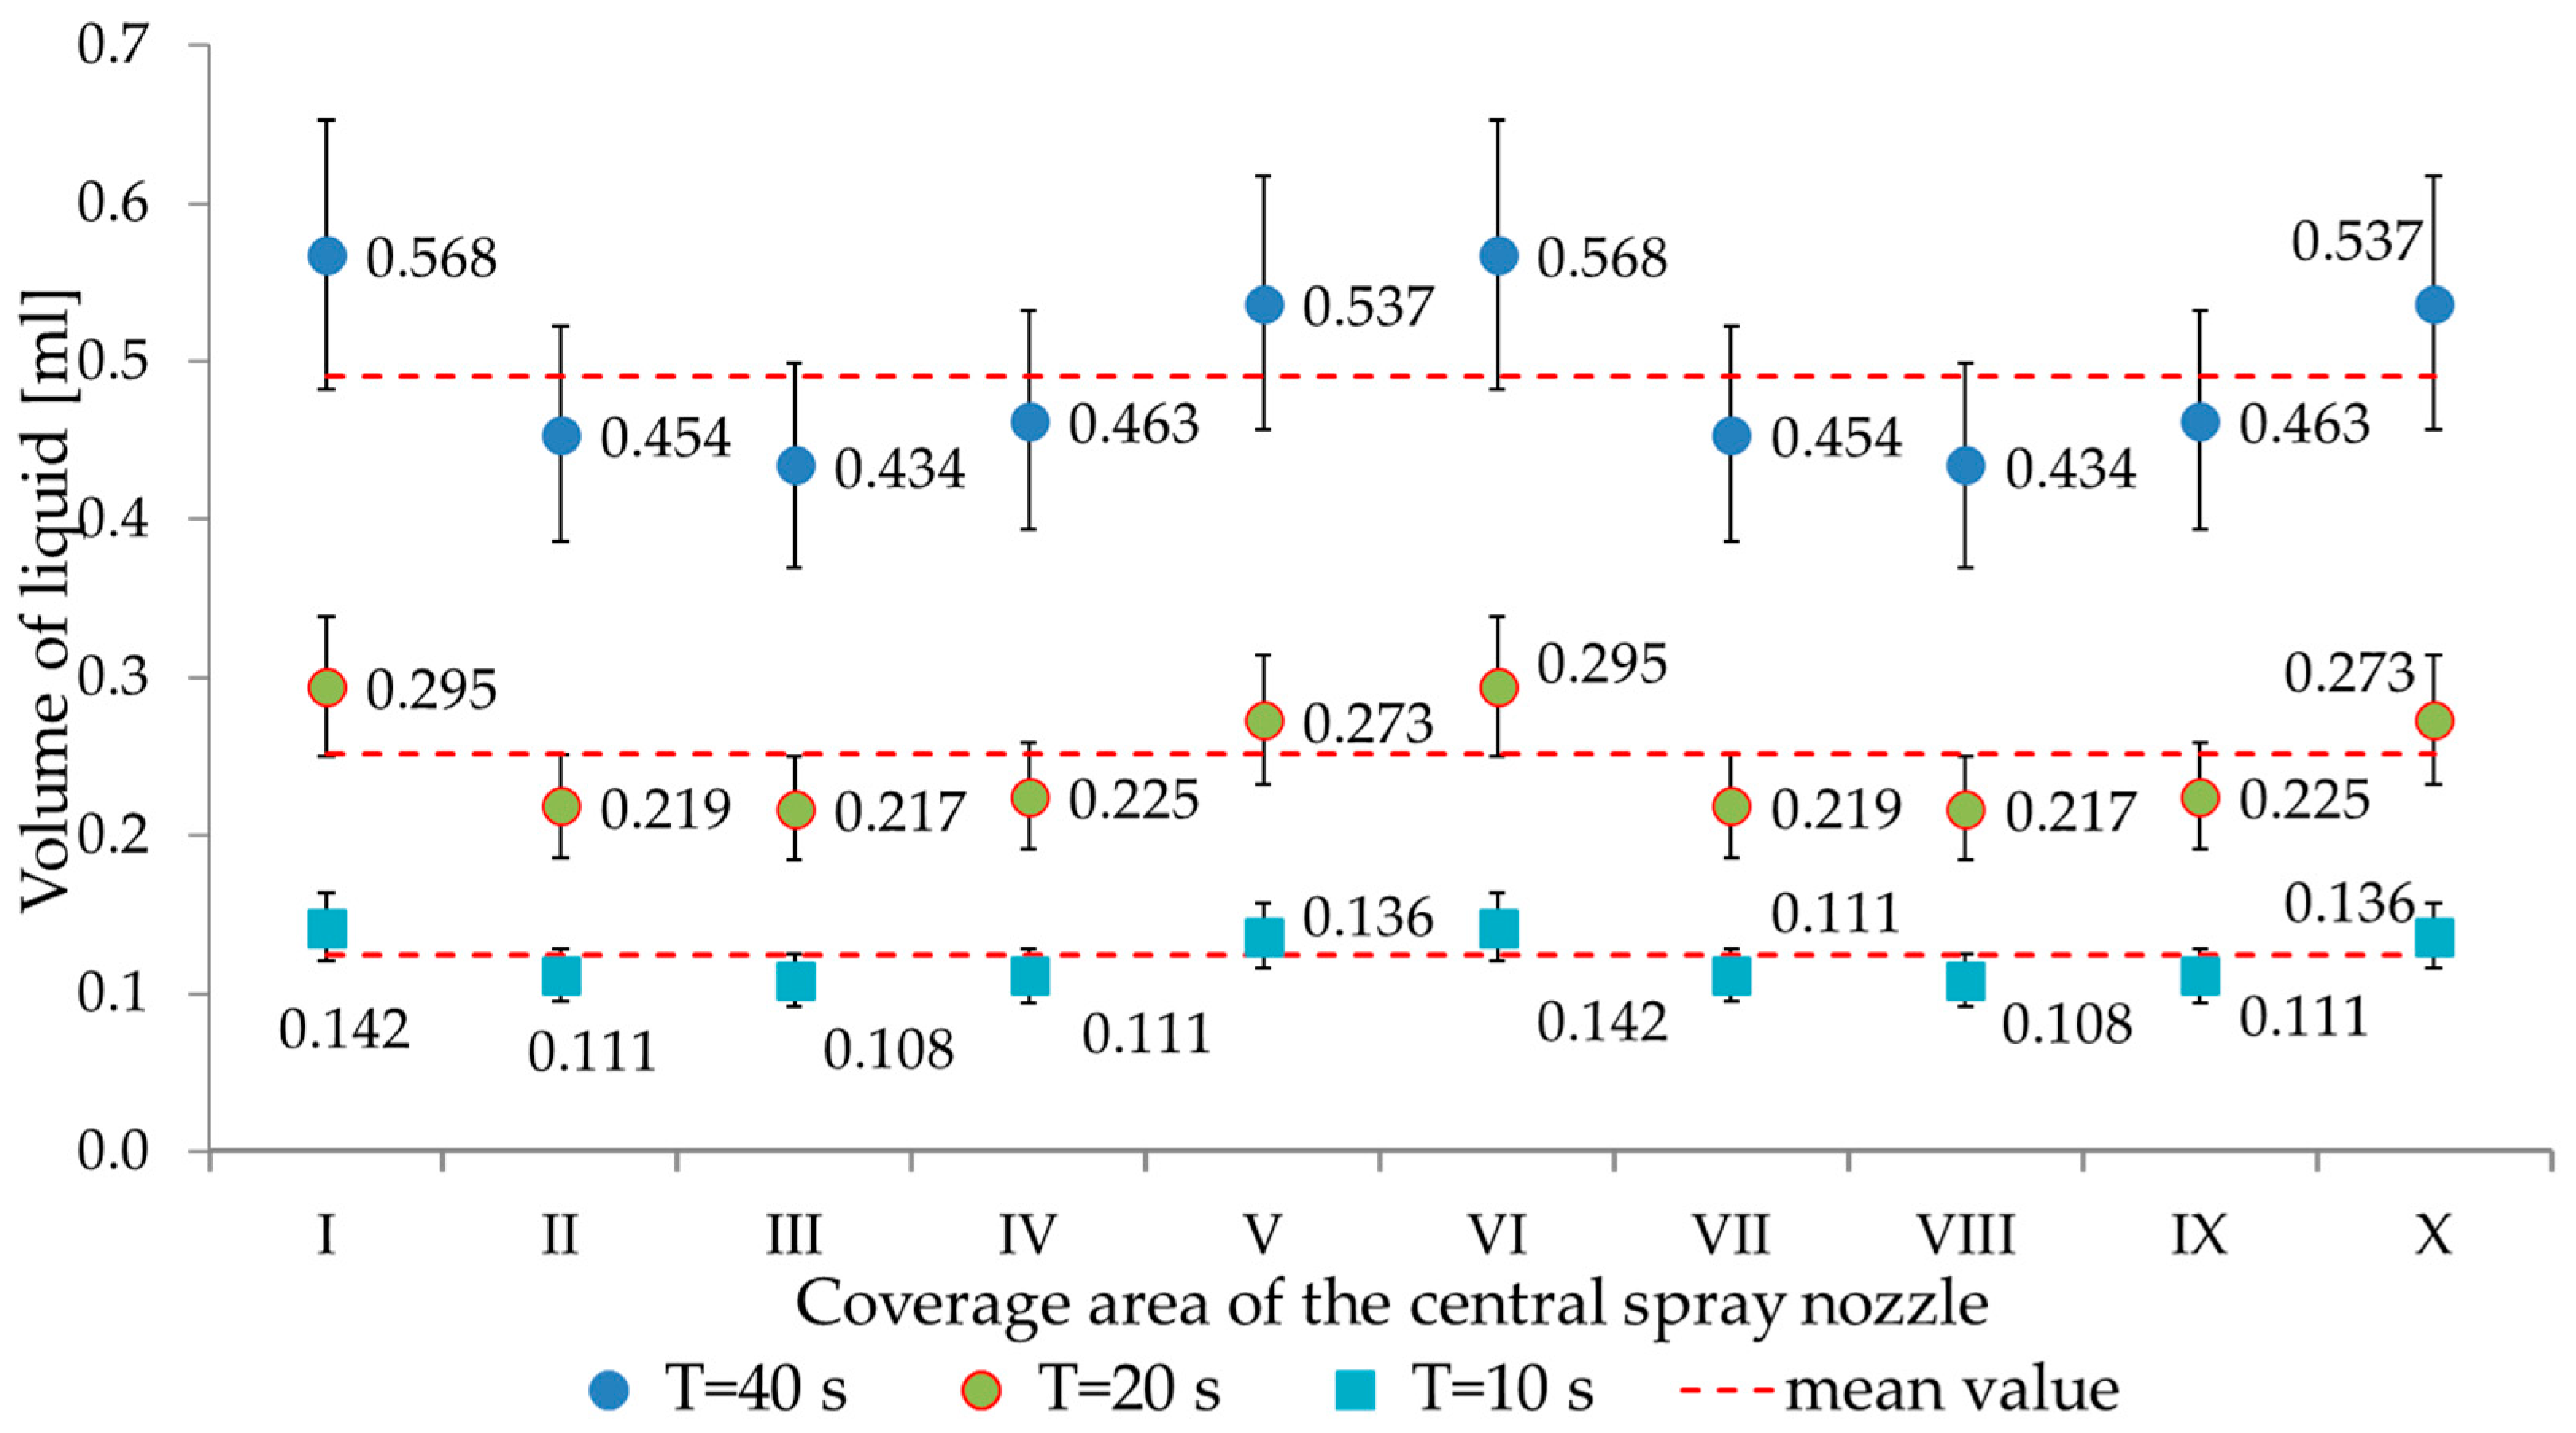
The results were evaluated in terms of differences in the coefficient of variation and the number of cylinders outside the tolerance range of ±15% of the average volume. The results of calculations according to the method used made it possible to obtain assessments of the coefficient of variation CV(D30)b relative to the test results based on groove table measurements. In the case of tests where a groove table was used to evaluate volume distribution, coefficient of variation values of less than 10% (as required within the acceptable range) were recorded. On the other hand, a slight increase in the coefficients determined by the PDA test was observed over almost the entire range of measurement times (Table 6). Figure 14, Figure 15, Figure 16 and Figure 17 present the post-composition distribution of volumes determined for (AirMix 11003, MMat 11003RS) over the full measurement times range T = (120, 80, 60, 40, 20, 10) s.
To evaluate the results, a criterion was adopted in which it was assumed that for successive measurements in the time range T = (120, 80, 60, 40, 20, 10) s, the appearance of a volume outside the range of ±15% of the mean value in at least one of the cylinders constitutes a limit and excludes this and subsequent measurements from the analysis of the variability of the CV(D30)b. Between the CVb value obtained from the groove table tests and the maximum CV(D30)b value for the adopted criterion, there was a gap expressed in percentage points: (i) AirMix 11003—2.4; (ii) MMat 11003EZ—2.2; (iii) TeeJet 11001VS—0.3; (iv) MMat 11003RS—0.9; and (v) AirMix 11002—2.7. The nozzle group AirMix 11002, MMat 11003EZ, TeeJet 11001VS, and MMat 11003RS is characterized by stability of results and smaller differences in the coefficient of variation, within the range of adopted measurement times T = (120, 80, 60,) s. For measurement time T = 40 s, the appearance of results outside the range of ±15% of the mean value was noted. The coefficient of variation CV(D30)b for the AirMix 11003 nozzle was recorded below 10% (the highest value was 6.28% for measurement time T = 20 s) over the entire time range T = (120, 80, 60, 40, 20, 10) s. Not a single cylinder outside the tolerance of ±15% of the average value was found for this nozzle.
This study also confirmed that a high coefficient of variation for a single nozzle does not mean that the coefficient for a boom composed of identical nozzles will be outside the acceptable range. The test results show that not all nozzles met the two adopted criteria (CV coefficient and number of cylinders outside tolerance) across the entire range of variations at the time when the tests were conducted.
Based on the results of the study, the issue of practical implementation of the proposed research method becomes important. It is worth noting that the experiments were conducted in a controlled laboratory environment. In this paper, a non-invasive, point-based measurement with high spatial resolution was proposed, combining information from many individual measurement points. Flux statistics were obtained for simultaneous evaluation of the signaled micro and macro parameters. Based on the results obtained, it is possible to assess the technical condition of the nozzle resulting from wear or faulty workmanship.
The method, due to its research capabilities, could find application in scientific and research centers or large corporations producing spray nozzles. Despite the possibility of standardizing the analysis of droplet size with simultaneous evaluation of the transverse distribution of the volume, the following are important: cost of the apparatus, environmental conditions for conducting research, and suitably qualified personnel. It seems that it would be difficult to replace the commonly used groove tables (stationary and mobile design) for sprayer attestation in field environments. Factors such as wind (drift) and ambient temperature are important in this type of testing. Also, extremely important is light dispersion, which can affect the conduct of measurements in field conditions.
The proposed research method seems relevant and important for the further development of liquid atomization studies.

4. Conclusions

Validation of the results obtained by the proposed measurement method with the results obtained on the groove table indicates the possibility of using an innovative test method. The research conducted should be carried out in a controlled laboratory environment. The study shows that for a reduced value of measurement time from T = 120 s to T = 10 s, and thus a decrease in the number of measured droplets in successive trials, the spread of the median volume value for the group of nozzles tested did not exceed 11.2 µm. The smallest differences in the relative values of the volumetric median were observed from 185,000 drops measured in the liquid stream during testing (results not exceeding 3 µm were obtained). In the case of measuring the volumetric diameters of Dv0.9 and Dv0.1, small changes in their values were also observed over the entire range of test times (from T = 120 s to T = 10 s), and so for Dv0.9, the maximum spread of values was 13.9 µm, while for Dv0.1, the maximum spread of values was 5.3 µm. The results obtained from the point measurement made in the center axis of the jet may be subject to error (recommendations according to ISO/FDIS 25358:2018—a minimum of five measurement points determined at the depth of the jet); nevertheless, an attempt was made to conduct tests and verify them. The two measurement methods used different representative volume measurements (sampling method and significantly different amounts of liquid analyzed); nevertheless, the preservation of regularity in assessing the nature of volume distribution was observed. The method and the results obtained can be successfully applied to nozzle assemblies on a virtual boom in the context of stream assessments from the area of full coverage. It is possible to use the procedure developed in future studies to evaluate the volume distribution determined for a virtual spray boom equipped with a group of different nozzles of the same type and conducting diagnostic evaluations of the proper functioning of spray nozzles placed on the boom. Based on the analysis of the results obtained in the three stages of testing in terms of assessments of micro and macro parameter variability, for nozzle testing it is recommended to use a minimum measurement time of T = 60 s at each discrete measurement point of the liquid jet. For micro-parameter analysis and transverse volume distribution for a single nozzle, the measurement time can be limited to T = 20 s (for fine droplet nozzles—TeeJet 11001, MMat 1103). However, when assembling the results of transverse volume distribution on the virtual boom for the criterion (CV factor, number of cylinders out of tolerance), the fulfillment is possible for time T = 60 s. Calculated and imposed volumes in these areas result in contractual cylinders out of tolerance ±15%. The analysis of the results obtained in the three stages of testing clearly indicates that the minimum value of measured droplets for complete evaluation is a value of about 185,000 in the spray stream.

Author Contributions

Methodology, D.L. and M.K.; Data curation, D.L. and M.K.; Writing—review & editing, D.L. and M.K. All authors have read and agreed to the published version of the manuscript.

Funding

This research received no external funding.

Institutional Review Board Statement

Not applicable.

Informed Consent Statement

Not applicable.

Data Availability Statement

The original contributions presented in this study are included in the article. Further inquiries can be directed to the corresponding author.

Conflicts of Interest

The authors declare no conflict of interest.

References

  1. Jalu, V.J.; Yadav, R.; Ambaliya, P.S. A comprehensive review of various types of sprayers used in modern agriculture. Pharma Innov. 2023, 12, 143–149. [Google Scholar]
  2. Dorr, G.J.; Hewitt, A.J.; Adkins, S.W.; Hanan, J.; Zhang, H.; Noller, B.A. A comparison of initial spray characteristics produced by agricultural nozzles. Crop Prot. 2013, 53, 109–117. [Google Scholar] [CrossRef]
  3. Griesang, F.; Decaro, R.A.; dos Santos, C.A.M.; Santos, E.S.; de Lima Roque, N.H.; da Costa Ferreira, M. How Much Do Adjuvant and Nozzles Models Reduce the Spraying Drift? Drift in Agricultural Spraying. Am. J. Plant Sci. 2017, 8, 2785–2794. [Google Scholar] [CrossRef]
  4. Kieloch, R.; Domaradzki, K. The influence of selected spraying parameters on two formulation of sulfonylurea herbicides effect. J. Cent. Eur. Agric. 2013, 14, 42–51. [Google Scholar] [CrossRef]
  5. Subr, A.; Milanowski, M.; Parafiniuk, S.; Sawa, J. Testing the Uniformity of Spray Distribution Under Different Application Parameters. In Proceedings of the IX International Scientific Symposium “Farm Machinery and Processes Management in Sustainable Agriculture”, Lublin, Poland, 22–24 November 2017; pp. 359–364. [Google Scholar]
  6. Martini, A.T.; Schlosser, J.F.; Gil, E.; de Farias, M.S.; dos Santos, G.O.; Bertollo, G.M.; Barberi, J.P. Agricultural Spray Inspection According to ISO 16122: Part II—Determination of the State of Use and Conservation of Agricultural Sprayers. J. Agric. Sci. 2019, 11, 60–75. [Google Scholar] [CrossRef]
  7. Godyń, A.; Doruchowski, G.; Hołownicki, R.; Świechowski, W. Metodyka Badania Stanu Technicznego Opryskiwaczy Montowanych na Pojazdach Kolejowych. Inżynieria Rol. 2013, 3, 67–76. [Google Scholar]
  8. Kole, J.; Harasta, P. Quality Assurance as a Key Point in Effective Sprayer Inspection Schemes. JKI Open J. Syst. 2015, 5, 73–80. [Google Scholar]
  9. Parafiniuk, S.; Milanowski, M. Liquid outflow intensity as a determinant of operational quality of agricultural sprayers. Acta Sci. Pol. 2013, 12, 39–45. [Google Scholar]
  10. Koprowski, M.; Lodwik, D.; Pietrzyk, J. Evaluation of the spectrum of drops produced in the aspect of the outlet hole geometry. Przemysł Chem. 2024, 103, 1296–1299. [Google Scholar]
  11. Li, X.; Lu, D.; Wang, S.; Zhang, M.; Lei, X.; Lv, X. Droplet Distribution and Airflow Simulation of a Newly Designed Agricultural Twin Fluid Nozzle. Int. Agric. Eng. J. 2019, 28, 194–202. [Google Scholar]
  12. Laryea, G.L.; No, S.-Y. Development of Electrostatic Pressure-swirl Nozzle for Agricultural Applications. J. Electrost. 2003, 57, 129–142. [Google Scholar] [CrossRef]
  13. Chethan, C.R.; Singh, P.K.; Dubey, R.P.; Singhariya, S.; Choudhary, V.K. Herbicide Application in Agriculture: Nozzle Selection and Effective Application. Indian Farming 2018, 68, 28–30. [Google Scholar]
  14. Dowlati, M.; Khoshnam, F.; Namjoo, M.; Mirshahi, E. Analysis of Nozzle Spray Distribution for Different Nozzle Height and Pressure. Agric. Eng. Int. 2022, 24, 61–67. [Google Scholar]
  15. Çetin, N.; Sağlam, C.; Demir, B. Determination of Spray Angle and Flow Uniformity of Spray Nozzles with Image Processing Operations. J. Anim. Plant Sci. 2019, 29, 1603–1615. [Google Scholar]
  16. Lodwik, D.; Pietrzyk, J.; Malesa, W. Analysis of Volume Distribution and Evaluation of the Spraying Spectrum in Terms of Spraying Quality. Appl. Sci. 2020, 10, 2395. [Google Scholar] [CrossRef]
  17. Lodwik, D.; Pietrzyk, J. Ocena odporności na znoszenie cieczy wybranych rozpylaczy w aspekcie nierównomierności poprzecznego rozkładu cieczy. Teka Kom. Motoryz. Energetyki 2017, 17, 65–70. [Google Scholar]
  18. ANSI/ASAE S572.1; Spray Nozzle Classification by Droplet Spectra. ASABE Standards: St. Joseph, MI, USA, 2009.
  19. Pascuzzi, S.; Manetto, G.; Santoro, F.; Cerutto, E. A Brief Review of Nozzle Spray Drop Size Measurement Techniques. In Proceedings of the 2021 IEEE International Workshop on Metrology for Agriculture and Forestry (MetroAgriFor), Trento-Bolzano, Italy, 3–5 November 2021. [Google Scholar]
  20. da Cunha, J.P.A.R.; dos Reis, E.F.; de Assunção, H.H.T.; Landim, T.N. Evaluation of droplet spectra of the spray tip AD 11002 using different techniques. Eng. Agric. 2019, 39, 476–481. [Google Scholar] [CrossRef]
  21. Privitera, S.; Manetto, G.; Pascuzzi, S.; Pessina, D.; Cerruto, E. Drop Size Measurement Techniques for Agricultural Sprays: A State-of-The-Art Review. Agronomy 2023, 13, 678. [Google Scholar] [CrossRef]
  22. Molnar-Irimie, A.; Ranta, O.; Stanila, S.; Marian, O. Study Regarding Methods and Techniques Used for Analysis of Spray Drift and Droplet Size Distribution by Agricultural Spraying Machines. Bull. Univ. Agric. Sci. Vet. Med. Cluj-Napoca 2025, 82, 1–11. [Google Scholar] [CrossRef]
  23. Hoffmann, W.C.; Hewitt, A.J. Comparison of three imaging systems for water-sensitive papers. Am. Soc. Agric. Biol. Eng. 2005, 21, 961–964. [Google Scholar] [CrossRef]
  24. Cerruto, E.; Failla, S.; Longo, D.; Manetto, G. Simulation of water sensitive papers for spray analysis. Agric. Eng. Int. CIGR J. 2016, 18, 22–29. [Google Scholar]
  25. Salyani, M.; Zhu, H.; Sweeb, R.D.; Pai, N. Assessment of spray distribution with water-sensitive paper. Agric. Ing. Int. CIGR J. 2013, 15, 101–111. [Google Scholar]
  26. Longo, D.; Manetto, G.; Papa, R.; Cerruto, E. Design and construction of a low-cost test bench for testing agricultural spray nozzles. Appl. Sci. 2020, 10, 5221. [Google Scholar] [CrossRef]
  27. Cerruto, E.; Manetto, G.; Privitera, S.; Papa, R.; Longo, D. Effect of Image Segmentation Thresholding on Droplet Size Measurement. Agronomy 2022, 12, 1677. [Google Scholar] [CrossRef]
  28. Sofija, V.M.; Cointault, F.; Vanggeyte, J.; Pietras, J.G.; Nuyttens, D. Spray Droplet Characterization from a Single Nozzle by High Speed Image Analysis Using an In-Focus Droplet Criterion. Sens. Agric. 2016, 16, 218. [Google Scholar]
  29. Hijazi, B.; Decourselle, T.; Vulgarakis, M.; Nuyttens, D.; Cointault, F.; Pieters, J.; Vamgeyte, J. The Use of High-Speed Imaging System for Applications in Precision Agriculture. In New Technologies: Trends, Innovations and Research; Constantin, V., Ed.; Intech: Bolton, UK, 2012; pp. 279–296. [Google Scholar]
  30. Vulgarakis Minov, S.; Cointault, F.; Vangeyte, J.; Pieters, J.G.; Nuyttens, D. Development of High-Speed Image Acquisition Systems for Spray Characterization Based on Single-Droplet Experiments. Trans. ASABE 2015, 58, 27–37. [Google Scholar]
  31. Huněk, A.; Bartoš, O. The Spray Measurement with Two Different Optical Methods. EPJ Web Conf. 2024, 299, 01015. [Google Scholar] [CrossRef]
  32. Fritz, B.K.; Hoffmann, W.C. Measuring spray droplet size from agricultural nozzles using laser diffraction. J. Vis. Exp. 2016, 115, e54533. [Google Scholar]
  33. Liu, X.; Doub, W.H.; Guo, C. Evaluation of droplet velocity and size from nasal spray devices using phase Doppler anemometry (PDA). Int. J. Pharm. 2010, 388, 82–87. [Google Scholar] [CrossRef]
  34. Sijs, R.; Kooij, S.; Holterman, H.J.; van de Zande, J.; Bonn, D. Drop Size Measurement Techniques for Sprays: Comparison of Image Analysis, Phase Doppler Particle Analysis, and Laser Diffraction. AIP Adv. 2021, 11, 015315-1–015315-9. [Google Scholar] [CrossRef]
  35. Holterman, H.J.; de Hoog, D. Droplet sizing of agricultural sprays, comparing PDA and Shadowgraphy. In Proceedings of the Fachtagung “Experimentelle Strömungsmechanik”, Munich, Germany, 5–7 September 2023; pp. 1–7. [Google Scholar]
  36. Kapulla, R.; Trautmann, M.; Güntay, S.; Dehbi, A.; Suckow, D. Comparison between Phase-Doppler Anemometry and Shadowgraphy Systems with Respect to Solid-Particle Size Distribution Measurements. In Lasermethoden in der Strömungsmesstechnik, 13; Dopheide, D., Müller, H., Strunck, V., Ruck, B., Leder, A., Eds.; GALA e.V. Deutsche Gesellschaft für Laser-Anemometrie: Braunschweig, Germany, 2006. [Google Scholar]
  37. Privitera, S.; Cerruto, E.; Manetto, G.; Lupica, S.; Nuyttens, D.; Dekeyser, D.; Zwertvaegher, I.; Furtado, M.R.; Costalonga Vargas, B. Comparison between Liquid Immersion, Laser Diffraction, PDPA, and Shadowgraphy in Assessing Droplet Size from Agricultural Nozzles. Agriculture 2024, 14, 1191. [Google Scholar] [CrossRef]
  38. Nuyttens, D.; Baetens, K.; De Schampheleire, M.; Sonck, B. PDPA laser-based characterisation of agricultural sprays. Agric. Eng. Int. CIGR J. 2006, 8, 1–18. [Google Scholar]
  39. ISO/FDIS 25358:2018; Crop Protection Equipment—Droplet-Size Spectra from Atomizers—Measurement and Classification. International Organization for Standardization (ISO): Geneva, Switzerland, 2018.
  40. Lodwik, D. Method of assessing the distribution of sprayed liquid using a laser Doppler analyzer. Przemysł Chem. 2024, 103, 1446–1449. [Google Scholar]
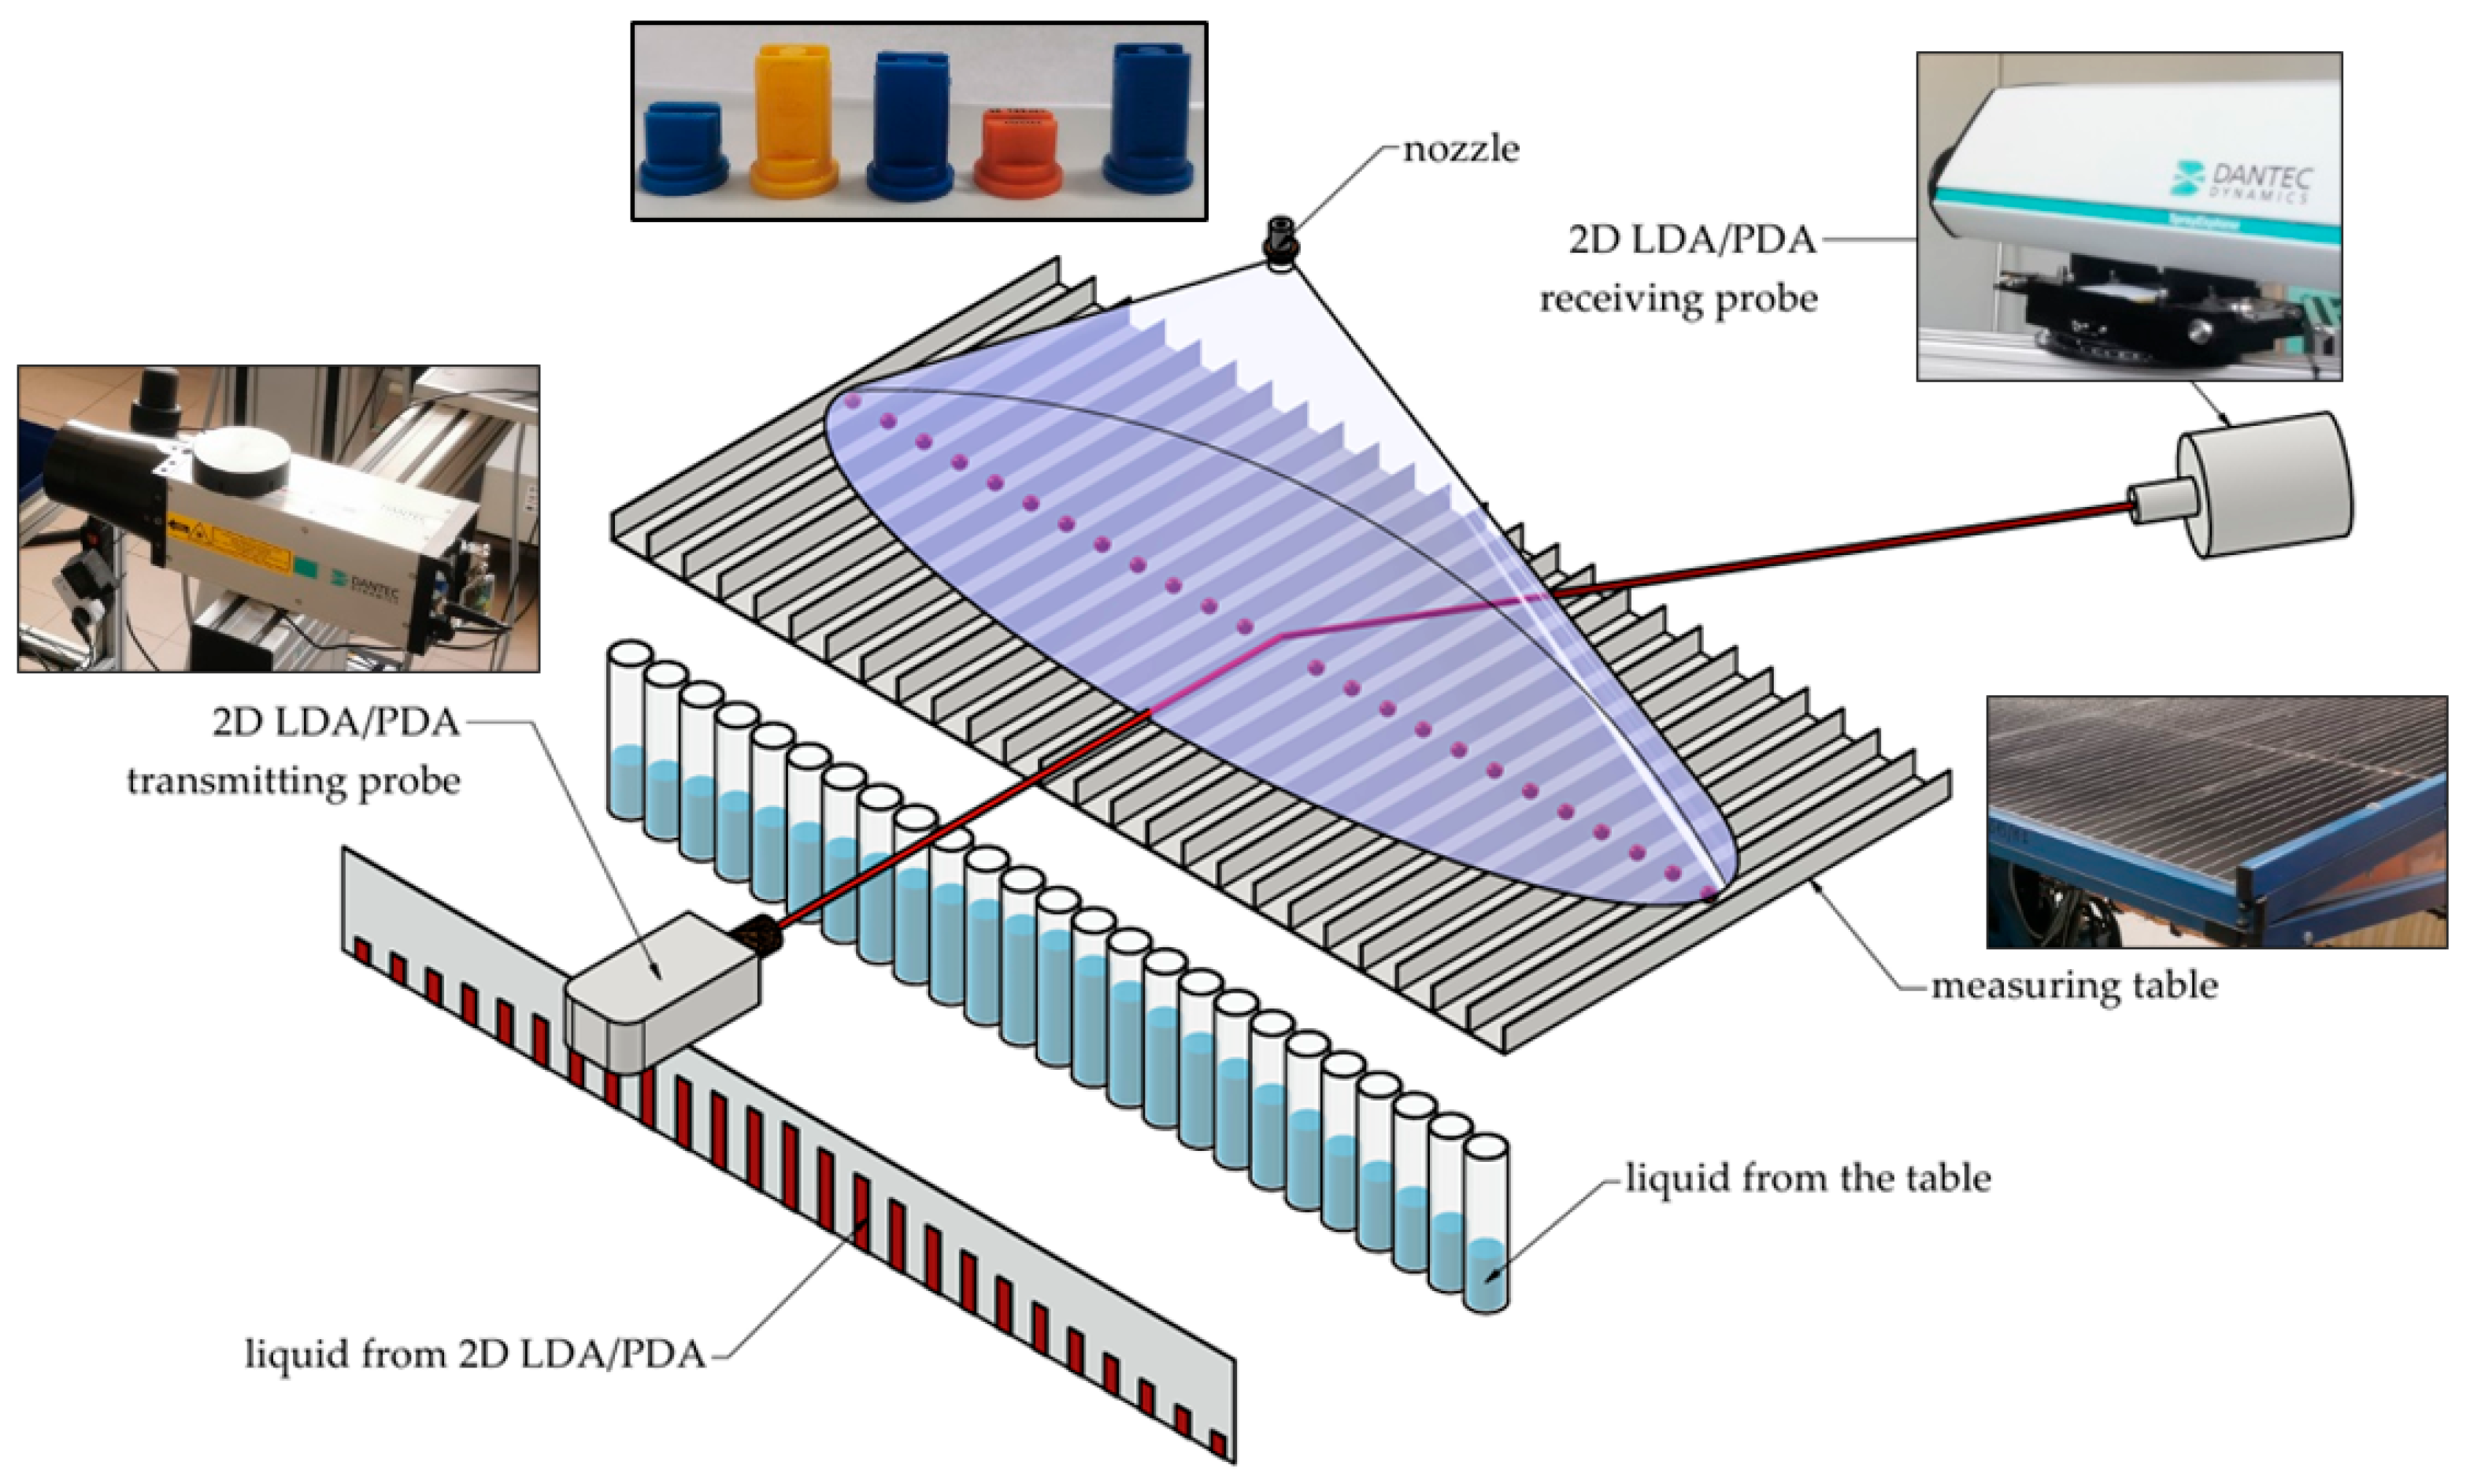
Figure 1. Diagram of use of two measurement methods.
Applsci 15 06993 g001
Figure 2. 2D laser LDA/PDA analyzer from Dantec Dynamics.
Applsci 15 06993 g002
Figure 3. Schematic of the test bench (2D LDA/PDA on the left, groove table on the right). V—measuring volume; Δx—measurement step; 0, 1, 2…—measurement point number (PDA)/groove number; L—last measurement point (PDA)/groove; h—distance of the nozzle outlet from the measurement point (PDA)/from the surface of the groove table.
Applsci 15 06993 g003
Figure 4. Diagram for determining the CV index for a spray boom section. h—distance of the nozzle outlet from the measurement point (PDA)/from the surface of the measurement table, s—the distance of adjacent nozzles.
Applsci 15 06993 g004
Figure 5. Spray volume distribution (CV) test stand.
Applsci 15 06993 g005
Figure 6. Number of drops as a function of time during the PDA test.
Applsci 15 06993 g006
Figure 7. Values of median volume as a function of measurement time, determined by the droplet diameter distribution test with the PDA analyzer.
Applsci 15 06993 g007
Figure 8. Volumetric median variation as a function of measurement time, determined by the droplet diameter distribution test with the PDA analyzer.
Applsci 15 06993 g008
Figure 9. Volumetric median variation as a function of measurement time, determined by the droplet diameter distribution test with the PDA analyzer.
Applsci 15 06993 g009
Figure 10. Values of volumetric diameters Dv0.9 as a function of measurement time, determined from the test distribution of droplet diameters with a PDA analyzer.
Applsci 15 06993 g010
Figure 11. Values of volumetric diameters Dv0.1 as a function of measurement time, determined from the test distribution of droplet diameters with a PDA analyzer.
Applsci 15 06993 g011
Figure 12. Histogram of volume distribution for AirMix 11003 nozzle determined by measuring (1) the distribution of droplet diameters as a function of test time (2) on the groove table.
Applsci 15 06993 g012
Figure 13. Graphical interpretation of coefficient of variation for single nozzles: CV(D30)—based on droplet diameter distribution with marked error bars ± 5%, CV—based on volume distribution on groove table.
Applsci 15 06993 g013
Figure 14. Liquid distribution for a boom section composed of AirMix 11003 nozzles with cylinders marking within ±15% of the mean volume value depending on the measurement time T = (120, 80, 60) s.
Applsci 15 06993 g014
Figure 15. Liquid distribution for a boom section composed of AirMix 11003 nozzles with cylinders marking within ±15% of the mean volume value depending on the measurement time T = (40, 20, 10) s.
Applsci 15 06993 g015
Figure 16. Liquid distribution for a boom section composed of MMat 11003RS nozzles with cylinders marking within ±15% of the mean volume value depending on the measurement time T = (120, 80, 60) s.
Applsci 15 06993 g016
Figure 17. Liquid distribution for a boom section composed of MMat 11003RS nozzles with cylinders marking within ±15% of the mean volume value depending on the measurement time T = (40, 20, 10) s.
Applsci 15 06993 g017
Table 1. Main parameters of the 2D LDA/PDA analyzer.
Measurement Parameters
size range of measured particles1–1600 µm
resolution of measured quantities±0.05 µm
maximum number of particles>300,000 particles/s
range of measured velocity components at any vector turn 0–300 m/s
resolution of measured speeds0.002%
Physical Parameters of the Transmitting and Receiving Probe
probe focal length700 mm
wavelength of laser beams660 nm and 785 nm
laser power per pair of beams for the first component90 mW
laser power per pair of beams for the second component70 mW
diameter of the laser beam at the front lens2.75 mm ± 0.25 mm
type of bonnet of the receiving probeB
medium droplet size644.2 µm
special filterslit: 0.2 mm
scattering angle43.5 deg
phase validation ratio15%
burst detector SNR level2 dB
level validation ratio4
data collection modeburst
relative refractive index1.334
confidence84.98%
best scattering138 deg
Table 2. Average values of spray spectrum coefficients as a function of the variable measurement time T determined from the test of the distribution of droplet diameters with the PDA analyzer.
T Dv0.5Dv0.1Dv0.9D10D30RSFV100Number of Drops
[s][mm] [%]pcs
AirMix 11003
AirMix 11003
120429.7247.6573.2243.8305.70.750.38480,179
80429.9247.4573.4245.1305.80.760.38324,399
60428.1246.7573.5241.3303.00.770.39241,934
40429.1246.9573.8221.7293.10.770.44181,625
20425.2245.4564.1242.2303.00.750.3980,570
10421.4246.1560.6242.6301.60.750.4239,930
MMat 11003 EZ120437.9249.5578.3241.3305.40.760.41489,804
80437.0249.3577.1241.2305.30.760.41328,380
60440.0250.0578.5241.8306.40.760.41243,476
40444.0250.2580.5243.8307.90.750.40164,419
20437.5249.2578.1245.5307.50.760.4285,474
10432.8244.9575.1241.5302.80.770.4142,833
TeeJet 11001VS120196.6132.2295.4139.4161.70.855.191,672,026
80198.2132.8295.3141.3163.20.845.151,095,226
60197.7133.0295.0140.8162.90.845.22809,766
40196.6132.7294.2142.2163.40.845.30580,724
20196.9132.2296.7141.9163.30.865.50271,633
10198.4132.1298.1139.5162.20.865.38140,064
MMat 11003RS120275.8167.9414.9163.8203.80.932.402,506,734
80274.3166.7413.8162.5202.40.922.361,674,256
60273.6165.6414.3161.2201.30.942.421,266,277
40275.8167.6414.9166.1205.00.932.29842,587
20275.1166.3413.3165.1204.00.932.32411,125
10274.3165.4413.9163.2202.60.932.28203,092
AirMix 11002120395.7216.4555.1223.2277.10.850.62451,483
80395.7216.8555.6232.5283.40.860.57223,346
60396.5215.5557.7228.7280.30.860.55187,593
40394.3217.4553.0218.4274.30.850.68121,071
20394.7215.2552.5226.4278.50.850.6060,010
10401.0219.8543.8226.2280.90.810.6635,104
Table 3. Coefficients of the spray spectrum as a function of variable measurement time for the full range of the PDA test for AirMix nozzle 11003.
Time60 s80 s120 s
CountsD30 [μm]Dv0.5 [μm]Dv0.9 [μm]CountsD30 [μm]Dv0.5 [μm]Dv0.9 [μm]CountsD30 [μm]Dv0.5 [μm]Dv0.9 [μm]
Position of the measurement space of the PDA analyzer [mm]550133394.8447.7583.0269365.2428.4570.1272396.7447.7583.0
525267389.8473.5576.5302390.0460.6570.1517397.5479.9583.0
500395388.8454.1570.1514387.8467.0589.4664387.4454.1576.5
475414383.6454.1563.7658381.9460.6589.4977379.6434.8570.1
450724369.9447.7570.1977368.4441.3550.81343375.7454.1570.1
425819343.4409.0531.41252351.8434.8589.42010344.3409.0557.2
4001293342.2434.8570.11629341.4421.9570.12657338.7434.8563.7
3751611325.1409.0557.22619312.3402.6550.83329325.8421.9557.2
3502486310.8415.5589.43117314.3428.4570.14101317.5409.0557.2
3252896301.4415.5570.13741299.6421.9576.55817296.6409.0563.7
3004052279.9396.2550.85448280.6409.0570.17881279.1402.6563.7
2754932276.7415.5570.17094271.1409.0563.710,015272.0402.7570.2
2506312264.2421.9576.57371273.6415.5570.111,739272.8421.9570.1
2256762264.7421.9570.19630269.1415.5570.113,999267.5421.9576.5
2007827268.5421.9570.110,713261.1409.0570.114,211268.9434.8576.5
1759012264.8428.4583.011,183264.2428.4576.516,648267.2421.9576.5
1509698266.9434.8576.512,949265.4434.8576.518,286270.1434.8583.0
12510,596262.3421.9570.113,988263.0428.4576.520,624263.3421.9576.5
10011,448255.7415.5570.115,385263.6434.8583.021,104265.8428.4576.5
7512,236260.1421.9576.515,308263.3421.9583.023,358265.1428.4576.5
5012,291266.3434.8576.516,525265.8434.8576.524,366269.5447.7583.0
2513,033263.5428.4583.017,455261.3421.9563.725,323263.6421.9576.5
012,292264.0434.8576.517,172263.1421.9576.525,473264.2434.8583.0
2511,647267.2428.4570.116,983261.0421.9570.124,502260.4421.9570.1
5011,178265.8434.8589.415,629263.8428.4576.523,501262.3421.9576.5
7510,889259.4428.4589.414,928265.2434.8583.022,617266.0428.4576.5
1009999267.4434.8583.014,437262.5428.4583.020,689267.1434.8583.0
1259251267.7434.8570.112,980265.4428.4570.119,958264.6428.4576.5
1508932268.2421.9576.512,168264.2428.4576.517,750266.0428.4583.0
1757552269.9434.8576.510,637265.6421.9576.516,304266.4421.9576.5
2007145258.7409.0570.19286271.4421.9576.514,457270.3434.8576.5
2255984274.0428.4563.78561272.0428.4576.512,448265.6409.0563.7
2505863263.4402.6576.57440273.9421.9563.711,791271.5415.5570.1
2754920274.6421.9583.06243273.9415.5563.79805267.4396.3563.9
3004464274.8415.5576.55011280.4409.0563.78055285.0415.5576.5
3253347287.3409.0570.13931303.7428.4576.56193294.7415.5563.7
3502536295.4415.5563.72864312.5409.0570.14604319.2428.4570.1
3751962298.3396.2570.12012339.6428.4570.13425329.7428.4576.5
4001353333.2428.4563.71808340.6421.9576.52866333.3434.8576.5
4251078345.7428.4550.81271358.0441.3557.22039359.8434.8583.0
450688364.1428.4589.4979370.6447.7589.41539354.8428.4570.1
475596377.3447.7570.1751373.6434.8550.81081381.1454.1583.0
500417369.6454.1583.0540381.8460.6576.5777390.5460.6583.0
525330373.9434.8589.4362389.9479.9589.4622373.1447.7550.8
550274373.0467.0602.3279391.9454.1583.0442369.0460.6563.7
Table 4. Coefficients of the spray spectrum as a function of variable measurement time for the full range of the PDA test for AirMix nozzle 11003.
Time10 s20 s40 s
CountsD30 [μm]Dv0.5 [μm]Dv0.9 [μm]CountsD30 [μm]Dv0.5 [μm]Dv0.9 [μm]CountsD30 [μm]Dv0.5 [μm]Dv0.9 [μm]
Position of the measurement space of the PDA analyzer [mm]55015384.3409.0467.050392.5428.4602.3128380.2525.0583.0
52516338.8370.4492.872389.1518.6595.9215351.2460.6583.0
50024406.0454.1602.3164311.9396.2525.0236355.8447.7576.5
475109343.5409.0499.2155408.3492.8570.1424323.8421.9589.4
450120371.2434.8557.2230358.8447.7576.5533376.3486.4595.9
425142393.7447.7576.5309368.8434.8550.8656364.9434.8589.4
400248336.5421.9563.7378341.8415.5557.2957339.0428.4550.8
375264323.4409.0544.3652302.9409.0550.81242308.7396.2544.3
350393329.5421.9576.5872296.6402.6544.31805284.3396.2544.3
325532283.0376.8525.01086281.3402.6557.22452284.9396.2557.2
300674284.8409.0595.91110300.1409.0563.72739280.8421.9595.9
275835268.6402.6557.21569281.3409.0576.53714272.7421.9563.7
250933260.1409.0583.02080258.9421.9544.34572261.4409.0563.7
2251330276.6421.9583.02327265.6421.9563.75034263.9421.9583.0
2001349249.7396.2537.92635263.1409.0570.15572262.0421.9570.1
1751309262.4402.6537.92943263.0421.9576.56375260.1421.9576.5
1501546270.7409.0557.23375264.0441.3576.57375257.2441.3583.0
1251737274.5441.3583.03493256.5409.0570.18158257.9434.8563.7
1001827259.0409.0576.53865262.4421.9576.59013252.9428.4563.7
751913255.6434.8570.13887258.2409.0550.88983251.3428.4583.0
502103258.6434.8583.04196263.6434.8589.49497251.4421.9576.5
252298249.0409.0563.74399257.7415.5563.79521249.2415.5570.1
02241255.0409.0557.24368267.5434.8563.79192252.8415.5570.1
251830266.0441.3589.44026259.7421.9570.18713255.5441.3589.4
501804261.1441.3557.23789261.3415.5557.28892252.3434.8583.0
751802264.1415.5570.13695263.2447.7576.58395250.1421.9583.0
1001644272.4428.4595.93466259.6428.4570.17703259.9441.3583.0
1251668254.7396.2576.53081269.9434.8570.17130254.6421.9576.5
1501407246.4409.0550.82921270.6434.8583.06415259.7421.9570.1
1751382255.8415.5570.12550280.0447.7570.15952253.3409.0576.5
2001196268.4409.0563.72407259.5428.4589.45240255.7415.5570.1
2251042264.2434.8576.52178246.5389.7525.05171260.9421.9570.1
250737275.2415.5589.41800269.2434.8595.94335266.8415.5583.0
275928266.3434.8570.11433281.0409.0557.23435274.5415.5570.1
300675259.2428.4570.11302277.4415.5563.72796277.8421.9557.2
325519287.4396.2537.9986306.1428.4570.12480283.9421.9570.1
350414286.2421.9557.2841324.0428.4583.01764303.2415.5557.2
375239321.1389.7583.0591323.9434.8557.21300306.3409.0563.7
400222353.8434.8576.5404340.2441.3550.8985323.7415.5557.2
425153326.6434.8570.1319342.7409.0544.3837338.9434.8576.5
450110327.0409.0512.1175375.5447.7550.8592346.9434.8589.4
47570349.3434.8518.6169379.5473.5557.2427359.3441.3570.1
50077344.7402.6512.1111370.6460.6544.3274369.2460.6570.1
52535423.5512.1608.763355.6383.3486.4238345.8434.8570.1
55018464.5512.1583.048405.9486.4595.9158346.2460.6608.7
Table 5. Coefficients of variation for single nozzles: CV(D30)—based on droplet diameter distribution, CV—based on volume distribution on groove table.
AirMix 11003MMat 11003 EZTeeJet 11001VSMMat 11003RSAirMix 11002
Time T [s]CV(D30) [%]
12066.558.342.654.458.8
8066.759.245.955.358.9
6066.757.348.054.359.8
4065.756.645.555.162.6
2068.359.446.154.165.0
1068.661.141.654.165.4
CV [%]
12065.957.146.353.160.1
Table 6. Results of the CV coefficient of variation as a function of measurement time for the boom section.
Coefficient of Variation, Submission of Results on the Virtual Boom/
Number of Cylinders Out of Range ± 15% of Average Volume Value
Groove Table—CVb [%]Point Measurement with a PDA Analyzer—CV(D30)b [%]
Measurement Time T [s]
1201208060402010
AirMix 110033.915.645.965.095.666.285.83
0000000
MMat 11003 EZ9.0410.110.3511.2010.0811.7213.41
0000222
MMat 11003 RS9.5310.4710.1210.4811.113.5712.24
0000122
AirMix 110028.0510.349.6410.7311.2712.8611.55
0000122
TeeJet 11001VS5.896.195.355.6610.197.94.61
0000100
Disclaimer/Publisher’s Note: The statements, opinions and data contained in all publications are solely those of the individual author(s) and contributor(s) and not of MDPI and/or the editor(s). MDPI and/or the editor(s) disclaim responsibility for any injury to people or property resulting from any ideas, methods, instructions or products referred to in the content.