Article

Empirical Study on Failure Prediction of Rotating Biological Contactors Available for Landfill Site Operators: Scoring Analysis Based on 17-Year Daily Inspection Reports

1
Material Cycles Division, National Institute for Environmental Studies (NIES), 16-2 Onogawa, Tsukuba 305-8506, Ibaraki, Japan
2
Material Cycles and Waste Management Group, Center for Environmental Science in Saitama (CESS), 914 Kamitanadare, Kazo 347-0115, Saitama, Japan
*
Author to whom correspondence should be addressed.
Appl. Sci. 2025, 15(13), 6950; https://doi.org/10.3390/app15136950
Submission received: 20 April 2025 / Revised: 23 May 2025 / Accepted: 12 June 2025 / Published: 20 June 2025
(This article belongs to the Section Ecology Science and Engineering)

Abstract

This study proposes a practical method for the early detection of failure signs in a rotating biological contactor (RBC) system that has been in long-term operation at a municipal solid waste landfill. Seventeen years of inspection logs, recorded between 2006 and 2023, were digitized and analyzed with a focus on abnormal noise, electric current values, operational status, and failure history. The analysis revealed that frequent occurrences of abnormal noise and sudden fluctuations in current tend to precede equipment failures. Based on these findings, we developed a scoring model for the predictive maintenance of RBCs. Traditionally, determining the score required professional knowledge such as performing a sensitivity analysis. However, by utilizing AI (ChatGPT o4), we were able to obtain recommended values for these parameters. This means that operators can now build and adjust a scoring model for predictive maintenance of RBCs according to their specific on-site conditions. On the other hand, sudden increases in current and abnormal noises were previously considered strong indicators of failure prediction. These parameters will depend on factors such as the sensitivity of electrical current meters and surrounding noise. Therefore, depending on the specific environmental conditions at the site, the scoring model developed in this study may have limited predictive accuracy.

1. Introduction

The rotating biological contactor (RBC) is a widely used wastewater treatment system that removes organic pollutants via biofilms attached to rotating disks (see Figure 1). It offers stable performance and is simple to operate and maintain [1,2,3,4,5,6,7,8,9,10]. RBCs have also been used for treating landfill leachate, which typically has high levels of biochemical oxygen demand (BOD), chemical oxygen demand (COD), and total nitrogen (T-N) [11,12,13,14]. However, recent shifts in landfill composition, particularly the replacement of combustible waste with incineration ash, have altered leachate characteristics. Incineration ash produces leachate with low organic content and high salinity, which inhibits biofilm formation and reduces treatment performance.
A critical issue is calcium scale formation from leachate, which accumulates on disks as calcium carbonate. This can cause mechanical imbalance and, in severe cases, shaft breakage [15,16,17]. These failures occur suddenly and require costly repairs. In response, RBC designs have evolved to enhance efficiency and durability. Notable innovations include aerofoil-embedded mesh disks [18], nonwoven biofilm carriers [19], membrane-integrated systems [20,21], and algae-assisted nitrification control [22]. Low-energy approaches such as glycogen-accumulating organisms (GAO)-enriched, non-aerated RBCs and water-wheel-driven systems have also been developed [23].
Meanwhile, AI-based predictive maintenance has gained attention. Ucar et al. (2024) proposed an integrated framework for AI-driven fault detection [24], and Waqas et al. (2023) emphasized the importance of RBC operational parameters for mechanical stability [25]. These insights underscore the potential of using signals like electric current and noise for AI-based failure prediction.
In this study, we aim to prevent such RBC mechanical failures before they occur by analyzing 17-year operational inspection log data routinely recorded at actual leachate treatment facilities. However, this inspection log only includes basic water quality measurements, such as pH and transparency. Concentrations of chemical substances are also factors that affect RBC failure. Since these measurements require analysis costs, they are not included in the inspection log. Thus, this study predicts failure based on mechanical changes, such as abnormal noise and current consumption, which are related to torque.
A scoring model was applied to predictive maintenance. This is because prediction errors occur when fitting actual measurements to a model in machine learning and numerical simulation. If failure is underestimated, the model will not be effective for predictive maintenance. Scoring models require the definition of thresholds and weights to generate scores. Traditionally, these have been determined by sensitivity analysis based on specialized knowledge. However, using artificial intelligence (AI) to obtain these values enables landfill operators without professional knowledge to build and adjust models. This research focuses on the practical aspects of predictive maintenance for landfill operators, providing a scoring model they can build and adjust themselves.
Note that leachate treatment facilities at landfill sites operate under fundamentally different principles compared to general wastewater treatment facilities. While general treatment facilities are designed to maintain continuous compliance with effluent standards regardless of influent variability, landfill leachate facilities are often permitted to suspend operation once the treated leachate satisfies environmental discharge criteria. Consequently, these systems are often designed with minimal investment, prioritizing basic regulatory compliance over long-term performance or operational resilience. Furthermore, to reduce operating costs, routine inspections and maintenance are often limited, which increases the risk of undetected equipment degradation or failure.

2. Materials and Methods

2.1. Overview of Landfill Site

The landfill site targeted in this study, located in Saitama Prefecture, Japan, began operations in 1990 and remains in continuous use to this day. The site has a capacity of 60,700 m3, a surface area of 11,500 m2, and a depth of 7 m. All waste in the landfill is limited to non-combustible materials. As a result, the leachate generated from this site has relatively low organic loading and, in recent years, has consistently exhibited low contaminant concentrations that meet regulatory maintenance standards.
At the leachate treatment facility (Kobelco Eco-Solutions Co., Ltd., Kobe, Japan) adjacent to the landfill site, a RBC has been in continuous operation as the sole biological treatment process since the facility began operation. No other biological treatment methods have been installed alongside it. In 2021, due to the aging of the existing RBC system, a full-scale replacement of the rotating discs was carried out at considerable cost.
Although the current leachate has extremely low pollutant loading, simplifying the treatment process or decommissioning the system remains challenging due to the difficulty of gaining consensus from local residents. Concerns regarding potential health impacts also necessitate a cautious approach. Against this background, it is essential to accumulate scientific knowledge that supports the safe and stable long-term operation of the existing system, while extending its service life as much as possible.

2.2. Leachate Treatment Facility

The landfill site under study is equipped with a dedicated treatment facility for processing raw leachate. The facility has an average daily treatment capacity of 45 m3 and a maximum capacity of 140 m3/day. To ensure the quality of the treated effluent, the facility employs a multi-stage treatment process as outlined below.
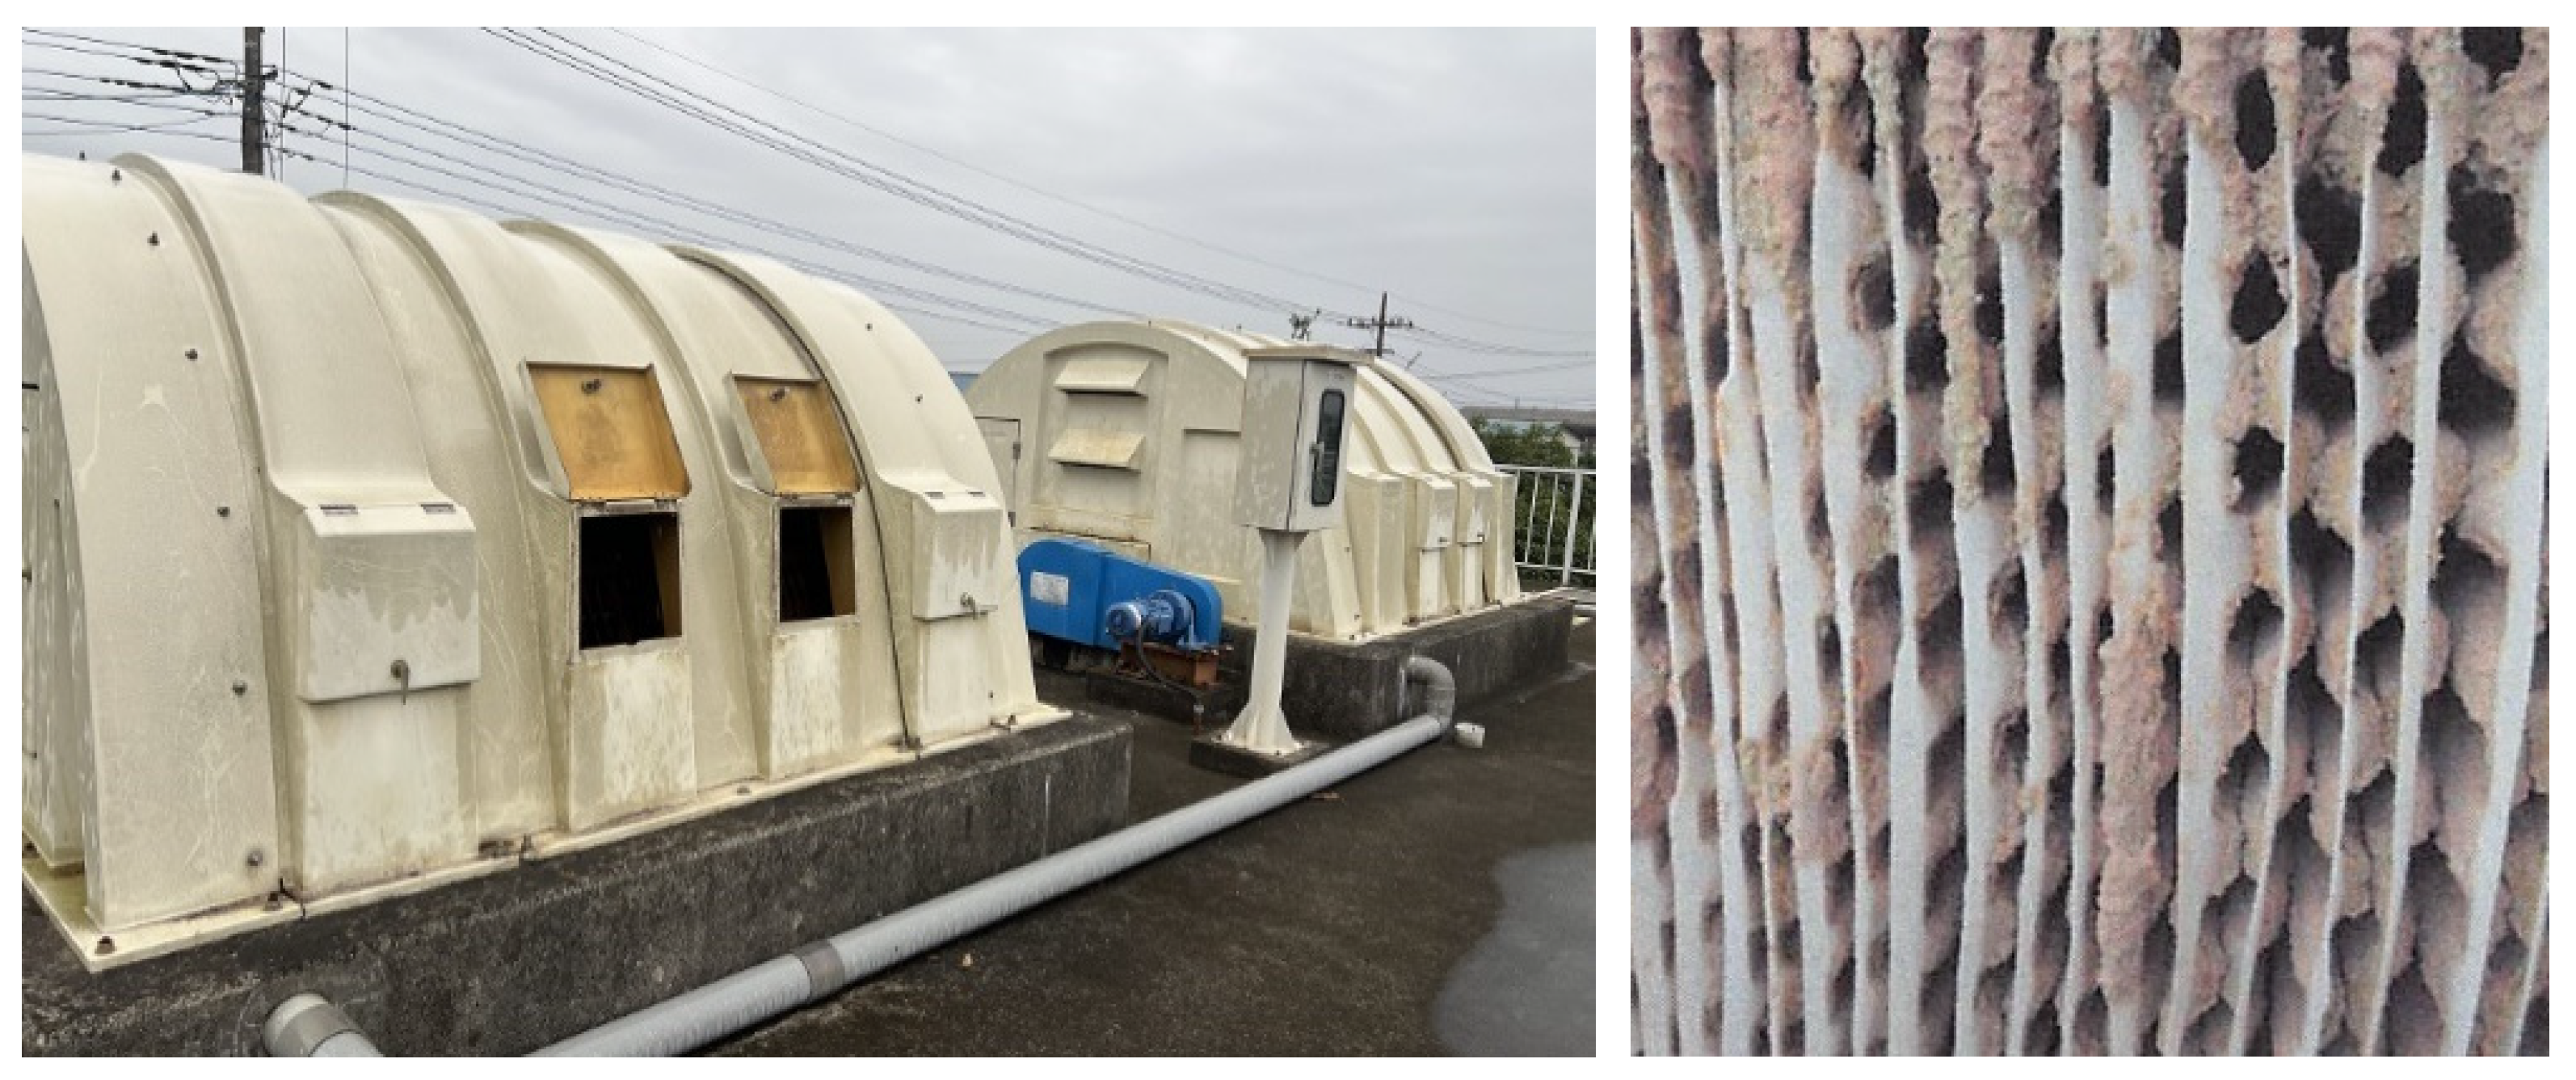
The treatment flow begins with preliminary treatment of the leachate generated from the landfill, followed by biological treatment using a RBC to decompose organic matter. Subsequently, the water undergoes coagulation and sedimentation, sand filtration, activated carbon adsorption, and disinfection, before being discharged. Two RBC units are installed in parallel, allowing one to continue operating in the event of a malfunction or during maintenance of the other (see Figure 2 and Figure 3).
Although measuring the concentrations of treated water is necessary to ensure environmental safety, there are no regulations in Japan to measure the concentrations of influent leachate. Therefore, specific analyzed leachate concentrations do not exist. The BOD and COD of the leachate at this landfill site are considered low because the landfill contains only non-combustible waste.
In terms of treatment performance in the specifications, the facility achieves a 95% removal rate for both BOD and SSs (suspended solids), based on an influent concentration of 200 mg/L, resulting in effluent concentrations of 10 mg/L for each. In addition, the facility maintains a 90% removal rate for COD, with an effluent concentration of 20 mg/L.
Even in landfills where non-combustible waste is predominantly disposed of, it is inevitable that pollutants may enter the leachate, either by adhering to the surface of non-combustible materials or being contained within them. The removal of these contaminants is carried out by the biological treatment process—specifically, the RBC. This study aims to extract and evaluate early warning signs of potential RBC failures by analyzing routine equipment inspection data.

2.3. Contents of Inspection Logs

To assess the operational status and identify potential signs of failure in the RBC at the leachate treatment facility under study, this research analyzes digitized data derived from paper-based inspection logs recorded over approximately 17 years, from 3 April 2006 to 27 March 2023. These logs document equipment inspections conducted twice a week and consist of diagnostic records produced consistently throughout the entire period by the same contracted organization, namely, the specialized manufacturer responsible for the production and maintenance of the RBC system. Importantly, these records were not obtained for experimentation purposes, but rather as part of routine facility operations. Thus, the 17-year dataset reflects real-world practices, including periods of normal operation and system anomalies. While some inconsistency or discontinuity in data acquisition may exist due to operational circumstances, this is a key strength of the study. It allows us develop a predictive model based on long-term, raw inspection data collected under practical, field-based conditions.
The inspection logs contain a wide range of recorded items, which can be broadly categorized into “water quality”, “equipment”, and “power consumption”. The water quality category includes basic indicators for the influent leachate, such as water temperature, pH, turbidity, dissolved oxygen, and residual chlorine. These parameters serve as important indicators for assessing the stability of treatment performance. For equipment-related items, the logs include current readings and operational conditions (inspection results) for various components such as pumps, blowers, and neutralization tanks. In the case of the RBC, its operational status is classified into five categories: “normal”, “abnormal noise”, “overheating”, “malfunction”, and “shutdown”. The current drawn by the RBC is also recorded. Additionally, total power consumption and flow rate data for the entire leachate treatment facility are recorded on a daily basis.
All the inspection reports were digitized manually to prevent misreading, rather than using OCR (optical character recognition). The digitized content was compiled into Excel 365 spreadsheets (Microsoft Corporation, Redmond, WA, USA), and MATLAB R2024a (The MathWorks, Inc., Natick, MA, USA) was used for subsequent tabulation and visualization. Any blank fields in the inspection logs were treated as follows. In Excel, the cells were left blank; in MATLAB, they were entered as “Not a Number”. Blank data was excluded from the dataset for analysis.
The inspection data serve as a highly reliable source for analyzing long-term trends and detecting early signs of abnormalities. However, due to the sheer volume of long-term records, it is difficult for humans to manually identify patterns that offer practical advantages. Furthermore, even with machine learning and numerical simulation, prediction errors are unavoidable. In cases where numerical models underestimate, this will result in missing signs of abnormalities. Therefore, in this study, we applied a scoring model that can handle all data in its raw form for predictive maintenance.
Building a scoring model requires professional knowledge, such as sensitivity analysis, to set thresholds and weights. However, this study assumes that business operators, who lack professional knowledge, created and used the scoring model. Thus, artificial intelligence (AI) estimated the thresholds and weights. Recent AI systems are probability-based, and their results can depend on factors such as hallucinations, prompt input, and user usage history. We also explained that the validity of the thresholds and weights suggested by the AI. ChatGPT (OpenAI) was the AI tool employed for this purpose.

2.4. Summary of Inspection Logs

In this study, paper-based inspection logs recorded over approximately 17 years (from 2006 to 2023) at a municipal waste landfill were digitized and analyzed. The focus was on 25 types of equipment installed at the leachate treatment facility. For each piece of equipment, operational status, abnormal occurrences, and failure history were compiled. The summary results are presented in Table 1 and Table 2. These are the results of the checks on each equipment that consists of the leachate treatment facility, indicating which equipment is easy to break down or not. The equipment covered in the records includes blowers, raw leachate pumps, filtration pumps, adjustment tank pumps, and rotating disk devices. For each device, operating states were categorized into “operating (normal or with abnormal noise),” “standby (normal or with abnormal noise),” and “under repair/negotiation.” Frequent shutdowns and failures due to abnormal noise were observed in rotating disk device No. 1 and filtration pump No. 1. In contrast, rotating disk device No. 2 and filtration pump No. 2 exhibited more stable operation than their respective No. 1 units. Most of the other equipment, including the pH meter, experienced almost no failures during the 17 years of operation.

3. Results and Discussion

3.1. Relationship with Leachate Water Quality

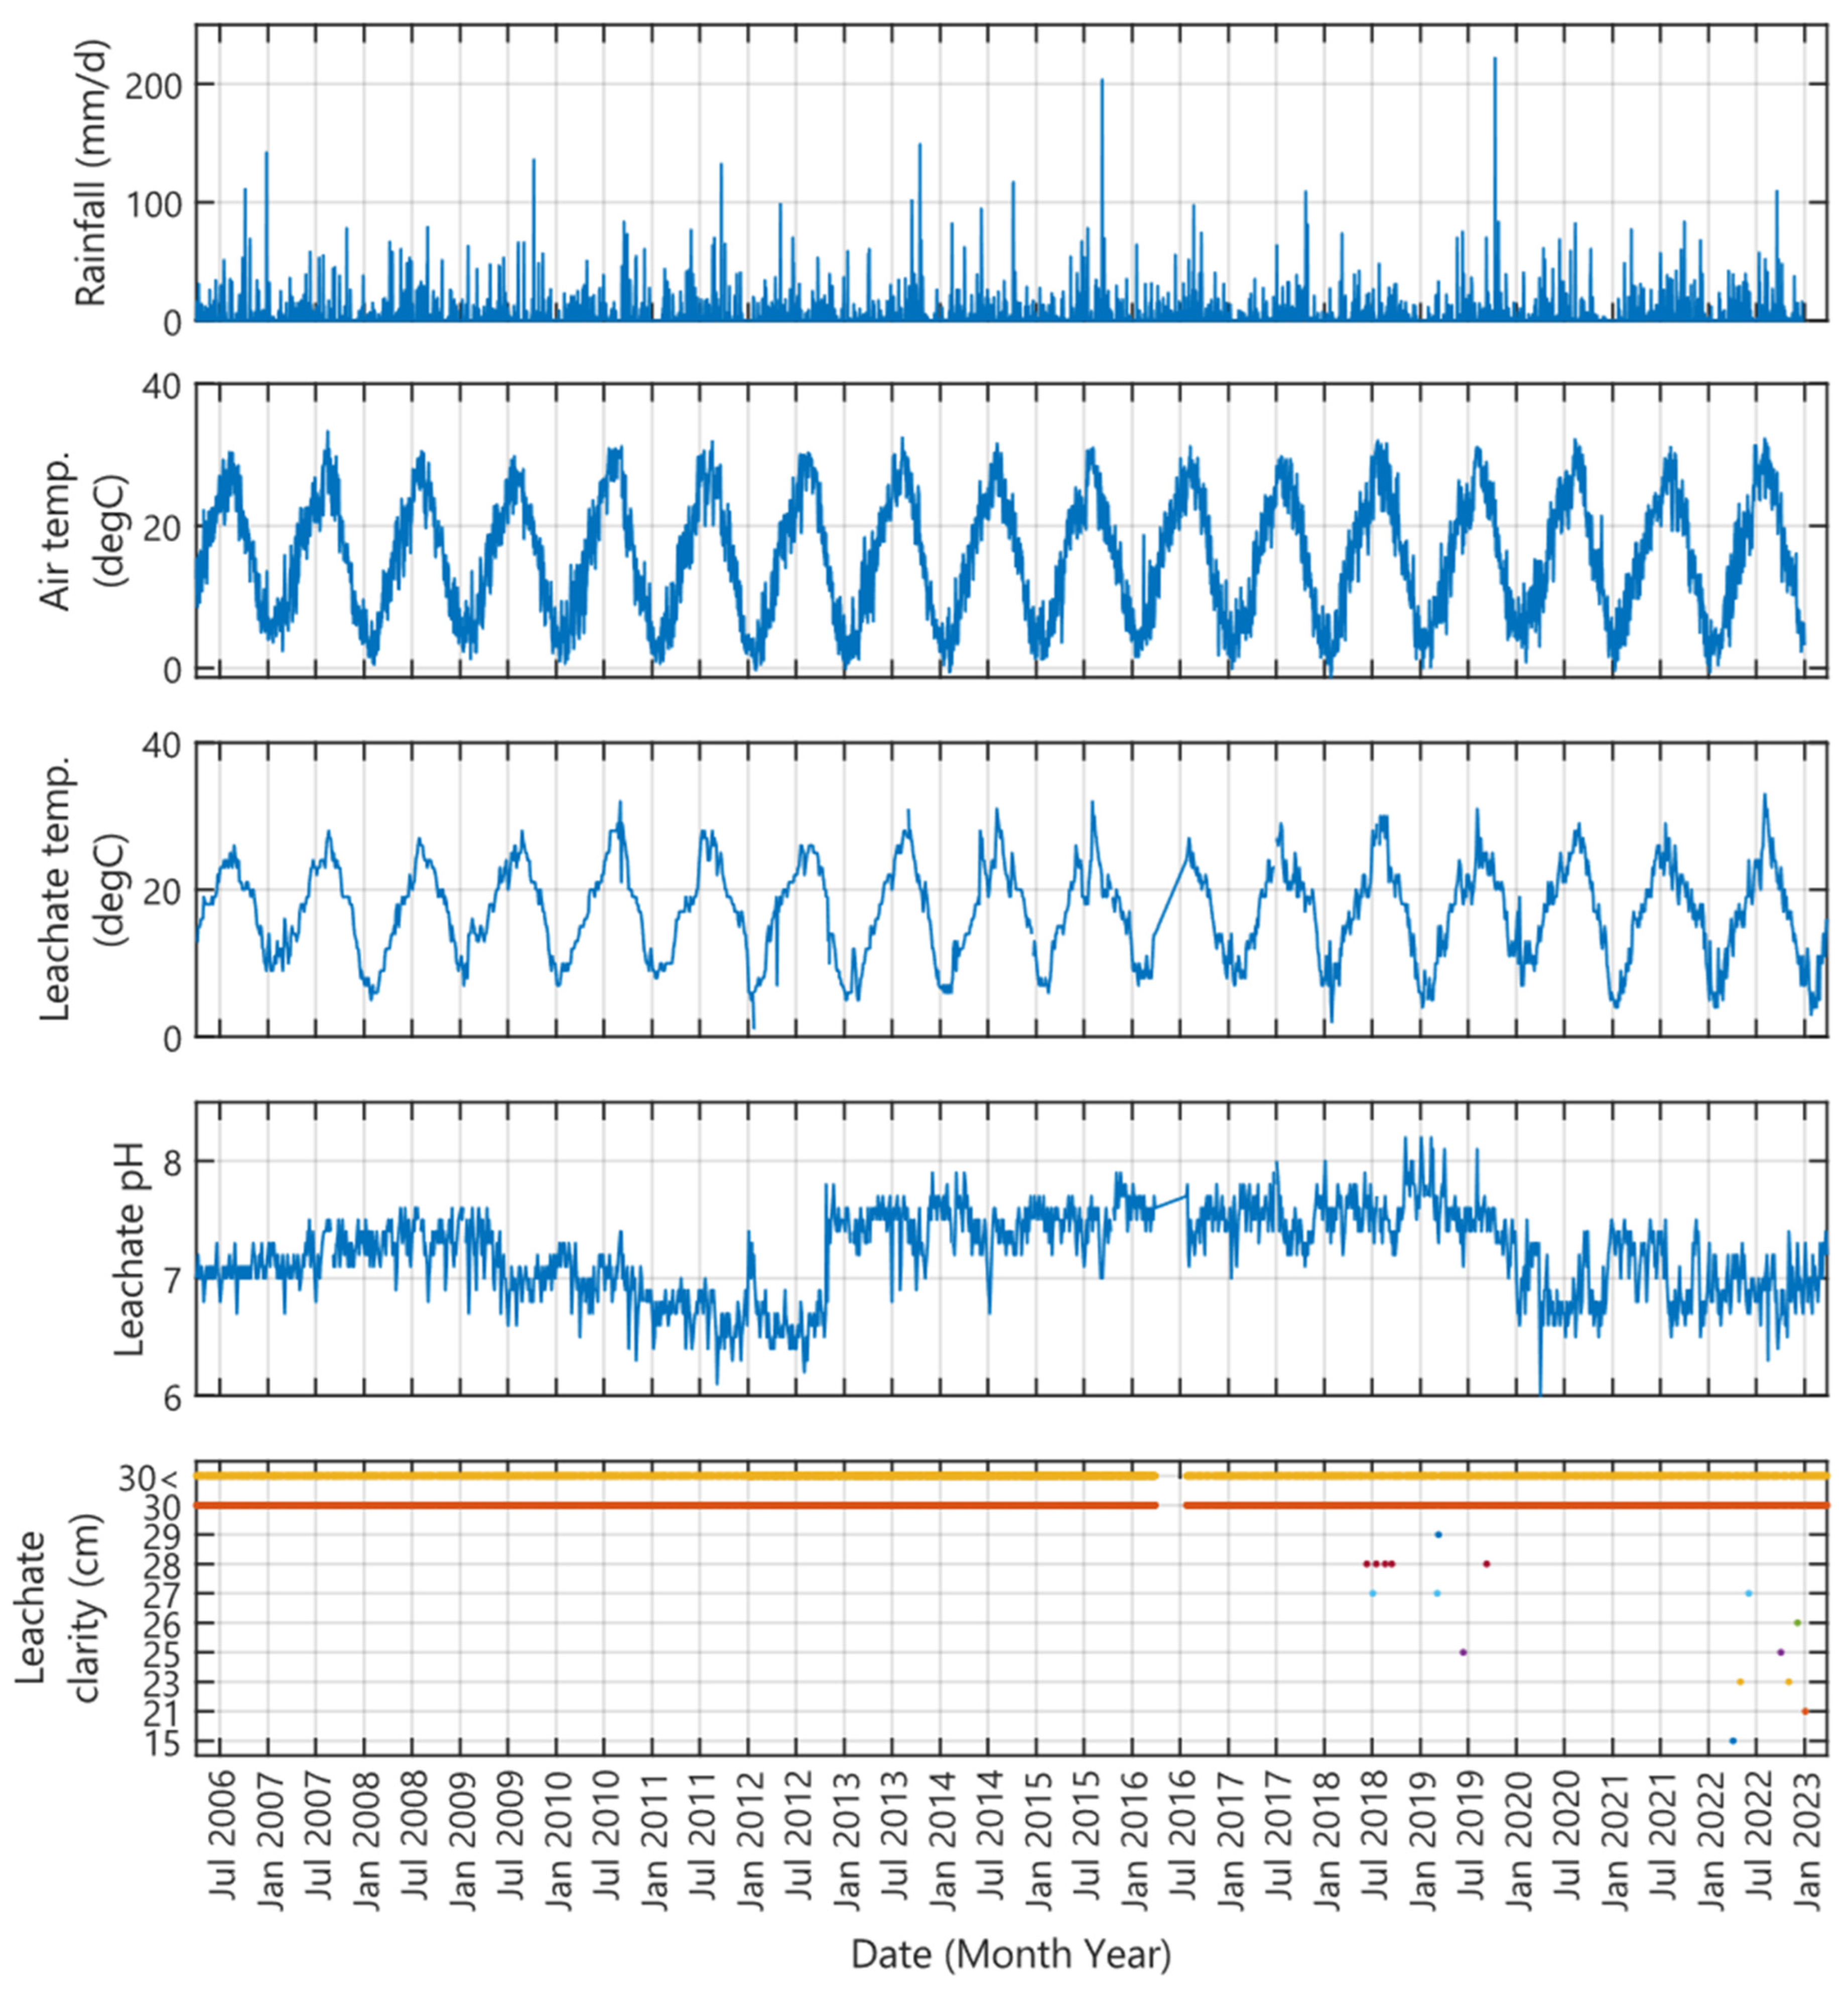
Figure 4 shows the long-term trends in rainfall and temperature at the landfill site, as well as the water quality of the leachate flowing into the treatment facility, including water temperature, pH, and transparency. While leachate quality is considered one of the potential causes of equipment failures within the treatment facility, the leachate generated at this landfill remained relatively stable, with water temperatures ranging from 10 to 30 °C and pH values between 6 and 8. Transparency refers to the maximum depth at which objects can be distinguished from the water surface, and is an indicator of water clarity. The higher the transparency, the closer the water is to being colorless, and the lower the transparency, the more turbid the water becomes. The transparency meter used in this facility has a maximum detectable depth of 30 cm, and transparency values above this are denoted as >30 cm. Transparency was generally maintained above 30. A few days of turbidity were observed over the 17-year period. The leachate was consistently clear. It was free of suspended solids (SSs).
While it is known that malfunctions of equipment within the leachate treatment facility can be caused by foreign substances such as sludge and fine particles, the water quality data suggest that these factors are unlikely to be the direct cause in this case. This is because the transparency consistently remained above 30, indicating that SSs were rarely visible to the naked eye. Additionally, the pH stayed within a neutral range, which is not conducive to significant calcium precipitation. Given these conditions, it is reasonable to conclude that the operational environment of the equipment was favorable, and that the observed failures were likely due to aging and mechanical wear of the equipment itself.

3.2. Characteristic Indicators of RBC Failure

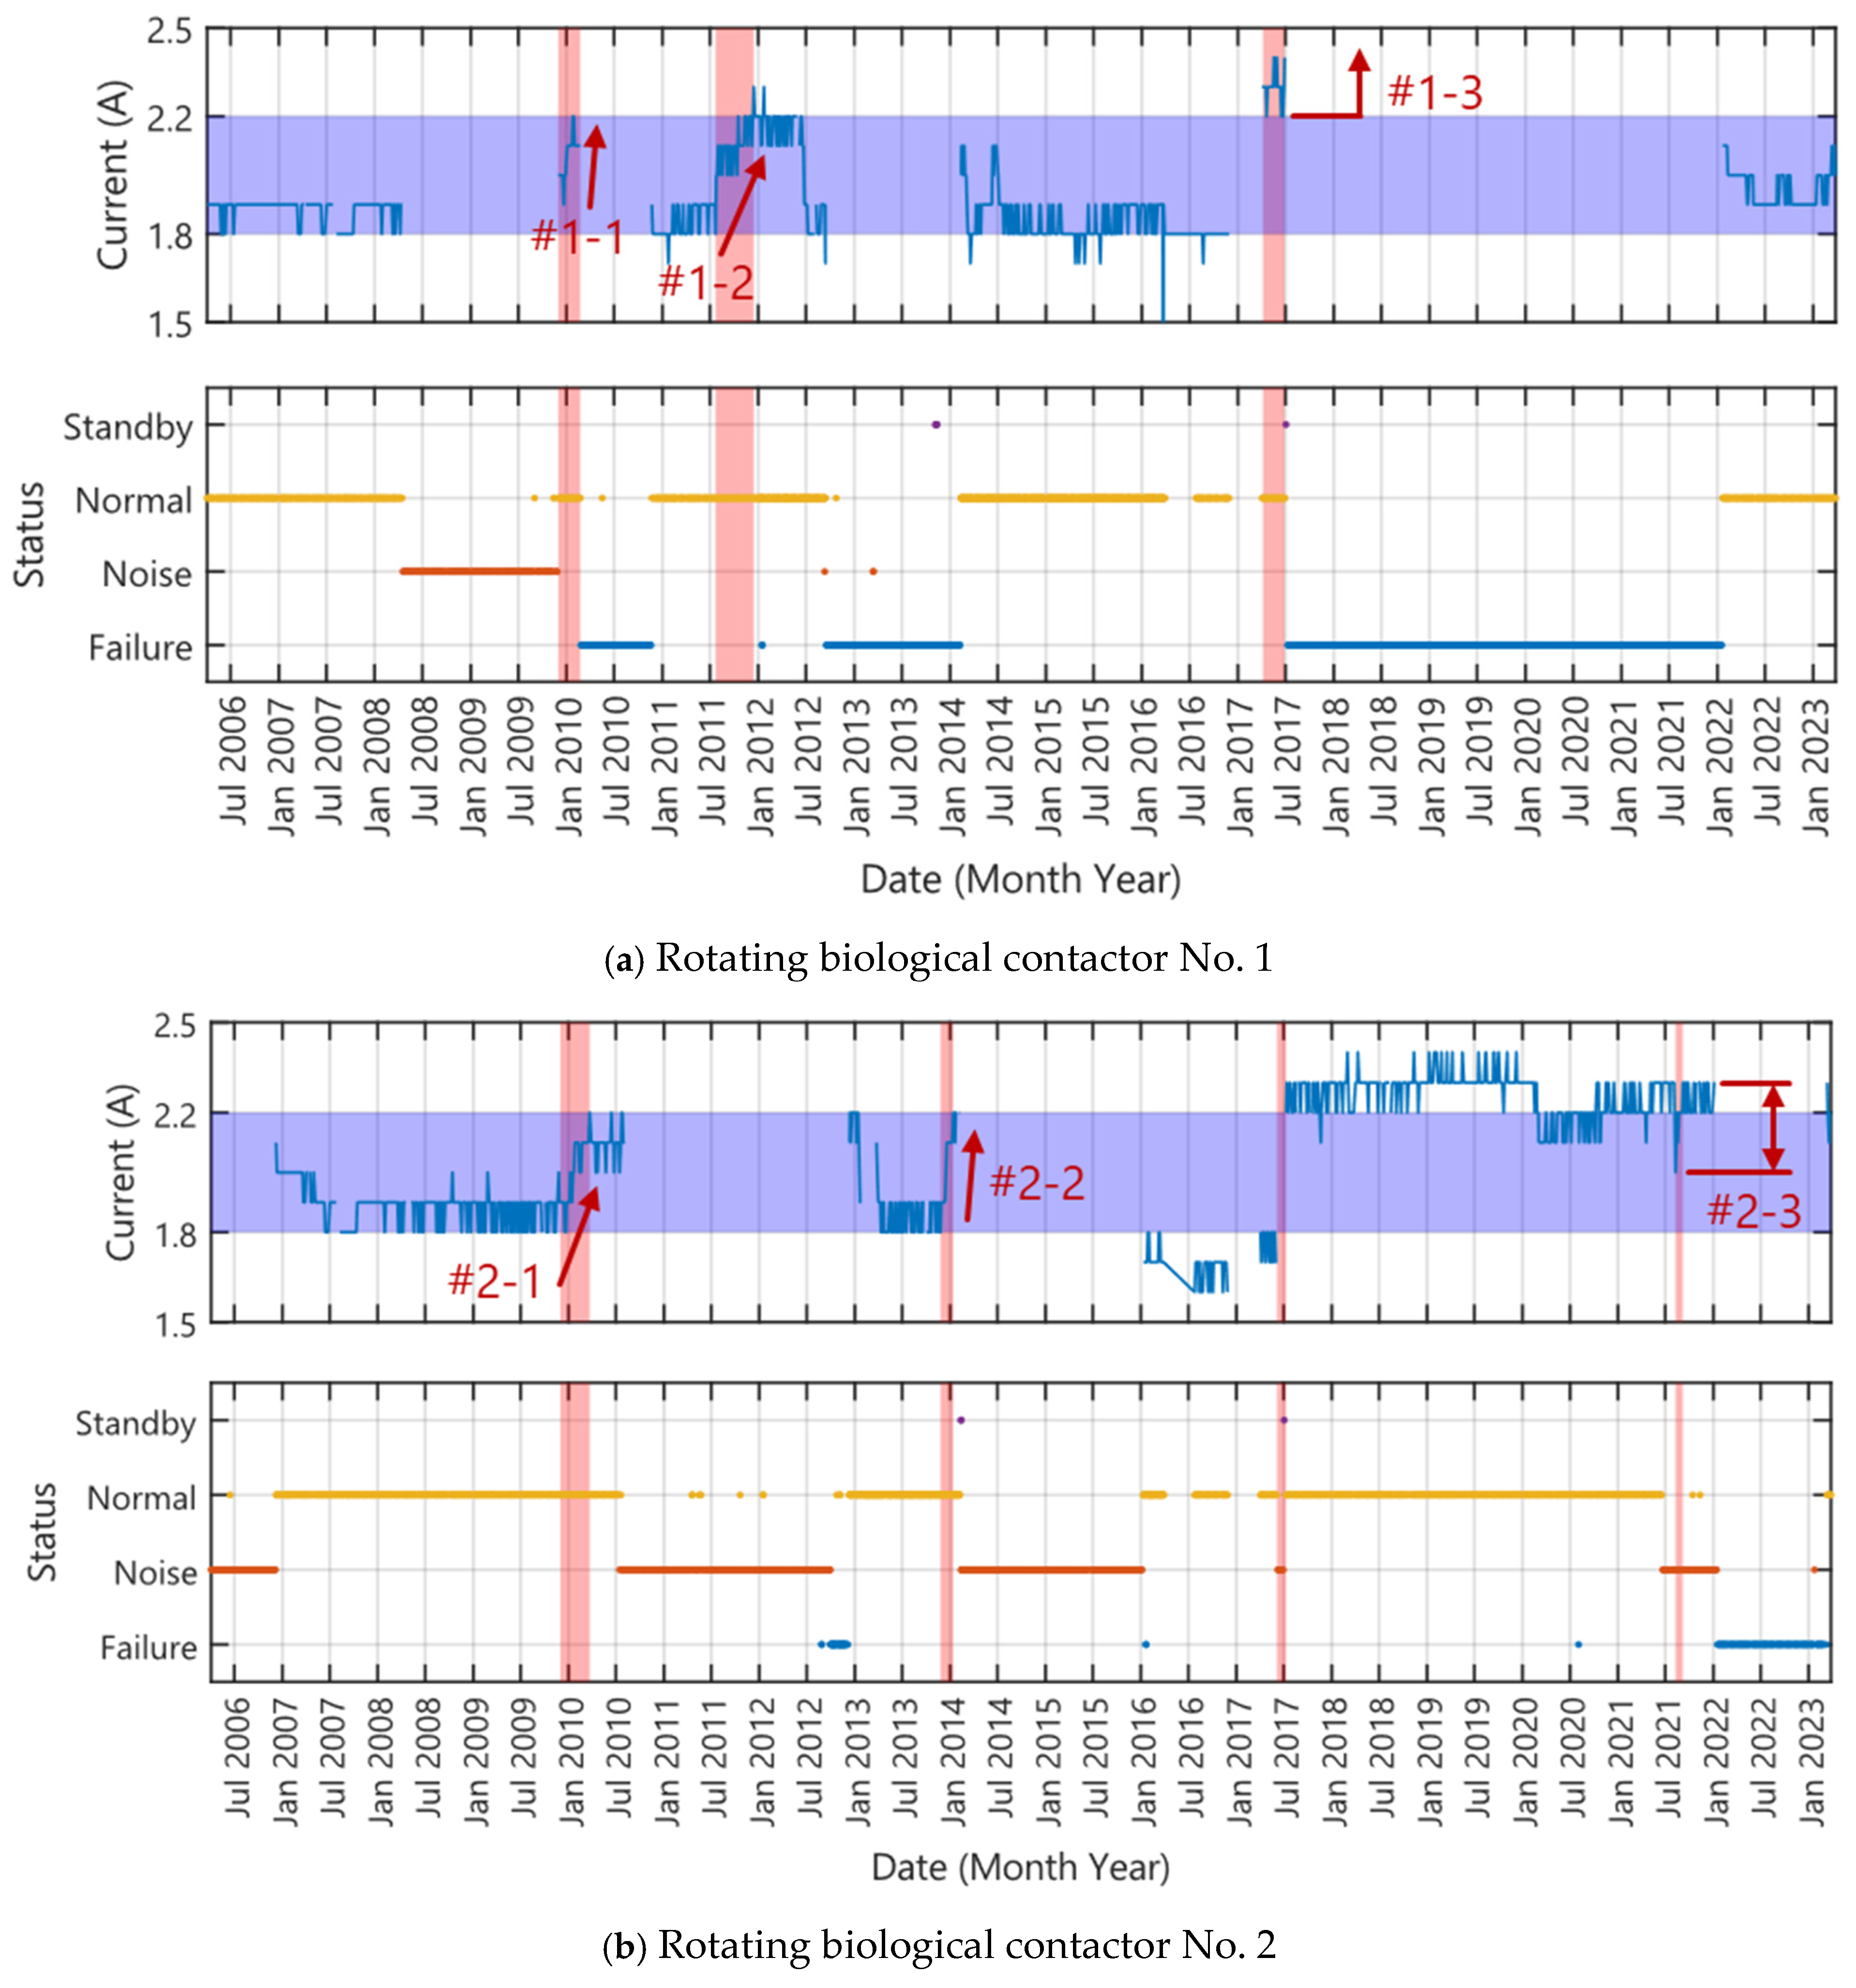
Since the failures were considered to be caused by mechanical aging, the relationship between power consumption and failure in the rotating disk devices was examined, as shown in Figure 5. The figure illustrates the power consumption and operational status of rotating disk device No. 1 and No. 2, which are installed in parallel.
Since the rotating disk devices operate under constant voltage conditions, an increase in power consumption indicates an increase in load. This is because the torque required to rotate the disks increases due to factors such as mechanical wear, reduced lubrication between components, and increased disk weight resulting from long-term alternating exposure to air and leachate, which leads to calcium precipitation. Therefore, power consumption serves as a relevant parameter related to the failure of rotating disk devices. In particular, a rising trend in power consumption is often associated with the occurrence of abnormal noise, followed in some cases by eventual failure.
Figure 5a shows the time-series variation in current (top) and operational status (bottom) of the RBC No. 1 over a 17-year period. The blue-shaded area in the top panel represents the normal operating current range (1.8–2.2 A). Notable events are highlighted with red arrows. The arrows labeled #1-1 and #1-2 indicate periods of sudden current increase, which preceded failure events and were also accompanied by abnormal noise. The arrow labeled #1-3 marks a prolonged period where the current remained consistently above the normal range, even though no abnormal noise was reported. The bottom panel categorizes the operational status based on daily inspection logs into four classes: “Standby”, “Normal”, “Noise”, and “Failure”. The red-shaded bands correspond to failure periods, showing clear alignment with anomalies in current values. These observations suggest that sudden increases in current and high current levels can serve as effective early indicators of potential mechanical failure, even in the absence of abnormal noise.
Figure 5b presents the time-series variation in current (top) and operational status (bottom) of RBC No. 2 over a 17-year period. The arrows labeled #2-1 and #2-2 indicate periods of sudden current increase, both of which were followed by the occurrence of abnormal noise and equipment failure. In contrast, the arrows labeled #2-3 represents a period where the fluctuation amplitude of the current increased significantly, despite remaining within the normal range. The fluctuation amplitude of the current suggests potential instability in the rotational load and serves as an effective early indicator. When the fluctuation exceeds 0.3 A as shown in the arrows labeled #2-3, it can be regarded as an early warning sign of failure.
In fact, no previous studies have monitored RBC maintenance information over the long term. However, it is well known that current consumption increases with the rotation speed of the disk [6]. Considering that an increase in self-weight due to scale precipitation on the rotating disk and a decrease in shaft lubricity may increase the torque required for rotation, an increase in the current consumption can be considered an indicator of mechanical service life. Mba (2003) summarized the mechanical characteristics of RBCs and stated that, if the design does not prevent stress concentration, uneven loads act on the components and will lead to damage and vibration caused by loosening bolts [4]. In addition to the data analysis conducted in this study, Ucar et al. (2024) stated that vibration analysis is an effective method for predictive maintenance [24]. Although the logs used in this study did not include any records related to heat generation, Saini (2022) stated that heat generation caused by mechanical factors is also a cause of failure in RBCs [18].
The numerical data discussed in this analysis are specific to this particular rotating disk device. However, the same qualitative behavior is considered applicable to other rotating disk devices as well. The key findings are as follows:
(1)
Normal operation is associated with a defined current range;
(2)
A sharp rise in current tends to precede the onset of abnormal noise;
(3)
Failure is preceded by sustained current fluctuations with increasing amplitude following the appearance of abnormal noise.

3.3. Failure Prediction Scoring Model

Machine learning and AI are capable of handling significantly larger volumes of information than humans. They excel at identifying and representing hidden relationships within data, making them indispensable tools in modern big data analysis. In this study, a diverse set of data spanning 17 years was also analyzed. The visualization of this data suggested the trends described in the previous sections (trends 1 through 3), which inspired an attempt to construct a predictive model supported by ChatGPT.
We can obtain specific weights for each failure factor by providing ChatGPT with the qualitative failure factors (1) through (3) above as prompts. Prior to applying the prompts to unknown cases, we tested them using known failure scenarios to confirm that the AI-generated outputs aligned with expected outcomes. Through this process, we determined prompts that consistently produced realistic and interpretable results. The components of the score are shown in Table 3, and the evaluation criteria are presented in Table 4. Actual operational data were used for scoring and validation to assess the applicability of the AI-suggested weight.
The key point for validation is that in predictive maintenance, scoring must not underestimate RBC deterioration. Even if it overestimates, it can be used for predictive maintenance to be on the safe side. With this in mind, we verified whether the threshold detects all failure events in advance using AI-suggested weights. This is possible because thresholds can be determined for each risk level to predict failures once the weights are defined.
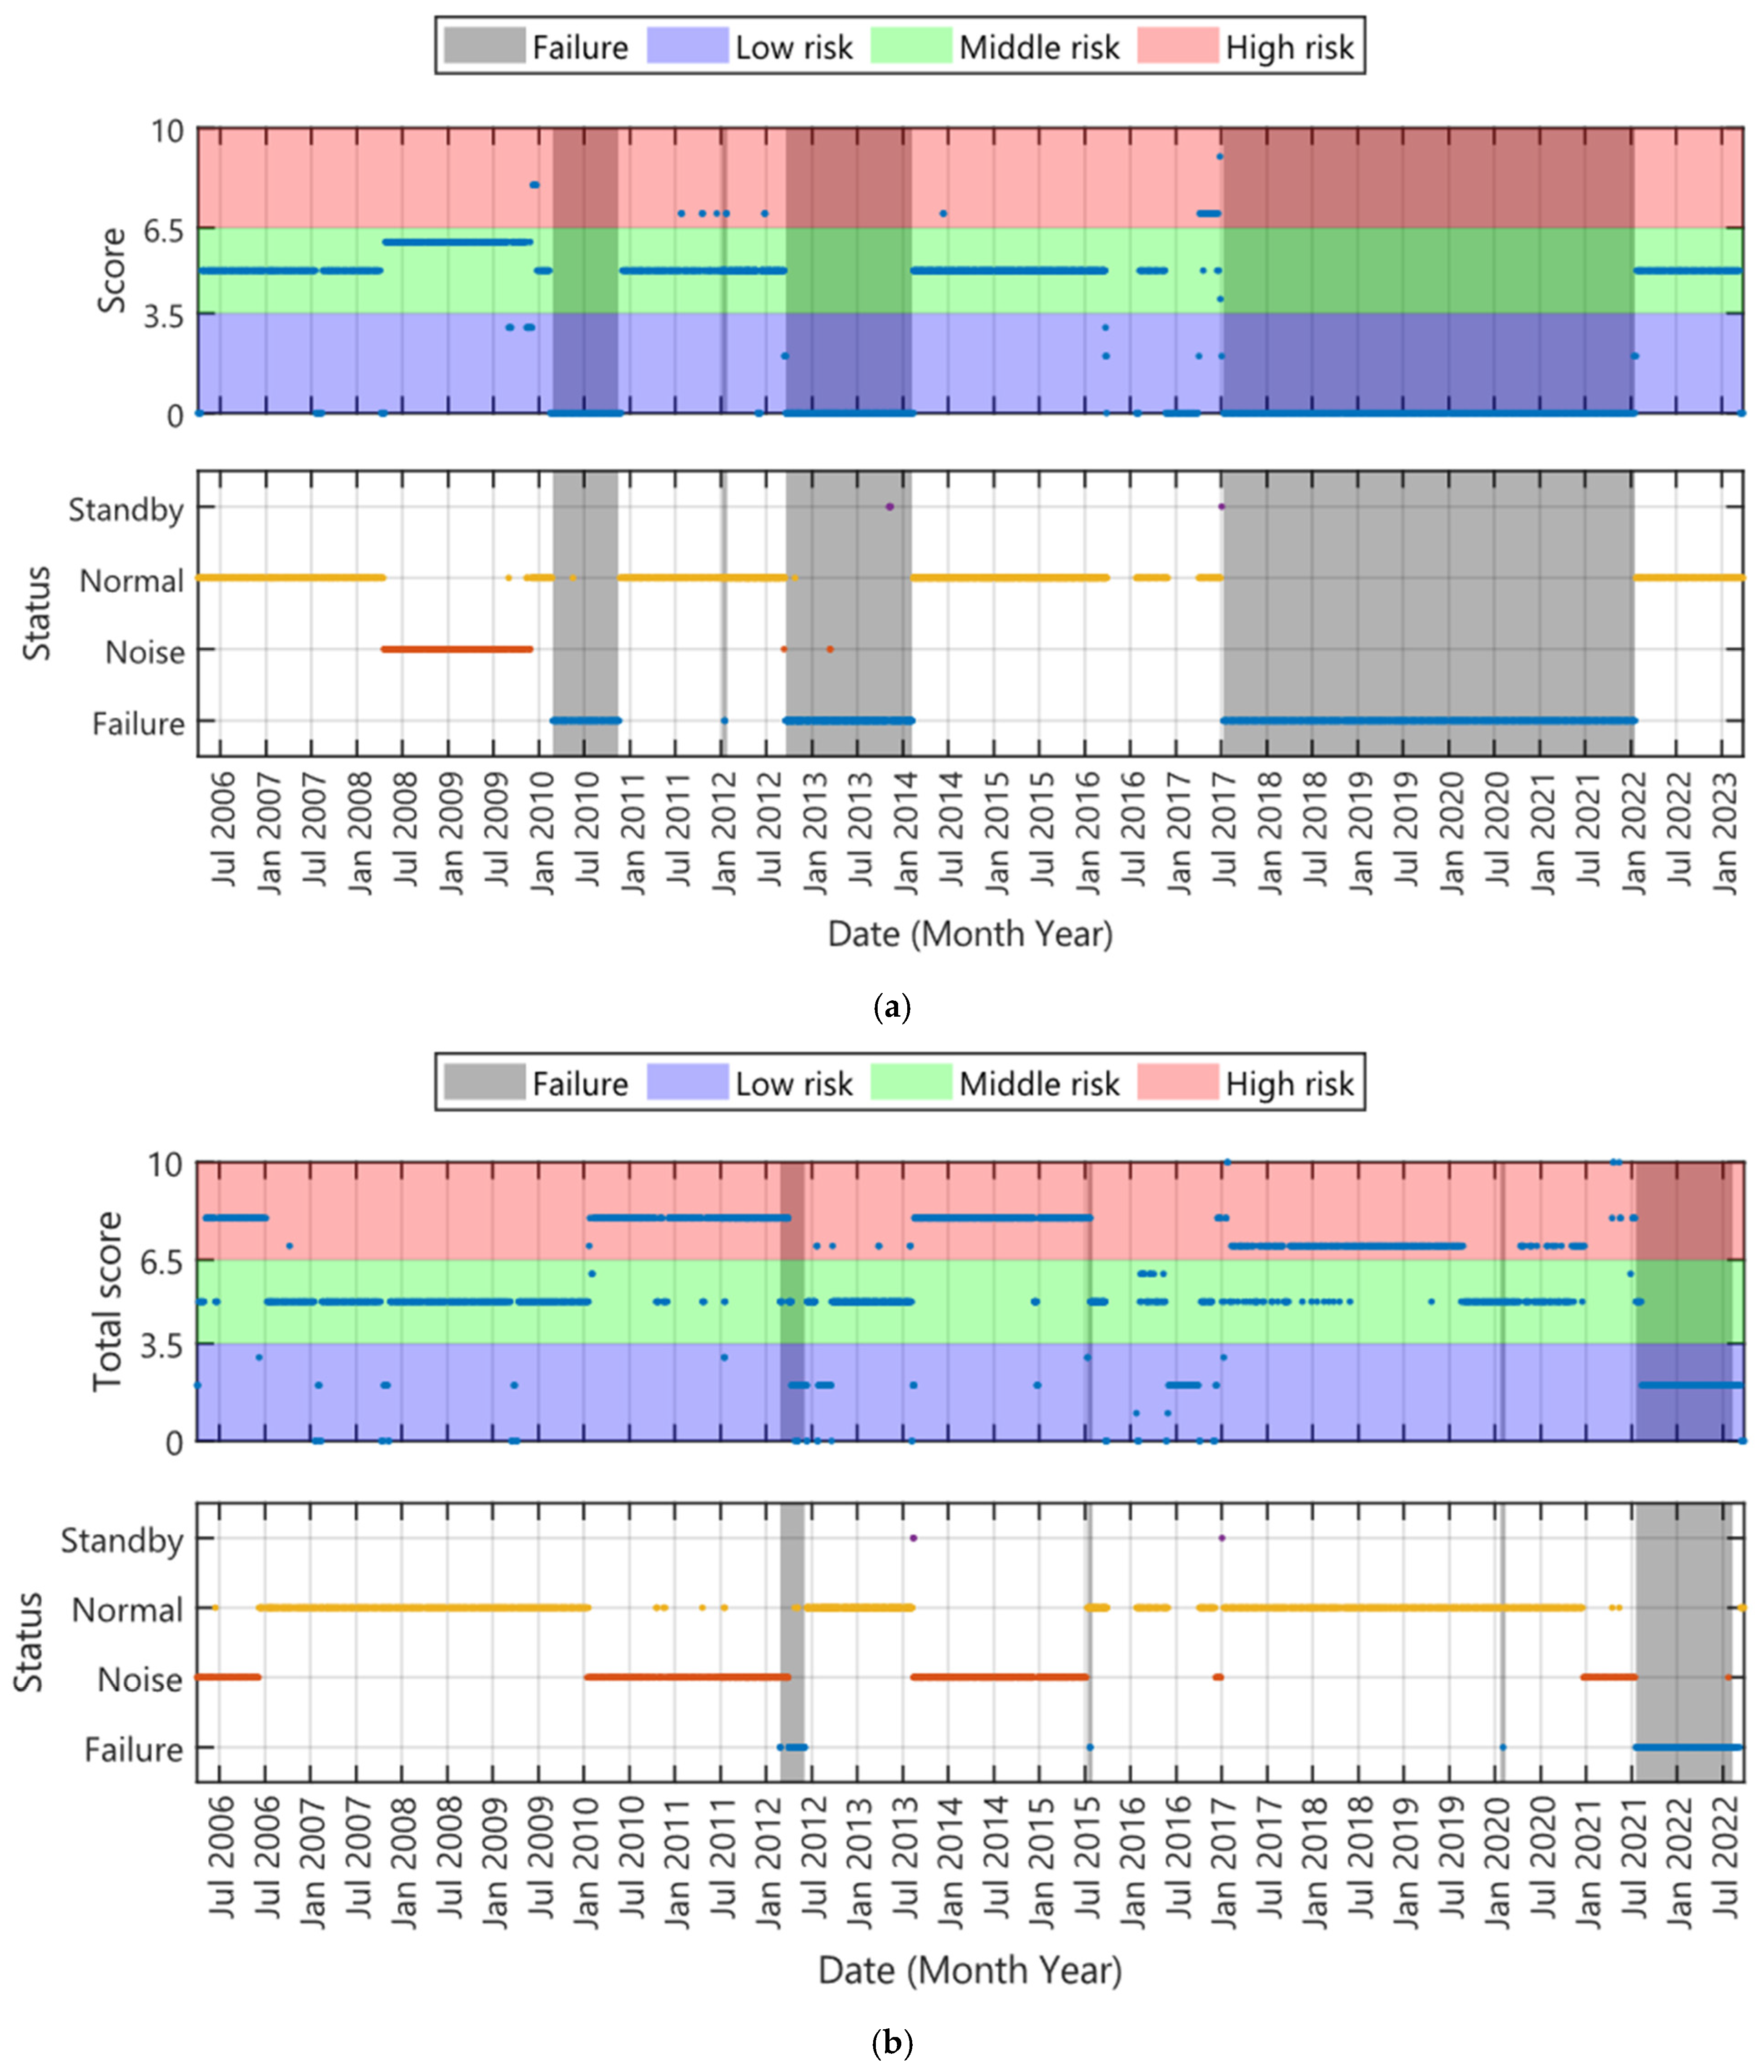
Figure 6 presents the validation results of the scoring model. The figure consists of two parts: the upper and lower graphs. The upper graph shows the calculated scores based on inspection log records using the criteria defined in Table 3. These scores are labeled as the AI-suggested score and are plotted on the vertical axis. The blue, green, and red shaded areas correspond to the risk levels defined in Table 4. Specifically, the blue area indicates a score of 0–3, representing a low risk of failure in the rotating disk device. The green area represents a medium risk with a score of 4–6, and the red area indicates a high risk with a score of 7 or more. The lower graph reproduces the state transition chart of the rotating disk device as shown in Figure 5. It is included to verify whether the calculated scores in the upper graph effectively capture the occurrence of failures.
As shown in Figure 6a, the AI-suggested scores for rotating disk device No. 1 were almost 5 points. The score of 6 points from 18 April 2008 to 26 November 2009 corresponded to periods when abnormal noise was present. In the first failure period (25 February 2010 to 12 November 2010), the second failure (16 January 2012), the third failure period (18 September 2012 to 6 February 2014), and the fourth failure period (10 July 2017 to 17 January 2022), the score was 7 or higher prior to the failures, classifying them as a high-risk level. Therefore, it was found that the scoring model defined in Table 3 and Table 4 was effective in predicting failures of rotating disk device No. 1.
In contrast, Figure 6b shows that the scores for rotating disk device No. 2 were distributed between 5 and 10 points. When the score reached 8 points, it closely aligned with periods during which abnormal noise was present. Therefore, in the cases of the first failure (27 August 2012–3 December 2012), the second failure (11 January 2016–31 January 2016), and the third failure (17 January 2022–9 February 2023), where prolonged abnormal noise eventually led to failure, this scoring model was considered effective in predicting equipment failure.
Failure events are summarized in Table 5. The scoring model using AI-suggested weight was able to predict failures of the rotating disk device in cases where prolonged abnormal noise preceded the failure or in cases where there was no abnormal noise but there was a sudden increase in current, by calculating scores based on the criteria defined in Table 3 and Table 4.

3.4. Applicability

Unlike numerical simulations, predictive maintenance requires preventive action based on observed data before failures occur. In future prediction, mistakes are unavoidable, which may lead to an underestimation of failure indicators. To address this issue, we developed a scoring model that uses raw data to identify consistently high-risk behaviors before failures occur.
To determine the indicator weights, we first constructed a prototype. We used ChatGPT for this. ChatGPT is a probabilistic AI model. Then, we evaluated whether elevated total scores could anticipate failures. Traditional approaches rely on expert-driven sensitivity analysis. Our method estimates weights from ChatGPT results. This enables rapid model development. Though this approach is potentially arbitrary, it allows for efficient adaptation to the target system.
Predictive maintenance models are inherently system-specific and not universally applicable. Nevertheless, non-generalizable models can provide practical insights to stakeholders, such as landfill operators. This study highlights the utility of AI-weighted scoring as a viable alternative to expert-based methods. The value lies in the replicable methodology, which does not require expert knowledge.
Reliable failure prediction is essential for long-lived infrastructure. Like roads and tunnels, landfills require over 50 years of maintenance, making predictive models essential. Based on this study, current fluctuations, particularly abrupt increases, emerged as key failure indicators. Although this insight is qualitative, it is transferable across sites and supports proactive maintenance strategies. Data accumulation was also found to be essential for improving prediction reliability.
Recent advances in Internet of Things (IoT) technology allow analog current meters to be replaced with sensors for finer resolution. Furthermore, introducing vibration and acoustic sensors makes it easier to detect anomalies, which enhances maintenance data collection and site management.

4. Conclusions

In this study, 17 years of inspection logs and electric current data from a rotating biological contactor (RBC) at a municipal waste landfill site were analyzed to identify early signs preceding equipment failure. It was found that, for the rotating disc devices, continuous abnormal noise and increases or fluctuations in current values were effective indicators of impending failure.
  • The scoring model constructed by artificial intelligence proved effective for predicting failures in cases where abnormal noise persisted over an extended period.
  • In contrast, for failure cases that occurred without abnormal noise, the application of a revised scoring model that accounted for sudden increases in current improved the accuracy of early fault detection.
  • The revised scoring model enabled the numerical evaluation of high-risk conditions by tracking cumulative changes in current before failures occurred. For the rotating disc devices targeted in this study, a method for quantitative predictive maintenance was successfully demonstrated using simple monitoring indicators such as abnormal noise and current.
The daily inspection records will depend on factors such as the sensitivity of electrical current meters and surrounding noise levels. Therefore, depending on the environmental conditions at the site, the scoring model developed in this study may have limited predictive accuracy. While this study uses the scoring model with inspection records and without leachate quality, a better model could be developed using leachate quality as explanatory variables from a research perspective.

Author Contributions

Conceptualization, H.I. and T.I.; methodology, H.I.; software, H.I.; validation, H.I. and T.I.; formal analysis, H.I.; investigation, H.I. and Y.I.; resources, H.I. and Y.I.; data curation, H.I.; writing—original draft preparation, H.I.; writing—review and editing, H.I., Y.I., T.I. and M.Y.; visualization, H.I.; supervision, T.I. and M.Y.; project administration, H.I.; funding acquisition, H.I. All authors have read and agreed to the published version of the manuscript.

Funding

This research was funded by Ministry of Environment and Environmental Restoration and Conservation Agency, grant number JPMEERF20213003.

Institutional Review Board Statement

Not applicable.

Informed Consent Statement

Not applicable.

Data Availability Statement

The data presented in this study are available on request from the corresponding author due to institute ownership rights.

Acknowledgments

We would like to express our gratitude to Agata of MathWorks Japan and Ogahara of Musashi-ABC for the visualization on the 17-year daily inspection reports.

Conflicts of Interest

The authors declare no conflicts of interest. The funders had no role in the design of the study; in the collection, analyses, or interpretation of data; in the writing of the manuscript; or in the decision to publish the results.

Abbreviations

The following abbreviations are used in this manuscript:
RBCrotating biological contactor

References

  1. Amorim, C.L.; Duque, A.F.; Afonso, C.M.M.; Castro, P.M.L. Bioaugmentation for treating transient 4-fluorocinnamic acid shock loads in a rotating biological contactor. Bioresour. Technol. 2013, 144, 554–562. [Google Scholar] [CrossRef] [PubMed]
  2. Brazil, B.L. Performance and operation of a rotating biological contactor in a tilapia recirculating aquaculture system. Aquac. Eng. 2006, 34, 261–274. [Google Scholar] [CrossRef]
  3. Brenner, R.C.; Heidam, J.A.; Opatken, E.J.; Petraske, A.C., Jr. Design Information on Rotating Biological Contactors; EPA-600/2-84-106; U. S. EPA: Washington, DC, USA, 1984. [Google Scholar]
  4. Mba, D. Mechanical evolution of the rotating biological contactor into the 21st century. Proc. Inst. Mech. Eng. Part E-J. Process Mech. Eng. 2003, 217, 189–219. [Google Scholar] [CrossRef]
  5. Nilling, J.J.; Deka, M.; Prasad, S.; Tungi, S.; Bharti, A. Performance evaluation of laboratory scale RBC to treat wastewater from hostels. Int. J. Innov. Res. Sci. Eng. Technol. 2007, 3, 168–175. [Google Scholar]
  6. Popa, M.; Ungureanu, N.; Vladut, V. Applications of rotating biological contactors in wastewater treatment. Cadastre Ser. 2019, 49, 136–145. [Google Scholar]
  7. Rana, S.; Gupta, N.; Rana, R.S. Removal of organic pollutant with the use of rotating biological contactor. Mater. Today Proc. 2018, 5, 4218–4224. [Google Scholar] [CrossRef]
  8. Tonde, M.R.; Mali, J.R.; Patil, S.B. Study of rotating biological contactors (RBCs) for wastewater treatment process. Int. J. Creat. Res. Thoughts 2017, 82, 621–623. [Google Scholar]
  9. EPA. Review of Current RBC Performance and Design Procedures; EPA/600/S2-85/033; U. S. EPA: Washington, DC, USA, 1985. [Google Scholar]
  10. Márqueza, P.; Gutiérreza, M.C.; Toledoa, M.; Alhamab, J.; Michánb, C.; Martína, M.A. Activated sludge process versus rotating biological contactors in WWTPs: Evaluating the influence of operation and sludge bacterial content on their odor impact. Process Saf. Environ. Prot. 2022, 160, 775–785. [Google Scholar] [CrossRef]
  11. Castillo, E.; Vergara, M.; Moreno, Y. Landfill leachate treatment using a rotating biological contactor and an upward-flow anaerobic sludge bed reactor. Waste Manag. 2007, 27, 720–726. [Google Scholar] [CrossRef]
  12. Imtinan, S.I.F.; Purwanto, P.; Yulianto, B. The biological treatment method for landfill leachate. Proc. E3S Web Conf. 2020, 202, 06006. [Google Scholar] [CrossRef]
  13. Kulikowska, D.; Józwiak, T.; Kuczajowska-Zadrozna, M.; Pokój, T.; Gusiatin, Z. Efficiency of nitrification and organics removal from municipal landfill leachate in the rotating biological contactor (RBC). Desalination Water Treat. 2011, 33, 125–131. [Google Scholar] [CrossRef]
  14. Varma, A.L.; Prasad, M.K. Treatment of synthetic leachate by rotating biological contactor: A review. Int. J. Res. Appl. Sci. Eng. Technol. 2019, 7, 993–997. [Google Scholar] [CrossRef]
  15. Coetzee, G.; Malandra, L.; Wolfaardt, G.M.; Viljoen-Bloom, M. Dynamics of a microbial biofilm in a rotating biological contactor for the treatment of winery effluent. Water SA 2024, 30, 407–412. [Google Scholar] [CrossRef]
  16. Ghawi, A.H.; Kris, J. Use of a rotating biological contactor for appropriate technology wastewater treatment. Slovak J. Civ. Eng. 2009, 3, 1–8. [Google Scholar]
  17. Hassard, F.; Biddle, J.; Cartmell, E.; Jefferson, B.; Tyrrel, S.; Stephenson, T. Rotating biological contactors for wastewater treatment—A review. Process Saf. Environ. Prot. 2015, 94, 285–306. [Google Scholar] [CrossRef]
  18. Saini, S.K. Modeling and experimentation for novel aerofoil embedded mesh disk-based partially submerged rotating reactor. Chem. Eng. J. Adv. 2022, 12, 100382. [Google Scholar] [CrossRef]
  19. Cheng, H.; Li, W.; Gong, Z.; Wen, C.; Zhang, C.; Lu, X. Treatment performance and characteristics of biofilm carriers in an aerobic waterwheel-driven rotating biological contactor. Water 2025, 17, 356. [Google Scholar] [CrossRef]
  20. Irfan, M.; Waqas, S.; Arshad, U.; Khan, J.A.; Legutko, S.; Kruszelnicka, I.; Kramarczyk, D.G.; Rahman, S.; Skrzypczak, A. Response surface methodology and ANN modelling of membrane rotating biological contactors for wastewater treatment. Materials 2022, 15, 1932. [Google Scholar] [CrossRef]
  21. Waqas, S.; Bilad, M.R.; Huda, N.; Harun, N.Y.; Nordin, N.; Shamsuddin, N.; Wibisono, Y.; Khan, A.L.; Roslan, J. Membrane filtration as post-treatment of rotating biological contactor for wastewater treatment. Sustainability 2021, 13, 7287. [Google Scholar] [CrossRef]
  22. Yan, Z.; Pei, Z. Light enables partial nitrification and algal-bacterial consortium in rotating biological contactors performance and microbial community. Sustainability 2024, 16, 5538. [Google Scholar] [CrossRef]
  23. Cheng, L.; Deng, G.; Zhang, C.; Yang, Y.; Abdelfattah, A.; Eltawab, R.; Jia, H. Enhanced low-energy chemical oxygen demand (COD) removal in aeration-free conditions through pulse-rotating bio-contactors enriched with glycogen-accumulating organisms. Water 2024, 16, 1417. [Google Scholar] [CrossRef]
  24. Ucar, A.; Karakose, M.; Kirimça, N. Artificial Intelligence for Predictive Maintenance Applications: Key Components, Trustworthiness, and Future Trends. Appl. Sci. 2024, 14, 898. [Google Scholar] [CrossRef]
  25. Waqas, S.; Harun, N.Y.; Sambudi, N.S.; Bilad, M.R.; Abioye, K.J.; Ali, A.; Abdulrahman, A. A Review of Rotating Biological Contactors for Wastewater Treatment. Water 2023, 15, 1913. [Google Scholar] [CrossRef]
Figure 1. Schematic overview of a rotating biological contactor (RBC) system. This figure illustrates the RBC configuration used in the leachate treatment facility, where microorganisms attached to rotating disks degrade organic matter in leachate under aerobic conditions.
Applsci 15 06950 g001
Figure 2. Flow chart of the leachate treatment system at the final disposal site. This schematic diagram outlines the main treatment processes, starting with the pumping of raw leachate, followed by screening, homogenization, biological treatment using a rotating biological contact (RBC) device, flocculation and sedimentation, filtration, adsorption, disinfection and final discharge. This system is designed to integrate mechanical and biological treatment to ensure the removal of organic matter and contaminants prior to discharge.
Applsci 15 06950 g002
Figure 3. Photographs of RBCs at the leachate treatment facility. The left image shows two rotating biological contactor units installed in parallel. The right image displays a close-up of the disk surface with calcium scale deposits, which can lead to mechanical imbalance and equipment failure.
Applsci 15 06950 g003
Figure 4. Long-term trends in climate and leachate quality at the landfill site. This figure shows the temporal variation in rainfall, atmospheric temperature, influent leachate temperature, pH, and transparency from 2006 to 2023, indicating the relative stability of influent conditions. In the fifth figure, the plots are colored depending on leachate clarity.
Applsci 15 06950 g004
Figure 5. Relationship between electrical current and RBC behavior. (a,b) Time series plots of electrical current for rotating disk devices No. 1 and No. 2, respectively. The blue area indicates normal operation (1.8–2.2 A), while the red area indicates sudden increases in current or expansion of current fluctuations, which often precede abnormal noise or malfunctions.
Applsci 15 06950 g005
Figure 6. Comparison of failure risk scores and actual operational status. Upper plots represent risk scores calculated from inspection log data. Blue, green, and red zones correspond to low, medium, and high risk, respectively. Lower plots are colored depending on operational status (normal, abnormal noise, failure) to evaluate prediction accuracy. (a) Rotating biological contactor No. 1; (b) rotating biological contactor No. 2.
Applsci 15 06950 g006
Table 1. Summary of operational and failure history for equipment at the leachate treatment facility. Includes frequency of normal operation, abnormal noise, and failure events over a 17-year period.
OperatingStandby
NormalNoiseNormalNoiseFailureTotal Events
Blower No. 110150968001983
Blower No. 210470935101983
Filtration pump No. 154901410713081978
Filtration pump No. 2142808265131975
Sludge scraper198300001983
Sludge dewatering machine198300001983
Caustic soda injection pump198300001983
Sulfuric acid injection pump198300001983
Phosphoric acid injection pump198300001983
Dewatering agent injection pump198100001981
Miscellaneous wastewater pump197500081983
Sludge feed pump198300001983
Groundwater pump198100001981
Adjustment tank pump No. 194601036001982
Adjustment tank pump No. 210970881001978
Leachate water pump No. 1197706001983
Leachate water pump No. 2197409001983
Backwash blower No. 1198102001983
Backwash blower No. 2198102001983
Blower No. 110150968001983
Blower No. 210470935101983
Rotating disk device No. 11086351547672015
Rotating disk device No. 2109142833431502015
Table 2. Summary of maintenance history for pH meters at the leachate treatment facility. Includes frequency of checking, cleaning, and calibration events over a 17-year period.
CheckingCleaningCalibrationTotal Events
pH meter for neutralization tank 19953371996
pH meter for flocculation mixing tank19933461994
Table 3. AI-assisted conversion of qualitative failure indicators into a quantitative scoring model for predictive maintenance. This table defines the indicators and point assignments used in the predictive failure scoring model. Based on expert-derived qualitative assessments of failure causes, ChatGPT was prompted to generate a numerical model incorporating signal-based inputs such as abnormal noise frequency, current variation, and power consumption trends. The total score is used to assess the risk of RBC failure.
IndicatorDescriptionWeight
(a) Abnormal noise frequency scoreNumber of abnormal noise occurrences in the past 30 days+3 points if 3 or more times
(b) Peak current scoreMaximum current exceeds 2.3 A+2 points
(c) Current fluctuation scoreStandard deviation exceeds 0.1 A+2 points
(d) Abnormally low currentMinimum current is less than or equal to 1.6 A+1 point
(e) Duration of abnormal periodNumber of consecutive days with abnormal noise+3 points if 1 week or more
(f) Sudden rise in currentNumber of consecutive days with rising power consumption+5 points if 2 week or more
Table 4. Risk classification criteria based on AI-suggested scoring of daily inspection results. This table presents the interpretation of total scores derived from the scoring model applied to daily inspection records. Based on the aggregated score, the risk of RBC failure is categorized into three levels—low, middle, and high—with corresponding recommendations for inspection and operational response.
Score RangeRisk LevelRecommended Action
0–3 pointsLowNo issues; normal operation
4–7 pointsMiddlePerform inspection as planned
7 points or moreHighPrompt inspection and consideration of backup unit startup
Table 5. Breakdown of high-risk scores and contributing factors for failure prediction in rotating biological contactors. This table summarizes cases where elevated scores were assigned based on the scoring model. Each score is decomposed into six contributing indicators: (a) frequency of abnormal noise, (b) peak current level, (c) current fluctuation range, (d) unusually low current, (e) duration of the abnormal period, and (f) presence of a sudden rise in current. The table also shows the corresponding monitoring period and the number of days from the high score to the actual failure event.
Factors Affecting High Score Time From the Last Alert
RBC No.DateScore(a)(b)(c)(d)(e)(f)Periods Giving High Score(High Score) to the Failure
125 February 20258 points3 57–21 December 200966 days after
16 January 20127 points 2 525 July 2011, 17 October 2011, 15 December 201132 days after
18 September 20127 points 2 525 June 201285 days after
10 July 20177 points 2 56 April–19 June 201721 days after
227 August 20128 points3 2 3 26 July 2010–23 August 20124 days after
21 January 20168 points3 23 17 February 2014–4 January 201617 days after
3 August 20207 points 2 510 August 2017–24 February 2020161 days after
17 January 20227 points 2 512 October 2020–24 June 2021207 days after
8 points32 3 18 October–11 November 202167 days after
10 points32 515 November 2021–13 January 20224 days after
Disclaimer/Publisher’s Note: The statements, opinions and data contained in all publications are solely those of the individual author(s) and contributor(s) and not of MDPI and/or the editor(s). MDPI and/or the editor(s) disclaim responsibility for any injury to people or property resulting from any ideas, methods, instructions or products referred to in the content.