


Navigational Risk Assessment in Offshore Wind Farms Using Spatial Ship Domain Models

Abstract
1. Introduction
- Evaluating how hazards ahead of the ship’s bow, astern of the ship’s aft and on the port and starboard sides, along with under-keel and over-head clearance requirements, influence the determination of safe navigation within Offshore Wind Farms (OWFs) areas by:
- a.
- Determining the navigational risk numeric indicators (RNLF, RNLA, RNWP, and RNWS) with respect to maintaining the required safe distance ahead of the ship’s bow, behind its stern, and on the ship’s port and starboard sides. This is carried out using the PIANC guidelines and the 2D ship domain model by Coldwell [20] and Rutkowski [23,24]. This includes consideration of the stopping maneuveres by reversing the engine from Full Ahead to Full Astern (FSAH-FAS), and from Half Ahead to Full Astern (HAH-FAS), as well as the turning circle maneuver at FSAH with a rudder angle of 35° starboard.
- b.
- Determining the numeric indicators of navigational risk (RND and RNH) related to maintaining the required under-keel and over-head clearance to ensure the safety of vessel traffic lanes for representative ship types navigating within OWF areas. This is based on the 3D ship domain model by Rutkowski [8,23,25].
- Identifying vessels that may pose specific risks to OWF operations, and determining vessel types that are considered safe and could be permitted to navigate or fish in or around OWF zones.
- Comparing the domain parameters for the selected vessels based on the PIANC guidelines, Coldwell’s 2D model, and Rutkowski’s 3D model, across the OX, OY, and OZ planes.
2. Materials and Methods
2.1. Defining the Method for Assessing the Navigational Risk Indicators RN
2.2. Types of Representative Ships
2.3. Hydrometeorological Data
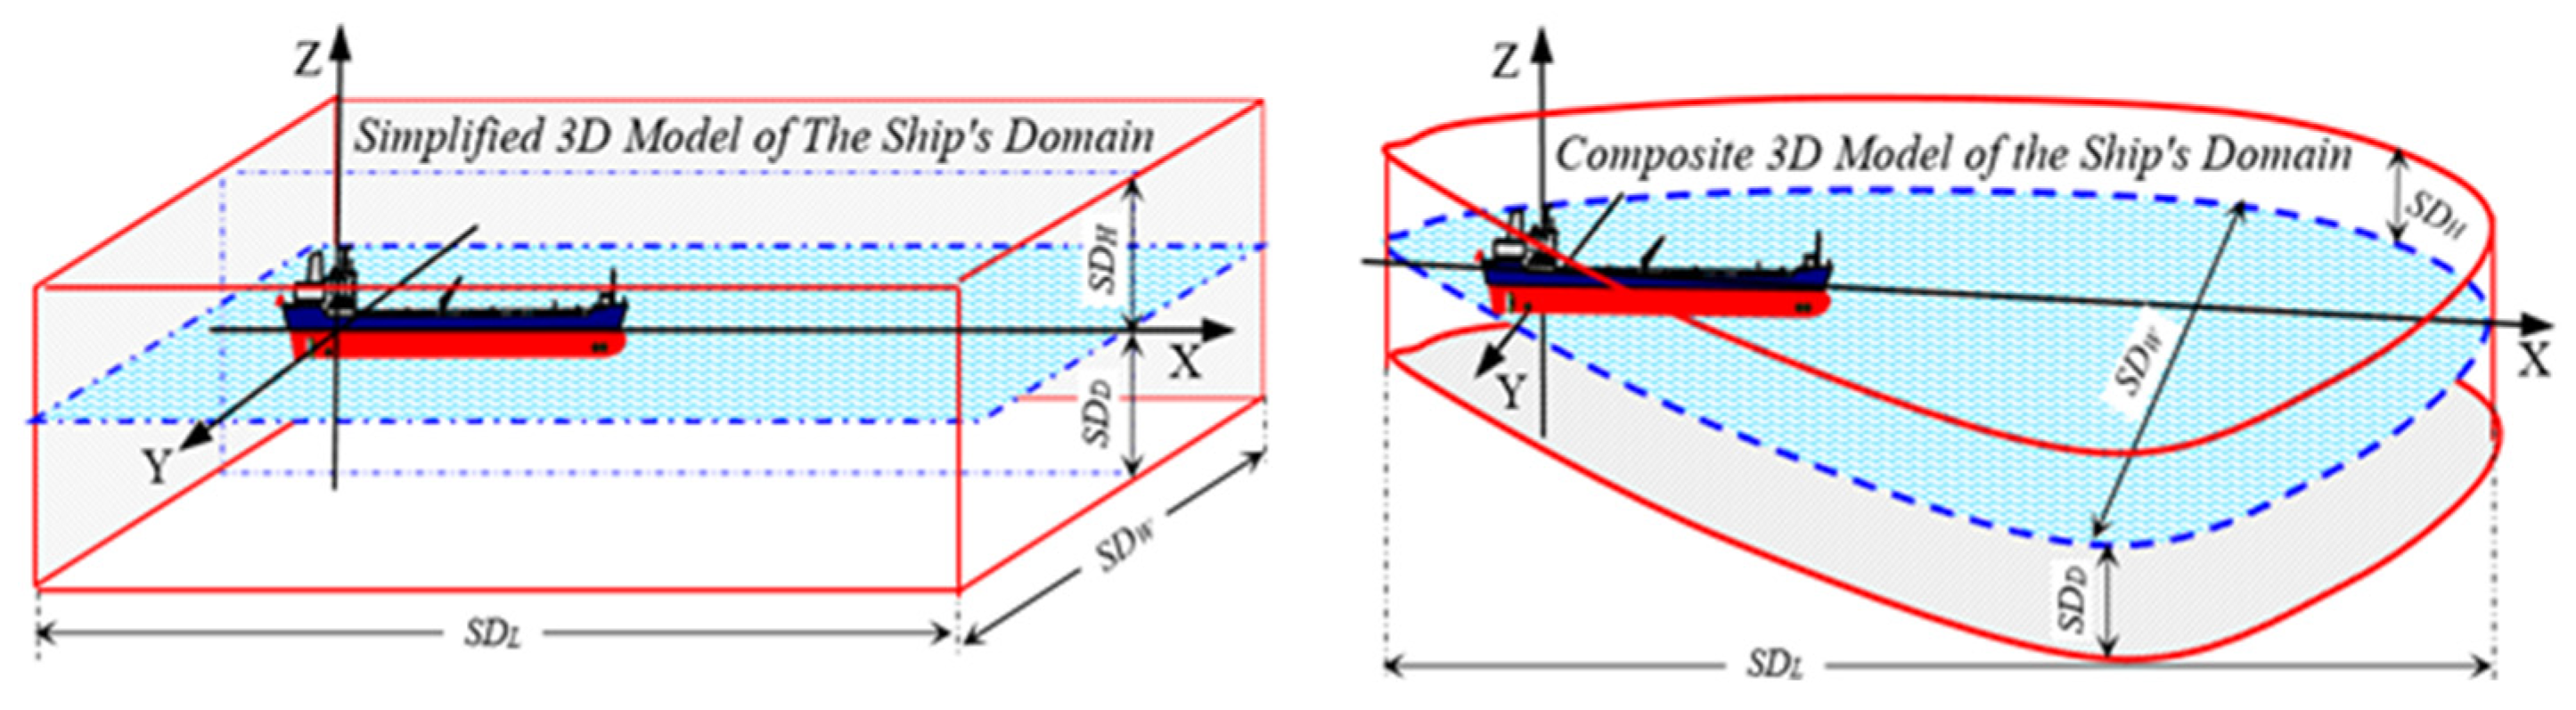
2.4. Spatial Models of the Ship Domain
2.5. Seabed Characteristics in the Study Area
3. Results
3.1. The Numeric Factors of RND and RNH Estimated for Three Ship Types
3.2. The Numeric Factors RNLF and RNLA Estimated for Three Ship Types
3.3. The Numeric Factors of RNWP and RNWS Estimated for Three Ship Types
4. Discussion
5. Conclusions
Author Contributions
Funding
Institutional Review Board Statement
Informed Consent Statement
Data Availability Statement
Acknowledgments
Conflicts of Interest
Appendix A
| RND= | numeric factor defining the vertical component of the navigational risk RN that concerns keeping an adequate required under-keel clearance; |
| RNH= | numeric factor defining the vertical component of the navigational risk RN that concerns keeping an adequate required over-head clearance (OHCR) or air draft clearance; |
| RNLF= | numeric factor defining the horizontal component of the navigational risk RN that concerns keeping an adequate required safe distance from the nearest danger ahead of the ship; |
| RNLA= | numeric factor defining the horizontal component of the navigational risk RN that concerns keeping an adequate required safe distance from the nearest danger astern of the ship; |
| RNWP= | numeric factor defining the horizontal component of the navigational risk RN that concerns keeping an adequate required safe distance from the nearest danger on the ship’s port side; |
| RNWS= | numeric factor defining the horizontal component of the navigational risk RN that concerns keeping an adequate required safe distance from the nearest danger on the ship’s starboard side; |
| SDD= | ship domain dept expressed in meters, [m]; |
| SDH= | ship domain height expressed in meters, [m]; |
| SDLF= | the length of the ship domain calculated horizontally in the forward direction ahead from the center of the ship’s layout; the starting point is in the vertical projection of the radar’s aerial (antenna) on the water plane, [m]; |
| SDLA= | the length of the ship domain calculated in meters horizontally astern in the direction aft from the center of the ship’s layout, [m]; |
| SDWP= | the width (beam) of the ship domain calculated in meters to the port side from the ship’s heading line (the center line of the ship = true course (TC) line, [m]; |
| SDWS= | the width (beam) of the ship domain calculated in meters to the starboard side from the ship’s heading line (the ship’s TC line), [m]; |
| h= | the actual water depth expressed in meters, [m]; |
| Tmax= | the maximum draft of the vessel expressed in meters, [m]; |
| Ho= | the distance between the water level and the height of the nearest objects hanging above the water (for the bridge, the vertical clearance is usually obtained above high-water level), [m]; |
| CVC= | the charted vertical clearance under the bridge or power cable referred to the high water (HW) or mean sea level (MSL), [m]; |
| ΔTide= | the tide correction for vertical distance between the charted datum used for the vertical clearance referred usually to HW (HAT, MHWS) or MSL and the current sea water level: ΔTide = Charted Vertical Clearance datum referred to Chart Datum—Height of Tide referred to Chart Datum, [m]; |
| HN= | the ship’s air draft, HN = Air Draft, the distance between the waterline to the highest point on the ship’s hull expressed in meters, [m]; |
| dNF= | the distance to the dangerous zone (e.g., target domain guard zone, obstructions, safety depth contour or other navigational hazard) measured in the direction ahead along the ship’s course line (heading line) expressed in meters, [m]; |
| dNA= | the distance to the dangerous zone (e.g., target domain guard zone, obstructions, safety depth contour or other navigational hazard) measured in the direction astern along the ship’s course line to the aft expressed in meters, [m]; |
| dNP= | the distance to the dangerous zone (e.g., target domain guard zone, obstructions, safety depth contour or other navigational hazard) measured in meters on directions perpendicular to the ship’s course line on the port side, [m]; |
| dNS= | the distance to the dangerous zone (e.g., target domain guard zone, obstructions, safety depth contour or other navigational hazard) measured in meters on directions perpendicular to the ship’s course line on the starboard side, [m]; |
| L= | the ship’s length overall (LOA) in meters obtained from the ship’s particulars, expressed in meters, [m]; |
| LRF= | the distance in meters between the vertical projection of radar aerial on the water plane and the ship’s bow obtained from the ship’s particulars, expressed in meters, [m]; |
| CVC= | the charted vertical clearance under the bridge or power cable referred to the high water (HW) or mean sea level (MSL), [m]; |
Appendix B
| SOG= | the ship’s speed over ground values in knots obtained from a Doppler log or the fixed ship’s positioning system such as GNSS/GPS, (SOG = Vd) where , the value expressed in knots, [kn]; |
| COG= | the ship’s course over ground () expressed in degrees of angle, [°]; |
| TC= | the ship’s true course expressed in degrees of angle, [°]; |
| ΔB= | a factor showing an increase in the width (beam) of the ship domain. The increase amounts to error MOY of the total ellipse errors δy(Bi) of all factors Bi that affect SDW, estimated with probability level P = 95% (C = 2.44). In this paper, we will assume ΔB = 10 m; |
| ΔL= | a factor showing an increase in the length of the ship domain. The increase amounts to error MOX of the total ellipse errors δx(Bi) of all factors Bi that affect SDL, estimated with probability level P = 95% (C = 2.44). In this paper, we will assume ΔL = 20 m; |
| BC= | the seeming width of the ship’s trace calculated horizontally in meters [m], with wind leeway angle α [ °], current deviation (drift angle) β [°], and the ship’s yawing Δ[°]: |
| ADmax= | the ship’s advance maximum values measured in meters as the maximum movement of the ship forward along the ship’s course line, observed after changing the course ΔTC ≥ 090° or after the ship’s stopping maneuver is completed, [m]; |
| TRmax= | the ship’s transfer maximum values measured in meters as the maximum movement of the ship to the port or starboard side (transverse horizontally to the ship’s initial course line), observed after changing the course ΔTC ≥ 180° or after the ship’s stopping maneuver is completed, [m]; |
| TRneg= | the ship’s “negative” transfer (maximum value) measured in meters, observed after on the side opposite to the general direction during the ship’s turning and/or stopping maneuver, known also in maritime terminology as “Kick” distance on turning circle diagrams. TRneg is specified for merchant ships as a value from 1.0 to 1.5 ship breadth B (for turning circulation) or about 1.5 ship length L (for a Crash Stop (Full Ahead-Full Astern) emergency maneuver), [m]; |
| tm= | the time needed to stop the ship or change its direction of movements by ΔTC ≥ 090° obtained in minutes from the Pilot Card, Wheel House Poster or Turning Circle Diagrams, [min]; |
| tr= | the time needed for the appropriate reaction, that is the right assessment of the navigational situation and giving maneuver order. In practice, tr ≈ 0.5 min up to 3.0 min depending on the competence of the seafarer and his professional experience, [min]; |
| Drift= | the total current speed values in knots (Drift = Vz) where , and total current = water flow = sea current + tide stream, [kn]; |
| Set= | the total current () direction in degrees, [°]; |
| p= | the factor (numeral coefficient) depending on the harmfulness of the cargo carried on board the ship. This factor (1 ≤ p ≤ 2) increases the safety margin of navigational reserve in the case of abnormal situations, which can result either in a catastrophe (disaster) or the contamination of the environment. In this paper, we recommend using the following values for factor p: For ships in the ballast condition without dangerous cargo or harmless charge, neutral for people and the environment: p = 1. For ships carrying a load of high harm for people and the environment, e.g., flammable substances, oil, natural gas: p = 1.5. For ships with a very harmful load for people and the environment, e.g., radioactive substances, corrosive chemicals, explosive substances: p = 2.0; |
| rL= | the numeral coefficient (factor) correcting length (rL) of the ship domain (0 ≤ rL ≤ 2), depending on the situation (privilege) according to COLREG (Collision Regulations at Sea Convention 1972). In this paper, we recommend using the following values for factor rL: For the ship aground or at anchor: rL = 0. For privileged ships such as vessels with restricted ability to maneuver (except vessels engaged with mine clearance and vessels engaged in fishing): rL = 1.5. For sailing ships, ships restricted by draft and/or ships that are not under command: rL = 2; |
| rW= | the numeral coefficient (factor) correcting width (rW) of the ship domain (0 ≤ rW ≤ 2), depending on the situation (privilege) according to COLREG regulations. In this paper, we recommend the following values for factor rW: For the ship aground or at anchor: rW = 0. For ships restricted by the draught: rW = 1. For privileged ships such as vessels with restricted ability to maneuver (except vessels engaged with mine clearance and vessels engaged in fishing): rW = 1.5. For sailing ships and ships that are not under command: rW = 2; |
| sL= | the numeral coefficient (factor) correcting the ship’s advance (AD) parameter on the turning circle in the case of the appearance of unexpected meteorological conditions than previously observed during sea trials and recorded on Pilot Card and Wheel House Posters (with the currents excluded); |
| sW= | the numeral coefficient (factor) correcting the ship’s transfer (TR) parameter on the turning circle in the case of the appearance of unexpected meteorological conditions than previously observed during sea trials and recorded on Pilot Card and Wheel House Posters (with the currents excluded). |
Appendix C

| The Ships Domain SD Parameters as a Function of Ship Type and Water Depth h1 and h2 | VLCC (Very Large Crude Carrier) | Fishing Boat (Fisher) | Z-Drive Prevention Response Tug | |||||||||||||||
|---|---|---|---|---|---|---|---|---|---|---|---|---|---|---|---|---|---|---|
| SDD [m] | SDH [m] | SDLF [m] | SDLA [m] | SDWP [m] | SDWS [m] | SDD [m] | SDH [m] | SDLF [m] | SDLA [m] | SDWP [m] | SDWS [m] | SDD [m] | SDH [m] | SDLF [m] | SDLA [m] | SDWP [m] | SDWS [m] | |
| N/A | N/A | N/A | 9260 m | N/A | 2068 m | 2624 m | N/A | N/A | 1852 m | N/A | 894 m | 1450 m | N/A | N/A | 500 m | N/A | 770 m | 1326 m |
| 2D ship domain according to T.G. Coldwell guidelines: SDLF = 6.1 L; SDLA = 3.9 L; SDWP = 1.75 L; SDWS = 3.25 L | ||||||||||||||||||
| N/A | N/A | N/A | 1594 m | 1019 m | 457 m | 849 m | N/A | N/A | 400 m | 256 m | 115 m | 213 m | N/A | N/A | 275 m | 176 m | 79 m | 146 m |
| 3D ship domain according to G. Rutkowski for circulation with FSAH at a rudder deflection of 35° to the starboard in average sea conditions | ||||||||||||||||||
| h1 = 2∙T ± 0.3 m | 19.9 m | 65.0 m | 1543 m | 319 m | 153 m | 970 m | 8.2 m | 29.5 m | 507 m | 98 m | 47 m | 272 m | 7.1 m | 18.9 m | 375 m | 68 m | 51 m | 110 m |
| h2 = 1.4∙T± 0.3 m | 20.2 m | 64.8 m | 8.3 m | 29.5 m | 7.2 m | 18.8 m | ||||||||||||
| 3D ship domain according to G. Rutkowski for the FSAH-FAS maneuver (data from the Wheel House Poster) in average sea conditions | ||||||||||||||||||
| h1 = 2∙T ± 0.3 m | 19.9 m | 65.0 m | 4321 m | 243 m | 472 m | 603 m | 8.2 m | 29.5 m | 961 m | 98 m | 130 m | 162 m | 7.1 m | 18.9 m | 363 m | 68 m | 57 m | 77 m |
| h2 = 1.4∙T ± 0.3 m | 20.2 m | 64.8 m | 8.3 m | 29.5 m | 7.2 m | 18.8 m | ||||||||||||
| 3D ship domain according to G. Rutkowski for the HAH-FAS maneuver (data from the Wheel House Poster) in average sea conditions | ||||||||||||||||||
| h1 = 2∙T ± 0.3 m | 19.7 m | 65.1 m | 2024 m | 243 m | 392 m | 523 m | 8.1 m | 29.6 m | 570 m | 98 m | 98 m | 131 m | 6.7 m | 19.1 m | 214 m | 68 m | 57 m | 77 m |
| h2 = 1.4∙T ± 0.3 m | 19.9 m | 65.0 m | 8.1 m | 29.6 m | 6.8 m | 19.1 m | ||||||||||||
| 3D ship domain according to G. Rutkowski for circulation with FSAH at a rudder deflection of 35° to the starboard in deteriorated sea conditions | ||||||||||||||||||
| h1 = 2∙T ± 0.6 m | 22.2 m | 65.0 m | 1515 m | 353 m | 221 m | 1038 m | 9.8 m | 29.5 m | 479 m | 98 m | 110 m | 335 m | 8.7 m | 18.9 m | 366 m | 68 m | 76 m | 135 m |
| h2 = 1.4∙T ± 0.6 m | 22.5 m | 64.8 m | 9.9 m | 29.5 m | 8.8 m | 18.8 m | ||||||||||||
| 3D ship domain according to G. Rutkowski for the FSAH-FAS maneuver (data from the Wheel House Poster) in deteriorated sea conditions | ||||||||||||||||||
| h1 = 2∙T ± 0.6 m | 22.2 m | 65.0 m | 4293 m | 243 m | 541 m | 672 m | 9.8 m | 29.5 m | 933 m | 98 m | 193 m | 225 m | 8.7 m | 18.9 m | 354 m | 68 m | 58 m | 78 m |
| h2 = 1.4∙T ± 0.6 m | 22.5 m | 64.8 m | 9.9 m | 29.5 m | 8.8 m | 18.8 m | ||||||||||||
| Ship (Tmax) | SDD for Speed FSAH or HAH | |||||||||
|---|---|---|---|---|---|---|---|---|---|---|
| FEW-Area | CI Corridor | Territorial Waters | ||||||||
| hmin | hav | hmax | hmin | hav | hmax | hmin | hav | hmax | ||
| 36.5 m | 43.02 m | 54.5 m | 14.5 m | 27.26 m | 39.0 m | 7.00 m | 24.35 m | 33.5 m | ||
| VLCC 15.00 [m] | FSAH | 0 | 0 | 0 | 1 | 0 | 0 | 1 | 0 | 0 |
| HAH | 0 | 0 | 0 | 1 | 0 | 0 | 1 | 0 | 0 | |
| FSAH * | 0 | 0 | 0 | 1 | 0 | 0 | 1 | 0 | 0 | |
| Fisher 5.40 [m] | FSAH | 0 | 0 | 0 | 0 | 0 | 0 | 0.45 | 0 | 0 |
| HAH | 0 | 0 | 0 | 0 | 0 | 0 | 0.41 | 0 | 0 | |
| FSAH * | 0 | 0 | 0 | 0 | 0 | 0 | 0.64 | 0 | 0 | |
| Z-Tug 4.9 [m] | FSAH | 0 | 0 | 0 | 0 | 0 | 0 | 0.09 | 0 | 0 |
| HAH | 0 | 0 | 0 | 0 | 0 | 0 | 0 | 0 | 0 | |
| FSAH * | 0 | 0 | 0 | 0 | 0 | 0 | 0.50 | 0 | 0 | |
| Ship (HN) | SDH for speed FSAH or HAH | |||||||||
| H0 | H0 | H0 | ||||||||
| 22 m | 26 m | ∞ | ∞ | ∞ | ∞ | ∞ | ∞ | ∞ | ||
| VLCC 62.3 [m] | FSAH | 1 | 1 | 0 | 0 | 0 | 0 | 0 | 0 | 0 |
| HAH | 1 | 1 | 0 | 0 | 0 | 0 | 0 | 0 | 0 | |
| FSAH * | 1 | 1 | 0 | 0 | 0 | 0 | 0 | 0 | 0 | |
| Fisher 27.0 [m] | FSAH | 1 | 1 | 0 | 0 | 0 | 0 | 0 | 0 | 0 |
| HAH | 1 | 1 | 0 | 0 | 0 | 0 | 0 | 0 | 0 | |
| FSAH * | 1 | 1 | 0 | 0 | 0 | 0 | 0 | 0 | 0 | |
| Z-Tug 16.1 [m] | FSAH | 0 | 0 | 0 | 0 | 0 | 0 | 0 | 0 | 0 |
| HAH | 0 | 0 | 0 | 0 | 0 | 0 | 0 | 0 | 0 | |
| FSAH * | 0 | 0 | 0 | 0 | 0 | 0 | 0 | 0 | 0 | |
| Ship Type and Length L [m] | Domain parameters | |||||||||||||||||||||||||||||||||||
|---|---|---|---|---|---|---|---|---|---|---|---|---|---|---|---|---|---|---|---|---|---|---|---|---|---|---|---|---|---|---|---|---|---|---|---|---|
| PIANC Guidelines | 2D Domain Model by Coldwell | Domain Model by G. Rutkowski for Turning Circle Maneuver at FSAH with the Rudder 35° Starboard | Domain Model by G. Rutkowski for FSAH-FAS Maneuver | Domain Model by G. Rutkowski for HAH-FAS Maneuver | ||||||||||||||||||||||||||||||||
| dN1 | dN2 | dN3 | dN4 | dN5 | dN6 | dN7 | dN1 | dN2 | dN3 | dN4 | dN5 | dN6 | dN7 | dN1 | dN2 | dN3 | dN4 | dN5 | dN6 | dN7 | dN1 | dN2 | dN3 | dN4 | dN5 | dN6 | dN7 | dN1 | dN2 | dN3 | dN4 | dN5 | dN6 | dN7 | ||
| 150 m | 250 m | 300 m | 350 m | 400 m | 500 m | 1000 m | 150 m | 250 m | 300 m | 350 m | 400 m | 500 m | 1000 m | 150 m | 250 m | 300 m | 350 m | 400 m | 500 m | 1000 M | 150 m | 250 m | 300 m | 350 m | 400 m | 500 m | 1000 m | 150 m | 250 m | 300 m | 350 m | 400 m | 500 m | 1000 m | ||
| VLCC 261.3 | SDLF | 1.00 | 1.00 | 0.99 | 0.98 | 0.98 | 0.97 | 0.91 | 1.00 | 0.97 | 0.93 | 0.90 | 0.86 | 0.79 | 0.43 | 1.00 | 0.97 | 0.93 | 0.89 | 0.86 | 0.78 | 0.41 | 1.00 | 0.99 | 0.98 | 0.97 | 0.95 | 0.93 | 0.81 | 1.00 | 0.98 | 0.95 | 0.92 | 0.90 | 0.84 | 0.56 |
| SDLA | N/A | 0.90 | 0.80 | 0.74 | 0.69 | 0.64 | 0.54 | 0.02 | 0.63 | 0.26 | 0.07 | 0.00 | 0.00 | 0.00 | 0.00 | 0.49 | 0.00 | 0.00 | 0.00 | 0.00 | 0.00 | 0.00 | 0.49 | 0.00 | 0.00 | 0.00 | 0.00 | 0.00 | 0.00 | |||||||
| Fisher 65.6 | SDLF | 0.94 | 0.88 | 0.86 | 0.83 | 0.80 | 0.75 | 0.47 | 0.70 | 0.42 | 0.28 | 0.14 | 0.00 | 0.00 | 0.00 | 0.76 | 0.55 | 0.44 | 0.34 | 0.23 | 0.01 | 0.00 | 0.88 | 0.77 | 0.72 | 0.66 | 0.61 | 0.50 | 0.00 | 0.79 | 0.60 | 0.51 | 0.42 | 0.32 | 0.13 | 0.00 |
| SDLA | N/A | 0.46 | 0.03 | 0.00 | 0.00 | 0.00 | 0.00 | 0.00 | 0.00 | 0.00 | 0.00 | 0.00 | 0.00 | 0.00 | 0.00 | 0.00 | 0.00 | 0.00 | 0.00 | 0.00 | 0.00 | 0.00 | 0.00 | 0.00 | 0.00 | 0.00 | 0.00 | 0.00 | 0.00 | |||||||
| Z-Tug 45 | SDLF | 0.72 | 0.51 | 0.41 | 0.31 | 0.21 | 0.00 | 0.00 | 0.48 | 0.10 | 0.00 | 0.00 | 0.00 | 0.00 | 0.00 | 0.62 | 0.35 | 0.21 | 0.07 | 0.00 | 0.00 | 0.00 | 0.61 | 0.32 | 0.18 | 0.04 | 0.00 | 0.00 | 0.00 | 0.32 | 0.00 | 0.00 | 0.00 | 0.00 | 0.00 | 0.00 |
| SDLA | N/A | 0.18 | 0.00 | 0.00 | 0.00 | 0.00 | 0.00 | 0.00 | 0.00 | 0.00 | 0.00 | 0.00 | 0.00 | 0.00 | 0.00 | 0.00 | 0.00 | 0.00 | 0.00 | 0.00 | 0.00 | 0.00 | 0.00 | 0.00 | 0.00 | 0.00 | 0.00 | 0.00 | 0.00 | |||||||
| Ship type and width B [m] | Domain parameters | |||||||||||||||||||||||||||||||||||
| dN1 | dN2 | dN3 | dN4 | dN5 | dN6 | dN7 | dN1 | dN2 | dN3 | dN4 | dN5 | dN6 | dN7 | dN1 | dN2 | dN3 | dN4 | dN5 | dN6 | dN7 | dN1 | dN2 | dN3 | dN4 | dN5 | dN6 | dN7 | dN1 | dN2 | dN3 | dN4 | dN5 | dN6 | dN7 | ||
| 150m | 250m | 300m | 350m | 400m | 500m | 1000m | 150m | 250m | 300m | 350m | 400m | 500m | 1000m | 150m | 250m | 300m | 350m | 400m | 500m | 1000M | 150m | 250m | 300m | 350m | 400m | 500m | 1000m | 150m | 250m | 300m | 350m | 400m | 500 m | 1000m | ||
| VLCC 48.3 | SDWP | 0.94 | 0.89 | 0.87 | 0.84 | 0.82 | 0.77 | 0.52 | 0.71 | 0.48 | 0.36 | 0.25 | 0.13 | 0.00 | 0.00 | 0.02 | 0.00 | 0.00 | 0.00 | 0.00 | 0.00 | 0.00 | 0.72 | 0.50 | 0.38 | 0.27 | 0.16 | 0.00 | 0.00 | 0.66 | 0.39 | 0.25 | 0.11 | 0.00 | 0.00 | 0.00 |
| SDWS | 0.95 | 0.91 | 0.89 | 0.87 | 0.86 | 0.82 | 0.62 | 0.85 | 0.73 | 0.67 | 0.60 | 0.54 | 0.42 | 0.00 | 0.87 | 0.76 | 0.71 | 0.66 | 0.60 | 0.50 | 0.00 | 0.78 | 0.61 | 0.52 | 0.44 | 0.36 | 0.18 | 0.00 | 0.75 | 0.55 | 0.45 | 0.35 | 0.25 | 0.05 | 0.00 | |
| Fisher 10.3 | SDWP | 0.84 | 0.72 | 0.67 | 0.61 | 0.56 | 0.44 | 0.00 | 0.00 | 0.00 | 0.00 | 0.00 | 0.00 | 0.00 | 0.00 | 0.00 | 0.00 | 0.00 | 0.00 | 0.00 | 0.00 | 0.00 | 0.00 | 0.00 | 0.00 | 0.00 | 0.00 | 0.00 | 0.00 | 0.00 | 0.00 | 0.00 | 0.00 | 0.00 | 0.00 | 0.00 |
| SDWS | 0.90 | 0.83 | 0.80 | 0.76 | 0.73 | 0.66 | 0.31 | 0.30 | 0.00 | 0.00 | 0.00 | 0.00 | 0.00 | 0.00 | 0.46 | 0.08 | 0.00 | 0.00 | 0.00 | 0.00 | 0.00 | 0.08 | 0.00 | 0.00 | 0.00 | 0.00 | 0.00 | 0.00 | 0.00 | 0.00 | 0.00 | 0.00 | 0.00 | 0.00 | 0.00 | |
| Z-Tug 12.5 | SDWP | 0.81 | 0.68 | 0.62 | 0.55 | 0.48 | 0.35 | 0.00 | 0.00 | 0.00 | 0.00 | 0.00 | 0.00 | 0.00 | 0.00 | 0.00 | 0.00 | 0.00 | 0.00 | 0.00 | 0.00 | 0.00 | 0.00 | 0.00 | 0.00 | 0.00 | 0.00 | 0.00 | 0.00 | 0.00 | 0.00 | 0.00 | 0.00 | 0.00 | 0.00 | 0.00 |
| SDWS | 0.89 | 0.82 | 0.78 | 0.74 | 0.70 | 0.63 | 0.25 | 0.00 | 0.00 | 0.00 | 0.00 | 0.00 | 0.00 | 0.00 | 0.00 | 0.00 | 0.00 | 0.00 | 0.00 | 0.00 | 0.00 | 0.00 | 0.00 | 0.00 | 0.00 | 0.00 | 0.00 | 0.00 | 0.00 | 0.00 | 0.00 | 0.00 | 0.00 | 0.00 | 0.00 | |
References
- Council of Ministers. Regulation on the Adoption of the Spatial Development Plan for Internal Marine Waters, Territorial Sea and Exclusive Economic Zone of Poland, Scale 1:200,000. Journal of Laws of the Republic of Poland, Item 935. 2021. Available online: https://isap.sejm.gov.pl/isap.nsf/DocDetails.xsp?id=WDU20210000935 (accessed on 9 June 2025).
- Tafon, R.; Saunders, F.; Zaucha, J.; Matczak, M.; Stalmokaitė, I.; Gilek, M.; Turski, J. Blue justice through and beyond equity and participation: A critical reading of capability-based recognitional justice in Poland’s marine spatial planning. J. Environ. Plann. Manag. 2023, 67, 2206–2228. [Google Scholar] [CrossRef]
- Zaucha, J. Methodology of maritime spatial planning in Poland. J. Environ. Prot. Ecol. 2018, 19, 713–720. [Google Scholar]
- Gilek, M.; Armoskaite, A.; Gee, K.; Saunders, F.; Tafon, R.; Zaucha, J. In search of social sustainability in marine spatial planning: A review of scientific literature published 2005–2020. Ocean Coast. Manag. 2021, 208, 105618. [Google Scholar] [CrossRef]
- Przedrzymirska, J.; Zaucha, J.; Calado, H.; Lukic, I.; Bocci, M.; Ramieri, E.; Varona, M.C.; Barbanti, A.; Depellegrin, D.; de Sousa Vergílio, M.; et al. Multi-Use of the Sea as a Sustainable Development Instrument in Five EU Sea Basins. Sustainability 2021, 13, 8159. [Google Scholar] [CrossRef]
- Wróbel, K.; Gil, M.; Huang, Y.; Wawruch, R. The Vagueness of COLREG versus Collision Avoidance Techniques—A Discussion on the Current State and Future Challenges Concerning the Operation of Autonomous Ships. Sustainability 2022, 14, 16516. [Google Scholar] [CrossRef]
- Kulkarni, K.; Goerlandt, F.; Li, J.; Banda, O.V.; Kujala, P. Preventing shipping accidents: Past, present, and future of waterway risk management with Baltic Sea focus. Saf. Sci. 2020, 129, 104798. [Google Scholar] [CrossRef]
- Rutkowski, G.; Kubacka, M. Analysis of navigational risk indicators as a function of the ship’s domain width for the selected offshore wind farm in the Baltic Sea. Sci. Rep. 2023, 13, 9269. [Google Scholar] [CrossRef]
- Serwis Rzeczypospolitej Polskiej. Available online: https://www.gov.pl (accessed on 25 May 2025).
- Baltic Power Sp. z o.o. Baltic Power Offshore Wind Farm—Environmental Impact Assessment Report. 2023. Available online: https://www.balticpower.pl (accessed on 9 June 2025).
- Polish Wind Energy Association (PSEW). Offshore Wind Energy Development in Poland—Economic Potential Report. 2021. Available online: https://psew.pl/wp-content/uploads/2021/06/PSEW_Report_Offshore_2021.pdf (accessed on 9 June 2025).
- Ministry of Infrastructure, Poland. National Offshore Wind Energy Development Program Until 2040 (NOP-OZE). 2022. Available online: https://www.gov.pl/web/infrastruktura (accessed on 9 June 2025).
- Urząd Morski w Gdyni. Available online: https://www.umgdy.gov.pl/en/ (accessed on 3 November 2023).
- Polish Maritime Administration: Navigation Expertise for OWF Dated 2023-02-14 (Doc. No.: PMO-MAAC-PMP-CO-01).
- Wielgosz, M.; Pietrzykowski, Z. The ship domain in navigational safety assessment. PLoS ONE 2022, 17, e0265681. Available online: https://journals.plos.org/plosone/article?id=10.1371/journal.pone.0265681 (accessed on 9 June 2025). [CrossRef]
- Li, W.; Zhong, L.; Xu, Y.; Shi, G. Collision Risk Index Calculation Based on an Improved Ship Domain Model. J. Mar. Sci. Eng. 2022, 10, 2016. [Google Scholar] [CrossRef]
- Gao, H.; Xie, C.; Liu, K.; Chen, S.; Zhou, L.; Liu, Z.; Wang, R. Modeling of Safe Distance Between Ship Routes and Offshore Wind Farm Based on Tolerable Collision Probability. IEEE Access 2022, 10, 71777–71790. [Google Scholar] [CrossRef]
- Lv, P.; Zhen, R.; Shao, Z. A Novel Method for Navigational Risk Assessment in Wind Farm Waters Based on the Fuzzy Inference System. Math. Probl. Eng. 2021, 2021, 4588333. [Google Scholar] [CrossRef]
- International Maritime Organization (IMO). International Convention for the Safety of Life at Sea, 1974, SOLAS; International Maritime Organization (IMO): London, UK, 1974; Consolidated text Retrieved 5 June 2022; 2015. [Google Scholar]
- Coldwell, T.G. Marine Traffic Behaviour in Restricted Waters. J. Navig. 1983, 36, 430–444. [Google Scholar] [CrossRef]
- Wang, N.; Meng, X.; Xu, Q.; Wang, Z. A Unified Analytical Framework for Ship Domains. J. Navig. 2009, 62, 643–655. [Google Scholar] [CrossRef]
- Zhou, J.; Wang, C.; Zhang, A. A COLREGs-Based Dynamic Navigation Safety Domain for Unmanned Surface Vehicles: A Case Study of Dolphin-I. J. Mar. Sci. Eng. 2020, 8, 264. [Google Scholar] [CrossRef]
- Rutkowski, G. Modelling the Ship’s Domain in the Process of Manoeuvring in Restricted Sea Areas. Doctoral Dissertation, Warsaw University of Technology, Faculty of Transport, Warszawa, Poland, 2000. (In Polish). [Google Scholar]
- Rutkowski, G. Risk analysis when navigating in restricted sea areas. Ann. Navig. 2006, 11, 103–122. [Google Scholar]
- Rutkowski, G. Analysis of a practical method for estimating the ship’s best possible speed when passing under bridges or other suspended obstacles. Ocean Eng. 2021, 225, 108790. [Google Scholar] [CrossRef]
- United Kingdom Hydrographic Office (UKHO). Admiralty Sailing Directions: Baltic Pilot Vol. 2 (Np19), 18th ed.; United Kingdom Hydrographic Office: Taunton, UK, 2022. [Google Scholar]
- Nowakowski, Z.; Magierek, R.; Deorocki, M. (Eds.) Locja Bałtyku. Wybrzeże Polskie, 10th ed.; Biuro Hydrografczne Marynarki Wojennej: Gdynia, Poland, 2016. (In Polish) [Google Scholar]
- PIANC—The World Association for Waterborne Transport Infrastructure. Interaction Between Offshore Wind Farms and Maritime Navigation, MarCom Working Group WG 161; The World Association for Waterborne Transport Infrastructure: Brussels, Belgium, 2018. [Google Scholar]
- Resolution MSC.137(76); International Maritime Organization (IMO). (Adopted on 4 December 2002). Standards for Ship Manoeuvrability. International Maritime Organization: London, UK, 2002.
- International Maritime Organization (IMO). MSC/Circ.1053. Explanatory Notes to the Standards for Ship Manoeuvrability. 2002. Available online: https://www.register-iri.com/wp-content/uploads/MSC.1-Circ.1053.pdf (accessed on 5 June 2022).
- Rutkowski, G. Determining Ship’s Safe Speed and Best Possible Speed for Sea Voyage Legs. TransNav 2017, 10, 425–430. [Google Scholar] [CrossRef]
- Rutkowski, G. Determining the Best Possible Speed of the Ship in Shallow Waters Estimated Based on the Adopted Model for Calculation of the Ship’s Domain Depth. Pol. Marit. Res. 2020, 27, 140–148. [Google Scholar] [CrossRef]
- Kramarska, R. Geological Map of the Baltic Sea bottom, 1:200,000, Sheet Ławica Słupska N.; Państwowy Instytut Geologiczny: Warsaw, Poland, 1991. [Google Scholar]
- Power-Technology. F.E.W. Baltic II Offshore Wind Farm (Poland). Available online: https://www.power-technology.com/projects/f-e-w-baltic-ii-offshore-wind-farm-poland/ (accessed on 9 June 2025).
- Zhen, R.; Lv, P.; Shi, Z.; Chen, G. A novel fuzzy multi-factor navigational risk assessment method for ship route optimization in costal offshore wind farm waters. Ocean Coast. Manag. 2023, 232, 106428. [Google Scholar] [CrossRef]
- Nie, Y.Y.; Liu, K.Z.; Yang, X.; Chen, S.Z.; Ma, J. The safe distance between the offshore wind farm and the airway. Navig. China 2019, 42, 12–17. [Google Scholar]
- Wróbel, K. Searching for the origins of the myth: 80% human error impact on maritime safety. Reliab. Eng. Syst. Saf. 2021, 216, 107942. [Google Scholar] [CrossRef]
| Abbreviation | Full Term |
|---|---|
| ADT | Ship’s Air Draft (HN), the vertical height of the ship’s highest point above the waterline |
| COLREG | International Regulations for Preventing Collisions at Sea |
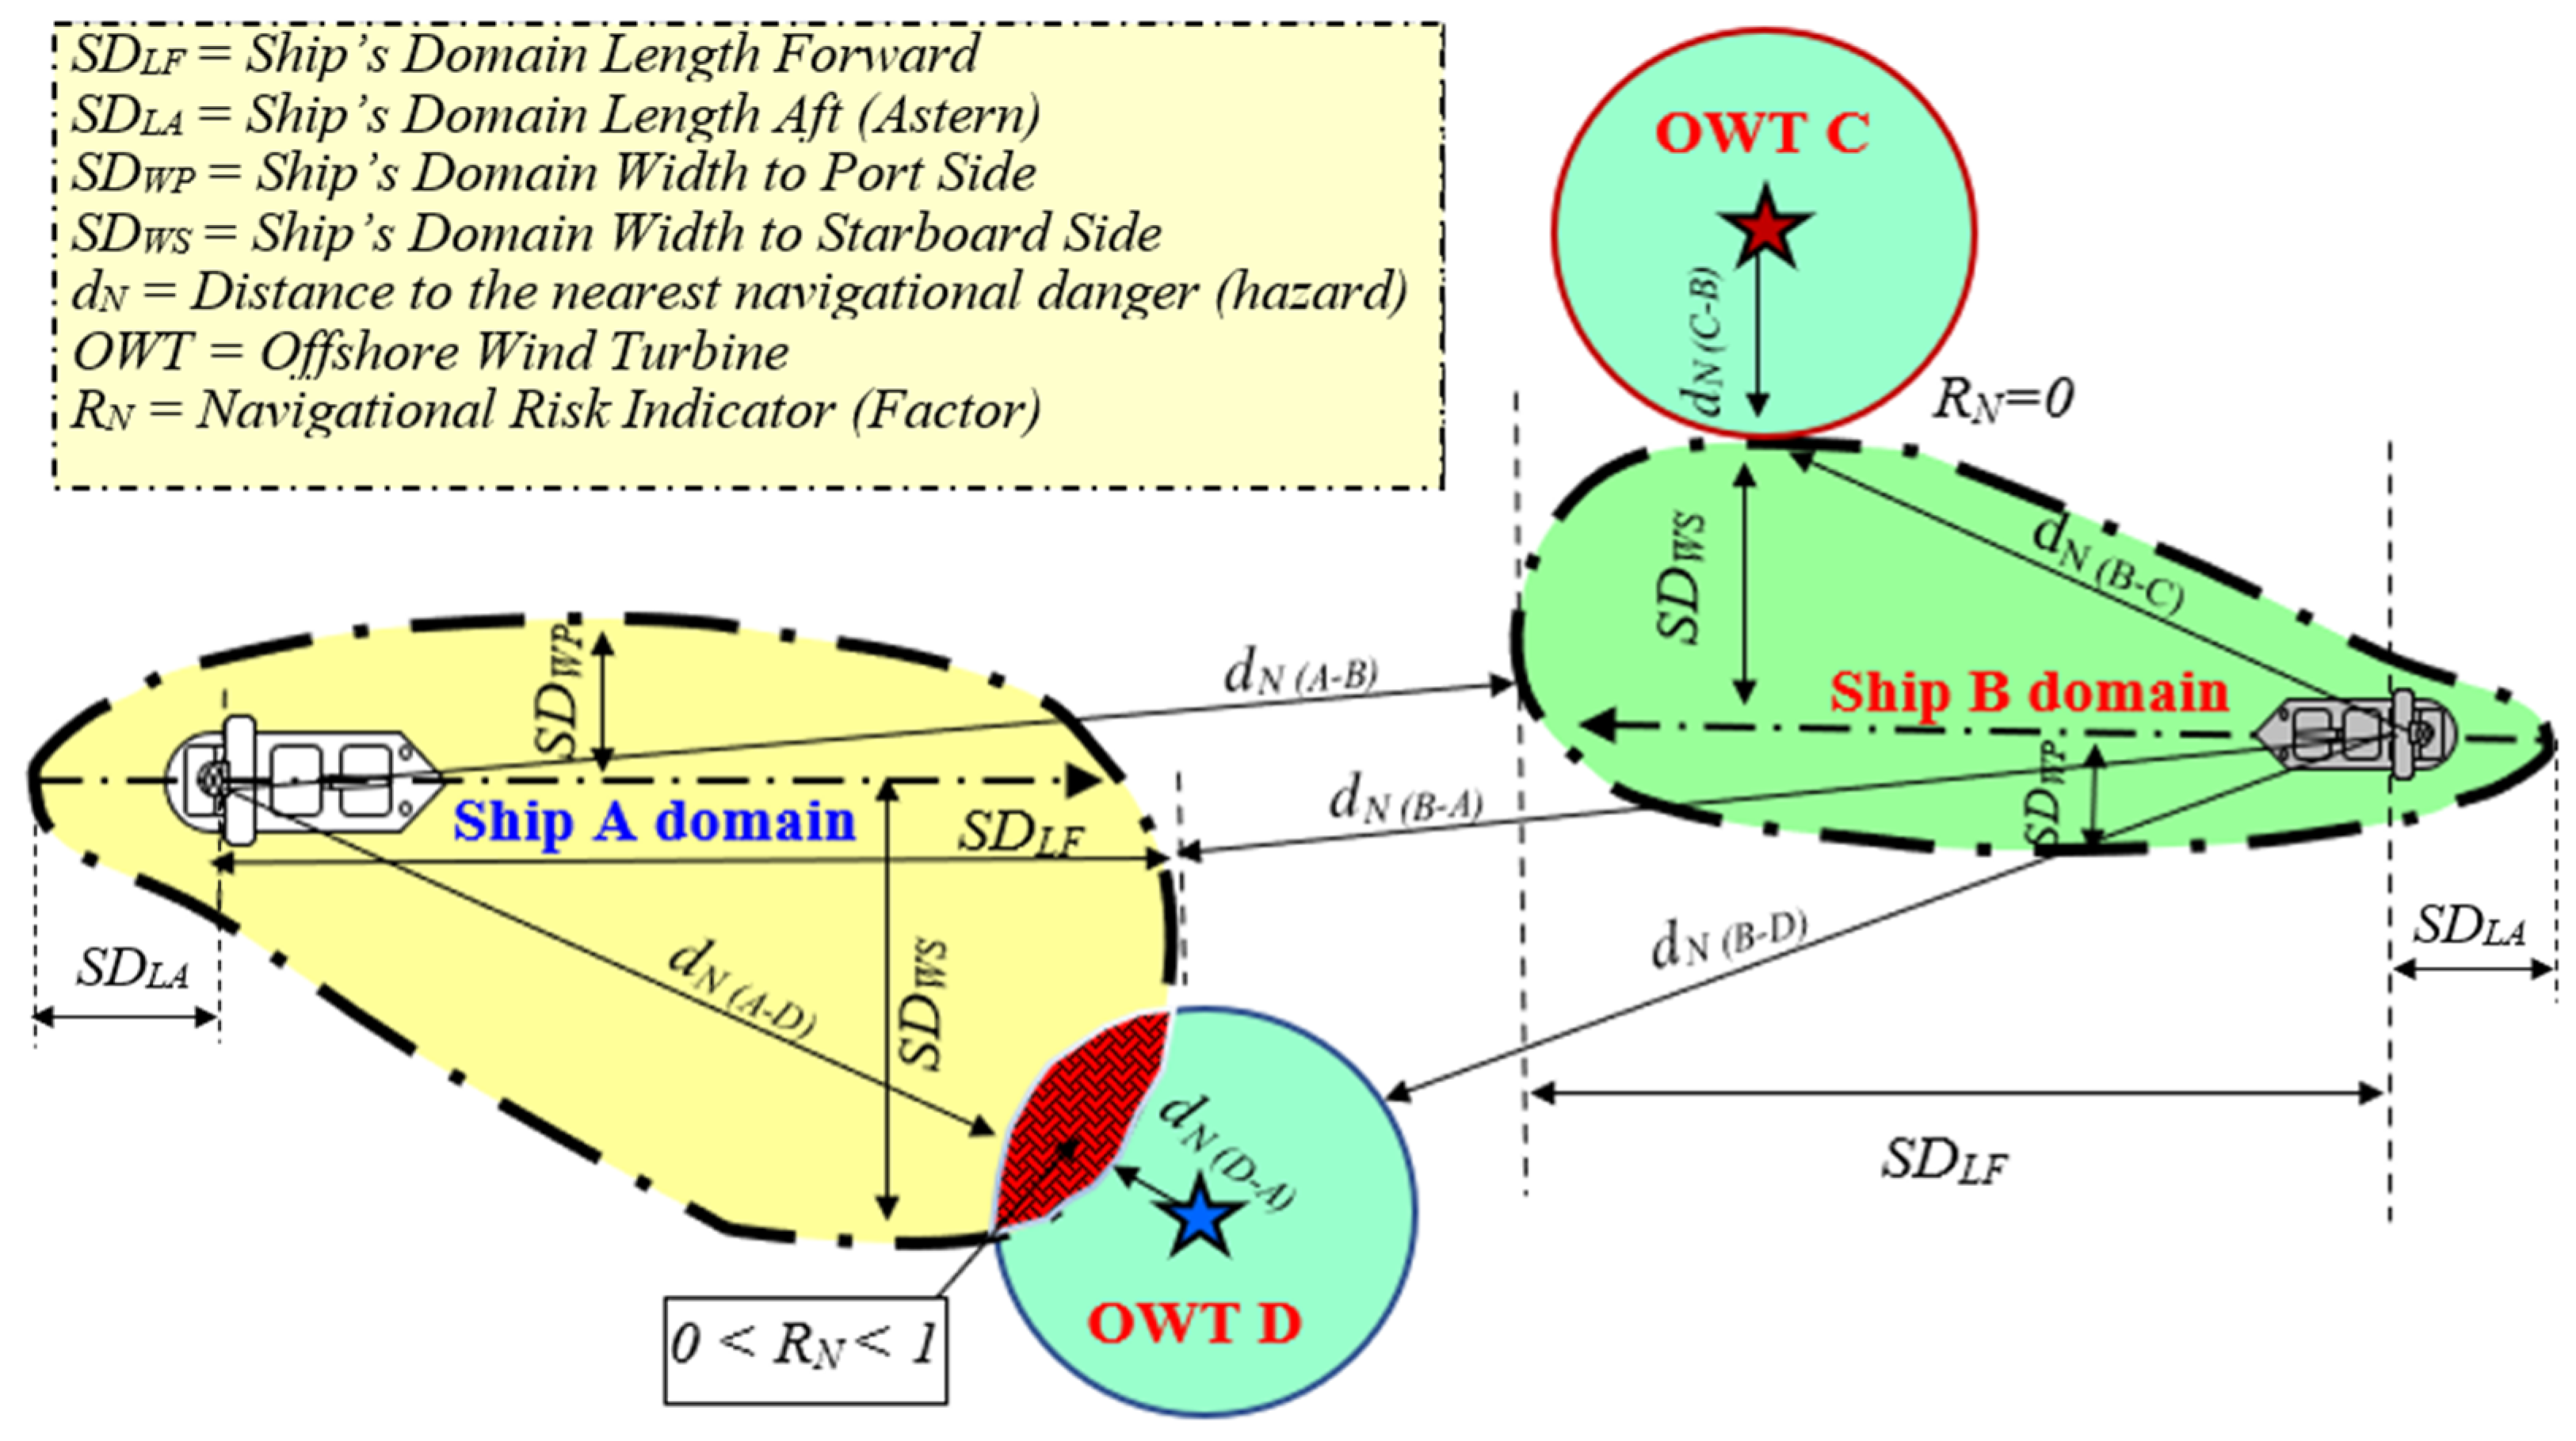
| dN | Distance to the nearest navigational danger (hazard) |
| ECDIS | Electronic Chart Display and Information System |
| EEZ | Exclusive Economic Zone |
| FAS | Full Astern |
| FSAH | Full Speed Ahead |
| HAH | Half Ahead |
| IMO | International Maritime Organization |
| OHC | Over-Head Clearance |
| OWF | Offshore Wind Farm |
| OWT | Offshore Wind Turbine |
| PIANC | World Association for Waterborne Transport Infrastructure |
| RL | Risk Level |
| RND | Vertical component of the navigational risk indicator (RN) that concerns keeping an adequate required under-keel clearance (UKC) |
| RNH | Vertical component of the navigational risk indicator (RN) that concerns keeping an adequate required over-head clearance (OHC) or air draft clearance |
| RNLF | Horizontal component of the navigational risk indicator (RN) that concerns keeping an adequate required safe distance from the nearest danger ahead of the ship |
| RNLA | Horizontal component of the navigational risk indicator (RN) that concerns keeping an adequate required safe distance from the nearest danger astern of the ship |
| RNWP | Horizontal component of the navigational risk indicator (RN) that concerns keeping an adequate required safe distance from the nearest danger on the ship’s port side |
| RNWS | Horizontal component of the navigational risk indicator (RN) that concerns keeping an adequate required safe distance from the nearest danger on the ship’s starboard side |
| SDD | Ship Domain Depth calculated below the waterline |
| SDH | Ship Domain Height calculated above the waterline |
| SDLF | Ship Domain Length Forward calculated horizontally ahead from the center of the ship’s layout |
| SDLA | Ship Domain Length calculated horizontally astern in the aft direction from the center of the ship’s layout |
| SDWP | Ship Domain Width (beam) calculated to the Port side from the ship’s heading line |
| SDWS | Ship Domain Width (beam) calculated to the Starboard side from the ship’s heading line |
| TSS | Traffic Separation Scheme |
| UKC | Under-Keel Clearance |
| VLCC | Very Large Crude Carrier |
| Z-Tug | Z-Drive Prevention Response Tug |
| Type of Ship and Its Parameters | |||
|---|---|---|---|
| VLCC (Very Large Crude Carrier) | Fishing Boat (Fisher) | Z-Drive Prevention Response Tug | |
| DWT [t] | 159,584 DWT | 1676 DWT | 300 DWT |
| Engine power [kW] | 15,500 kW | 840 kW | 2 × 3800 kW |
| Length overall (L = LOA), from stern to bridge (LRF) and from bridge to bow (LRF) [m] | L = LOA = 261.3 m LAR = 51.8 m LRF = 209.5 m | L = LOA = 65.6 m LAR = 25.3 m LRF = 40.3 m | L = LOA = 45.0 m LAR = 30.5 m LRF = 14.5 m |
| Width B [m] | 48.3 m | 10.3 m | 12.5 m |
| Draft T = Tmax [m] | 15.0 m | 5.4 m | 4.9 m |
| Overall height Hc [m] | 77.3 m | 32.3 m | 21.0 m |
| Air draft HN = ADT [m] | 62.3 m | 27.0 m | 16.1 m |
| Hull Block coefficient CB | 0.85 | 0.64 m | 0.614 |
| Ships Speed [kn] | Full Ahead (FSAH) = 15.0 kn ≈ 7.7 m/s Half Ahead (HAH) = 10.1 kn ≈ 5.2 m/s | Full Ahead (FSAH) = 12.6 kn ≈ 6.5 m/s Half Ahead (HAH) = 8.9 kn ≈ 4.6 m/s | Full Ahead (FSAH) = 15.0 kn ≈ 7.7 m/s Half Ahead (HAH) = 5.7 kn ≈ 2.9 m/s |
| Parameters for ship turning (circulation) and emergency ADmax; TRmax [m] | Advance = ADmax = 926 m ≈ 3.5∙L Transfer = TRmax = 889 m ≈ 3.4∙L | Advance = 213 m ≈ 3.2∙L Transfer = 241 m ≈ 3.7∙L | Deep Water: Advance = 86 m ≈ 1.9∙L Transfer = 78 m ≈ 1.7∙L Shallow Water: Advance = 89 m ≈ 1.9∙L Transfer = 108 m ≈ 2.4∙L |
| Stopping Distance ADmax [m] | FSAH-FAS = 3704 m ≈ 14.2∙L HAH-FAS = 1482 m ≈ 5.7∙L | FSAH-FAS = 667 m ≈ 10.2∙L HAH-FAS = 333 m ≈ 5.1∙L | FSAH-FAS = 77 m ≈ 1.9∙L HAH-FAS = 22 m ≈ 0.5∙L |
| Parameter | Average Conditions | Deteriorated Conditions |
|---|---|---|
| Visibility | At least 5 NM | Reduced to 2 NM |
| Wave height | hf ≈ 1.0 m | hf ≈ 3.0 m |
| Wind | 3–4 °B | 5–6 °B |
| Permanent surface current velocity | Vp ≤ 0.2 kn | Vp ≤ 0.4 kn |
| Current direction (Kp) | In line with the direction of the vessel traffic flow within the TSS | Perpendicular to the direction of the vessel traffic flow within the TSS |
| Water level vertical oscillations referred to chart datum (Chart Datum = MSL) | ±0.3 m | Not more than ±0.60 m |
| Water density (ρ) | 1.0066 g cm−3 | 1.0066 g cm−3 |
| Ship drift angle (a) | Not more than ±1° | Not more than ±2° |
| Maximum yawing (Δ) | Up to ±2° | Up to ±4° |
| Roll angle (a) | Up to ±4° | Up to ±8° |
| Model | Dimensionality | Accounts for Vessel Size/Speed? | Considers Vertical Risks (UKC/OHC)? | Reflects Maneuvering Capability? |
|---|---|---|---|---|
| PIANC guidelines | 2D (horizontal) | No | No | Partially (via generic maneuvering standards) |
| Coldwell (1983) [20] | 2D (horizontal) | Partially (via stopping distance) | No | Yes (limited to turning/stopping distance) |
| Rutkowski (2000) [23] | 3D (horizontal + vertical) | Yes | Yes | Yes (detailed maneuvering behavior under different conditions) |
Disclaimer/Publisher’s Note: The statements, opinions and data contained in all publications are solely those of the individual author(s) and contributor(s) and not of MDPI and/or the editor(s). MDPI and/or the editor(s) disclaim responsibility for any injury to people or property resulting from any ideas, methods, instructions or products referred to in the content. |
© 2025 by the authors. Licensee MDPI, Basel, Switzerland. This article is an open access article distributed under the terms and conditions of the Creative Commons Attribution (CC BY) license (https://creativecommons.org/licenses/by/4.0/).
Share and Cite
Rutkowski, G.; Kubacka, M. Navigational Risk Assessment in Offshore Wind Farms Using Spatial Ship Domain Models. Appl. Sci. 2025, 15, 6943. https://doi.org/10.3390/app15126943
Rutkowski G, Kubacka M. Navigational Risk Assessment in Offshore Wind Farms Using Spatial Ship Domain Models. Applied Sciences. 2025; 15(12):6943. https://doi.org/10.3390/app15126943
Chicago/Turabian StyleRutkowski, Grzegorz, and Maria Kubacka. 2025. "Navigational Risk Assessment in Offshore Wind Farms Using Spatial Ship Domain Models" Applied Sciences 15, no. 12: 6943. https://doi.org/10.3390/app15126943
APA StyleRutkowski, G., & Kubacka, M. (2025). Navigational Risk Assessment in Offshore Wind Farms Using Spatial Ship Domain Models. Applied Sciences, 15(12), 6943. https://doi.org/10.3390/app15126943