Article

Radiodosiomics Prediction of Treatment Failures Prior to Chemoradiotherapy in Head-and-Neck Squamous Cell Carcinoma

by
Hidemi Kamezawa
1 and
Hidetaka Arimura
2,*
1
Department of Radiological Technology, Faculty of Fukuoka Medical Technology, Teikyo University, 6-22 Misaki-machi, Omuta 836-8505, Fukuoka, Japan
2
Division of Medical Quantum Science, Department of Health Sciences, Faculty of Medical Sciences, Kyushu University, 3-1-1 Maidashi, Higashi-ku, Fukuoka 812-8582, Fukuoka, Japan
*
Author to whom correspondence should be addressed.
Appl. Sci. 2025, 15(12), 6941; https://doi.org/10.3390/app15126941
Submission received: 28 April 2025 / Revised: 11 June 2025 / Accepted: 17 June 2025 / Published: 19 June 2025
(This article belongs to the Special Issue Novel Technologies in Radiology: Diagnosis, Prediction and Treatment)

Abstract

Predicting treatment failure (TF) in head-and-neck squamous cell carcinoma (HNSCC) patients before treatment can help in selecting a more appropriate treatment approach. We investigated a novel radiodosiomics approach to predict TF prior to chemoradiation in HNSCC patients. Computed tomography (CT) images, dose distributions (DDs), and clinical data from 172 cases were collected from a public database. The cases were divided into the training (n = 140) and testing (n = 32) datasets. A total of 1027 features, including conventional radiomic (R) features, local binary pattern-based (L) features, and topological (T) features, were extracted from the CT images and DDs of the tumor region. Moreover, deep (D) features were extracted from a deep learning-based prediction model. The Coxnet algorithm was employed to select significant features. Twenty-two treatment failure prediction models were constructed based on Rad-scores. TF prediction models were assessed using the concordance index (C-index) and statistically significant variations in the Kaplan–Meier curves between the two risk groups. The Kaplan–Meier curves of the DD-based T (DD-T) model displayed statistically significant differences. The highest C-index of the testing dataset for this model was 0.760. The proposed radiodosiomics models could potentially demonstrate greater accuracy in anticipating TF before chemoradiation in HNSCC patients.

1. Introduction

Head-and-neck squamous cell carcinoma (HNSCC) affects approximately 136,000 people worldwide annually [1]. The 5-year overall survival rate (5y-OS) for HNSCC is estimated to be approximately 60%. Furthermore, advanced HNSCC (stages III and IV) has a poor prognosis, with a 5y-OS of <50%. Radiotherapy (RT), combined with chemoradiotherapy (CRT), plays an important role in the definitive treatment of HNSCC. However, the 5y-OS remains low despite advances in treatment, owing to treatment failure. Recurrence (local, locoregional, and regional recurrence), distant metastasis, and residual tumors were included as treatment failures. Recurrence occurs in 16–52% of patients with head-and-neck squamous cell carcinoma (HNSCC) treated with definitive CRT [2,3,4,5,6,7]. Therefore, the prediction of treatment failure in each patient with HNSCC prior to treatment planning can lead to more optimal treatment plans or selection of a better treatment approach.
In recent years, radiomics and dosiomics have been widely applied for the recurrence prediction of HNSCC [8,9,10], preoperative prediction of the malignancy of parotid gland tumors [11,12], and prognosis prediction in patients with HNSCC [13,14,15]. Radiomics is a rapidly developing field that analyzes the relationships between clinical outcomes and the features extracted from medical images. In addition, dosiomics is a radiomics approach, and the dose distribution simulated in RT treatment planning is analyzed instead of using medical images. Dose distribution is closely related to tumor control at RT. Tumors consist of heterogeneous tumor cells as well as resistant and sensitive cells. Therefore, the inadequate distribution of an insufficient dose to resistant cells can cause treatment failure. We previously reported recurrence prediction after RT in patients with HNSCC using dosiomics [10]. This performance is better than that of the conventional radiomics approaches.
Local binary pattern (LBP) is a conventional radiomics feature. LBP can describe the textural characteristics of the images by comparing the intensity of a center pixel in a small neighborhood with the intensity of its surrounding pixels. Some studies have applied LBP to radiomics analysis to evaluate tumor heterogeneity [14,15]. Moreover, we reported the first dosiomics analysis applying LBP to predict recurrence in patients with HNSCC [10]. The dosiomics model performance was higher than the conventional radiomics approach. Therefore, a mixed radiomics and dosiomics approach (radiodosiomics) by using the LBP could characterize the tumor heterogeneity, which is associated with treatment failure.
Topological radiomics is a novel approach in radiomics research [12,13]. It was analyzed using topological features, particularly Betti numbers, extracted from medical images. Betti numbers are topological invariants used in algebraic topology to summarize the connectivity and geometry of spaces. Betti numbers provide information on the number of connected components, holes, and higher-dimensional cavities in the data [16,17,18]. Figure 1 shows an example of CT and binary images of non-treatment failure (upper panel) and treatment failure cases (lower panel). In radiomics, Betti numbers can be used to analyze and quantify the topological properties of medical images. Higher Betti numbers indicate a greater number of holes or voids in the image, which may be associated with different pathological conditions or anatomical structures. In dosiomics, topological features may represent inhomogeneous dose distributions related to treatment failure. Therefore, topological features based on the Betti number may reveal tumor properties. They may improve the predictive performance of tumor characterization, prognosis, and treatment response. Ikushima et al. reported two-dimensional topological radiomics for predicting the malignancy of parotid gland tumors [12]. The topology-based approach showed a better performance (accuracy: 0.975) than the conventional approach (accuracy: 0.795). Le et al. suggested that two-dimensional topological radiomics can capture intrinsic tumor information and predict the prognosis of HNSCC patients [13]. The C-index for the prediction performance was 0.80. Therefore, a topology-based approach may be useful for predicting treatment failure in HNSCC patients.
Based on our current understanding, it appears that no prior research has explored the potential use of LBP and three-dimensional topology in the context of radiomics and dosiomics (radiodosiomics) analysis for HNSCC. The proposed approach in this study incorporates LBP and topological features to enhance the precision of treatment failure prognosis for patients with HNSCC who undergo CRT, using radiodosiomics analyses.

2. Materials and Methods
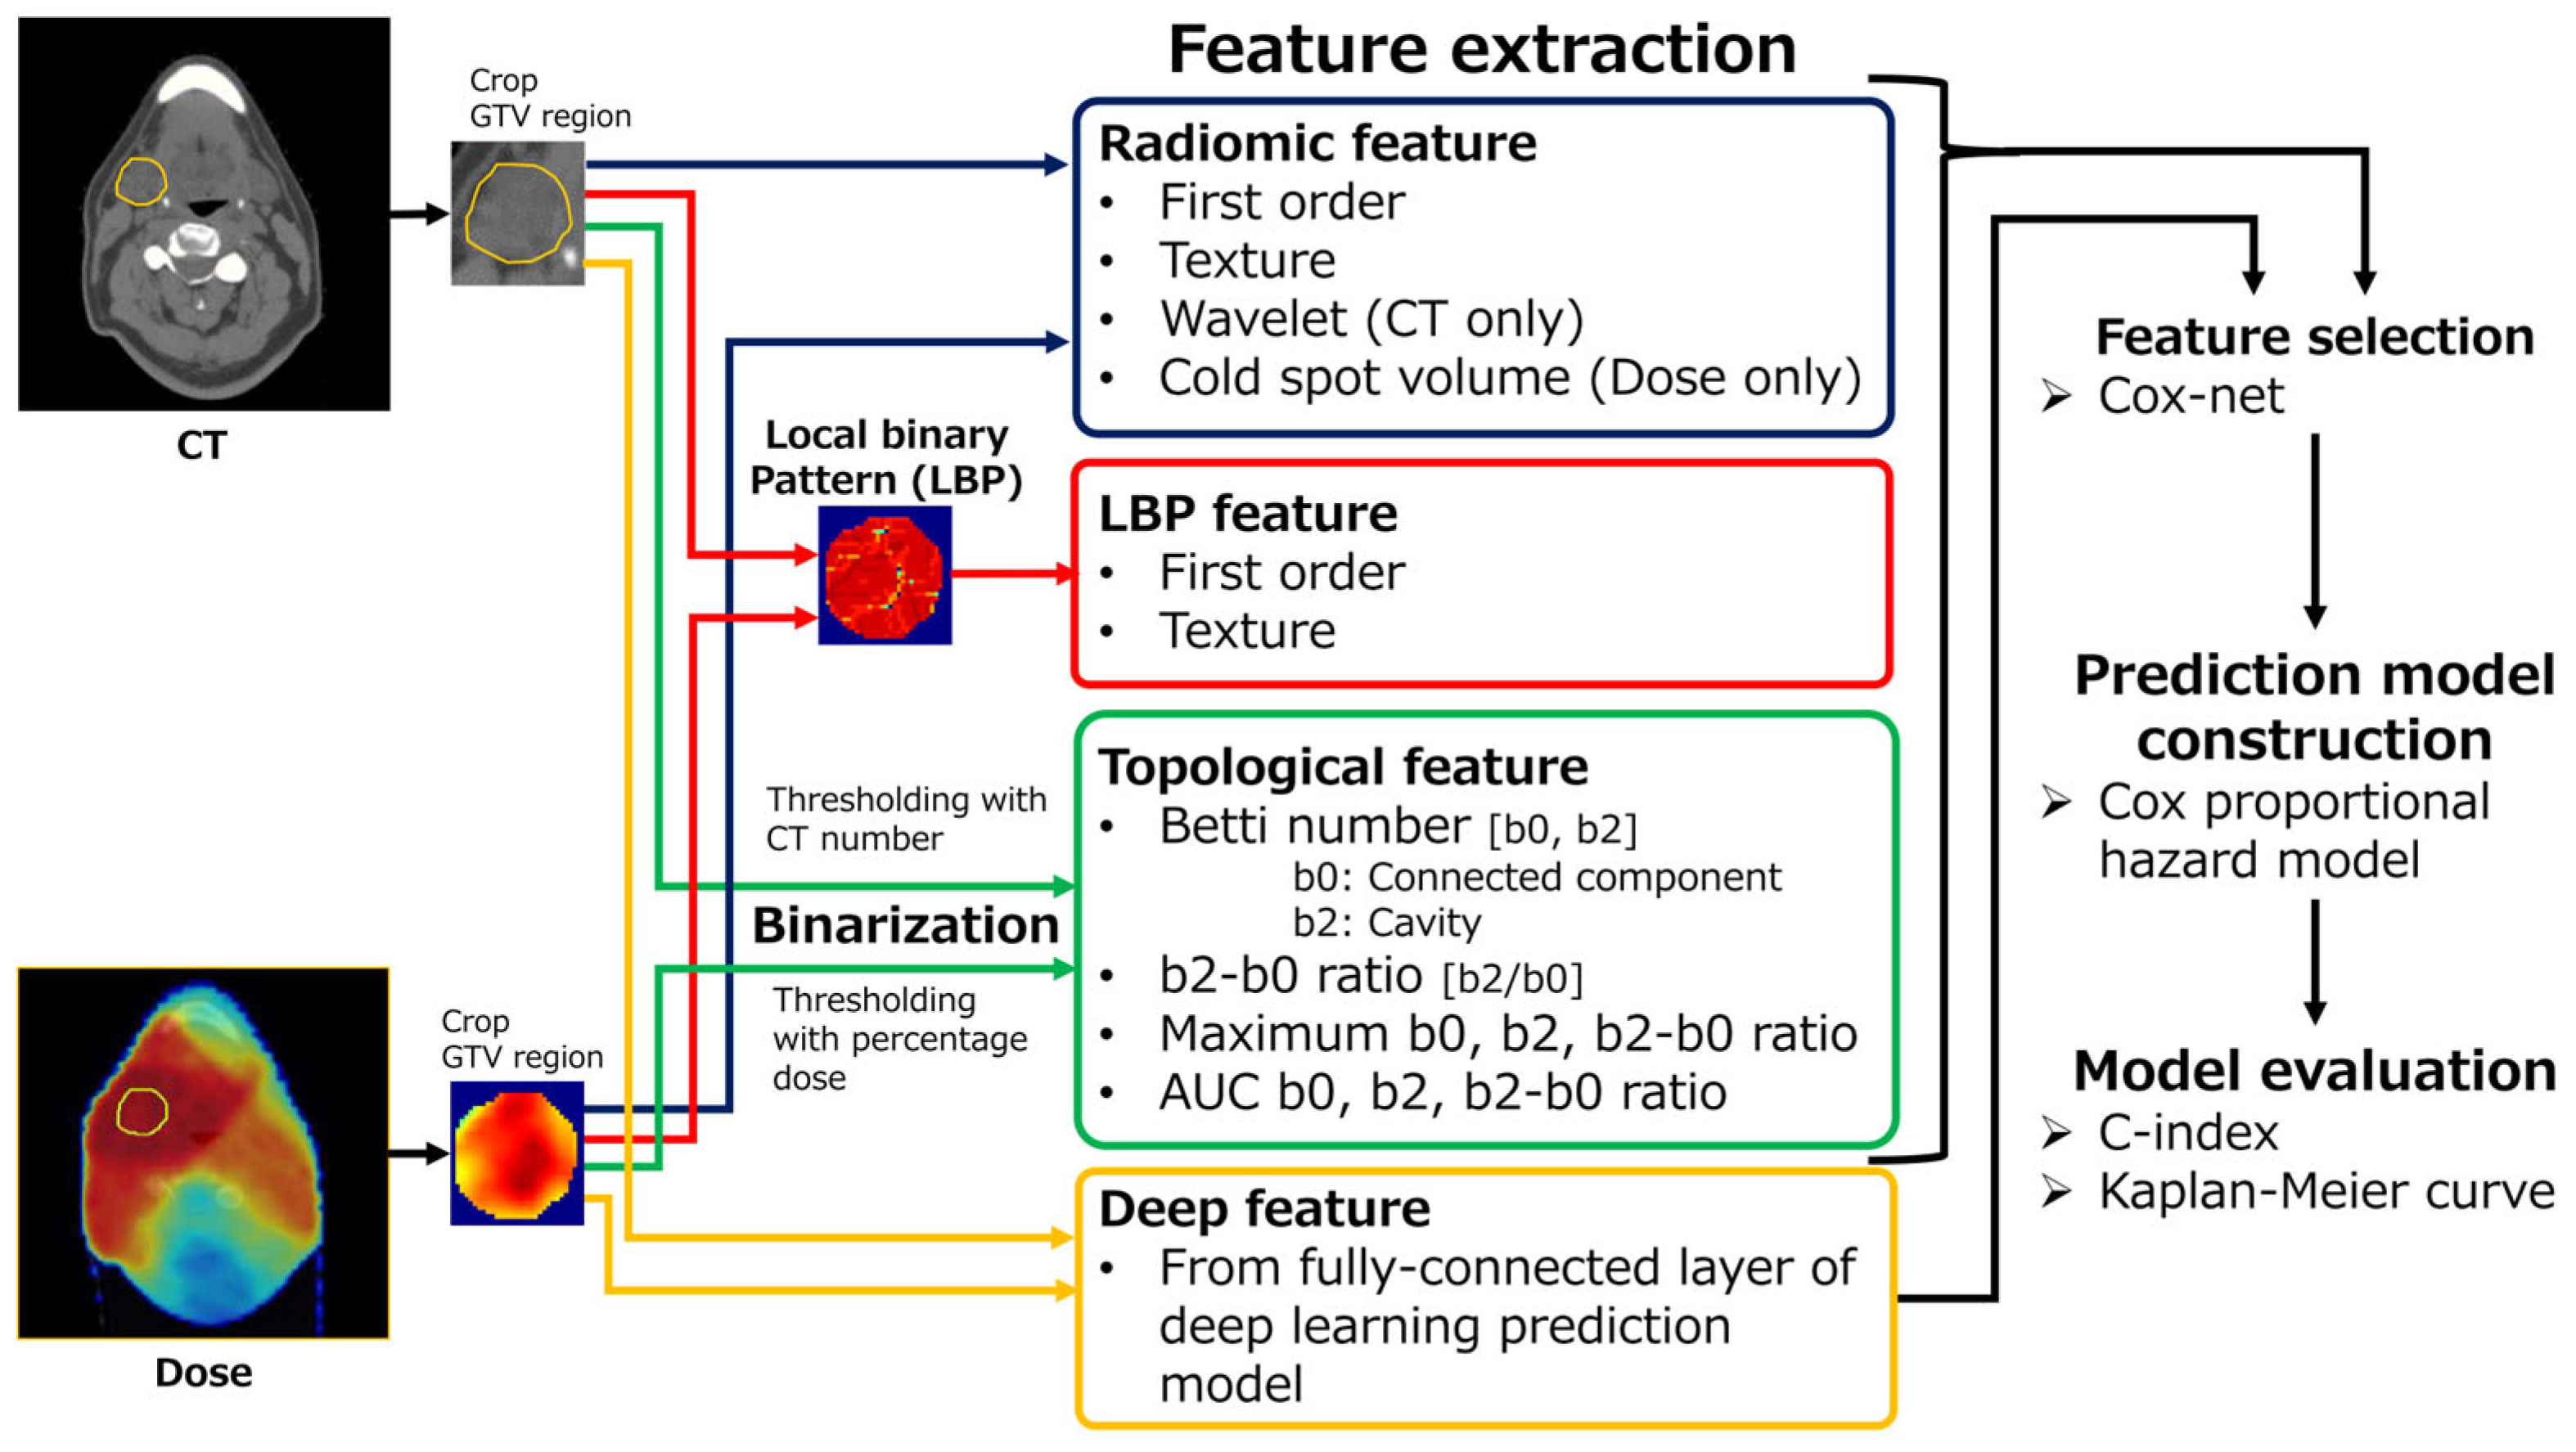
2.1. Overview

Figure 2 provides an overview of this study. First, the gross tumor volume (GTV) region on the CT image and dose distribution (DD) in the GTV region were cropped based on the GTV contour information. Radiomics (R), local binary pattern (L), and topological (T) features were extracted from the cropped CT and DD images. Moreover, deep features were extracted from the deep learning-based prediction model. A total of 22 models—that is, R, L, T, RL, RT, LT, and RLT in CT-only, DD-only, combined CT with DD (CD), and deep learning-based (DL) models—were compared. Second, significant features associated with treatment failure were explored using the Cox proportional hazards (CPH) model with the least absolute shrinkage and selection operator (LASSO) penalty. The treatment failure prediction model was then constructed with the Rad-score calculated using the significant features. Finally, the performance of the prediction model was assessed using the C-index and Kaplan–Meier curves.

2.2. Patients

Overall, 172 cases, which were treated with CRT to HNSCC stage III and IV, were collected from the “HNSCC” and “HN-PET-CT” database in The Cancer Imaging Archive (TCIA) [19,20,21,22,23,24]. The dataset consists of 172 HNSCC patients treated at Hôpital général juif de Montréal (n = 17), Centre hospitalier universitaire de Sherbrooke (n = 29), Hôpital Maisonneuve-Rosemont de Montréal (n = 17), Centre hospitalier de l’Université de Montréal (n = 41), and MD Anderson Cancer Center (n = 68). Institutional Review Board approval was not required because TCIA is an open-access database and all data collected for this study were freely available for scientific research. Moreover, our study followed the TCIA data-usage policy. The cases were non-randomly divided into the training (n = 140) and testing (n = 32) datasets without statistically significant differences between two groups, according to the transparent reporting of a multivariable prediction model for individual prognosis or diagnosis (TRIPOD): the TRIPOD Statement [25]. Because the TRIPOD Statement defines that the non-random split is a stronger design for evaluating model performance. Patient characteristics are shown in Table 1. Local recurrence, locoregional recurrence, regional recurrence, distant metastasis, and residual tumors were considered treatment failures after CRT. The numbers of treatment failures were 28 and 16 in the training and test datasets, respectively. The number of treatment failures and complete response cases were imbalanced at 28 and 112, respectively. Therefore, treatment failure in the training dataset was balanced using the synthetic minority oversampling technique (SMOTE) [26], which can randomly generate synthetic data from a minority group, while maintaining the distribution of the original data. Therefore, the number of treatment failure cases in the training dataset increased to 112, which is the same as the number of complete response cases. As a result, the training dataset was expanded from 140 to 224 using SMOTE.

2.3. Feature Extraction

Prior to feature extraction, the CT images and DD in the GTV region were cropped based on the contour information of the GTV. Preprocessing, which resamples the voxel size and quantization, for CT and DD was then performed. The CT and DD images were resampled with an isotropic voxel size of 1 × 1 × 1 mm3. Quantization of CT and DD was performed using 64 bits and a fixed bin width of 25 cGy. In total, 486 R, 54 L, and 309 T features were extracted from the CT images, and 55 R, 54 L, and 69 T features were extracted from the DD images. All the features were extracted using an in-house program implemented in MATLAB R2024b (MathWorks, Natick, MA, USA). The extracted features are listed in Table 2. Ultimately, each feature extracted from all datasets was standardized using a Z-score based on the mean and standard deviation of the training data.

2.3.1. Radiomics (R) Feature

The R feature group consisted of first-order (n = 14), texture (n = 40), and wavelet decomposition (WD) features (n = 432). However, the WD features were calculated from the CT-only model, and the cold-spot volume (n = 1) was added only to the DD. Cold spots were defined as 95% of the prescribed dose, according to the Radiation Therapy Oncology Group 1016 protocol [27]. Therefore, R values for CT and DD (CT-R and DD-R) were 486 and 55, respectively. Texture features were calculated from four categories: the gray-level cooccurrence matrix (GLCM), gray-level run length matrix (GLRLM), gray-level size zone matrix (GLSZM), and neighborhood gray-tone matrix (NGTDM [28,29,30,31]. WD was performed by applying either a low- (L) or high-pass filter (H) in each direction of the three-dimensional volume using a Coiflet1 mother wavelet [32]. The 432 WD features were derived by calculating 14 first-order and 40 texture features for each of the eight wavelet decomposition images: LLL, LLH, LHL, LHH, HLL, HLH, HHL, and HHH.

2.3.2. Local Binary Pattern (L) Feature

Local binary pattern (L) was transformed from the original CT and DD images using the following equation [33]:
L = p = 1 P S 1 s v p v c 2 p ,
where p is the position number of a neighboring pixel, PS is the patch size, v c is the central pixel value in an arbitrary patch (as a threshold value), v p is the neighboring pixel value of position p in an arbitrary patch, and
s v p v c = 1 ,       v p v c 0 0 ,       v p v c < 0
A PS of 3 × 3 was employed for this study such that the number of neighboring pixels was eight (p: 1–8). Fourteen first-order and forty texture features were extracted from the CT-L and DD-L.

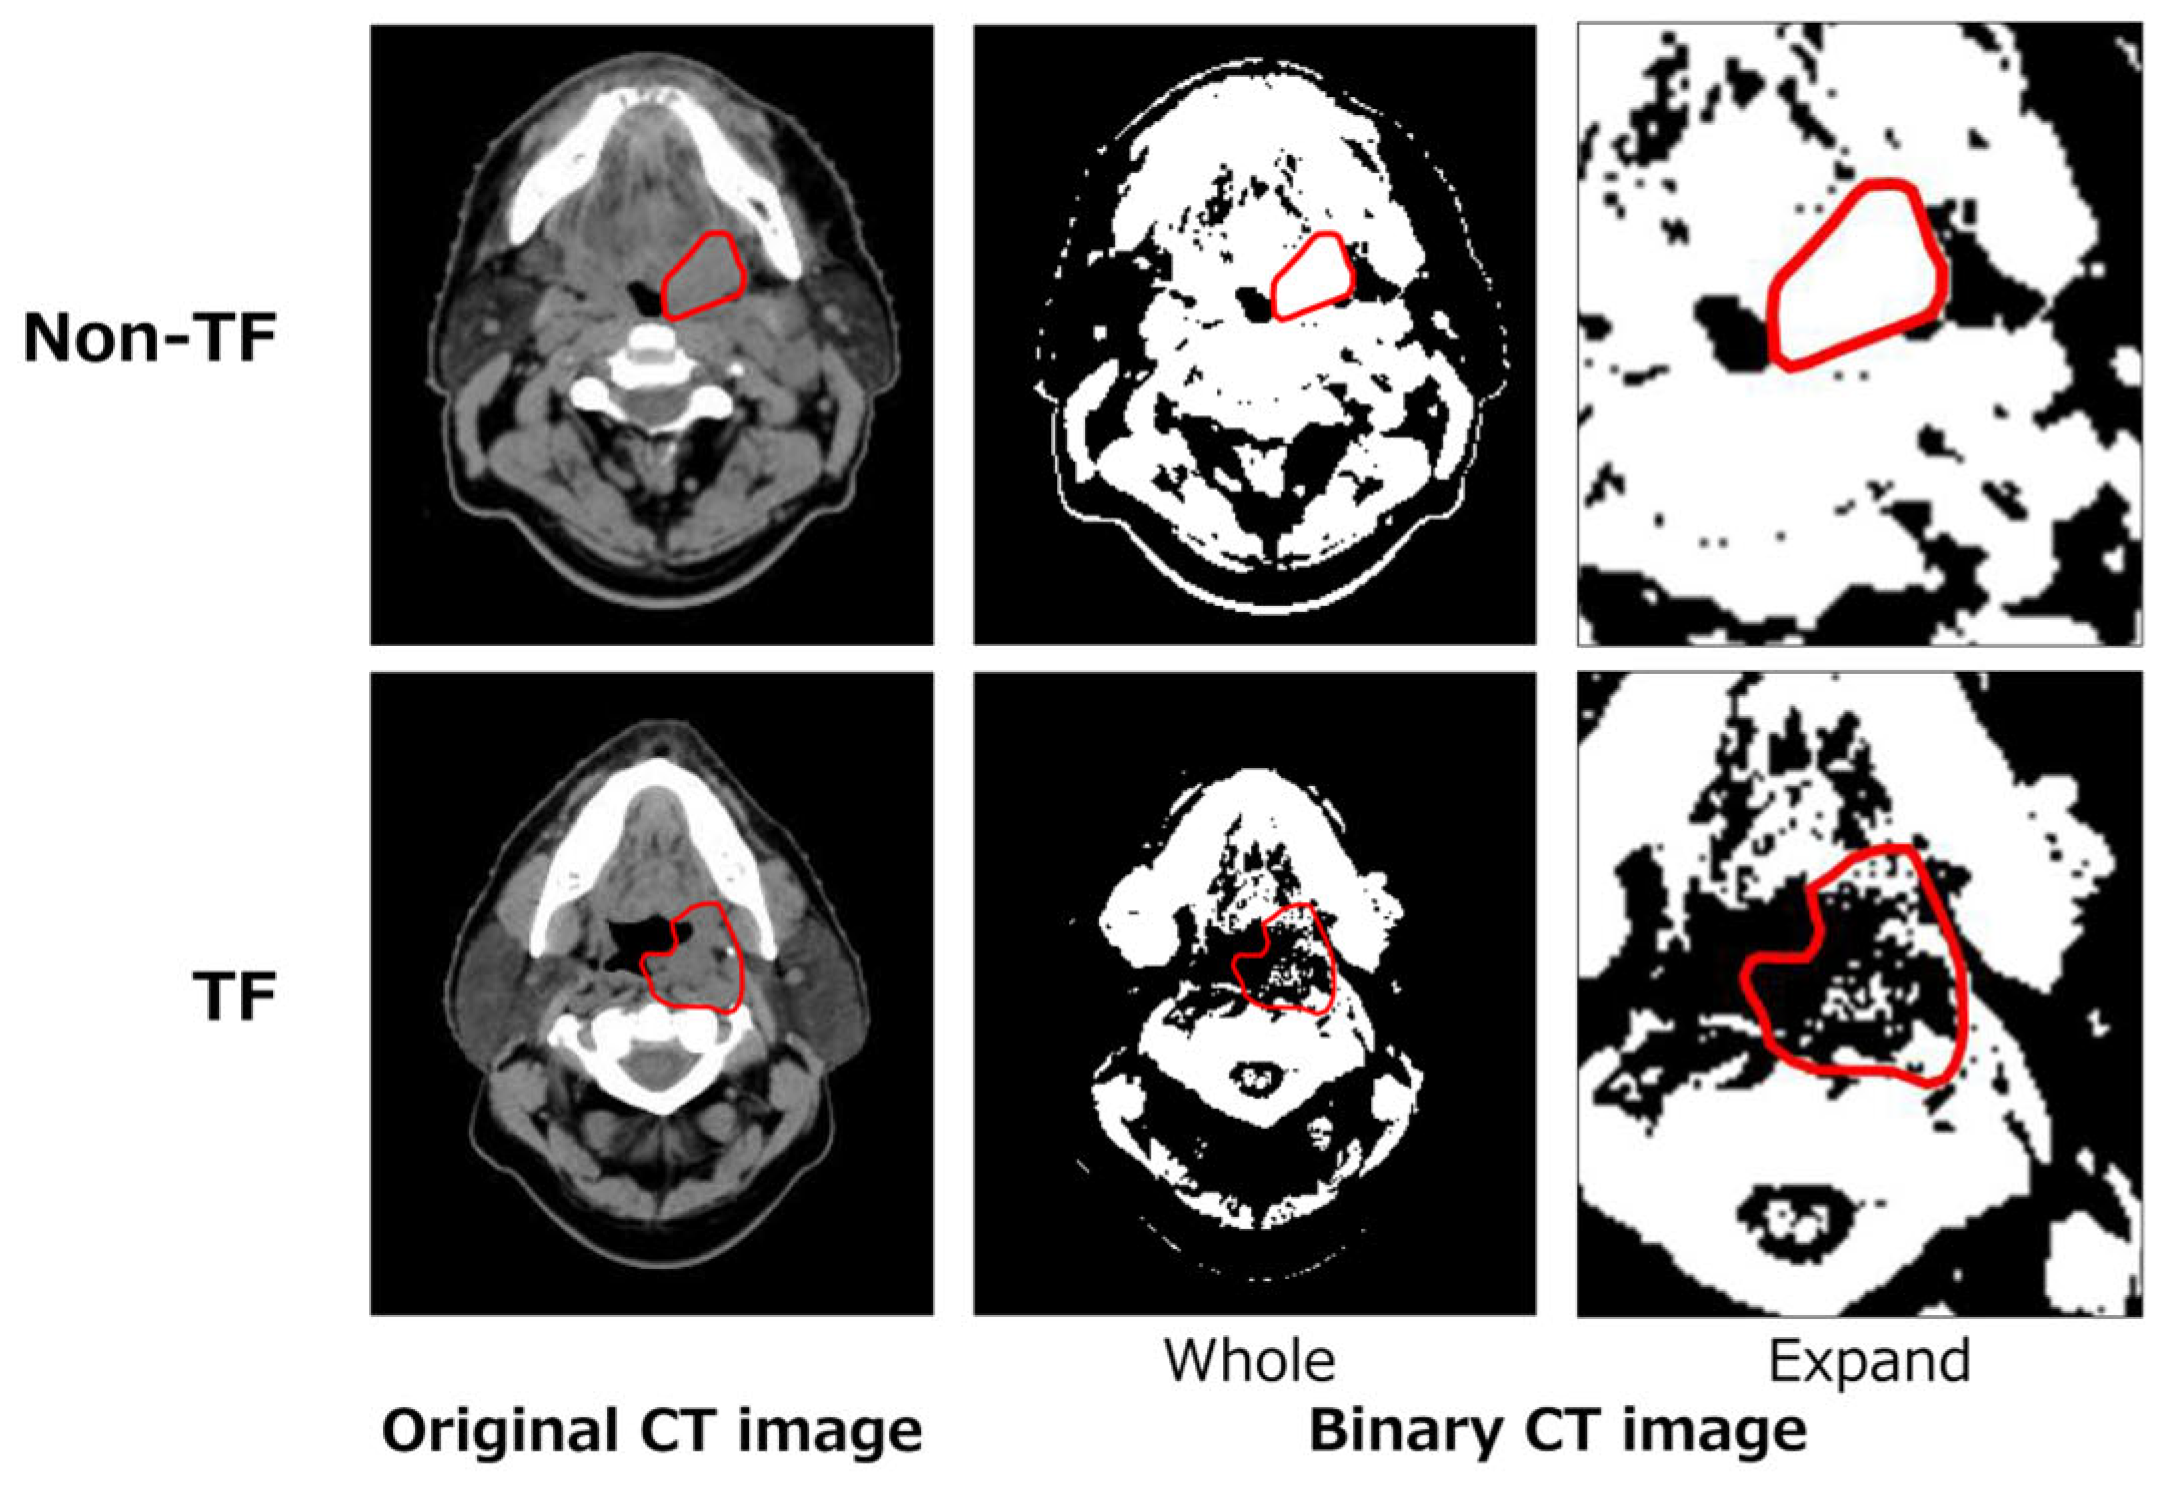
2.3.3. Topological (T) Feature

Betti numbers are invariant for topological spaces based on connectivity. The topological analysis was applied to the three-dimensional CT and DD images. In three-dimensional image, two values (b0 and b2) were included for the Betti numbers. b0 represents the number of connected components and b2 is the number of cavities. b0 and b2 were calculated from binarized CT and DD by changing the threshold of the CT value (range: mean CT value in CT ± 50, increment: 1 Hounsfield unit [HU]) and percentage prescribed dose (range: 95–105%, increment: 0.5%). In other words, b0 and b2 were obtained from each CT, and the DD was binarized with various thresholds. Moreover, the ratio of b0 and b2 (b2/b0) and area under the Betti number curve (AUBC) were employed as T features. AUBC is a definite integral of a curve describing the change in b0, b2, and b2/b0 as a function of the threshold value. An example of the Betti number curves in the CT of the four cases is shown in Figure 3. The Betti number curves varied depending on each case and may be able to express the differences in cancer traits.

2.3.4. Deep (D) Feature

A deep learning-based prediction model (DL model) was constructed for comparison with a hand-crafted (R, L, and T) feature-based radiomics model. The Inception-ResNet-v2 network [34], which has been pre-trained on more than a million natural images from ImageNet database [35] was employed. This network represented the best performance in the prediction of HNSCC regression for adaptive radiotherapy [36]. Therefore, for this study, D features were extracted using transfer learning to predict the treatment failure in HNSCC from the Inception-ResNet-v2 network. The transfer learning was performed using the training dataset, and the trained DL model was validated with the test dataset. Input images have three channels (1: CT image data, 2: DD data, and 3: Sobel-filtered CT image) and were resized to 299 × 299. We then extracted 1532 D features from the last fully connected layer after the transfer learning of this network using input images.

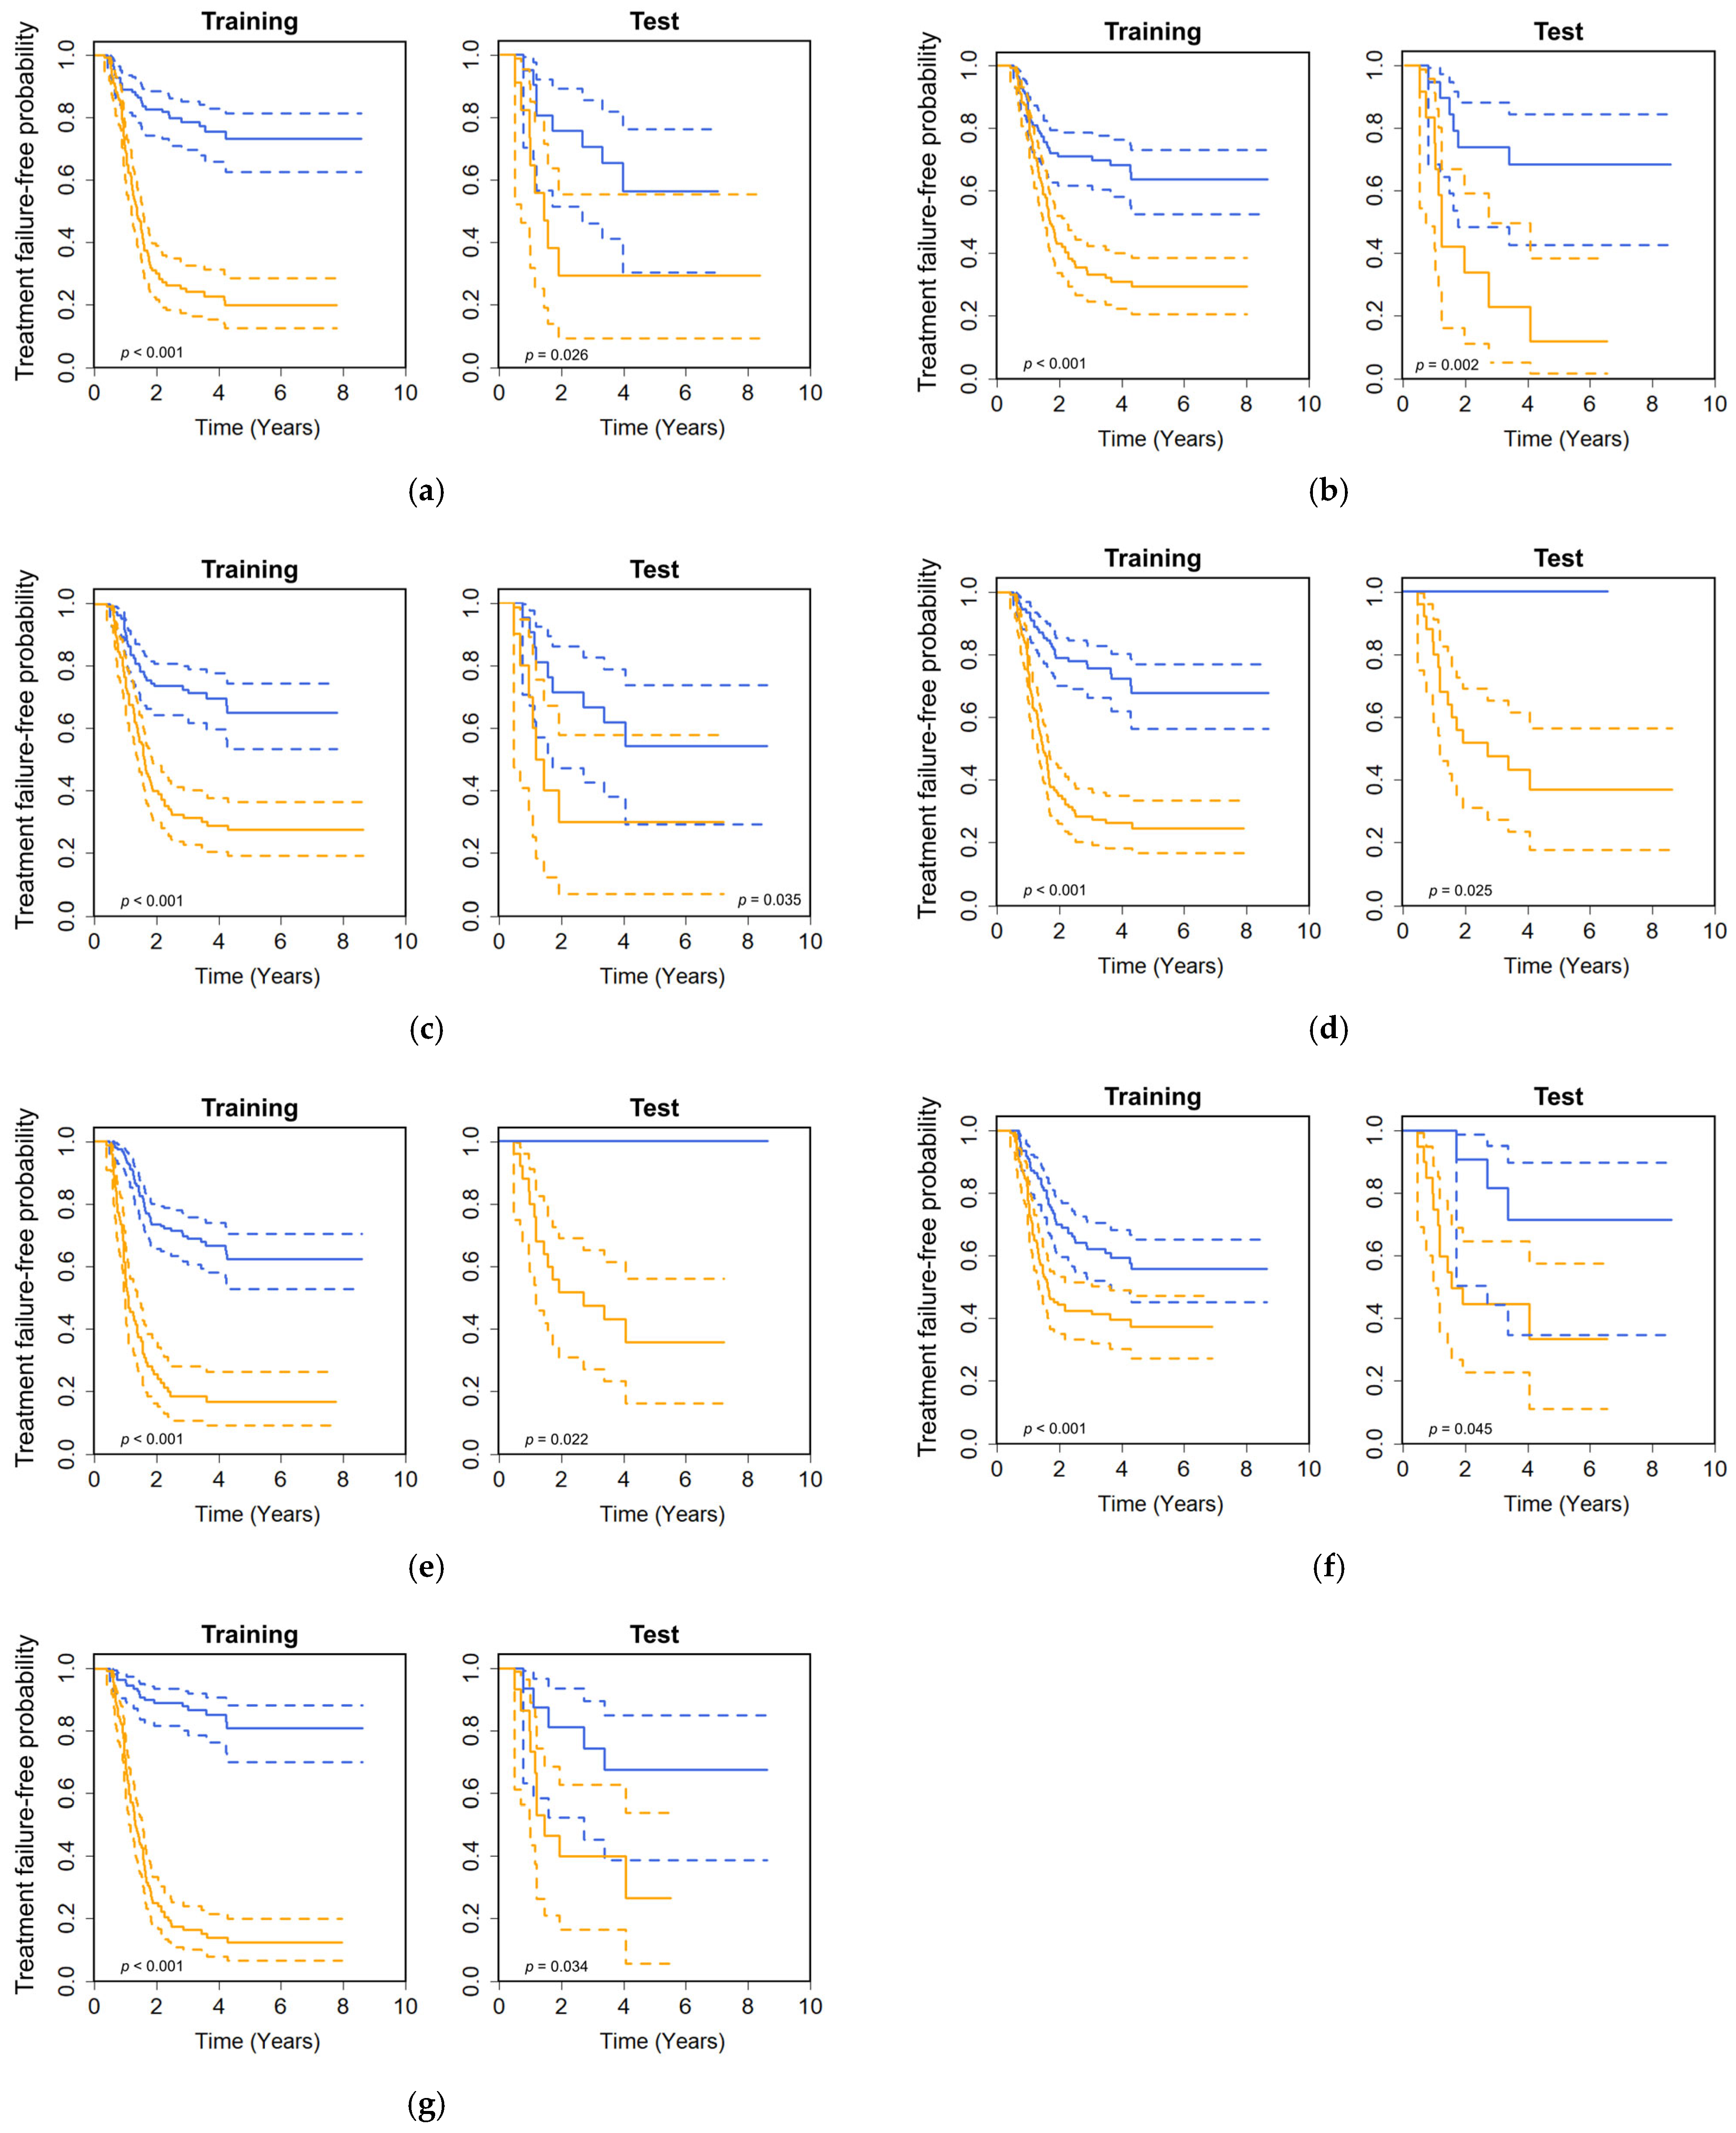
2.4. Prediction Model Construction and Performance Evaluation

Twenty-two models—that is, R, L, T, RL, RT, LT, and RLT models in CT-only, DD-only, CD, and DL models—were constructed to compare treatment failure prediction performances. Significant features were selected using Coxnet, and the CPH model was optimized using the LASSO (L1 norm) penalty and 10-fold cross validation. LASSO is widely used in radiomics to select features. If the coefficients of the features are zero, they are considered irrelevant to treatment failure. In other words, only features with coefficients were related to treatment failure, and only significant features could be selected. The Coxnet algorithm using the “glmnet” package in R software (R Foundation for Statistical Computing, Vienna, Austria) version 4.0.2 was employed to select significant features in the training dataset. The coefficients of the features selected by Coxnet represent the degree of contribution of each feature to the prediction of treatment failure. Moreover, to consider multicollinearity, pairwise correlation coefficients between selected features were calculated, and no highly correlated features (>0.70) were identified. The Rad-score was calculated as follows:
R a d s c o r e = i = 1 n β i × S F i ,
where n is the number of selected features, β is the coefficient of the selected feature obtained by the Coxnet, and the S F is the value of selected feature. Ultimately, a prediction model was constructed using a Rad-score-based CPH model.
C-indices and balanced C-indices were employed to assess model performance. The balanced C-index was calculated as the average value of the C-indices in the training and testing datasets. Moreover, all HNSCC cases in each dataset were stratified into two groups by the median of the Rad-score of the training data, and the significant difference between the two groups was evaluated by Kaplan–Meier curves (treatment failure-free probability curves) with the log-rank test (p < 0.05).
The optimal number of selected features was determined by changing the number of selected features (n) from two to the sample size (N), in order of larger absolute values of the coefficients, based on the condition “N > 10 × n” [37]. The optimal number of features was determined as the one representing the presence of statistically significant differences between Kaplan–Meier curves and the highest C-index of the test dataset. In the case of the absence of statistically significant differences, the optimal number of features were decided only with the C-index.

3. Results

The optimized number of significant features associated with treatment failure was determined for each of the 22 models listed in Table 3 in the training dataset of 224 cases (N). The number of selected features was determined as shown, based on the best prediction performance in each of the 22 models. The optimal number of significant features is shown in Table 3. In the binary images used to extract the T features, the treatment failure case had more cavities (b2), whereas the non-treatment failure case had almost a connected component (b0), as shown in Figure 1.
Table 3 shows the optimal number of features, C-indices, balanced C-indices, and statistically significant differences of the treatment failure-free probability curves of the high- and low-risk groups, stratified based on the median Rad-score in the treatment failure prediction model. Statistically significant differences in the treatment failure-free probability curves appeared in the CT-R, CT-L, DD-L, DD-T, DD-RT, DD-LT, and CD-RLT models. Figure 4 shows the treatment failure-free probability curves for the seven models, as mentioned above. The C-indices of training and test datasets were 0.726 and 0.641 for the CT-R model, 0.635 and 0.745 for the CT-L model, 0.670 and 0.641 for the DD-L model, 0.743 and 0.760 for the DD-T model, 0.730 and 0.747 for the DD-RT model, 0.679 and 0.756 for the DD-LT model, and 0.834 and 0.664 for the CD-RLT model. The DD-T model had the highest C-index of 0.760 for the test dataset. The balanced C-indices were 0.684, 0.690, 0.656, 0.752, 0.739, 0.718, and 0.739 for the CT-R, CT-L, DD-L, DD-T, DD-RT, DD-LT, and CD-RLT models, respectively. Considering the C-index of 0.760 for the test dataset, balanced C-index, and statistically significant differences in the treatment failure-free probability curves, the DD-T model demonstrated the best prediction performance.

4. Discussion

In this study, a novel approach for radiodosiomics analysis was proposed. The treatment failure prediction model was able to stratify patients into low- and high-risk groups. The CT-R, CT-L, DD-L, DD-T, DD-RT, DD-LT, and CD-RLT models may play a role in predicting treatment failure after CRT in patients with HNSCC. The LBP or topology-based features were used in six of the seven models (CT-L, DD-L, DD-T, DD-RT, DD-LT, and CD-RLT); they are useful for predicting treatment failure. Five of the seven models (DD-L, DD-T, DD-RT, DD-LT, and CD-RLT) were based on the features extracted from dose distribution. Therefore, the LBP- and topology-based features, and the features extracted from dose distribution, could be useful for predicting treatment failure prior to treatment planning of CRT.
Keek et al. developed two radiomic-based models to predict locoregional recurrence and distant metastasis before CRT in patients with HNSCC [8]. C-indices for prediction performance were 0.52 for radiomics–locoregional recurrence and 0.49 for the radiomics– distant metastasis models. Our CT-R, CT-L, DD-L, DD-T, DD-RT, DD-LT, and CD-RLT models demonstrated C-indices of 0.64, 0.75, 0.64, 0.76, 0.75, 0.76, and 0.64, respectively. Therefore, our proposed approach can accurately predict treatment failure prior to treatment planning in patients with HNSCC.
Wu et al. developed recurrence prediction models for patients with HNSCC [9]. The C-index of the conventional CT radiomics model was 0.54. The C-indices of the dosiomics and CT radiodosiomics models were 0.60 and 0.60, respectively. By comparing our treatment failure prediction models (CT-R, CT-L, DD-L, DD-T, DD-RT, DD-LT, and CD-RLT models) with their recurrence prediction models, our treatment failure models achieved higher C-indices (0.64, 0.75, 0.76, 0.75, 0.76, and 0.64) than their models. Therefore, the treatment failure prediction performance before CRT in patients with HNSCC may be improved by applying the topology or local binary pattern to conventional radiodosiomics models. However, they reported that the CT radiodosiomics prediction model combined with PET data showed improvement, with a C-index of 0.66. Hence, our model can potentially be improved by applying radiomics features extracted from PET images. Therefore, the incorporation of PET images should be investigated in future studies.
Our dataset mixed the cases collected from five independent institutions to ensure generalization performance. Karabacak et al. reported that the multi-institutional approach significantly improves the generalizability of the models compared to single-center studies [38]. Therefore, our dataset contains inter-institutional variability, which could contribute to the generalizability of the models. Although validation on a completely independent external dataset could not be performed, the inclusion of multi-institutional data in both the training and testing datasets could partially address this concern. However, validation on an independent external dataset would provide stronger evidence of the model’s performance. Therefore, we consider the inclusion of additional external datasets an important point for future work to further evaluate and improve the generalizability of the model.
Zhai et al. reported the utility of adding CT-based radiomics to clinical variables in predicting the outcomes for HNSCC patients treated with CRT [39]. The prediction performance of 0.65 as the area under the receiver operator characteristic curve (AUC) for disease-free survival by using only radiomics was improved to 0.70 by integrating clinical variables into radiomics. To investigate the impact of clinical variables on the prediction performance of our developed models, tumor size as the T-value in the tumor, lymph node, metastasis (TNM) classification and clinical stage were incorporated into the CT-R, CT-L, DD-L, DD-T, DD-RT, DD-LT, and CD-RLT models as the clinical variables. The balanced C-indices of seven models combined with and without clinical variables are shown in Table 4. The balanced C-indices decreased in all models with the addition of clinical variables. In addition, there were no statistically significant differences between the treatment failure-free probability curves in all models. Although an integrated analysis of clinical variables was expected to enhance prediction accuracy, this was not achieved. One possible explanation is that the clinical variables used in this investigation were limited to only two that were available at this time. Therefore, enhancing prediction performance by integrating additional clinical variables, such as performance status score, human papillomavirus status, histological subtype, and others should be studied in the future.
Although a DL model achieved the relatively high balanced C-index of 0.743, as shown in Table 3, its predictive performance did not significantly outperform the handcrafted models when the C-indices in the training and test datasets are interpreted separately. In addition, there was no statistically significant difference in the treatment failure-free probability curves in the test dataset. Potential causes for the DL model’s limitations may include suboptimal network architecture and insufficiently tailored input data. In future work, we plan to explore more advanced or optimal network architecture [40] and refine the input data design.
The Betti numbers in this study provide a novel topological perspective on both tumor morphology and dose distribution. Betti numbers (b0 and b2), which quantify the number of connected components and cavities, respectively, may capture aspects of tumor spatial heterogeneity that are not reflected on conventional radiomics or dosiomics features. For instance, a high b2 value in a tumor may indicate internal necrosis or cavitation, which has been associated with poor prognosis in certain cancer types [41]. Similarly, Betti numbers can capture the complex patterns of dose distribution, such as hot and cold spots, which may correspond to dose conformity or coverage that may potentially affect the probability of tumor control [42]. The topological features could serve as surrogate markers for biological and clinical characteristics, such as tumor aggressiveness, hypoxia, or response to radiation. Although further biological validation is required, the integration of topological data may enhance our understanding of spatial patterns in radiation oncology and support the development of more personalized treatment strategies.
Local recurrence, locoregional recurrence, distant metastasis, and residual tumors were defined as treatment failures in this study, owing to the insufficient number of cases for each outcome. This study aimed to predict treatment failure in patients with local recurrence, locoregional recurrence, distant metastasis, or residual tumors. Treatment failure is primarily caused by tumor resistance. Resistant tumor cells can survive treatment (residual tumor), contribute to local recurrence or locoregional recurrence, or lead to the development of distant metastasis. Thus, our approach may be able to extract resistant tumor cells from the phenotype in medical images through a more detailed analysis in the future.
This study had some limitations. First, inter-observer variability in tumor delineation was not considered. This may affect the robustness and generalizability of the radiomics-based prediction models. Pavic et al. reported that the stability rate of radiomic features with respect to inter-observer delineation variability was 59% in HNSCC [43]. This could be due to the inclusion of several tumor sites. Therefore, it is necessary to limit the number of tumor sites used in the analysis as much as possible. Moreover, employing consensus-based approaches, such as obtaining agreement among multiple observers or expert consensus, may help mitigate inter-observer delineation variability. In addition, automated or semiautomated delineation techniques may address the problem of inter-observer variability.
Second, treatment planning can vary by facility, planner (i.e., oncologists and medical physicists), years of experience, and dose-calculation algorithms, leading to differences in the calculated dose distributions. This variability can affect the reliability and reproducibility of the dosiomics analyses. Bufacchi et al. calculated the target dose for nasopharyngeal carcinomas with the two dose-calculation algorithms [44]. As a result, the difference in tumor control probability reached 6.8%. Therefore, it is necessary to investigate the reliability and reproducibility of the dosiomics analysis of the prediction models in future studies.
Third, although the number of selected features was optimized for the construction of treatment failure prediction models, there is scope for further study on the optimization of the number of selected features by using other adaptive selection strategies. The optimization for DL model construction is also needed.
Finally, the treatment failure prediction model developed in this study is based on a limited number of patients with HNSCC (n = 224). Therefore, it may be crucial to ensure an appropriate number of patients in order to improve the performance of treatment failure prediction models. Thus, a longitudinal study with a larger sample size is required to assess the reliability of these results. Another limitation of this study is that, although it was designed to address HNSCC in general, the majority of the analyzed cases were oropharyngeal cancers. Therefore, the findings may primarily reflect the characteristics of oropharyngeal cancer. This should be considered when interpreting the results, and further studies involving more diverse tumor sites should be conducted in the future.

5. Conclusions

The proposed radiodosiomics model, using local binary pattern and topology, can be used to predict treatment failure prior to the treatment planning of CRT. Among various developed models, the CT-R, CT-L, DD-L, DD-T, DD-RT, DD-LT, and CD-RLT models showed a statistically significant stratification of risk groups and achieved high predictive performance. Although further study is needed to increase the number of cases, as well as external validation and combining more clinical variables, we believe that the proposed approach will contribute to the prediction of treatment failure in patients with HNSCC.

Author Contributions

Conceptualization, H.K. and H.A.; methodology, H.K. and H.A.; data curation, H.K.; writing—original draft preparation, H.K.; writing—review and editing, H.K. and H.A.; supervision, H.A.; funding acquisition, H.K. All authors have read and agreed to the published version of the manuscript.

Funding

This research was funded by JSPS KAKENHI, grant number JP22K15808.

Institutional Review Board Statement

Ethical review and approval were waived for this study. The reason is that TCIA, which was used in this study, is an open-access database and all data collected for this study were freely available for scientific research.

Informed Consent Statement

Not applicable.

Data Availability Statement

The image data are available at the following URL: “https://www.cancerimagingarchive.net/collection/hnscc/” (accessed on 28 May 2025) and “https://www.cancerimagingarchive.net/collection/head-neck-pet-ct/” (accessed on 28 May 2025). The data that support the findings of this study are not openly available and are available from the corresponding author on reasonable request.

Conflicts of Interest

The authors declare no conflicts of interest.

Abbreviations

The following abbreviations are used in this manuscript:
AUBCArea under the Betti number curve
AUCArea under the receiver operator characteristic curve
CDComputed tomography and dose distribution
C-indexConcordance index
CPHCox proportional hazard
CRTChemoradiotherapy
CTComputed tomography
DDDose distributions
DLDeep learning
DMDistant metastasis
GLCMGray-level cooccurrence matrix
GLRLMGray-level run length matrix
GLSZMGray-level size zone matrix
GTVGross tumor volume
HNSCCHead-and-neck squamous cell carcinoma
HUHounsfield unit
LASSOLeast absolute shrinkage and selection operator
LBPLocal binary pattern
LRLocal recurrence
LRRLocoregional recurrence
NGTDMNeighborhood gray-tone matrix
PETPositron emission tomography
PSPatch size
Rad-scoreRadiomics score
ResNetResidual network
RTRadiotherapy
SFSelected feature
SMOTESynthetic minority oversampling technique
TFTreatment failure
TNMTumor, lymph node, metastasis
TRIPODTransparent reporting of a multivariable prediction model for individual prognosis or diagnosis
WDWavelet decomposition

References

  1. Kono, M.; Ishihara, R.; Kato, Y.; Miyake, M.; Shoji, A.; Inoue, T.; Matsueda, K.; Waki, K.; Fukuda, H.; Shimamoto, Y.; et al. Diagnosis of pharyngeal cancer on endoscopic video images by Mask region-based convolutional neural network. Dig. Endosc. 2021, 33, 569–576. [Google Scholar] [CrossRef] [PubMed]
  2. Petit, C.; Lacas, B.; Pignon, J.-P.; Le, Q.T.; Grégoire, V.; Grau, C.; Hackshaw, A.; Zackrisson, B.; Parmar, M.K.B.; Lee, J.-W.; et al. Chemotherapy and radiotherapy in locally advanced head and neck cancer: An individual patient data network meta-analysis. Lancet Oncol. 2021, 22, 727–736. [Google Scholar] [CrossRef] [PubMed]
  3. Forastiere, A.A.; Zhang, Q.; Weber, R.S.; Maor, M.H.; Goepfert, H.; Pajak, T.F.; Morrison, W.; Glisson, B.; Trotti, A.; Ridge, J.A.; et al. Long-term results of RTOG 91-11: A comparison of three nonsurgical treatment strategies to preserve the larynx in patients with locally advanced larynx cancer. J. Clin. Oncol. 2013, 31, 845–852. [Google Scholar] [CrossRef] [PubMed]
  4. Cooper, J.S.; Zhang, Q.; Pajak, T.F.; Forastiere, A.A.; Jacobs, J.; Saxman, S.B.; Kish, J.A.; Kim, H.E.; Cmelak, A.J.; Rotman, M.; et al. Long-term follow-up of the RTOG 9501/intergroup phase III trial: Postoperative concurrent radiation therapy and chemotherapy in high-risk squamous cell carcinoma of the head and neck. Int. J. Radiat. Oncol. Biol. Phys. 2012, 84, 1198–1205. [Google Scholar] [CrossRef]
  5. Bernier, J.; Domenge, C.; Ozsahin, M.; Matuszewska, K.; Lefèbvre, J.-L.; Greiner, R.H.; Giralt, J.; Maingon, P.; Rolland, F.; Bolla, M.; et al. European Organization for Research and Treatment of Cancer Trial 22931. Postoperative irradiation with or without concomitant chemotherapy for locally advanced head and neck cancer. N. Engl. J. Med. 2004, 350, 1945–1952. [Google Scholar] [CrossRef]
  6. Brockstein, B.; Haraf, D.J.; Rademaker, A.W.; Kies, M.S.; Stenson, K.M.; Rosen, F.; Mittal, B.B.; Pelzer, H.; Fung, B.B.; Witt, M.-E.; et al. Patterns of failure, prognostic factors and survival in locoregionally advanced head and neck cancer treated with concomitant chemoradiotherapy: A 9-year, 337-patient, multi-institutional experience. Ann. Oncol. 2004, 15, 1179–1186. [Google Scholar] [CrossRef]
  7. Denis, F.; Garaud, P.; Bardet, E.; Alfonsi, M.; Sire, C.; Germain, T.; Bergerot, P.; Rhein, B.; Tortochaux, J.; Calais, G. Final results of the 94-01 French Head and Neck Oncology and Radiotherapy Group randomized trial comparing radiotherapy alone with concomitant radiochemotherapy in advanced-stage oropharynx carcinoma. J. Clin. Oncol. 2004, 22, 69–76. [Google Scholar] [CrossRef]
  8. Keek, S.; Sanduleanu, S.; Wesseling, F.; de Roest, R.; Brekel, M.; van der Heijden, M.; Vens, C.; Giuseppina, C.; Licitra, L.; Scheckenbach, K.; et al. Computed tomography-derived radiomic signature of head and neck squamous cell carcinoma (peri)tumoral tissue for the prediction of locoregional recurrence and distant metastasis after concurrent chemo-radiotherapy. PLoS ONE 2020, 15, e0232639, Erratum in PLoS ONE 2020, 15, e0237048. [Google Scholar] [CrossRef]
  9. Wu, A.; Li, Y.; Qi, M.; Lu, X.; Jia, Q.; Guo, F.; Dai, Z.; Liu, Y.; Chen, C.; Zhou, L.; et al. Dosiomics improves prediction of locoregional recurrence for intensity modulated radiotherapy treated head and neck cancer cases. Oral Oncol. 2020, 104, 104625. [Google Scholar] [CrossRef]
  10. Kamezawa, H.; Arimura, H. Recurrence prediction with local binary pattern-based dosiomics in patients with head and neck squamous cell carcinoma. Phys. Eng. Sci. Med. 2023, 46, 99–107. [Google Scholar] [CrossRef]
  11. Kamezawa, H.; Arimura, H.; Yasumatsu, R.; Ninomiya, K.; Haseai, S. Preoperative and non-invasive approach for radiomic biomarker-based prediction of malignancy grades in patients with parotid gland cancer in magnetic resonance images. Med. Imaging Inf. Sci. 2020, 37, 66–74. [Google Scholar] [CrossRef]
  12. Ikushima, K.; Arimura, H.; Yasumatsu, R.; Kamezawa, H.; Ninomiya, K. Topology-based radiomic features for prediction of parotid gland cancer malignancy grade in magnetic resonance images. Magn. Reson. Mater. Phys. Biol. Med. 2023, 36, 767–777. [Google Scholar] [CrossRef]
  13. Le, Q.C.; Arimura, H.; Ninomiya, K.; Kodama, T.; Moriyama, T. Can Persistent Homology Features Capture More Intrinsic Information about Tumors from 18F-Fluorodeoxyglucose Positron Emission Tomography/Computed Tomography Images of Head and Neck Cancer Patients? Metabolites 2022, 12, 972. [Google Scholar] [CrossRef]
  14. Huynh, B.N.; Groendahl, A.R.; Tomic, O.; Liland, K.H.; Knudtsen, I.S.; Hoebers, F.; van Elmpt, W.; Malinen, E.; Dale, E.; Futsaether, C.M. Head and neck cancer treatment outcome prediction: A comparison between machine learning with conventional radiomics features and deep learning radiomics. Front. Med. 2023, 10, 1217037. [Google Scholar] [CrossRef]
  15. Mossinelli, C.; Tagliabue, M.; Ruju, F.; Cammarata, G.; Volpe, S.; Raimondi, S.; Zaffaroni, M.; Isaksson, J.L.; Garibaldi, C.; Cremonesi, M.; et al. The role of radiomics in tongue cancer: A new tool for prognosis prediction. Head Neck 2023, 45, 849–861. [Google Scholar] [CrossRef]
  16. Nakane, K.; Tsuchihashi, Y.; Matsuura, N. A simple mathematical model utilizing topological invariants for automatic detection of tumor areas in digital tissue images. Diagn. Pathol. 2013, 8, S27. [Google Scholar] [CrossRef]
  17. Nakane, K.; Takiyama, A.; Mori, S.; Matsuura, N. Homology-based method for detecting regions of interest in colonic digital images. Diagn. Pathol. 2015, 10, 36. [Google Scholar] [CrossRef]
  18. Pranav, P.; van de Weygaert, R.; Vegter, G.; Jones, B.J.T.; Adler, R.J.; Feldbrugge, J.; Park, C.; Buchert, T.; Kerber, M. Topology and geometry of Gaussian random fields I: On Betti numbers, Euler characteristic, and Minkowski functionals. Mon. Not. R. Astron. Soc. 2019, 485, 4167–4208. [Google Scholar] [CrossRef]
  19. Grossberg, A.; Elhalawani, H.; Mohamed, A.; Mulder, S.; Williams, B.; White, A.L.; Zafereo, J.; Wong, A.J.; Berends, J.E.; AboHashem, S.; et al. HNSCC [Dataset]. The Cancer Imaging Archive. 2020. Available online: https://www.cancerimagingarchive.net/collection/hnscc/ (accessed on 16 June 2025). [CrossRef]
  20. Grossberg, A.J.; Mohamed, A.S.R.; Elhalawani, H.; Bennett, W.C.; Smith, K.E.; Nolan, T.S.; Williams, B.; Chamchod, S.; Heukelom, J.; Kantor, M.E.; et al. Imaging and Clinical Data Archive for Head and Neck Squamous Cell Carcinoma Patients Treated with Radiotherapy. Sci. Data 2018, 5, 180173. [Google Scholar] [CrossRef]
  21. Elhalawani, H.; Mohamed, A.S.R.; White, A.L.; Zafereo, J.; Wong, A.J.; Berends, J.E.; AboHashem, S.; Williams, B.; Aymard, J.M.; Kanwar, A. Matched computed tomography segmentation and demographic data for oropharyngeal cancer radiomics challenges. Sci. Data 2017, 4, 170077. [Google Scholar] [CrossRef]
  22. Vallières, M.; Kay-Rivest, E.; Perrin, L.J.; Liem, X.; Furstoss, C.; Khaouam, N.; Nguyen-Tan, P.F.; Wang, C.S.; Sultanem, K. Head-Neck-PET-CT [Dataset]. The Cancer Imaging Archive. 2017. Available online: https://www.cancerimagingarchive.net/collection/head-neck-pet-ct/ (accessed on 16 June 2025). [CrossRef]
  23. Vallières, M.; Kay-Rivest, E.; Perrin, L.J.; Liem, X.; Furstoss, C.; Aerts, H.J.W.L.; Khaouam, N.; Nguyen-Tan, P.F.; Wang, C.-S.; Sultanem, K.; et al. Radiomics strategies for risk assessment of tumour failure in head-and-neck cancer. Sci. Rep. 2017, 7, 10117. [Google Scholar] [CrossRef] [PubMed]
  24. Clark, K.; Vendt, B.; Smith, K.; Freymann, J.; Kirby, J.; Koppel, P.; Moore, S.; Phillips, S.; Maffitt, D.; Pringle, M.; et al. The Cancer Imaging Archive (TCIA): Maintaining and Operating a Public Information Repository. J. Digit. Imaging 2013, 26, 1045–1057. [Google Scholar] [CrossRef] [PubMed]
  25. Moons, K.G.M.; Altman, D.G.; Reitsma, J.B.; Ioannidis, J.P.A.; Macaskill, P.; Steyerberg, E.W.; Vickers, A.J.; Ransohoff, D.F.; Collins, G.S. Transparent Reporting of a multivariable prediction model for Individual Prognosis or Diagnosis (TRIPOD): Explanation and elaboration. Ann. Intern. Med. 2015, 162, W1–W73. [Google Scholar] [CrossRef] [PubMed]
  26. Chawla, N.V.; Bowyer, K.W.; Hall, L.O.; Kegelmeyer, W.P. SMOTE: Synthetic minority over-sampling technique. J. Artif. Intell. Res. 2002, 16, 321–357. [Google Scholar] [CrossRef]
  27. Gillison, M.L.; Trotti, A.M.; Harris, J.; Eisbruch, A.; Harari, P.M.; Adelstein, D.J.; Jordan, R.C.K.; Zhao, W.; Sturgis, E.M.; Burtness, B.; et al. Radiotherapy plus cetuximab or cisplatin in human papillomavirus-positive oropharyngeal cancer (NRG Oncology RTOG 1016): A randomised, multicentre, non-inferiority trial. Lancet 2019, 393, 40–50. [Google Scholar] [CrossRef]
  28. Haralick, R.M.; Shanmugam, K.; Dinstein, I.H. Textural Features for Image Classification. IEEE Trans. Syst. Man. Cybern. 1973, 6, 610–621. [Google Scholar] [CrossRef]
  29. Galloway, M.M. Texture classification using gray level run length. Comput. Graph. Image Process. 1975, 4, 172–179. [Google Scholar] [CrossRef]
  30. Thibault, G.; Fertil, B.; Navarro, C.; Pereira, F.; Cau, P.; Levy, N.; Sequeira, J.; Mari, J.L. Texture indexes and gray level size zone matrix application to cell nuclei classification. In Proceedings of the Pattern Recognition and Information Processing, Minsk, Belarus, 19–21 May 2009; pp. 140–145. [Google Scholar]
  31. Amadasun, M.; King, R. Textural features corresponding to textural properties. IEEE Trans. Syst. Man Cybern. 1989, 19, 1264–1274. [Google Scholar] [CrossRef]
  32. Mallat, S.G. A theory for multiresolution signal decomposition: The wavelet representation. IEEE Trans. Pattern Anal. Mach. Intell. 1989, 11, 674–693. [Google Scholar] [CrossRef]
  33. Ojala, T.; Pietikainen, M.; Maenpaa, T. Multiresolution gray-scale and rotation invariant texture classification with local binary patterns. IEEE Trans. Pattern Anal. Mach. Intell. 2002, 24, 971–987. [Google Scholar] [CrossRef]
  34. Szegedy, C.; Ioffe, S.; Vanhoucke, V.; Alemi, A. Inception-v4, inception-resnet and the impact of residual connections on learning. In Proceedings of the AAAI Conference on Artificial Intelligence, San Francisco, CA, USA, 4–9 February 2017; Volume 31, pp. 4278–4284. [Google Scholar] [CrossRef]
  35. Russakovsky, O.; Deng, J.; Su, H.; Krause, J.; Satheesh, S.; Ma, S.; Huang, Z.; Karpathy, A.; Khosla, A.; Bernstein, M.; et al. ImageNet Large Scale Visual Recognition Challenge. Int. J. Comput. Vis. 2015, 115, 211–252. [Google Scholar] [CrossRef]
  36. Tanaka, S.; Kadoya, N.; Sugai, Y.; Umeda, M.; Ishizawa, M.; Katsuta, Y.; Ito, K.; Takeda, K.; Jingu, K. A deep learning-based radiomics approach to predict head and neck tumor regression for adaptive radiotherapy. Sci. Rep. 2022, 12, 8899. [Google Scholar] [CrossRef] [PubMed]
  37. Arimura, H.; Soufi, M.; Ninomiya, K.; Kamezawa, H.; Yamada, M. Potentials of radiomics for cancer diagnosis and treatment in comparison with computer-aided diagnosis. Radiol. Phys. Technol. 2018, 11, 365–374. [Google Scholar] [CrossRef] [PubMed]
  38. Karabacak, M.; Patil, S.; Feng, R.; Shrivastava, R.K.; Margetis, K. A large scale multi institutional study for radiomics driven machine learning for meningioma grading. Sci. Rep. 2024, 14, 26191. [Google Scholar] [CrossRef]
  39. Zhai, T.-T.; Langendijk, J.A.; van Dijk, L.V.; Halmos, G.B.; Witjes, M.J.; Oosting, S.F.; Noordzij, W.; Sijtsema, N.M.; Steenbakkers, R.J. The prognostic value of CT-based image-biomarkers for head and neck cancer patients treated with definitive (chemo-)radiation. Oral Oncol. 2019, 95, 178–186. [Google Scholar] [CrossRef]
  40. Jiang, L.; Xu, C.; Bai, Y.; Liu, A.; Gong, Y.; Wang, Y.-P.; Deng, H.-W. Autosurv: Interpretable deep learning framework for cancer survival analysis incorporating clinical and multi-omics data. npj Precis. Oncol. 2024, 8, 4. [Google Scholar] [CrossRef]
  41. Moon, C.; Li, Q.; Xiao, G. Using persistent homology topological features to characterize medical images: Case studies on lung and brain cancers. Ann. Appl. Stat. 2023, 17, 2192–2211. [Google Scholar] [CrossRef]
  42. Morgan, H.E.; Sher, D.J. Adaptive radiotherapy for head and neck cancer. Cancers Head Neck 2020, 5, 1. [Google Scholar] [CrossRef]
  43. Pavic, M.; Bogowicz, M.; Würms, X.; Glatz, S.; Finazzi, T.; Riesterer, O.; Roesch, J.; Rudofsky, L.; Friess, M.; Veit-Haibach, P.; et al. Influence of inter-observer delineation variability on radiomics stability in different tumor sites. Acta Oncol. 2018, 57, 1070–1074. [Google Scholar] [CrossRef]
  44. Bufacchi, A.; Caspiani, O.; Rambaldi, G.; Marmiroli, L.; Giovinazzo, G.; Polsoni, M. Clinical implication in the use of the AAA algorithm versus the AXB in nasopharyngeal carcinomas by comparison of TCP and NTCP values. Radiat. Oncol. 2020, 15, 150. [Google Scholar] [CrossRef]
Figure 1. Example CT and binary images of non-treatment failure: Non-TF (upper) and treatment failure: TF cases (lower). Red circle represents the cancer region.
Applsci 15 06941 g001
Figure 2. Overall study procedure.
Applsci 15 06941 g002
Figure 3. Example of Betti number curves describing the change in b0 (left), b2 (middle), and b2/b0 (right) as a function of threshold value in CT for four cases. CR: complete response, TF: treatment failure.
Applsci 15 06941 g003
Figure 4. Treatment failure-free probability curves of CT-R (a), CT-L (b), DD-L (c), DD-T (d), DD-RT (e), DD-LT (f) and CD-RLT (g) models in the training (left) and test dataset (right). Yellow line: High-risk group, blue line: Low-risk group. The dash line represents 95% confidence interval.
Applsci 15 06941 g004
Table 1. Patients’ characteristics.
TrainingTestp-Value
Total number of cases14032
Age
[y, min–max (median)]
29–91 (62)49–82 (64)0.23 *
Sex 0.28 +
Male11124
Female298
Stage 0.75 +
III186
IV12226
Tumor site 0.50 +
Nasopharynx52
Oropharynx12528
Hypopharynx102
Tumor status after CRT 1.00 +
Treatment failure28 (112 )16
Complete response11216
Treatment failure-free survival time
[y, min–max (median)]
0.39–8.64 (3.80)0.46–8.62 (3.08)0.08 *
CRT: chemoradiotherapy. Number of augmented data, * Mann–Whitney U-test, + Fisher’s exact test.
Table 2. Extracted features.
CategoryDataFeatureNo. of Features
RCTFirst-order features14
Texture features (GLCM, GLRLM, GLSZM, and NGTDM)40
Wavelet decomposition features432
DDFirst-order features14
Texture features (GLCM, GLRLM, GLSZM, and NGTDM)40
Cold spot volume1
LCTFirst-order features14
Texture features (GLCM, GLRLM, GLSZM, and NGTDM)40
DDFirst-order features14
Texture features (GLCM, GLRLM, GLSZM, and NGTDM)40
TCTBetti number (b0, b2, and b2/b0)303
Area under the Betti number curve3
Maximum Betti number3
DDBetti number (b0, b2, and b2/b0)63
Area under the Betti number curve3
Maximum Betti number3
Total1027
R: radiomic feature, L: local binary pattern feature, T: topological feature, CT: computed tomography, DD: dose distribution, GLCM: gray-level co-occurrence matrix, GLRLM: gray-level run length matrix, GLSZM: gray-level size zone matrix, NGTDM: neighborhood gray tone matrix.
Table 3. Performances of treatment failure prediction models.
ModelOptimal Number of FeaturesC-IndexBalanced
C-Index
Statistically Significant Differences
TrainingTestTrainingTest
CT-R30.7260.6410.684****
CT-L30.6350.7450.690*****
CT-T120.6880.6470.668***n.s.
CT-RL20.7050.6140.660***n.s.
CT-RT40.7040.6160.660***n.s.
CT-LT140.7530.5950.674***n.s.
CT-RLT50.7470.5970.672***n.s.
DD-R20.5720.6220.597**n.s.
DD-L50.6700.6410.656****
DD-T90.7430.7600.752****
DD-RL80.5960.5530.575**n.s.
DD-RT70.7300.7470.739****
DD-LT210.6790.7560.718****
DD-RLT180.7640.6190.692***n.s.
CD-R20.7040.6250.665***n.s.
CD-L130.6940.5920.643***n.s.
CD-T60.6010.7340.668**n.s.
CD-RL20.7020.6300.666***n.s.
CD-RT50.6480.6300.639***n.s.
CD-LT180.7800.6110.696***n.s.
CD-RLT220.8340.6440.739****
DL170.7760.7100.743***n.s.
CT: computed tomography, DD: dose distribution, CD: combined CT with DD, DL: deep learning. *: p < 0.05, **: p < 0.01, ***: p < 0.001, n.s.: not significant.
Table 4. Comparison of performance with and without clinical variables in the treatment failure prediction models.
ModelBalanced
C-Index
Without
Clinical Variables
With
Clinical Variables
CT-R0.6840.650
CT-L0.6900.627
DD-L0.6560.521
DD-T0.7520.751
DD-RT0.7390.728
DD-LT0.7180.683
CD-RLT0.7390.541
CT: computed tomography, DD: dose distribution, CD: combined CT with DD.
Disclaimer/Publisher’s Note: The statements, opinions and data contained in all publications are solely those of the individual author(s) and contributor(s) and not of MDPI and/or the editor(s). MDPI and/or the editor(s) disclaim responsibility for any injury to people or property resulting from any ideas, methods, instructions or products referred to in the content.

