Article

Experimental Study on Glass Deformation Calculation Using the Holographic Interferometry Double-Exposure Method

Department of Avionics Engineering, Aviation Maintenance NCO Academy of Air Force Engineering University, Xinyang 464000, China
*
Author to whom correspondence should be addressed.
Appl. Sci. 2025, 15(12), 6938; https://doi.org/10.3390/app15126938
Submission received: 28 April 2025 / Revised: 17 June 2025 / Accepted: 17 June 2025 / Published: 19 June 2025

Abstract

This study systematically compares the metrological characteristics of single- exposure, double-exposure, and continuous-exposure holographic interferometry for micro-deformation detection. Results demonstrate that the double-exposure method achieves optimal balance across critical performance metrics through its ideal cosine fringe field modulation. This approach (1) eliminates object wave amplitude interference via dual-exposure superposition, establishing submicron linear mapping between fringe displacement and deformation amplitude; (2) introduces a fringe gradient-based direction detection algorithm resolving deformation vector ambiguity; and (3) implements an error-compensated fusion framework integrating theoretical modeling, MATLAB 2015b simulations, and experimental validation. Experiments on drilled glass samples confirm their superior performance in terms of near-ideal fringe contrast (1.0) and noise suppression (0.06). The technique significantly improves real-time capability and anti-interference robustness in micro-deformation monitoring, providing a validated solution for MEMS and material mechanics characterization.

1. Introduction

Holographic interferometry has been extensively applied in the precise measurement of micro-deformations. This technique determines material deformation by quantifying the number of fringe shifts [1]. Currently, it has found widespread applications across multiple domains including deformation analysis of mechanical components [2,3], dynamic monitoring of temperature fields in heated fluids, three-dimensional thermal field visualization [4], and solution concentration measurement [5], thereby underscoring its significance in scientific research. Recent advancements in digital holographic interferometry have demonstrated substantial progress in technical optimization and application expansion. Three distinct exposure methodologies—single-exposure, double-exposure, and continuous-exposure techniques—have been developed, each tailored for specific measurement requirements and operational scenarios. The single-exposure method, primarily implemented in off-axis holographic configurations, records holograms through a single exposure and isolates target image spectra via spatial filtering, offering applicability in dynamic measurements [6]. Its key achievement lies in enabling high-sensitivity phase measurements of transparent objects with nanometer-level axial resolution [7]. However, limitations include stringent holographic plate repositioning requirements to avoid phase errors and susceptibility to environmental vibrations/noise-induced fringe contrast degradation. In contrast, the double-exposure method records pre- and post-deformation holograms on a single plate, analyzing displacement through interferometric fringes with operational simplicity and high contrast [8,9]. It has achieved submicron-level accuracy in rock fracture and MEMS (micro-electro-mechanical system) deformation analyses [10], yet its reliance on manual dual-hologram recording restricts real-time dynamic measurement capabilities. The continuous-exposure method captures time-averaged interferograms during prolonged exposure of vibrating objects, enabling full-field vibration visualization with optical wavelength-level precision in mechanical/acoustic studies [11,12,13]. However, its implementation demands exceptional light source stability and precise exposure control. Future directions emphasize breakthroughs in dynamic adaptability, noise suppression, and phase distortion mitigation, with proposed integrations of deep learning algorithms and dual-wavelength holography [14,15] to enhance real-time monitoring precision, system integration, and anti-noise robustness.
The single-exposure method enables real-time detection with nanometer-level resolution, yet requires precise optical alignment and is susceptible to environmental noise. The continuous-exposure method can capture full-field vibration, but demands extreme stability and involves complex processing. The double-exposure method exhibits superior fringe contrast and signal-to-noise ratio compared to single-exposure and time-averaged exposure techniques. Through systematic comparison of the three exposure methodologies, we fundamentally reveal that the fringe field characteristics, exclusively governed by cosine function modulation in double-exposure holography, effectively eliminate the influence of object wave amplitude on interference patterns, thereby establishing its theoretical predominance.
A tripartite detection framework integrating “double-exposure measurement–deformation theoretical modeling–MATLAB 2015b simulation verification” was developed, achieving enhanced detection efficiency and superior detail preservation in glass drilling deformation analysis. The proposed multi-dimensional cross-validation mechanism synergistically combines experimental data with numerical simulations, enabling the construction of a dynamic error compensation model that reduces measurement uncertainty through real-time calibration between theoretical calculations and simulation results.
These innovations systematically address three critical challenges in holographic interferometry: (1) fringe pattern optimization through amplitude-independent modulation; (2) enhanced phase unwrapping accuracy in phase reconstruction [16]; and (3) quantitative detection of complex deformations via error-compensated hybrid methodology. The proposed theoretical framework and experimental protocol offer novel methodological insights for precision optical metrology, demonstrating strong consistency between theoretical predictions and empirical observations in validation studies.

2. Theoretical Analysis

2.1. Principle of Single-Exposure Method

Figure 1 illustrates the schematic diagram of the single-exposure method. The procedure involves first recording the optical field O ˜ of the object in its initial state. Subsequently, the hologram is illuminated with the original reference beam to reconstruct the optical field O ˜ , which then interferes with the modified optical field O ˜ generated after the object undergoes changes. This interference enables the detection of variations in the object.
The hologram is formed by the interference between reference beam R ˜ and object beam O ˜ :
I = R ˜ + O ˜ 2 = R ˜ 2 + O ˜ 2 + R ˜ * O ˜ + R ˜ O ˜ *
During detection, only the modified object beam O ˜ (after object alteration) illuminates the hologram I, reconstructing the optical field:
U ˜ 0 = O ˜ I = O ˜ ( R ˜ 2 + O ˜ 2 + R ˜ * O ˜ + R ˜ O ˜ * ) = O ˜ ( R ˜ 2 + O ˜ 2 ) + R ˜ * O ˜ O ˜ + R ˜ O ˜ O ˜ * = U ˜ 0 o + U ˜ 0 1 + U ˜ 01
In the equation, U ˜ 0 o = O ˜ ( R ˜ 2 + O ˜ 2 ) , U ˜ 0 1 = R ˜ * O ˜ O ˜ , U ˜ 01 = R ˜ O ˜ O ˜ * .
When the detection system illuminates hologram I, solely with the recorded reference beam R ˜ , the reconstructed optical field becomes
U ˜ R = R ˜ I = R ˜ ( R ˜ 2 + O ˜ 2 + R ˜ * O ˜ + R ˜ O ˜ * ) = R ˜ ( R ˜ 2 + O ˜ 2 ) + O ˜ + R ˜ R ˜ O ˜ * = U ˜ R o + U ˜ R 1 + U ˜ R 1
In the equation, U ˜ R o = R ˜ ( R ˜ 2 + O ˜ 2 ) , U ˜ R 1 = O ˜ , U ˜ R 1 = R ˜ R ˜ O ˜ * .
After single-exposure processing, the transmittance function of the hologram is expressed as
T = α β t 0 I ( x , y )
In Equation (4), T denotes the amplitude transmittance of the hologram, describing the intensity attenuation of light passing through the holographic plate. α represents the initial transmittance of the unexposed plate, determined by the substrate material and independent of photosensitive reactions. β signifies the sensitivity coefficient of the recording medium, characterizing the change in transmittance per unit of exposure energy. t0 indicates the exposure time. I(x,y) corresponds to the interference intensity between the object wave and reference wave.
Upon re-illumination with the original reference beam, the complex amplitude of the diffracted field recorded through the hologram is
A 1 ( x , y ) = T ( x , y ) U R ( x , y ) + U o ( x , y )
In Equation (5), A1(x,y) represents the complex amplitude of the diffracted optical field; T(x,y) is the single-exposure hologram transmittance function; UR(x,y) denotes the complex amplitude distribution of the reconstructed optical field when the hologram I is illuminated solely by the reference beam R ˜ ; and U o ( x , y ) refers to the deformed object optical field.
The complex amplitude of the transmitted diffracted wave through the hologram is derived as
E ( x , y ) = T ( x , y ) · U R x , y
In Equation (6), E(x,y) denotes the complex amplitude of the diffracted optical wave at the observation plane (x,y) after passing through the hologram; T(x,y) denotes the amplitude transmittance function of the hologram; and UR(x,y) denotes the complex amplitude distribution of the reconstructed optical field when the hologram I is illuminated solely by the reference beam R ˜ .
Extracting the first-order diffraction term from Equation (6) yields
T 1 = ε U o ( x , y ) β t 0 U R ( x , y ) U o ( x , y )
In Equation (7), T1 denotes the complex amplitude of the first-order diffraction term of the hologram, and ε denotes the coefficient related to the intensity of the reference beam.
The intensity calculated from Equation (7) is
I ( x , y ) = T 1 · T 1 * = ε 2 + β 2 t 0 2 a R 4 a 0 2 2 ε β t 0 a R 2 a 0 2 cos ϕ ( x , y ) ϕ 0 ( x , y )
In Equation (8), aR denotes the amplitude of the reference beam; a0 denotes the amplitude of the object beam; and ϕ ( x , y ) ϕ 0 ( x , y ) is the phase difference induced by object deformation. In ϕ ( x , y ) ϕ 0 ( x , y ) = 2 π λ · δ , δ denotes the optical path change; bright fringes occur when δ = N λ and dark fringes occur when δ = N + 1 2 λ .
In the single-exposure method, dynamic interference patterns can be directly observed or recorded by using a camera for subsequent quantitative analysis. This approach facilitates real-time monitoring and evaluation of time-varying object deformations or displacements.

2.2. Principle of Double-Exposure Method

Figure 2 depicts the schematic diagram of the double-exposure method.
The double-exposure method involves two sequential recordings. First, the optical field O ˜ of the object in its initial state is recorded by interfering with it using reference beam R ˜ , forming hologram I:
I = R ˜ + O ˜ 2 = R ˜ 2 + O ˜ 2 + R ˜ * O ˜ + R ˜ O ˜ *
Subsequently, after the object undergoes deformation, the modified optical field O ˜ (with identical exposure parameters) is recorded by using the same reference beam R ˜ , generating hologram I :
I = R ˜ + O ˜ 2 = R ˜ 2 + O ˜ 2 + R ˜ * O ˜ + R ˜ O ˜ *
By analyzing and counting the interference fringes, the wavefront variation can be quantified, thereby determining changes in the measured physical quantities.
Unlike the single-exposure method, the holographic plate is exposed twice, resulting in a composite hologram IH expressed as
I H = I + I = 2 R ˜ 2 + O ˜ 2 + O ˜ 2 + R ˜ * O ˜ + R ˜ O ˜ * + R ˜ * O ˜ + R ˜ O ˜ *
During reconstruction, the hologram is illuminated with the original reference beam R ˜ , producing the following optical fields:
U ˜ = R ˜ I H = R ˜ ( 2 R ˜ 2 + O ˜ 2 + O ˜ 2 + R ˜ * O ˜ + R ˜ O ˜ * + R ˜ * O ˜ + R ˜ O ˜ * ) = R ˜ ( 2 R ˜ 2 ) + R ˜ ( O ˜ 2 + O ˜ 2 ) + R ˜ R ˜ * ( O ˜ + O ˜ ) + R ˜ R ˜ ( O ˜ * + O ˜ * ) = U ˜ 1 + U ˜ 2 + U ˜ 3 + U ˜ 4
In the equation, U ˜ 1 = R ˜ ( 2 R ˜ 2 ) , U ˜ 2 = R ˜ ( O ˜ 2 + O ˜ 2 ) , U ˜ 3 = R ˜ R ˜ * ( O ˜ + O ˜ ) and U ˜ 4 = R ˜ R ˜ ( O ˜ * + O ˜ * ) . As shown in Figure 2c, for U ˜ 3 = R ˜ R ˜ * ( O ˜ + O ˜ ) , the propagation direction deviates from the conjugate path of the original object beam. By extending the deviated beam backward, a virtual image with visible interference fringes can be observed.
For U ˜ 4 = R ˜ R ˜ ( O ˜ * + O ˜ * ) , the propagation direction deviates from the conjugate path of the original object beam. The intersection of these deviated beams forms a real image with measurable interference fringes.
Double-exposure holographic interferometry is the most widely used quantitative method for analyzing surface deformations or displacements [17]. Specifically, it records holograms of the object before and after deformation on the same plate, which are later reconstructed under identical optical conditions. Observing through the hologram reveals interference fringes generated by the superposition of object waves from the two states. These fringes represent contour lines of equal displacement along the measurement sensitivity direction.
The complex amplitudes of the reference wave and object waves (before and after deformation) are denoted as UR(x,y), Uo(x,y), and U o x , y , respectively.
U o x , y = a o x , y exp j ϕ o x , y
U o x , y = a o x , y exp j ϕ x , y
U R x , y = a R x , y exp j ϕ R x , y
For small deformations, the amplitude of the object wave remains unchanged, while its phase undergoes a measurable shift.
First exposure: The recorded complex amplitude and intensity on the hologram are
A 1 ( x , y ) = U o x , y + U R x , y
I 1 ( x , y ) = A 1 ( x , y ) · A 1 * ( x , y ) = U o x , y + U R x , y · U o x , y + U R x , y *
Second exposure: The complex amplitude and intensity distribution obtained on the same hologram are
A 2 ( x , y ) = U o x , y + U R x , y
I 2 ( x , y ) = A 2 ( x , y ) · A 2 * ( x , y ) = U o x , y + U R x , y · U o x , y + U R x , y *
Assuming equal exposure time t0, the total energy recorded on the hologram is
B ( x , y ) = I 1 ( x , y ) + I 2 ( x , y ) · t 0
The amplitude transmittance of the hologram is
T ( x , y ) = α β · B ( x , y ) = α β · I 1 ( x , y ) + I 2 ( x , y ) · t 0
For the holographic reconstruction of the above equation, the complex amplitude of the diffracted light wave passing through the hologram is
E ( x , y ) = T ( x , y ) · U R x , y = α U R x , y β · I 1 ( x , y ) + I 2 ( x , y ) · t 0 · U R x , y
Simplifying this expression yields three terms:
E ( x , y ) = α 2 β t 0 ( a o 2 + a R 2 ) U R β t 0 a R 2 a o exp j ϕ o x , y + exp j ϕ x , y β t 0 a R 2 a o exp j ( ϕ o x , y 2 ϕ R x , y ) + exp j ( ϕ x , y 2 ϕ R x , y )
The first term of the equation represents the transmitted wave, propagating along the original reference beam direction.
The second term of the equation represents the first-order diffraction wave, which is a coherent superposition of the object waves before and after deformation, and is critical for interferometric analysis.
The third term of the equation represents the conjugate object wave, propagating in the opposite direction.
The first-order diffraction term (denoted as T 1 ( x , y ) ) is expressed as
T 1 ( x , y ) = β t 0 a R 2 a o exp j ϕ o x , y + exp j ϕ x , y = β t 0 a R 2 [ U o x , y + U o x , y ]
The corresponding intensity is
I ( x , y ) = I 0 1 + cos Δ ϕ ( x , y ) = 2 I 0 cos 2 Δ ϕ ( x , y ) 2
where Δ ϕ ( x , y ) = ϕ x , y ϕ o x , y represents the phase difference caused by deformation.
In the equation, I 0 = 2 β 2 t 0 2 a R 4 a o 2 .
I ( x , y ) = 4 β 2 t 0 2 a R 4 a o 2 cos 2 Δ ϕ ( x , y ) 2 = 4 β 2 t 0 2 a R 4 a o 2   cos ( Δ ϕ ( x , y ) ) + 1
Phase decoupling occurs via the arccosine operation, as shown below:
Δ ϕ ( x , y ) = I ( x , y ) 4 β 2 t 0 2 a R 4 a o 2 1
Here, Δ ϕ ( x , y ) is defined only for angles between 0 and π in Equation (27).
According to Equation (25), the intensity function of double exposure is a light field modulated by a cosine function.
By comparing the intensity formulas of the single-exposure method (Equation (8)) and the double-exposure method (Equation (25)), it is evident that the latter provides significantly enhanced fringe visibility and reduced noise [18,19].
Fringe extrema:
Δ ϕ ( x , y ) = 2 n π Δ ϕ ( x , y ) = ( 2 n + 1 ) π n = 0 , ± 1 , ± 2 , n = 0 , ± 1 , ± 2 , I ( x , y ) = I max ( x , y ) = 2 I 0 I ( x , y ) = I min ( x , y ) = 0     Bright   stripes     Dark   stripes
Fringe contrast:
V = I max ( x , y ) I min ( x , y ) I max ( x , y ) + I min ( x , y ) = 1
In double-exposure holography, interference patterns are perfectly modeled by a cosine function. These patterns depend only on phase changes from deformation, ensuring ideal fringe contrast (near 1) and minimal noise.

2.3. Principle of Continuous-Exposure Method

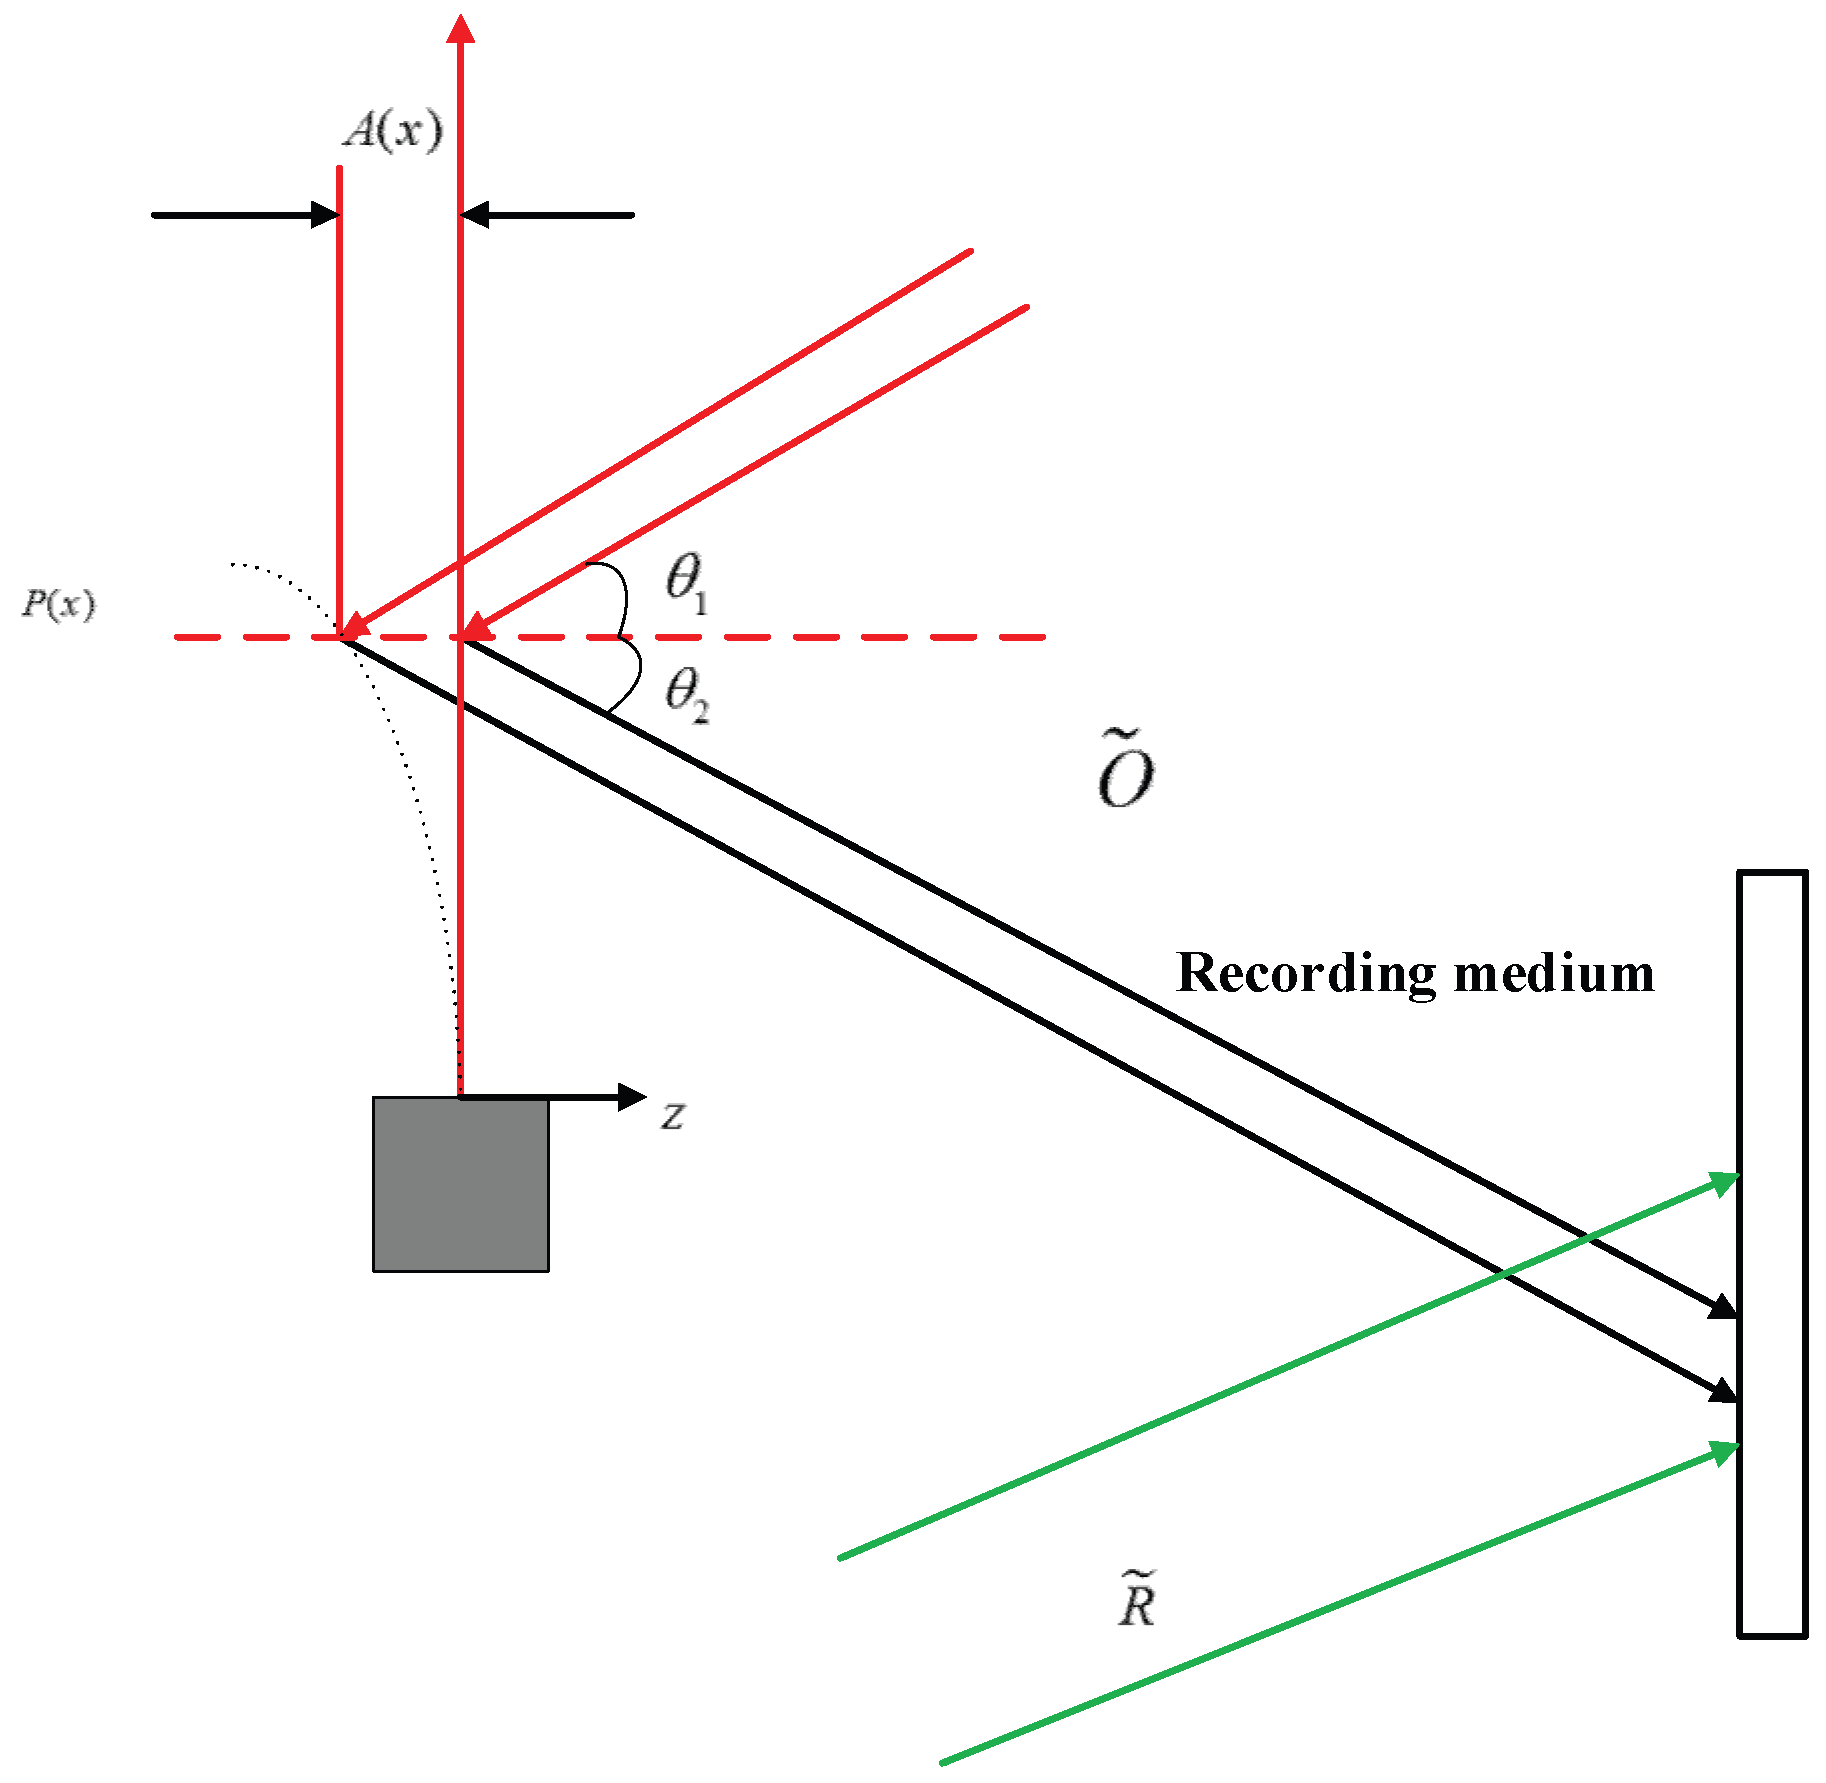
Figure 3 illustrates the schematic diagram of the continuous-exposure method.
Consider a vibrating point P on the object surface with vibration amplitude A(x) and angular frequency ω. The instantaneous displacement at time t is expressed as
z x , t = A ( x ) cos ( ω t )
Compared to the equilibrium position, the phase change of point P at time t is
φ 0 x , t = 2 π λ cos ( ω t ) cos θ 1 + cos θ 2
where θ 1 and θ 2 denote the angles of incidence and reflection of the illumination beam on the object surface, respectively.
The object wavefield reaching the holographic plate from point P is
O ˜ x , t = O ˜ 0 x exp j φ 0 x , t
where O ˜ 0 represents the static object wavefield (without vibration). Assuming the reference beam is a plane wave,
R ˜ ( x ) = r 0 ( x ) exp j φ r x
The recorded intensity on the hologram becomes
I ( x , t ) = r 0 2 + O ˜ 0 x 2 + O ˜ R ˜ * + O ˜ * R ˜
For exposure durations significantly longer than the vibration period T, the time-averaged intensity is
I ( x , t ) = 1 T 0 T I ( x , t ) d t = r 0 2 + O ˜ 0 2 + 1 T R ˜ * 0 T O ˜ x , t d t + 1 T R ˜ 0 T O ˜ * x , t d t
When the hologram is illuminated with the original reference beam R ˜ , the reconstructed wavefield contains three components. Focusing on the transmitted wavefield related to the original object wave O ˜ , we obtain
U ˜ t ( x ) = R ˜ R ˜ * T 0 T O ˜ x , t d t = r 0 2 2 π 0 2 π O ˜ x , t d ( ω t ) = r 0 2 O ˜ 0 x 2 π 0 2 π exp [ j k A ( x ) cos ( ω t ) ( cos θ 1 + cos θ 2 ) ] d ( ω t )
The continuous-exposure method captures vibration patterns through prolonged exposure, offering full-field measurement capabilities. However, it only captures time-averaged amplitude distributions and requires extensive post-processing for hologram reconstruction, making it unsuitable for real-time vibration monitoring. This technique is particularly effective for studying micro-vibrations and it enables high-precision measurement of vibration amplitudes.
From the three methods discussed (single-, double-, and continuous-exposure), the double-exposure approach demonstrates superior performance in calculating object deformations due to its enhanced fringe contrast and noise immunity.

3. Deformation Calculation for Glass

Figure 4 illustrates the relationship between surface deformation of a diffuse object and the resulting interference fringe field. For any point P on the surface of the diffuse object, if it displaces to point P1 after deformation, the phase change Δ ϕ P observed at point Q in holographic interferometry arises from the displacement of P before and after deformation.
Optical fields: s 1 : optical field at point P before deformation; s 2 : optical field at point P1 after deformation.
Vectors: D : displacement vector from P to P1. Illumination vectors: directed toward the object surface ( s 1 , s 2 ). Observation vectors: directed toward the observer ( q 1 from P to Q; q 2 from P1 to Q).
The phase difference Δ ϕ P denotes the phase change at observation point Q induced by the object wave before and after deformation.
The phase difference Δ ϕ P caused by deformation is expressed as
Δ ϕ P = 2 π λ Δ P
The phase change calculation is
D = P 1 P
Defining the following equations,
s = 1 2 s 1 + s 2 ;   Δ s = 1 2 s 1 s 2
q = 1 2 q 1 + q 2 ;   Δ q = 1 2 q 1 q 2
Optical path difference ( Δ P denotes the change in optical path length caused by deformation).
Δ P = s + Δ s · S P + q + Δ q · P Q s Δ s · S P 1 q Δ q · P 1 Q = D · q D · s + Δ s · S P + S P 1 + Δ q · P Q + P 1 Q
When, D S P , P Q , S P 1 , P 1 Q ,
Δ ϕ P = 2 π λ D ( P ) q ( P ) s ( P ) = 2 π λ e ( P ) · D ( P )
The displacement sensitivity vector e ( P ) denotes the magnitude representing the sensitivity of the interferometer to the displacement direction; it determines the fringe shift per unit displacement.
e ( P ) = q ( P ) s ( P )
Then,
Δ ϕ P = 2 π λ e ( P ) · D ( P )
The displacement vector is
D ( P ) = D x ( P ) , D y ( P ) , D z ( P )
Illumination vector s ( P ) denotes the vector from the light source to the undeformed point P:
s ( P ) = s x ( P ) s y ( P ) s z ( P ) = 1 x p x s 2 + y p y s 2 + z p z s 2 1 / 2 x p x s y p y s z p z s
The observation vector components are
q ( P ) = q x ( P ) q y ( P ) q z ( P ) = 1 x Q x P 2 + y Q y P 2 + z Q z P 2 1 / 2 x Q x P y Q y P z Q z P
Δ ϕ P = 2 π λ e ( P ) · D ( P )
Substituting these into Equation (40) yields
d = N λ s
where d is the displacement vector and s is the sensitivity vector, enabling the determination of the object’s deformation.
Substituting Equations (44)–(46) into Equation (40), the deformation of the object can be quantitatively determined. This formalism enables full-field displacement mapping through systematic analysis of interference fringe patterns.

4. Simulation Verification

In the following simulations, a He-Ne laser (wavelength λ = 632.8 nm) serves as the light source. The key parameters include an object-to-hologram distance z 0 = 0.3086 m, a diffraction plane size of 5 × 10 3 m, and reference beam angles, with respect to the X- and Y-axes, of α = p i / 2.0 and β = p i / 2.0175 . All images have a size of 5 mm × 5 mm with a resolution of 512 × 512 pixels.

4.1. Simulation of Single-Exposure Holographic Interferometry

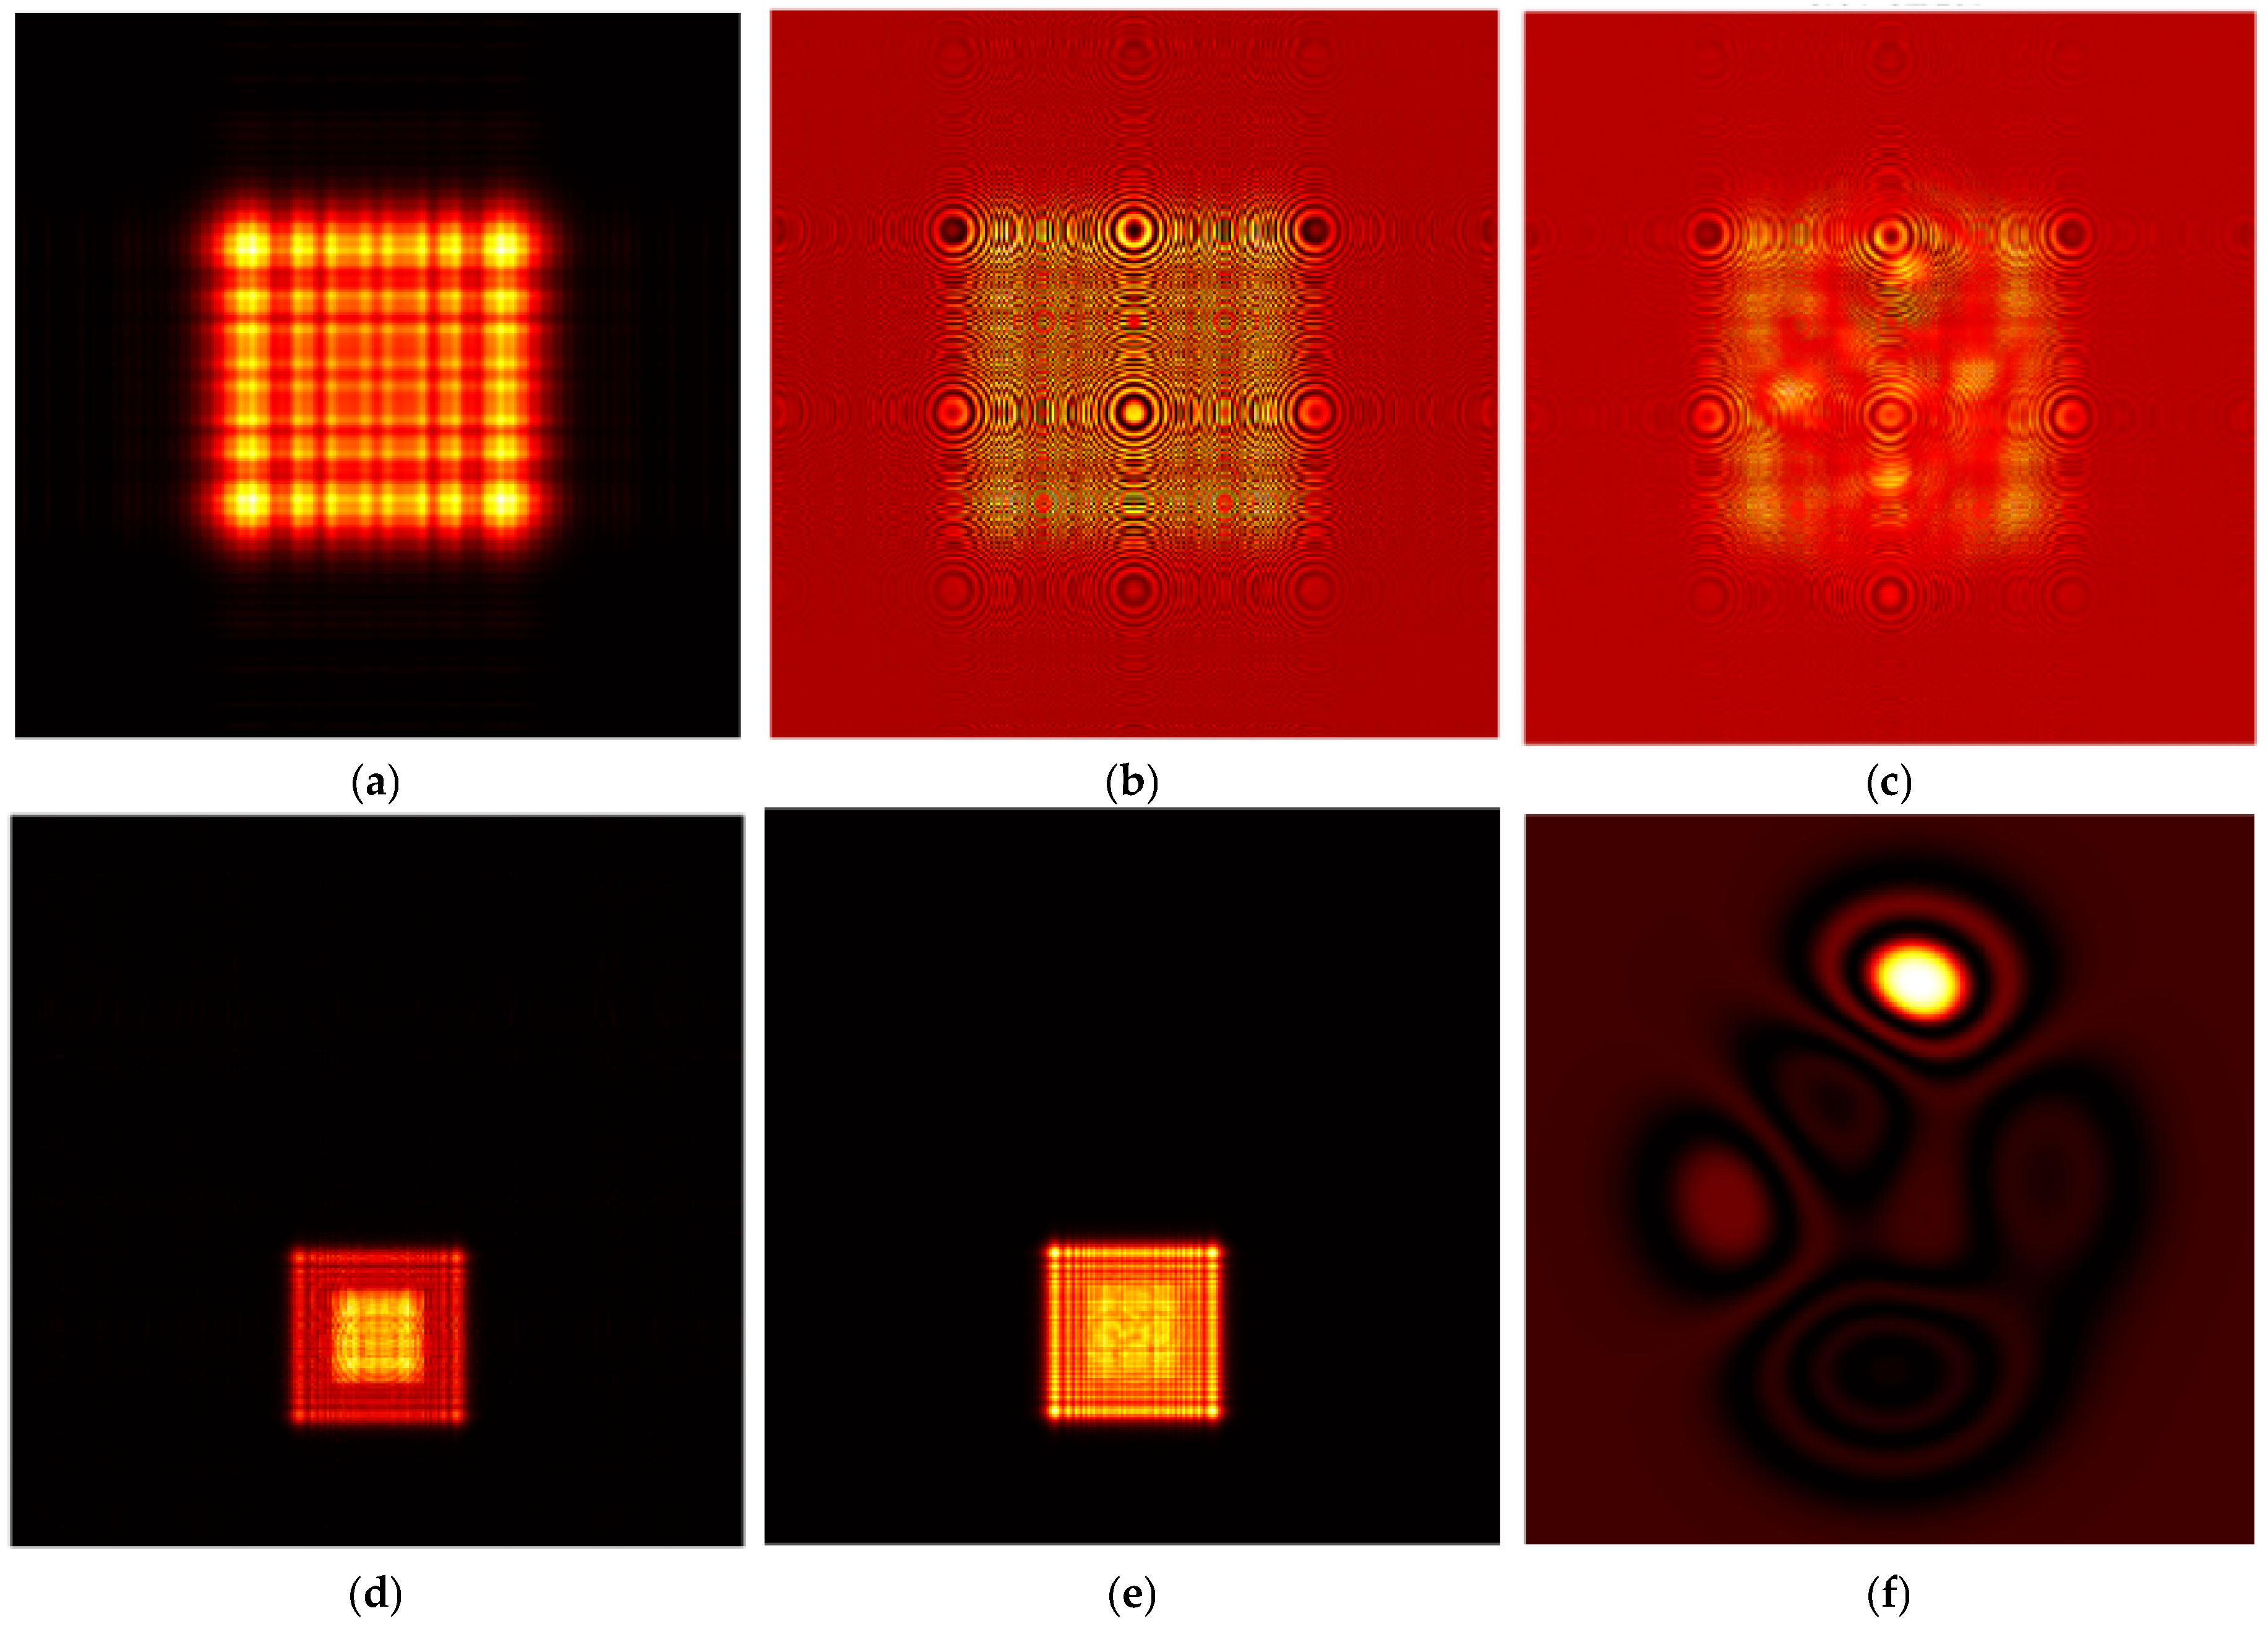
Figure 5 illustrates the workflow for recording and detection in single-exposure holographic interferometry:
Procedure:
(1) Model construction: This involves creating pre- and post-deformation objects. The following parameters are also input: wavelength, wavenumber, diffraction distance, and object plane size.
The lens focal length f = 0.1 m. The deformation phase field U0yp (varying from 0 to 4π) simulates glass deformation. Wavenumber k = 9.93 × 10⁶ m−1 is used for light field propagation calculation. The imaging distance Zi = 0.151 cm, and the image plane size Li = 0.0097 m. Lens phase modulation eliminates wavefront curvature.
(2) Pre-deformation hologram: The diffraction distribution of the object wave on the holographic plane is computed using the triple fast Fourier transform (T-FFT) [20] algorithm. The hologram is generated via interference with the reference beam.
(3) Post-deformation diffraction: The diffraction distribution of the deformed object wave is calculated by using T-FFT.
(4) Imaging lens configuration: The lens parameters are input to determine imaging distance.
(5) Reconstruction and interference:
a. The hologram is illuminated with either the reference beam or the deformed object beam.
b. Reconstruction is carried out using the single fast Fourier transform (S-FFT) algorithm.
c. Reconstructed fields are superimposed for interference detection.
Figure 5a: Diffraction pattern of object wave before deformation. The central rectangular region (256 × 256 pixels) exhibits a Gaussian distribution, with Fresnel diffraction rings appearing at the edges. No interference fringes are present (pure object wave intensity distribution).
Figure 5b: Hologram before deformation, showing clear tilted interference fringes. Spectrum broadening occurs in the central rectangular region.
Figure 5c: Diffraction pattern of deformed object wave. Intensity distribution in the central region is distorted, diffraction ring structure is disrupted, and no clear interference fringes exist.
Figure 5d: Reconstructed image using reference wave, showing a bright central rectangular image (+1 diffraction order), a conjugate image (−1 diffraction order), and a central zero-order diffraction spot.
Figure 5e: Reconstructed image illuminated by deformed object wave. The image appears blurred, shifted, with multiple images (due to wavefront mismatch of illumination light) and reduced contrast; the object wave change causes image degradation.
Figure 5f: Interference fringes obtained by simultaneous illumination with reference wave and deformed object wave. Dense interference fringes appear in the central region, with local fringe breakage (at phase jump locations), visualizing the optical path difference distribution caused by deformation. Although simple to implement, the single-exposure method is limited by low fringe contrast, noise sensitivity, and lack of directional detection, failing to meet high-precision deformation detection requirements.

4.2. Simulation of Double-Exposure Holographic Interferometry

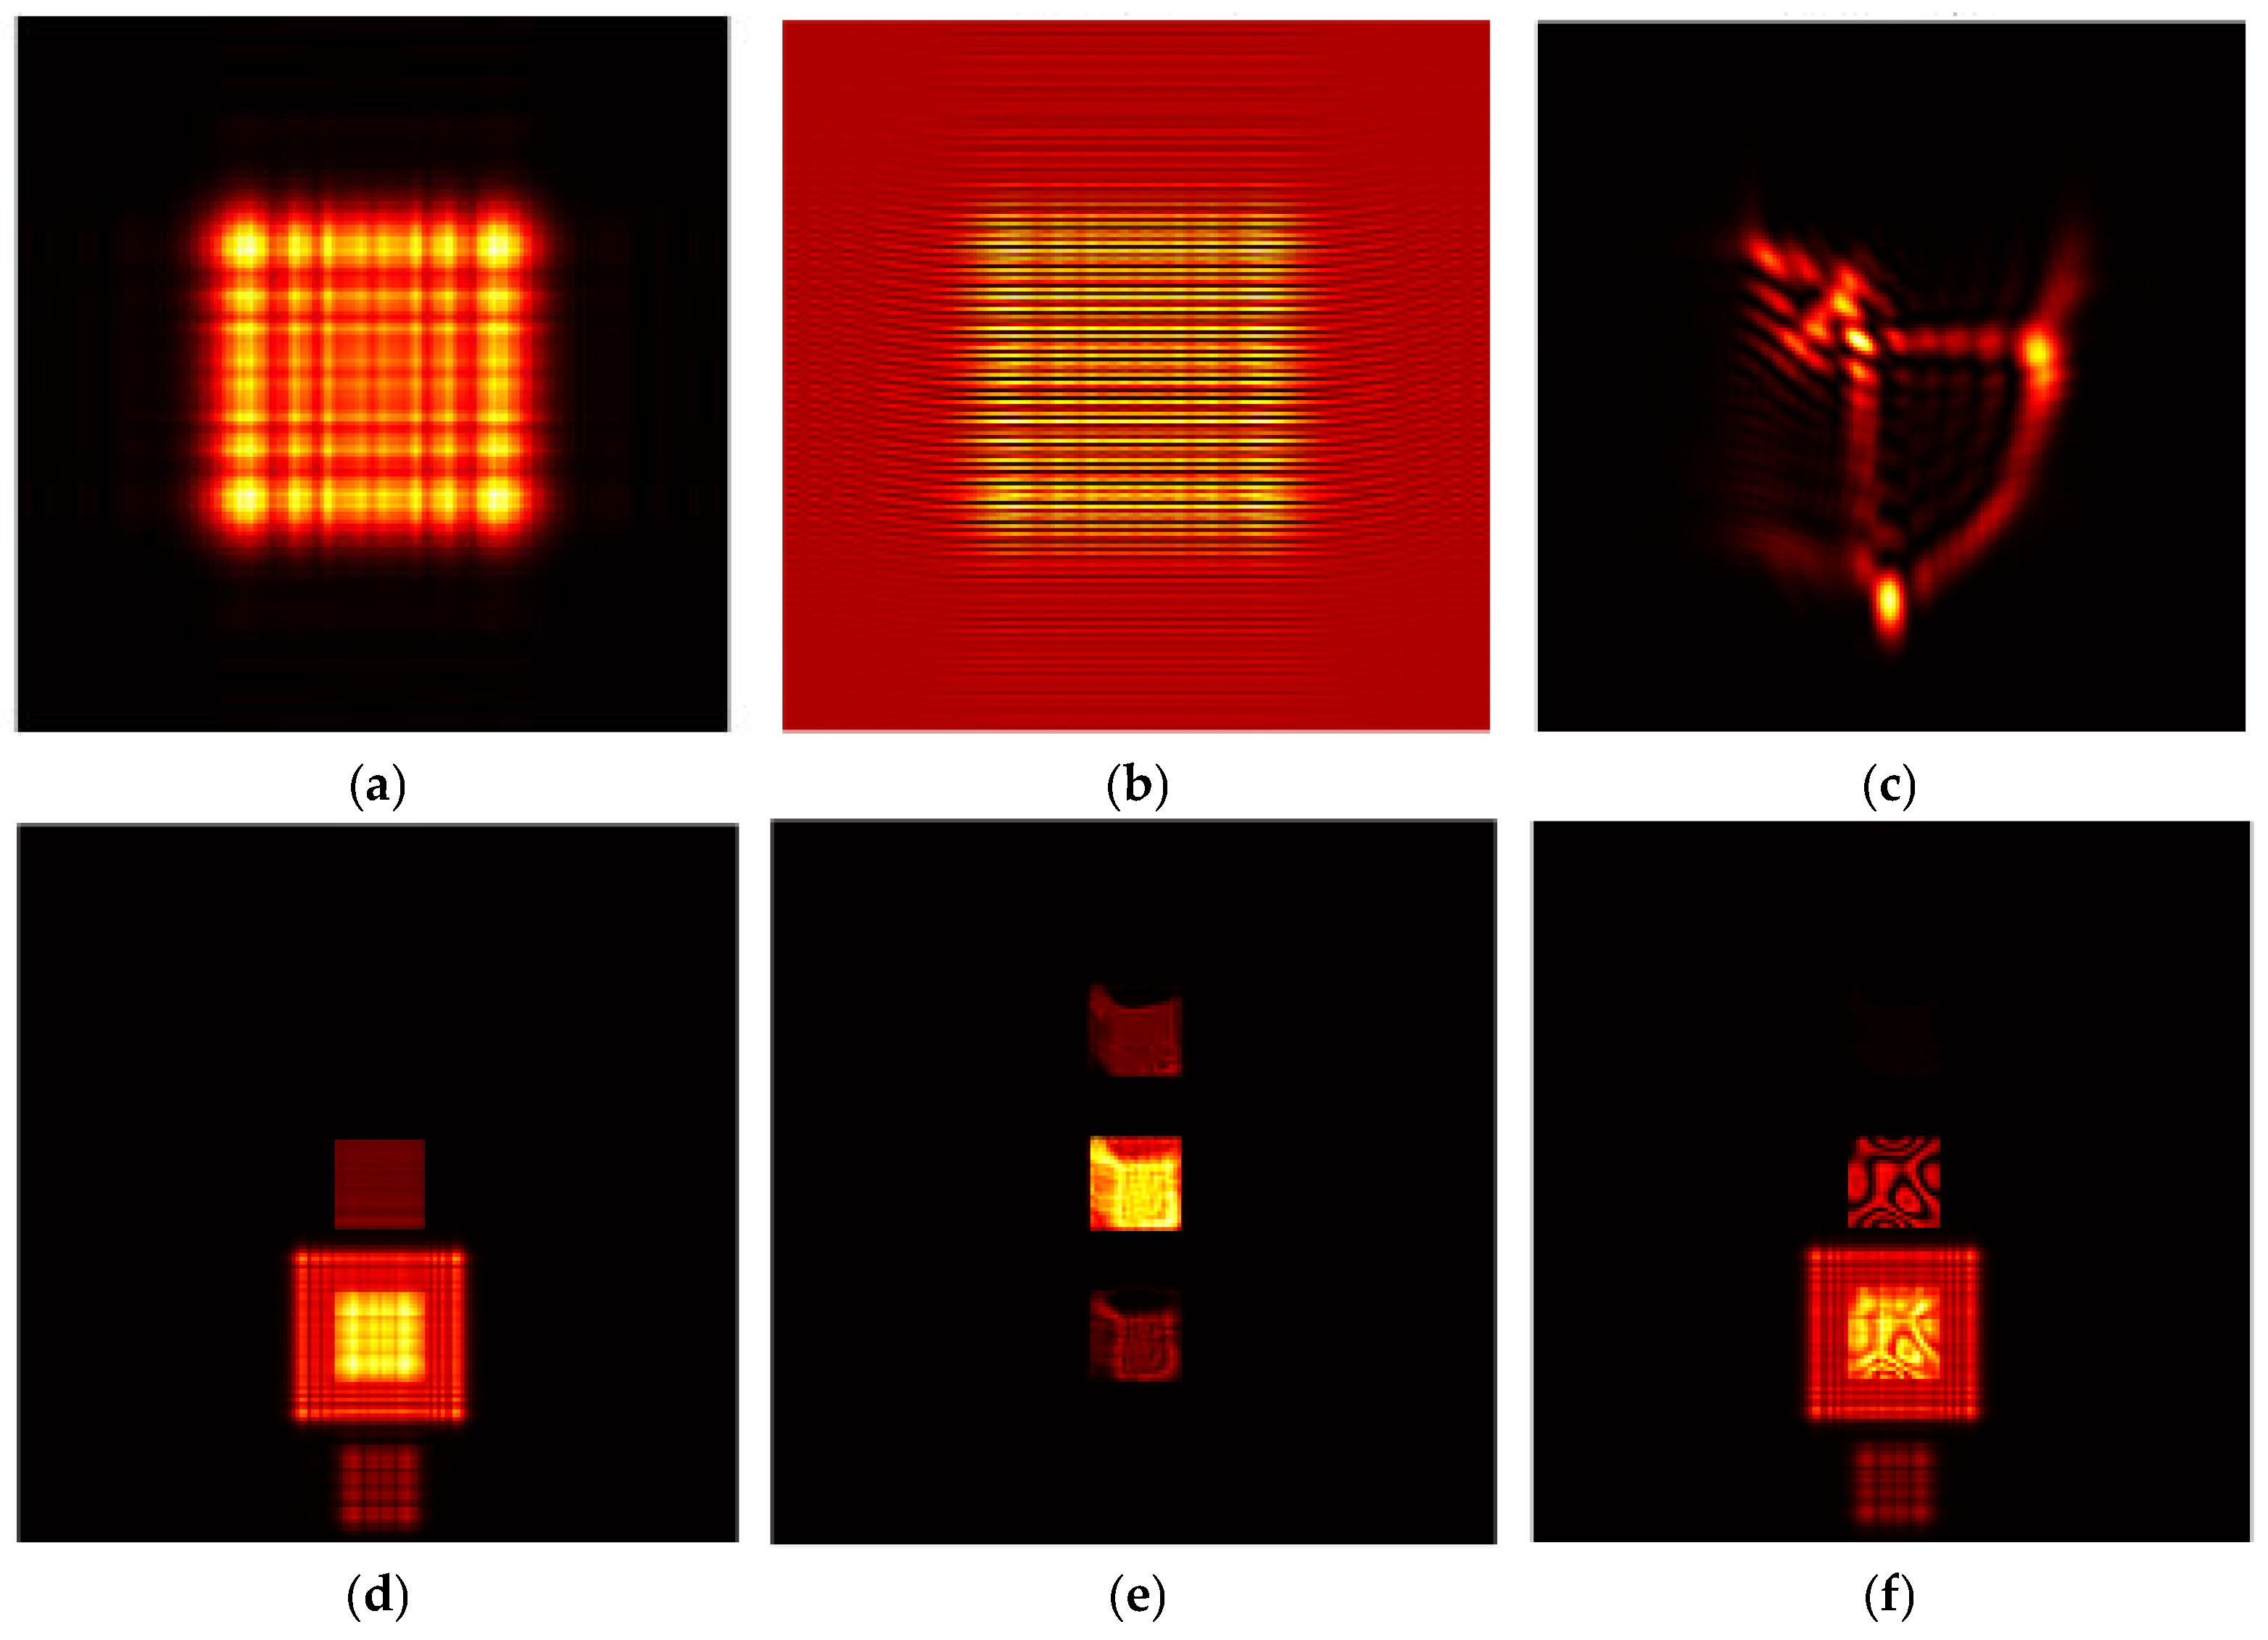
Figure 6 presents the workflow for double-exposure holography:
Procedure:
(1) Model construction: Identical to Section 4.1;
(2) Pre-deformation hologram: Hologram is generated via T-FFT and interference;
(3) Post-deformation hologram: Step 2 is repeated for the deformed object;
(4) Composite hologram: Pre- and post-deformation holograms are superimposed;
(5) Reconstruction: The composite hologram is generated with the reference beam and interference fringes are analyzed using S-FFT [21].
Figure 6a: Diffraction pattern of object wave before deformation. Fresnel diffraction field of a flat rectangular object at distance zo, showing a central bright rectangle + Fresnel diffraction rings (edge oscillations).
Figure 6b: Hologram before deformation. Interference between reference wave R and object wave O forms the hologram; the fringe tilt angle is controlled by alpha and beta, showing tilted parallel straight fringes.
Figure 6c: Diffraction pattern of deformed object wave. Peak phase modulation causes wavefront distortion, corresponding to object deformation, showing central region distortion + diffraction ring distortion.
Figure 6d: Hologram after deformation. Deformation alters the object wavefront, causing local fringe distortion, showing local fringe bending/density variation.
Figure 6e: Double-exposure reconstructed image. Interference superposition of two exposed holograms; fringes in the image reflect the phase difference caused by deformation, showing a rectangular image overlaid with bright/dark interference fringes. Numerical simulation of double-exposure holographic interferometry was implemented based on the fast Fourier transform (T-FFT/S-FFT) algorithm. The hologram recording and reconstruction process was simulated by constructing an initial rectangular object plane and a deformed object plane with superimposed peak phase modulation. Simulation results show that object plane phase modulation is successfully transformed into interference fringe distribution in the reconstructed image, verifying the mapping relationship between phase change and fringe density/orientation.

4.3. Simulation of Continuous-Exposure Holographic Interferometry

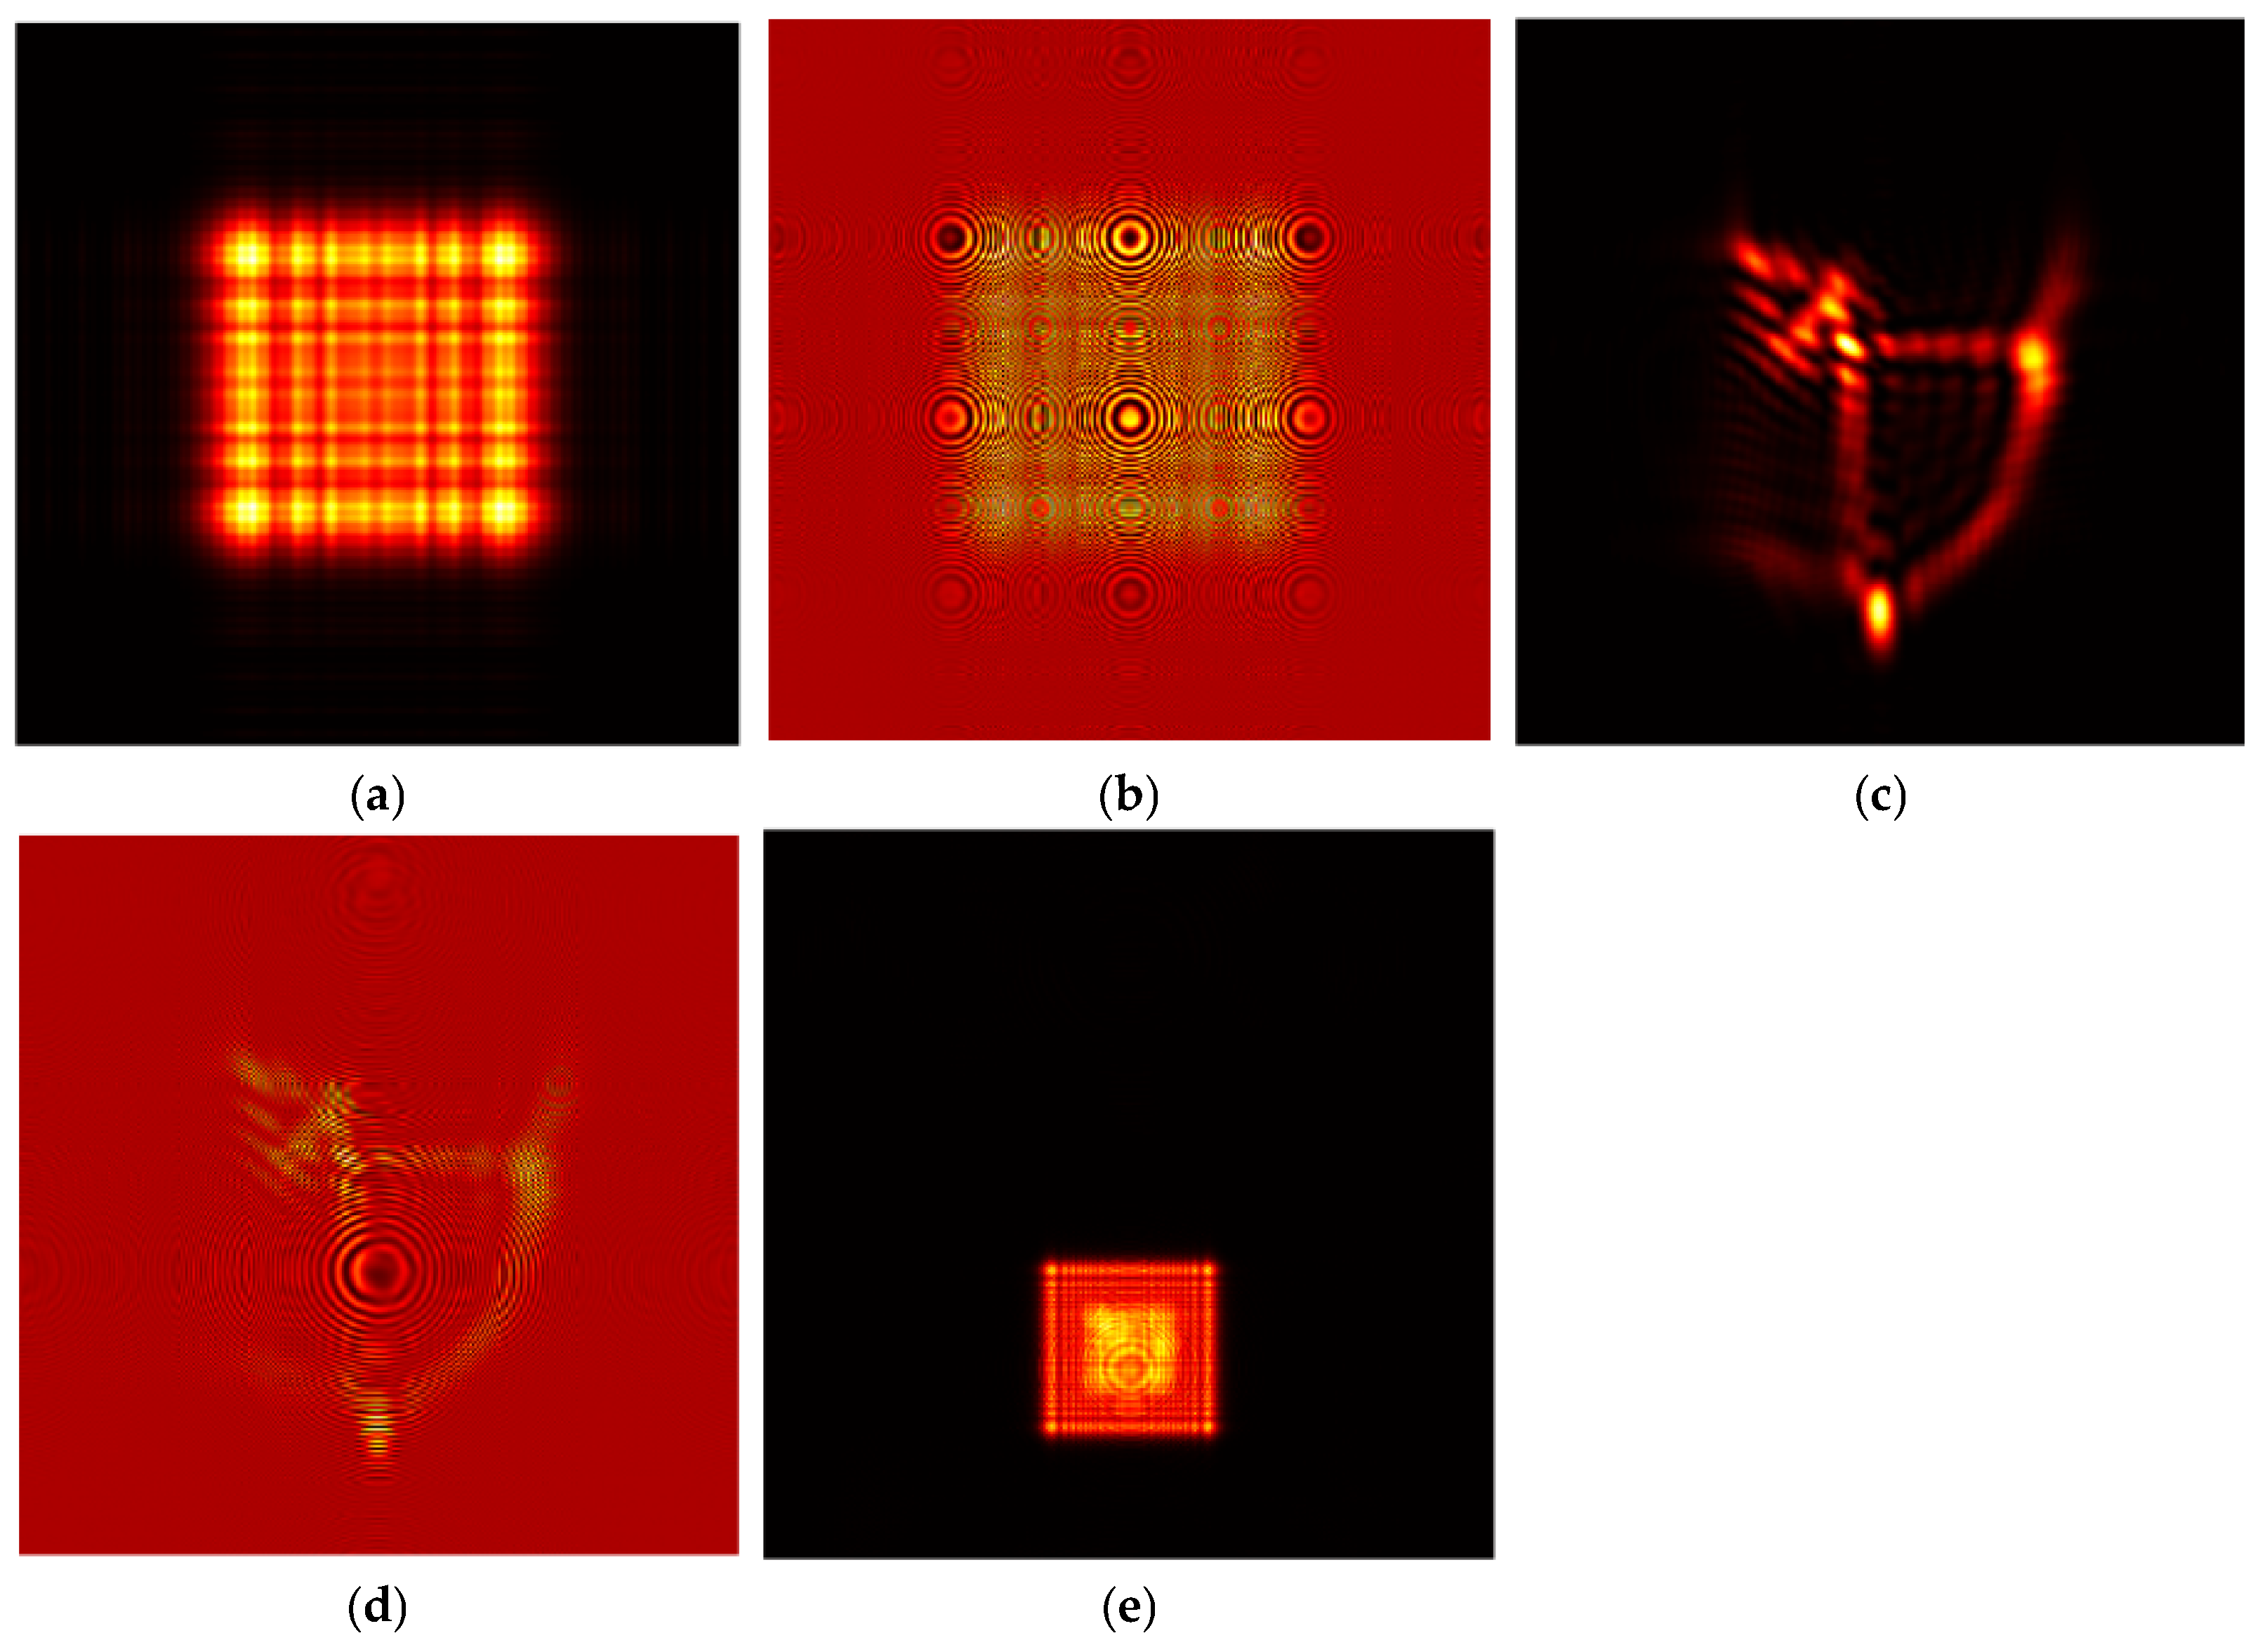
Figure 7 outlines the continuous-exposure workflow:
Procedure:
(1) Model construction: The object geometry is defined and the parameters input.
Laser incidence and reflection angles (determining vibration phase sensitivity): π/2 and π/3, respectively. Maximum amplitude on object surface: 3.16 μm. Vibration angular frequency: 5 rad/s. Number of sampling points per vibration cycle: 50. Initial vibration phase: π rad.
(2) Static hologram: The hologram of the non-vibrating object is generated via T-FFT.
(3) Vibration assignment: The vibration amplitudes are assigned using peak functions. The vibration parameters, sampling rates, and beam angles are adjusted.
(4) Time-averaged hologram: The instantaneous diffraction patterns during vibration are computed, superimposing multiple frames.
(5) Reconstruction and comparison:
a. Static and time-averaged holograms are reconstructed using S-FFT.
b. The reconstructed intensities are compared using zeroth-order Bessel function modulation.
Figure 7a: Diffraction pattern of object wave before vibration. This is the Fresnel diffraction field of a flat rectangular object at distance zo, showing central bright rectangle + clear Fresnel diffraction rings.
Figure 7b: Hologram before vibration. Therenterference between reference wave and static object wave; fringe orientation controlled by alpha, beta, showing uniform tilted straight fringes.
Figure 7c: Time-averaged hologram. Vibration causes a time-averaging effect (fringe contrast decreases with increasing amplitude), showing fringe blurring/contrast reduction in the central region.
Figure 7d: Static reconstructed image, showing a clear rectangular image + uniform background.
Figure 7e: Time-averaged reconstructed image. The vibration amplitude distribution is modulated by the zero-order Bessel function. Bright rings: maxima (amplitude nodes); dark rings: zeros (amplitude extrema).
Figure 7f: Bessel modulation distribution, showing ring fringes perfectly matching the reconstructed image.
Theoretical analysis and simulation verification results demonstrate that the single-exposure method is constrained by data acquisition frequency and computational speed, limiting its capability for rapid measurement. In the continuous-exposure method, the intensity ratio between the reference wave and the object wave significantly impacts the contrast of real-time holographic interference fringes. Conversely, the interference fringes obtained via the double-exposure method can be altered by varying the exposure sequence and the position of the reference light source. This approach not only enables the quantitative measurement of deformation magnitude through the number of fringe displacements but also facilitates the qualitative determination of deformation direction based on the movement direction of the interference fringes. Consequently, the double-exposure method was employed for stress detection in the experimental phase.

5. Experimental Verification

5.1. Double-Exposure Method Experiment

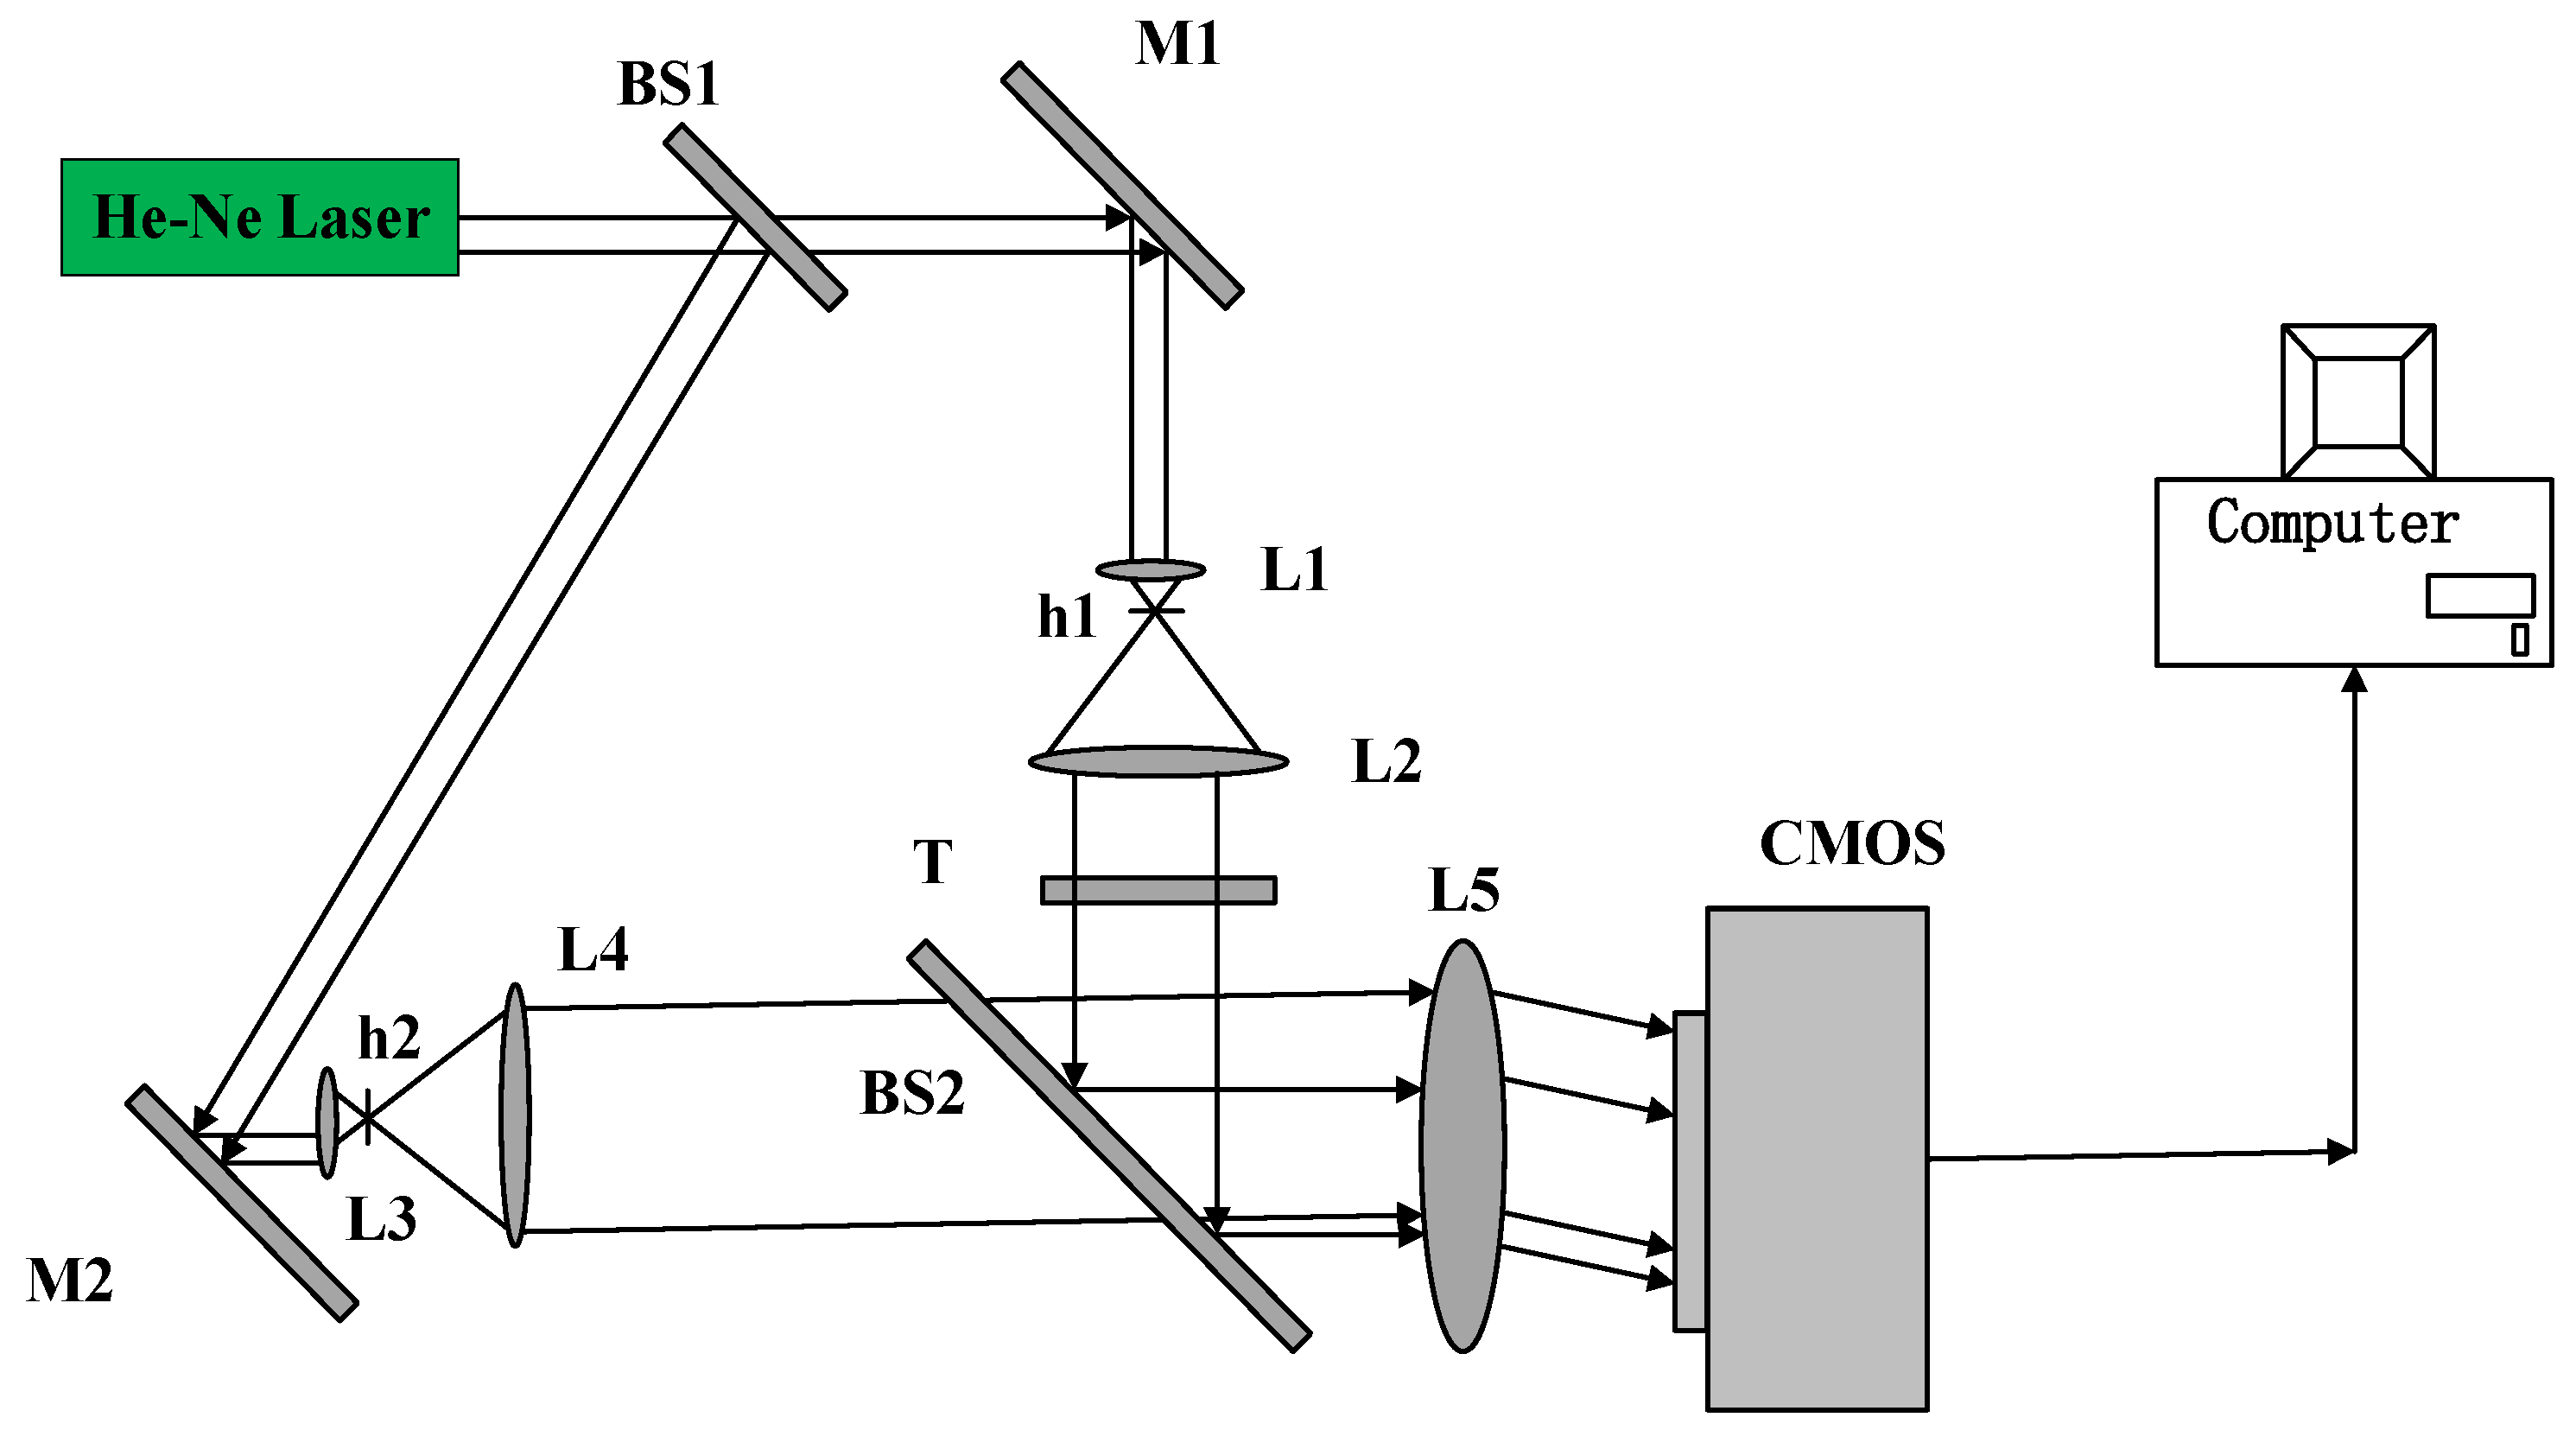
The double-exposure holographic interferometry setup for stress detection is illustrated in Figure 8. The experiment employs a continuous-wave He-Ne laser (power: 40 mW; wavelength λ = 632.8 nm) and a CMOS sensor (model OV7670; frame rate: 30 fps; pixel clock: 24 MHz; photosensitive array: 640 × 480 pixels; package size: 3.785 mm × 4.235 mm). The tested glass has a thickness t = 4.00 mm, radius a = 17.50 mm, Poisson’s ratio μ = 0.2, and refractive index n = 1.517.
Optical configuration:
The following components are used: He-Ne laser, two mirrors (M1/M2), five beam expanders (L1–L5), two beam splitters (BS1/BS2), glass sample T, CMOS sensor, and computer.
Beam paths:
The laser beam is split by BS1 into two paths:
Reference beam: The reference beam is reflected by M2, collimated, and directed to the CMOS via BS2 and L5.
Object beam: The object beam is reflected by M1 and collimated; then, it illuminates the glass sample T and scatters to the CMOS through BS2 and L5.
The two beams interfere to form a Fresnel off-axis digital hologram, recorded by the CMOS and digitized for storage and processing.
Procedure:
First hologram: The hologram of the undeformed glass is recorded; then, digital reconstruction and phase unwrapping are performed to obtain the initial phase distribution.
Second hologram: In-plane stress is applied to the glass while maintaining optical alignment. The second hologram is recorded and processed to extract the deformed phase distribution.
Parameters:
(1) Pixel size: 3.2 × 3.2 μm2; resolution: 1600 × 1200 pixels; sampling rate: 10 fps.
(2) Object-to-CMOS distance: 0.120 m; reference beam angles: α = p i / 2.045 , β = p i / 1.9655 .
(3) Reconstructed image scaling factor: reduced to 1/3. Curvature radius of spherical reconstruction wave: −0.06 (negative sign indicates converging illumination). Reconstruction image plane distance: 4 cm.
Experimental calculation results are shown in Figure 9.
Figure 9a: Reconstructed image of the first digital hologram. Tilted carrier fringes are superimposed with local distortion; interference fringes from two states are superimposed. Distorted regions reflect phase changes caused by deformation.
Figure 9b,c: Pure object wave reconstruction images. Speckles originate from rough surface scattering.
Figure 9d: High-contrast cosine fringes (fringe bending in the deformed region). For Figure 9d, the holographic interference fringes can be observed radiating outward from the center. The magnitude of fringe displacement reveals the distribution pattern of glass deformation.

5.2. Single- and Continuous-Exposure Method Experiments

Under identical experimental conditions, single- and continuous-exposure methods were compared with the double-exposure approach.
Single-Exposure Protocol:
(1) The initial interference field is recorded with a CCD under static conditions.
(2) Deformation is applied and interference fringes between the deformed object beam and reference beam are dynamically captured.
(3) The phase distribution is extracted via Fourier transform, unwrapping phases, and computing deformation.
Continuous-Exposure Protocol:
(1) Time-varying interference patterns during deformation were continuously recorded using a high-speed CCD.
(2) Temporal Fourier transform was performed on the sequence to extract phase evolution.
(3) Phase data were fitted to quantify deformation.
Regarding the interference fringe results, Figure 10 compares the fringe patterns:
Figure 10a: Single-exposure fringes.
Figure 10b: Continuous-exposure fringes.
According to Table 1, the following can be seen:
(1) The single-exposure method has the lowest fringe density (0.75) and highest noise (0.18) due to single-frame limitations. It also has the fastest computation (0.157 s) so it suits real-time applications.
(2) The double-exposure method has improved fringe density (0.83) and noise suppression (0.06) via cosine modeling. It has moderate detail retention (0.78) with practical computation time (0.172 s).
(3) The continuous-exposure method has the highest fringe density (0.92) and detail retention (0.89), but also the highest noise (0.23) and computational load (0.214 s).
The double-exposure method achieves an optimal balance between fringe clarity, noise control, and computational efficiency, making it ideal for engineering applications requiring high precision and real-time capability.

6. Conclusions

This study comprehensively evaluates three holographic interferometry algorithms through theoretical analysis, MATLAB simulations, and experimental validation. Compared to the single-exposure method—which suffers from real-time limitations due to acquisition frequency constraints and only resolves deformation amplitudes—and the continuous-exposure method—prone to instability from intensity sensitivity and noise interference—the double-exposure method demonstrates superior performance. By constructing a noise-suppressed fringe field characterized by cosine modulation, the double-exposure approach enables active control of interference patterns, overcoming the environmental dependency inherent in conventional techniques.
Key innovations include the following: (1) Quantitative mapping model: A fringe displacement-to-deformation mapping framework was established by using the double-exposure method, enhancing amplitude detection accuracy. (2) Vector resolution algorithm: A fringe gradient field-based algorithm was proposed to determine deformation directions, achieving simultaneous improvements in computational efficiency and measurement precision. (3) The tripartite verification framework integrating theory, simulation, and experiment provides a robust methodology for validating holographic measurement systems.
This work advances precision optical metrology by offering (1) enhanced adaptability to dynamic deformation scenarios; (2) improved noise immunity through active fringe modulation; and (3) a systematic pathway for algorithm development and optimization.
These findings establish the double-exposure method as a versatile solution for high-accuracy deformation analysis with real-time capability in engineering applications.

Author Contributions

Y.L.: writing—original draft preparation, writing—review and editing; Y.Z.: formal analysis; D.J.: methodology; S.G.: validation; M.Z.: investigation. All authors have read and agreed to the published version of the manuscript.

Funding

This research received no external funding.

Data Availability Statement

The raw data supporting the conclusions of this article will be made available by the authors on request.

Conflicts of Interest

The authors declare no conflict of interest.

References

  1. Dezfouli, A.M.; Demoli, N.; Abramović, D.; Rakić, M.; Skenderović, H. Digital Holographic Interferometry for Micro-Deformation Analysis of Morpho Butterfly Wing. Photonics 2024, 11, 851. [Google Scholar] [CrossRef]
  2. Mach, M.; Psota, P.; Žídek, K.; Mokrý, P. On-chip digital holographic interferometry for measuring wavefront deformation in transparent samples. Opt. Express 2023, 31, 17185–17200. [Google Scholar] [CrossRef] [PubMed]
  3. Vandenrijt, J.-F.; Thizy, C.; Martin, L.; Beaumont, F.; Garcia, J.; Fabron, C.; Prieto, É.; Maciaszek, T.; Georges, M.P. Digital holographic interferometry in the long-wave infrared and temporal phase unwrapping for measuring large deformations and rigid body motions of segmented space detector in cryogenic test. Opt. Eng. 2016, 55, 121723. [Google Scholar] [CrossRef]
  4. Cubreli, G.; Psota, P.; Dančová, P.; Lédl, V.; Vít, T. Digital Holographic Interferometry for the Measurement of Symmetrical Temperature Fields in Liquids. Photonics 2021, 8, 200. [Google Scholar] [CrossRef]
  5. Zhang, Y.; Zhao, J.; Di, J.; Jiang, H.; Wang, Q.; Wang, J.; Guo, Y.; Yin, D. Real-time monitoring of the solution concentration variation during the crystallization process of protein-lysozyme by using digital holographic interferometry. Opt. Express 2012, 20, 18415–18421. [Google Scholar] [CrossRef]
  6. Zhang, Q.; Li, J. Single Exposure Phase-Only Optical Image Encryption and Hiding Method via Deep Learning. IEEE Photonics J. 2022, 14, 7813508. [Google Scholar] [CrossRef]
  7. Gesualdi, M.R.D.R.; Muramatsu, M.; Soga, D.; Paiva, R.D., Jr. Wave optics analysis by phase-shifting real-time holographic interferometry. Optik 2010, 121, 80–88. [Google Scholar] [CrossRef]
  8. Séfel, R.; Kornis, J. Double-exposure phase calculation method in electronic speckle pattern interferometry based on holographic object illumination. Appl. Opt. 2011, 50, 4642–4647. [Google Scholar] [CrossRef]
  9. Chikode, P.P.; Vhatkar, R.S.; Patil, S.D.; Fulari, V.J. Investigations of defects in ceramic tiles using Double Exposure Digital Holographic Interferometry (DEDHI) technique. Optik 2020, 219, 165035. [Google Scholar] [CrossRef]
  10. Arul, A.R.; Ramalingam, H.B.; Balamurugan, R. Surface deformation studies of TiO2 thin films by double exposure laser holographic interferometry. Laser Phys. 2023, 33, 076201. [Google Scholar] [CrossRef]
  11. Palevicius, P.; Saunoriene, L.; Cao, M.; Ragulskis, M. Time-averaged computer generated holography for the estimation of torsional amplitudes of oscillating microdevices. Opt. Commun. 2019, 439, 260–269. [Google Scholar] [CrossRef]
  12. Hariharan, P. Application of holographic subtraction to time-average hologram inteferometry of vibrating objects. Appl. Opt. 1973, 12, 143–146. [Google Scholar] [CrossRef] [PubMed]
  13. Lyalikov, A.M. Enhancement of the Measurement Sensitivity in Multiple-Exposure Holographic Interferometry. Opt. Spectrosc. 2002, 93, 136–139. [Google Scholar] [CrossRef]
  14. Zhao, W.; Zhong, Z.; Chen, X.; Ling, L.; Liu, L.; Shan, M. Fast and robust reconstruction using off-axis-optimized conjugate iteration for single-exposure dual-wavelength digital holography. Opt. Laser Technol. 2025, 184, 112451. [Google Scholar] [CrossRef]
  15. Munera, N.; Trujillo, C.; Garcia-Sucerquia, J. High-speed measurement of mechanical micro-deformations with an extended phase range using dual-wavelength digital holographic interferometry. Appl. Opt. 2022, 61, B279–B286. [Google Scholar] [CrossRef]
  16. Li, Y.; Zhang, Y.; Jia, D.; Zhang, M.; Ji, X.; Li, Y.; Wu, Y. Experimental Study on the Reconstruction of a Light Field through a Four-Step Phase-Shift Method and Multiple Improvement Iterations of the Least Squares Method for Phase Unwrapping. Photonics 2024, 11, 716. [Google Scholar] [CrossRef]
  17. Chikode, P.P.; Pawar, S.J.; Fulari, V.J.; Dongare, M.B. Study of diffusion process in sucrose solution by using double exposure holographic interferometry (DEHI). J. Opt. 2007, 36, 157–168. [Google Scholar] [CrossRef]
  18. Ronga, W.; Yangb, L.; Ai-Guob, O. A denoising method combining bitonic filtering and sine-cosine transform for shearography fringe pattern. Chin. Opt. 2024, 17, 435–443. [Google Scholar] [CrossRef]
  19. Al-Zaben, A.; Al-Fahoum, A.; Ababneh, M.; Al-Naami, B.; Al-Omari, G. Improved recovery of cardiac auscultation sounds using modified cosine transform and LSTM-based masking. Med. Biol. Eng. Comput. 2024, 62, 2485–2497. [Google Scholar] [CrossRef]
  20. Dong, J.; Jia, S.; Jiang, C. Surface shape measurement by multi-illumination lensless Fourier transform digital holographic interferometry. Opt. Commun. 2017, 402, 91–96. [Google Scholar] [CrossRef]
  21. Kulkarni, R.; Rastogi, P. Multiple phase estimation via signal separation using a windowed Fourier transform in digital holographic interferometry. Meas. Sci. Technol. 2015, 26, 075204. [Google Scholar] [CrossRef]
Figure 1. (a) Recording process of single-exposure holographic interferometry; (b) reconstructed optical fields in single-exposure holographic interferometry.
Applsci 15 06938 g001
Figure 2. (a) First exposure; (b) second exposure; (c) reconstructed optical fields in double-exposure holographic interferometry.
Applsci 15 06938 g002
Figure 3. Optical path for recording in continuous-exposure holographic interferometry.
Applsci 15 06938 g003
Figure 4. Relationship between surface deformation of a diffuse object and interference fringe field.
Applsci 15 06938 g004
Figure 5. (a) Diffraction pattern of object wave before deformation. (b) Hologram before deformation. (c) Diffraction intensity after deformation. (d) Reconstructed image under reference beam illumination. (e) Reconstructed image under deformed object beam illumination. (f) Interference fringes from simultaneous illumination with reference and deformed object beams.
Applsci 15 06938 g005
Figure 6. (a) Pre-deformation diffraction pattern. (b) Pre-deformation hologram. (c) Post-deformation diffraction pattern. (d) Post-deformation hologram. (e) Reconstructed image under reference beam illumination.
Applsci 15 06938 g006
Figure 7. (a) Pre-vibration diffraction pattern. (b) Time-averaged diffraction pattern. (c) Time-averaged hologram. (d) Reconstruction of static object. (e) Time-averaged reconstruction. (f) Bessel function-modulated distribution.
Applsci 15 06938 g007
Figure 8. Optical setup for double-exposure holographic stress detection.
Applsci 15 06938 g008
Figure 9. (a) Reconstructed image from first hologram. (b,c) Double-exposure reconstructions. (d) Interference fringes from superimposed fields.
Applsci 15 06938 g009
Figure 10. (a) Single-exposure interference fringes. (b) Continuous-exposure interference fringes.
Applsci 15 06938 g010
Table 1. Performance comparison of the three methods.
FeatureDouble-ExposureSingle-ExposureContinuous-Exposure
Fringe density0.830.750.92
Noise level0.060.180.23
Detail retention0.780.680.89
Computational time (s)0.1720.1570.214
Disclaimer/Publisher’s Note: The statements, opinions and data contained in all publications are solely those of the individual author(s) and contributor(s) and not of MDPI and/or the editor(s). MDPI and/or the editor(s) disclaim responsibility for any injury to people or property resulting from any ideas, methods, instructions or products referred to in the content.