Article

Numerical Simulation and Experimental Validation of Masonry Walls Strengthened with Stiff-Type Polyurea Under Seismic Loads

School of Civil and Environmental Engineering, Yonsei University, 50, Yonsei-ro, Seodaemun-gu, Seoul 03722, Republic of Korea
*
Author to whom correspondence should be addressed.
Appl. Sci. 2025, 15(12), 6912; https://doi.org/10.3390/app15126912
Submission received: 28 April 2025 / Revised: 15 June 2025 / Accepted: 17 June 2025 / Published: 19 June 2025
(This article belongs to the Special Issue Simplified Seismic Analysis of Complex Civil Structures)

Abstract

:
The deterioration of aging masonry structures poses significant challenges to structural safety, particularly under seismic loading. In response to the growing need for effective retrofitting solutions, stiff-type polyurea (STPU) has emerged as a promising material due to its high tensile strength, durability, and rapid application characteristics. This study investigates the seismic performance of masonry walls retrofitted with STPU through both shaking table tests and finite element analysis (FEA). Three types of specimens (non-strengthened, STPU-strengthened, and STPU + GFRP-strengthened walls) were subjected to out-of-plane seismic loading with additional mass loading to simulate real-world conditions. Experimental results demonstrated that STPU significantly improved the ductility and seismic resistance of masonry walls, with the STPU + GFRP hybrid system showing the highest performance. A simplified micro-model using ABAQUS successfully captured the primary failure modes and load-bearing behavior observed in the experiments. Furthermore, a parametric study on STPU thickness identified 2 mm as the most efficient thickness considering both strengthening effect and material economy. These findings confirm the effectiveness of STPU as a retrofitting material and demonstrate the reliability of the proposed numerical modeling approach in predicting the seismic response of retrofitted masonry structures.

1. Introduction

The global increase in aging infrastructure has become a significant concern in recent decades [1,2,3]. Structures constructed during periods of rapid industrialization and urban development are now experiencing deterioration beyond their originally intended service lives [2,4]. Over time, materials degrade due to environmental exposure, fatigue, chemical reactions, and other aging-related mechanisms [5,6]. This degradation leads to the reduction of structural integrity, stiffness, and load-bearing capacity, compromising the overall safety and performance of the structures [7,8]. Without timely intervention, the progressive deterioration of aging structures can result in serious functional deficiencies, higher maintenance costs, and eventual structural failures [9,10]. Therefore, understanding the mechanisms of structural deterioration and developing strategies to mitigate their effects are essential to extending the service life and ensuring the reliability of existing infrastructure.
This trend is also evident in South Korea, where the aging of buildings has become a growing concern. As of 2020, approximately 38.8% of all buildings in South Korea—equivalent to 7.27 million structures—had exceeded 30 years of age, and this proportion is projected to rise sharply to 62% by 2030 [11]. Many buildings constructed before the late 1980s were designed without comprehensive seismic considerations, as South Korea’s first mandatory seismic design code was only introduced in 1988 [12]. Although modern seismic design regulations are now well established, a substantial portion of the building stock remains vulnerable to seismic and other structural risks. In particular, in Seoul, masonry structures account for approximately 60.3% of buildings over 30 years old, underscoring the urgent need for proactive maintenance and targeted retrofitting strategies to enhance the safety and resilience of aging structures [13].
Among various construction components, the structural performance of masonry buildings is highly dependent on the strength of the mortar joints. Due to the inherently low tensile strength of mortar, masonry structures are significantly more susceptible to seismic forces compared to reinforced concrete (RC) structures [14,15]. As a result, considerable attention has been directed toward developing effective repair techniques and strengthening materials, aimed at enhancing the earthquake resistance of older masonry buildings [16]. Accordingly, not only is strengthening necessary, but the establishment of an efficient finite element modeling framework for accurately evaluating the structural stability of aged masonry buildings is also critically required.
Recent advancements in the retrofitting of masonry structures have emphasized the integration of strengthening and energy efficiency improvements. Various studies have evaluated different retrofitting techniques to improve the structural performance of masonry walls. Karlos et al. [17] introduced an integrated seismic and energy retrofitting system utilizing TRM and insulation materials, demonstrating through experimental, analytical, and finite element analysis (FEA) that significant improvements in structural behavior and thermal performance could be achieved. Similarly, Triantafillou et al. [18] evaluated the in-plane mechanical behavior of masonry walls strengthened with TRM and insulation layers, confirming their effectiveness in increasing the structural capacity under seismic loading.
Boem [19] applied an open-source FEA platform to simulate masonry elements strengthened with TRM, showing good agreement between numerical predictions and experimental results. In addition, Alsayed et al. [20] investigated the blast response of masonry walls strengthened with glass-fiber-reinforced polymer (GFRP) sheets. Through experimental studies and FEM simulations using ANSYS-AUTODYN, they demonstrated that GFRP strengthening effectively enhanced the blast resistance of masonry walls by increasing flexural capacity and reducing debris scattering. Further, Gkournelos et al. [21] investigated the out-of-plane behavior of retrofitted masonry walls, highlighting how prior in-plane damage can influence subsequent structural performance, and validated their findings through finite element simulations.
In recent studies on masonry retrofitting, polymer-based coatings have drawn increasing attention for their ability to enhance structural resilience under extreme loading. Notably, Santos et al. [22] conducted full-scale blast experiments and corresponding numerical simulations to evaluate the effectiveness of polyurea coatings in mitigating blast-induced damage in concrete masonry walls. Their findings revealed that polyurea significantly improved blast resistance by reducing fragmentation and enhancing ductility. Similarly, Öztürk et al. [23] investigated the influence of polyurea application on the shear behavior of masonry wall elements through experimental testing. Their results demonstrated that polyurea coatings contributed to improved shear performance by altering the failure mode and enhancing the post-crack response of the masonry system.
These studies collectively demonstrate the growing emphasis on developing efficient, reliable FEM frameworks for accurately predicting the behavior of retrofitted masonry structures. Building upon this foundation, the present study aims to further evaluate and simulate the structural performance of masonry walls strengthened with innovative retrofitting materials, focusing on both experimental validation and detailed numerical modeling.
Given the increasing number of aging masonry structures worldwide, there is a growing need for strengthening materials that are not only effective but also durable, economical, and easy to apply. Among various retrofit solutions, polyurea (PU) has gained attention due to its excellent mechanical properties, including high durability, high ductility, rapid curing, and suitability for wrapping applications on existing structures [24,25,26,27,28,29]. In particular, stiff-type polyurea (STPU), developed by Lee et al. [30], has shown improved mechanical characteristics compared to conventional PU, with a tensile strength of 28 MPa, an elongation of 250%, and an elastic modulus of 112 MPa. The enhanced tensile strength and reduced elongation of STPU suggest a higher energy absorption capacity, improved load-carrying capacity, and greater confinement effects when used in structural retrofitting [31].
In this study, STPU was selected as a retrofitting material to strengthen masonry walls subjected to seismic loads. To evaluate its effectiveness under seismic loads, shaking table tests were conducted on three types of specimens: non-strengthened, STPU-strengthened, and STPU + GFRP-strengthened masonry walls. Seismic loads were applied in the out-of-plane direction with additional mass loading on top of the specimens, and the resulting seismic resistance was assessed through experiments and numerical simulations using ABAQUS CAE/2022. Considering the dynamic nature of the applied loads and the relatively large size of the test specimens, an efficient simplified micro-modeling approach was adopted to ensure a reasonable computational time while accurately capturing the global behavior of the retrofitted masonry walls. The validity and effectiveness of this modeling strategy were confirmed through comparison with experimental results. Detailed modeling procedures, assumptions, and validation results are discussed in the following sections.

2. Experimental Evaluation

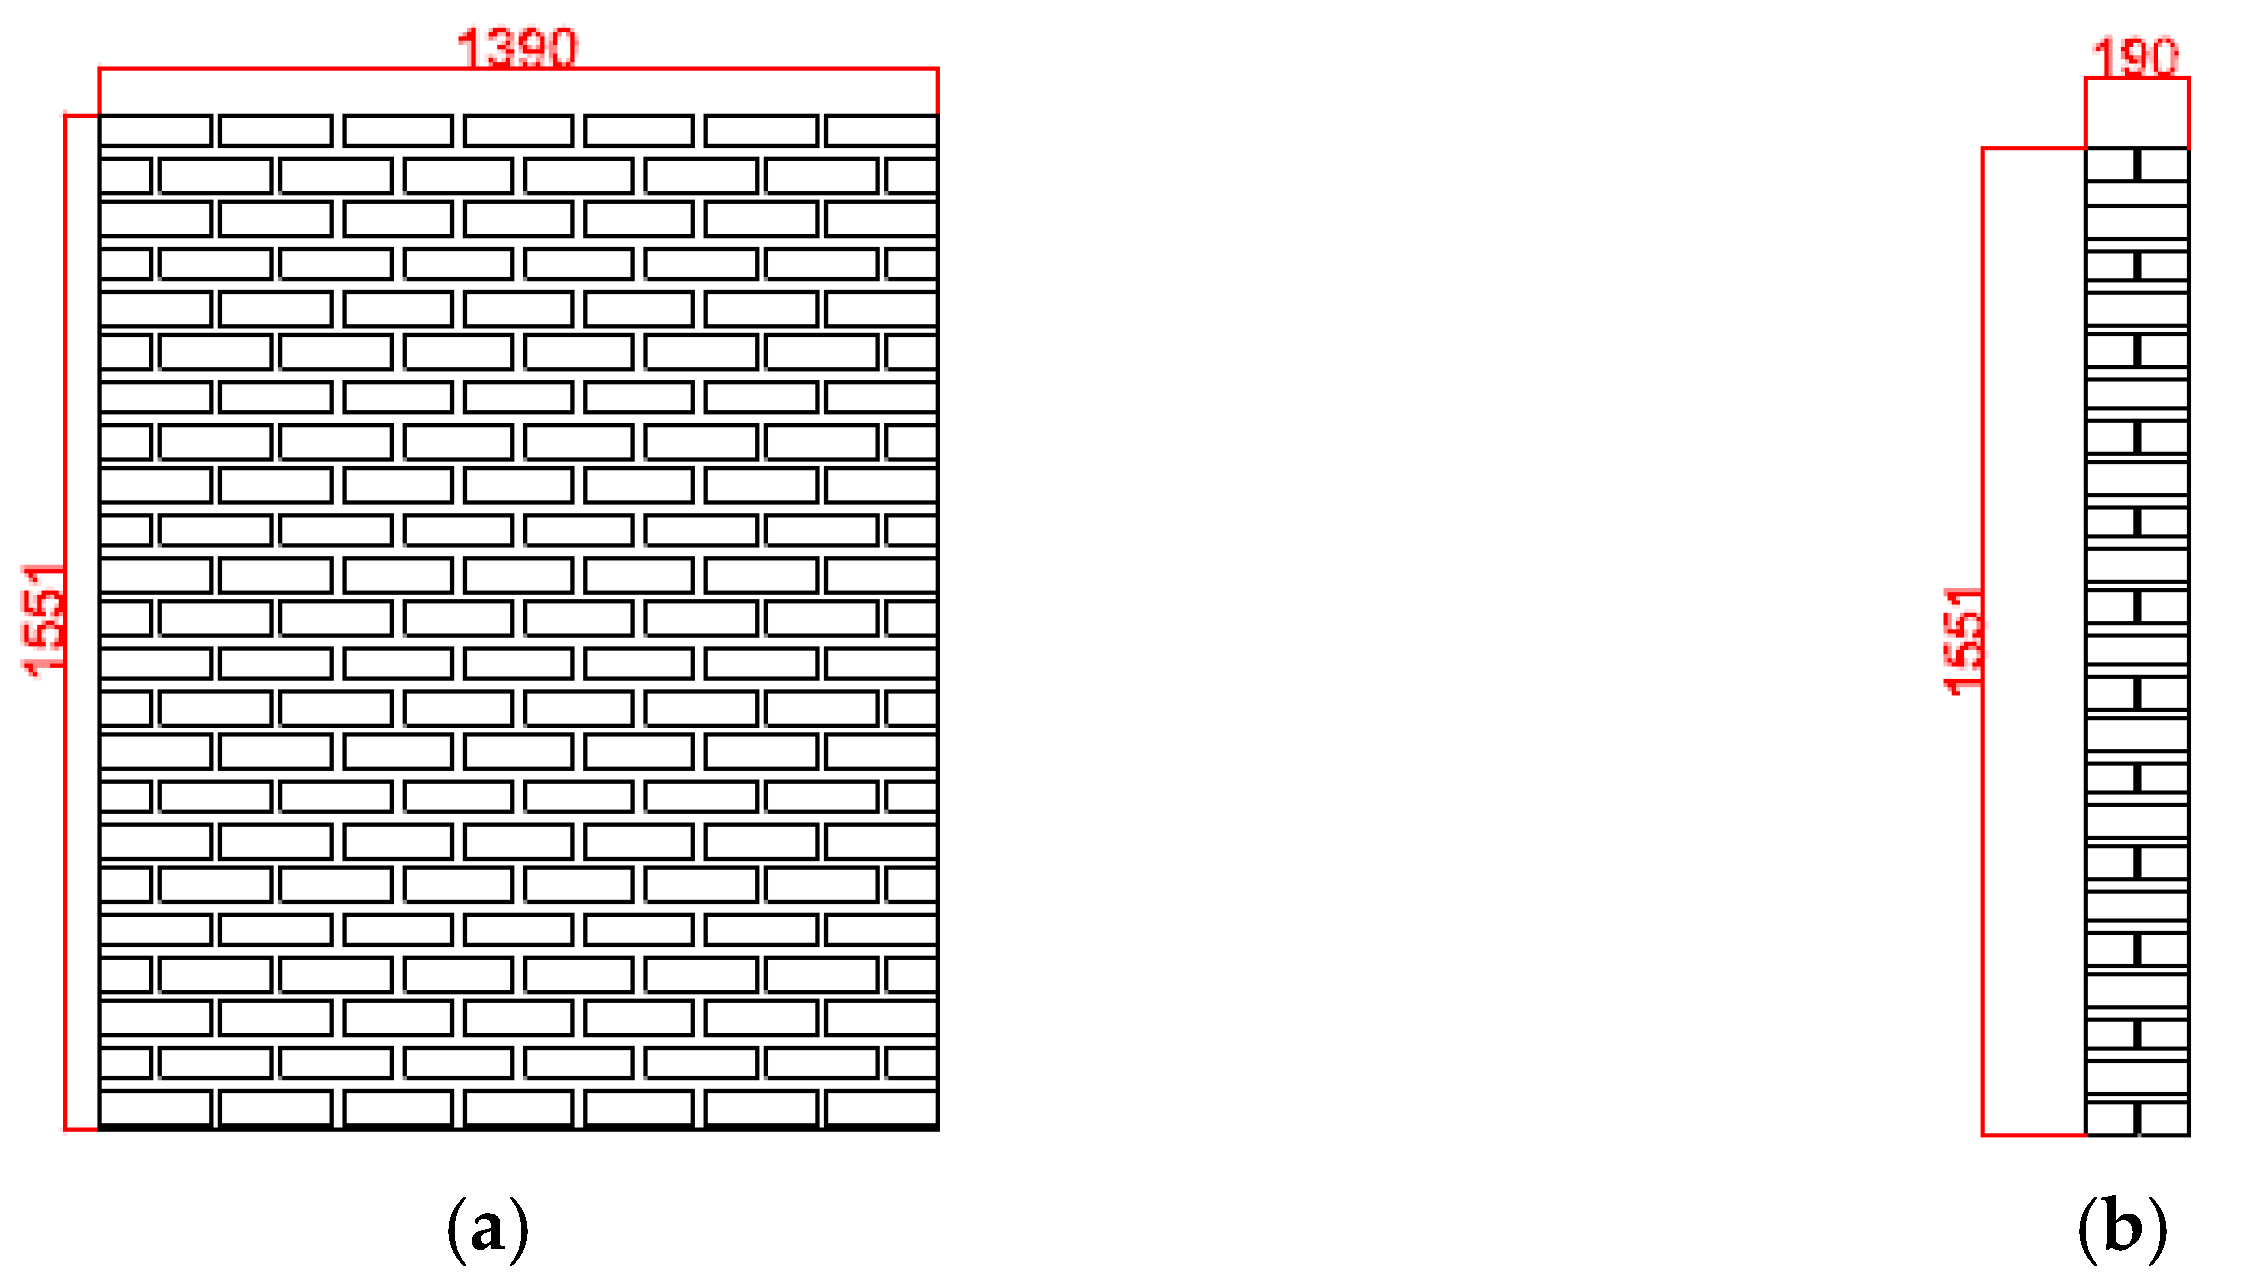
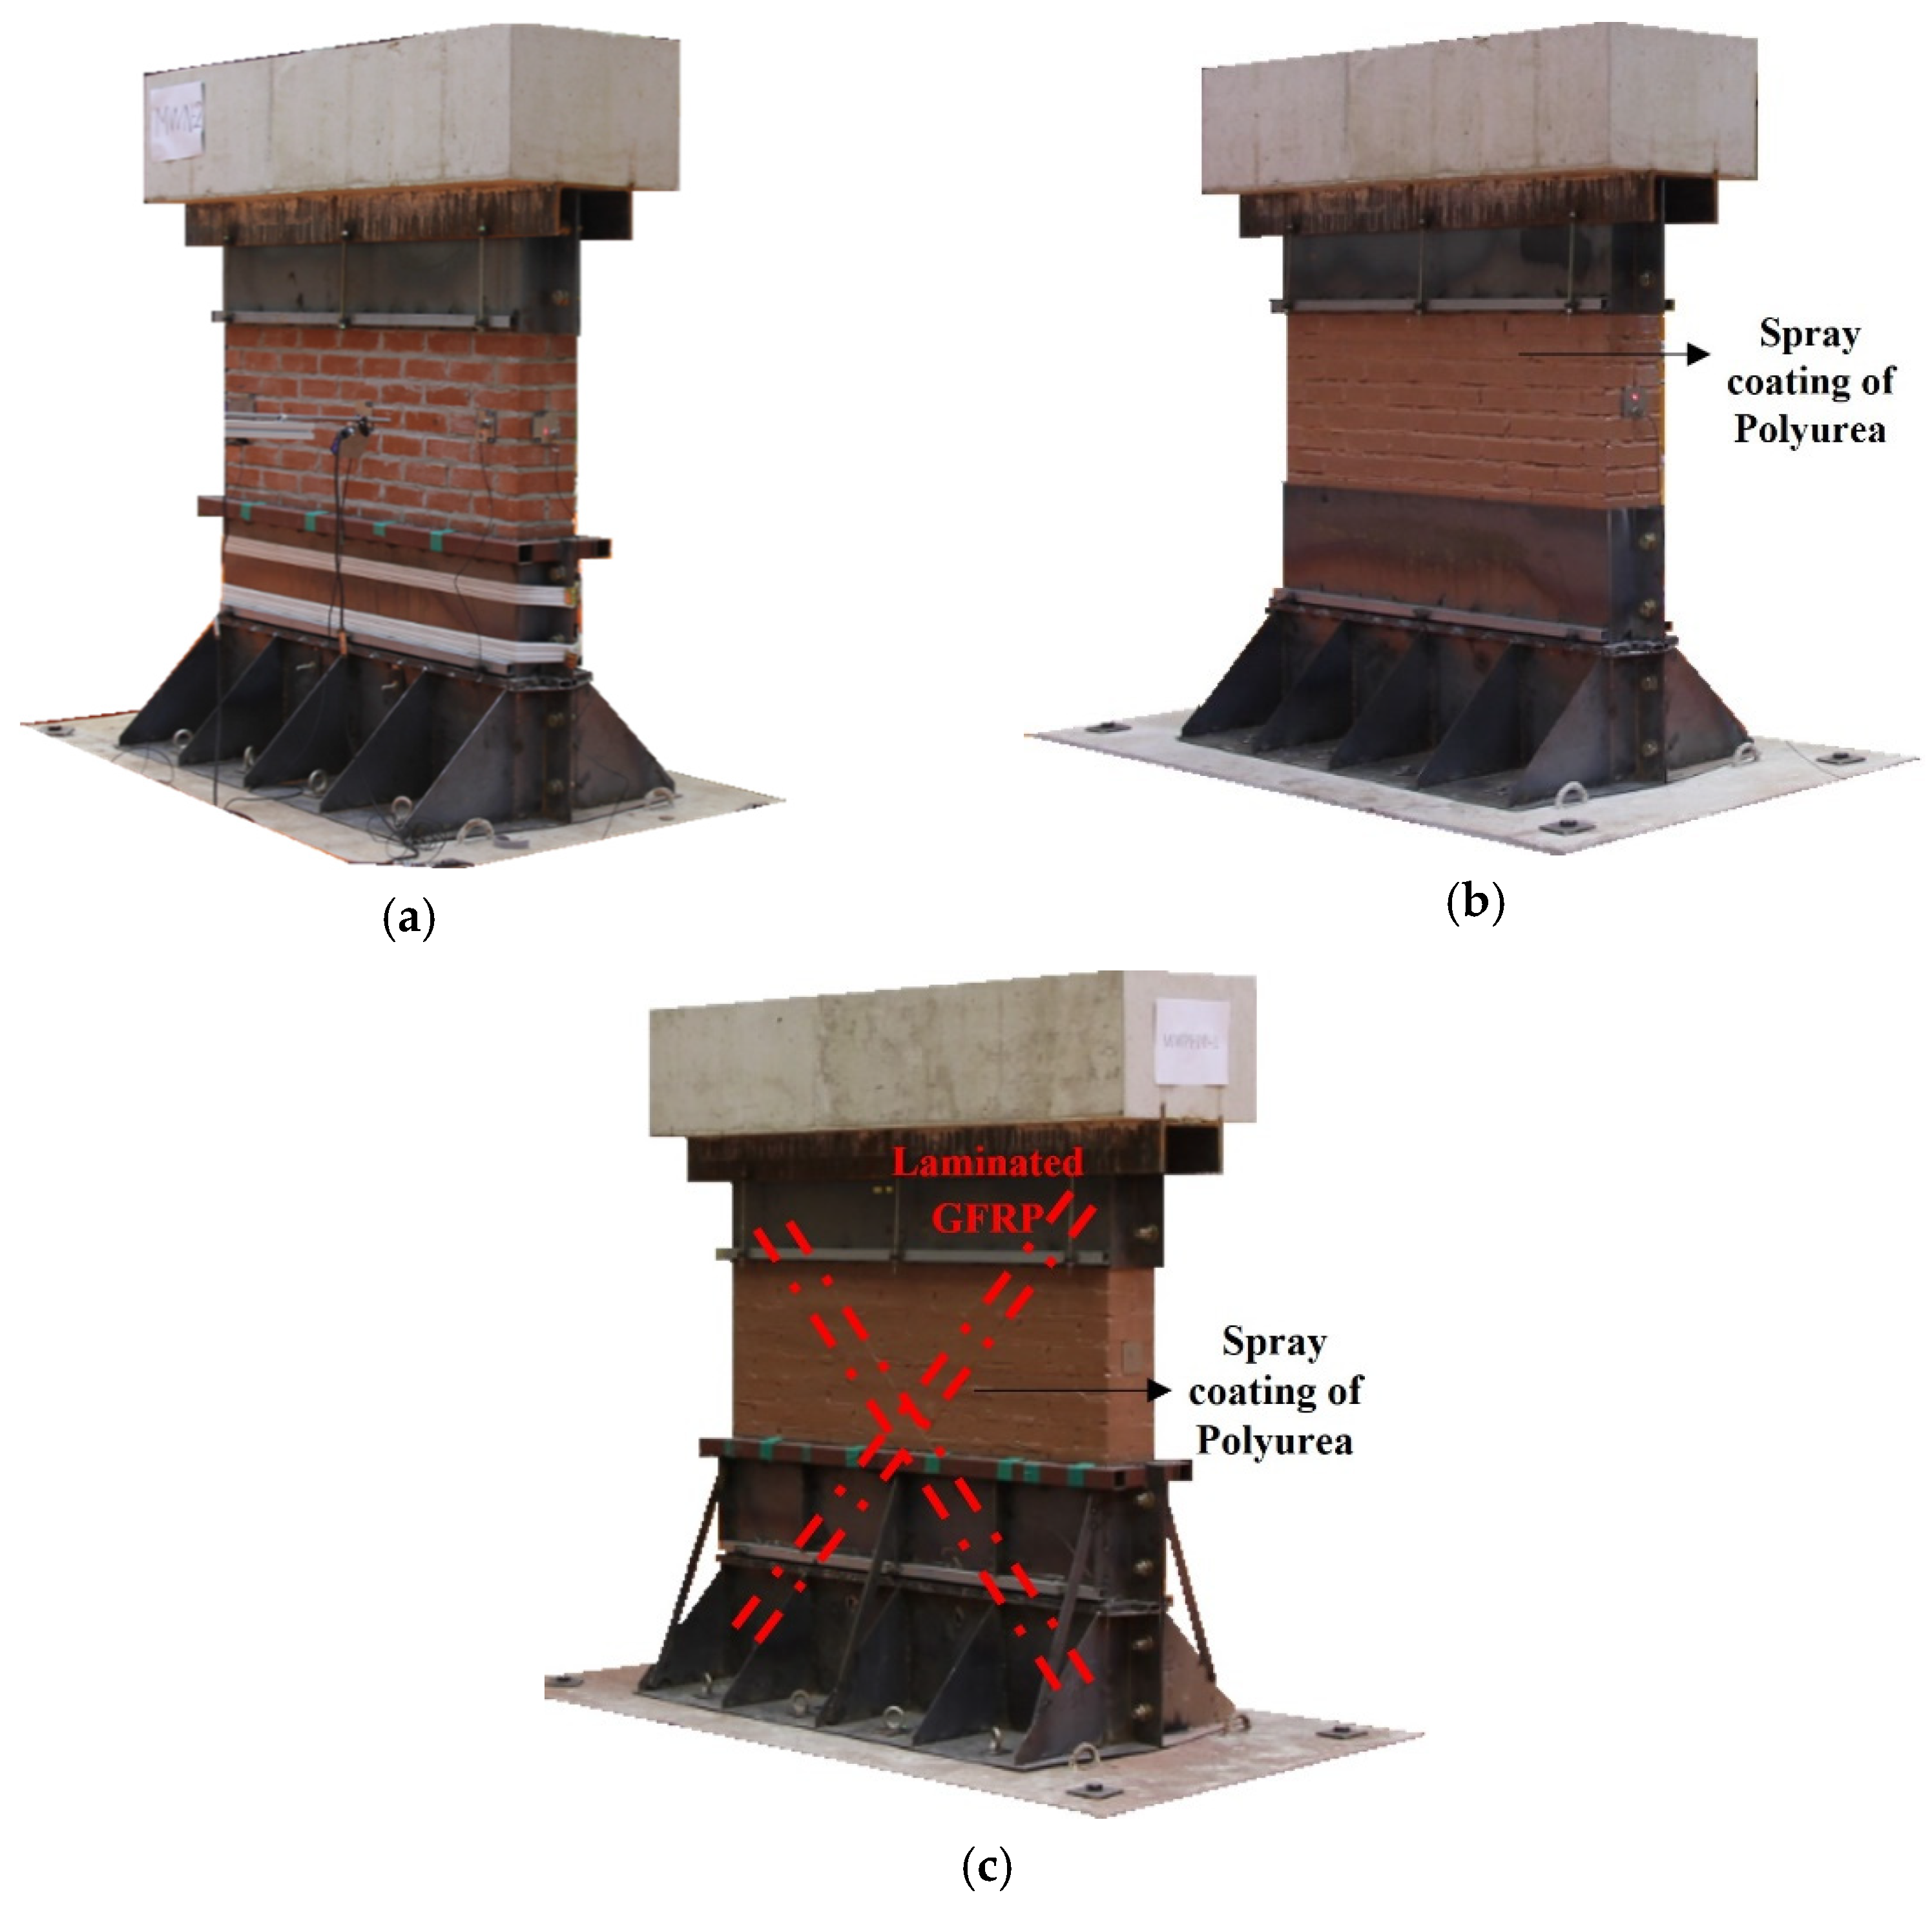
2.1. Shaking Table Test Specimens

In the shaking table test, the masonry wall specimen had dimensions of 1390 mm × 1551 mm × 190 mm and weighed 700 kg, as shown in Figure 1. The clay brick dimensions were 190 mm × 57 mm × 90 mm and comprised 23 layers with 10 mm mortar joints. The compressive strengths of clay brick and mortar are 25 and 16 MPa, respectively. Three different types of masonry wall specimens were prepared, as illustrated in Figure 2. The first type, designated as MWN, consisted of non-retrofitted control specimens. The second type, MWP2, was retrofitted with a 2 mm thick layer of STPU. The third type, MWP5, consisted of specimens retrofitted with X-shaped laminated GFRP strips, 5 mm in width, followed by the application of a 2 mm thick STPU layer on top. The GFRP used for strengthening had a tensile strength of 900 MPa and an elastic modulus of 45 GPa. A total of three MWN specimens were fabricated, including one for preliminary testing, whereas two specimens were prepared for each of the retrofitted types, MWP2 and MWP5.

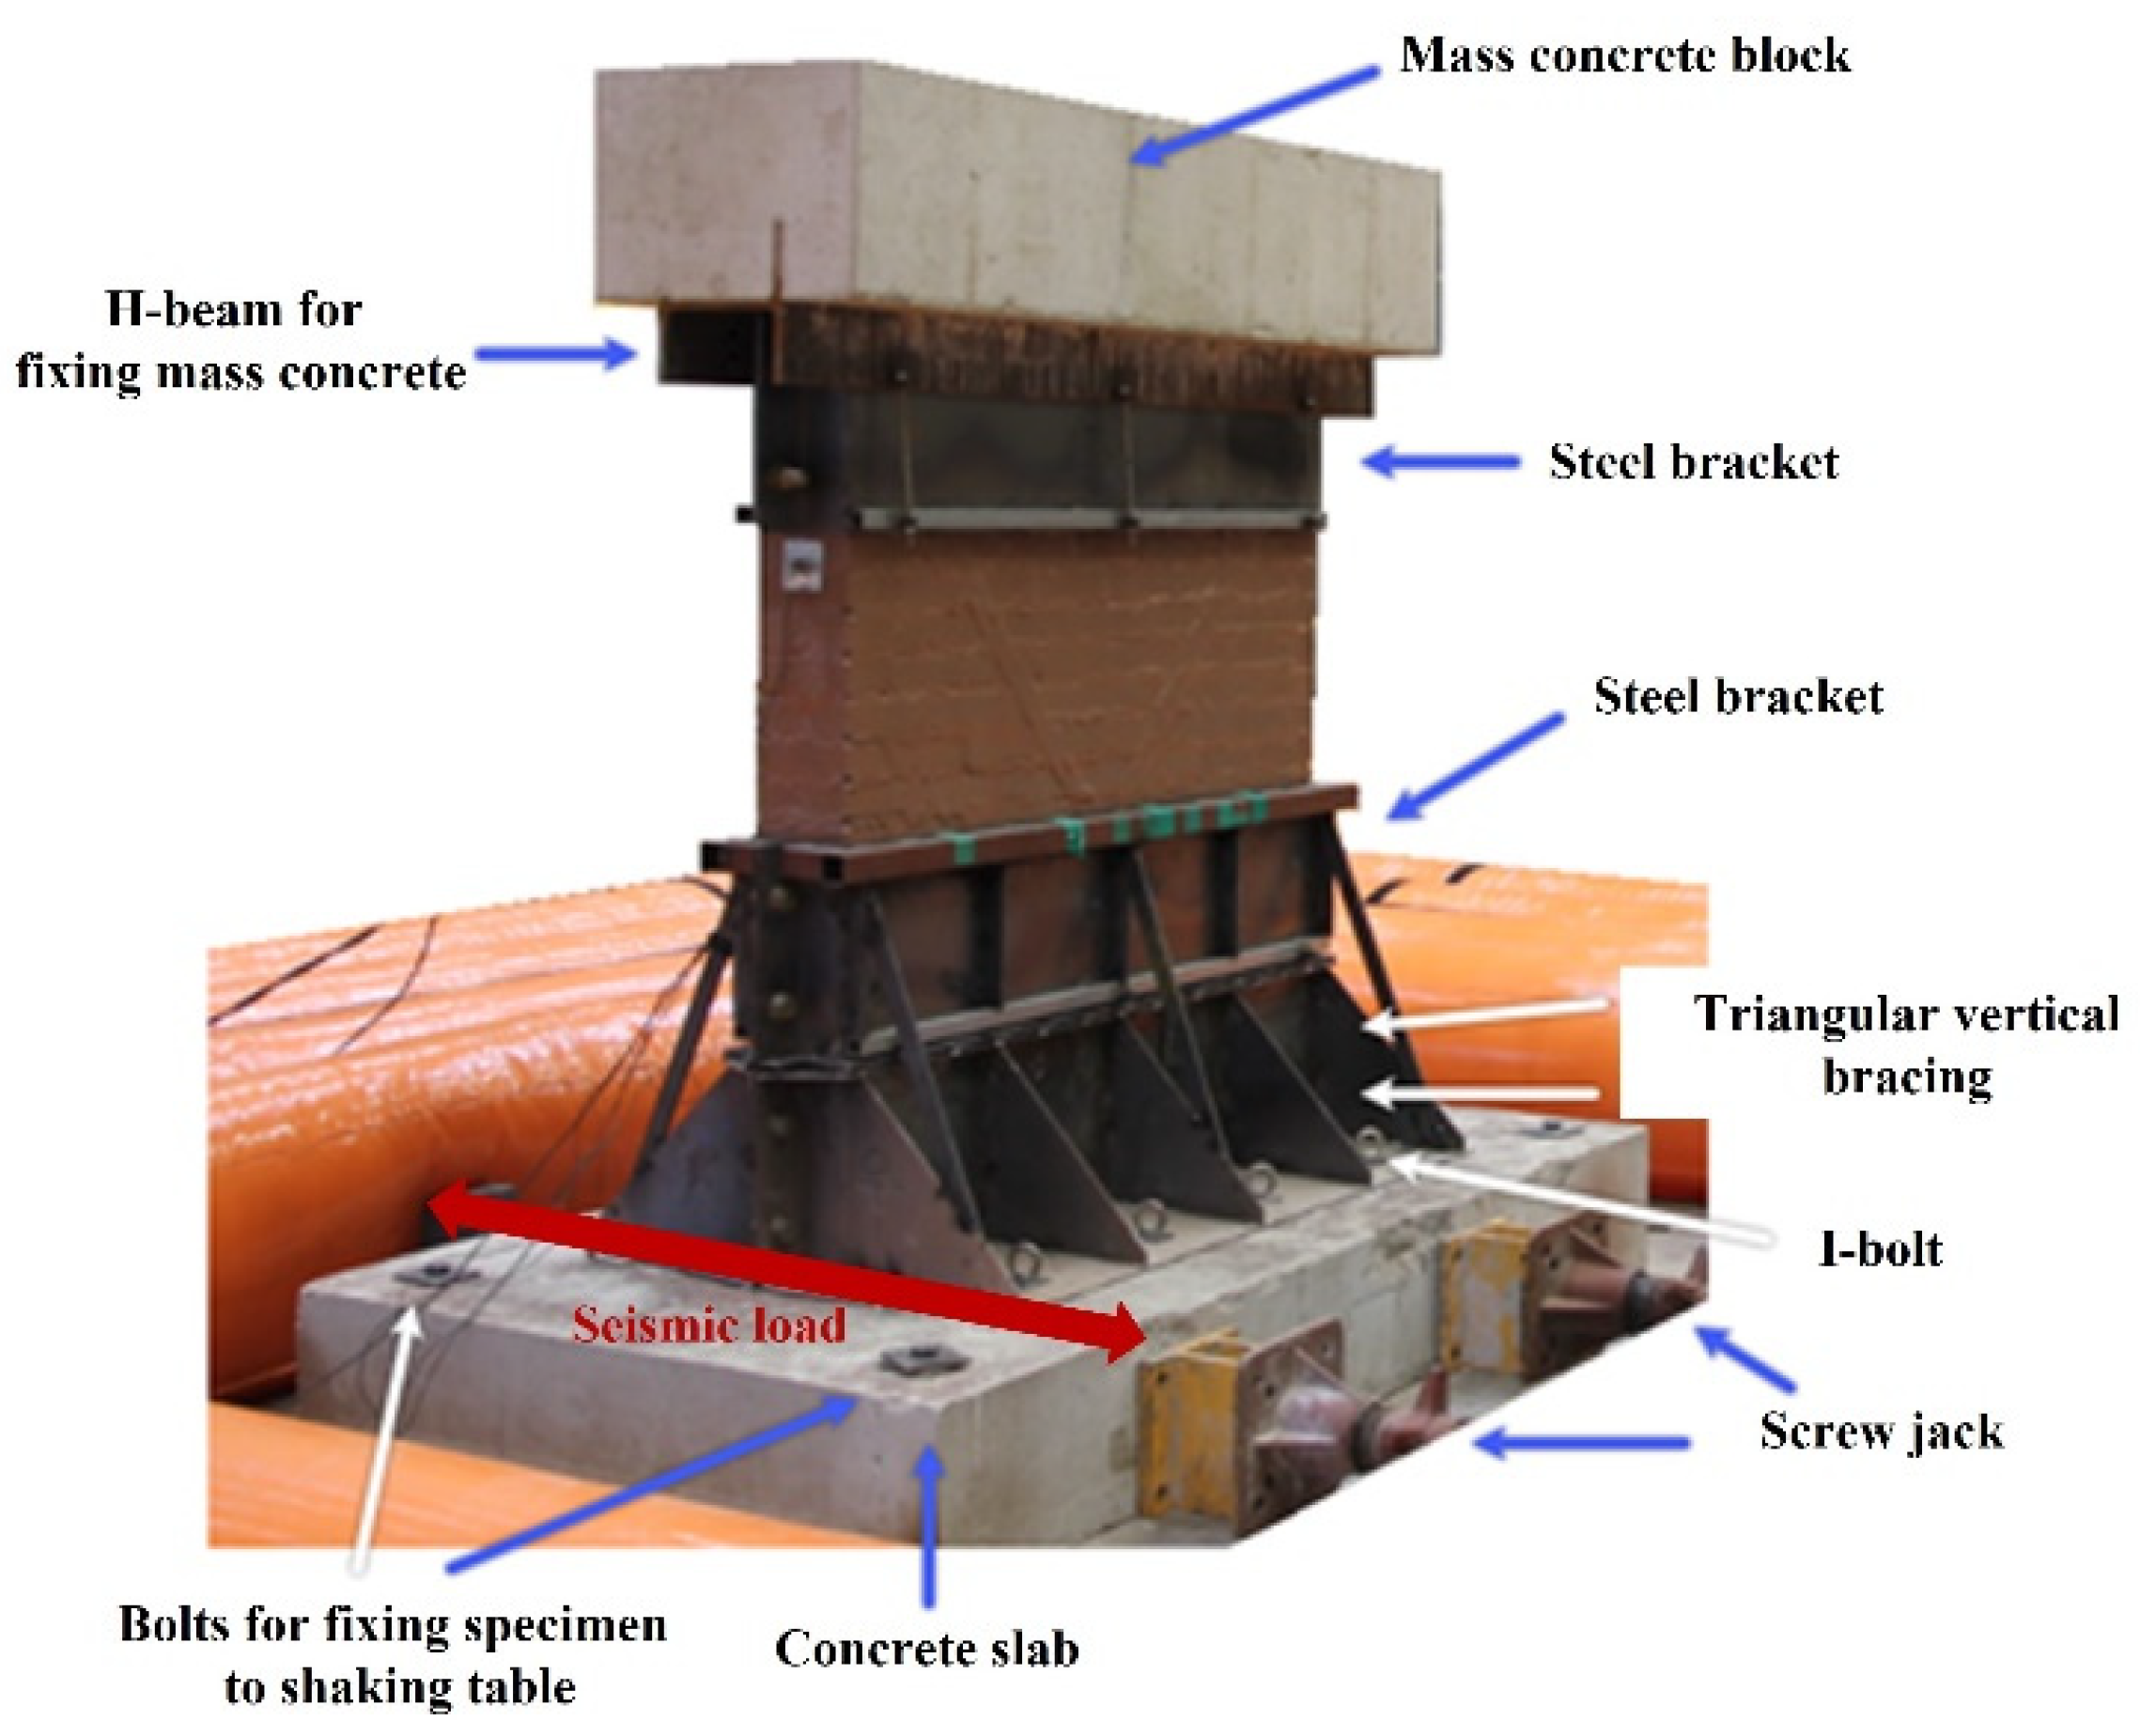
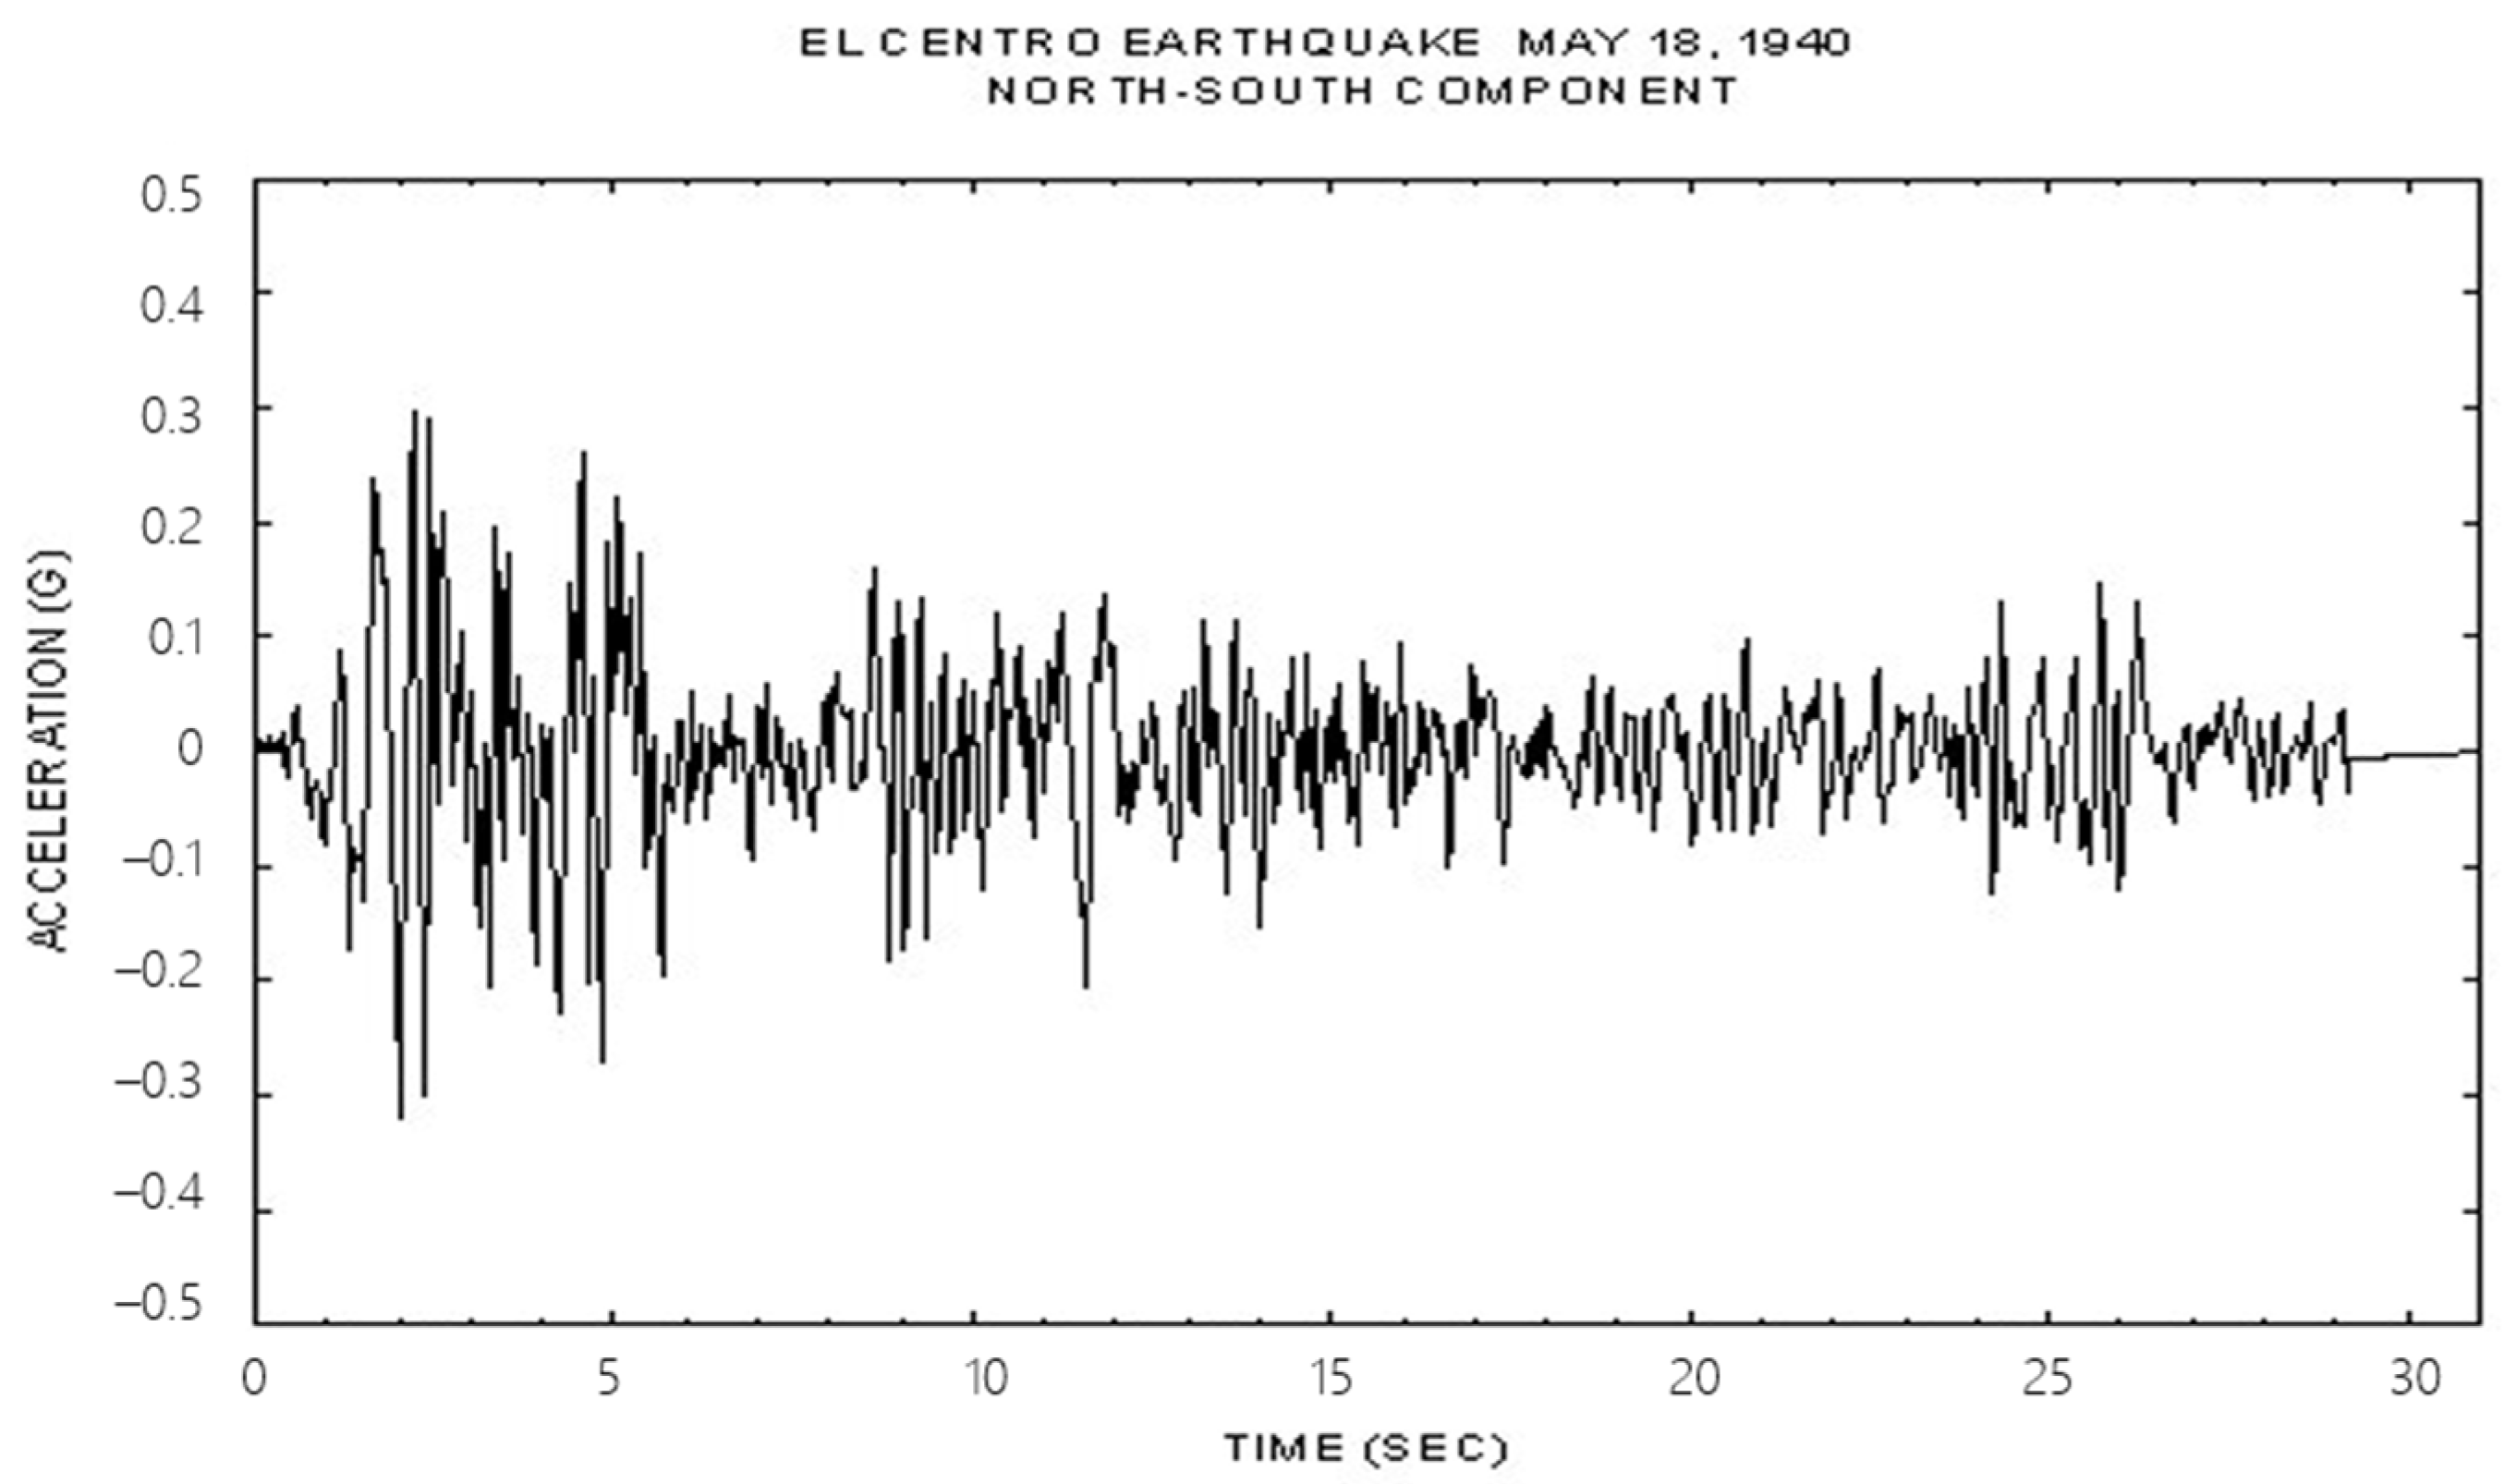
2.2. Shaking Table Test Setup

The experimental configuration for the shaking table test is illustrated in Figure 3. To connect the specimen to the shaking table, the masonry wall was mounted on top of a 2300 × 300 × 1500 mm concrete slab and fixed using bolts. A 1750 × 370 × 540 mm concrete block was placed on top of the masonry wall to apply vertical loading and generate inertial forces during the shaking table test. Steel brackets were installed at the bottom 880 mm and top 440 mm of the wall. This restraint configuration was intentionally designed to prevent premature failure at both ends of the wall and to guide damage initiation toward the center. This setup ensured that the failure occurred within the retrofitted region, allowing for clearer observation of the strengthening effects across specimen types. Although this configuration may differ from real boundary conditions in building walls, it enabled controlled crack development and reproducible comparison between experimental and numerical results. The seismic load was applied in the out-of-plane direction using El Centro earthquake records, as shown in Figure 4. The El Centro ground motion was selected due to its historical significance and well-characterized frequency content (1–2 Hz), which overlaps with the natural frequency range of typical unreinforced masonry structures [32,33]. The load was first applied with a peak ground acceleration (PGA) of 0.1 g and then increased by 0.1 g increments until the specimen failed.

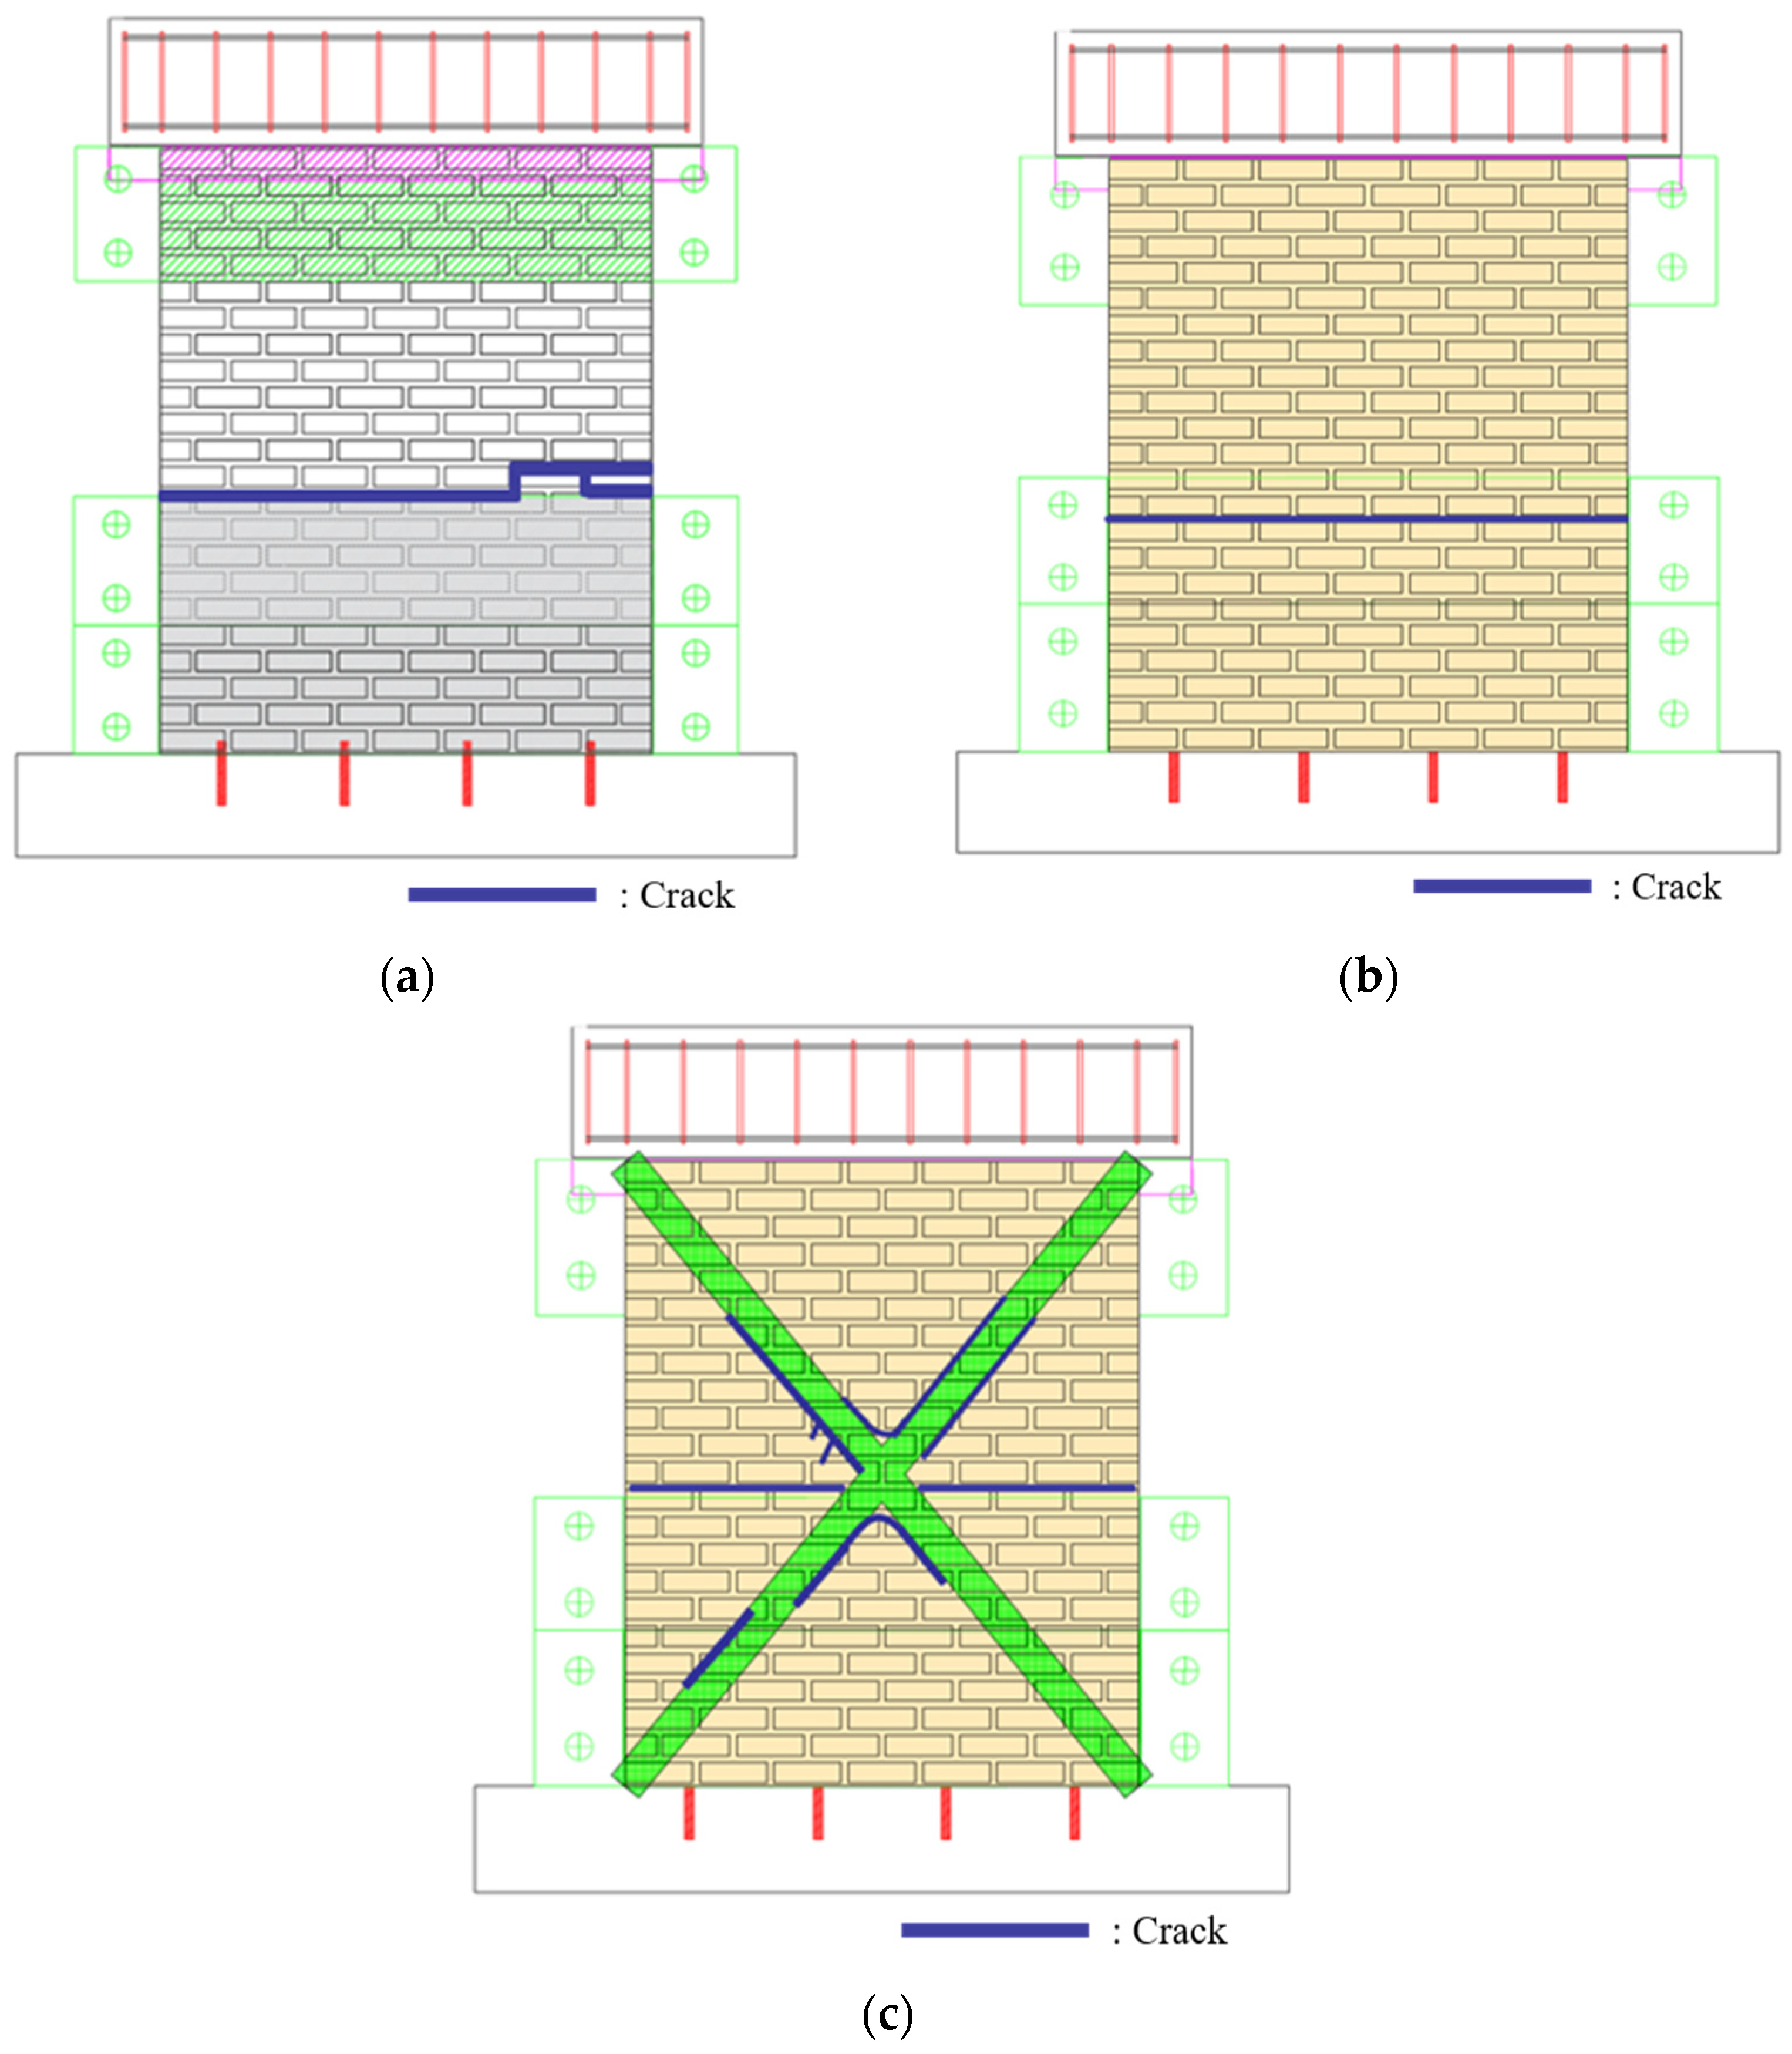
2.3. Shaking Table Test Results

The seismic performance of the three specimen types was evaluated through shaking table tests. The MWN specimens exhibited failure at PGA of 0.4–0.5 g. Specimens retrofitted with STPU (MWP2) demonstrated improved seismic resistance, withstanding up to 0.7–0.8 g. The MWPF5 specimens, which were strengthened using both GFRP and STPU, exhibited the highest resistance, enduring seismic loads up to 0.9–1.0 g.
Crack patterns were consistent with the intended design. In all specimen types, initial cracks developed just above the lower steel bracket, indicating that the restraining configuration effectively guided damage to the central region of the wall as shown in Figure 5. While MWN specimens showed extensive cracking and rapid failure progression, MWP2 specimens demonstrated a more ductile response. MWPF5 specimens exhibited localized cracking around the GFRP reinforcement zones, and although significant displacement was observed at high PGA levels, structural collapse did not occur until debonding between the GFRP and masonry was apparent.
These results suggest that STPU effectively enhances ductility and energy dissipation capacity under out-of-plane seismic loading. Furthermore, the addition of GFRP increases overall stiffness and strength, resulting in higher seismic load capacity. However, the increased stiffness also led to higher acceleration responses and a potential for brittle failure upon debonding. A more detailed evaluation of these results, including comparative analysis with finite element models, is presented in the subsequent sections.

3. Numerical Evaluation

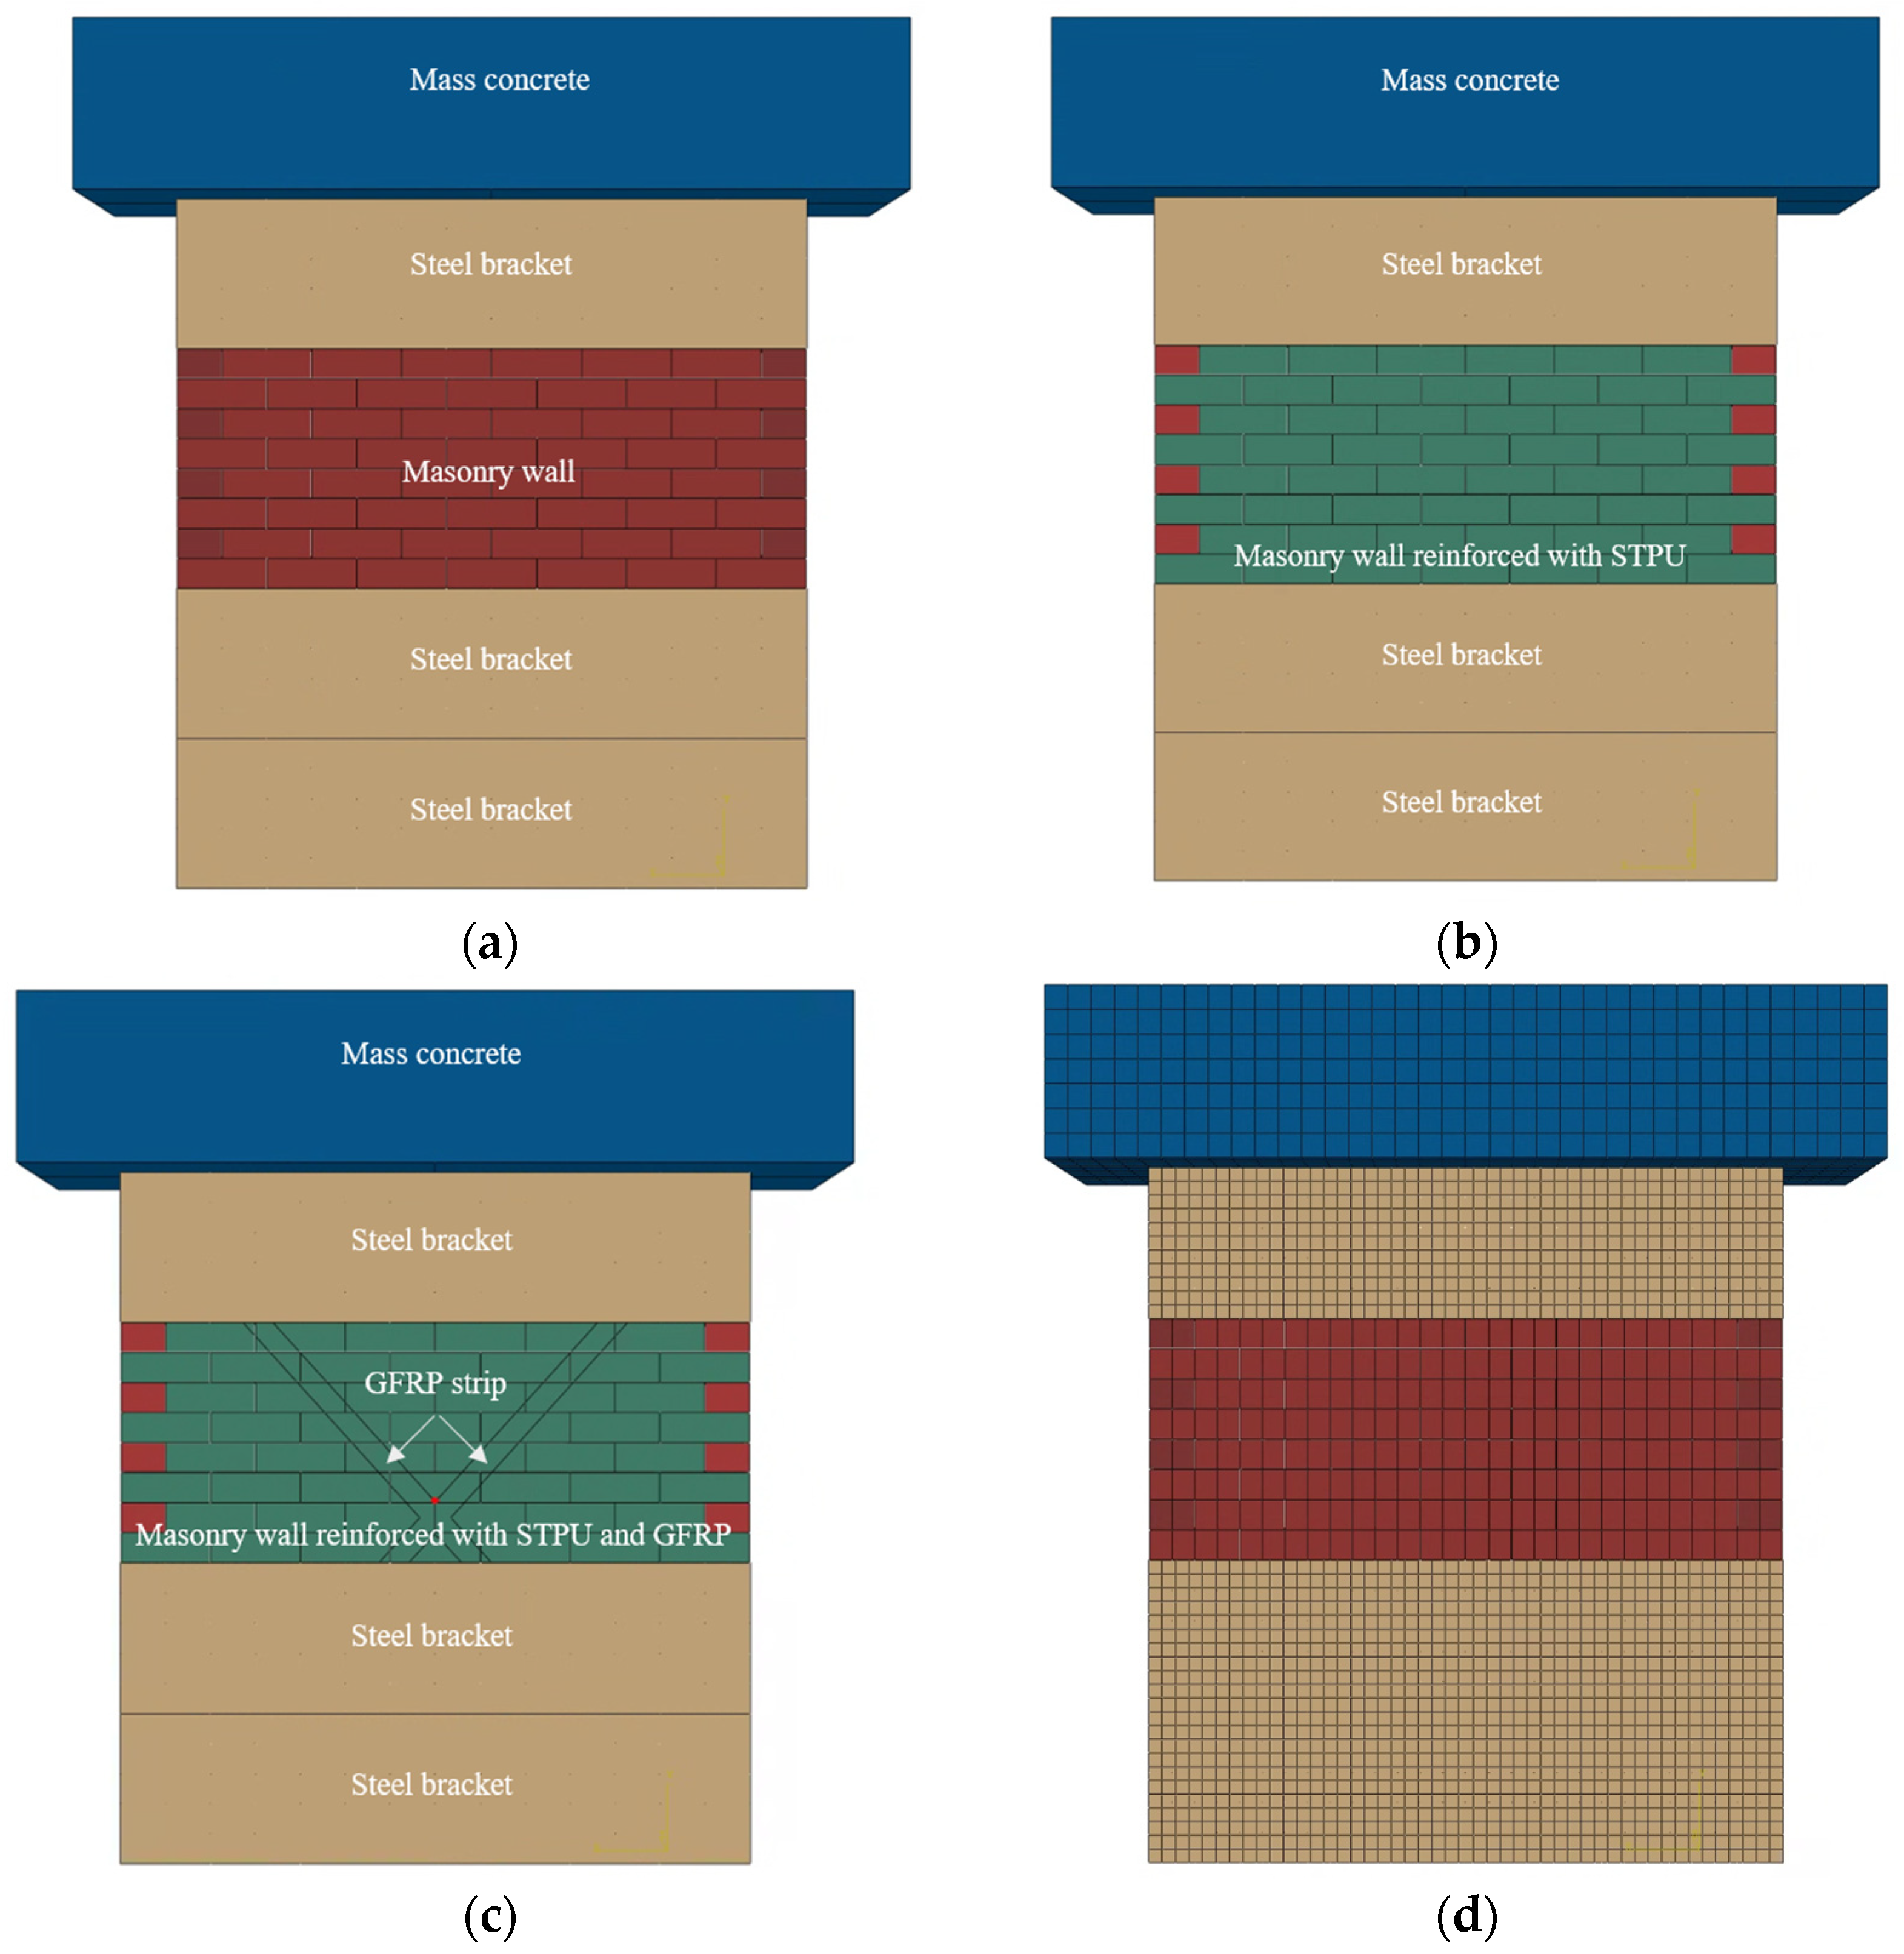
3.1. Introduction to Numerical Modeling

Three widely accepted strategies have been developed for the finite element modeling of masonry walls: the detailed micro-model, the simplified micro-model, and the macro-model, as illustrated in Figure 6, based on the classifications proposed by Lourenço (1997, 2002) [34,35]. In this study, the simplified micro-model was adopted to simulate the seismic behavior of masonry walls. Due to the relatively large size of the test specimens, the simplified micro-model provided a practical balance between computational efficiency and the ability to reproduce key failure patterns observed in the shaking table tests.

3.2. Material Model and Variables for Shaking Table Test

The interaction among the expanded units comprising a masonry wall plays an important role in the structural behavior of the wall. Therefore, to model masonry walls, the Drucker–Prager model is applied. This model is advantageous for modeling frictional materials whose yield strengths are higher in compression than in tension [36]. In this study, the input material properties were not assigned separately to the bricks and mortar but were selected as equivalent properties for the expanded unit. These values were referenced in a previous experimental and numerical study [37], and reflect the behavior of typical clay brick masonry under dynamic loading conditions, as shown in Table 1. Material parameters were selected based on values reported in previous published studies involving similar masonry materials tested under dynamic conditions [37].
To model the mechanical behavior of STPU, the Arruda–Boyce model was adopted as the constitutive formulation using a shell element. Polyurea and similar polymers possess a chain-like molecular configuration and are capable of sustaining large strains exceeding 100%, which results in highly nonlinear and rubber-like hyperelastic responses. Given these characteristics, the Arruda–Boyce model is particularly appropriate, as it captures the material’s behavior from a micromechanical perspective, offering high accuracy in representing large deformations [38,39].
The model is derived based on statistical mechanics, where a representative volume element is composed of eight polymer chains arranged diagonally within a hexahedral structure, as depicted in Figure 7. The material is treated as incompressible, and its stress–strain relationship is formulated through a strain energy potential function, expressed as Equation (1) [40].
U = μ 1 2 I 1 ¯ 3 + 1 20 λ m 2 I 1 ¯ 2 9 + 11 1050 λ m 4 I 1 ¯ 3 27 + 19 7000 λ m 6 I 1 ¯ 4 81 + 519 673750 λ m 8 I 1 ¯ 5 243 + 1 D J e l 2 1 2 ln J e l
Here, λ m is the elongation rate in longitudinal direction; I ¯ is the deviatoric strain invariant; J e l is the elastic volumetric rate; and μ and D are the volume compression controlling material coefficients.
To reflect the physical properties of STPU in the numerical analysis, the strain–stress data obtained from the tensile strength test were applied to the material model, as shown in Figure 8 [30].
A shell element was also utilized to model the laminated GFRP. The material model used is the lamina model, which is mainly employed for laminated FRP. The elastic properties of GFRP are summarized in Table 2, and the failure stress used as a sub-option is listed in Table 3 based on a previous study [41].

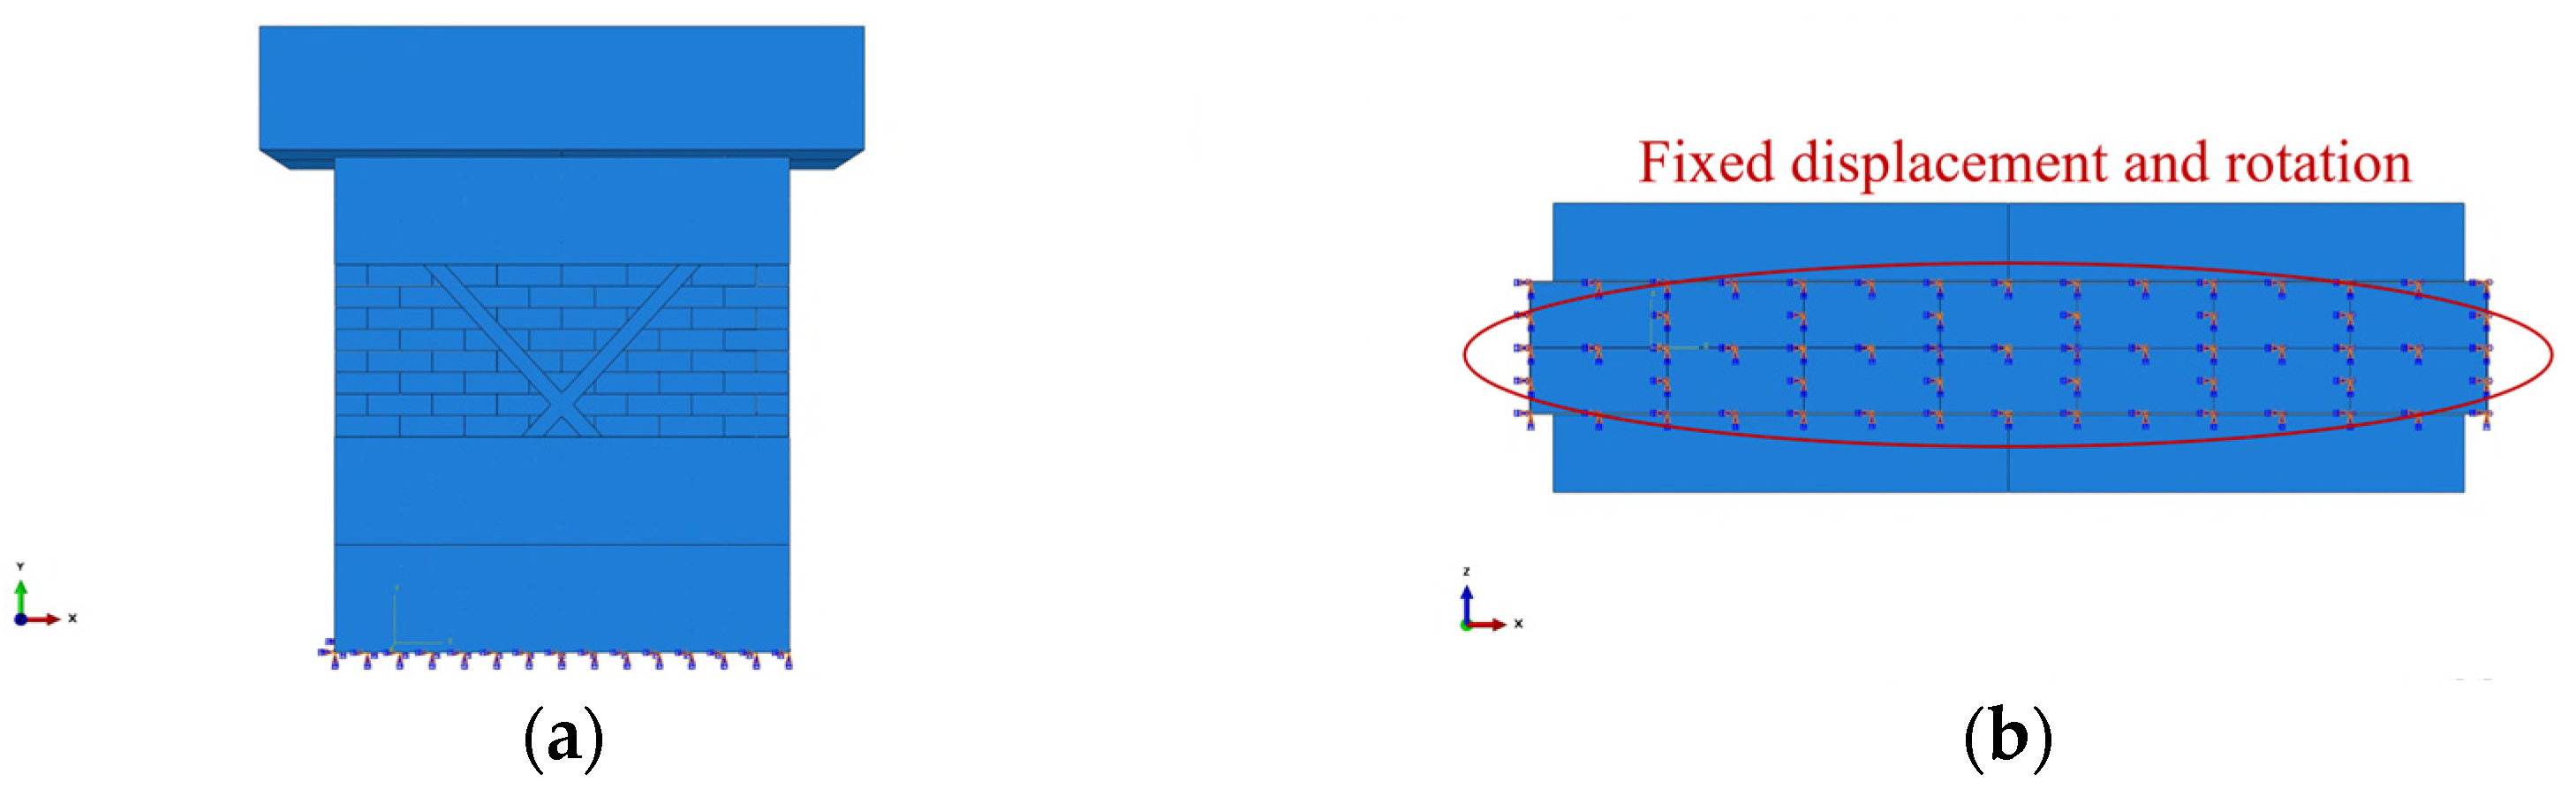
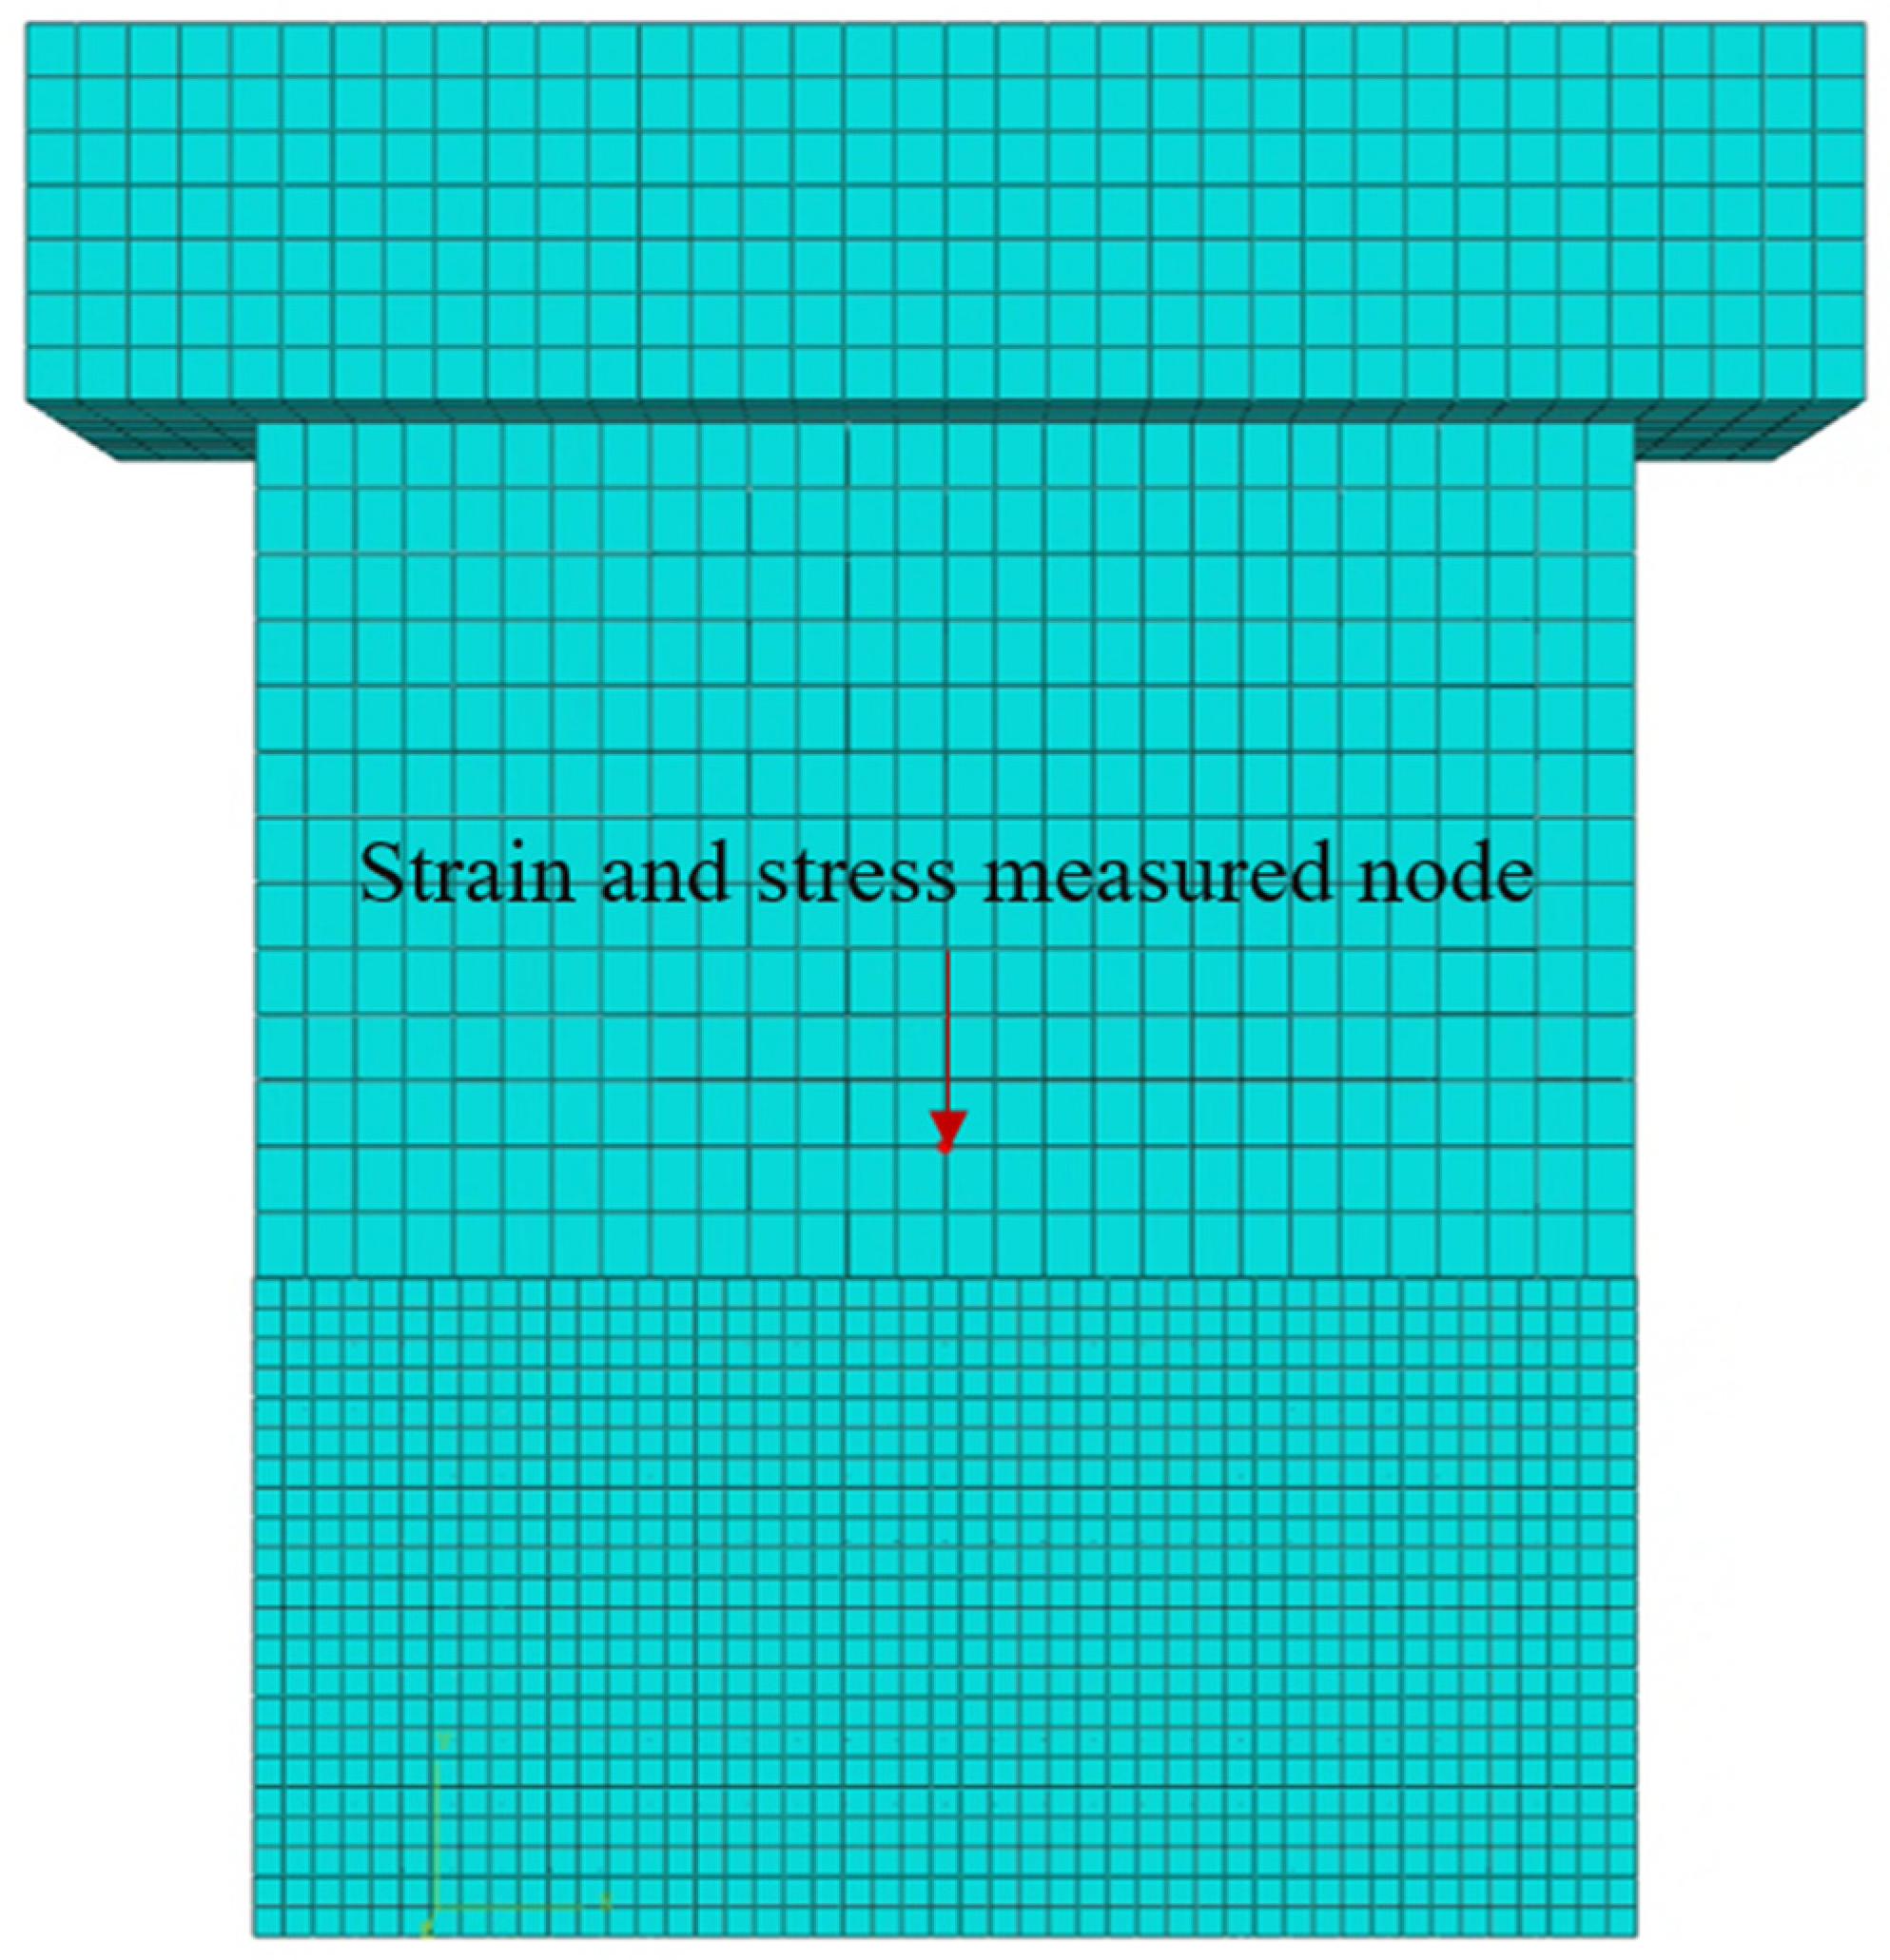
3.3. Numerical Modeling of Shaking Table Test

The finite element models of specimens MWN, MWP2, and MWPF5 using the simplified micro-method are summarized in Figure 9. Figure 9b,c indicate that the STPU does not entirely cover the masonry wall. However, this is a visual result of modeling the STPU as a shell element such that it reinforces the entire surface of the masonry wall. The mesh size of the expanded unit is 50 mm with 8nodes element type C3D8R applied. For the reinforced materials (STPU and GFRP), 30 mm of mesh size and the S4R element type are applied. The mesh size of the expanded unit is 50 mm with 8nodes element type C3D8R applied. For the reinforced materials (STPU and GFRP), 30 mm of mesh size and the S4R element type are applied.
Prior to performing the main seismic analysis, a modal analysis was first conducted to determine the structure’s natural frequencies and corresponding mode shapes. The first mode, with a natural frequency of approximately 8.0 Hz, was then adopted for the modal dynamics analysis. The seismic analysis used modal dynamics, and a 5% damping condition, which is used in general masonry wall structures, was applied. Although modal dynamics analysis does not allow direct observation of crack propagation or structural failure modes, it offers significant advantages in reducing computational time. Failure prediction was addressed indirectly by analyzing strain data at each PGA level and comparing it with the material’s strain capacity. Although modal dynamics analysis typically involves combining multiple vibration modes, only the first mode was used in this study. This is because the first out-of-plane mode dominated the dynamic response of the masonry wall due to the structure’s geometry, boundary conditions, and the frequency content of the input ground motion. The El Centro record used in this study has dominant frequency content near the first mode frequency (approximately 8.0 Hz), making the contribution of higher modes negligible. The boundary condition used in the actual experiment is similar to that employed in the simulation analysis. It is applied to the six degrees of freedom (DOF) of the bottom of the specimen as a fixed condition, as shown in Figure 10. The seismic load was applied to the bottom of the specimen in terms of acceleration, and the gravity load was employed to describe the action of inertia during the seismic load application. To ensure similarity between the experimental and simulation results, the analysis was performed using the acceleration data for each seismic load collected in the shaking table test. Table 4 presents the defined contact interface properties between the expanded units, the STPU layer, and the laminated GFRP based on previous studies [37,41]. In the Abaqus simulation, the interface between the FRP and the masonry wall was defined using a surface-based cohesive contact. The damage-initiation criterion was set to the maximum nominal stress method, with critical values of 2.7 MPa for the normal direction and 0.88 MPa for both shear directions (Shear-1 and Shear-2). Damage evolution was enabled using an energy-based approach, with a total fracture energy of 100 J specified to control the degradation behavior after initiation. These settings allowed simulation of progressive debonding between the FRP and masonry under increasing seismic load.

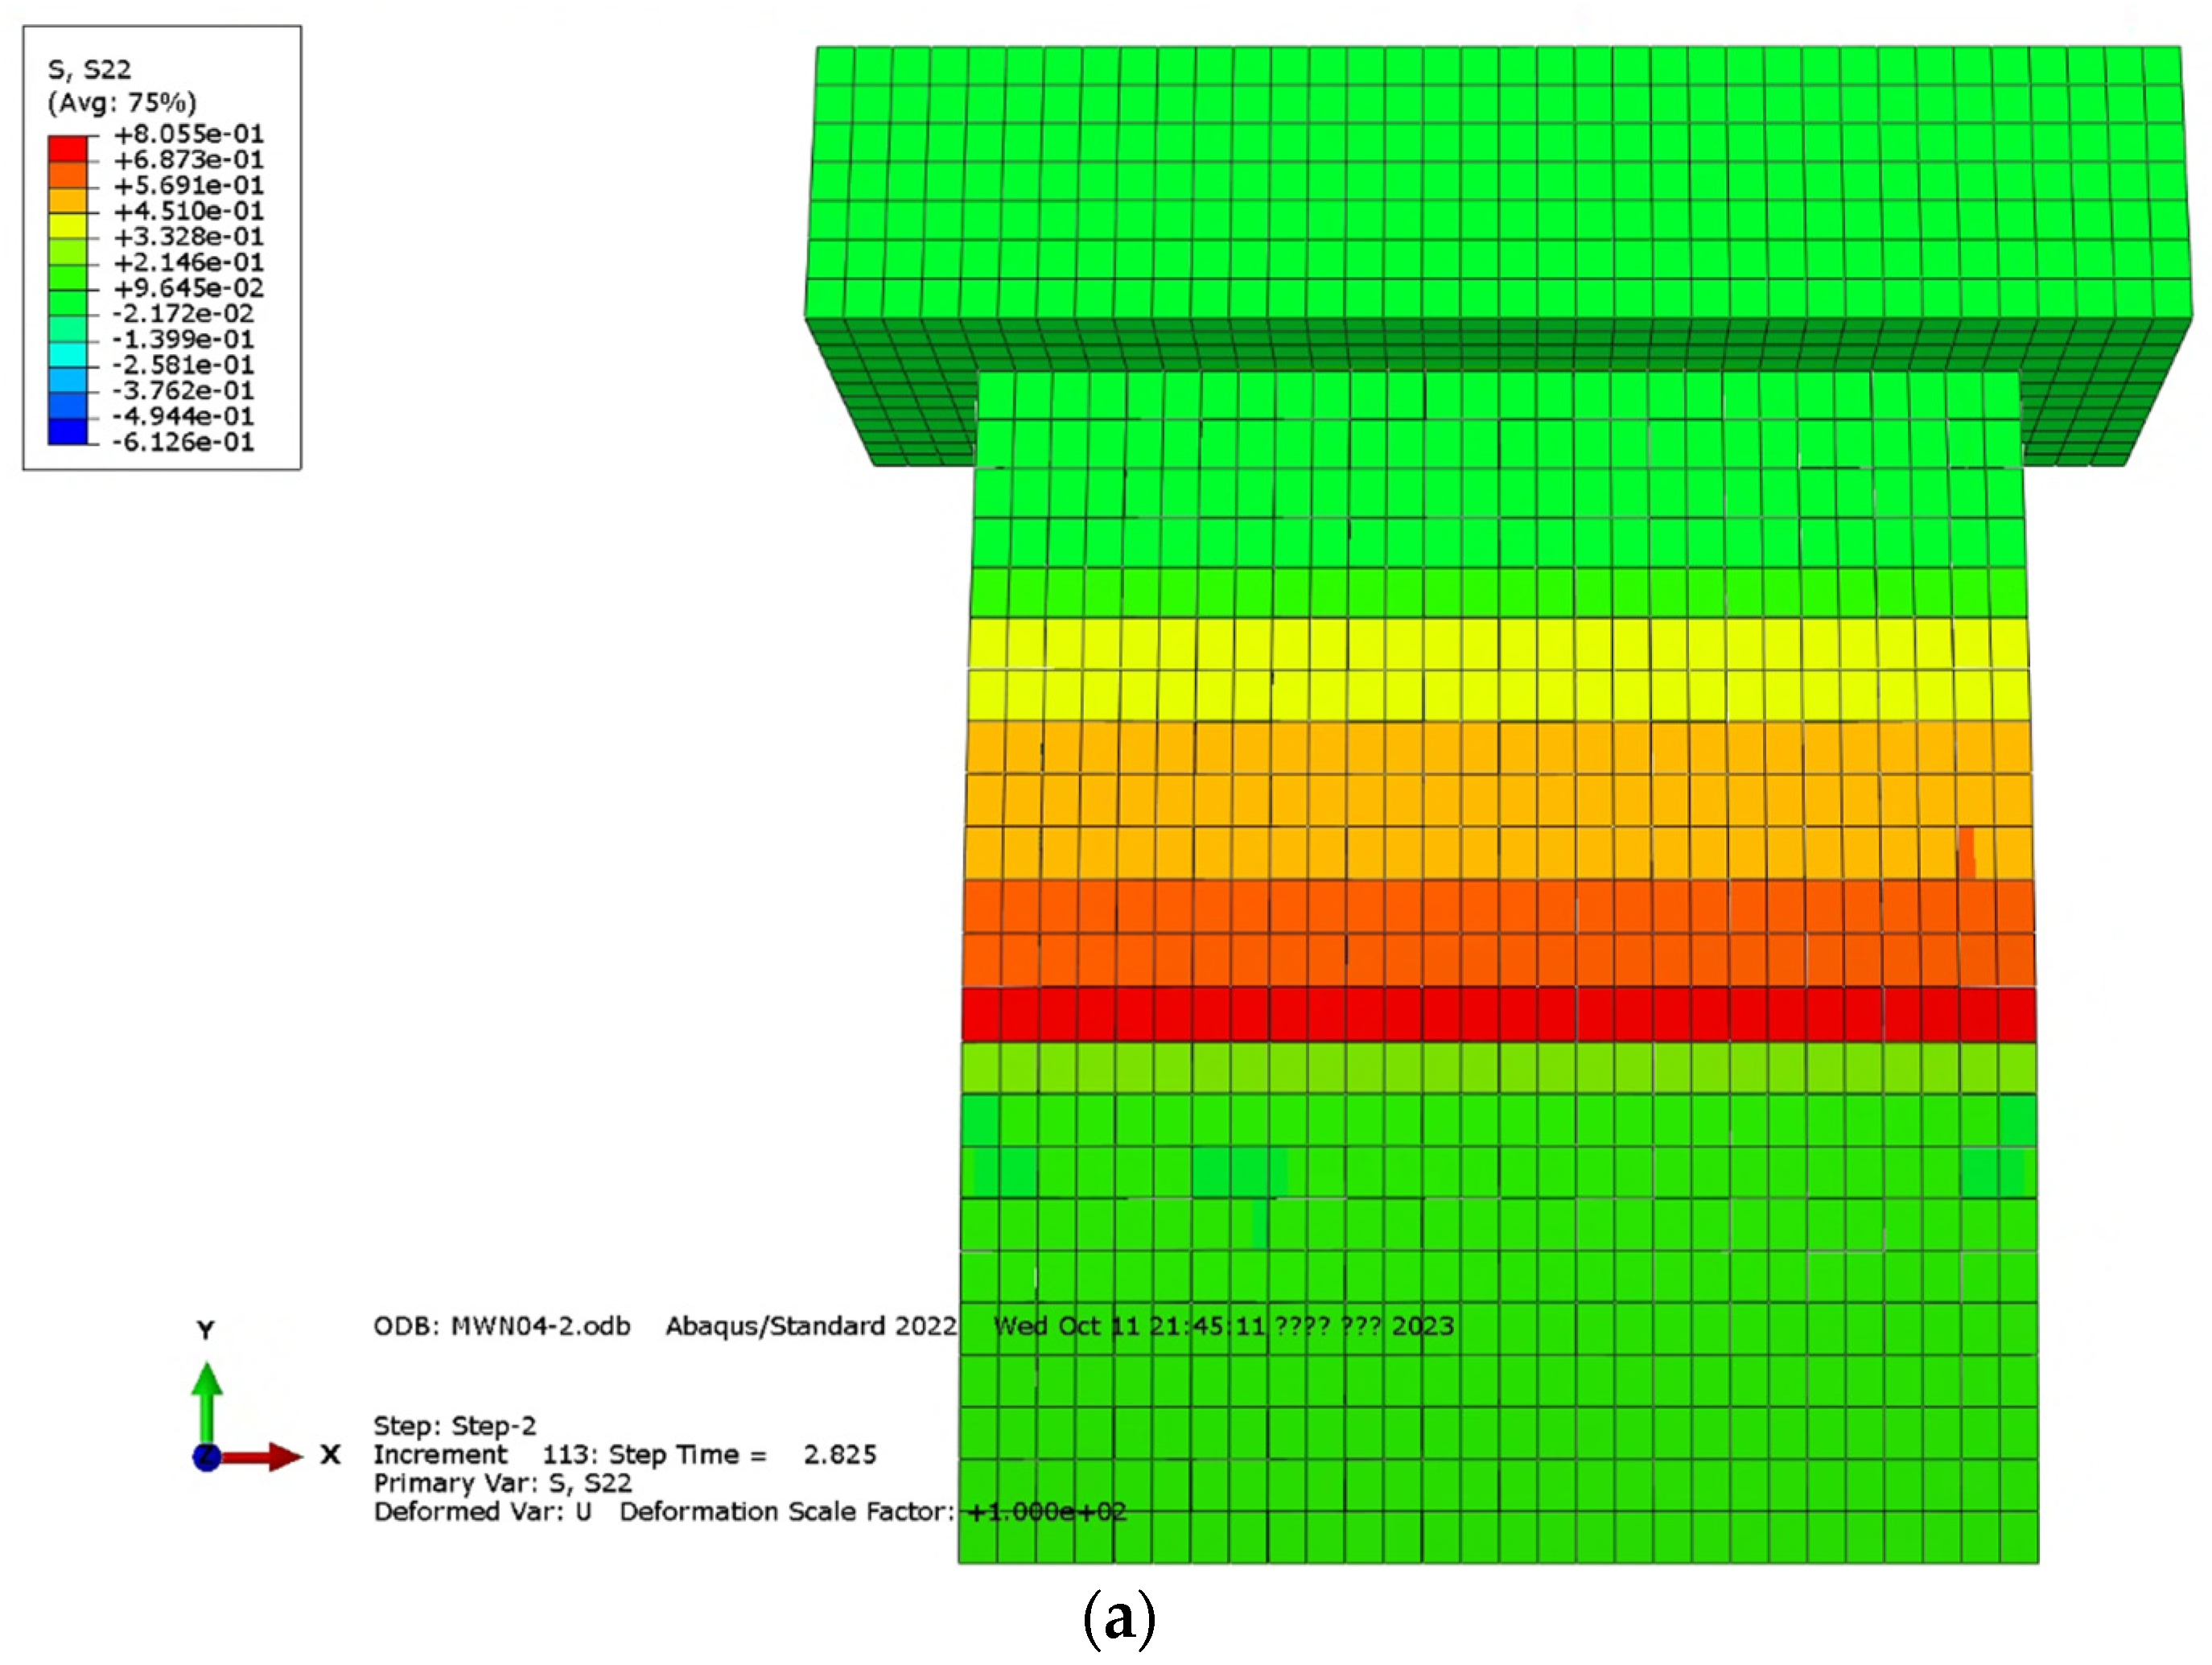
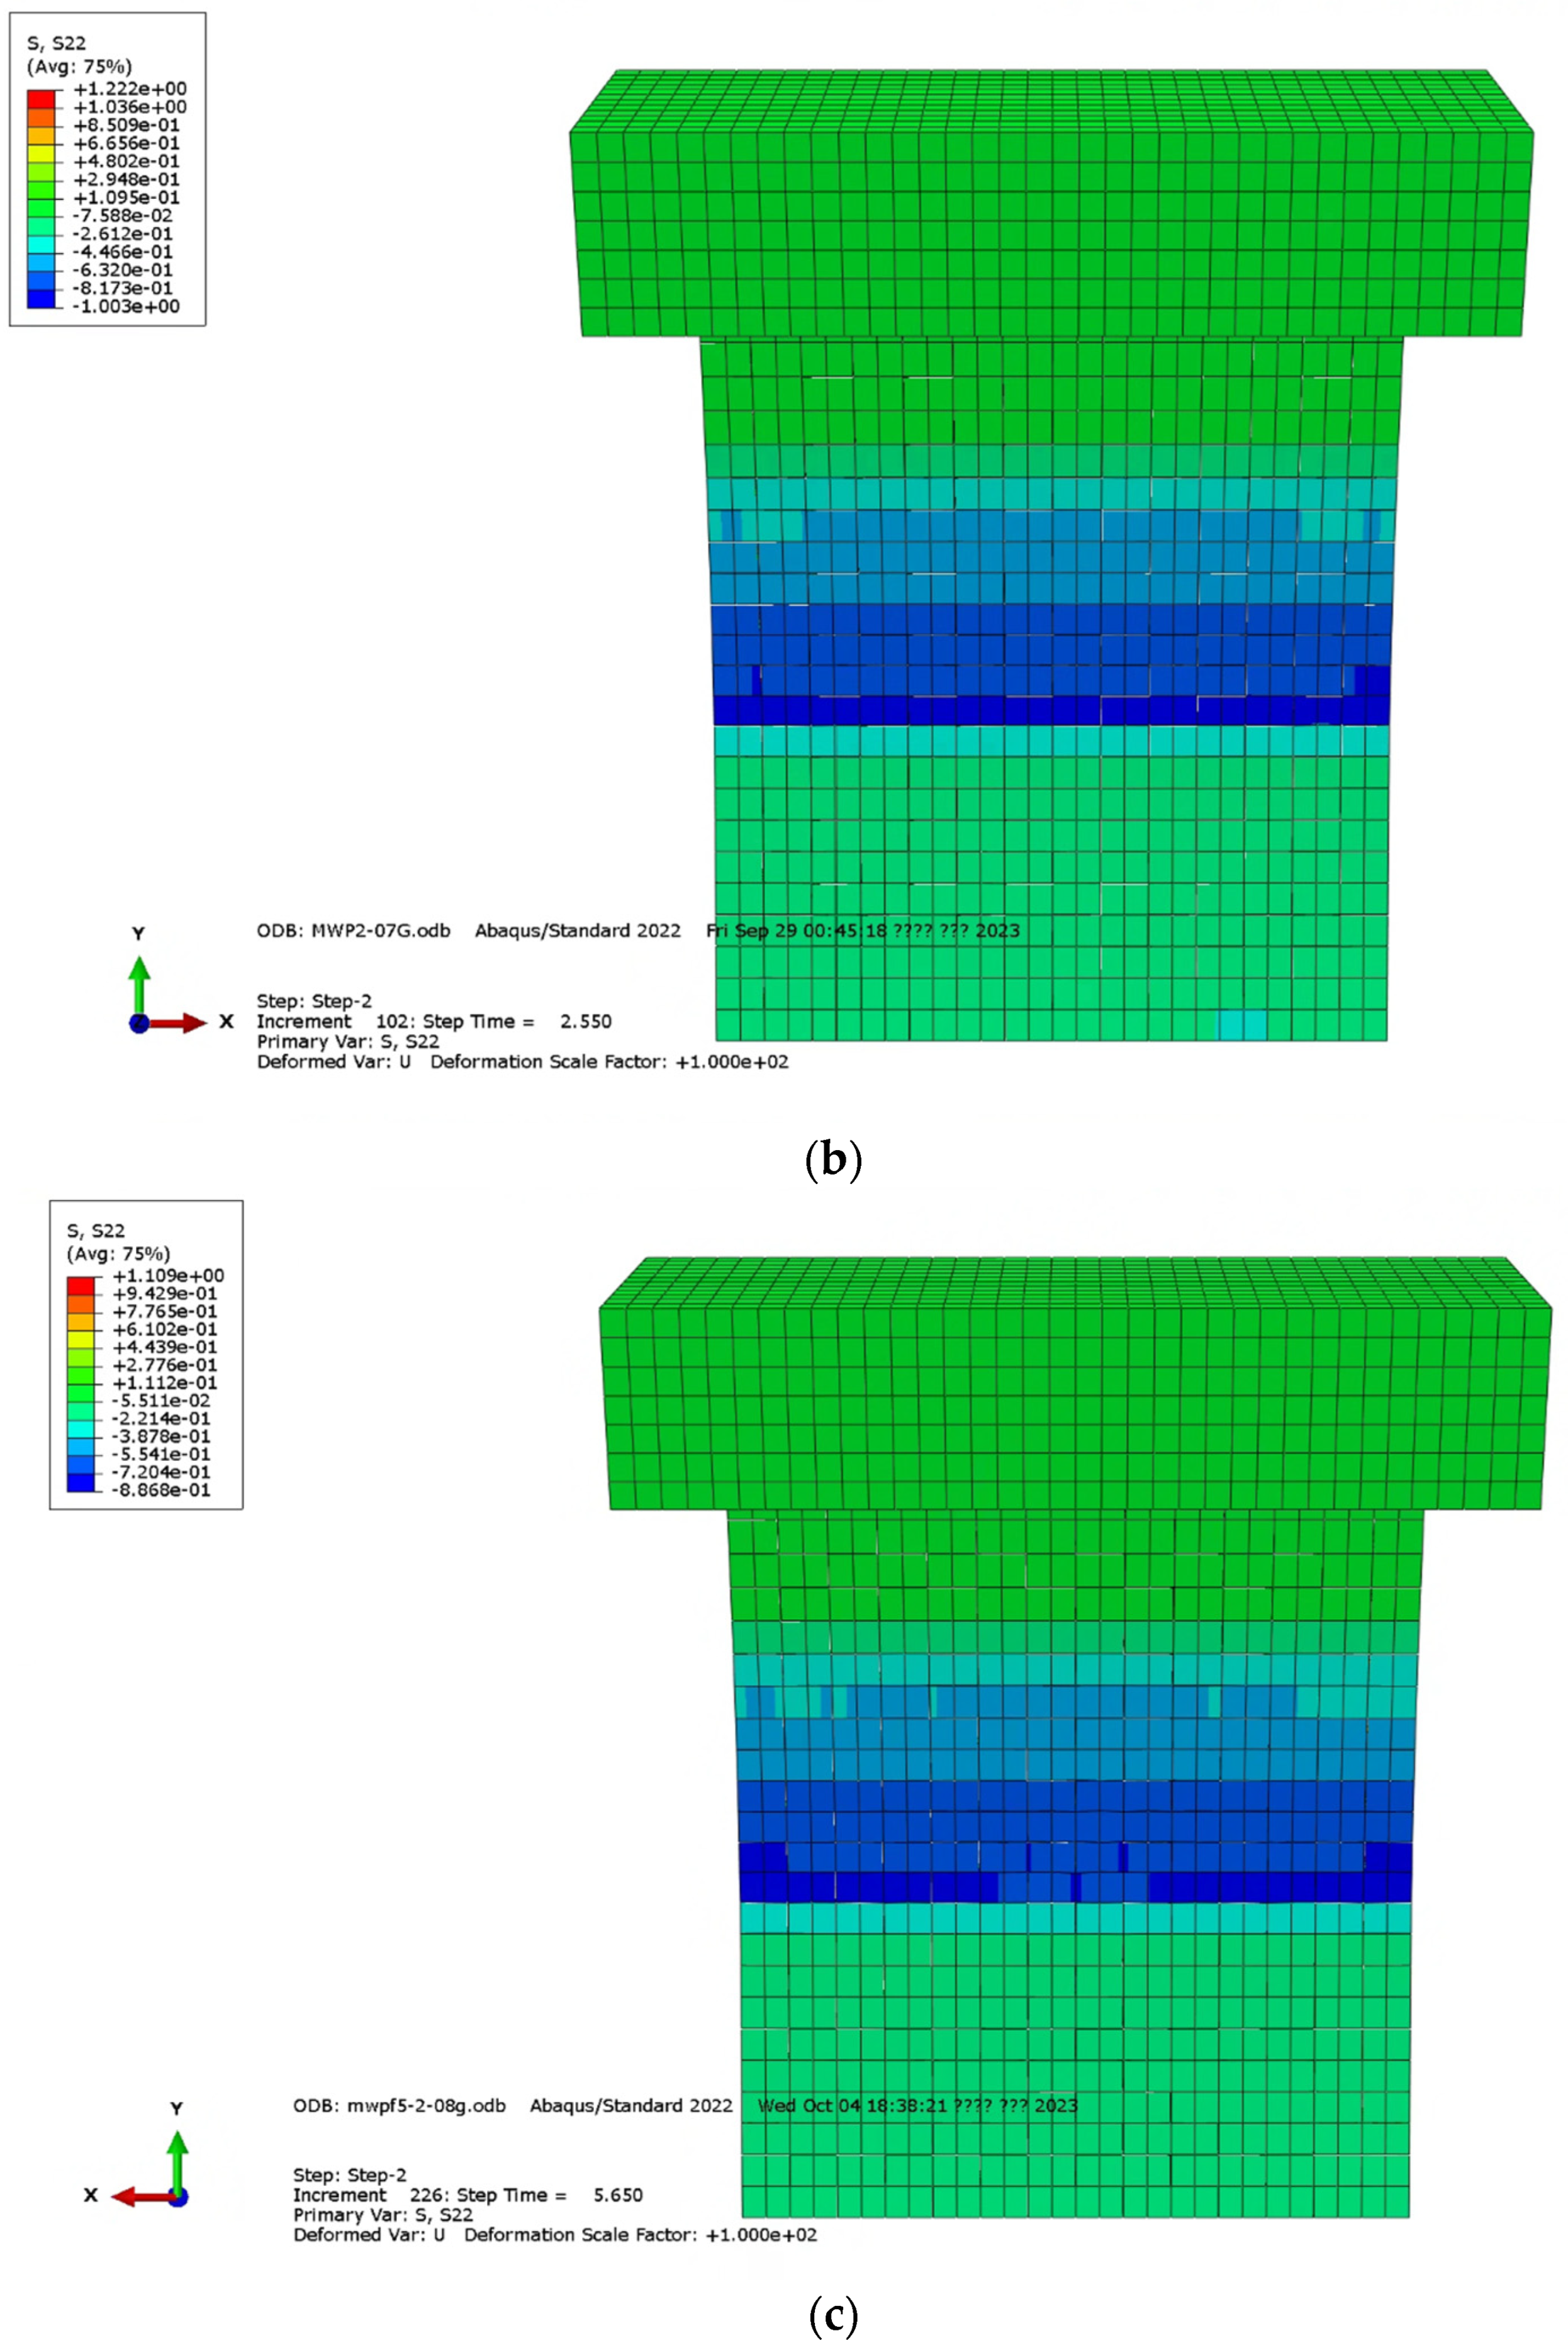
3.4. Validation of Numerical Model: Comparison with Experimental Results

The central strain and stress derived from the simulation analysis of each specimen are summarized in Table 5. The simulation analysis results collected from the nodes are shown in Figure 11. The central strain and stress data were collected from the node above the lower fixed bracket, where the greatest damage was observed during the shaking table test. Based on the study by Yang et al. (2019), cracking was considered to occur when the strain exceeded 0.00015 [42]. To estimate the stress causing the destruction of the masonry wall, the tensile strength of the mortar was calculated. Based on the measured compressive strength of the mortar (16 MPa), its tensile strength was estimated to be 0.8 MPa by assuming a typical ratio of tensile to compressive strength for cement-based mortar. This estimate follows the empirical range of 1/10 to 1/20 commonly reported in the literature. In this study, a conservative value at the lower end of this range (1/20) was adopted [43].
The failure of the specimens, as identified through stress analysis in the simulation, first occurred at PGA values of 0.5 g, 0.7 g, and 0.8 g for the MWN, MWP2, and MWPF5 specimens, respectively. The PGA values at which failure occurred in the numerical analysis closely matched those observed in the shaking table tests. Figure 12 presents stress contours at the PGA levels where initial failure was identified in the numerical simulation, as summarized in Table 5. For the MWP2 and MWPF5 specimens, stress localization corresponding to the onset of cracking appears clearly at 0.7 g and 0.8 g, respectively. In contrast, the MWN specimen did not exhibit failure within the applied PGA range; thus, a representative contour at 0.4 g is provided to illustrate the early-stage stress development. As shown in Figure 5, the experimentally observed cracks in the MWP2 specimen initiated in the immediate vicinity above the lower fixed steel bracket and propagated diagonally upward. This damage pattern was consistently observed across all specimen types. Similarly, the numerical stress distribution in Figure 12, corresponding to the MWP2 specimen, shows the highest stress concentrated in the same region. This close agreement between the experimental and numerical results confirms the model’s ability to accurately capture the damage concentration zones and overall failure behavior under out-of-plane seismic loading.
Although good correlation was observed at 0.3 g for most specimens, as shown in Figure 13, noticeable deviations were observed in the MWPF5 specimen (Figure 13c). This deviation can be attributed to the localized debonding between the GFRP and the masonry substrate, which occurred only on one side of the specimen. Although GFRP sheets were attached to both the front and back faces of the wall, slight debonding was observed on only one face during the experiment. This asymmetric debonding likely resulted in uneven stiffness and increased displacement in the negative loading direction. Such localized failure was not explicitly modeled in the numerical analysis, which assumed perfect bonding between materials on both faces. Furthermore, the difference between the simulation and experimental results became more pronounced as the PGA increased, primarily due to the progressive cracking and cumulative damage in the specimens, which introduced nonlinearities not fully reflected in the numerical model.
While the modal dynamics method provides useful insights into the overall displacement and strain behavior of the structure, it has limitations in capturing progressive damage and nonlinear failure mechanisms. These limitations become more evident as the PGA increases. To overcome this, future studies may incorporate dynamic/explicit analysis, which enables the modeling of crack propagation, stiffness degradation, and more accurate failure modes under severe seismic loading.

4. Parametric Study

The strengthening effect of STPU with varying thicknesses was evaluated through a parametric study. Using the previously developed finite element analysis (FEA) model, the STPU thickness was varied from 1 mm to 8 mm in 1 mm increments and applied to the masonry wall specimen. The same numerical modeling approach and boundary conditions described in Section 3.2 and Section 3.3 for the MWP2 specimen were used, and a seismic load corresponding to a PGA of 0.4 g was applied to all specimens. The results of the parametric study are summarized in Table 6. In thickness of 6 mm, the strain and stress results show the lowest value, and in thickness of 2 mm, displacement results show the lowest value. Although the seismic performance improved slightly with increasing STPU thickness, the difference in maximum displacement and strain reduction beyond 2 mm was marginal. Considering the cost, ease of application, curing time, and material efficiency, the 2 mm thickness was determined to be the most practical and best choice for retrofitting masonry walls. Therefore, it is recommended as an optimal thickness for field application.
The strengthening effect weakens after the thickness exceeds 6 mm. These results are similar to those of Park et al. (2011) [44]. In Park et al.’s study (2011), they retrofitted the RC slab with different thicknesses (3, 5, 7 mm) of PU, and when the PU thickness of 7 mm was applied, the strengthening effect was lower than for other thicknesses [44]. These findings imply that in structures where PU is excessively applied, the high elongation rate, a characteristic of PU, cannot be accurately exhibited. While the parametric study focused on the effect of STPU thickness, other mechanical properties—such as elastic modulus, tensile strength, and elongation—of STPU may also influence the structural response. Future studies will consider expanding the parametric analysis to include variations in these material properties to better understand their sensitivity and optimize the retrofitting design.

5. Discussion

The findings of this study confirm the applicability of the simplified micro-modeling approach in predicting the seismic performance of STPU-retrofitted masonry walls. While this method demonstrated strong agreement with experimental failure loads and deformation patterns, it is important to note its inherent limitations in capturing progressive damage and localized cracking. These limitations became more evident at higher PGA levels, where cumulative damage and nonlinear effects were not fully represented.
Moreover, the simulation did not account for phenomena such as interface debonding or degradation of bonding between STPU/GFRP and the masonry substrate, which influenced the experimental results—particularly in the MWPF5 specimen. Incorporating interface damage models or cohesive elements in future simulations could enhance the accuracy of predicted responses.
In addition, the study used representative material properties sourced from relevant prior research to model the equivalent masonry units. Although appropriate for the present scope, future studies should include sensitivity analyses on masonry material parameters (e.g., tensile strength, modulus) to evaluate their influence on retrofitted wall behavior. Exploring probabilistic modeling approaches may also help to address uncertainties in both material properties and seismic demand.
From a practical perspective, the results of this study suggest that a 2 mm thick application of STPU offers a balanced solution between structural enhancement and economic feasibility. While thicker coatings provided marginal improvements in displacement and strain reduction, these gains may not justify the additional cost, material use, and curing time. Therefore, for masonry walls subjected to moderate seismic demands, a 2 mm thickness is recommended as the optimal configuration.
Future design guidelines for STPU application could adopt a performance-based approach where the required strengthening thickness is calibrated against target displacement or strain reduction thresholds, as established through experimental or numerical analysis.

6. Conclusions

This study investigated the seismic performance of masonry walls retrofitted with STPU through shaking table tests and finite element analysis. A simplified micro-model was adopted to simulate the structural response under out-of-plane seismic loading. The main conclusions are as follows:
1. In the shaking table tests, the non-retrofitted specimens (MWN) failed at 0.4–0.5 g, whereas the STPU-retrofitted specimens (MWP2) showed improved ductility and resisted up to 0.7–0.8 g. The hybrid specimens with both GFRP and STPU (MWPF5) exhibited the highest resistance, withstanding seismic loads up to 0.9–1.0 g. Crack patterns were concentrated near the lower fixed bracket in all specimens, confirming the effectiveness of the boundary constraint design.
2. The finite element model successfully predicted the PGA values at failure for each specimen type, showing strong agreement with the experimental results. The location and mode of failure observed in the simulation also corresponded well with the experimental crack patterns.
3. The constitutive models applied—Drucker–Prager for masonry, Arruda–Boyce for STPU, and the lamina model for GFRP—reflected the mechanical properties of each material and enabled realistic simulation of structural behavior under dynamic loading.
4. A parametric study varying STPU thickness revealed that a 2 mm layer provided the most efficient strengthening effect, comparable to thicker applications but with advantages in material cost and constructability.
5. While the simplified micro-model showed reliable results, further improvements can be achieved by adopting detailed micro-modeling to capture localized cracking and post-failure behavior more accurately. Moreover, applying probabilistic analysis methods can help assess the uncertainty in material properties and seismic demands, leading to a more robust evaluation of seismic performance in real-world applications.

Author Contributions

Conceptualization, J.-H.J.K.; methodology, J.-H.J.K.; validation, T.-H.L.; investigation, T.-H.L., J.-W.K., and S.L.; writing—original draft preparation, T.-H.L. All authors have read and agreed to the published version of the manuscript.

Funding

This work was supported by the Technology Innovation Program (RS-2024-00408368, Development of Carbon fiber application technology for life care and utilization technology to replace steel strand wire for construction usage) funded By the Ministry of Trade, Industry & Energy (MOTIE, Korea).

Institutional Review Board Statement

Not applicable.

Informed Consent Statement

Not applicable.

Data Availability Statement

The data presented in this research are available on request from the first author due to privacy and confidentiality agreements with the collaborating institution.

Conflicts of Interest

The authors declare no conflicts of interest.

Abbreviations

The following abbreviations are used in this manuscript:
RCReinforced concrete
FEAFinite element analysis
GFRPGlass-fiber-reinforced polymer
PUPolyurea
STPUStiff-type polyurea
PGAPeak ground acceleration
DOFDegree of freedom

References

  1. Capacci, L.; Biondini, F.; Frangopol, D.M. Resilience of aging structures and infrastructure systems with emphasis on seismic resilience of bridges and road networks. Resilient Cities Struct. Struct. 2022, 1, 23–41. [Google Scholar] [CrossRef]
  2. Briggs, K.M.; Dijkstra, T.A.; Glendinning, S. Assessing the deterioration of ageing infrastructure earthworks. GeoStrata Mag. Arch. 2022, 26, 26–33. [Google Scholar] [CrossRef]
  3. Biondini, F.; Frangopol, D.M. Life-Cycle of Structures and Infrastructure Systems. In Proceedings of the Eighth International Symposium on Life-Cycle Civil Engineering, Milan, Italy, 2–6 July 2023; CRC Press/Balkema: Milan, Italy, 2023. [Google Scholar]
  4. Little, R.G. Managing the Risk of Aging Infrastructure; IRGC, Public Sector Governance of Emerging Risks Council, Infrastructure Case: 2012. Available online: https://irgc.org/wp-content/uploads/2018/09/R.-Little_Risk-of-Aging-Infrastructure_revision-Nov2012.pdf (accessed on 28 October 2022).
  5. Ibrahim, A.; Abdelkhalek, S.; Zayed, T.; Qureshi, A.H.; Mohammed Abdelkader, E. A comprehensive review of the key deterioration factors of concrete bridge decks. Buildings 2024, 14, 3425. [Google Scholar] [CrossRef]
  6. Faris, N.; Zayed, T.; Fares, A. Review of Condition Rating and Deterioration Modeling Approaches for Concrete Bridges. Buildings 2025, 15, 219. [Google Scholar] [CrossRef]
  7. Ellingwood, B.R.; Mori, Y. Reliability-based service life assessment of concrete structures in nuclear power plants: Optimum inspection and repair. Nucl. Eng. Des. 1997, 175, 247–258. [Google Scholar] [CrossRef]
  8. Frangopol, D.M.; Lin, K.Y.; Estes, A.C. Reliability of reinforced concrete girders under corrosion attack. J. Struct. Eng. 1997, 123, 286–297. [Google Scholar] [CrossRef]
  9. Frangopol, D.M.; Liu, M. Maintenance and management of civil infrastructure based on condition, safety, optimization, and life-cycle cost. In Structures and Infrastructure Systems; Routledge: London, UK, 2019; pp. 96–108. [Google Scholar]
  10. Yang, S.I.; Frangopol, D.M.; Neves, L.C. Service life prediction of structural systems using lifetime functions with emphasis on bridges. Reliab. Eng. Syst. Saf. 2004, 86, 39–51. [Google Scholar] [CrossRef]
  11. Ministry of Land, Infrastructure and Transport (Korea). Report. Available online: https://www.molit.go.kr/USR/NEWS/m_71/dtl.jsp?id=95085286&lcmspage=1 (accessed on 1 August 2022).
  12. Lee, D.G.; Kim, T.H. Application of seismic isolation and vibration control in Korea. J. Earthq. Eng. Soc. Korea 2006, 10, 67–77. [Google Scholar]
  13. Seoul Institute of Technology (SIT). Spotlight. Available online: https://www.sit.re.kr/kr (accessed on 1 March 2021).
  14. Bruneau, M. State-of-the-art report on seismic performance of unreinforced masonry buildings. J. Struct. Eng. 1994, 120, 230–251. [Google Scholar] [CrossRef]
  15. Cholostiakow, S.; McKinley, B.; Mergos, P.; Hall, C.; Kappos, A.; Ayoub, A. Seismic retrofitting of URM masonry piers with helical steel reinforcement. Constr. Build. Mater. 2024, 431, 136499. [Google Scholar] [CrossRef]
  16. Meguro, K.; Sathiparan, N.; Sakurai, K.; Numada, M. Shaking table test of two-story masonry house model retrofitted by PP-band mesh. In Proceedings of the 15th World Conference on Earthquake Engineering (15WCEE), Sociedade Portuguesa de Engenharia Sismica (SPES), Lisbon, Portugal, 24–28 September 2012. [Google Scholar]
  17. Karlos, K.; Tsantilis, A.; Triantafillou, T. Integrated seismic and energy retrofitting system for masonry walls using textile-reinforced mortars combined with thermal insulation: Experimental, analytical, and numerical study. J. Compos. Sci. 2020, 4, 189. [Google Scholar] [CrossRef]
  18. Triantafillou, T.C.; Karlos, K.; Kapsalis, P.; Georgiou, L. Innovative structural and energy retrofitting system for masonry walls using textile reinforced mortars combined with thermal insulation: In-plane mechanical behavior. J. Compos. Constr. 2018, 22, 04018029. [Google Scholar] [CrossRef]
  19. Boem, I. Masonry elements strengthened through Textile-Reinforced Mortar: Application of detailed level modelling with a free open-source Finite-Element code. Constr. Build. Mater. 2022, 357, 129333. [Google Scholar] [CrossRef]
  20. Alsayed, S.H.; Elsanadedy, H.M.; Al-Zaheri, Z.M.; Al-Salloum, Y.A.; Abbas, H. Blast response of GFRP-strengthened infill masonry walls. Constr. Build. Mater. 2016, 115, 438–451. [Google Scholar] [CrossRef]
  21. Gkournelos, P.D.; Triantafillou, T.C.; Bournas, D.A. Integrated structural and energy retrofitting of masonry walls: Effect of in-plane damage on the out-of-plane response. J. Compos. Constr. 2020, 24, 04020049. [Google Scholar] [CrossRef]
  22. Santos, A.P.; Chiquito, M.; Castedo, R.; López, L.M.; Gomes, G.; Mota, C.; Fangueiro, R.; Mingote, J.L. Experimental and numerical study of polyurea coating systems for blast mitigation of concrete masonry walls. Eng. Struct. 2023, 284, 116006. [Google Scholar] [CrossRef]
  23. Öztürk, Ş.; Aydın, F.; Arslan, Ş. Investigation of the effects of polyurea application on shear behavior in masonry wall elements. Constr. Build. Mater. 2025, 469, 140467. [Google Scholar] [CrossRef]
  24. He, J.; Sun, X.; Pi, D.; Wang, X.; Wu, M.; Qin, W.; Wu, A.; Qu, Y.; Wang, B. An experimental study on the resistance of a polyurea-sprayed structure to low-speed drop hammer impact. Constr. Build. Mater. 2024, 435, 136915. [Google Scholar] [CrossRef]
  25. Parniani, S.; Toutanji, H. Monotonic and fatigue performance of RC beams strengthened with a polyurea coating system. Constr. Build. Mater. 2015, 101, 22–29. [Google Scholar] [CrossRef]
  26. Davidson, J.S.; Porter, J.R.; Dinan, R.J.; Hammons, M.I.; Connell, J.D. Explosive testing of polymer retrofit masonry walls. J. Perform. Constr. Facil. 2004, 18, 100–106. [Google Scholar] [CrossRef]
  27. Guo, H.; Du, C.; Chen, Y.; Li, D.; Hu, W.; Lv, X. Study on protective performance of impact-resistant polyurea and its coated concrete under impact loading. Constr. Build. Mater. 2022, 340, 127749. [Google Scholar] [CrossRef]
  28. Huang, W.B.; Xiang, J.Y.; Lv, P.; Li, X.M. Study on mechanical properties aging of spray pure polyurea for hydraulic concrete protection. Adv. Mater. Res. 2012, 374, 1325–1329. [Google Scholar]
  29. Chen, D.; Wu, H.; Fang, Q.; Wei, J.S.; Xu, S.L. Out-of-plane behaviors of unreinforced and spray polyurea retrofitted one-way masonry infilled walls. J. Build. Eng. 2023, 67, 106006. [Google Scholar] [CrossRef]
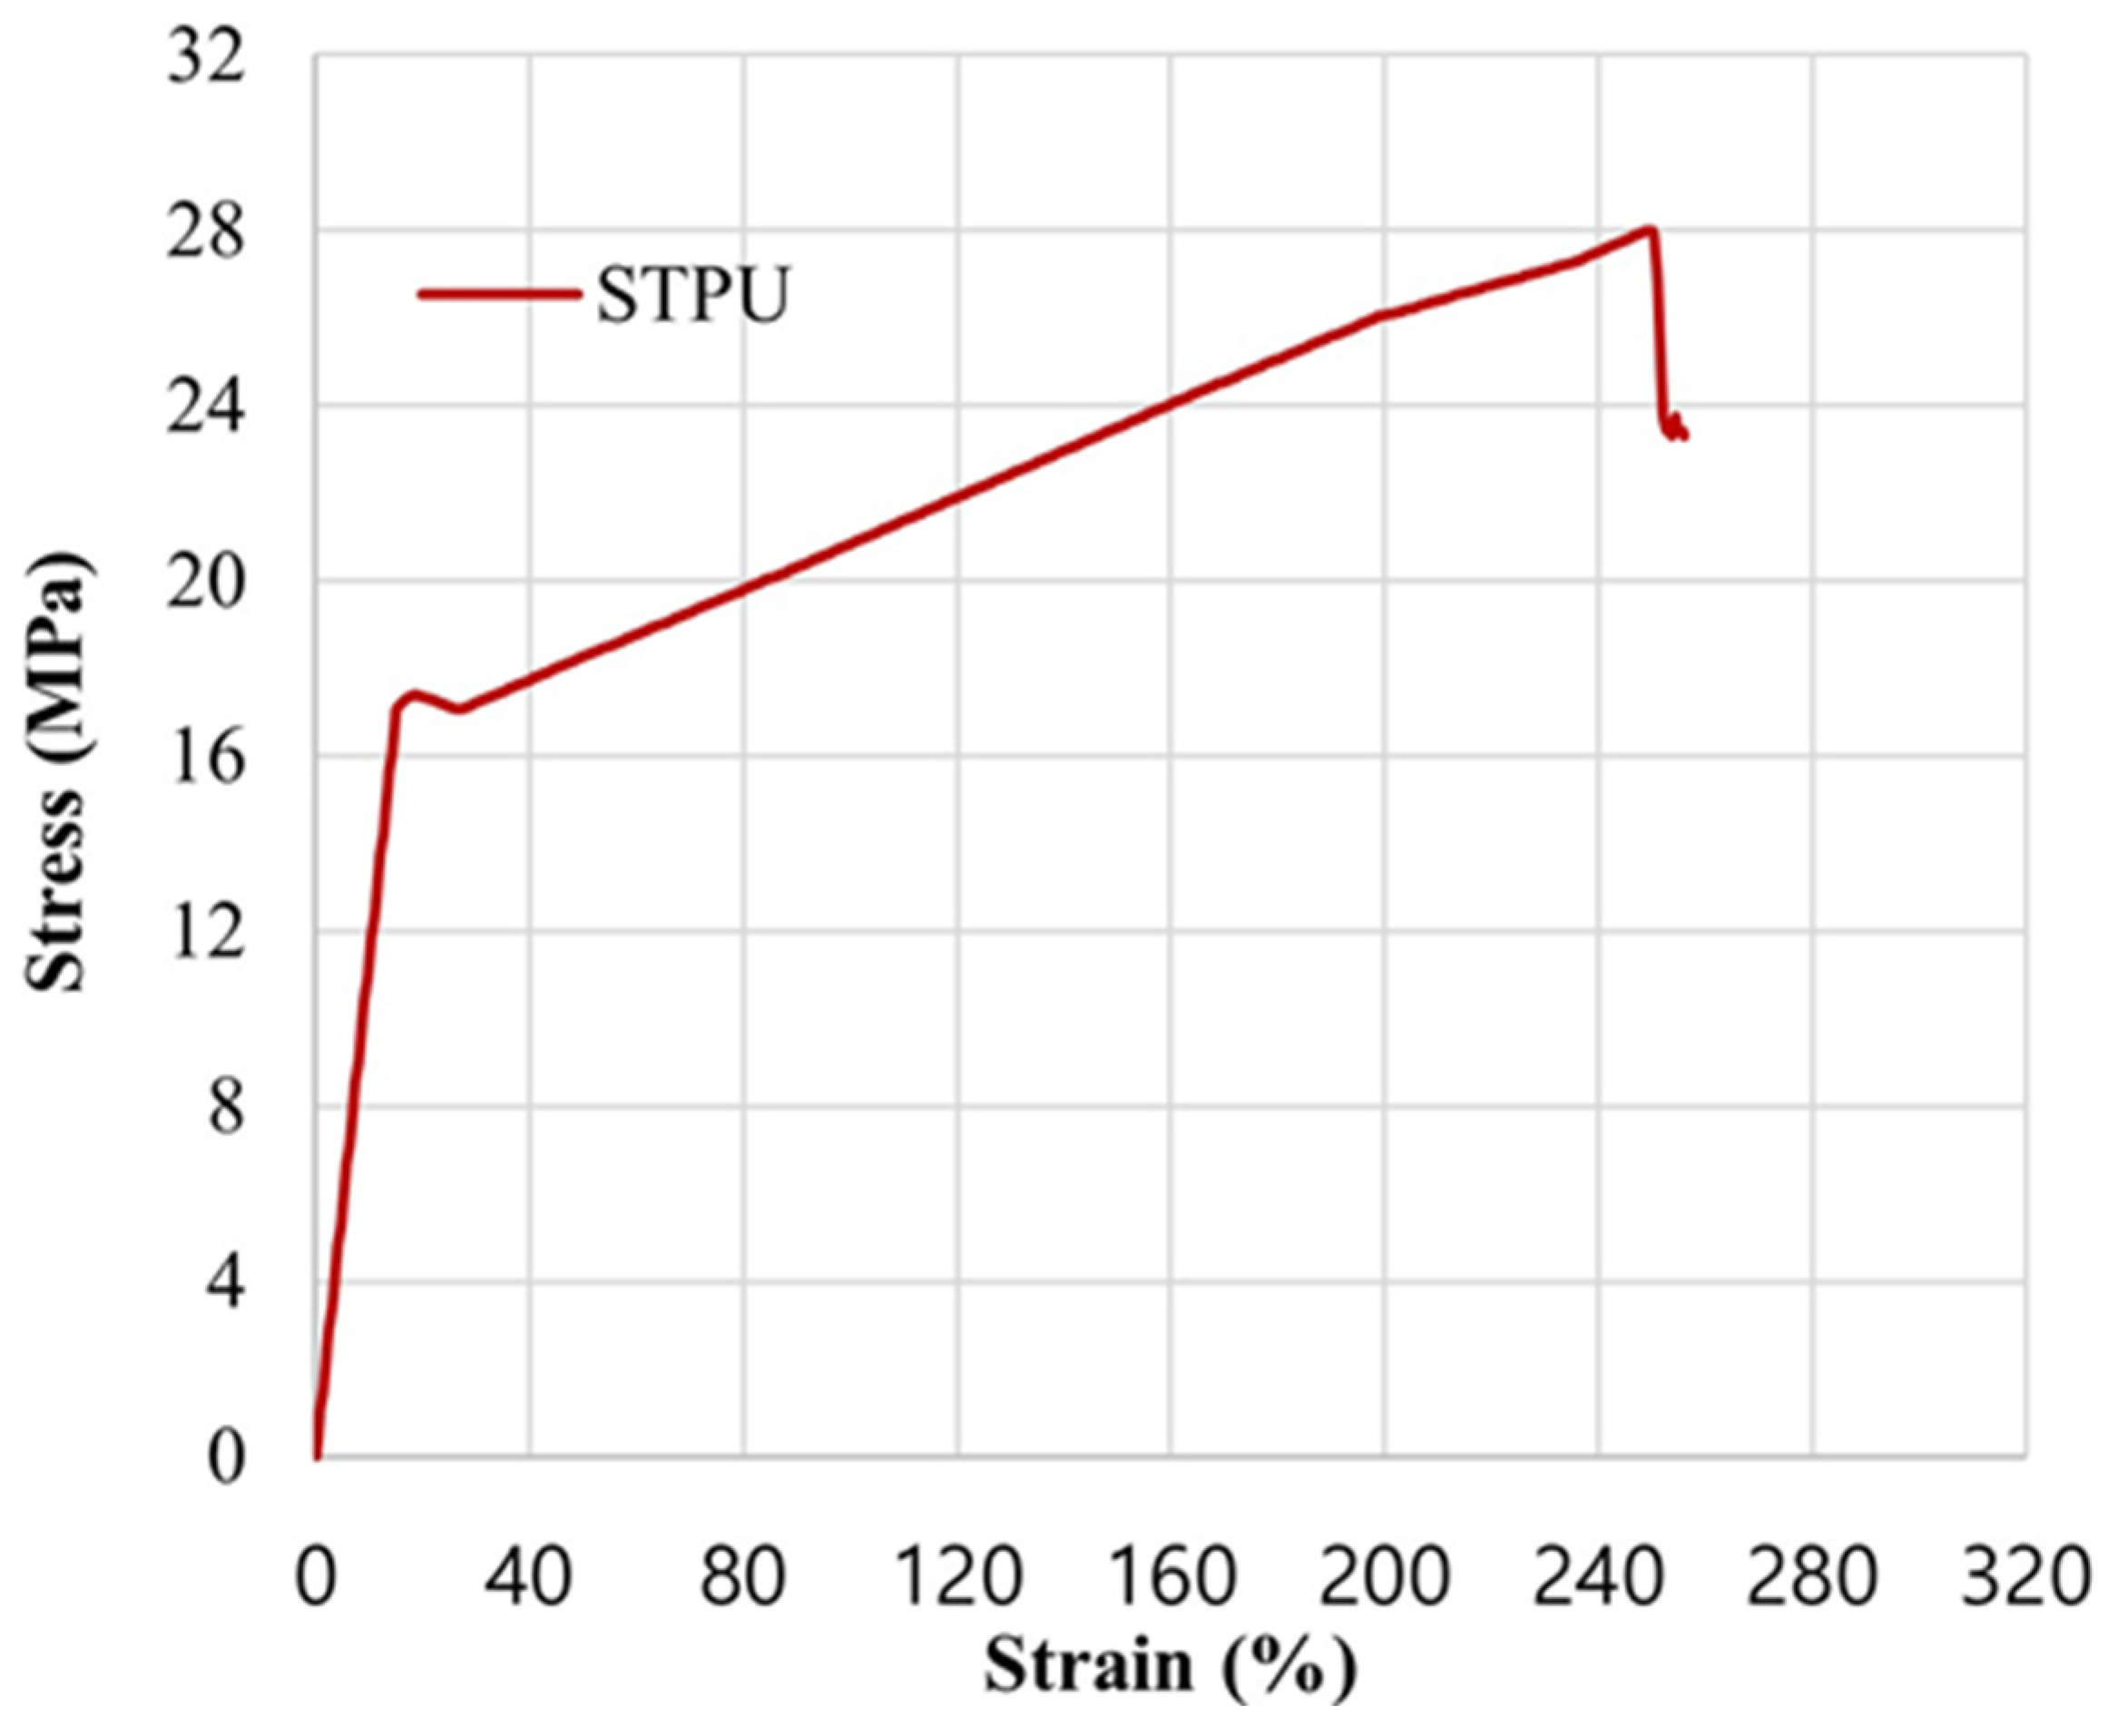
  30. Lee, T.H.; Park, J.H.; Yang, D.H.; Kim, J.H.J.; Noor, N.B.M. Material enhancements of newly developed stiff type polyurea for retrofitting of concrete structures. Case Stud. Constr. Mater. 2022, 17, e01431. [Google Scholar] [CrossRef]
  31. Lamba, N.M.K.; Woodhouse, K.A.; Cooper, S.L. Polyurethanes in Biomedical Applications, 1st ed.; CRC Press: Boca Raton, FL, USA, 1998; pp. 14–23. [Google Scholar]
  32. Ahmad, B.; Najar, I.A. Comparative seismic analysis of EL Centro and Japan earthquakes using response spectra method. Int. J. Curr. Eng. Technol. 2016, 6, 1859–1864. [Google Scholar]
  33. Kim, J.S.; Kim, H.W.; Lee, J.H.; Park, B.C. Natural Frequency Analysis of Masonry Buildings Under Seismic Excitations. In Proceedings of the Korean Society for Noise and Vibration Engineering Conference; The Korean Society for Noise and Vibration Engineering: Jeju, Republic of Korea, 2012; pp. 495–496. [Google Scholar]
  34. Lourenço, P.B.; Rots, J.G. Multisurface interface model for analysis of masonry structures. J. Eng. Mech. 1997, 123, 660–668. [Google Scholar] [CrossRef]
  35. Lourenço, P.B. Computations on historic masonry structures. Prog. Struct. Eng. Mater. 2002, 4, 301–319. [Google Scholar] [CrossRef]
  36. Agüera, N.D.; Tornello, M.E.; Frau, C.D. Structural response of unreinforced masonry walls. J. Civ. Eng. Archit. 2016, 10, 219–231. [Google Scholar]
  37. Abdulla, K.F.; Cunningham, L.S.; Gillie, M. Simulating masonry wall behaviour using a simplified micro-model approach. Eng. Struct. 2017, 151, 349–365. [Google Scholar] [CrossRef]
  38. Rull, N.; Basnayake, A.; Heitzmann, M.; Frontini, P.M. Constitutive modelling of the mechanical response of a polycaprolactone based polyurethane elastomer: Finite element analysis and experimental validation through a bulge test. J. Strain Anal. Eng. Des. 2021, 56, 206–215. [Google Scholar] [CrossRef]
  39. Chen, D.; Wu, H.; Wei, J.S.; Xu, S.L.; Fang, Q. Nonlinear visco-hyperelastic tensile constitutive model of spray polyurea within wide strain-rate range. Int. J. Impact Eng. 2022, 163, 104184. [Google Scholar] [CrossRef]
  40. Arruda, E.M.; Boyce, M.C. A three-dimensional constitutive model for the large stretch behavior of rubber elastic materials. J. Mech. Phys. Solids 1993, 41, 389–412. [Google Scholar] [CrossRef]
  41. Gattesco, N.; Amadio, C.; Bedon, C. Experimental and numerical study on the shear behavior of stone masonry walls strengthened with GFRP reinforced mortar coating and steel-cord reinforced repointing. Eng. Struct. 2015, 90, 143–157. [Google Scholar] [CrossRef]
  42. Yang, K.H.; Lee, Y.; Hwang, Y.H. Evaluation of tensile stress-strain relationship of masonry elements. J. Archit. Inst. Korea Struct. Constr. 2019, 35, 27–33. [Google Scholar]
  43. Still, G.T. Strength of Cementitious Mortars: A Literature Review with Special Reference to Weak Mortars in Tension; University of Warwick: Coventry, UK, 2004. [Google Scholar]
  44. Park, J.C.; Lee, S.W.; Kim, S.B.; Kim, J.H.J. Performance evaluation of RC slabs strengthened by stiff type polyurea. KSCE J. Civ. Environ. Eng. Res. 2011, 31, 457–464. [Google Scholar]
Figure 1. Masonry wall specimen for shaking table test: (a) front view; (b) side view (unit: mm).
Applsci 15 06912 g001
Figure 2. Shaking table test specimen type: (a) MWN type; (b) MWP2 type; (c) MWPF5 type.
Applsci 15 06912 g002
Figure 3. Shaking table test setup.
Applsci 15 06912 g003
Figure 4. El Centro earthquake data.
Applsci 15 06912 g004
Figure 5. Typical crack patterns observed in the shaking table tests: (a) MWN type; (b) MWP2 type; (c) MWPF5 type.
Applsci 15 06912 g005
Figure 6. Finite element modeling methods of masonry wall: (a) detailed micro-model; (b) simplified micro-model; (c) macro-model [34,35].
Applsci 15 06912 g006
Figure 7. Eight chain rubber elasticity model: (a) undeformed; (b) tension; (c) compression [40].
Applsci 15 06912 g007
Figure 8. Strain–stress graph of STPU [30].
Applsci 15 06912 g008
Figure 9. Finite element modeling of shaking table test specimens: (a) MWN; (b) MWP2; (c) MWPF5; (d) meshed specimen.
Applsci 15 06912 g009
Figure 10. Boundary condition in shaking table test simulation: (a) front view; (b) bottom view.
Applsci 15 06912 g010
Figure 11. Simulation data measured node.
Applsci 15 06912 g011
Figure 12. Stress contours at initial failure: (a) MWN at 0.4 g; (b) MWP2 at 0.7 g; (c) MWFP5 0.8 g.
Applsci 15 06912 g012aApplsci 15 06912 g012b
Figure 13. Comparison of time–displacement graph between simulation results and experimental data: (a) MWN (0.3 g); (b) MWP2 (0.3 g); (c) MWPF5 (0.3 g).
Applsci 15 06912 g013aApplsci 15 06912 g013b
Table 1. Drucker–Prager material properties of expanded unit for masonry wall [37].
Density
(kg/m3)
Elastic Modulus
(MPa)
ν ψFlow Stress RatioAngle of FrictionYield Compressive Stress (MPa)
Expanded unit180028880.1511.313616
Table 2. Material properties of lamina type GFRP [41].
GFRP Elastic PropertyValue
Density (kg/m3)1900
Longitudinal modulus, E1 (GPa)73
Transverse modulus, E2 (GPa)18
In-plane Poisson’s ratio, ν 12 0.25
In-plane shear modulus, G12 (GPa)9
Transverse shear modulus, G13 (GPa)9
Through-thickness shear modulus, G23 (GPa)7
Table 3. Fail stresses of GFRP used in simulation [41].
Fail Stress PropertyFail Stress
Tensile stress in fiber direction (MPa)1500
Compressive stress in fiber direction (MPa)−700
Tensile stress in transverse direction (MPa)90
Compressive stress in transverse direction (MPa)−140
Shear strength (MPa)6
Table 4. Properties for joint interfaces in shaking table test simulation [37,41].
Tangential BehaviorCohesive Behavior
Friction CoefficientStiffness of Joint in the Normal Direction
Knn
(N/mm2)
Stiffness of Joint in the First Shear Direction
Kss
(N/mm2)
Stiffness of Joint in the Second Shear Direction
Ktt
(N/mm2)
Brick-Brick0.75632525
Brick-STPU,
Brick-GFRP
0.06416017501750
Table 5. Numerical results of shaking table test.
SpecimenMWNMWP2MWPF5
PGA. StrainY-Axis Stress (MPa)StrainY-Axis Stress (MPa)StrainY-Axis Stress (MPa)
0.1 gMax.0.000080.220.000060.150.000080.20
Min.−0.00007−0.20−0.00007−0.20−0.00010−0.25
0.2 gMax.0.000120.320.000080.210.000110.28
Min.−0.00001−0.27−0.00014−0.36−0.00012−0.30
0.3 gMax.0.00019
(Crack occurred)
0.520.000110.280.00017
(Crack occurred)
0.45
Min.−0.00019
(Crack occurred)
−0.51−0.00011−0.29−0.00015
(Crack occurred)
−0.37
0.4 gMax.0.00024
(Crack occurred)
0.660.000090.250.000120.31
Min.−0.0027
(Crack occurred)
−0.75−0.00017
(Crack occurred)
−0.49−0.00020
(Crack occurred)
−0.51
0.5 gMax. 0.000140.400.00022
(Crack occurred)
0.30
Min. −0.00020
(Crack occurred)
−0.55−0.00031
(Crack occurred)
−0.23
0.6 gMax. 0.00016
(Crack occurred)
0.430.00021
(Crack occurred)
0.56
Min. −0.00028
(Crack occurred)
−0.76−0.00026
(Crack occurred)
−0.64
0.7 gMax. 0.00015
(Crack occurred)
0.410.00027
(Crack occurred)
0.68
Min. −0.00032
(Crack occurred)
−0.88
(Failure occurred)
−0.00026
(Crack occurred)
−0.67
0.8 gMax. 0.00015
(Crack occurred)
0.410.00030
(Crack occurred)
0.76
Min. −0.00032
(Crack occurred)
−0.90
(Failure occurred)
−0.00034
(Crack occurred)
−0.88
(Failure occurred)
0.9 gMax. 0.00039
(Crack occurred)
0.99
(Failure occurred)
Min. −0.00041
(Crack occurred)
−1.05
(Failure occurred)
Table 6. Parametric study results for different thicknesses of STPU.
ThicknessNumerical Analysis Result
DisplacementStrainY-Axis Stress (MPa)
1 mmMax.1.540.0000950.26
Min.−0.80−0.000187−0.53
2 mmMax.1.480.0000930.25
Min.−0.70−0.0000174−0.49
3 mmMax.1.500.0001180.31
Min.−0.81−0.000189−0.51
4 mmMax.1.510.0001190.32
Min.−0.82−0.000196−0.54
5 mmMax.1.510.0001140.31
Min.−0.79−0.000175−0.50
6 mmMax.1.510.0001030.28
Min.−0.79−0.00016−0.46
7 mmMax.1.510.0001160.32
Min.−0.79−0.000187−0.51
8 mmMax.1.540.0001110.32
Min.−0.80−0.000192−0.52
Disclaimer/Publisher’s Note: The statements, opinions and data contained in all publications are solely those of the individual author(s) and contributor(s) and not of MDPI and/or the editor(s). MDPI and/or the editor(s) disclaim responsibility for any injury to people or property resulting from any ideas, methods, instructions or products referred to in the content.

