Article

Age-Related Compensatory Gait Strategies During Induced Perturbations in the Pre-Swing Gait Phase: A Kinematic and Kinetic Analysis

by
Katarzyna Chodkowska
1,
Michalina Błażkiewicz
1,*,
Andrzej Mroczkowski
2 and
Jacek Wąsik
2,*
1
Faculty of Rehabilitation, The Józef Piłsudski University of Physical Education in Warsaw, 00-968 Warsaw, Poland
2
Institute of Physical Culture Sciences, Jan Długosz University in Częstochowa, 42-200 Częstochowa, Poland
*
Authors to whom correspondence should be addressed.
Appl. Sci. 2025, 15(12), 6885; https://doi.org/10.3390/app15126885
Submission received: 28 April 2025 / Revised: 7 June 2025 / Accepted: 16 June 2025 / Published: 18 June 2025

Abstract

The response to perturbations in the gait of elderly and young individuals can differ due to various factors, such as age-related changes in sensorimotor function, muscle strength, and balance control. This study aimed to identify and compare compensatory kinematic and kinetic gait strategies in response to sudden treadmill perturbations applied during the Pre-Swing phase in young and older adults. The analysis focused on determining age-related differences in joint behavior and force production under perturbation stress, with implications for fall prevention. Twenty-one young and an equal number of elderly healthy females walked on a treadmill in a virtual environment (GRAIL, Motek). Unexpected perturbations were applied five times. Principal Component Analysis (PCA) and k-means clustering identified three distinct compensatory strategies per limb. Young adults primarily employed Strategies I (42.2%) and II (40%), while older adults most often selected Strategy II (45.5%). Statistical analysis (SPM and Mann-Whitney U test, p = 0.05) showed significant between-group differences in joint angles and torques across the gait cycle. For instance, in Strategy I, young participants had significantly lower ankle plantarflexion angles (p < 0.01) and hip extension torques (p < 0.05) compared to the elderly. Strategy II in older adults showed significantly higher vGRF minimums (p < 0.01) and anterior-posterior GRF peaks (p < 0.001). The elderly adopted strategies compatible with their neuromuscular capacity rather than those minimizing joint load, as observed in the young group. These findings offer novel insights into age-related compensatory mechanisms and highlight the importance of tailored fall-prevention strategies based on biomechanical response patterns.

1. Introduction

The gait perturbations refer to disruptions or disturbances in the normal walking pattern and can be intentional or unintentional. They are widely employed in research and clinical settings to investigate gait adaptations, balance control mechanisms, and rehabilitation strategies [1,2]. Based on the literature, gait perturbations are typically categorized into three main types: external, internal, and cognitive perturbations [3,4]. External perturbations result from outside forces or environmental changes and commonly include tripping, slipping, push/pull forces, and oscillatory movements [5].
These simulated scenarios are crucial because they offer a controlled method for studying real-world fall mechanisms. However, the relevance of such simulations must be linked to actual fall circumstances. Sudden treadmill belt accelerations closely mimic real-life tripping or slipping events by unexpectedly altering foot-ground dynamics, inducing destabilization. This resemblance allows researchers to analyze balance-recovery strategies under safe and repeatable conditions, thereby bridging the gap between experimental setups and everyday fall risks.
In the context of anterior-posterior perturbations, the literature presents various terminologies, often describing them as “tripping-like” or “slipping-like” disturbances. A trip generally involves the swing leg encountering an obstacle during its forward motion, usually resulting in a forward-directed fall. Conversely, a slip occurs when the stance foot loses traction with the ground surface, leading to a sudden displacement either forward or backward. In experimental studies using split-belt treadmills, slipping effects are typically simulated by accelerating one treadmill belt, which causes the stance foot to move backward, thereby increasing the risk of a forward fall. Alternatively, decelerating or abruptly halting one belt can cause the stance foot to displace forward, which may result in a backward fall [6]. Pushing or pulling is the application of sudden forces to the body or upper extremities to cause imbalance during gait. Oscillatory perturbations arise from a moving or oscillating platform beneath the individual to introduce rhythmic disturbances into their gait pattern. Internal disruptions involve manipulating internal factors of the individual’s body. They may include altered sensory input (modifying the sensory feedback received through visual, vestibular, or somatosensory signals), muscle weakness or fatigue, and altered stiffness of joints. Cognitive perturbations involve introducing cognitive challenges or distractions during gait to study attentional demands and dual-task performance [7].
Talbot [8] showed that unexpected falls or loss of balance during gait occur most often due to tripping or slipping in young and elderly populations alike. At this point, it is worth emphasizing that gait responses in the elderly and young may differ due to various factors, such as age-related changes in sensorimotor function, muscle strength, and balance control [9,10]. Elderly individuals may exhibit a delayed response to perturbations compared to younger individuals. Age-related changes in processing speed and neural transmission can result in slower reaction times [11]. Elderly individuals may have reduced balance and stability [12], making them more vulnerable to perturbations. It can be explained by an age-related decline in muscle strength, joint flexibility, and sensory functions [13,14]. Older people also apply some strategies to maintain proper neuromuscular control, like decreasing propulsive power generation during push-off [15]. On the other hand, young people tend to show a faster and more immediate response to perturbations due to having more efficient sensorimotor systems and better coordination. They can also more effectively engage muscles to counteract the forces and maintain balance [16]. This results in quicker adaptation of their gait patterns in response to perturbations, including changes in stride length, step width, or body alignment to regain stability. Talbot et al. [8] described the perceived causes, environmental influences, and resulting injuries associated with falls in a young population (20–45 years) comprising 292 participants, a middle-aged group (46–65 years) with 616 participants, and an older age group (>65 years) including 589 participants. Across all age groups and in both genders, walking on uneven surfaces or stairs was the activity most often cited as the cause of falls. Younger subjects fell more often while running, and seniors while walking. Younger participants tended to fall more often outdoors, while the percentage of falls indoors increased from the middle to the older age group. Thirty-seven percent of older women and 23% of older men reported falling in their homes. Most older fallers mentioned tripping as the cause of their fall [17]. Participants perceived the causes of falls in balance, gait impairment, head disturbance, accidents, and the environment. From the middle to older age groups, falls due to accidents or the environment decreased, while falls due to balance, gait, or head disorders increased. Wrist/hand, knee, and ankle injuries were most common in the young group, knee injuries in the middle-aged group, and head and knee injuries in the older group. Injuries across the age groups and between genders were not significantly different. However, women had a higher rate of falls than men regardless of age group, confirmed by retrospective studies [18,19]. It is worth emphasizing that falls in the elderly can have severe consequences, from injury and short- or long-term disability to death. Falls also generate costs for patients, the health system, and society [7,20,21]. It is particularly significant for women with menopausal osteoporosis, who have a greater tendency to break bones after a fall. Therefore, biomechanical analyses of gait disorders can help determine and plan preventive physiotherapy to minimize their negative impact, especially in the older population. The objective of this study was to systematically analyze how healthy young and older women respond biomechanically to controlled treadmill perturbations applied during the Pre-Swing phase, particularly focusing on differences in compensatory strategies, joint angles, torques, and GRF components. Although the aim of this study is stated, the rationale for selecting the Pre-Swing phase and the non-dominant limb requires further clarification. The Pre-Swing phase is a biomechanically critical moment in the gait cycle responsible for propulsion and initiation of limb advancement [22]. It is characterized by rapid unloading of the stance leg and generation of forward momentum, making it particularly vulnerable to destabilizing perturbations. Studying this phase can provide valuable insight into how the body manages balance threats during a transitional moment of gait. Additionally, targeting the non-dominant limb is relevant because asymmetries in strength, neuromuscular control, and sensory input may influence the ability to respond to perturbations. Prior research suggests that the non-dominant limb often exhibits distinct compensatory strategies, which are crucial to consider when assessing age-related or functional differences in gait stability.

2. Materials and Methods

2.1. Participants

Twenty-one young female students (Y) and twenty-one older women (O) participated in this study (Table 1). The study groups were statistically significantly different across all anthropometric parameters. Participants satisfied the following inclusion criteria: no muscular or neural diseases; no existing lower limb injuries in the last six months before testing, followed by at least two days of restricted activity; physical, recreational activity engaged two times a week. Exclusion criteria were: bad physical condition (evaluated subjectively on the day before and the day of the trial), lack of experience in walking on a treadmill, and problem with balance or taking medications that adversely affected the nervous system.
All participants gave their informed consent to participate in the study, which had previously been approved by the university’s institutional review board (no. SKE01-15/2023). This study was conducted according to the ethical guidelines and principles of the Declaration of Helsinki.

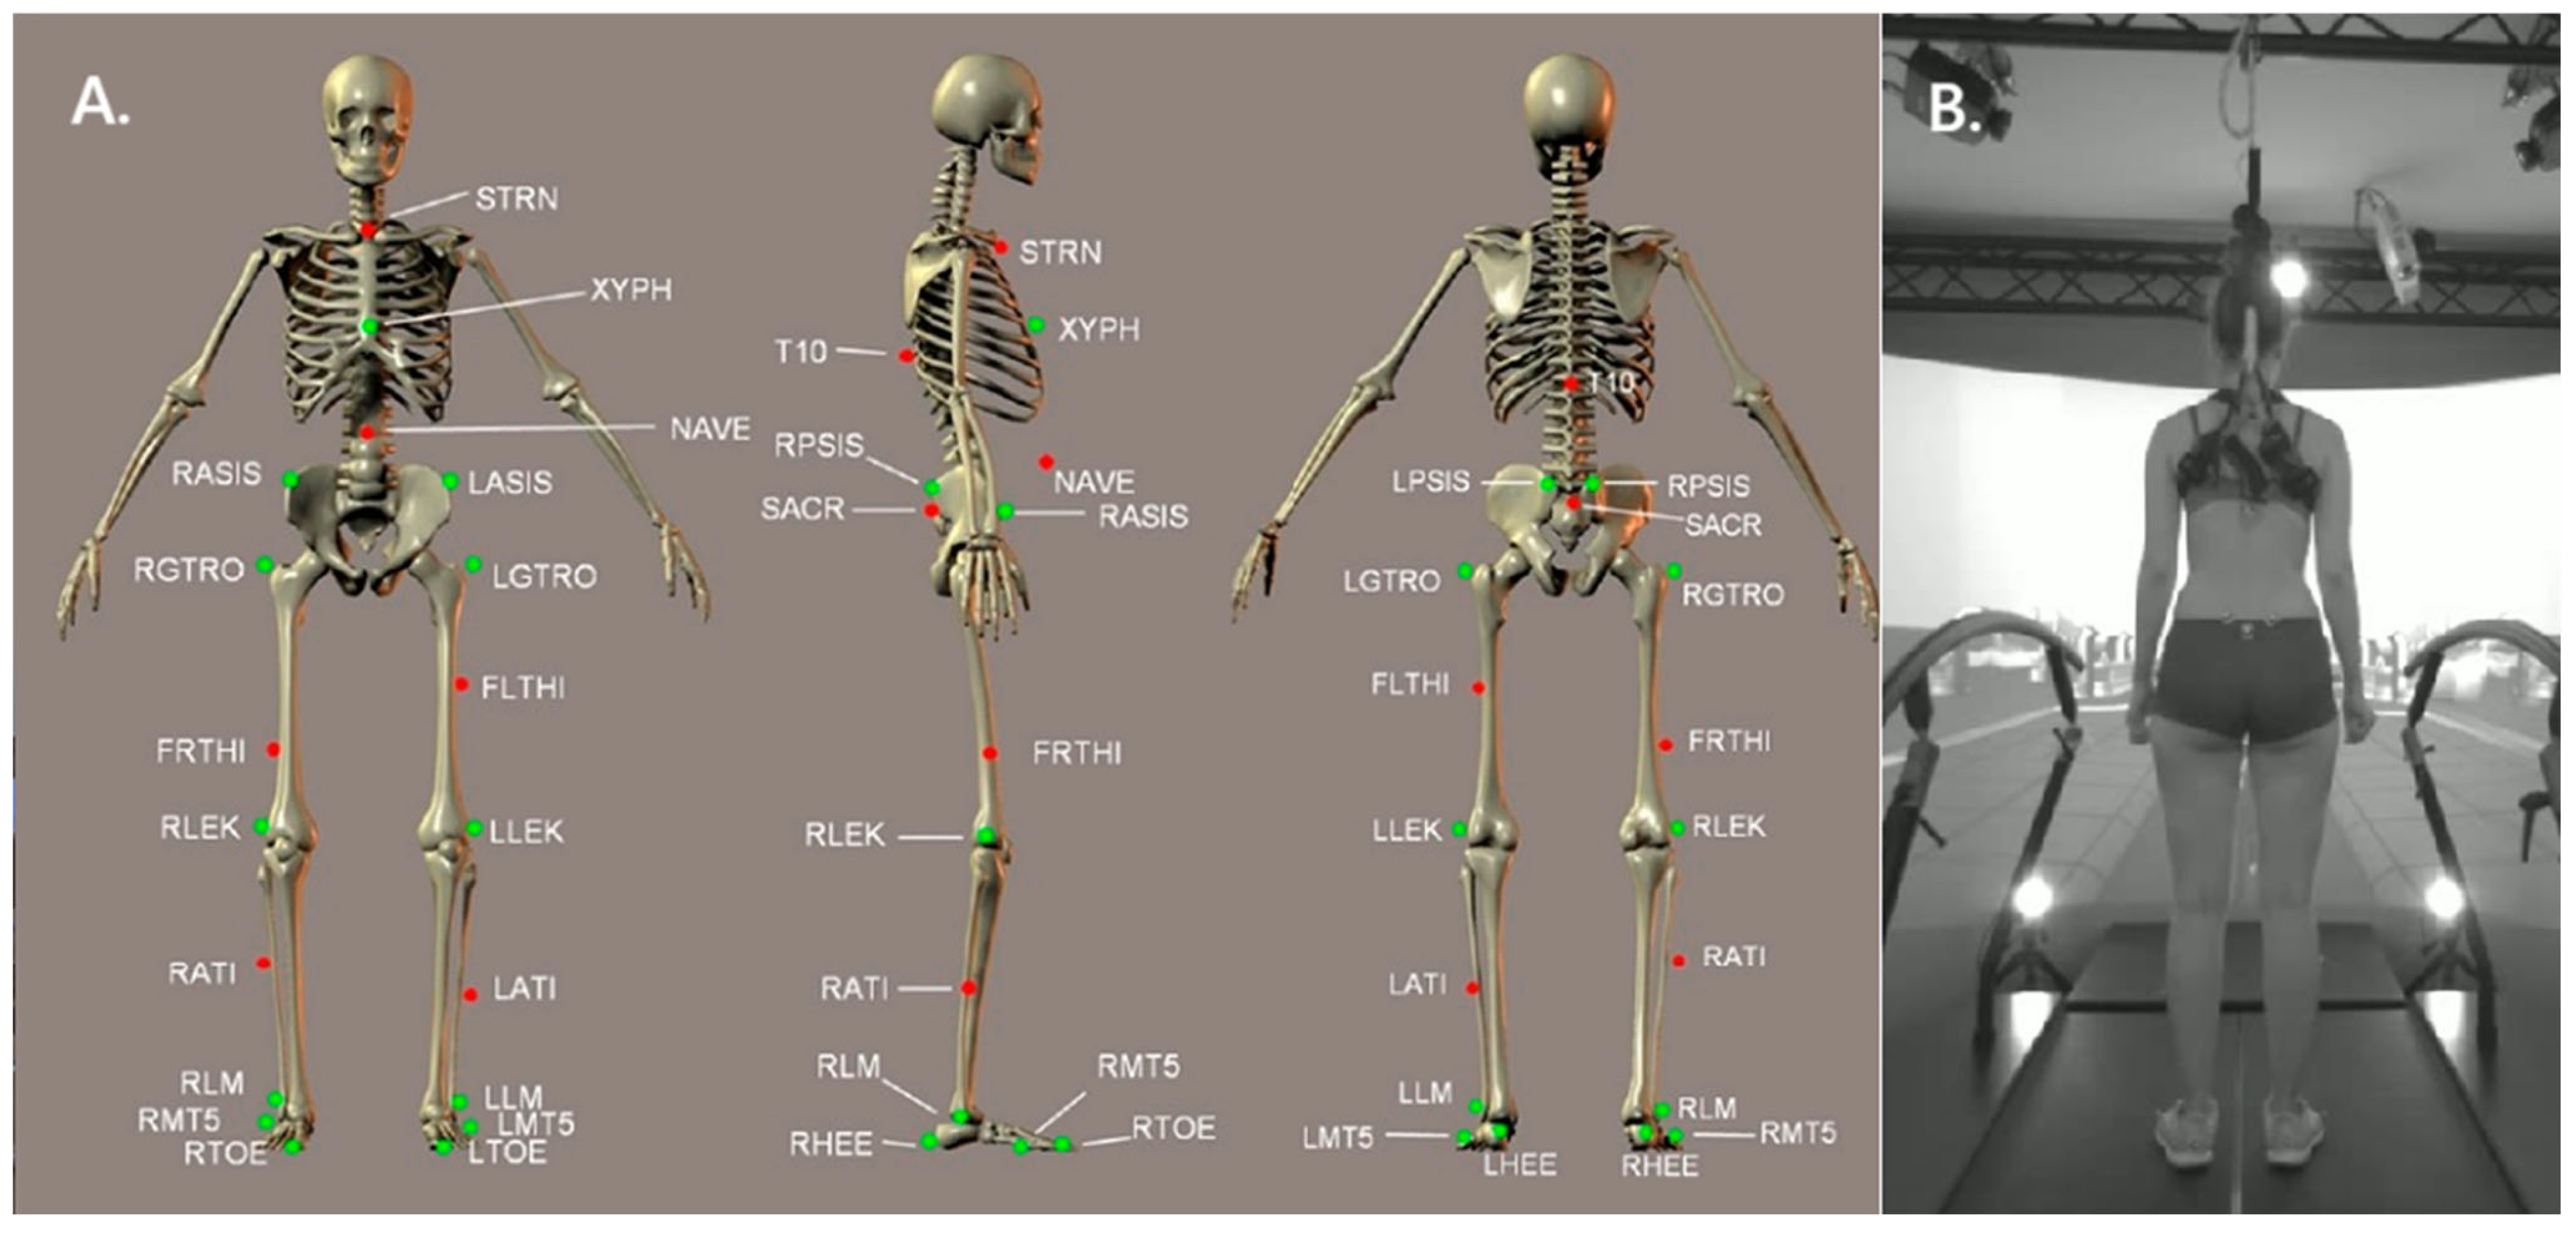
2.2. Measurement Protocol and Perturbation Specification

The kinematics and kinetics parameters of the perturbed gait took place in a Gait Real-time Analysis Interactive Lab (GRAIL, Motek Medical B.V., Amsterdam, The Netherlands). The GRAIL includes an instrumented dual split-belt treadmill with pitch and sway (1000 Hz), a motion capture system (Vicon Metrics Ltd., Oxford, UK) (100 Hz), three video cameras, synchronized virtual reality environments, and a ceiling-suspended safety harness. The Human Body Model 2 (HBM2), based on 25 reflective markers (Figure 1A), captured the participants’ motions. The D-Flow software v. 3.26 (Motek Medical B.V., Amsterdam, The Netherlands) was used for perturbation triggering and data acquisition.
In this study, participants walked on a dual-belt treadmill at a fixed speed while wearing comfortable athletic footwear. The walking speed was set at 1.2 m/s for young adults and 1.0 m/s for older adults. This distinction was necessary because older participants tended to transition into a running gait at 1.2 m/s, while 1.0 m/s was too slow for younger adults and led to an unnatural gait pattern. Moreover, it is worth emphasizing that a review by Chodkowska et al. [6] addressed the topic of gait speed when studying the effect of perturbations on gait parameters, comparing older and younger groups. They showed that in most cases, the speed was self-selected and consistently differed between the two groups [23,24].
Although the treadmill perturbations were not intended to induce falls, all participants wore a ceiling-mounted safety harness for protection (Figure 1B), which allowed the full range of motion and did not restrict movement. Unexpected mechanical perturbations were applied to the left treadmill belt during the toe-off phase of gait. Each participant completed a single trial, consisting of five perturbations occurring at 10-s intervals–specifically at the 30th, 40th, 50th, 60th, and 70th seconds of walking (Figure 2A).
Perturbations were only applied to the left leg, which was the non-dominant, supporting limb for all subjects [25]. This decision was based on the assumption that applying perturbations to the non-dominant leg may pose a lower risk of imbalance or falls, particularly in older adults. While existing literature often focuses on the right leg and does not consistently validate left-right symmetry, some studies, such as those highlighted in the review by Chodkowska et al. [6] have applied perturbations to the left leg or both legs. This study contributes to addressing this gap by providing data specific to left-leg perturbations.
The perturbations involved sudden accelerations of the left belt, causing the stance foot to move backward [26]. The intensity of each perturbation was standardized at level 5 (on a scale of 1 to 5), resulting in a belt speed change of approximately 0.6 m/s and a perturbation duration of about 0.93 s (Figure 2B). The timing of each perturbation was automatically determined in D-Flow software v. 3.26, based on real-time marker data from the heel and toe. This ensured consistent application at the toe-off phase across all participants. This protocol was adapted from the methodology described by Sloot et al. [27]. Furthermore, a comprehensive review by Chodkowska et al. [6] delineated the most frequently employed perturbation types and their intensity ranges, while the work by Błażkiewicz and Hadamus [28] identified perturbations exhibiting the highest repeatability. Collectively, these sources substantiated the methodological framework utilized in the present study.

2.3. Parameters and Strategies Identification

Kinematic and kinetic parameters in the sagittal plane were extracted from *.mox files generated by the D-Flow software version 3.26 and imported into MatLab R2021a (MathWorks, Natick, MA, USA) using a toolbox developed by Feldhege et al. [29]. For the analysis, two gait cycles were selected from each participant’s left lower limb–specifically, unperturbed cycles that immediately preceded the onset of perturbation. This procedure enabled the creation of reference treadmill gait data for both the younger (Y) and older (O) groups separately.
Subsequently, gait cycles that included the perturbation (affecting the left leg) and the corresponding response (right leg) were analyzed for each participant. These cycles were examined within the Y and O groups independently to identify behavioral strategies, focusing on both the perturbation phase and the resulting compensatory response. The analysis was based on the vertical component of the ground reaction force (GRF), imported from Excel files in which each column represented one participant’s signal. The data were transposed so that each row corresponded to a single participant, allowing direct comparison between participants.
Standardization (z-score normalization) was then applied to reduce inter-subject variability and focus on the relative shape of the signals. To reduce the dimensionality of the dataset while retaining the key variance, Principal Component Analysis (PCA) was performed. The first two principal components were used to represent each subject in a reduced feature space.
K-means clustering was then applied, grouping the subjects into three distinct clusters, with 10 replicates to enhance the robustness of the results. These three clusters captured different behavioral response patterns based on the vertical GRF profiles. Moreover, to visualize and interpret the clustering results, average GRF curves were calculated for each cluster, along with their standard deviations. These mean curves and variability bands were plotted to reveal characteristic loading patterns for each group. This approach provided insights into how participants adapted their loading behavior in response to the perturbation, helping to differentiate between distinct compensatory strategies.
Building on the clustering results, both kinematic parameters (joint angles) and kinetic parameters (joint torques) were classified according to the three identified strategy groups. For each strategy and the reference treadmill gait data, the maximum and minimum values of each parameter were determined within the gait cycle, separately for the Y and O groups. It is important to emphasize that the left and right lower limbs were analyzed independently.

2.4. Statistical Analysis

The normality of the distribution of the calculated extreme values was checked using the Shapiro-Wilk test, which showed distributions different from normal in most cases. Statistical analysis was performed using PQStat 2021 software v. 1.8.2.238 (PQStat Software, Poznań, Poland).
The statistical analysis was conducted in several stages due to the results of the calculation procedure described above. The first stage was to check whether the joint angles, torques, and GRF curves differ for treadmill gait between the young and elderly groups. For SPM t-test, a statistical parametric map SPM{t} was created by calculating the univariate t-statistic at each point of the gait curve [30]. Afterwards, Random Field Theory allowed an estimation of the critical threshold of 5% (α = 0.05) [31]. If at any time, an SPM{t} crossed the critical threshold, a supra-threshold cluster was created, indicating a significant difference between two motion patterns in a specific location of the gait cycle. All analyses were performed using open-source SPM1d code (www.spm1D.org) in Matlab R2021a. The second step involved a comparison of extreme values between groups (Y and O) within each strategy and treadmill gait separately. For this purpose, the U Mann-Whitney test was used. To compute the effect size for a U Mann-Whitney test, the following formula was used: r = Z N , where Z is the Z-score from the test, and N is the total number of observations. In this case, N = 42. The effect size interpretation was as follows: r < 0.3–small effect, 0.3 ≤ r ≤ 0.5–medium effect, and r > 0.5–large effect [32].
In the last step in both groups, the number of strategies separately for the right and left lower limbs were counted to see which occurred most often.

3. Results

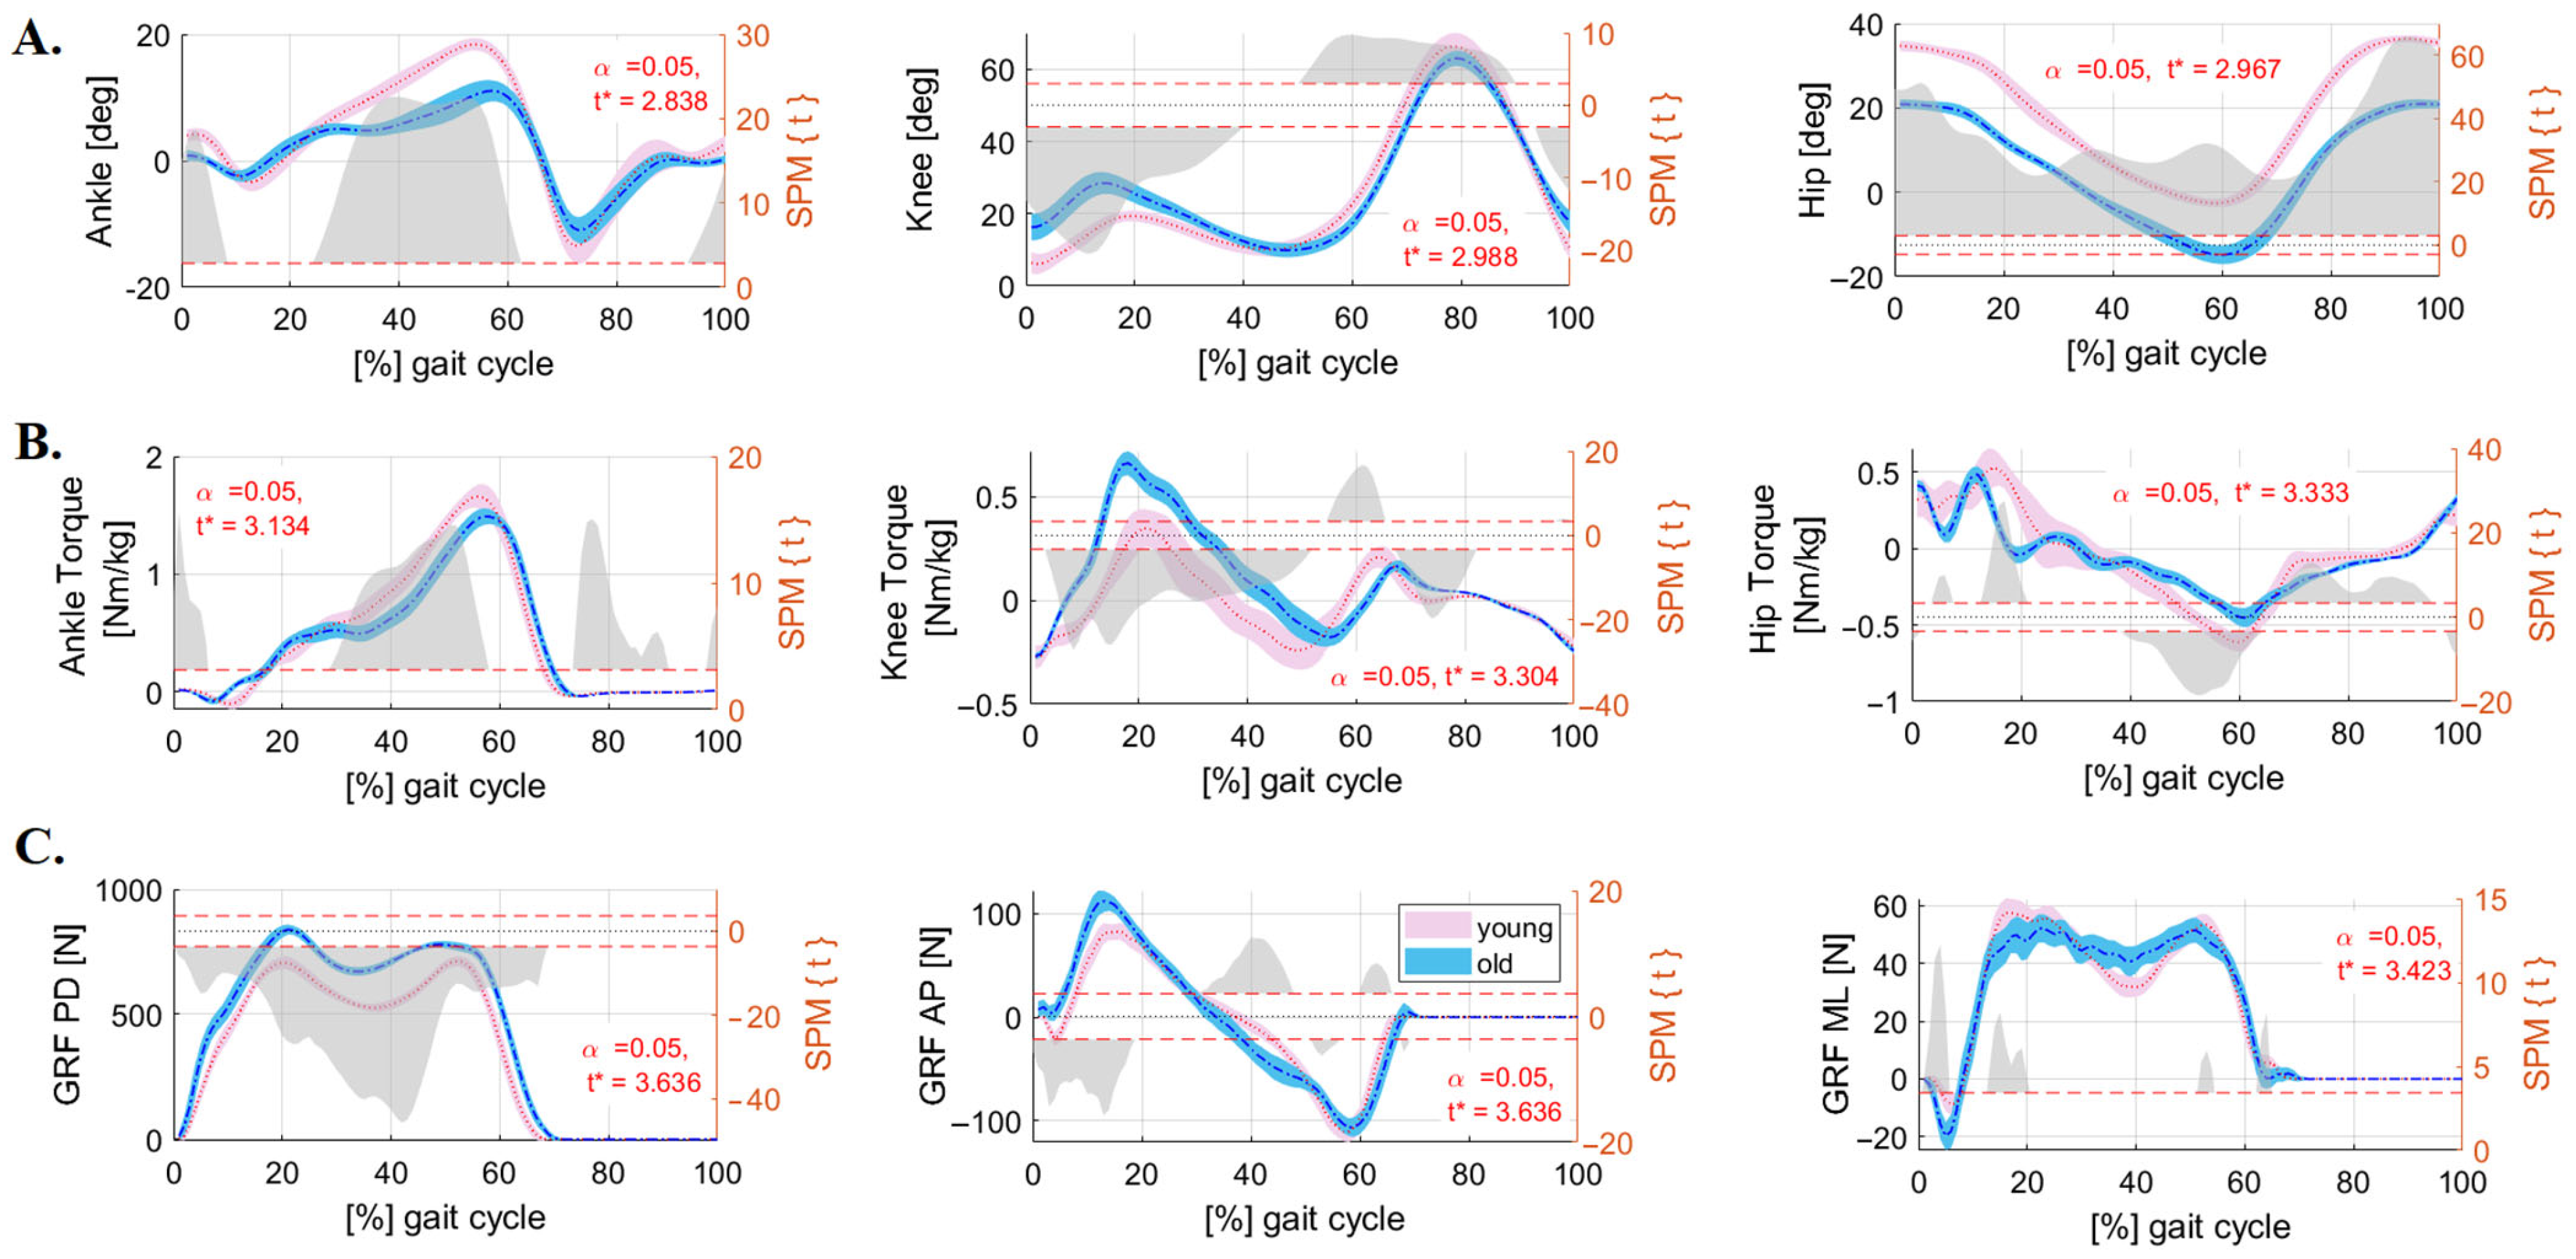
3.1. Differences Between Groups in Treadmill Gait Without Perturbations

Following the SPM analysis, statistically significant differences were observed for all analyzed kinematic and kinetic parameters between the treadmill gait of young and elderly subjects. Such differences were noted for hip and knee joint angles for the entire gait cycle at p < 0.001. For the ankle joint, differences were also at p < 0.001, but in the intervals of 0–8%, 24–62%, and 92–100% of the gait cycle (Figure 3A).
In the case of lower limb muscle torques, the largest differences were for the knee, hip, and ankle joints, respectively (Figure 3B).
The smallest differences were noted for the lateral component of the ground reaction forces. In the case of the anterior-posterior and vertical components of GRF, differences were recorded throughout the entire support phase (Figure 3C).

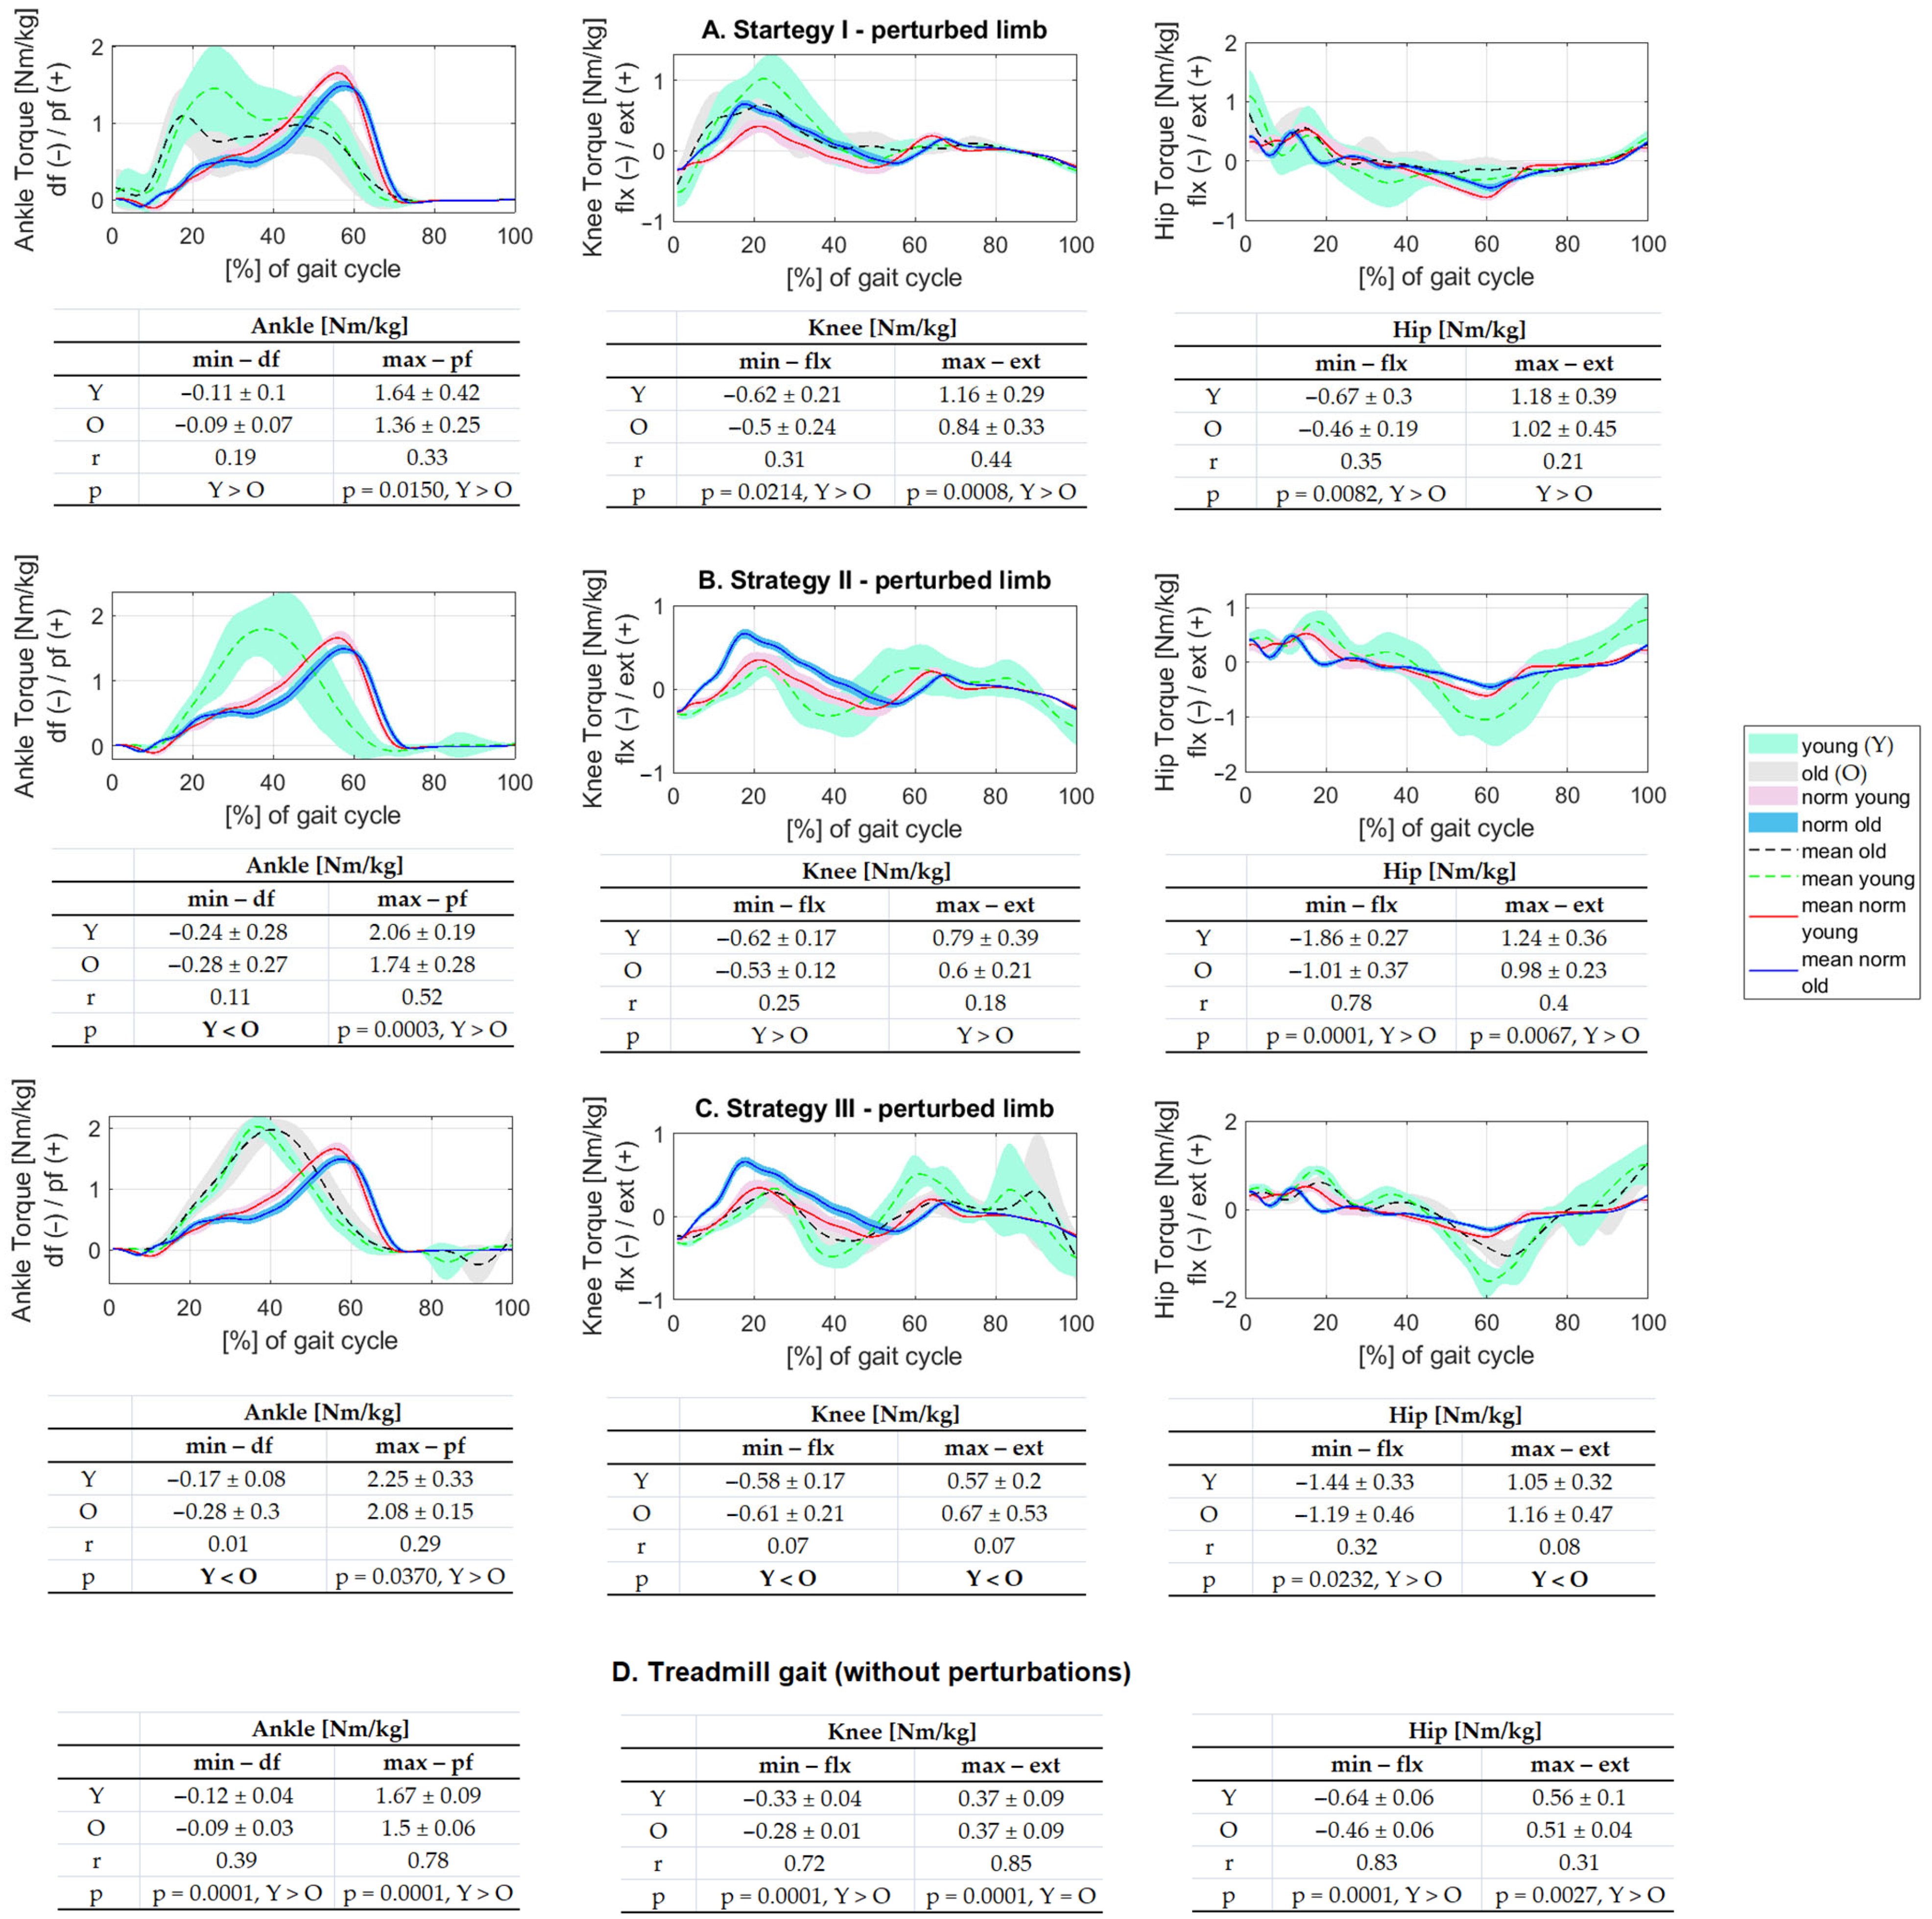
3.2. Description of Response to Perturbation for Kinematic and Kinetic Parameters–Perturbed Limb

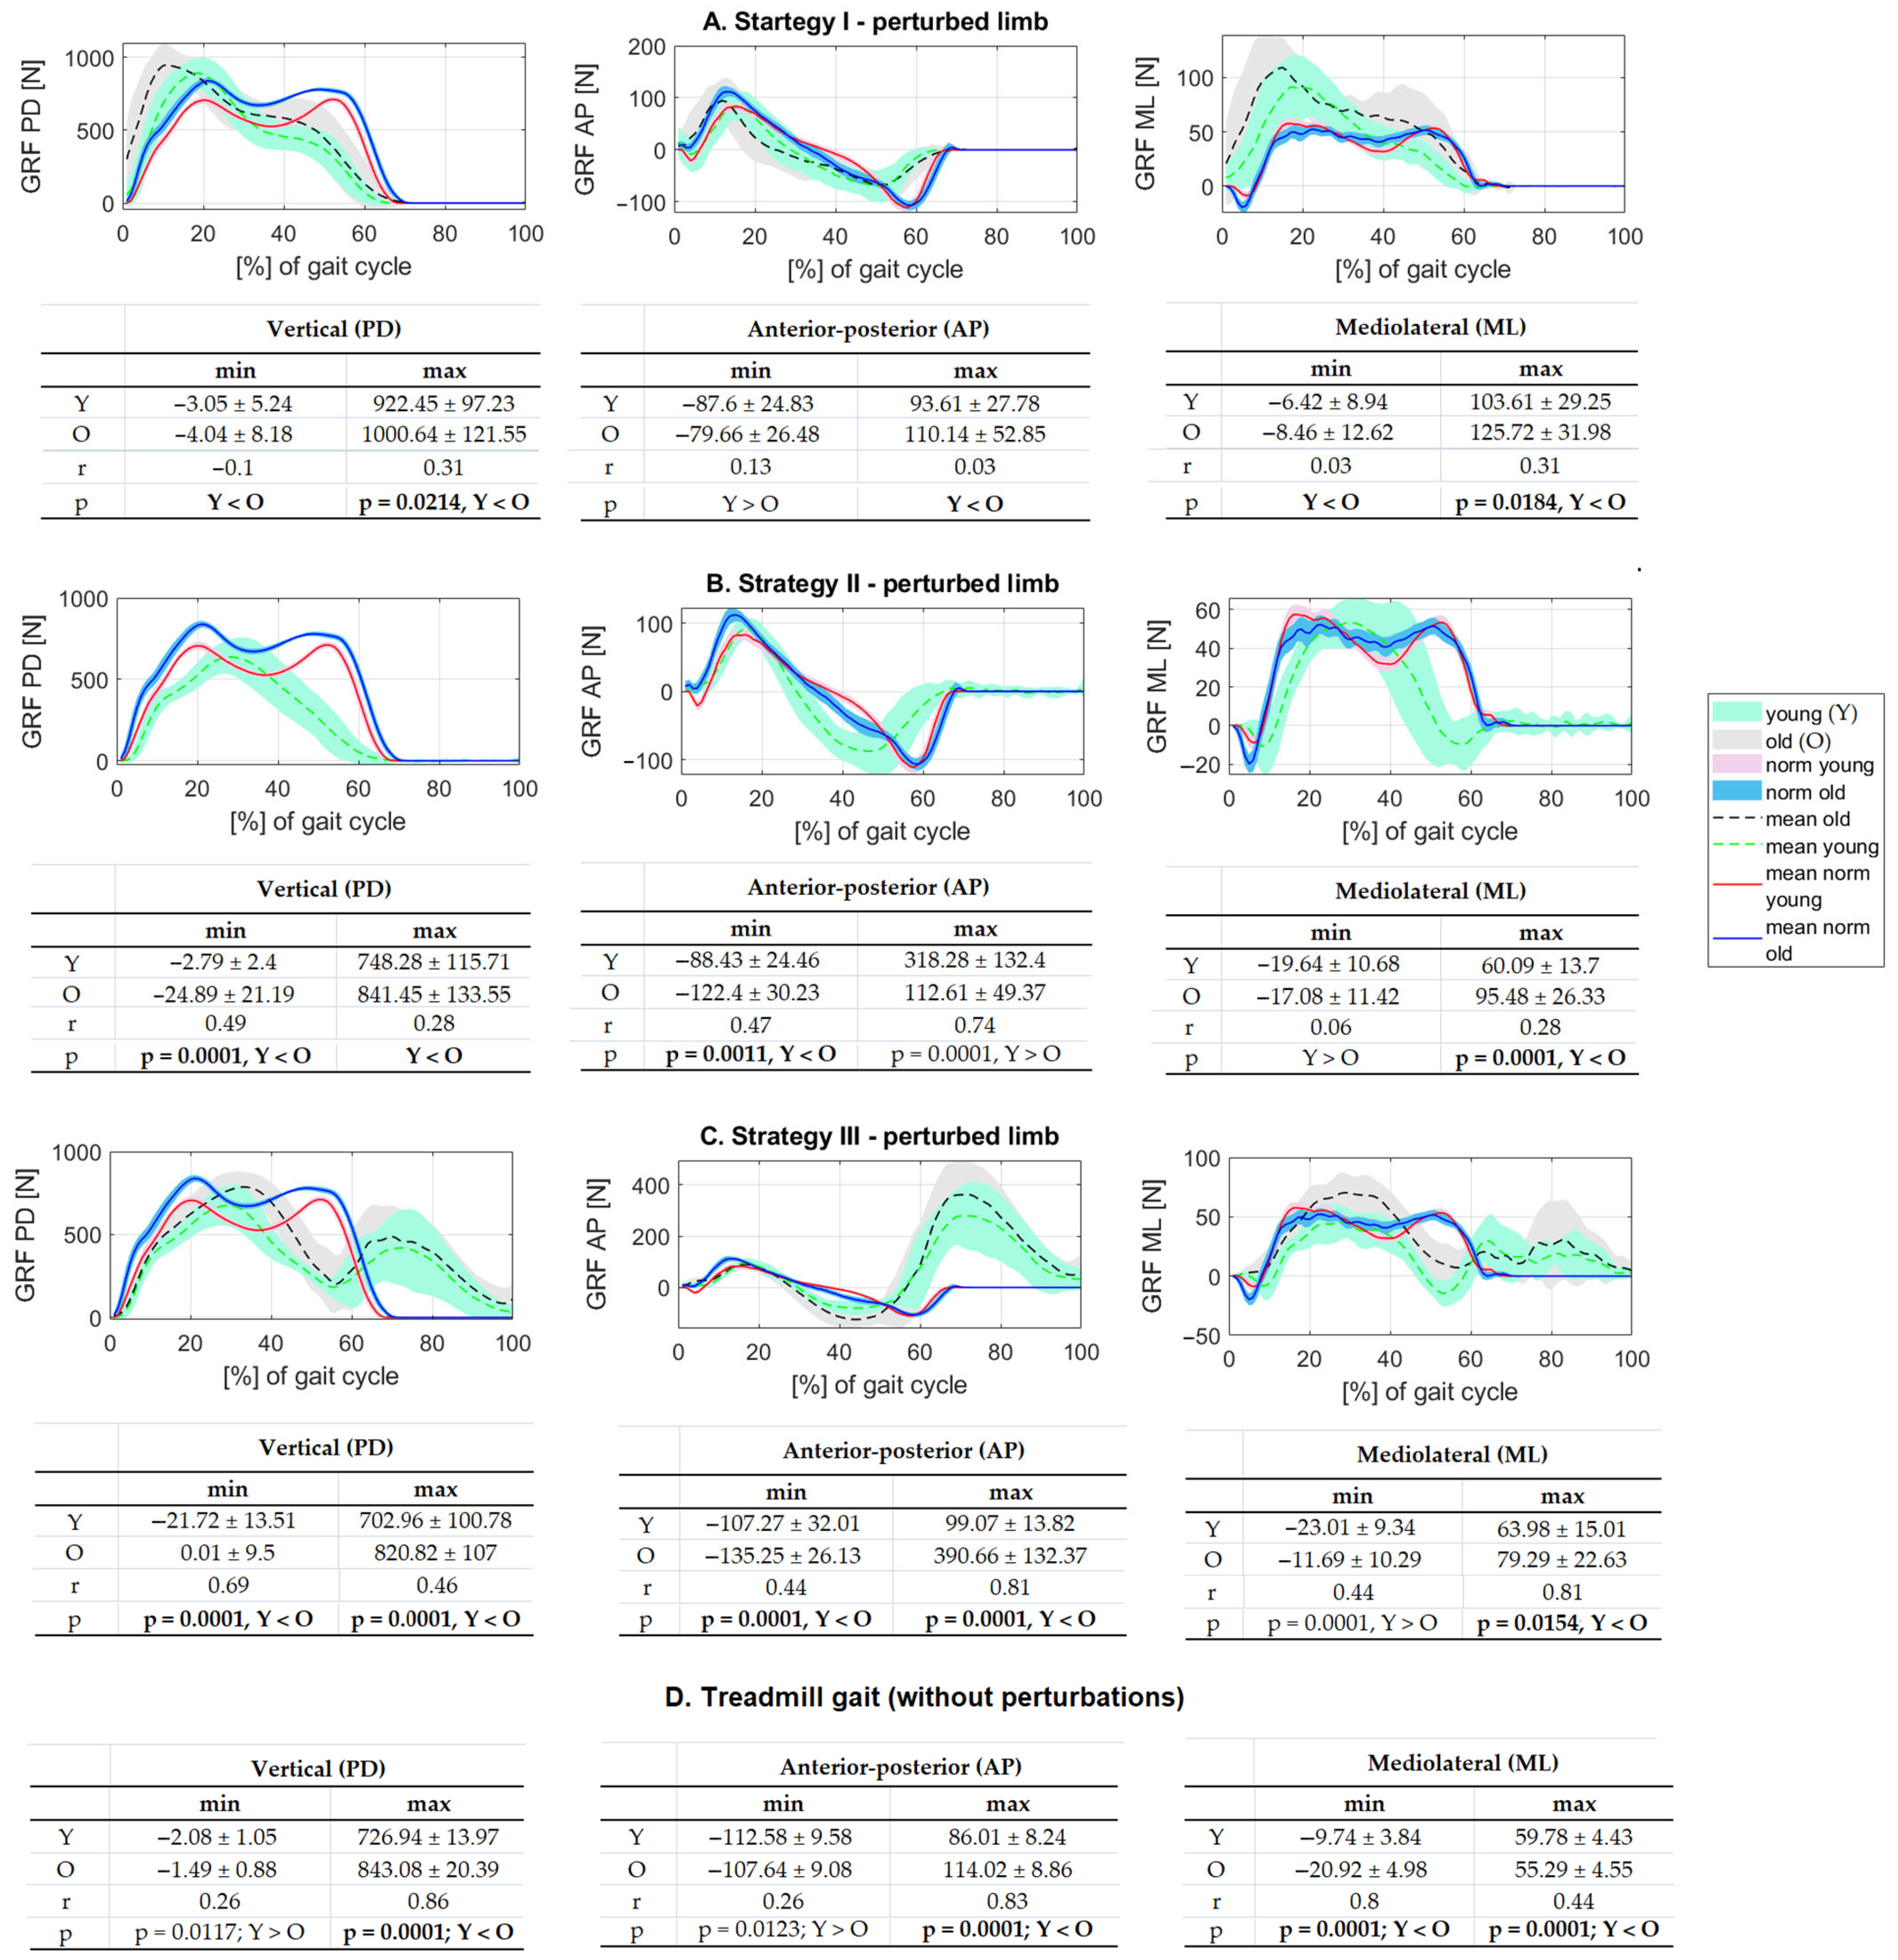
3.2.1. Ground Reaction Forces

Figure 4 shows the clustering of vertical ground reaction force (GRF) patterns of perturbed left lower limbs, highlighting distinct adaptation strategies in older and young adults. Principal Component Analysis (PCA) was applied to reduce the complexity of the GRF data, with the first two principal components (PC1 and PC2) capturing the most relevant variability in movement patterns. In the older adult group (Figure 4A), PC1 and PC2 accounted for 51.6% and 22.7% of the total variance, respectively–together explaining 74.3% of the dataset’s variability. For the young adult group (Figure 4B), PC1 explained 45.1% and PC2 25.5%, totaling 70.6% of the variance. These high percentages indicate that the majority of meaningful differences in GRF patterns are well represented in the two-dimensional PCA space. K-means clustering (3 clusters, 10 replicates) identified clear groupings of subjects based on their GRF characteristics, with each point representing an individual and colors denoting cluster membership. The distinct separation between clusters suggests varied loading behaviors, with noticeable differences between age groups–indicating that older and younger adults employ different compensatory strategies, likely influenced by age-related changes in neuromuscular control and balance response.
The extreme values of each component of ground reaction forces from the elderly group were compared with those recorded for the young group for each extracted behavioral strategy and treadmill gait (Figure 5).
Statistically significant differences were noted for all variables between the younger and older groups for treadmill gait (Figure 5D) and for Strategy III (Figure 5C). For Strategy II, significantly higher values were reported in the elderly group compared to those recorded in the young group for the maximum values of the ML component, the minimum values of the vertical component, and both the minimum and maximum values of the AP component (Figure 5B). In Strategy I, the maximum values for the ML and PD components were significantly higher in the elderly group (Figure 5A).
It is worth noting that, for most variables, the values recorded in the elderly group were higher or significantly higher than those in the young group. The exceptions were noted for (1) the minimum value of the anterior-posterior component of GRF in Strategy I; (2) the maximum value of the anterior-posterior component of GRF in Strategy II; (3) the minimum value of the ML component of GRF in Strategy III; (4) and the minimum value of the vertical and anterior-posterior components of GRF and treadmill gait.

3.2.2. Kinematic Parameters

In this section, the approach was identical to the previous one. The maximal and minimal values of lower limb joint angles were compared between young and old subjects within each strategy and treadmill gait (Figure 6A–D).
Most of the values recorded in the older group were higher than those achieved in the young group. Non-significant exceptions included the ankle dorsiflexion and the hip flexion angles in Strategy I. Moreover, significantly higher plantarflexion was observed in the young group. In Strategy II, the significant differences from the rule were for ankle plantarflexion and knee flexion. In Strategy III, the exception was only for ankle plantarflexion, which was significantly greater for young people. During treadmill gait, hip flexion angle, and ankle and knee joints’ extreme values were higher in the young group.
The strategy with the highest number of extreme values deviating the least from those recorded for treadmill gait seems to be the one that should be adopted most often by the subjects. For this purpose, the differences between the extreme values adopted for each strategy and those for treadmill gait were counted separately in the two groups (Table 2). In the youth group, out of six differences, four were minimal, one was medium, and one was maximum for Strategy I. For Strategy II: 1–minimum, 4–medium, and 1–maximum. For Strategy III: 1–minimum, 1–medium, and 4–maximum.
Among older people, out of the six differences, three were minimum, one was medium, and two were maximum for Strategy I. For Strategy II: 1–minimum, 4–medium, and 1–maximum. For Strategy III: 2–minimum, 1–medium, and 3–maximum.

3.2.3. Kinetic Parameters

The final step, which included the perturbed limb, was to compare the maximal and minimal values of lower limb joint torques between the young and elderly groups separately in the three Strategies and treadmill gait without perturbation (Figure 7A–D).
In the first Strategy and during treadmill gait, all parameters’ values were lower in the elderly group. For Strategy II, this trend continues for all variables except for dorsiflexion ankle torque, but the differences between the groups are not significant here. Strategy III significantly differs from the pattern. However, the differences between the groups are not statistically significant. In Strategy III, the discussed trend (lower values in the elderly group) is maintained only for the hip flexion and ankle plantarflexion torques.
As for the kinematic parameters, the strategy with the highest number of extreme values deviating the least from those recorded for treadmill gait seems to be the one that should be adopted most often by the subjects. For this purpose, the differences between the extreme values adopted for each strategy and those for treadmill gait were counted separately in the two groups (Table 3). In the youth group, out of six differences, three were minimal, two were medium, and one was maximum for Strategy I. For Strategy II, three parameters had a mean, and three variables had maximum differences. For Strategy III: 3–minimum, 2–medium, and 1–maximum.
Among older people, out of the six differences, four were minimal, one was medium, and one was maximum for Strategy I. For Strategy II, two parameters had a minimum, and four variables had an average distance from those recorded for gait without perturbation. For Strategy III, two variables had a mean dispersion, and four had a maximum one.

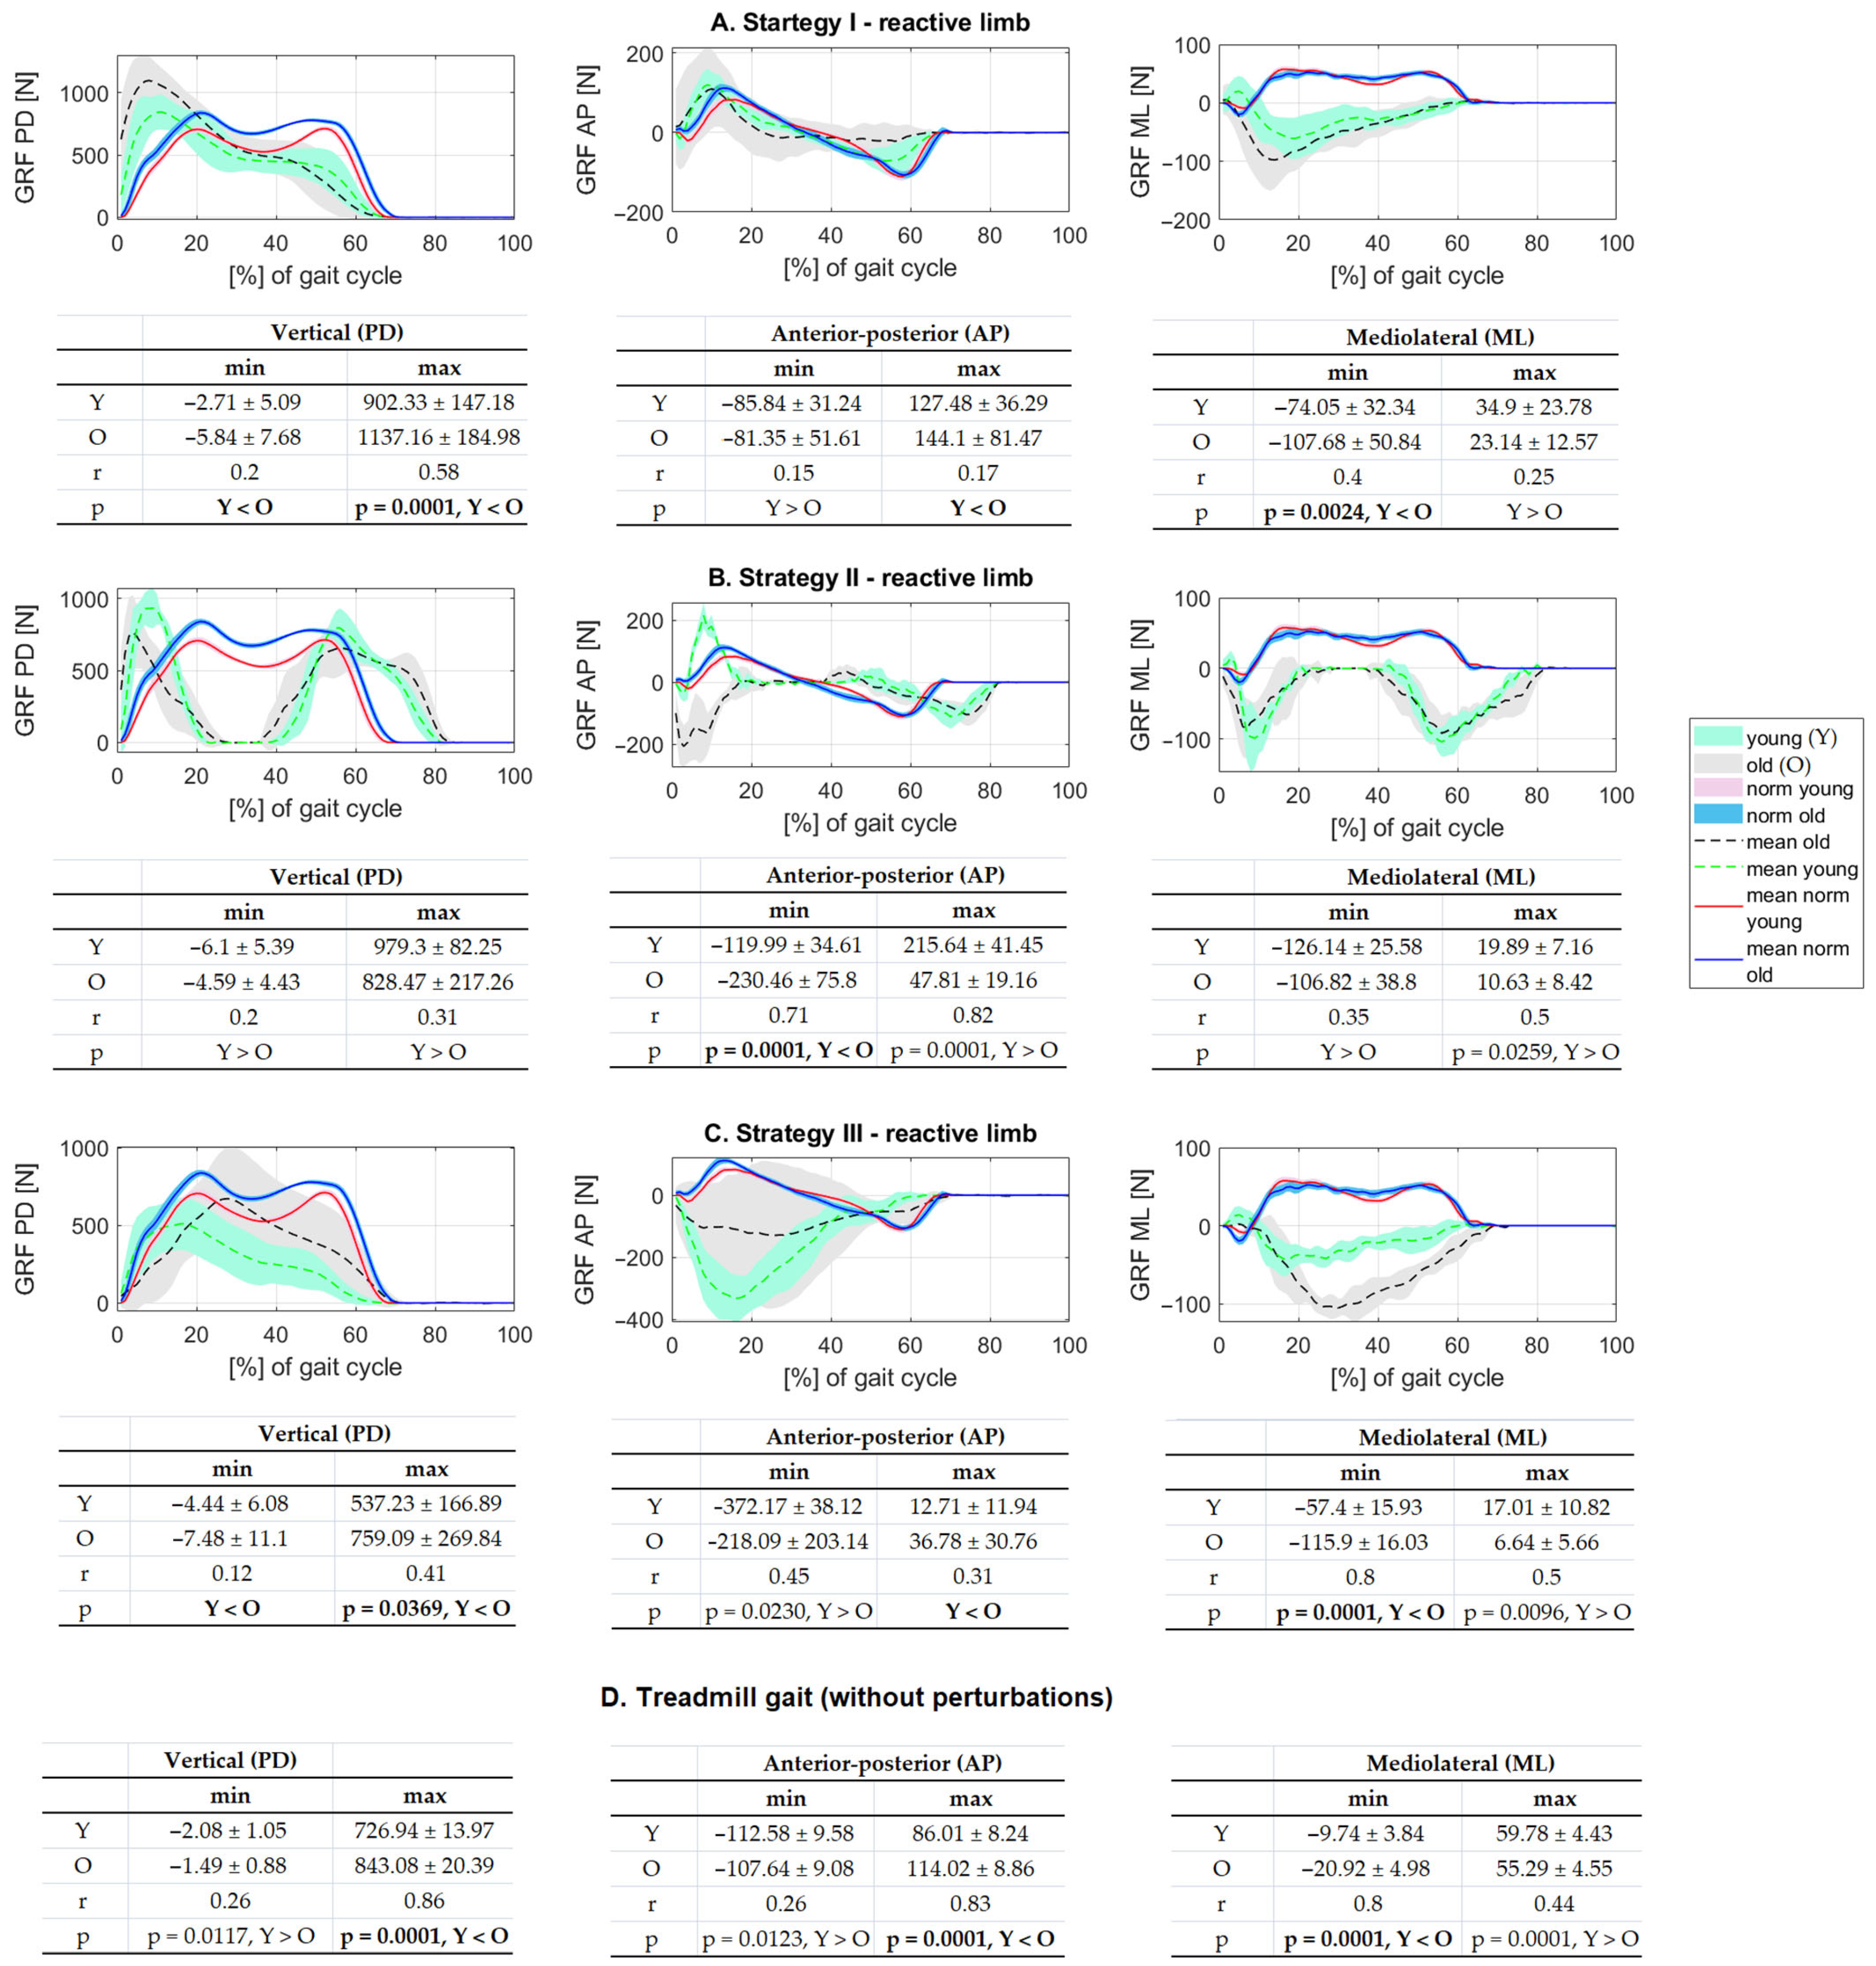
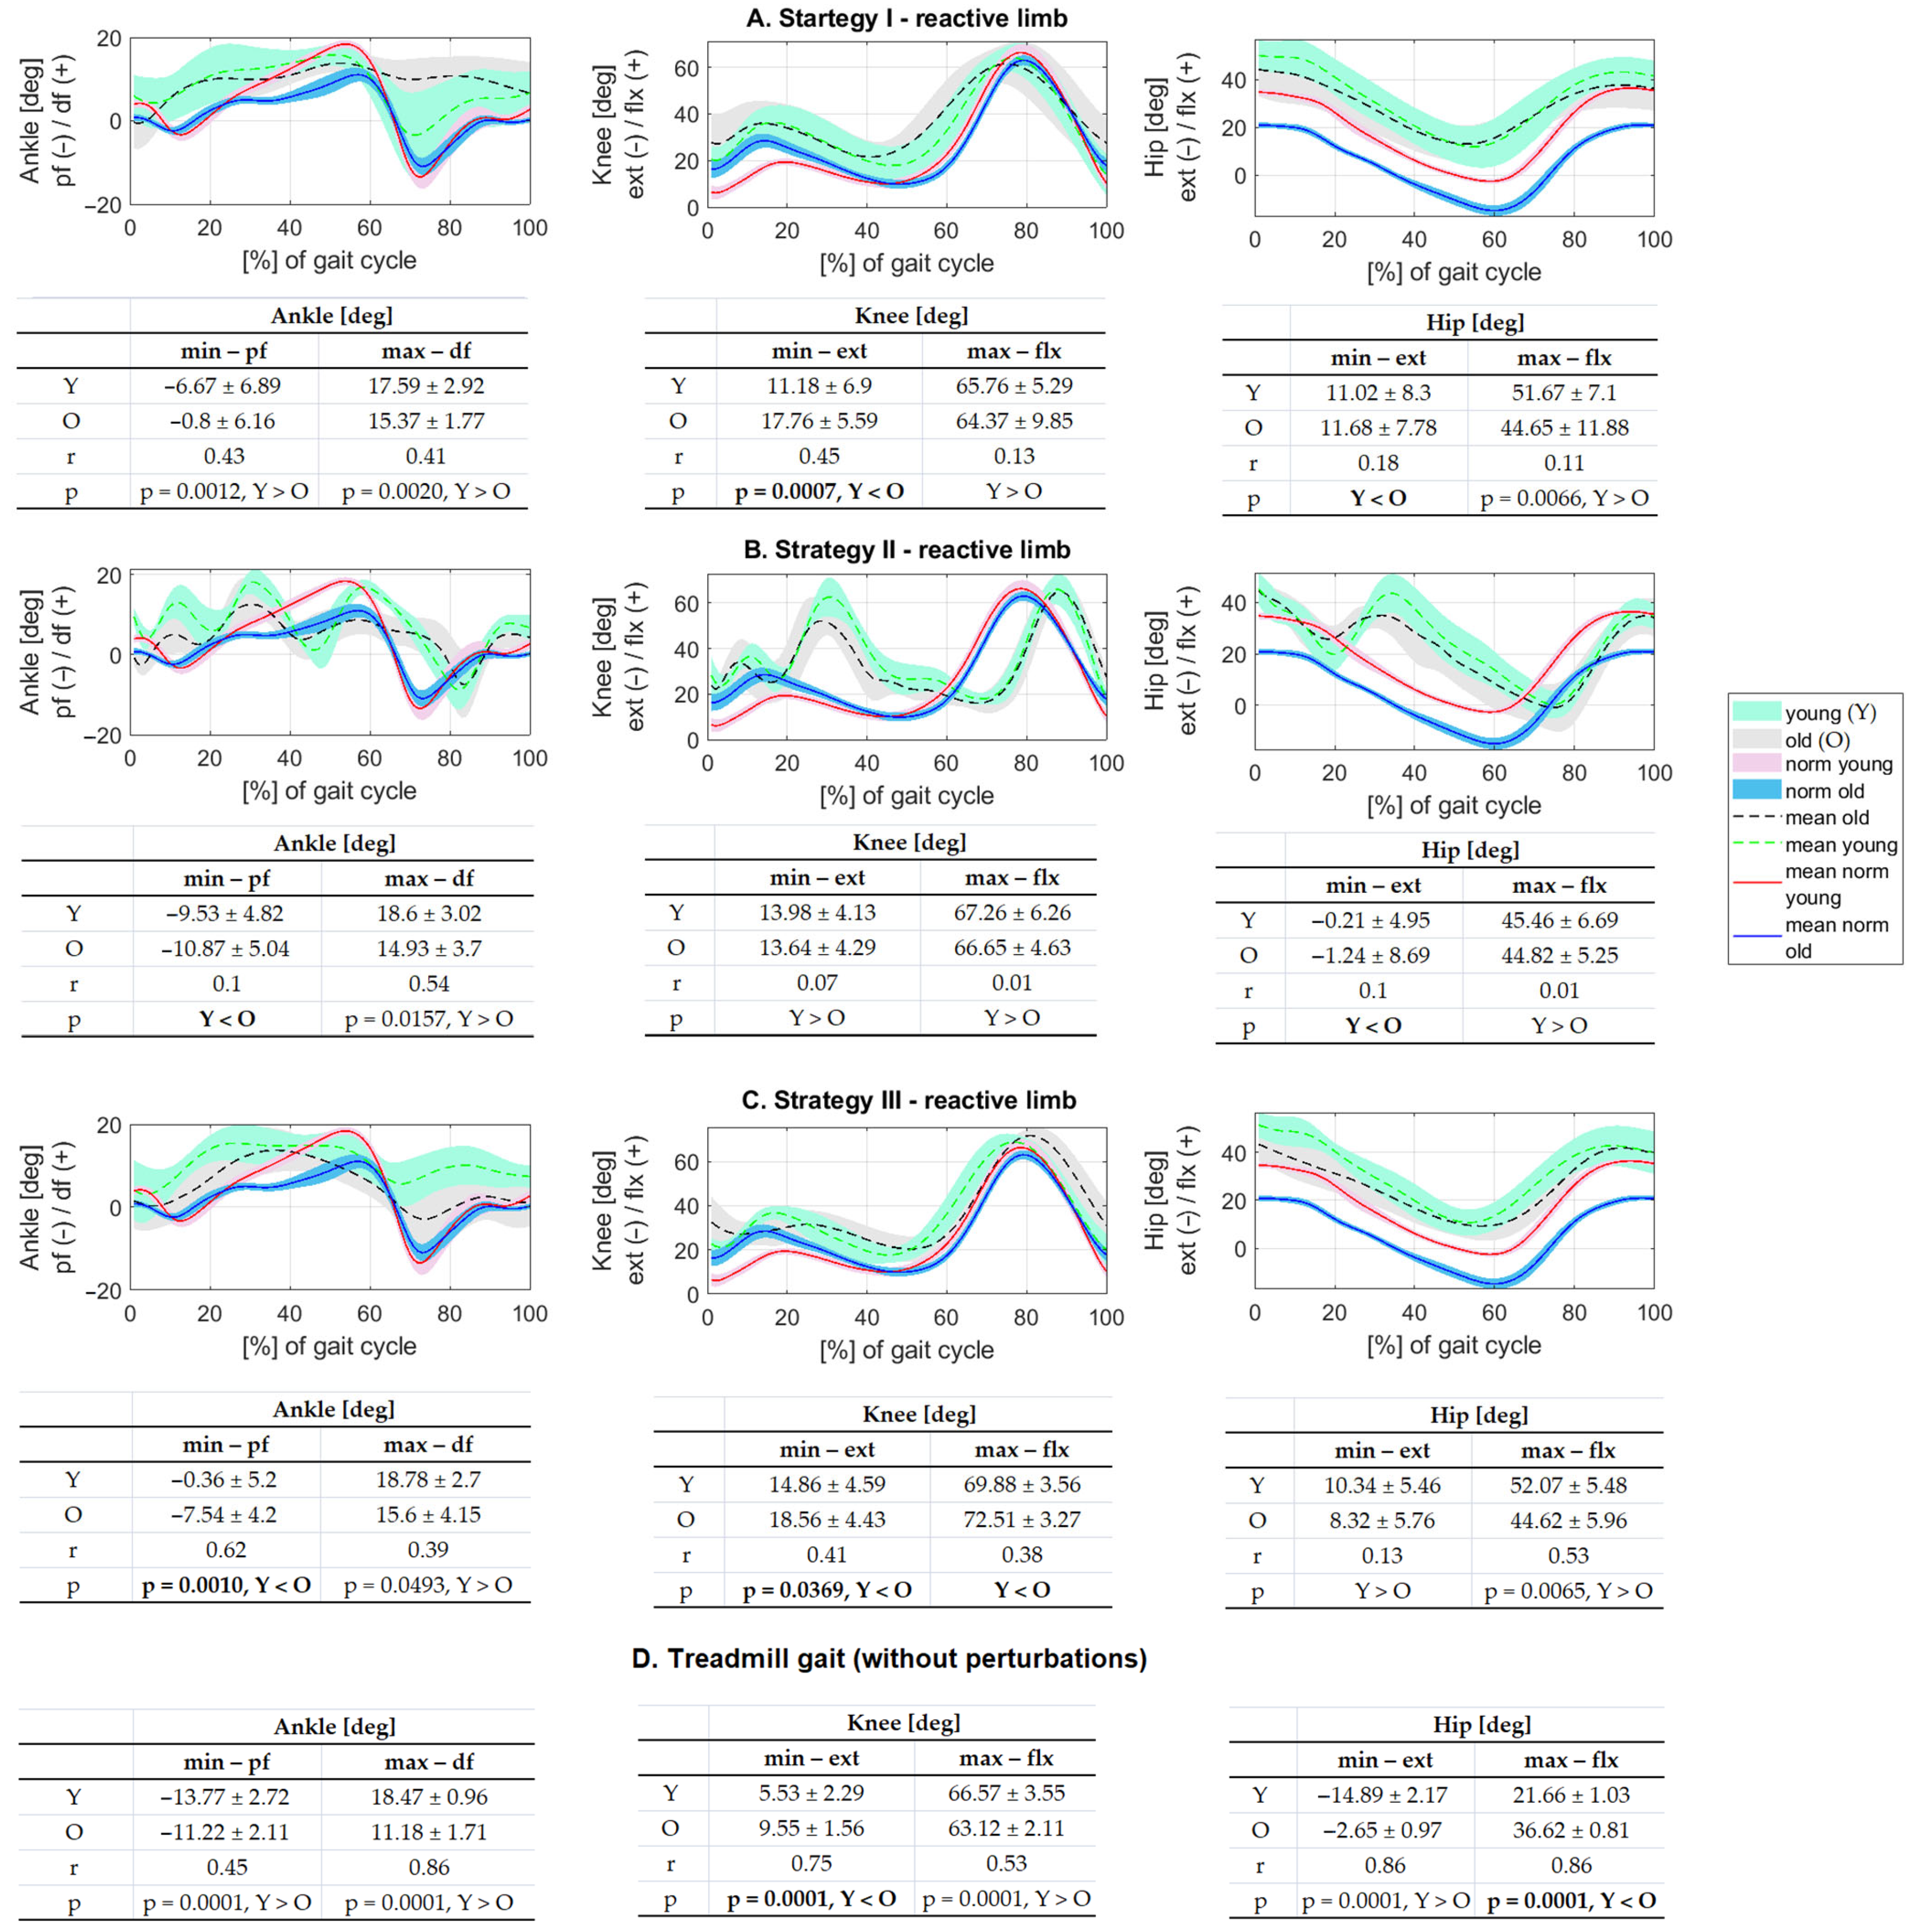
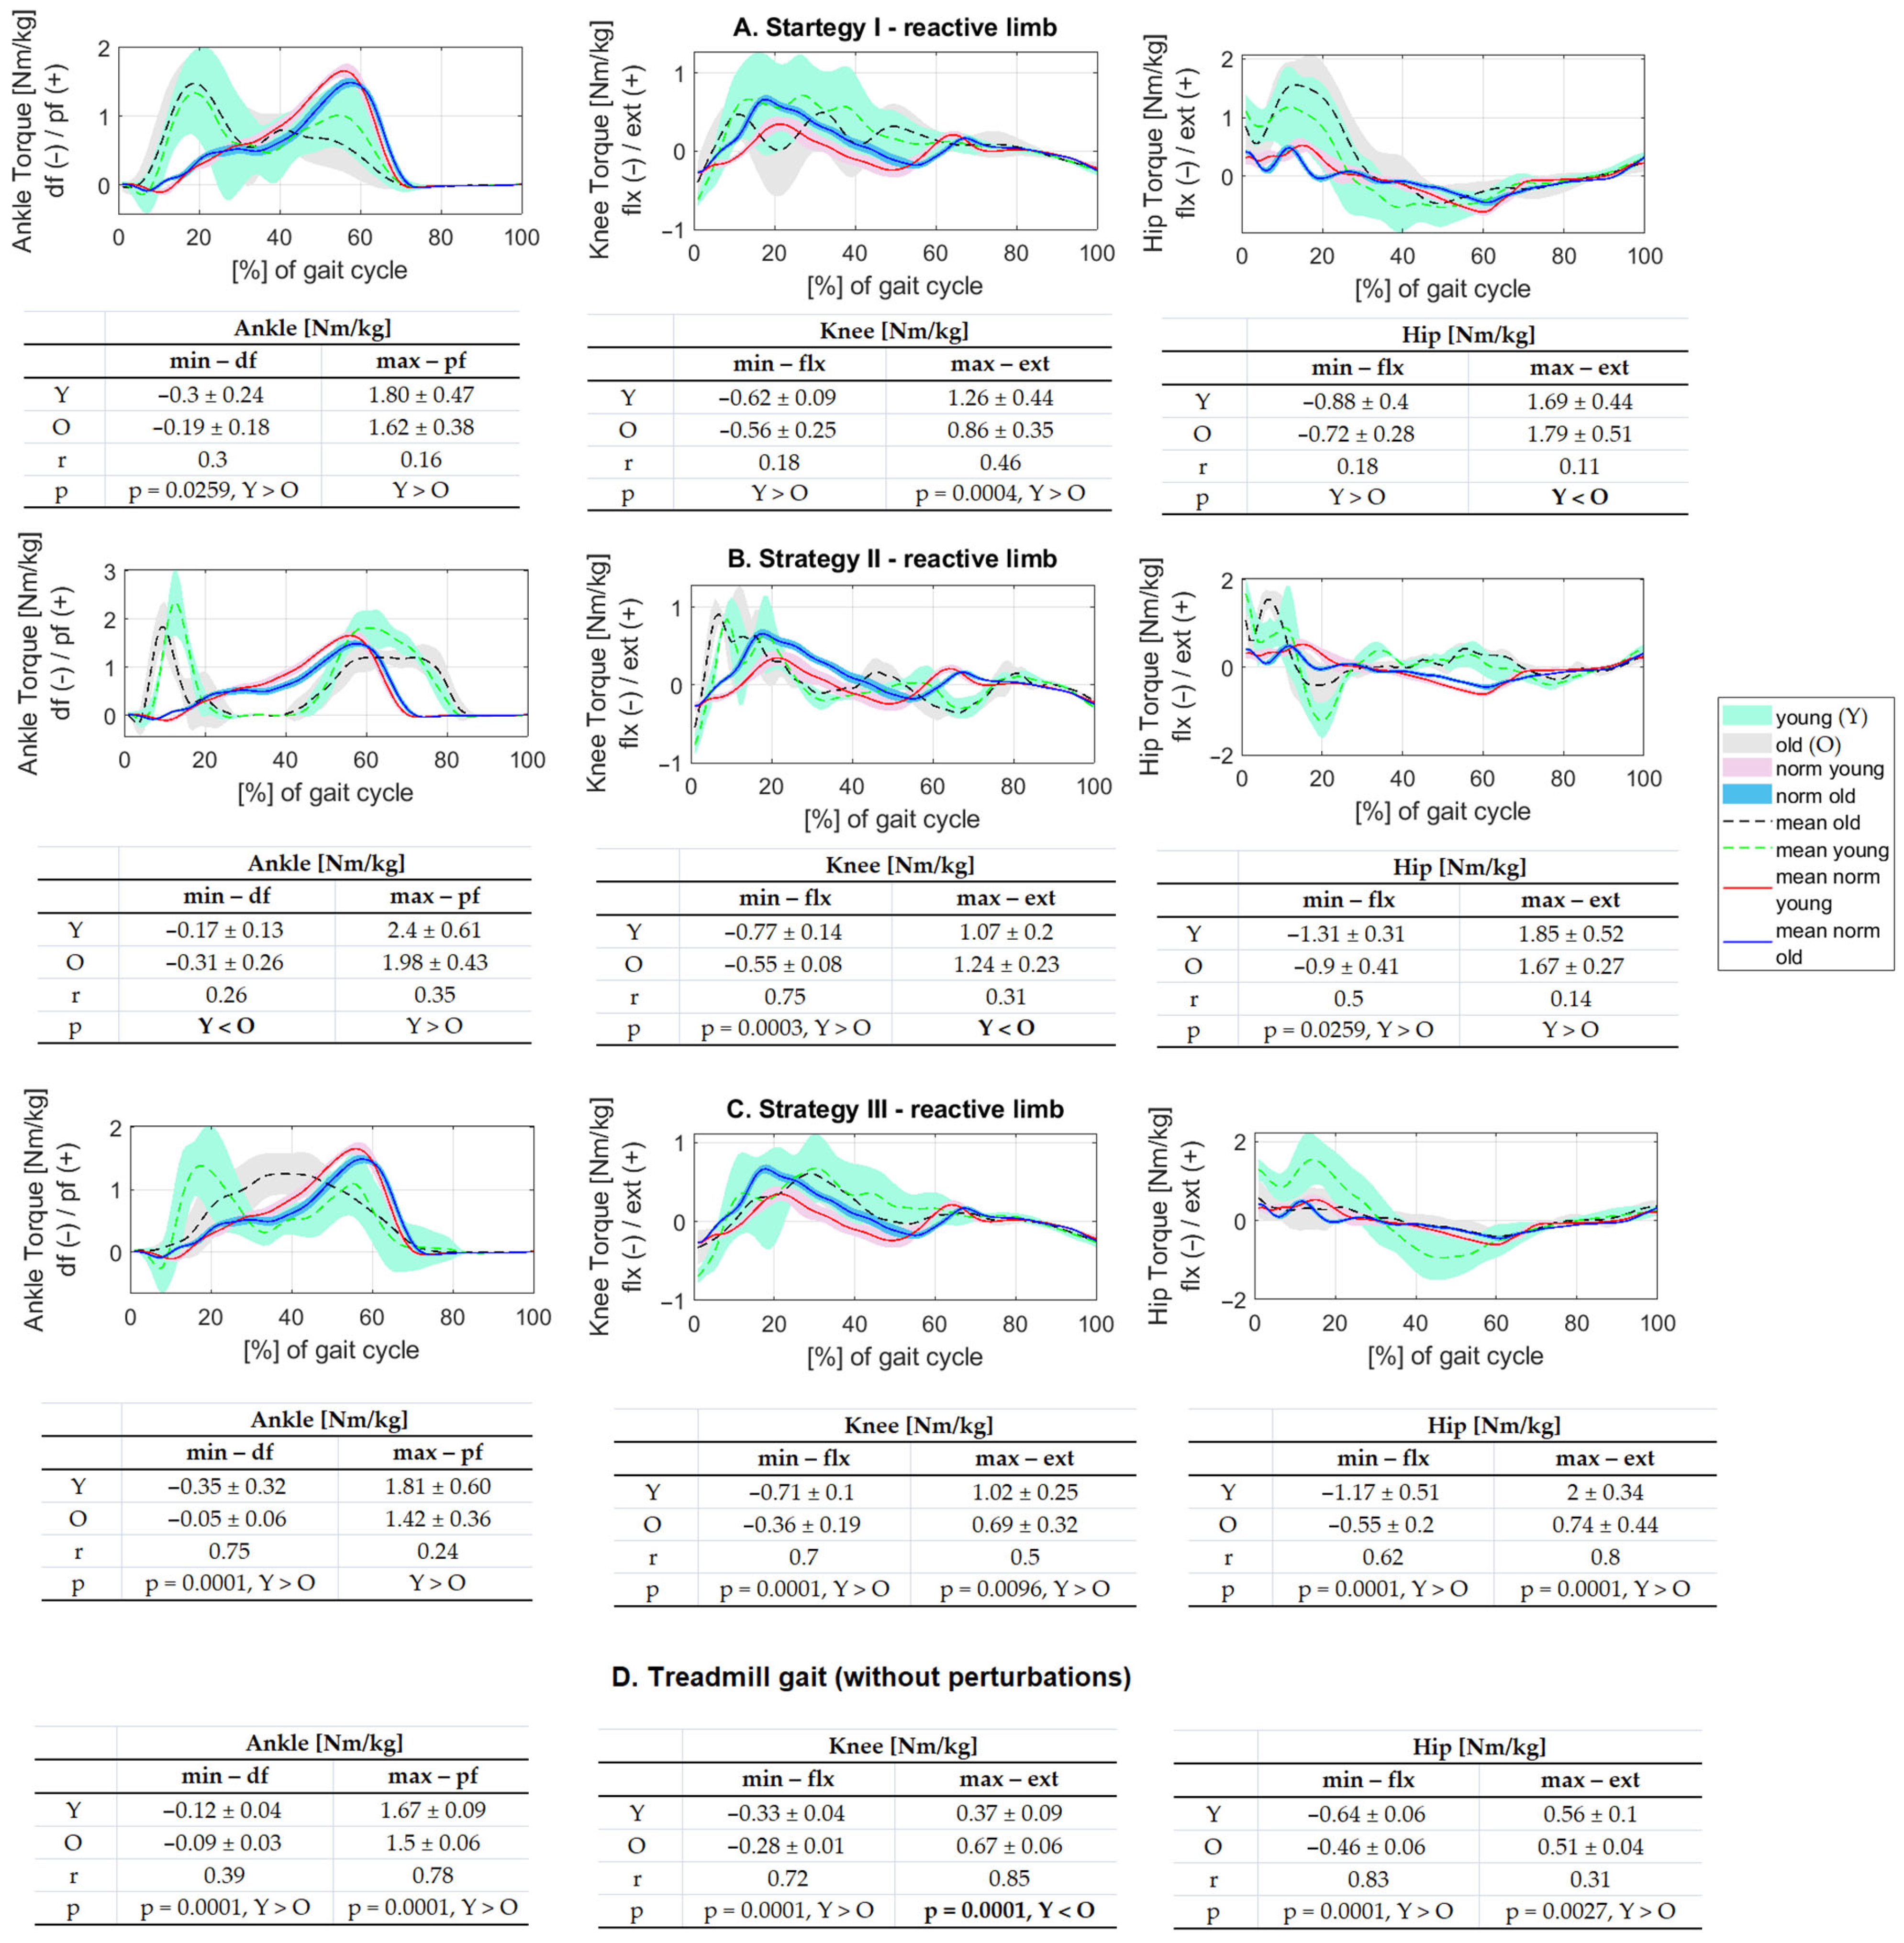
3.3. Description of Response to Perturbation for Kinematic and Kinetic Parameters–Reactive Limb

As in the case of the perturbed (left) limb–for the reactive limb, there are subsections in which there is an analysis of the extreme values for (1) each component of ground reaction forces; (2) lower limb joint angles, and (3) torques in three strategies and during treadmill gait. The aforementioned values found in the elderly group were compared with those recorded for young people using the U Mann-Whitney test. However, it is worth noting that the response to perturbation in Strategies I, II, or III (preservation of the right lower limb) is not necessarily the same as the response described for the perturbed limb in that strategy. In other words, a perturbation located for Strategy I (left leg) could take a response as Strategy II or III (right leg).

3.3.1. Ground Reaction Forces

Figure 8 illustrates the clustering of vertical ground reaction force (GRF) patterns in the reactive phase of the right lower limb, highlighting distinct adaptation strategies in older and younger adults. Principal Component Analysis (PCA) was used to simplify the GRF data, with the first two principal components (PC1 and PC2) capturing the most significant variations in movement patterns. In the older adult group (Figure 3A), PC1 and PC2 explained 59.5% and 26.7% of the total variance, respectively, together accounting for 86.2% of the dataset’s variability. In the younger adult group (Figure 3B), PC1 accounted for 67.7%, and PC2 explained 12.9%, resulting in a total of 80.6% of the variance. These high percentages indicate that the majority of the meaningful differences in GRF patterns are effectively represented in the two-dimensional PCA space.
Figure 9 shows the three components of ground reaction forces for the reactive limb and its three ways of responding to perturbations. In both groups, the shapes of the curves in all Strategies differ significantly from those presented for treadmill gait.
When analyzing the extreme values of the three components of ground reaction forces, the most significant differences between the young and elderly groups were found for treadmill gait (all parameters) and Strategy III (four parameters). In most cases, the values recorded in the elderly group were higher or significantly higher than those noted in the young group. The exceptions to the rule were in Strategy I for the maximal value of the ML component, Strategy II for the maximal value of the ML component and the AP component, and Strategy III for the maximal value of the ML component and the minimal value of the AP component. In treadmill gait, the exception to the rule is the maximal value of the ML component and the minimum values of the PD and AP components.

3.3.2. Kinematic Parameters

Regarding kinematic parameters for the reactive limb (Figure 10A–D), the highest differences between the young and elderly groups were found during treadmill gait (all parameters) and for Strategies I and III (four parameters). It is worth noting that in treadmill gait, the extreme values were lower in the elderly group for four parameters (both dorsi and plantarflexion, knee and hip flexion), in Strategy I and III for three (Strategy I: both dorsi and plantarflexion and hip flexion, Strategy III: ankle dorsiflexion, both hip flexion and extension), and for four parameters in Strategy II (knee flexion and extension, hip flexion, and only one significantly for ankle dorsiflexion).
As mentioned in the chapters on the perturbed limb, the strategy with the highest number of extreme values that deviate the least from the values recorded for the treadmill gait seems to be the one that should be used most often by the subjects (Table 4). The differences between the extreme values adopted for each strategy and those for treadmill gait in the young group were as follows. The first strategy included one minimum, three means, and two maximum values. Strategy II: five minimum values and one middle value. Strategy III: two middle and four maximum values. In the elderly group, the distribution looked different. The first strategy contained one minimum value, three means, and two maximum values. Strategy II: four minimum values, one mean value, and one maximum value. Strategy III: one minimum value, two middle, and three maximum values.

3.3.3. Kinetic Parameters

Regarding kinetic parameters for the reactive limb (Figure 11), it is possible to note that extreme values were higher in young people in most cases. The most statistically significant differences were recorded for treadmill gait (all parameters), Strategy III (five parameters), and Strategy I and II (two parameters).
Non-significantly higher values of muscle torque in the elderly group were for hip extension (Strategy I), dorsiflexors, and knee extensors (Strategy II). Significantly higher values of muscle torque were recorded only for treadmill gait for knee extensors. It is important to note that in Strategy III, all the torque values were lower in the elderly group.
Table 5 is the last one, which contains the differences between the extreme values recorded for each strategy and treadmill gait. The differences relate to the values recorded for joint torques and look as follows. The first strategy included four minimal values, one mean, and one maximum value. Strategy II: one minimum, two middle, and two maximal values. Strategy III: one minimum, three means, and two maximum values. In the elderly group, the distribution looked different. The first strategy contained four middle and two maximum values. Strategy II comprised two mean and four maximum values. The third strategy had extreme values most similar to those recorded for treadmill gait without perturbation (six minimum values).

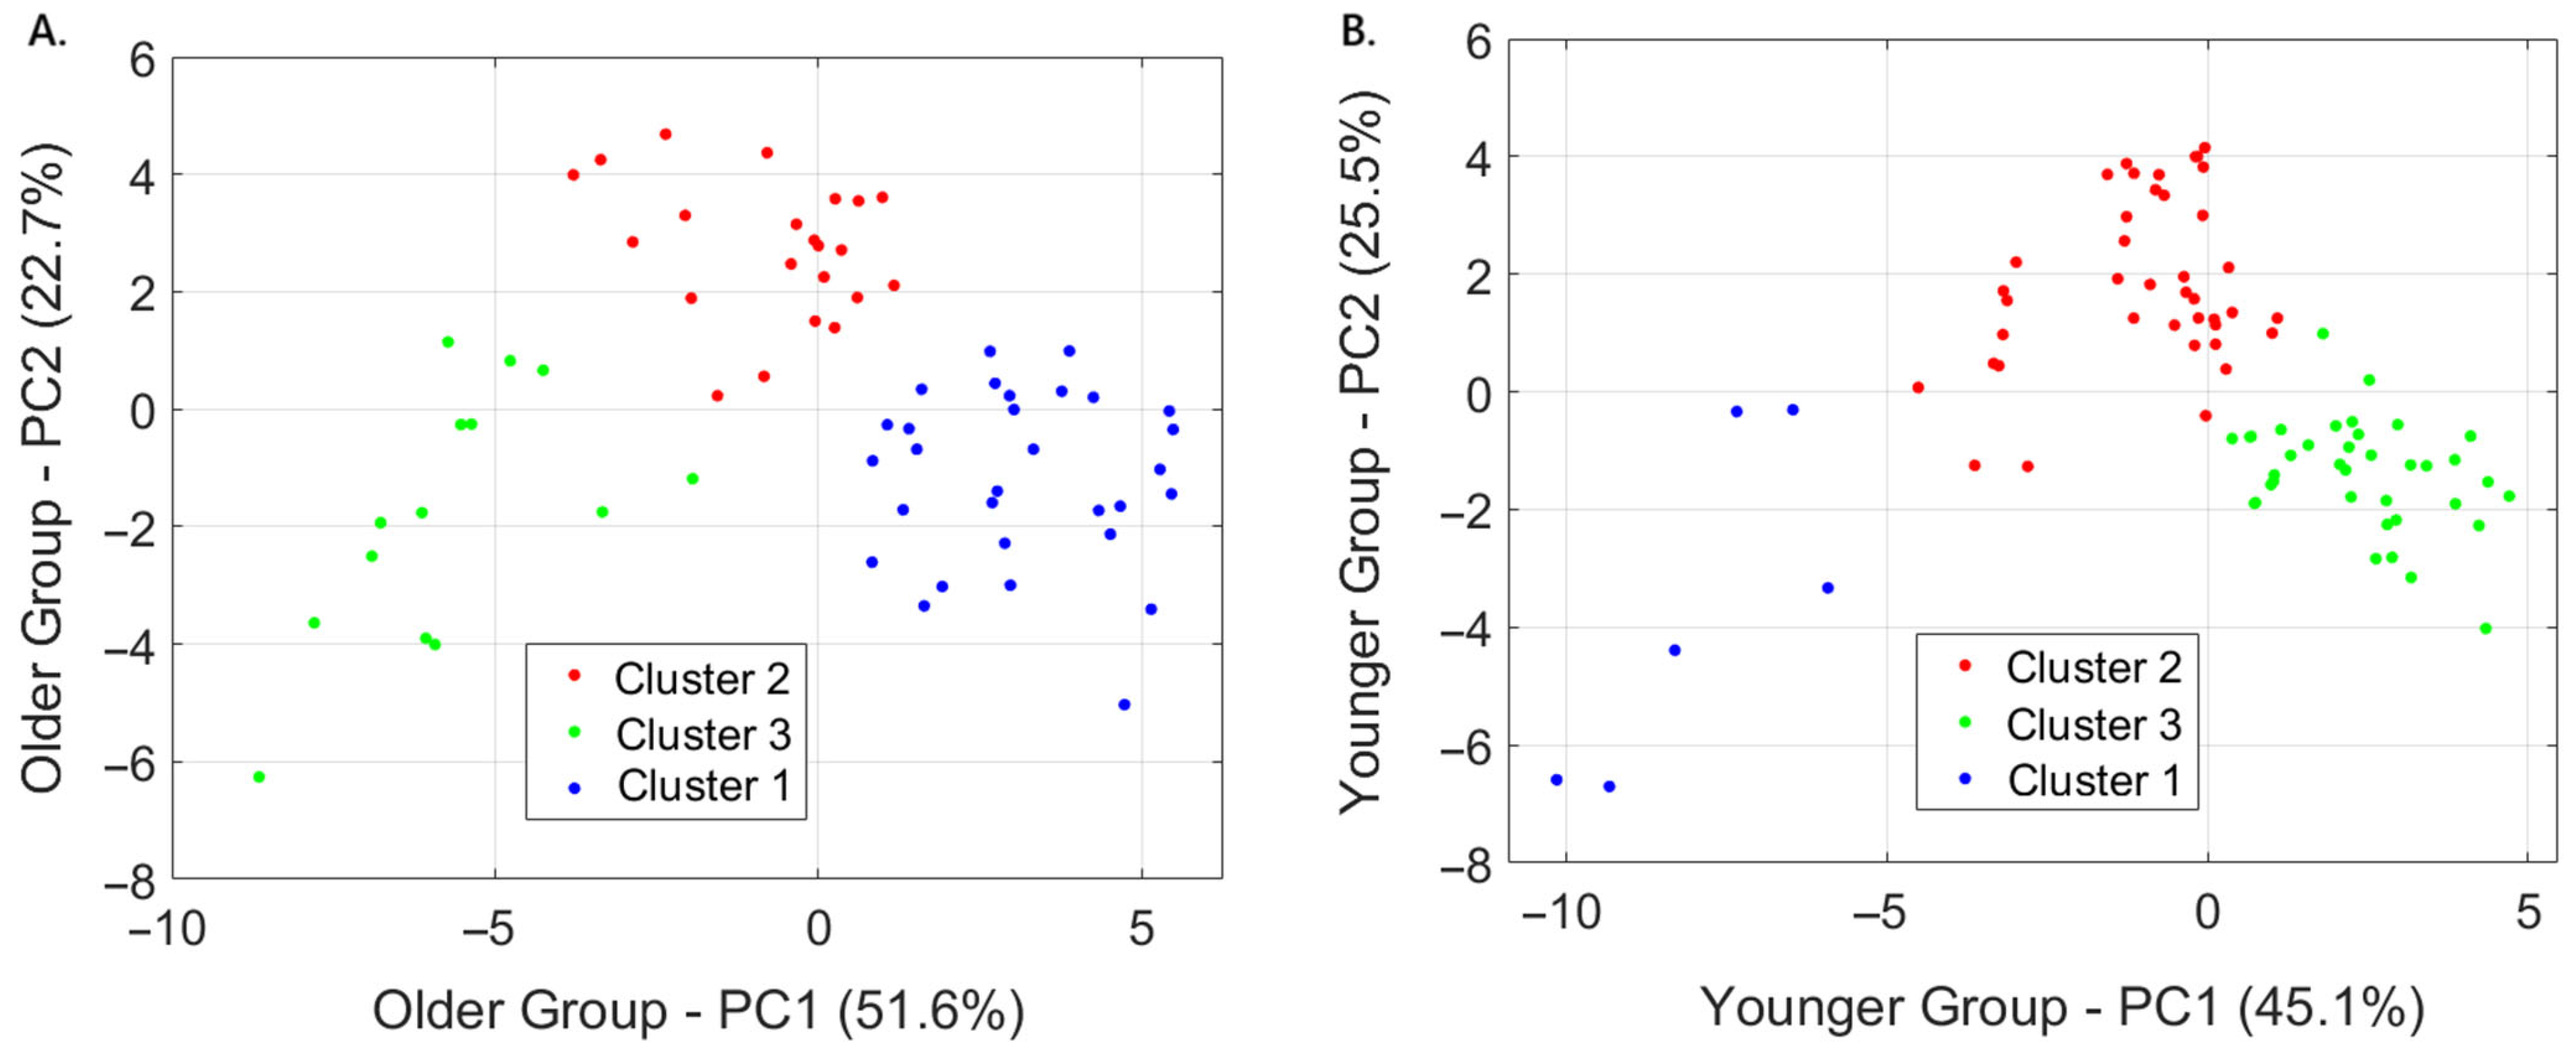
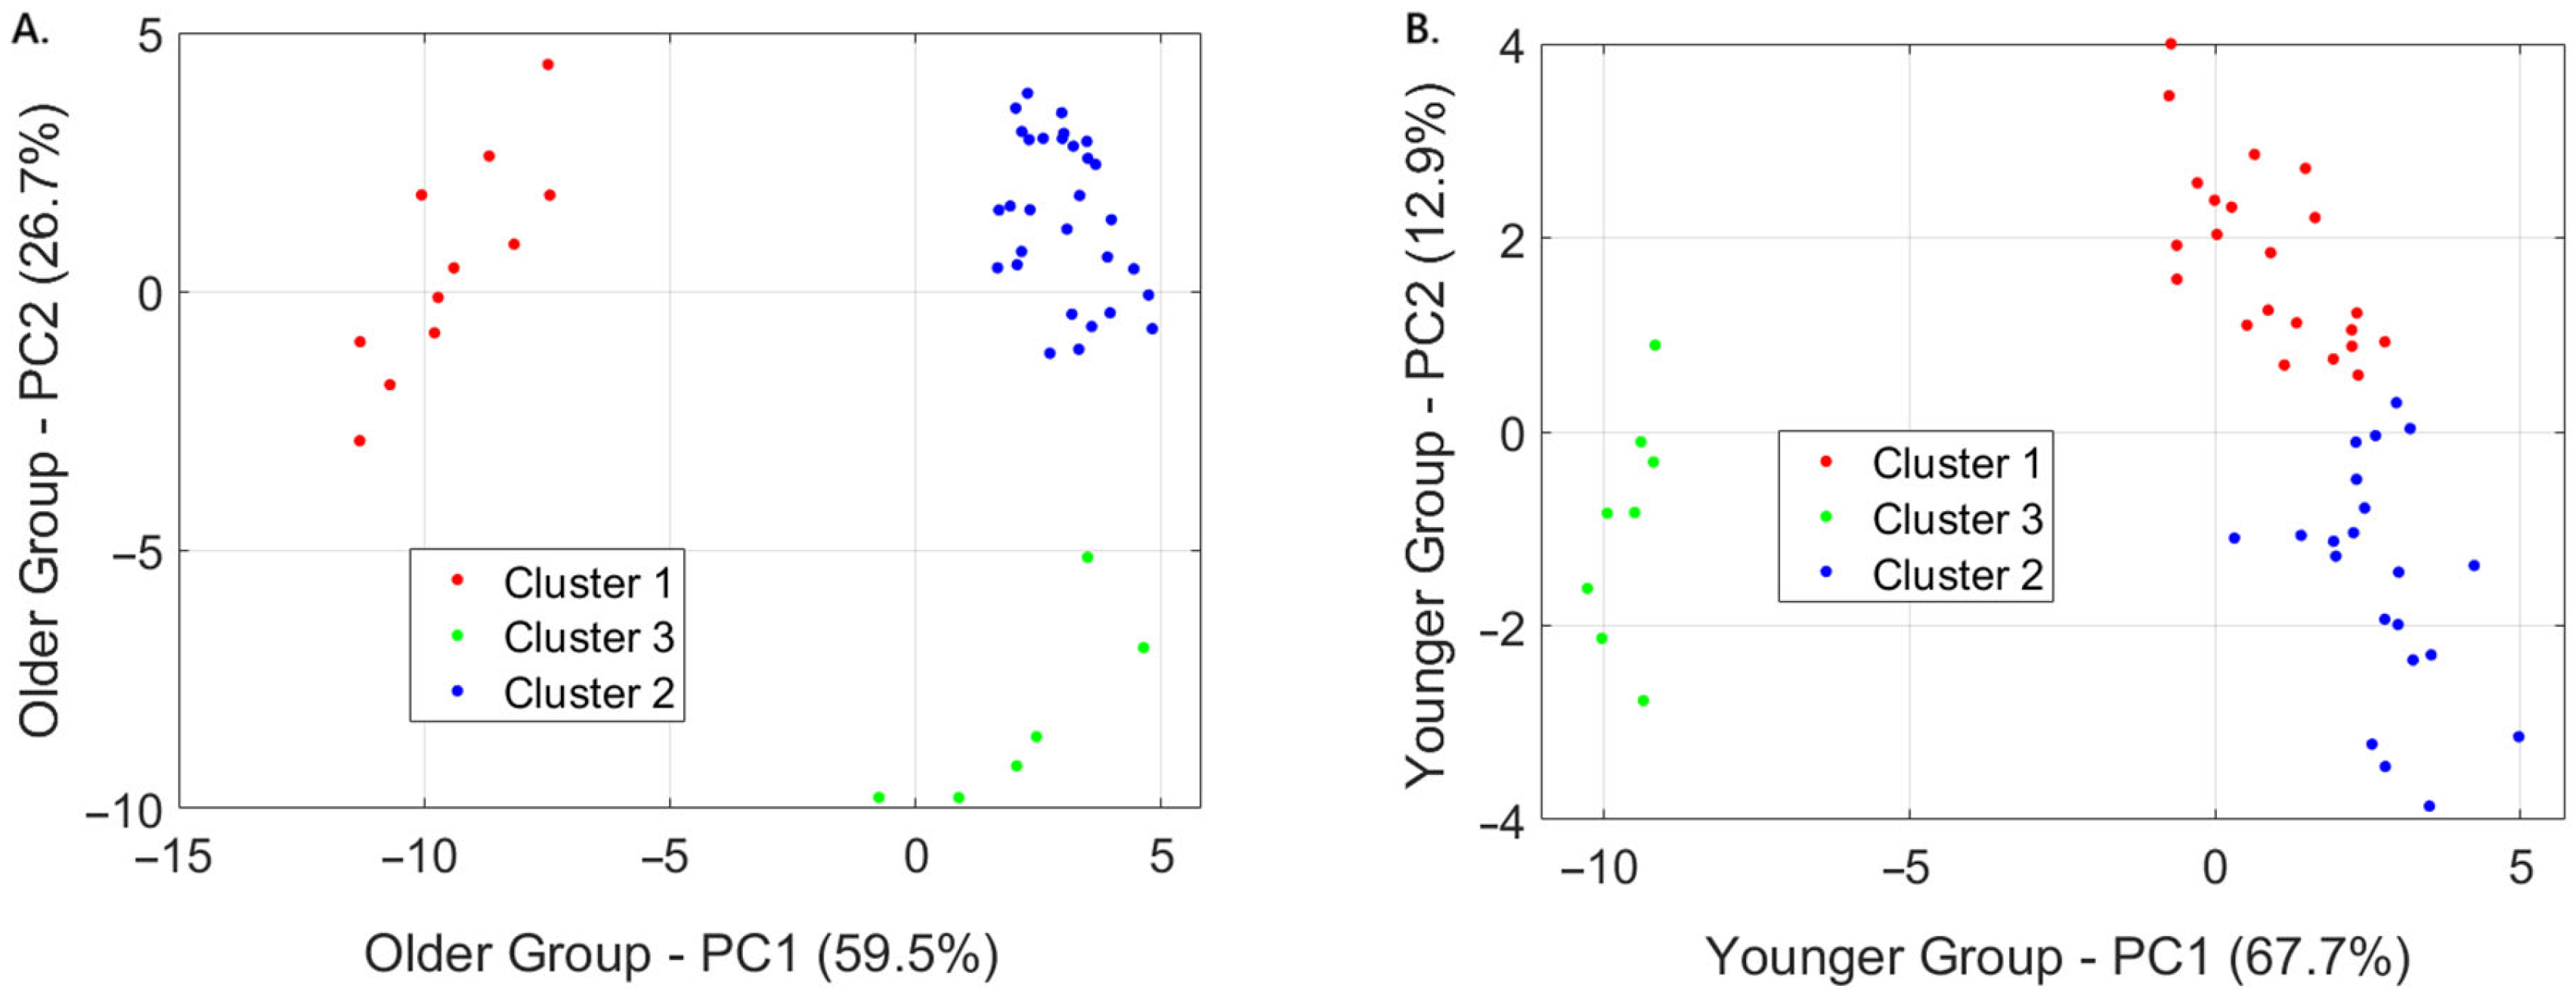
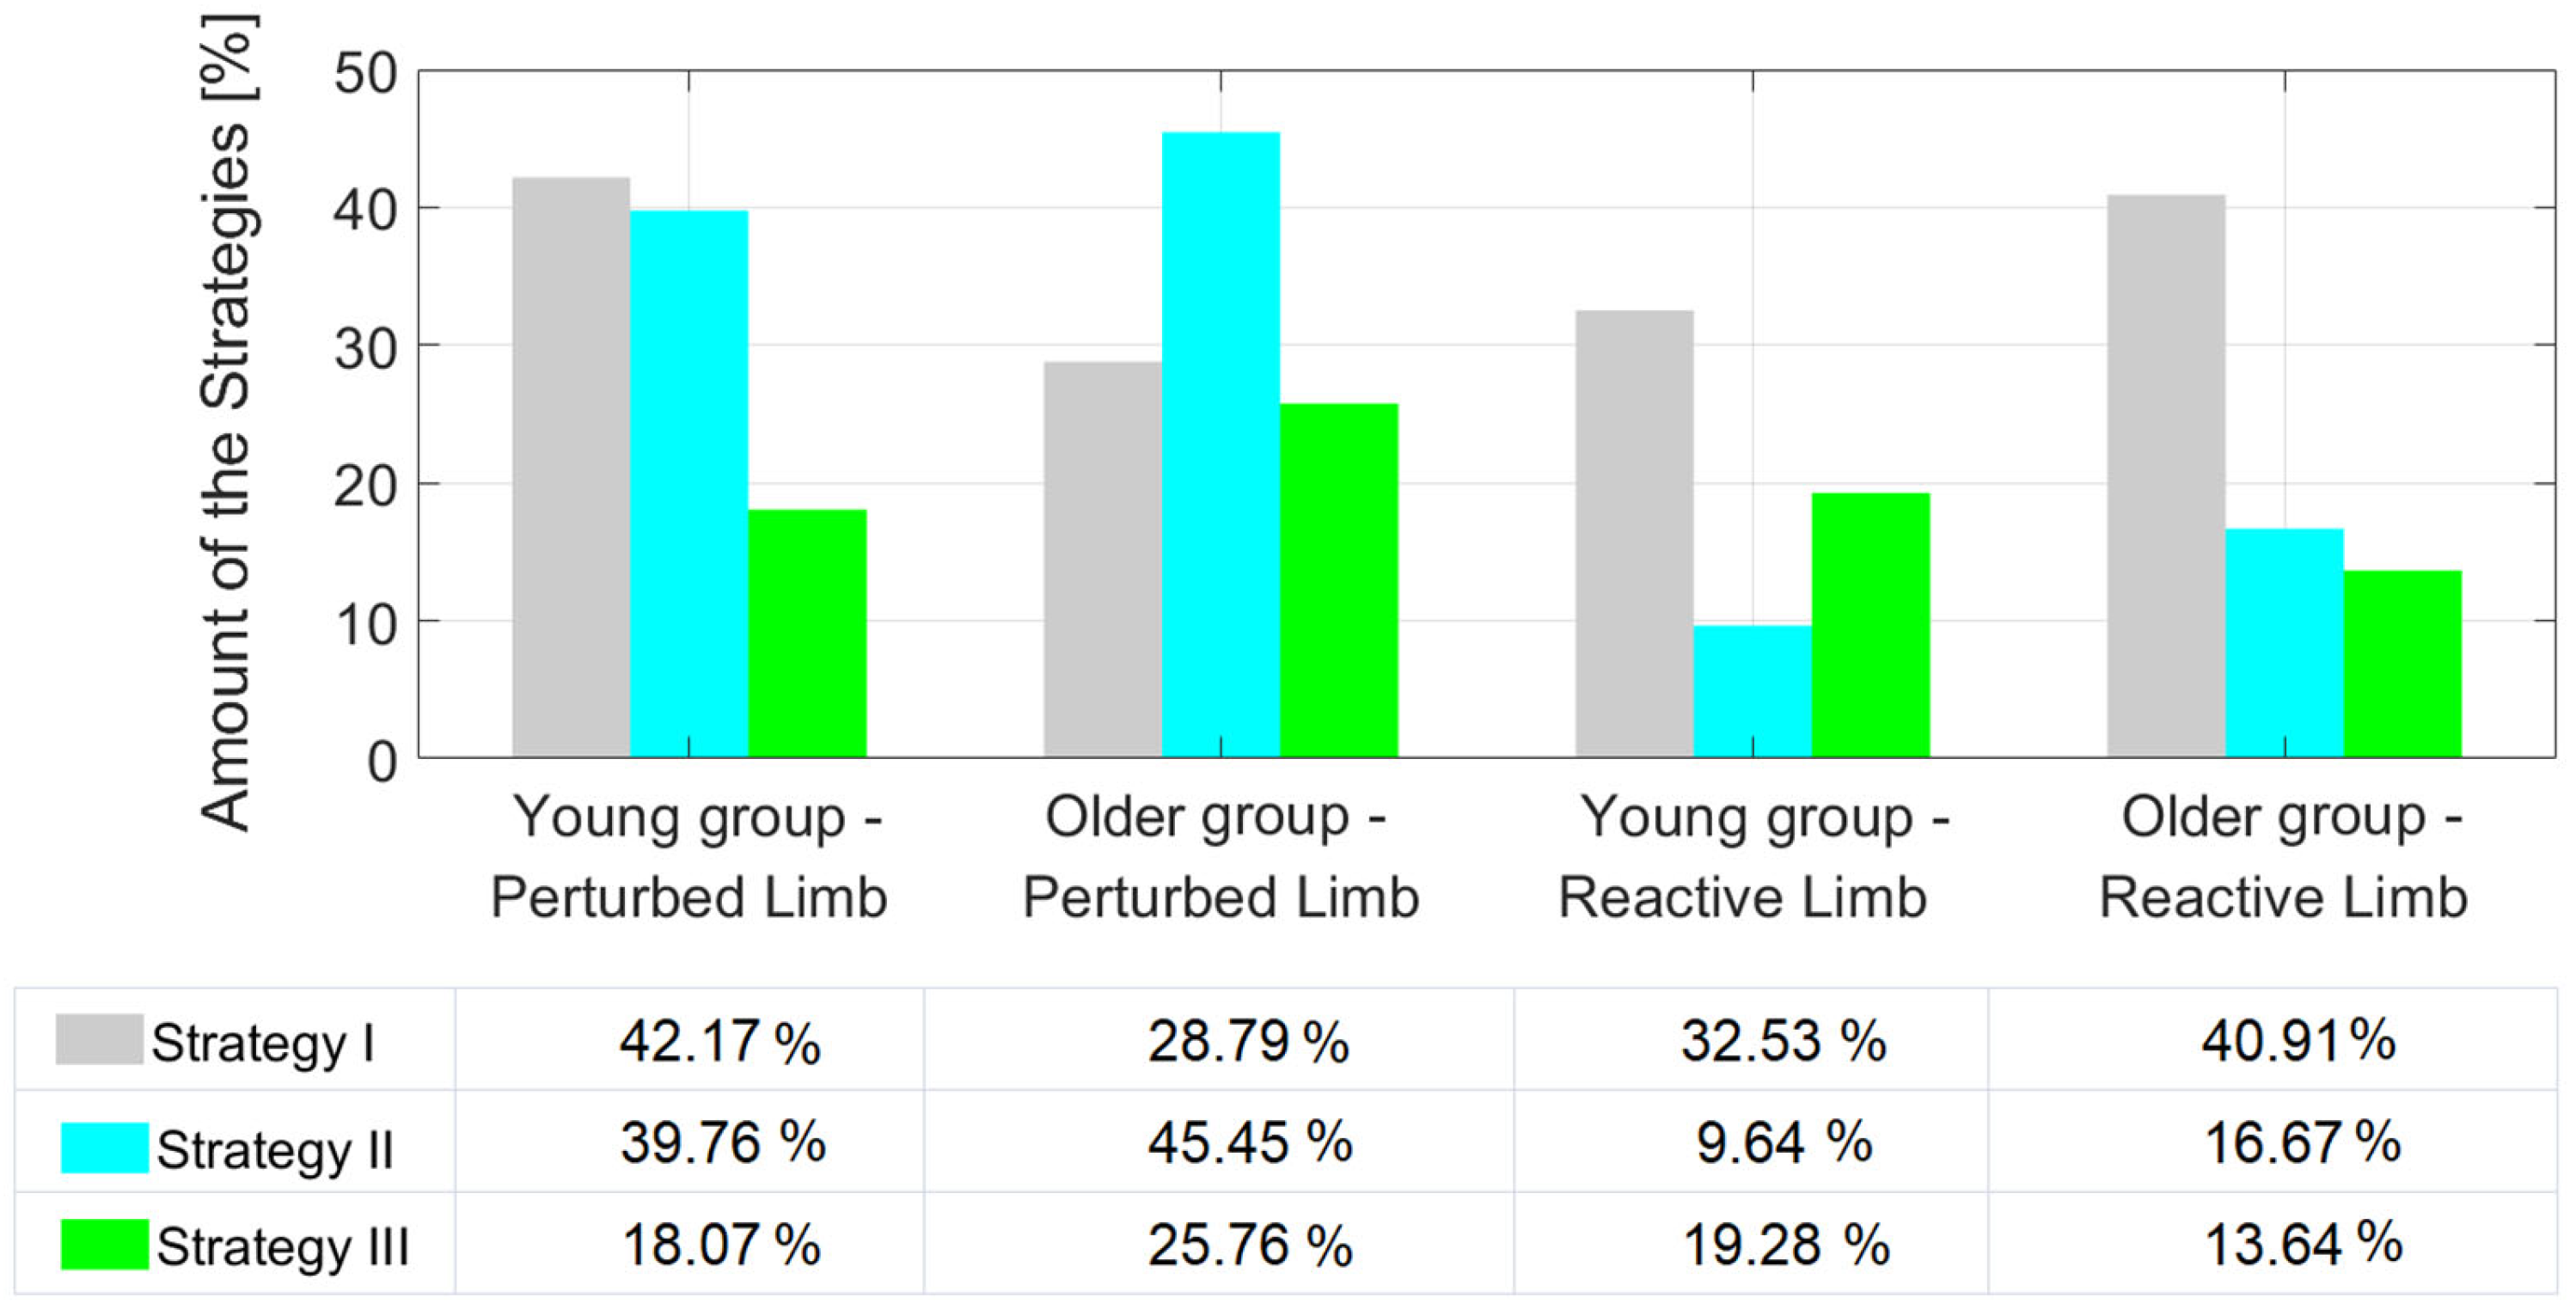
3.4. Amount of Strategies in Studied Groups

Figure 12 specifies the number of strategies adopted in the young and elderly groups according to whether they involved perturbed or reactive limbs. For a perturbed limb, Strategy I was the most common (42.17%) in the group of young people. In contrast, among seniors, it was Strategy II (45.45%).
Strategy I was the most common for the reactive limb in both groups, with 32.53% (young people) and 40.91% (older people), respectively. It is worth noting that Strategy III is used the least frequently (18.07% and 25.76%) in the case of a perturbed limb in both groups. For the reactive limbs in the elderly group, this trend is well maintained. The group of young people for the reactive extremity deviates from the described pattern, as Strategy II is adopted least often (9.64%).

4. Discussion

Berg et al. [33] reported that most falls are caused by trips or slips, and older adults are at greater risk of falling than young adults. Both tripping (fall direction–forward) and slipping (fall direction–backward) lead to disruption of the gait pattern [34]. When a person trips, their foot unexpectedly encounters an obstacle or uneven surface, often resulting in a sudden change in the foot alignment. Slipping happens when the friction between the foot and the walking surface is insufficient, causing the foot to slide [35]. Individuals often make rapid changes in their kinematics and kinetics to recover from trips or slips [35,36,37]. It involves a broad range of compensatory and protective movements. Some common strategies include: stiffening the muscles and joints to maintain stability and minimize movement upon impact, exaggerated stepping or arm movements, extending the arms or legs in an attempt to reach out and grab onto something for support or cushion the fall, or relaxing the body to reduce the risk of injury by allowing the body to absorb the impact more smoothly [1,38].
Several methods have been employed in previous studies to evoke tripping-like responses during gait, including treadmill belt acceleration [39,40,41,42], ankle rope pull (break and release) [43], and dropping an obstacle on the belt [44]. Although treadmill belt acceleration does not incorporate a physical obstacle, it simulates the overall forward rotation of the trunk and stepping [41,45]. It is crucial to understand how treadmill belt acceleration affects gait parameters to assess how overloaded the body is during perturbation recovery.
There are few studies in which perturbations are induced during the Pre-Swing phase. For instance, Lee et al. [46] examined both types of anterior-posterior perturbations—belt acceleration and deceleration–during this critical phase. In contrast, Chodkowska et al. [6] focused exclusively on belt deceleration perturbations during the Pre-Swing phase. Similarly, perturbations during this phase were also studied by Ciunelis et al. [47] and Błażkiewicz and Hadamus [28], who extended their analysis to include responses during the Initial Contact and Midstance phases as well.
The present study aimed to analyze the effects of external perturbations involving the acceleration of the left treadmill belt during the Pre-Swing phase on gait kinematics and kinetics in both young and older adults. The left belt was deliberately chosen for perturbation, as all participants were left-leg non-dominant, and targeting the non-dominant side was considered a safer approach. Notably, a review by Ferreira et al. [48] highlighted that most studies have predominantly applied perturbations to the dominant (typically right) limb. Similarly, Chodkowska et al. [6] reported that the majority of previous research has perturbed the right limb. Therefore, the decision to perturb the non-dominant limb in the present study represents a distinctive and meaningful contribution to the existing literature.
The first part of the study showed statistically significant differences for all kinematic and kinetic parameters between the treadmill gait of young and elderly subjects, which aligns with other publications [49,50,51]. During treadmill gait, the older individuals had significantly lower plantarflexion values, but not significantly lower maximum values of dorsiflexion ankle angle compared to those recorded in the young group. The older participants maintained significantly higher knee flexion in the support phase. During the swing phase, the knee flexion was significantly lower than that recorded in the young, resulting in a much smaller range of motion in this group. At the hip joint, the elderly group demonstrated significantly lower flexion and higher extension values compared to those noted in the young group. It is worth mentioning that the extreme lower limb torque values in treadmill gait were significantly lower in the elderly group. Monaco et al. [51] explained that these differences arise because older adults approach locomotion more cautiously, tending to stiffen their movements. Some explanations for this behavior can be found in a decrease in joint receptor activity, a reduction in stimulus processing abilities, and a deterioration of musculoskeletal viscoelastic properties. Additionally, it should be noted that the differences observed between groups are partly due to the significantly lower treadmill speeds in the older individuals’ gait (1.2 m/s for young adults vs. 1.0 m/s for elderly participants).
Despite different treadmill speeds between groups, the general shapes of kinematic and kinetic response curves were similar, though with significantly different magnitudes. In both age groups, three distinct recovery strategies were identified for both the perturbed and reactive limbs, primarily differentiated by vertical ground reaction force (vGRF) profiles. These were clustered using PCA and k-means methods, offering a novel classification approach not previously detailed in the literature.
Statistical differences in parameter values and strategy frequency supported this categorization. Younger participants predominantly used Strategies I and II, whereas older adults favored Strategy II, possibly due to reduced proprioception or muscle power. Strategy I, more frequent in the young group, was characterized by joint angles and torques resembling unperturbed gait, indicating a more efficient and controlled recovery. In contrast, older adults relied less on this strategy, which may reflect age-related neuromuscular limitations. These findings provide insight into age-specific adaptations to perturbations and underline the need for individualized balance training interventions.
In the elderly group, Strategy II was most frequently adopted, a surprising finding given that the extreme kinematic values were generally higher than in young subjects. However, Strategy II allowed moderate deviations from unperturbed gait, particularly for ankle dorsiflexion/plantarflexion, knee flexion, and hip extension torques, suggesting that older adults opt for responses that avoid functioning under extreme biomechanical conditions.
For the reactive limb, Strategy I was most common in both groups (young: 33%; elderly: 41%). The young group then selected Strategy III (19%) and Strategy II (10%), while the elderly group showed a reversed order for Strategies II and III (16.67% and 14%, respectively). Among young participants, Strategy II appeared more favorable for kinematic parameters, even though Strategy I was more frequently chosen. In older adults, Strategy II again seemed preferable for kinematics, but Strategy III showed the least deviation from unperturbed gait for kinetic parameters, making Strategy I still the most favorable globally for this group.
Overall, these results emphasize that while younger and older adults show similar patterns of strategic response to perturbations, the specific biomechanical adjustments differ significantly, likely reflecting age-related changes in neuromuscular control and mechanical efficiency.
Analyzing the available literature on this topic, it is noteworthy that most authors have focused on the impact of gait perturbations primarily in the context of maintaining stability. This focus has led to the quantification of an individual’s ability to control the center of mass (CoM) relative to the base of support (BoS), using measures such as stabilizing and destabilizing forces, feasible stability regions, and margins of stability (MoS) [45,52,53]. While some studies have examined changes in spatiotemporal parameters [53,54], their approaches vary depending on the type and timing of the applied perturbation. In contrast, this study provides novel insights through a comprehensive analysis of vertical ground reaction force patterns and their corresponding kinematic and kinetic adaptations, assessed separately for both the perturbed and reactive limbs.
These findings have important clinical implications, particularly for fall prevention and rehabilitation in older adults. By identifying distinct compensatory strategies in response to perturbations and revealing age-related differences in joint loading and movement patterns, this study underscores the need for targeted, population-specific interventions. Training programs could be developed to improve neuromuscular control and promote more stable and adaptive gait responses in older individuals. For example, incorporating perturbation-based balance training into rehabilitation routines may help elderly individuals adopt more efficient strategies, thereby reducing fall risk. Moreover, the strategy classification approach proposed here may be used as a tool to monitor therapeutic progress or assess fall risk in clinical settings. Personalized rehabilitation plans could then be formulated based on individual biomechanical deficits, enhancing the precision and effectiveness of intervention strategies.
This study has some limitations. First, only women were included. Given that older women experience more severe fall consequences than men, this is important clinically; however, including men in future studies would be valuable. Secondly, gait and perturbation parameters differed between groups because the natural comfort speed for each participant was used to maintain a natural gait pattern. Thirdly, strategies were analyzed separately for the perturbed and reactive limbs. Future research should consider analyzing these strategies together, possibly including trunk and upper limb movements to gain a more complete understanding of global motor strategies for fall avoidance. Finally, the last limitation of this study is that only one type of perturbation was examined and analyzed, which limits the ability to compare the results with other studies. Therefore, it is necessary to investigate different types of perturbations to broaden the understanding of this topic.

5. Conclusions

This study identified three distinct compensatory strategies in response to Pre-Swing gait perturbations and revealed clear, age-dependent differences in joint kinematics, torques, and ground reaction forces between young and older women. Younger participants predominantly employed Strategies I and II, with Strategy I closely resembling unperturbed gait. This suggests efficient neuromuscular adaptation and an enhanced ability to minimize joint loading. In contrast, older women most often adopted Strategy II, reflecting compensatory responses aligned with their functional limitations rather than those minimizing biomechanical stress. These findings confirm that perturbation responses vary systematically with age and underscore the need for individualized balance training and fall-prevention programs tailored to specific biomechanical profiles.

Author Contributions

Conceptualization, K.C. and M.B.; methodology, K.C. and M.B.; software, K.C. and M.B.; validation, K.C. and M.B.; formal analysis, K.C. and M.B.; investigation, K.C. and M.B.; resources, K.C. and M.B.; data curation, M.B.; writing—original draft preparation, K.C. and M.B.; writing—review and editing, K.C., M.B., A.M. and J.W.; visualization, M.B. and K.C.; supervision, M.B. and J.W.; project administration, M.B.; funding acquisition, M.B. and J.W. All authors have read and agreed to the published version of the manuscript.

Funding

This research was funded by the Józef Piłsudski University of Physical Education in Warsaw, grant number UPB no. 2 (114/12/PRO/2023). Gait Real-time Analysis Interactive Lab (GRAIL, Motek Medical B.V., Amsterdam, The Netherlands) was purchased under the project “Adaptation and equipment of innovative laboratories for diagnostic and therapeutic tests of the musculoskeletal system” co-financed by the European Union under the Operational Program Development of Eastern Poland 2007–2013. Apparatus maintained under a subjective subsidy from the Ministry of Education and Science under decision 41/529869/SPUB/SP/2022.

Institutional Review Board Statement

The study was conducted in accordance with the Declaration of Helsinki, and approved by the Institutional Review Board of Józef Piłsudski University of Physical Education in Warsaw, Poland (protocol code SKE01-15/2023 and date of approval 24 March 2023).

Informed Consent Statement

Informed consent was obtained from all subjects involved in the study.

Data Availability Statement

The data presented in this study are available on request from the corresponding author. The data are not publicly available due to ongoing data collection and further research being conducted on this topic.

Acknowledgments

We would like to thank Karol Kowieski for his help in data collection.

Conflicts of Interest

The authors declare no conflicts of interest.

References

  1. Borkowski, R.; Błażkiewicz, M. Postural reactions to external mediolateral perturbations: A review. Appl. Sci. 2023, 13, 1696. [Google Scholar] [CrossRef]
  2. Hadamus, A.; Gulatowska, M.; Ferenc, A.; Shahnazaryan, K.; Brzuszkiewicz-Kuźmicka, G.; Błażkiewicz, M. Influence of leg dominance on the symmetry in body balance measurements. Phys. Act. Rev. 2025, 13, 88–96. [Google Scholar] [CrossRef]
  3. Rogers, M.W.; Mille, M.-L. Chapter 5—Balance perturbations. In Handbook of Clinical Neurology; Day, B.L., Lord, S.R., Eds.; Elsevier: Amsterdam, The Netherlands, 2018; Volume 159, pp. 85–105. [Google Scholar]
  4. Amboni, M.; Barone, P.; Hausdorff, J.M. Cognitive contributions to gait and falls: Evidence and implications. Mov. Disord. 2013, 28, 1520–1533. [Google Scholar] [CrossRef] [PubMed]
  5. Taylor, Z.; Walsh, G.S.; Hawkins, H.; Inacio, M.; Esser, P. Perturbations during Gait: A Systematic Review of Methodologies and Outcomes. Sensors 2022, 22, 5927. [Google Scholar] [CrossRef]
  6. Chodkowska, K.; Borkowski, R.; Błażkiewicz, M. Perturbations During Gait on a Split-Belt Treadmill: A Scoping Review. Appl. Sci. 2024, 14, 9852. [Google Scholar] [CrossRef]
  7. Sakthivadivel, V.; Geetha, J.; Gaur, A.; Kaliappan, A. Performance-Oriented Mobility Assessment test and Timed Up and Go test as predictors of falls in the elderly—A cross-sectional study. J. Fam. Med. Prim. Care 2022, 11, 7294–7298. [Google Scholar] [CrossRef]
  8. Talbot, L.A.; Musiol, R.J.; Witham, E.K.; Metter, E.J. Falls in young, middle-aged and older community dwelling adults: Perceived cause, environmental factors and injury. BMC Public Health 2005, 5, 86. [Google Scholar] [CrossRef]
  9. Rice, P.E.; Needle, A.R.; Leicht, Z.S.; Zwetsloot, K.A.; McBride, J.M. Bone health, muscle properties and stretch-shortening cycle function of young and elderly males. J. Musculoskelet. Neuronal Interact. 2019, 19, 389–395. [Google Scholar]
  10. Xing, L.; Bao, Y.; Wang, B.; Shi, M.; Wei, Y.; Huang, X.; Dai, Y.; Shi, H.; Gai, X.; Luo, Q.; et al. Falls caused by balance disorders in the elderly with multiple systems involved: Pathogenic mechanisms and treatment strategies. Front. Neurol. 2023, 14, 1128092. [Google Scholar] [CrossRef]
  11. Rasooli, A.; Adab, H.Z.; Van Ruitenbeek, P.; Weerasekera, A.; Chalavi, S.; Cuypers, K.; Levin, O.; Dhollander, T.; Peeters, R.; Sunaert, S.; et al. White matter and neurochemical mechanisms underlying age-related differences in motor processing speed. iScience 2023, 26, 106794. [Google Scholar] [CrossRef]
  12. Bednarczuk, G. Changes in balance and fall risk in female members of the Third Age University aged 60 and older. Adv. Rehabil. 2020, 34, 15–21. [Google Scholar] [CrossRef]
  13. Bobowik, P.; Wiszomirska, I. Diagnostic dependence of muscle strength measurements and the risk of falls in the elderly. International journal of rehabilitation research. Internationale Zeitschrift fur Rehabilitationsforschung. Int. J. Rehabil. Res. 2020, 43, 330–336. [Google Scholar] [CrossRef] [PubMed]
  14. Hortobágyi, T.; Rider, P.; Gruber, A.H.; DeVita, P. Age and muscle strength mediate the age-related biomechanical plasticity of gait. Eur. J. Appl. Physiol. 2016, 116, 805–814. [Google Scholar] [CrossRef] [PubMed]
  15. Franz, J.R. The Age-Associated Reduction in Propulsive Power Generation in Walking. Exerc. Sport Sci. Rev. 2016, 44, 129–136. [Google Scholar] [CrossRef]
  16. Ahsan, M.; Feroz, M.A.; Alzahrani, A. Impact of a pre-competition aerobic and anaerobic training on the maximal aerobic capacity, anaerobic power, dynamic balance, and visual-motor coordination of rugby and soccer players. Phys. Act. Rev. 2023, 11, 99–111. [Google Scholar] [CrossRef]
  17. Tideiksaar, R. Reducing the risk of falls and injury in older persons: Contribution of a falls and immobility clinic. L’Année Gérontologique (Ed. Française) 1996, 60, 163–182. [Google Scholar]
  18. Larsen, E.R.; Mosekilde, L.; Foldspang, A. Correlates of falling during 24 h among elderly Danish community residents. Prev. Med. 2004, 39, 389–398. [Google Scholar] [CrossRef]
  19. Campbell, A.J.; Borrie, M.J.; Spears, G.F.; Jackson, S.L.; Brown, J.S.; Fitzgerald, J.L. Circumstances and consequences of falls experienced by a community population 70 years and over during a prospective study. Age Ageing 1990, 19, 136–141. [Google Scholar] [CrossRef]
  20. Lee, M.; Lee, S.-J.; Robinson, S. How did the COVID-19 pandemic impact the relationship between residential environments and older rural adults’ physical activity levels? Phys. Act. Rev. 2025, 13, 48–61. [Google Scholar] [CrossRef]
  21. Çelikhisar, H.; Demir, F. The relationship between physical activity and oxidative stress biomarkers in older adults. Phys. Act. Rev. 2023, 11, 34–41. [Google Scholar] [CrossRef]
  22. Winter, D.A. Human balance and posture control during standing and walking. Gait Posture 1995, 3, 193–214. [Google Scholar] [CrossRef]
  23. Ren, X.; Lutter, C.; Kebbach, M.; Bruhn, S.; Bader, R.; Tischer, T. Lower extremity joint compensatory effects during the first recovery step following slipping and stumbling perturbations in young and older subjects. BMC Geriatr. 2022, 22, 656. [Google Scholar] [CrossRef] [PubMed]
  24. Ren, X.; Lutter, C.; Kebbach, M.; Bruhn, S.; Yang, Q.; Bader, R.; Tischer, T. Compensatory Responses During Slip-Induced Perturbation in Patients with Knee Osteoarthritis Compared with Healthy Older Adults: An Increased Risk of Falls? Front. Bioeng. Biotechnol. 2022, 10, 893840. [Google Scholar] [CrossRef] [PubMed]
  25. Promsri, A.; Longo, A.; Haid, T.; Doix, A.M.; Federolf, P. Leg Dominance as a Risk Factor for Lower-Limb Injuries in Downhill Skiers-A Pilot Study into Possible Mechanisms. Int. J. Environ. Res. Public Health 2019, 16, 3399. [Google Scholar] [CrossRef]
  26. Zeni, J.A.; Richards, J.G.; Higginson, J.S. Two simple methods for determining gait events during treadmill and overground walking using kinematic data. Gait Posture 2008, 27, 710–714. [Google Scholar] [CrossRef]
  27. Sloot, L.H.; van den Noort, J.C.; van der Krogt, M.M.; Bruijn, S.M.; Harlaar, J. Can Treadmill Perturbations Evoke Stretch Reflexes in the Calf Muscles? PLoS ONE 2015, 10, e0144815. [Google Scholar] [CrossRef]
  28. Błażkiewicz, M.; Hadamus, A. Influence of Perturbation’s Type and Location on Treadmill Gait Regularity. Appl. Sci. 2024, 14, 493. [Google Scholar] [CrossRef]
  29. Feldhege, F.; Richter, K.; Bruhn, S.; Fischer, D.C.; Mittlmeier, T. MATLAB-based tools for automated processing of motion tracking data provided by the GRAIL. Gait Posture 2021, 90, 422–426. [Google Scholar] [CrossRef]
  30. Pataky, T.C. Generalized n-dimensional biomechanical field analysis using statistical parametric mapping. J. Biomech. 2010, 43, 1976–1982. [Google Scholar] [CrossRef]
  31. Adler, R.J.; Taylor, J.E. Random Fields and Geometry; Springer: Berlin/Heidelberg, Germany, 2007; Volume 80. [Google Scholar]
  32. Rosnow, R.L. Effect sizes for experimenting psychologists. Can. J. Exp. Psychol.=Rev. Can. Psychol. Exp. 2003, 57, 221–237. [Google Scholar] [CrossRef]
  33. Berg, W.P.; Alessio, H.M.; Mills, E.M.; Tong, C. Circumstances and consequences of falls in independent community-dwelling older adults. Age Ageing 1997, 26, 261–268. [Google Scholar] [CrossRef] [PubMed]
  34. Lurie, J.D.; Zagaria, A.B.; Ellis, L.; Pidgeon, D.; Gill-Body, K.M.; Burke, C.; Armbrust, K.; Cass, S.; Spratt, K.F.; McDonough, C.M. Surface Perturbation Training to Prevent Falls in Older Adults: A Highly Pragmatic, Randomized Controlled Trial. Phys. Ther. 2020, 100, 1153–1162. [Google Scholar] [CrossRef] [PubMed]
  35. Chang, W.R.; Leclercq, S.; Lockhart, T.E.; Haslam, R. State of science: Occupational slips, trips and falls on the same level. Ergonomics 2016, 59, 861–883. [Google Scholar] [CrossRef] [PubMed]
  36. Grabiner, M.D.; Donovan, S.; Bareither, M.L.; Marone, J.R.; Hamstra-Wright, K.; Gatts, S.; Troy, K.L. Trunk kinematics and fall risk of older adults: Translating biomechanical results to the clinic. J. Electromyogr. Kinesiol. 2008, 18, 197–204. [Google Scholar] [CrossRef]
  37. Allum, J.H.; Carpenter, M.G.; Honegger, F.; Adkin, A.L.; Bloem, B.R. Age-dependent variations in the directional sensitivity of balance corrections and compensatory arm movements in man. J. Physiol. 2002, 542, 643–663. [Google Scholar] [CrossRef]
  38. El-Din Mahmoud, L.S.; Aly, S.M.; Shafeek, M.M.; Battesha, H.H.M. Effect of CoDuSe and step square exercises on risk of fall in multiple sclerosis: A randomized controlled trial. Phys. Act. Rev. 2022, 10, 2022. [Google Scholar] [CrossRef]
  39. McCrum, C.; Karamanidis, K.; Willems, P.; Zijlstra, W.; Meijer, K. Retention, savings and interlimb transfer of reactive gait adaptations in humans following unexpected perturbations. Commun. Biol. 2018, 1, 230. [Google Scholar] [CrossRef]
  40. Song, P.Y.H.; Sturnieks, D.L.; Davis, M.K.; Lord, S.R.; Okubo, Y. Perturbation-Based Balance Training Using Repeated Trips on a Walkway vs. Belt Accelerations on a Treadmill: A Cross-Over Randomised Controlled Trial in Community-Dwelling Older Adults. Front. Sports Act. Living 2021, 3, 702320. [Google Scholar] [CrossRef]
  41. Sessoms, P.H.; Wyatt, M.; Grabiner, M.; Collins, J.D.; Kingsbury, T.; Thesing, N.; Kaufman, K. Method for evoking a trip-like response using a treadmill-based perturbation during locomotion. J. Biomech. 2014, 47, 277–280. [Google Scholar] [CrossRef]
  42. McCrum, C.; Gerards, M.H.G.; Karamanidis, K.; Zijlstra, W.; Meijer, K. A systematic review of gait perturbation paradigms for improving reactive stepping responses and falls risk among healthy older adults. Eur. Rev. Aging Phys. Act. 2017, 14, 3. [Google Scholar] [CrossRef]
  43. Epro, G.; McCrum, C.; Mierau, A.; Leyendecker, M.; Brüggemann, G.P.; Karamanidis, K. Effects of triceps surae muscle strength and tendon stiffness on the reactive dynamic stability and adaptability of older female adults during perturbed walking. J. Appl. Physiol. 2018, 124, 1541–1549. [Google Scholar] [CrossRef] [PubMed]
  44. King, S.T.; Eveld, M.E.; Martínez, A.; Zelik, K.E.; Goldfarb, M. A novel system for introducing precisely-controlled, unanticipated gait perturbations for the study of stumble recovery. J. Neuroeng. Rehabil. 2019, 16, 69. [Google Scholar] [CrossRef] [PubMed]
  45. Roeles, S.; Rowe, P.J.; Bruijn, S.M.; Childs, C.R.; Tarfali, G.D.; Steenbrink, F.; Pijnappels, M. Gait stability in response to platform, belt, and sensory perturbations in young and older adults. Med. Biol. Eng. Comput. 2018, 56, 2325–2335. [Google Scholar] [CrossRef] [PubMed]
  46. Lee, B.C.; Kim, C.S.; Seo, K.H. The Body’s Compensatory Responses to Unpredictable Trip and Slip Perturbations Induced by a Programmable Split-Belt Treadmill. IEEE Trans. Neural Syst. Rehabil. Eng. 2019, 27, 1389–1396. [Google Scholar] [CrossRef]
  47. Ciunelis, K.; Borkowski, R.; Błażkiewicz, M. The Impact of Induced Acceleration Perturbations in Selected Phases of the Gait Cycle on Kinematic and Kinetic Parameters. Appl. Sci. 2024, 14, 4849. [Google Scholar] [CrossRef]
  48. Ferreira, R.N.; Ribeiro, N.F.; Figueiredo, J.; Santos, C.P. Provoking Artificial Slips and Trips towards Perturbation-Based Balance Training: A Narrative Review. Sensors 2022, 22, 9254. [Google Scholar] [CrossRef]
  49. Downey, R.J.; Richer, N.; Gupta, R.; Liu, C.; Pliner, E.M.; Roy, A.; Hwang, J.; Clark, D.J.; Hass, C.J.; Manini, T.M.; et al. Uneven terrain treadmill walking in younger and older adults. PLoS ONE 2022, 17, e0278646. [Google Scholar] [CrossRef]
  50. Schmitt, A.C.; Baudendistel, S.T.; Lipat, A.L.; White, T.A.; Raffegeau, T.E.; Hass, C.J. Walking indoors, outdoors, and on a treadmill: Gait differences in healthy young and older adults. Gait Posture 2021, 90, 468–474. [Google Scholar] [CrossRef]
  51. Monaco, V.; Macrì, G.; Dario, P.; Micera, S. Kinematics and kinetics analysis of gait on treadmill: A comparison between the performance of young and elderly people. Gait Posture 2006, 24, S1–S2. [Google Scholar] [CrossRef]
  52. Golyski, P.R.; Vazquez, E.; Leestma, J.K.; Sawicki, G.S. Onset timing of treadmill belt perturbations influences stability during walking. J. Biomech. 2022, 130, 110800. [Google Scholar] [CrossRef]
  53. Madehkhaksar, F.; Klenk, J.; Sczuka, K.; Gordt, K.; Melzer, I.; Schwenk, M. The effects of unexpected mechanical perturbations during treadmill walking on spatiotemporal gait parameters, and the dynamic stability measures by which to quantify postural response. PLoS ONE 2018, 13, e0195902. [Google Scholar] [CrossRef] [PubMed]
  54. Onushko, T.; Boerger, T.; Van Dehy, J.; Schmit, B.D. Dynamic stability and stepping strategies of young healthy adults walking on an oscillating treadmill. PLoS ONE 2019, 14, e0212207. [Google Scholar] [CrossRef] [PubMed]
Figure 1. (A) The front, side, and rear views of the marker configuration used in the Human Body Model are presented. The green markers indicate the anatomical reference points used to define the skeleton during the initialization process, as follows: XYPH—the xiphoid process of the sternum, LASIS and RASIS—the left and right anterior superior iliac spine, LPSIS and RPSIS—the left and right posterior superior iliac spine, LGTRO and RGTRO—the left and right greater trochanter, LLEK and RLEK—the left and right lateral epicondyles of the knee, LLM and RLM—the left and right lateral malleolus of the ankle, LMT5 and RMT5—the left and right fifth metatarsal, LTOE and RTOE—the tips of the left and right toes, LHEE and RHEE—the left and right heels. Additional markers, which are technical markers providing redundancy and robustness for the model, included the following: STRN—the jugular notch of the sternum, NAVE—the navel, T10—the 10th thoracic vertebra, SACR—located midway between the LPSIS and RPSIS points, FLTHI and FRTHI—the left and right lateral thigh (positioned halfway between the greater trochanter and the lateral knee epicondyle), LATI and RATI—the left and right lateral shank (placed halfway between the lateral knee epicondyle and the lateral malleolus); (B) Ceiling-mounted safety harnesses.
Applsci 15 06885 g001
Figure 2. Representative treadmill left belt speed profiles for Young and Old participants: (A) full trial duration, (B) isolated perturbation event.
Applsci 15 06885 g002
Figure 3. The means and standard deviations of (A) joint angles, (B) joint torques and (C) ground reaction forces of the gait cycle for young (pink) and elderly (blue) groups, PD–vertical component, AP–anterior-posterior component, ML–medial-lateral component. On the right axis, the SPM{t} statistic is shown as a function of the gait cycle with the critical threshold (t) values. The areas highlighted in gray show the ranges where statistically significant differences are present.
Applsci 15 06885 g003
Figure 4. Clustering of vertical ground reaction force patterns for perturbed limb using PCA and K-Means. Scatter plots illustrate the distribution of subjects in a reduced feature space defined by the first two principal components (PC1 and PC2) extracted from vertical GRF data. Each point represents a subject, colored by their k-means cluster assignment (3 clusters, 10 replicates). PC1 and PC2 capture the majority of variance, enabling clear visualization of individual differences in loading behavior: (A) Older adults, (B) Young adults.
Applsci 15 06885 g004
Figure 5. The means and standard deviations for the ground reaction force curves of the perturbed limb (left) compared to those noted during treadmill gait in a group of young (Y) and elderly (O), where: (A) Strategy I, (B) Strategy II, (C) Strategy III, (D) Treadmill gait (reference), PD–vertical component, AP–anterior-posterior component, ML–medial-lateral component. The tables show the minimum and maximum values for the three components of ground reaction forces for the three strategies and treadmill gait, as well as statistically significant differences between the groups and effect size (r). Bold font indicates that values in group O were higher than in group Y. When comparing negative values, their absolute values were considered.
Applsci 15 06885 g005
Figure 6. The means and standard deviations for the joint angles curves in the joints of the perturbed limb (left) compared to those recorded during treadmill gait in a group of young (Y) and elderly (O), where: (A) Strategy I, (B) Strategy II, (C) Strategy III, (D) Treadmill gait (reference), pf–plantarflexion, df–dorsiflexion, ext–extension, flx–flexion. The tables show the minimum and maximum values of joint angles for the three strategies and treadmill gait, as well as statistically significant differences between the groups and effect size (r). Bold font indicates that values in group O were higher than in group Y. When comparing negative values, their absolute values were considered.
Applsci 15 06885 g006
Figure 7. The means and standard deviations for the joint torques curves for the perturbed limb (left) compared to those recorded during treadmill gait in a group of young (Y) and elderly (O), where: (A) Strategy I, (B) Strategy II, and (C) Strategy III, (D) Treadmill gait (reference), pf–plantarflexion, df–dorsiflexion, ext–extension, flx–flexion. The tables show the minimum and maximum values of joint torques for the three strategies and treadmill gait, as well as statistically significant differences between the groups and effect size (r). Bold font indicates that values in group O were higher than in group Y. When comparing negative values, their absolute values were considered.
Applsci 15 06885 g007
Figure 8. Clustering of vertical ground reaction force patterns for reactive limb using PCA and K-Means. Scatter plots illustrate the distribution of subjects in a reduced feature space defined by the first two principal components (PC1 and PC2) extracted from vertical GRF data. Each point represents a subject, colored by their k-means cluster assignment (3 clusters, 10 replicates). PC1 and PC2 capture the majority of variance, enabling clear visualization of individual differences in loading behavior: (A) Older adults, (B) Young adults.
Applsci 15 06885 g008
Figure 9. The means and standard deviations for the ground reaction force curves of the reactive limb (right) compared to those noted during treadmill gait in a group of young (Y) and elderly (O), where: (A) Strategy I, (B) Strategy II, (C) Strategy III, (D) Treadmill gait (reference), PD–vertical component, AP–anterior-posterior component, ML–medial-lateral component. The tables show the minimum and maximum values for the three components of ground reaction forces for the three strategies and treadmill gait, as well as statistically significant differences between the groups and effect size (r). Bold font indicates that values in group O were higher than in group Y. When comparing negative values, their absolute values were considered.
Applsci 15 06885 g009
Figure 10. The means and standard deviations for the joint angles curves in the joints of the reactive limb (right) compared to those recorded during treadmill gait in a group of young (Y) and elderly (O), where: (A) Strategy I, (B) Strategy II, and (C) Strategy III, (D) Treadmill gait (reference), pf–plantarflexion, df–dorsiflexion, ext–extension, flx–flexion. The tables show the minimum and maximum values of joint angles for the three strategies and treadmill gait, as well as statistically significant differences between the groups and effect size (r). Bold font indicates that values in group O were higher than in group Y. When comparing negative values, their absolute values were considered.
Applsci 15 06885 g010
Figure 11. The means and standard deviations for the joint torques curves for the reactive limb (right) compared to those recorded during treadmill gait in a group of young (Y) and elderly (O), where: (A) Strategy I, (B) Strategy II, and (C) Strategy III, (D) Treadmill gait (reference), pf–plantarflexion, df–dorsiflexion, ext–extension, flx–flexion. The tables show the minimum and maximum values of joint torques for the three strategies and treadmill gait, as well as statistically significant differences between the groups and effect size (r). Bold font indicates that values in group O were higher than in group Y. When comparing negative values, their absolute values were considered.
Applsci 15 06885 g011
Figure 12. Percentage of strategies adopted for perturbed limb (left), and reactive limb (right) in young and older group.
Applsci 15 06885 g012
Table 1. Characteristics of the participants (mean ± SD).
GroupsAge [Years]Body Weight [kg]Body Height [cm]
Young (Y: n = 21)21.38 ± 1.3261.38 ± 6.48165.9 ± 4.53
Old (O: n = 21)67.75 ± 4.773.36 ± 11.06161.5 ± 5.18
Table 2. Differences between the means of the extreme values adopted in Strategies I, II, III, and those for gait on a treadmill without perturbation (n) for kinematic parameters of the perturbed limb with the indication of their spread (min, mean, max) relative to each other. For negative values, the comparison was for absolute values.
Ankle [deg]Knee [deg]Hip [deg]
min − pfmax − dfmin − extmax − flxmin − extmax − flx
Young
I–n2.66 (min)−3.02 (min)4.32 (mean)−2.47 (min)5.78 (max)4.44 (min)
II–n−6.1 (mean)−4.64 (mean)4.67 (max)12.72 (mean)3.21 (min)11.61 (mean)
III–n−9.37 (max)−5.48 (max)1.64 (min)14.65 (max)3.46 (mean)12.6 (max)
Elderly
I–n8.66 (max)3.53 (min)6.2 (mean)4.46 (min)19.28 (max)15.82 (min)
II–n2.38 (mean)5.18 (mean)4.38 (min)10.42 (mean)18.32 (mean)26.86 (max)
III–n−0.45 (min)6.12 (max)7.27 (max)19.42 (max)14.46 (min)23.3 (mean)
Table 3. Differences between the means of the extreme values adopted in Strategies I, II, III, and those for gait on a treadmill without perturbation (n) for kinetic parameters of the perturbed limb with the indication of their spread (min, mean, max) relative to each other. For negative values, the comparison was for absolute values.
Ankle [Nm/kg]Knee [Nm/kg]Hip [Nm/kg]
min − dfmax − pfmin − flxmin − dfmax − pfmin − flx
Young
I–n0.01 (min)−0.03 (min)−0.29 (mean)0.79 (max)−0.03 (min)0.62 (mean)
II–n−0.12 (max)0.39 (mean)−0.29 (mean)0.42 (mean)−1.22 (max)0.68 (max)
III–n−0.05 (mean)0.58 (max)−0.25 (min)0.2 (min)−0.8 (mean)0.49 (min)
Elderly
I–n0 (min)−0.14 (min)−0.22 (min)0.47 (max)0 (min)0.51 (mean)
II–n−0.19 (mean)0.24 (mean)−0.25 (mean) 0.23 (min)−0.55 (mean) 0.47 (min)
III–n−0.19 (mean)0.58 (max)−0.33 (max)0.3 (mean)−0.73 (max)0.65 (max)
Table 4. Differences between the means of the extreme values adopted in Strategies I, II, III, and those for gait on a treadmill without perturbation (n) for kinematic parameters of the reactive limb with the indication of their spread (min, mean, max) relative to each other. For negative values, the comparison was for absolute values.
Ankle [deg]Knee [deg]Hip [deg]
min − pfmax − dfmin − extmax − flxmin − extmax − flx
Young
I–n7.1 (mean)−0.88 (max)5.65 (min)−0.81 (mean)25.91 (max)30.01 (mean)
II–n4.24 (min)0.13 (min)8.45 (mean)0.69 (min)14.68 (min)23.8 (min)
III–n13.41 (max)0.31 (mean)9.33 (max)3.31 (max)25.23 (mean)30.41 (max)
Elderly
I–n10.42 (max)4.19 (mean)8.21 (mean)1.25 (min)14.33 (max)8.03 (mean)
II–n0.35 (min)3.75 (min)4.09 (min)3.53 (mean)1.41 (min)8.2 (max)
III–n3.68 (mean)4.42 (max)9.01 (max)9.39 (max)10.97 (mean)8 (min)
Table 5. Differences between the means of the extreme values adopted in Strategies I, II, III, and those for gait on a treadmill without perturbation (n) for kinetic parameters of the reactive limb with the indication of their spread (min, mean, max) relative to each other. For negative values, the comparison was for absolute values.
Ankle [Nm/kg]Knee [Nm/kg]Hip [Nm/kg]
min − dfmax − pfmin − flxmin − dfmax − pfmin − flx
Young
I–n−0.18 (mean)0.13 (min)−0.29 (min)0.89 (max)−0.24 (min)1.13 (min)
II–n−0.05 (min)0.73 (max)−0.44 (max)0.7 (mean)−0.67 (max)1.29 (mean)
III–n−0.23 (max)0.14 (mean)−0.38 (mean)0.65 (min)−0.53 (mean)1.44 (max)
Elderly
I–n−0.1 (mean)0.12 (mean)−0.28 (max)0.19 (mean)−0.26 (mean)1.28 (max)
II–n−0.22 (max)0.48 (max)−0.27 (mean)0.57 (max)−0.44 (max)1.16 (mean)
III–n0.04 (min)−0.08 (min)−0.08 (min)0.02 (min)−0.09 (min)0.23 (min)
Disclaimer/Publisher’s Note: The statements, opinions and data contained in all publications are solely those of the individual author(s) and contributor(s) and not of MDPI and/or the editor(s). MDPI and/or the editor(s) disclaim responsibility for any injury to people or property resulting from any ideas, methods, instructions or products referred to in the content.

