Abstract
Due to the complexity of planning and constructing underground lines, construction challenges—such as close proximity and multi-line interactions—are increasingly being recognized, along with their associated safety hazards. The visual observation of tunnel deformation and changes in the surrounding strata is difficult. In this study, laboratory model experiments were conducted using a mixture of liquid paraffin, n-tridecane, and silica gel powder, combined in specific proportions to create a transparent material that simulates natural soft rock. The new tunnel was designed to simultaneously cross over and under two existing tunnels. The impact of the new tunnel on the existing tunnels was examined, with excavation length and soil layer thickness considered as the primary influencing factors. The results indicate that excavating the new tunnel causes settlement deformation in the tunnels above and heave deformation in the tunnels below. The magnitude of deformation increases as excavation progresses but decreases with the greater thickness of the soil interlayer. For an existing tunnel, variations in the thickness of the soil interlayer not only affect its own deformation but also disturb the tunnel on the opposite side. Therefore, to ensure safer and orderly urban tunnel construction and to address the “black box” effect, it is essential to study the deformation characteristics of existing tunnels and their surrounding rock during the construction of new tunnels.
1. Introduction
In recent years, the rapid advancement of transportation has significantly contributed to economic growth. However, this rapid development has resulted in a complex network of intersecting underground tunnel lines, where new tunnels are inevitably planned near existing ones, creating unique construction challenges [1,2,3,4]. To improve the current situation, some scholars have turned their attention to underground space, and the development and utilization of underground space have become a hot issue in the current academic circle. Seeking land and space underground has become an inevitable historical trend in urban development. As early as the 1960s, many cities around the world carried out three-dimensional planning and development during the construction process, effectively utilizing underground space. According to the “Notice on the Development Plan for the Modern Comprehensive Transportation System during the 14th Five-Year Plan Period”, China’s rail transit plan points out that by 2025, transportation development will move towards world-class levels. The more difficult and complex part of the three-dimensional construction of urban transportation lies underground. In the utilization and development of underground space, during the construction of underground tunnels, not only the above-ground buildings need to be taken into account, but also the multi-line interlacing of new underground tunnels and existing ones. The close proximity and staggering of multiple routes will inevitably impact surrounding structures during construction. This is primarily due to the movement of underground structures and strata around the tunnel pipelines caused by tunnel excavation [5,6].
Currently, the methods used to assess the impact of tunnel construction on the surrounding environment and underground structures, both domestically and internationally, can be broadly classified into four types: the empirical method, theoretical prediction method [7], model test method, and field observation method. The empirical method [8,9,10,11] is mainly represented by the Gaussian curvilinear settling trough proposed by Peck et al. Attewell et al. investigated the maximum surface settlement based on the assumption of Peck’s formula and found that the maximum surface settlement is related to the rate of stratum loss, which is then applied to the study of overlapping tunnels [12]. Within the scope of information available, Wood [13] and Carter et al. [14], Verruijt [15], and Sagaseta [16] obtained soil deformation and surface settlement closure solutions for the effects of soil disturbance during shield tunneling by treating shield tunneling as a column bore expansion. In Germany, Duddeck [17] provided a mechanical analysis of two metro shield tunnels excavated in close proximity to each other in a stratum, where the displacement response method and the stiffness distribution method were explored. Vorster et al. [18] took into account the size of the pipe and the soil-structure stiffness difference in terms of the elastic continuum solution. Klar et al. [19] discussed the theoretical model of the pipeline and considered the pipeline as a beam and a three-dimensional structure, where different computational results were obtained. Zhang et al. [20], Liang et al. [21], and Xu et al. [22] investigated the excavation above an existing tunnel based on the Winkler foundation beam model and derived an analytical solution for the longitudinal deformation of the existing tunnel. Yazdchi et al. [23] explored the impacts of cross-tunneling on the existing tunnel and the surface settlement using a three-dimensional numerical simulation method under different ground conditions. Ghaboussi J. et al. [24] analyzed the force and deformation effects on the existing tunnel when a new tunnel was built over a passageway by establishing the 2D and 3D finite element models, respectively.
In centrifugal modeling tests, Mair [25] investigated the stability of shield tunnels. It was concluded that the damage pattern of the tunnel excavation surface in sandy soil was chimney-shaped, while in clay soil, it was funnel-shaped. Grant et al. [26] investigated the “greenfield model” and found the displacement pattern of different strata and soil layers during the gradual advancement of shield tunnels. A number of centrifugal modeling tests have been carried out by T. Kimura et al. [27] based on the passage of tunnels under an existing pipeline, and a method for calculating the internal forces in the existing pipeline has been developed. As for the conventional model tests, Nakai et al. [28] used solid cylinders to simulate tunnels in shield tunnel tests in sandy soil to investigate the formation loss formed by shield advancement. For the field observation method, Sharma et al. [29] studied MRT tunnels under extensive excavation and used a motorized total station monitoring system to monitor the MRT tunnels during the excavation of the foundation pit. Hansmire [30] analyzed two parallel shield tunnels in soft soil. It was also noted that volume changes due to the expansion or compression of the soil are the main factors affecting ground movement.
The large physical model tests mentioned above are costly, and the opaqueness of the geotechnical body makes it challenging to monitor internal deformations, requiring numerous sensors and additional complexity. To facilitate the clear and convenient observation of deformations within the soil body, the properties and applications of synthetic transparent soil have been studied.
Mannheimer [31] invented transparent clay in 1990 and used it to model the non-Newtonian flow problem of clay. This was the earliest prototype of transparent synthetic clays. After this, Iskander et al. [32] investigated the physical, mechanical properties of consolidated specimens of transparent mud in their subsequent studies. The results showed that such transparent mud could be used to simulate natural soil. This result laid the foundation for future artificial transparent synthetic soils. Then, Iskander et al. [33,34,35,36,37] synthesized transparent clays using amorphous silica powders and pore-flowing liquids. The existing types of transparent clays and areas of application were also summarized. Wallace et al. [38] and Hakhamaneshi et al. [39] developed transparent clay materials using LaponiteRD material and Gelita material, respectively. Gill [40] studied the infiltration of water in clay soil via the target tracking technique and used transparent synthetic soil to study the deformation of the soil around the pile during its subsidence. Sadek et al. [41,42] synthesized a transparent material using amorphous silica gel and pore fluids with the same refractive coefficient. Sun et al. [43] developed a complete transparent soil shield tunnel model test system. For the first time, transparent materials were used to study shield tunnel excavation. Xu [44,45] selected a mixed solution of silica gel powder and mineral oil to formulate transparent rock. The deformation, damage mechanism, and rupture evolution law of the surrounding rock of deeply buried tunnels were analyzed.
Most studies mentioned above have focused on research in situations where a new tunnel crosses two existing tunnels simultaneously. Additionally, most scholars use transparent sand and clay for tunnel excavation tests, while the use of transparent rock to simulate tunnel excavation has been adopted by only a few researchers. In addition, the range of conditions studied is relatively limited. To address these gaps, this study combines transparent rock testing with the scenario of tunneling through two existing tunnels simultaneously, providing a detailed investigation into the impact of new tunnel excavation on both the upper and lower existing tunnels.
2. Transparent Geotechnical Test
2.1. Model Box
The size of the physical model for tunnel excavation is determined based on its geometric similarity ratio to the prototype project. While a smaller geometric similarity ratio enables the test results to more accurately reflect the actual project, it also leads to higher testing expenses. As the model size increases, the presence of impurities in similar transparent material causes its transparency to decrease. This suggests that the test model size should not be excessively large, particularly in the direction perpendicular to the internal observation surface, in order to maintain the clarity of the internal observation surface. Therefore, the thickness in the photographic direction should be kept within 200 mm to ensure clarity, while the dimensions in the other two directions can be appropriately increased based on the requirements. In this study, taking into account the size of the actual tunnel project and the size limitations of the transparent geotechnical test, the geometric similarity ratio for the physical model of the tunnel excavation is set to 200. The prototype of the new tunnel is simplified to a circular shape, with the tunnel diameter being approximately 70 mm.
In addition, according to St. Venant’s principle and relevant test results, when the dimensions of the model box in the lateral and vertical directions are more than three times the diameter of the tunnel, the influence of boundary effects becomes negligible. As a result, the dimensions of the physical model of the transparent rock mass are set to a thickness of 200 mm, a width of 250 mm, and a height of 400 mm. The test model tank is constructed using four pieces of 17 mm thick transparent plexiglass plates bonded with glass adhesive, along with two removable 15 mm transparent plexiglass panels, as illustrated in Figure 1.

Figure 1.
Model test box (unit: mm).
2.2. Consolidation Device
In this section, the model box of the tunnel model test is assembled with the structure of a “Plexiglass box + peripheral steel plate” before consolidation, as shown in Figure 2. When the transparent rock body is loaded and consolidated, a peripheral fixation device is used to prevent the plexiglass box from bulging and deforming under high-pressure loads. This device is made of four 12 mm steel plates and includes 14 screws with a diameter of 6 mm.

Figure 2.
Schematic diagram of model box fixtures.
At present, there are three kinds of loading methods often used in indoor model experiments in geotechnical engineering: gravity loading, cylinder (including jack) loading, and motor loading. The transparent rock body test has the following two characteristics: (1) Their models cannot be very limited by transparency and have long consolidation and loading times. (2) Due to the requirement of the transparent rock body tunnel model consolidation, slow loading and unloading, and others, it requires a greater function of the loading device. Therefore, after comprehensive consideration, the transparent rock body loading test system with motor loading was selected. In this method, an actuator and a dynamometer were used to conduct the test, as shown in Figure 3.

Figure 3.
Consolidation device.
2.3. Excavation Device
To more accurately simulate the process of forward tunnel excavation, this study designed a tunnel excavation device based on the tunnel model test apparatus, as illustrated in Figure 4. The device primarily consists of a cutter disc, a drill bit, a rotating blade, a screw mandrel, and a handle. The primary function of the cutter disc and drill bit is to cut the transparent rock and facilitate its discharge through the hole in the cutter disc. The rotating blades are designed to cut and discharge the transparent rock material. The screw and handle are designed to allow the cutter to move freely back and forth to excavate transparent rock. The cutter advances 0.26 mm for each clockwise rotation of the handle. And a polyester ammonia Ulli hose was used to simulate the existing tunnels.

Figure 4.
Excavation device.
2.4. Data Acquisition Device
The principle of rock deformation testing based on digital photography is the digital scattering correlation method proposed by Yamaguchi [46] and Peters et al. [47] in the early 1980s. It is a full-field, non-contact photometric method for directly extracting deformation information from randomly distributed natural scattering fields or pseudo-randomly distributed artificial scattering fields on the test section of an object. Numerous scholars, both domestically and internationally, have conducted extensive research on the overall observation of the deformation and rupture evolution of rock bodies, as well as on the study of their mechanical properties. The emergence, development, and maturation of transparent rock body experimental technology effectively addresses the limitations of digital photographic measurement technology when observing deformation within rock bodies.
Figure 5 illustrates the complete test setup. As shown, a CCD industrial camera and particle imaging velocimetry (PIV) technique were employed in this experiment. Instead of using the traditional laser irradiation to create a scattering field, various colored waterborne paints were mixed with silica gel powder in the same proportion for dyeing. The colored silica gel powder mixture was then evenly sprinkled on the pre-set plane to form a colored artificial spotting surface, as depicted in Figure 6.

Figure 5.
Test setup and model details. (a) Schematic diagram of the transparent rock model test system; (b) picture of the test setup.

Figure 6.
Diagrams of artificial spot surface.
2.5. Test Materials
Currently, the primary aggregates for transparent geotechnical similar materials include fused silica sand, amorphous silica powder, amorphous silica gel, and epoxy resin. Fused silica sand, in particular, is produced by melting natural high-purity silica in an electric furnace at temperatures exceeding 1760 °C, followed by rapid cooling. Its refractive index is essentially linearly related to its density; as the density of the quartz sand increases, its refractive index gradually rises.
The product obtained after crushing or the further ultrafine grinding of fused silica is known as fused silica sand or fused silica powder. Silica gel powder is characterized by its high purity, high transparency, low coefficient of thermal expansion, strong chemical resistance, stable physical and chemical properties, and strong adsorption capacity. Its specific gravity is generally around 2.2 g/cm3, and its refractive index ranges between 1.41 and 1.46. The configuration of the pore liquid often employs the “solution 1 + solution 2” method, which involves combining two solutions with different refractive indices. This approach mixes the solutions at a specific ratio to achieve a refractive index similar to that of the aggregate. For example, the refractive index of the pore liquid and amorphous silica powder can be matched by mixing n-dodecane and liquid paraffin in a volume ratio of 2.5:1.
In this test, it is assumed that the tunnel is located in a stratum composed solely of siltstone. Building upon previous research findings in transparent similar materials, transparent rock configured with epoxy resin (as the aggregate), a curing agent, and an accelerator exhibits higher transparency. However, it also shows poor anisotropy, higher plasticity, and low brittleness. Transparent soil configured with amorphous silica powder (as the aggregate), n-dodecane, and liquid paraffin possesses properties that are primarily similar to those of clay. On the other hand, transparent clays made from fused silica sand (as the aggregate) combined with n-dodecane and liquid paraffin, or fused silica sand with a calcium bromide solution, exhibit properties mainly akin to sandy clays. In this study, transparent clays were selected and configured from amorphous silica powder (as the aggregate), n-tridecane, and liquid paraffin. These transparent clays exhibit lower strength and resemble soft rock after consolidation. The basic physical and mechanical parameters of siltstone used in the test are presented in Table 1. The material used in the test and the material intended to be simulated in reality have the basic same physical and mechanical parameters. However, the transparency of the rock formulated with this material is limited. Based on the previous research results, this experiment involved using amorphous silica powder as the aggregate and a mixture of n-tridecane and liquid paraffin as the cementing material. Then, transparent materials were synthesized in a certain proportion to simulate natural soft rock. The effects of different refractive indices are shown in Figure 7. As can be seen from the figure, the number in the picture represents the refractive index; when the refractive index of the transparent similar material is 1.446, the transparency effect is the best.

Table 1.
Basic physical and mechanical parameters of the material.

Figure 7.
Transparent similar materials with varying refractive indices.
2.6. Test Schemes and Process
In this test, the thickness of the soil interlayer between the new tunnel and the two existing tunnels was chosen as the primary influencing factor, while also considering the tunnel footage for the model test of transparent geotechnical tunnel excavation. The test was conducted on three groups of models under different operating conditions. By adjusting the placement of the existing tunnels and varying the thickness of the soil interlayer, the impact of the new tunnel excavation on the rock surrounding the two adjacent existing tunnels was examined. The specific conditions for the model tests are detailed in Table 2.
Table 2.
Test schemes.
The test process is as follows:
- (1)
- Specimen Preparation: A transparent solution of mineral oil was formulated by mixing liquid paraffin and n-tridecane in a weight ratio of 1:0.835. Simultaneously, a certain amount of silica gel powder was prepared. The mixture was then vacuumed to achieve a transparent state.
- (2)
- Tunnel Simulation: Two Uli hoses were buried in predetermined positions to represent the existing tunnels.
- (3)
- Consolidation: The prepared specimens were consolidated. Once consolidation was complete, weights were applied to simulate the upper load.
- (4)
- Photography Setup: A CCD camera was used to capture images. To ensure optimal shooting conditions, lights were arranged next to the camera, and both the lighting and camera focus were adjusted.
- (5)
- Excavation: The handle was rotated to simulate the excavation process.
This setup allowed for the observation and analysis of the effects of new tunnel excavation on the surrounding rock and existing tunnels.
The test process is as follows: specimen preparation with liquid paraffin and n-tridecane according to the weight ratio of 1:0.835 formulated into a transparent solution of mineral oil, and at the same time preparing a certain amount of silica gel powder, mixing it, and using a vacuum to achieve a transparent state. In addition, two Uli hoses are buried in an established position in advance to represent the existing tunnel. The configured specimens are consolidated, and after the consolidation is completed, the upper load is applied with weights. The CCD camera is used to take pictures, and in order to achieve the best shooting effect, lights are arranged next to the camera; the light and camera focus are adjusted, and the handle is rotated for excavation.
3. Results and Discussions
3.1. Effect of the Tunnel Footage
Under the condition of a certain thickness of the rock and soil layer, the new tunnel penetrates through existing tunnel a and crosses existing tunnel b. The displacement changes in the rock and soil around the two existing tunnels are selected for analysis when the tunnel excavation device travels to the front, middle, and back of the artificial observation spot. As can be seen from Figure 8, the shield jacking length L is selected to be analyzed, such as L = 1.9D, 2.2D, and 2.5D. Among them, the L of 2.2D represents the position of the artificial spot observation surface. The displacement changes in the rock and soil bodies around the existing tunnels can be obtained during the advance of the shield tunnel by importing the original figures taken at each stage of the test into the PIV software (PIVview2CDemo_v359) for analysis and processing.

Figure 8.
Vertical displacement of the rock and soil around the existing tunnels. (h1 = h2 = 0.3D).
Figure 8 shows the displacement of the rock around the two existing tunnels when the new tunnel crosses above and beneath the existing tunnels with the same thickness as the rock and soil interlayer (h = 0.5D) at the same time. When the tunneling device moved ahead of the artificial spot observation surface (L = 1.9D), there was a small settlement below existing tunnel a and a small uplift above existing tunnel b. At this moment, the maximum vertical displacement-to-diameter ratio of existing tunnel a was about 0.0022, and that of existing tunnel b was approximately 0.0026. When the tunneling device moved to the artificial spotting observation surface (L = 2.2D), the settlement below existing tunnel a and the uplift above existing tunnel b was larger than before the spotting surface. Also, the maximum vertical displacement-to-diameter ratio for existing tunnel a and tunnel b equaled about 0.0038 and 0.0045, respectively. Additionally, the maximum vertical displacement-to-diameter ratio increased by 0.0016 and 0.0019 compared with that at 1.9D. When the tunneling device reached the back of the artificial spot observation surface (L = 2.5D), maximum deformation occurred under existing tunnel a and above existing tunnel b. The maximum vertical displacement-to-diameter ratio was about 0.0048 and 0.0059, respectively. These two values were 0.001 and 0.0014 mm larger than that at L = 2.2D. With the advance of the newly excavated tunnel, the rock deformation around the existing tunnels gradually decreased from the center to the two sides along the direction of the existing tunnel length. The deformation pattern conformed to the Gaussian distribution curve, and some rock bodies bulged at both ends of the existing tunnel bulge. This was because the simulated existing tunnels were not completely horizontal and there were small warps at both ends of the tunnels, which tended to deform upwards. Figure 9 and Figure 10 show the displacement of the surrounding rock as the new tunnel passes through existing tunnel a and existing tunnel b. In Figure 9, the thickness of the rock and soil interlayer above existing tunnel a is 0.3D and 0.7D below existing tunnel b. In contrast, these two values in Figure 10 are equal to 0.7D and 0.3D, respectively. Since the deformations are consistent with the thickness (i.e., 0.3D) of the rock and soil interlayer, we will not repeat this.

Figure 9.
Vertical displacement of the rock and soil around the existing tunnels (h1 = 0.3D, h2 = 0.7D).

Figure 10.
Vertical displacement of the rock and soil around the existing tunnels as a function of the excavation footage. (h1 = 0.7D, h2 = 0.3D).
Generally, the settlement deformation and heave deformation of the rock and soil around the existing tunnels increase gradually with the increasing excavation footage of the new tunnel when the new tunnel crosses the upper and lower two existing tunnels at the same time. And the maximum settlement deformation and heave deformation occur when crossing the existing tunnel above or below, and the increasing deformation decreases after crossing and tends to become gradually stable.
3.2. Effect of the Thickness of Soil Interlayer
- (1)
- Variation in the thickness of the soil interlayer of existing tunnel a
When the newly excavated tunnel goes through existing tunnel a and crosses existing tunnel b at the same time, comparative experiments are conducted to investigate the effects of the thickness of the soil interlayer between the new and existing tunnels on the surrounding rock mass of the existing tunnels. In this section, the thickness of the soil interlayer is selected as 0.3D, 0.5D, and 0.7D for analysis.
Figure 11 shows the deformation characteristics of the rock body around existing tunnel a, by increasing the thickness of the soil interlayer between existing tunnel a and the new tunnel from 0.3D to 0.7D. The excavation footage of the new tunnel is controlled as a constant.
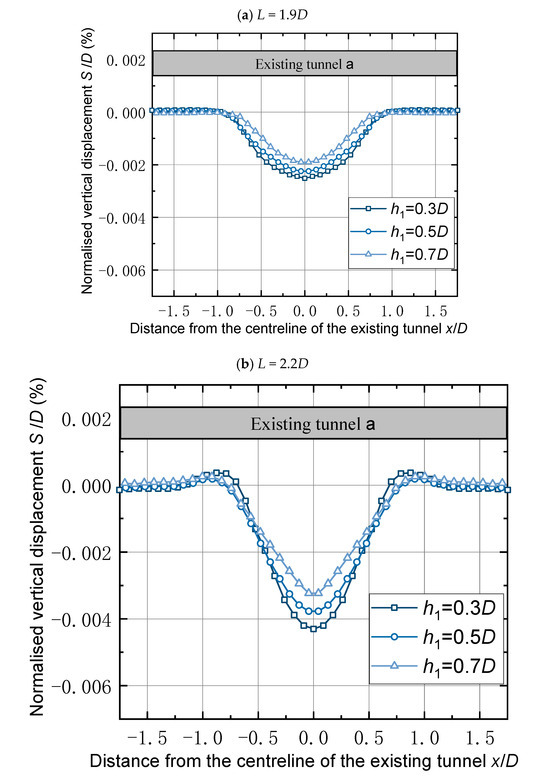

Figure 11.
Vertical displacement of existing tunnel a with varying soil layer thicknesses.
The maximum deformation of the rock mass around existing tunnel a is analyzed underneath existing tunnel a. When the thickness of the soil interlayer between the new tunnel and existing tunnel a is 0.3D, the settlement that occurs in the rock beneath existing tunnel a is the largest, with a maximum vertical displacement-to-diameter ratio of about 0.0056. As the thickness of the soil interlayer between the tunnels increases, the deformation of the rock beneath existing tunnel a gradually decreases. When the thickness of the soil interlayer is 0.5D, the settlement of the rock directly underneath existing tunnel a becomes smaller, with the maximum vertical displacement-to-diameter ratio being about 0.0048. As the thickness of the soil interlayer continues to increase to 0.7D, the maximum vertical displacement-to-diameter ratio reaches 0.0039 (see Figure 11c). Along the length of the existing tunnel, the maximum deformation of the rock mass around existing tunnel a is located at the center of the tunnel. The deformation decreases from the center to the sides. The deformation pattern conforms to the Gaussian distribution curve. The rules for the other two types of footage are consistent with the above laws and, therefore, will not be repeated.
In the case of a new tunnel passing through two existing tunnels at the same time, the fixed excavation footage and the thickness of the soil interlayer of existing tunnel b remain unchanged. As the thickness of the soil interlayer in existing tunnel a increases, the settlement around existing tunnel a decreases. Along with the length of the existing tunnel, the vertical displacement of the tunnel edge decreases from the center of the tunnel axis to the sides of the tunnel.
- (2)
- Variation in the thickness of the soil interlayer of existing tunnel b
When the new tunnel crosses two existing tunnels (a and b) at the same time and the thickness of the soil layer between existing tunnel a and the new tunnel is specified, the vertical displacement of the rock and soil bodies around existing tunnel b is compared with the thickness of the soil layer in the upper crossing of existing tunnel b, which is 0.3D, 0.5D and 0.7D, respectively.
From Figure 12, it can be seen that the effect of variation in the soil layer thickness of existing tunnel b is itself consistent with the above under the condition that the excavation footage is kept constant. At the end of tunnel excavation (L = 2.5D), when the soil layer thickness decreases from 0.7D to 0.5D, the vertical displacement of the rock mass above existing tunnel b increases, with the maximum vertical displacement-to-diameter ratio increasing from 0.0052 to 0.0059. Subsequently, the soil layer thickness continues to decrease to 0.3D, and the maximum displacement-to-diameter ratio of the bulge continues to increase to 0.0066 (see Figure 12c). Similarly, the maximum vertical displacement-to-diameter ratio above existing tunnel b increases with decreasing soil layer thickness when the tunnel excavation scales are 2.2D and 1.9D. The same pattern is observed for L = 2.5D, so it is not repeated here. Along the length of the existing tunnel, the maximum deformation of the rock around existing tunnel b is located at the center of the tunnel and the deformation value decreases gradually from the middle to both sides, which is in line with the Gaussian distribution curve.
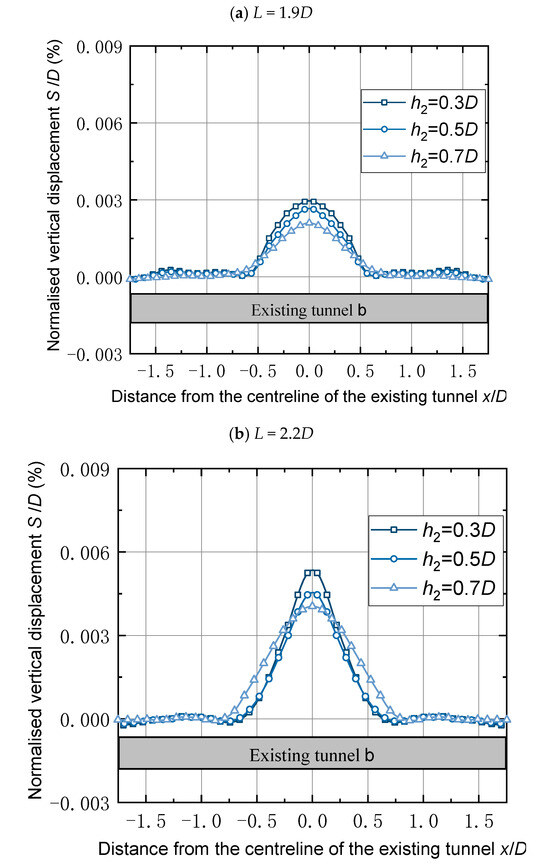

Figure 12.
Vertical displacement of existing tunnel b with varying soil layer thickness.
When the new tunnel crosses two existing tunnels at the same time, the excavation footage is kept constant. The deformation of both existing tunnel b and existing tunnel a increases with the decrease in the thickness of the soil interlayer. Along the length of the existing tunnel, the vertical displacement of the rock body around the existing tunnel gradually decreases from the center of the tunnel’s axis to the two sides, and the deformation curve is still in line with the Gaussian curve characteristics.
3.3. Discussions
In order to study the working conditions of the new tunnel passing under existing tunnel a and crossing over existing tunnel b simultaneously, when the clear distance between the new tunnel and the existing tunnel, that is, the thickness of the interlayer layer changes, the impact on the existing tunnel can be determined. And it can be compared and analyzed with the transparent rock mass test mentioned above. Combined with the engineering background, we have three working conditions that conform to the similarity ratio of the test. Among them, the thicknesses of the interlayer layers were set at 0.3D, 0.5D, and 0.7D, respectively. Figure 13 and Figure 14 show a comparison between the finite element results and the results of the transparent rock mass model test. Existing tunnel a and existing tunnel b can be seen under the conditions of three interlayer thicknesses h = 0.3D, h = 0.5D, and h = 0.7D, respectively. The results show similar patterns, and the deformation curves all conform to the Gaussian curve distribution. And the peak values are not very different. But it can be seen that in the simulation results of the finite element method, the newly built tunnel passing under the existing tunnel causes existing tunnel a and existing tunnel b to have a deformation range that is larger than that of the indoor model test. This might be due to the fact that the finite element software simulates the actual working conditions in a similar way, but the similarity between the finite element software and the model test is relatively large, at 1/200. So, during the excavation process, there are the existing tunnels in the limiting element software that are affected at a larger range compared to those in the experiment. On the other hand, it can be seen in the model test that settlement occurred on both sides of the uplift deformation, which might be due to the middle part of the existing tunnel being subjected to new forces, the effect of excavation, and unloading during tunnel construction, which reduces the surrounding rock pressure above the existing tunnel arch, causing it to bulge and deform the rocks on both sides, which are squeezed towards the middle, thus causing a small-scale settlement phenomenon.
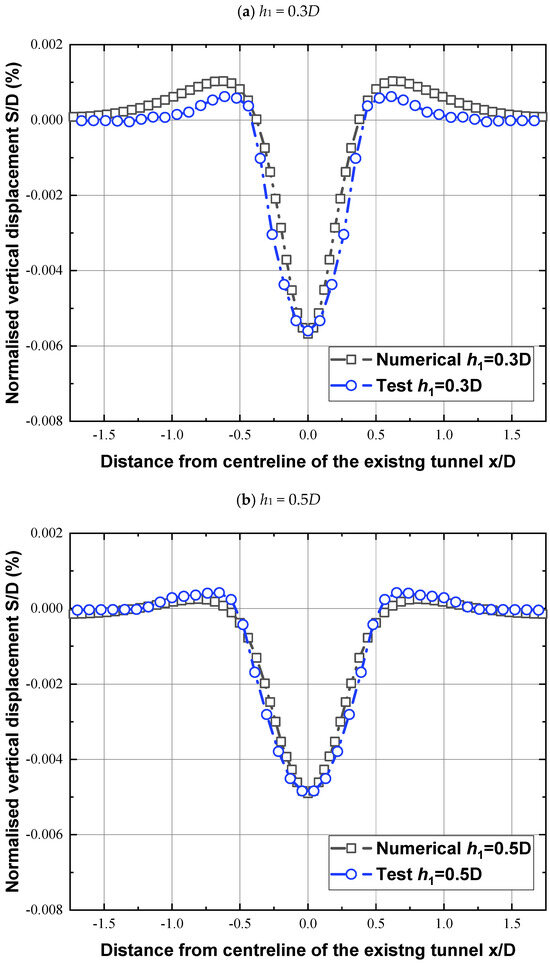

Figure 13.
Numerical simulation of existing tunnel a compared to the transparent rock tests.
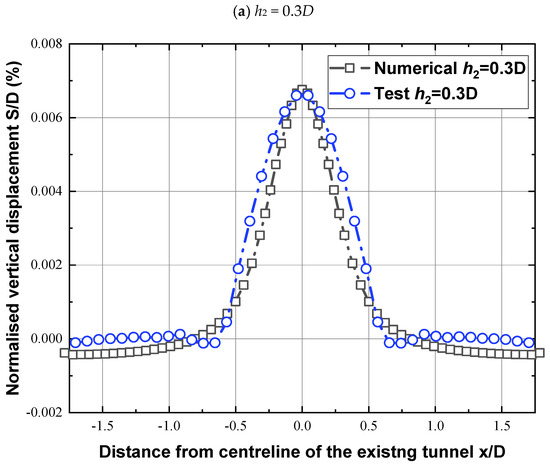

Figure 14.
Numerical simulation of existing tunnel b compared to the transparent rock tests.
The technology of transparent rock and soil mass still needs to be improved. Currently, the obtained transparent rock and soil mass materials can only simulate some soft rocks, and both the transparency and model size are subject to certain limitations. Increasing the consolidation pressure is a feasible method to enhance strength; however, it will greatly reduce its transparency. Therefore, the next step of this work will consider finding more reasonable ways and methods to enhance the material strength on the premise of ensuring transparency, so as to simulate more types of rock masses and better serve the research work of geotechnical engineering.
4. Conclusions
A study was conducted on the simultaneous crossing of two existing tunnels by a new tunnel, using transparent soft rock modeling tests. By varying the advanced footage of the new tunnel and the thickness of the soil layer, the main findings of this study can be summarized as follows:
- (1)
- Through research on different aggregates and cementing materials, the most suitable artificial synthetic transparent rock-like materials for simulating the excavation of new tunnels were determined. Moreover, using incandescent lamps and colored spot surfaces, the influence caused by low transparency was compensated to a certain extent.
- (2)
- Along the length of the existing tunnel, the vertical displacement of the rock surrounding the tunnels consistently decreased from the center of the tunnel’s axis toward both sides. The deformation pattern follows a Gaussian curve.
- (3)
- When the new tunnel simultaneously passes through the two existing tunnels, the deformation of the rock around the existing tunnels increases as the excavation footage of the new tunnel increases. The largest deformation of the existing tunnels occurs when the new tunnel crosses above or below them. Meanwhile, the deformation was most significant when the newly built tunnel advanced to 2.2D. Then it tends to stabilize.
- (4)
- With constant excavation footage, as the thickness of the soil interlayer between the new tunnel and existing tunnel a gradually decreases, the settlement of the rock around tunnel a increases. Similarly, the maximum deformation of the rock mass around existing tunnel b also increases as the thickness of the soil interlayer decreases.
- (5)
- The next step of this work will consider finding more reasonable ways and methods to enhance the material strength on the premise of ensuring transparency, so as to simulate more types of rock mass.
Author Contributions
Software, X.R.; Validation, M.L.; Writing—original draft, M.L.; Writing—review & editing, Q.O., X.R. and X.D.; Funding acquisition, Q.O. and X.D. All authors have read and agreed to the published version of the manuscript.
Funding
This research was funding by the National Natural Science Foundation of China, grand number: U2268213 & 52178312 & 52108299, the Chongqing Outstanding Youth Science Fund, grand number: CSTB2022NSCQ-JQX0020, the Chongqing technology innovation and application development special key project, grand number: STB2022TIAD-KPX0144, and Chongqing construction technology project, grand number: City Kezi 2023 number 1-1.
Institutional Review Board Statement
Not applicable.
Informed Consent Statement
Not applicable.
Data Availability Statement
The datasets generated and analyzed during the current study are available from the corresponding author on reasonable request.
Conflicts of Interest
Author Maoyi Liu was employed by the company Chongqing City Construct Investment Group Co., Ltd. The remaining authors declare that the research was conducted in the absence of any commercial or financial relationships that could be construed as a potential conflict of interest.
References
- Wu, B.; Liu, W.; Shi, P.; Xu, X.; Liu, Y. A case study of newly tunnels over-crossing the existing subway tunnels. Int. J. Distrib. Sens. Netw. 2022, 18, 159–176. [Google Scholar] [CrossRef]
- Xie, C.; Qu, Y.; Lu, H.; Song, S. Study on Deformation of New Tunnels Overcrossing Existing Tunnels Underneath Operating Railways. Buildings 2024, 14, 2420. [Google Scholar] [CrossRef]
- Yin, M.L.; Jiang, H.; Jiang, Y.S.; Sun, Z.Y.; Wu, Q.L. Effect of the excavation clearance of an under-crossing shield tunnel on existing shield tunnels. Tunn. Undergr. Space Technol. 2018, 78, 245–258. [Google Scholar] [CrossRef]
- Zeng, L.; Zhang, D.; Lian, C.; Zhang, J.; Yin, H. Study on the Influence of an Under-Crossing Parallel Double-Line Shield Tunnel on the Existing Tunnel Structure. Mathematics 2023, 11, 3125. [Google Scholar] [CrossRef]
- Cui, L.; Sheng, W.Y.Q.; Zheng, J.; Ali, N. Deformation behaviour of strain-softening rock mass in tunnels considering deterioration model of elastic modulus. Geomech. Geophys. Geo-Energy Geo-Resour. 2024, 10, 171. [Google Scholar] [CrossRef]
- Cui, L.; Yang, W.; Sheng, Q.; Zheng, J.; Zhang, W.; Guan, K.; Song, F. An enhanced numerical model for considering coupled strain-softening and seepage effect on rock masses surrounding a submarine tunnel. J. Rock Mech. Geotech. Eng. 2024, 17, 1445–1458. [Google Scholar] [CrossRef]
- Zhou, Z.; Chen, Y.; Liu, Z.Z.; Miao, L.W. Theoretical prediction model for deformations caused by construction of new tunnels undercrossing existing tunnels based on the equivalent layered method. Comput. Geotech. 2020, 123, 103565. [Google Scholar] [CrossRef]
- Han, X.; Li, N.; Standing, J.R. An adaptability study of Gaussian equation applied to predicting ground settlements induced by tunneling in China. Rock Soil Mech. 2007, 1, 23–28+35. [Google Scholar]
- Pan, H.Z.; Jiang, B.Y.; Hang, T. An adaptability study of gaussian equation applied to predicting ground settlements induced by shield tunneling in Tian Jin. Sci. Surv. Mapp. 2010, 35, 53–55. [Google Scholar]
- Peck, R.B. Deep Excavation and tunnelling in soft ground. In Proceedings of the 7th International Conference on Soil Mechanics and Foundation Engineering, Mexico City, Mexico, 4 April 1969; State of the Arts. Report. Volume 4, pp. 311–375. [Google Scholar]
- Song, K.Z.; Wang, M.S.; Sun, M. Reliability Analysis of Ground Settlement with Shield Tunnel Construction Based on Peck Formula. J. Nort Hern Jiaotong Univ. 2004, 4, 30–33. [Google Scholar]
- Attewell, P.B.; Yeates, J.; Selby, A.R. Soil Movements Induced by Tunnelling and Their Effects on Pipelines and Structures; Methuen Inc.: New York, NY, USA, 1986; Volume 2, p. 102. [Google Scholar]
- Wood, A.M.M. The Circular Tunnel in Elastic Ground. Geotechnique 1975, 25, 115–127. [Google Scholar] [CrossRef]
- Carter, J.; Booker, J.R.; Yeung, S.K. Cavity expansion in cohesive frictional soil. Geotechnique 1986, 24, 22. [Google Scholar] [CrossRef]
- Verruijt, A.; Booker, J.R. Surface settlements due to deformation of a tunnel in an elastic half plane. Géotechnique 1998, 46, 753–756. [Google Scholar] [CrossRef]
- Sagaseta, C. Discussion: Analysis of undrained soil deformation due to ground loss. Géotechnique 1988, 38, 647–649. [Google Scholar] [CrossRef]
- Duddeck, H. Application of numerical analyses for tunnelling. Int. J. Numer. Anal. Methods Geomech. 1991, 15, 233–249. [Google Scholar] [CrossRef]
- Vorster, T.E.; Klar, A.; Soga, K.; Mair, R.J. Estimating the Effects of Tunneling on Existing Pipelines. J. Geotech. Geoenviron. Eng. 2005, 131, 1399–1410. [Google Scholar] [CrossRef]
- Klar, A.; Marshall, A.M.; Soga, K.; Mair, R.J. Tunneling effects on jointed pipelines. Can. Geotech. J. 2008, 45, 131–139. [Google Scholar] [CrossRef]
- Zhang, Z.; Huang, M.; Wang, W. Evaluation of deformation response for adjacent tunnels due to soil unloading in excavation engineering. Tunn. Undergr. Space Technol. 2013, 38, 244–253. [Google Scholar] [CrossRef]
- Liang, R.; Xia, T.; Hong, Y.; Yu, F. Effects of above-crossing tunnelling on the existing shield tunnels. Tunn. Undergr. Space Technol. 2016, 58, 159–176. [Google Scholar] [CrossRef]
- Xu, Y.J.; Tao, L.J.; Wen, Z.K.; Liu, X.H.; Zang, Y. Upheaval Deformation Induced by Newly-Built Metro Tunnel Upcrossing Existing Tunnel. China Railw. Sci. 2014, 35, 48–54. [Google Scholar]
- Yazdchi, M.; Yeow, H.C.; Young, S. 3D Finite Element Prediction of Ground Movement Induced by Tunnelling Operation in London Clay. Comput. Civ. Eng. 2005, 1–8. [Google Scholar] [CrossRef]
- Ghaboussi, J.; Hansmire, W.H.; Parker, H.W.; Kim, K.J. Finite-element simulation of tunneling over subways. J. Geotech. Eng. ASCE 1983, 109, 318–334. [Google Scholar] [CrossRef]
- Mair, R.J. Theme lecture: Bored tunnels in the urban environment. In Proceedings of the Fourteenth International Conference on Soil Mechanics and Foundation Engineering, Hamburg, Germany, 6–12 September 1997; Volume 4, pp. 2353–2385. [Google Scholar]
- Taylor, R.N.; Grant, R.J. Tunnelling-induced ground movements in clay. Geotech. Eng. 2000, 143, 43–55. [Google Scholar]
- Kusakabe, O.; Kimura, T.; Saitoh, K. Geotechnical model tests of bearing capacity problems in a centrifuge. Geotechnique 1985, 35, 33–45. [Google Scholar]
- Nakai, T. Effects of excavation sequence on the 3D settlement of shallow tunnels. In Proceedings of the International Symposium on Geotechnical Aspects of Underground Construction in Soft Ground, Tokyo, Japan, 21–23 July 2000. [Google Scholar]
- Sharma, J.S.; Hefny, A.M.; Zhao, J.; Chan, C.W. Effect of large excavation on deformation of adjacent MRT tunnels. Tunn. Undergr. Space Technol. 2001, 16, 93–98. [Google Scholar] [CrossRef]
- Hansmire, W.H. Measured soil response to epb shield tunneling—Discussion. J. Geotech. Eng. ASCE 1984, 110, 305–306. [Google Scholar] [CrossRef]
- Mannheimer, R.J.; Oswald, C.J. Development of transparent porous-media with permeabilities and porosities comparable to soils, aquifers, and petroleum reservoirs. Ground Water 1993, 31, 781–788. [Google Scholar] [CrossRef]
- Iskander, M.; Bathurst, R.J.; Omidvar, M. Past, Present, and Future of Transparent Soils. Geotech. Test. J. 2015, 38, 557–573. [Google Scholar] [CrossRef]
- Ahmed, M.; Iskander, M. Analysis of Tunneling-Induced Ground Movements Using Transparent Soil Models. J. Geotech. Geoenviron. Eng. 2011, 137, 525–535. [Google Scholar] [CrossRef]
- Ahmed, M.; Iskander, M. Evaluation of tunnel face stability by transparent soil models. Tunn. Undergr. Space Technol. 2012, 27, 101–110. [Google Scholar] [CrossRef]
- Iskander, M.G.; Sadek, S.; Liu, J. Optical Measurement of Deformation Using Transparent Silica Gel to Model Sand. Int. J. Phys. Model. Geotech. 2002, 2, 13–26. [Google Scholar]
- Liu, J.; Iskander, M.G. Modelling capacity of transparent soil. Can. Geotech. J. 2010, 47, 451–460. [Google Scholar] [CrossRef]
- Sadek, S.; Iskander, M.G.; Liu, J.Y. Geotechnical properties of transparent silica. Can. Geotech. J. 2002, 39, 111–124. [Google Scholar] [CrossRef]
- Wallace, J.F.; Rutherford, C.J. Geotechnical Properties of LAPONITE RD (R). Geotech. Test. J. 2015, 38, 574–587. [Google Scholar] [CrossRef]
- Hakhamaneshi, M.; Black, J.A. Shear Strength of Transparent Gelita—The Effect of the Mixture Ratio, Displacement Rate, and Over-Consolidation Ratio; American Society of Civil Engineers Geo-Chicago: Chicago, IL, USA, 2016; pp. 443–452. [Google Scholar]
- Gill, D.R. Experimental and Theoretical Investigations of Pile and Penetrometer Installation in Clay. 2000. Available online: https://webofscience.clarivate.cn/wos/alldb/full-record/PQDT:68130729 (accessed on 15 June 2025).
- Iskander, M.G.; Liu, J.Y.; Sadek, S. Transparent amorphous silica to model clay. J. Geotech. Geoenviron. Eng. 2002, 128, 262–273. [Google Scholar] [CrossRef]
- Liu, J.Y.; Iskander, M.G.; Sadek, S. Consolidation and permeability of transparent amorphous silica. Geotech. Test. J. 2003, 26, 390–401. [Google Scholar] [CrossRef]
- Sun, J.Z.; Xiao, W.H. Design on Model Test of Shield Tunneling in Transparent Soil. J. Wuhan Univ. Technol. 2011, 33, 108–112. [Google Scholar]
- Xu, G.A. Research on the Mechanism and Evolution Law of Rock Deformation and Cracking Around Deep Tunnels; China University of Mining and Technology: Beijing, China, 2011. [Google Scholar]
- Xu, Z.L. Concise Course in Elastic Mechanics; Higher Education Press: Beijing, China, 2013. [Google Scholar]
- Yamaguchi, I. Speckle Displacement and Decorrelation in the Diffraction and Image Fields for Small Object Deformation. Opt. Acta Int. J. Opt. 1981, 28, 1359–1376. [Google Scholar] [CrossRef]
- Peters, W.H.; Ranson, W.F. Digital image techniques on experimental stress analysis. Opt. Eng. 1982, 21, 427–431. [Google Scholar] [CrossRef]
Disclaimer/Publisher’s Note: The statements, opinions and data contained in all publications are solely those of the individual author(s) and contributor(s) and not of MDPI and/or the editor(s). MDPI and/or the editor(s) disclaim responsibility for any injury to people or property resulting from any ideas, methods, instructions or products referred to in the content. |
© 2025 by the authors. Licensee MDPI, Basel, Switzerland. This article is an open access article distributed under the terms and conditions of the Creative Commons Attribution (CC BY) license (https://creativecommons.org/licenses/by/4.0/).