Article

Mechanical Response and Failure Mechanisms of Block Caving Bottom Structures Under Dynamic Conditions Induced by Slope Rockfalls

1
Yunnan Diqing Non-Ferrous Metals Co., Ltd., Shangri-La 674400, China
2
School of Resources and Safety Engineering, Central South University, Changsha 410083, China
*
Authors to whom correspondence should be addressed.
Appl. Sci. 2025, 15(12), 6867; https://doi.org/10.3390/app15126867
Submission received: 12 May 2025 / Revised: 13 June 2025 / Accepted: 17 June 2025 / Published: 18 June 2025
(This article belongs to the Special Issue Advances and Techniques in Rock Fracture Mechanics)

Abstract

The stability of bottom structures in block caving mines is significantly challenged by impact loads generated from large rockfalls and ore collapses on slopes. This study aims to investigate the mechanical response and failure characteristics of bottom structures under such dynamic and cyclic loading conditions. Discrete element methods (DEMs) were employed to simulate the impact load amplitudes caused by large rockfalls on bottom structures. Specimens with identical mechanical properties to the bottom structure were fabricated at a 1:100 scale, based on the principle of similarity ratio tests. Three distinct types of impact loads were identified and analyzed: overall impact from large-scale slope collapses, localized impact from partial rock and soil mass collapses, and continuous multiple impacts from progressive slope failures. True triaxial tests were conducted to evaluate the mechanical response of the bottom structure under these loading scenarios. The results indicate that while overall and multiple impact loads from slope collapses do not lead to catastrophic failure of the bottom structure, severe damage occurs under a 100 m thickness of ore and large block impacts. Specifically, the inner walls of ore accumulation troughs peel off, and ore pillars between troughs fracture and fail. This study highlights the need for advanced experimental and numerical approaches to accurately predict the stability and failure modes of bottom structures under complex loading conditions.

1. Introduction

Block caving is a highly cost-effective underground mining method for large, low-grade ore bodies, relying on gravity-induced fragmentation and controlled draw [1]. The stability of the bottom structure, which includes critical components such as drawpoints, drifts, and pillars [2], is essential for the economic viability of this method. However, the dynamic nature of caving, particularly the impact of large block falls, poses significant challenges to structural integrity [3]. Recent failure of underground caverns in block caving mines, such as the Chuquicamata mine collapse in 2018 [4,5], have underscored the need for a better understanding of impact-induced damage mechanisms. Unlike traditional mining methods, block caving subjects the bottom structure to both static stresses (from overburden pressure) and dynamic loads (from falling blocks) [6,7,8]. This dual-loading scenario makes conventional stability analyses insufficient, necessitating advanced experimental and numerical approaches [9,10].
The bottom structure must withstand three types of loads: static stress from the overlying caved material [11,12], dynamic impacts from large blocks (up to several meters in size) [13], and cyclic degradation due to repeated loading–unloading during production [14]. Field observations and numerical studies suggest that progressive damage accumulation (e.g., pillar spalling, drift convergence) often leads to sudden collapses [15]. For instance, at the Northparkes mine in Australia, unexpected block falls caused severe damage to drawpoints, highlighting the need for predictive models. Sun, Zhou [16] examines the flow characteristics of caved ore and rock under the influence of multiple coarse particles through physical and numerical tests, highlighting the importance of interparticle interactions, void fractions, and force chains in shaping the isolated movement zone. Zhao, Wu [17] investigates the influence of pre-existing joints on rockfall fragmentation during impact using the discrete element method, revealing that joint geometry and spatial position significantly affect fragmentation, impact force, and kinetic energy. Despite these risks, most existing studies focus on static stability [18,19], while dynamic and cyclic loading effects remain understudied [20,21]. The damage to the bottom structure is usually caused by the impact of large rockfalls on the slope. Large block falls generate high-energy impacts, inducing stress waves that propagate through the bottom structure [22]. Laboratory experiments using split Hopkinson pressure bars (SHPB) have quantified single-impact rock fragmentation [23], but repetitive impacts (simulating actual mining conditions) are rarely studied [24]. Existing research faces several unresolved issues, such as the effect of cyclic loads on the long-term strength of pillars and drifts, and the inability to clearly identify critical stresses for different failure modes [25,26]. Additionally, the impact of dynamic loads is often overlooked, which may lead to a potential underestimation of risks.
True triaxial tests have been widely used in mining applications [27]. Conventional triaxial tests (σ1 > σ2 = σ3) cannot replicate the true stress anisotropy (σ1 ≠ σ2 ≠ σ3) in block caving environments [28]. True triaxial testing has emerged as a superior method for simulating mining-induced stresses [29], with applications in pillar bursting [30], excavation damage zones [31], and rock fracture propagation [32,33]. However, no prior study has applied true triaxial testing to investigate cyclic block impacts on bottom structures. This gap limits the accuracy of numerical models (e.g., FEM, DEM) used in mine design. This paper addresses the deficiencies of the aforementioned research. Firstly, a large rockfall impact test on the bottom structure of multiple funnels under true triaxial stress was conducted. The test adopted different types of impact loads to study the mechanical response of the bottom structure. The deformation characteristics of the arch top, edge sides, and the area near the ore outlet were monitored in real-time using strain gauges. Ultimately, the failure modes of the bottom structure under overall impact, local bulk impact, and continuous multiple impact loads were determined.

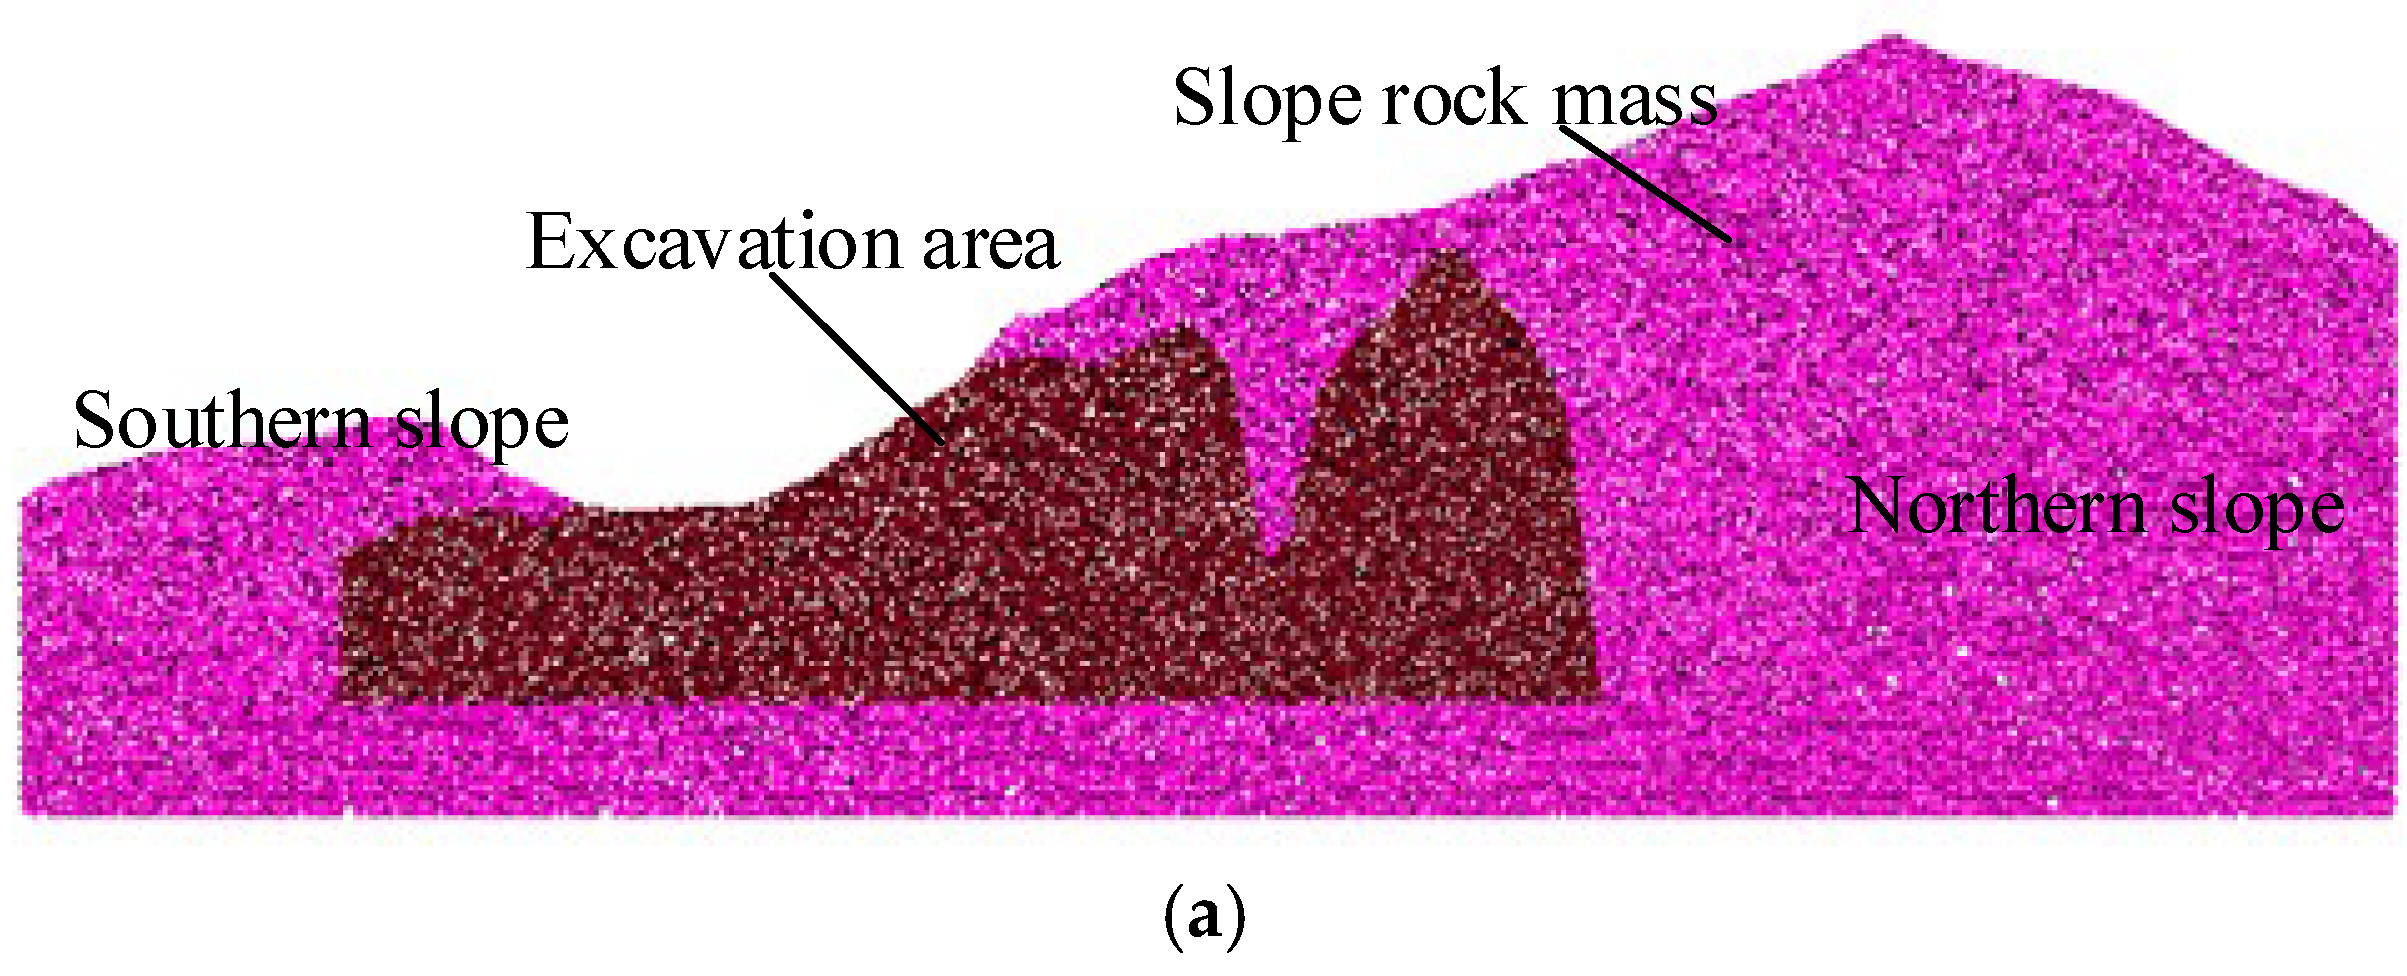
2. Test Method Aring Capacity of Bottom Structure

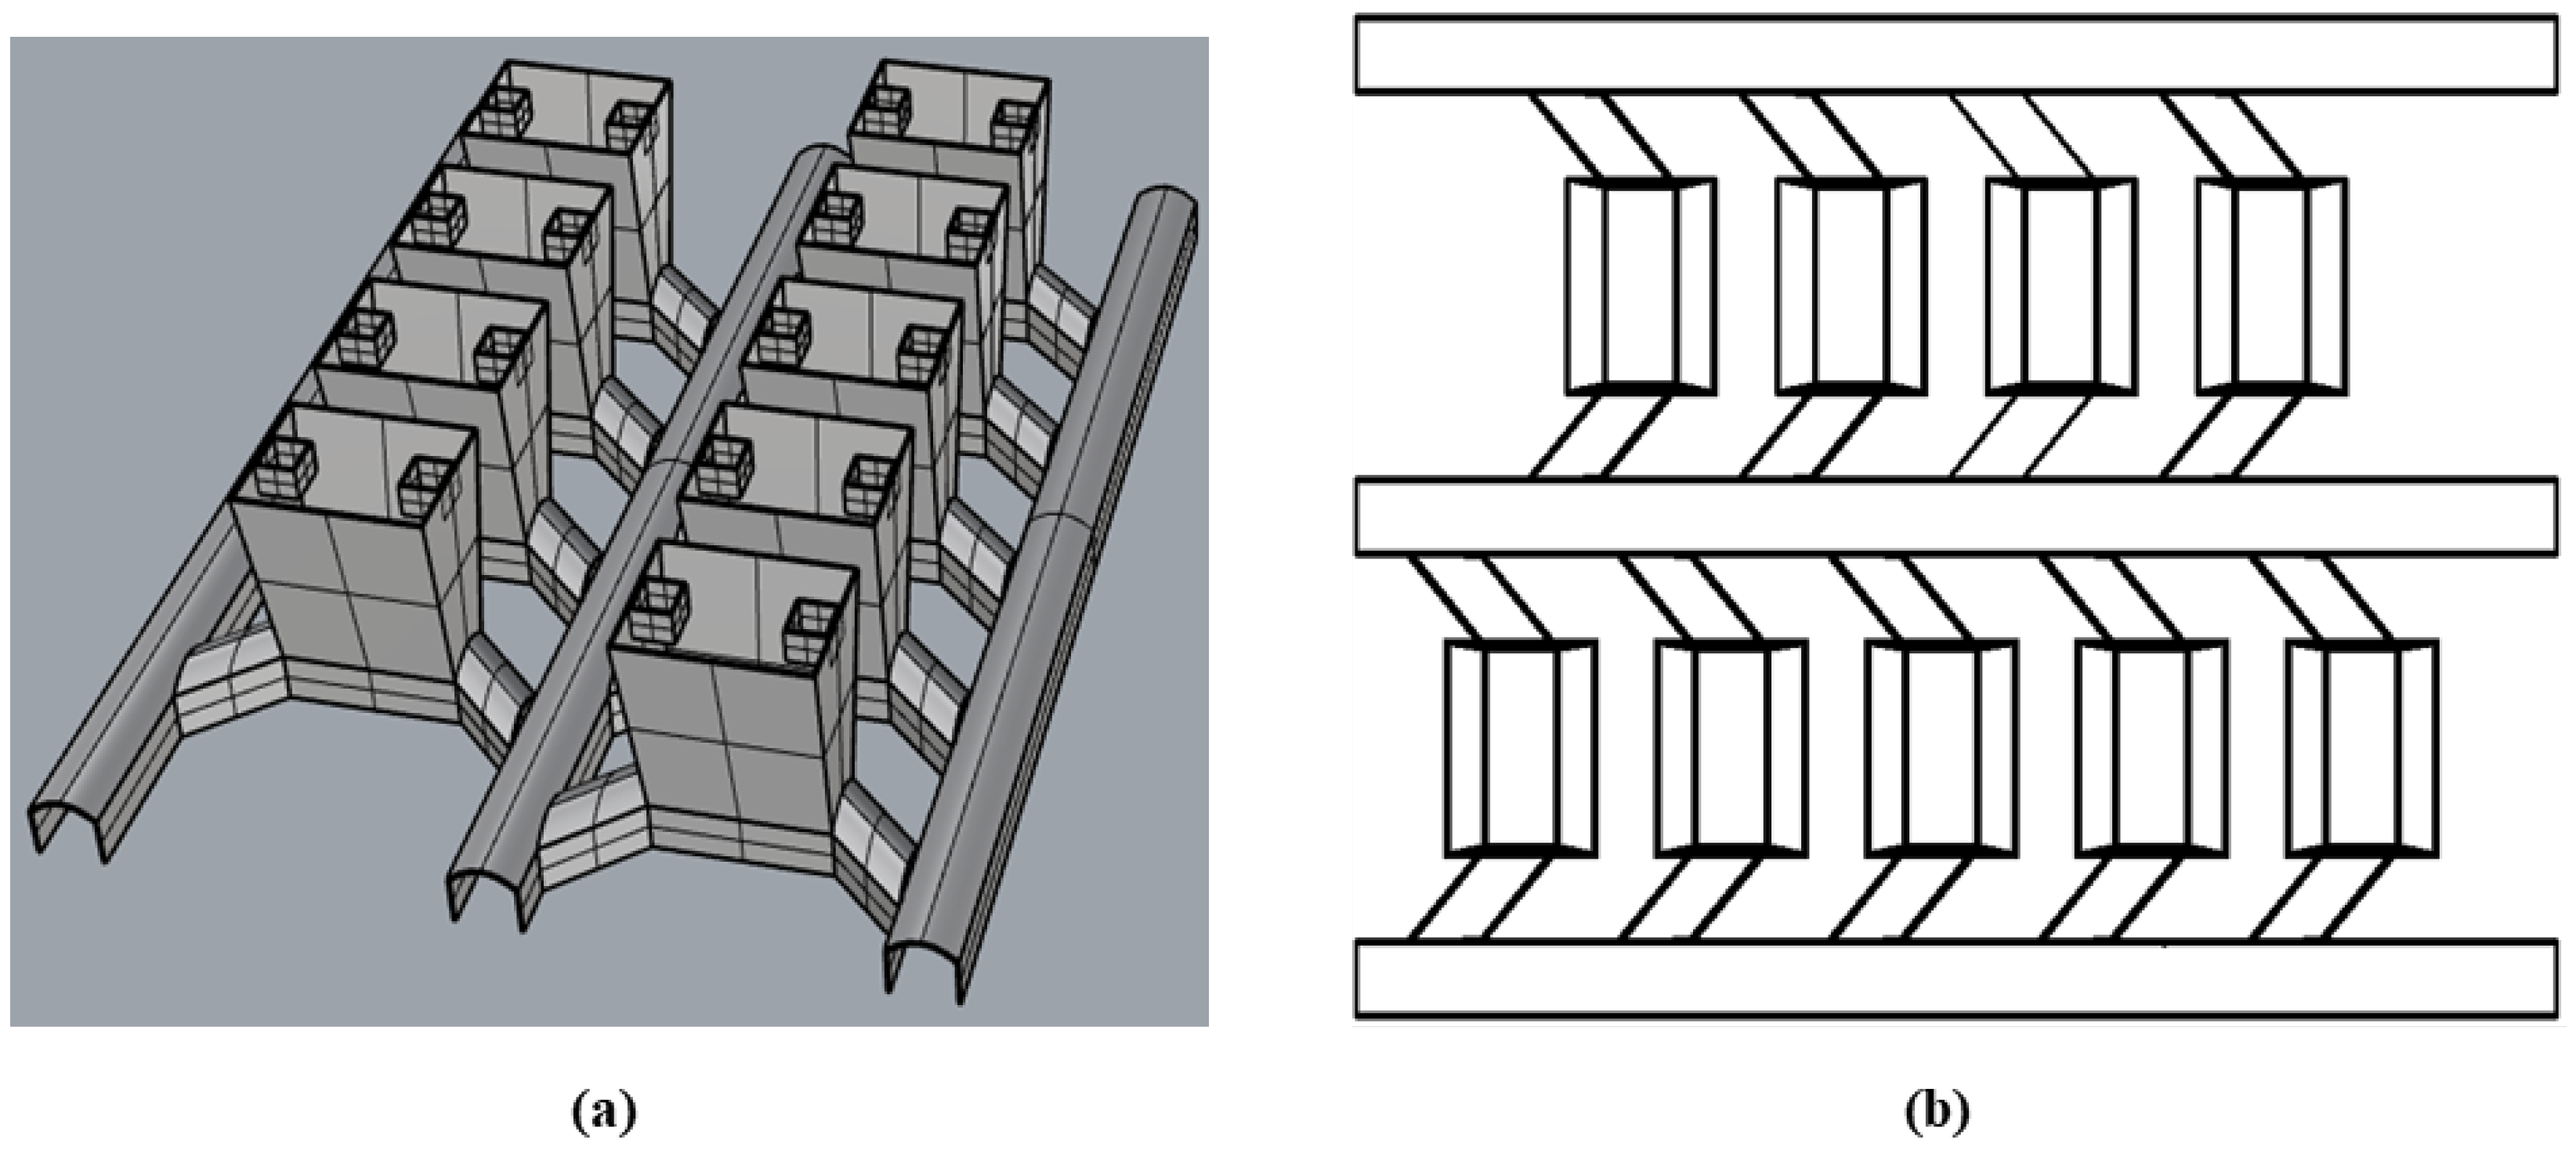
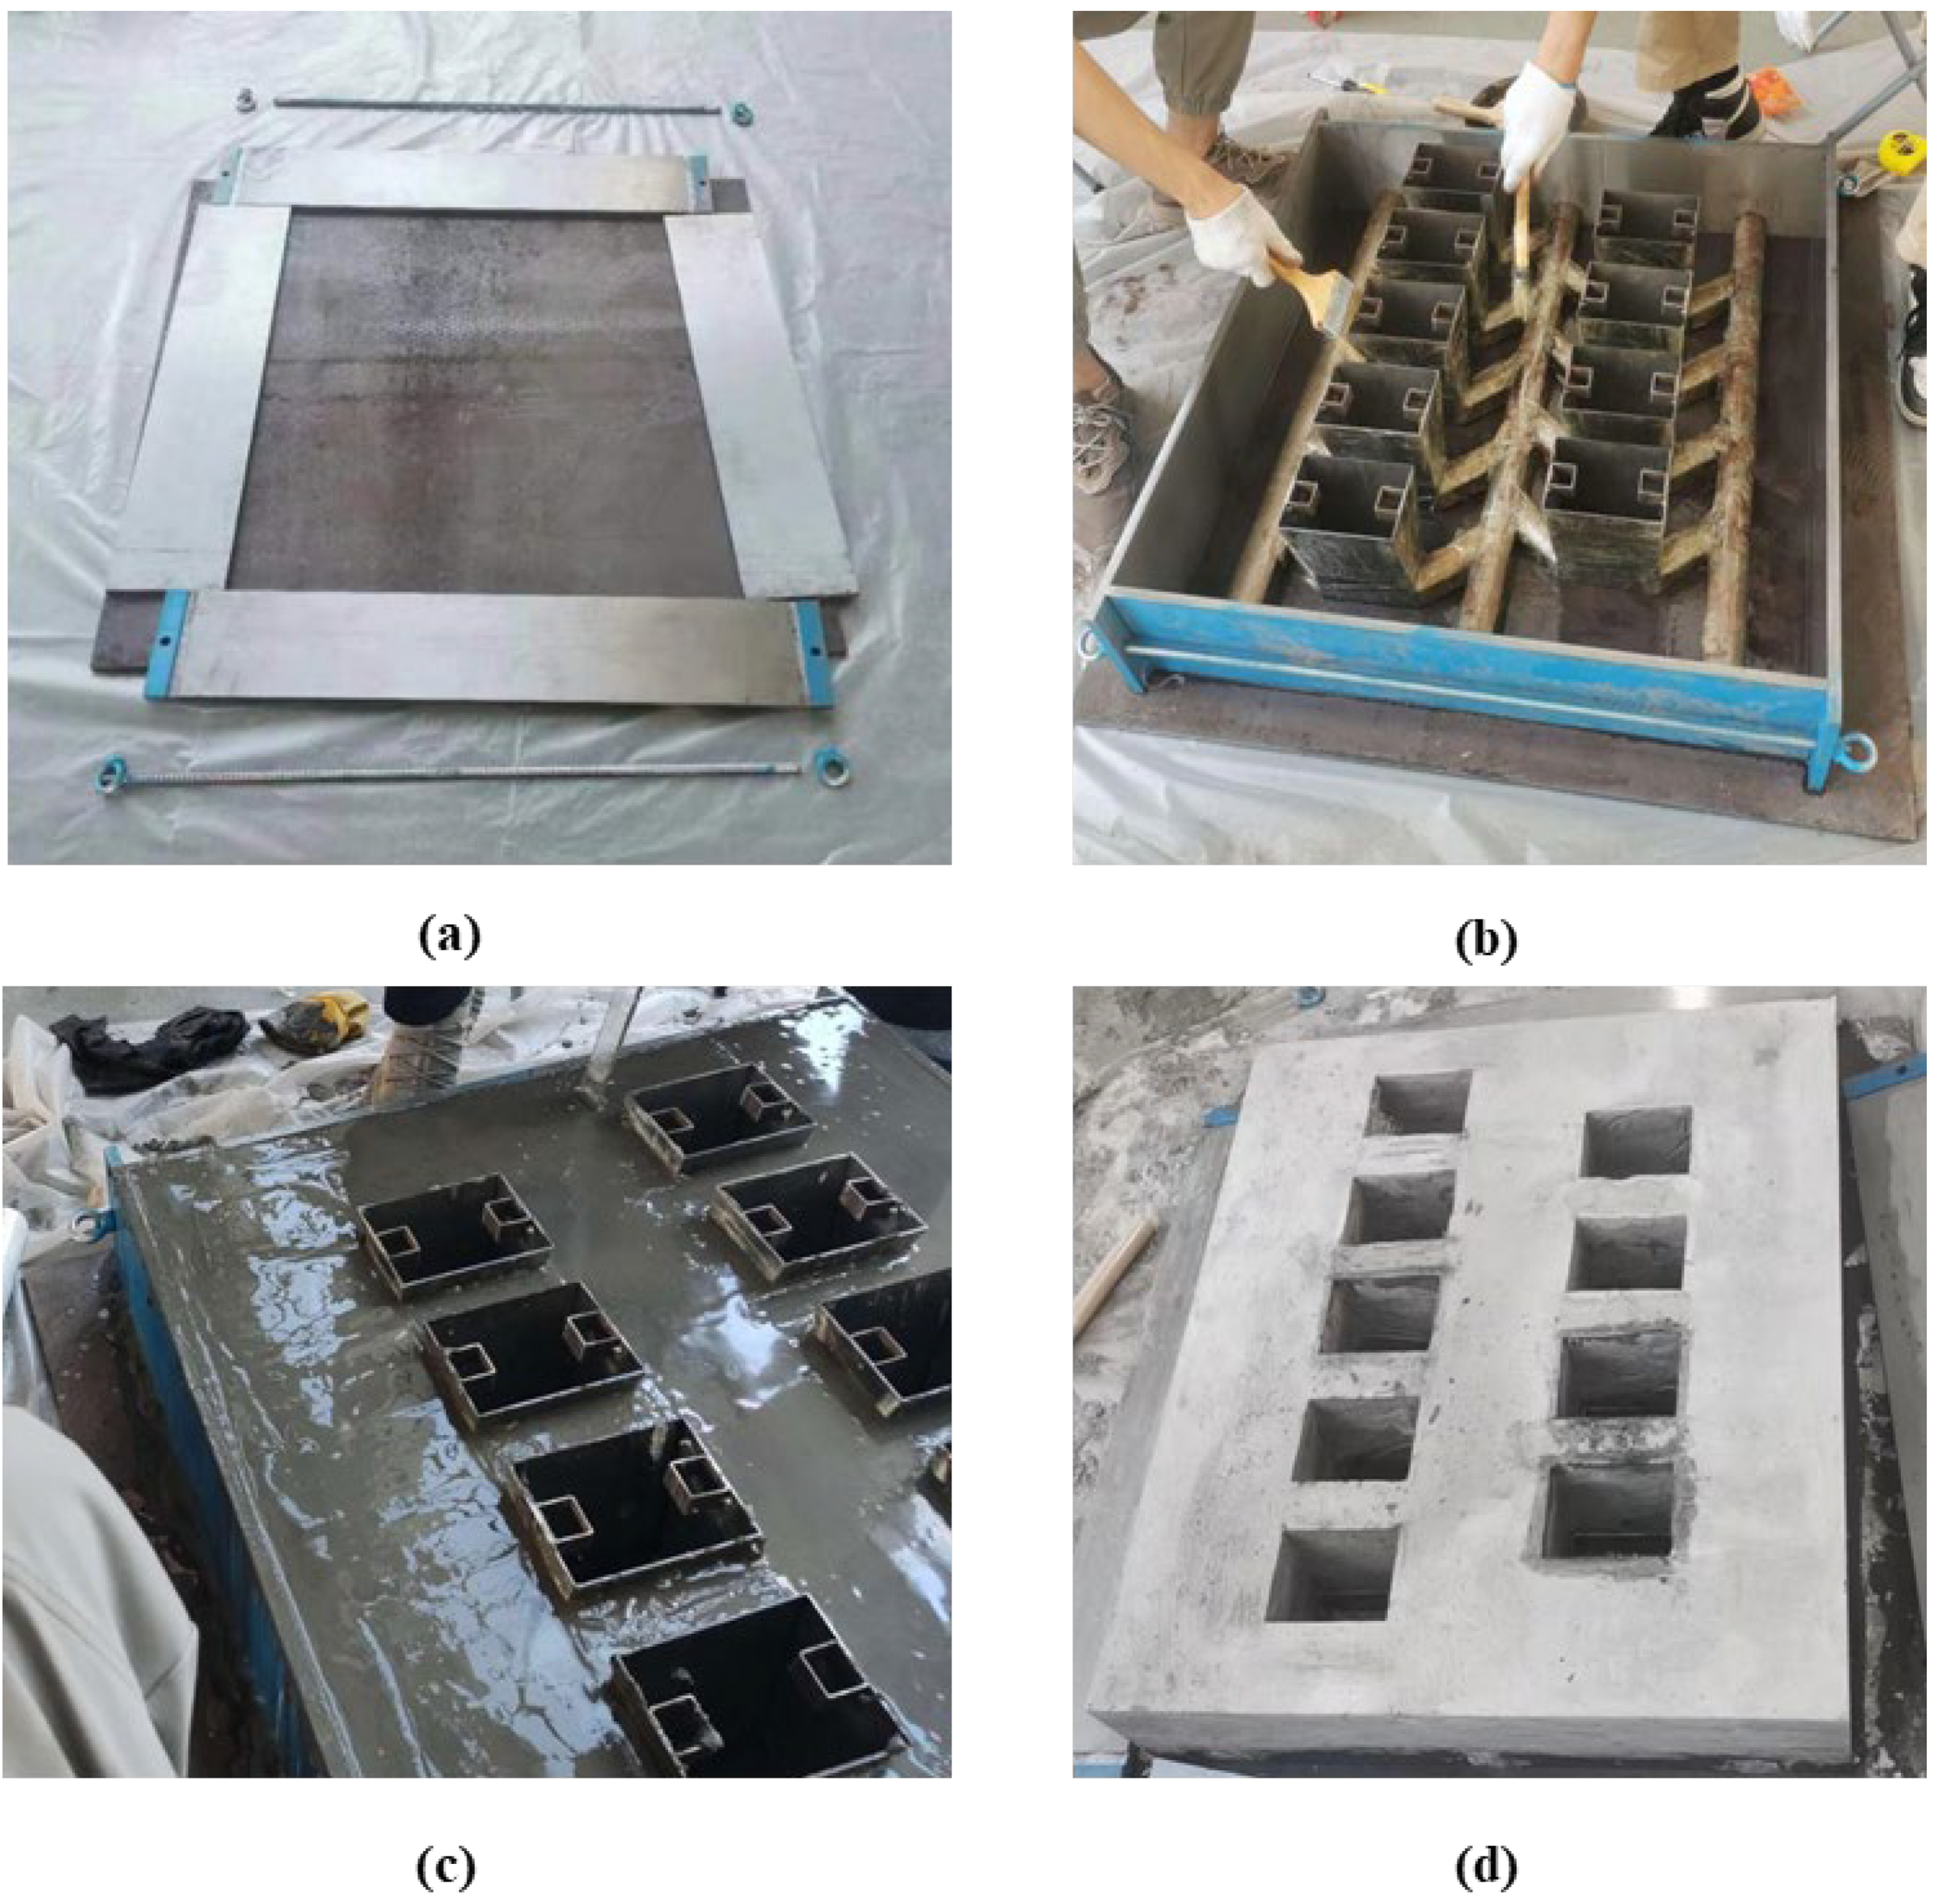
2.1. Bottom Structure Mold Design

The design and fabrication of the bottom structure mold are critical for accurately simulating the mechanical behavior of the actual bottom structure under various loading conditions. The mold must replicate the essential features of the bottom structure while adhering to the principles of geometric similarity and material properties. The inner frame of the bottom structure model was designed to include critical components such as the roadway and the ore accumulation troughs. The layout of the inner frame is illustrated in Figure 1, which includes three vein lanes with a length of 0.8 m. The height of the actual bottom structure is 16 m, and the corresponding height of the model is 0.16 m, adhering to a geometric similarity ratio of 1:100. The angle between the vein roadway and the ore extraction approach is set at 55 degrees, which is a critical parameter for accurately simulating the stress paths and load distributions in the bottom structure. The inner frame consists of three vein tunnels and nine ore accumulation troughs, scaled down according to the 1:100 ratio. The dimensions of the ore accumulation troughs and the roadway are carefully scaled to ensure that the model accurately represents the spatial relationships and interactions between these components. This design allows for the precise monitoring of stress and deformation characteristics during the experimental tests.
The fabrication process of the large-scale models involves several critical steps to ensure the accuracy and reliability of the experimental results, shown in Figure 2. The slurry is prepared according to a predetermined ratio, and the external frame and internal mold are assembled. The outer wall of the inner frame and the inner wall of the outer frame are coated with salad oil to facilitate easy demolding. The slurry is then poured into the gap between the outer frame and the inner frame. After 24 h, the polyore troughs are carefully extracted from the top of the exposed position. Subsequently, the model is maintained by regular watering to ensure adequate hydration and curing. Once the model has achieved sufficient hardness, the demolding process for the remaining part of the inner frame begins. To ensure that the model accurately represents the mechanical behavior of the actual bottom structure, the geometric similarity ratio of 1:100 was strictly followed. This ratio ensures that the scaled-down model maintains the same stress distribution and deformation characteristics as the full-scale structure. Additionally, the material properties of the slurry were carefully selected to match the mechanical properties of the actual bottom structure. The formula for the cement mortar is cement/18-mesh sand/water = 5:3:2. The slurry was formulated to have a similar compressive strength, elastic modulus, and failure characteristics as the rock mass in the mine environment. To monitor the mechanical response of the bottom structure during the tests, strain gauges were strategically placed at critical locations on the model. These locations include the arch top, edge sides, and the area near the ore outlet. The strain gauges were attached to the model before the pouring process to ensure accurate and real-time monitoring of deformation characteristics. This instrumentation allows for the detailed analysis of stress and strain distributions under various loading conditions, providing valuable insights into the failure mechanisms of the bottom structure.

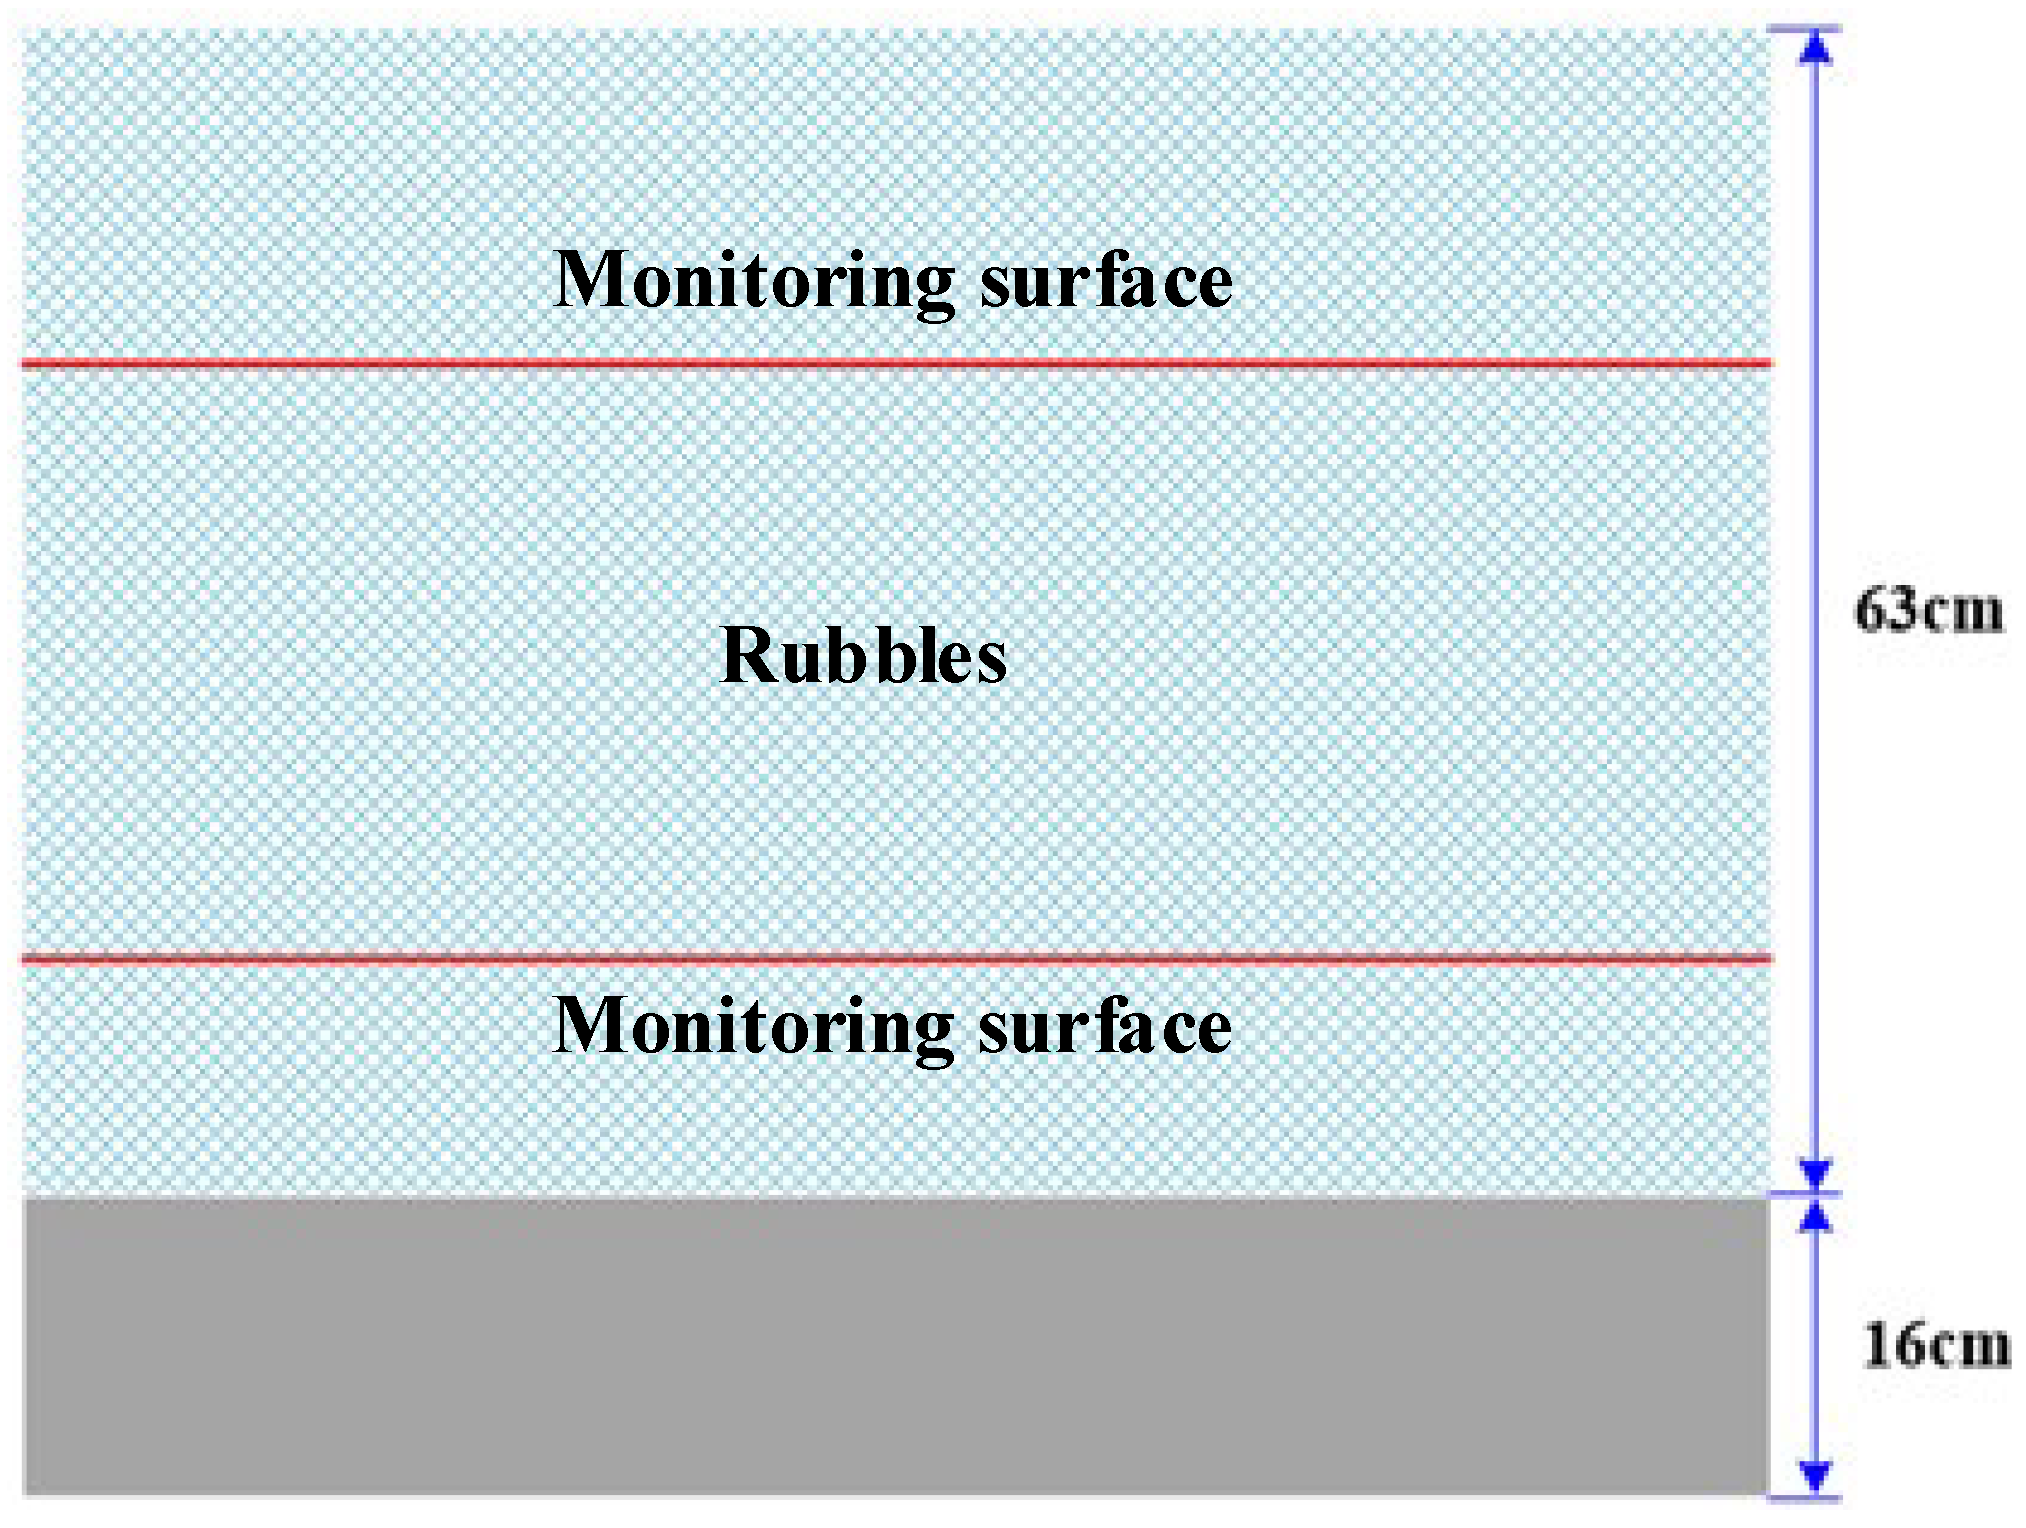
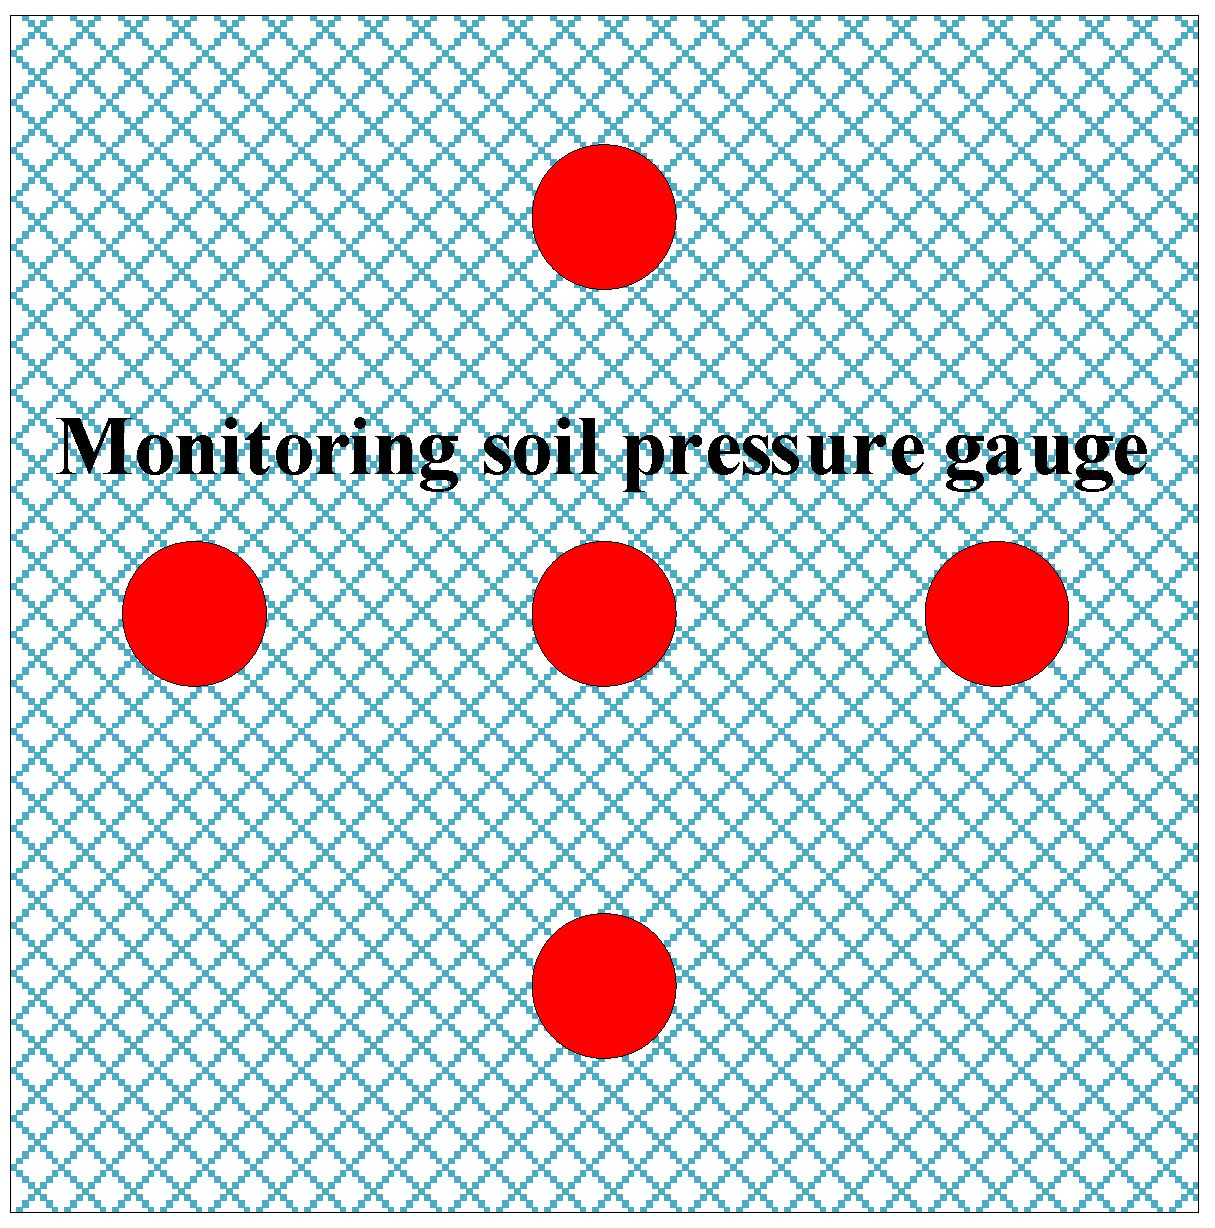
2.2. Experimental Loading Plan

In order to investigate the mechanical response of the bottom structure under impact loads, a systematic experimental loading plan was devised. The primary objective was to replicate the loading conditions that the bottom structure would experience during slope collapses in block caving mines. To achieve this, two monitoring surfaces were established within the rubble body above the bottom structure model, as depicted in Figure 3. The first monitoring surface, located 15 cm above the bottom structure model, and the second monitoring surface, positioned 45 cm from the top surface of the bottom structure, were strategically placed to capture the stress characteristics of the collapsing ore bulk. Each monitoring surface was equipped with five monitoring components, as illustrated in Figure 4. The layout of these components was meticulously designed to ensure comprehensive data collection. A central monitoring point was placed at the center of each monitoring surface, with the remaining four points evenly distributed near the edges, maintaining a distance of 15 cm from the sides. This arrangement facilitated the acquisition of stress change data within the granular body during the experimental process through an external data acquisition module.
The experimental loading plan was designed to simulate both static and dynamic loading conditions, reflecting the potential impact forces generated by high and steep slope collapses. To determine the appropriate loading modes and forces for different working conditions, discrete element numerical simulations were conducted based on various profiles of the Pulang copper mine. These simulations aimed to identify the maximum slump–impact load and waveform under different profiles. The experimental research on the bearing capacity of the bottom structure was then carried out based on the obtained waveform, ensuring that the loading conditions were representative of real-world mining scenarios.

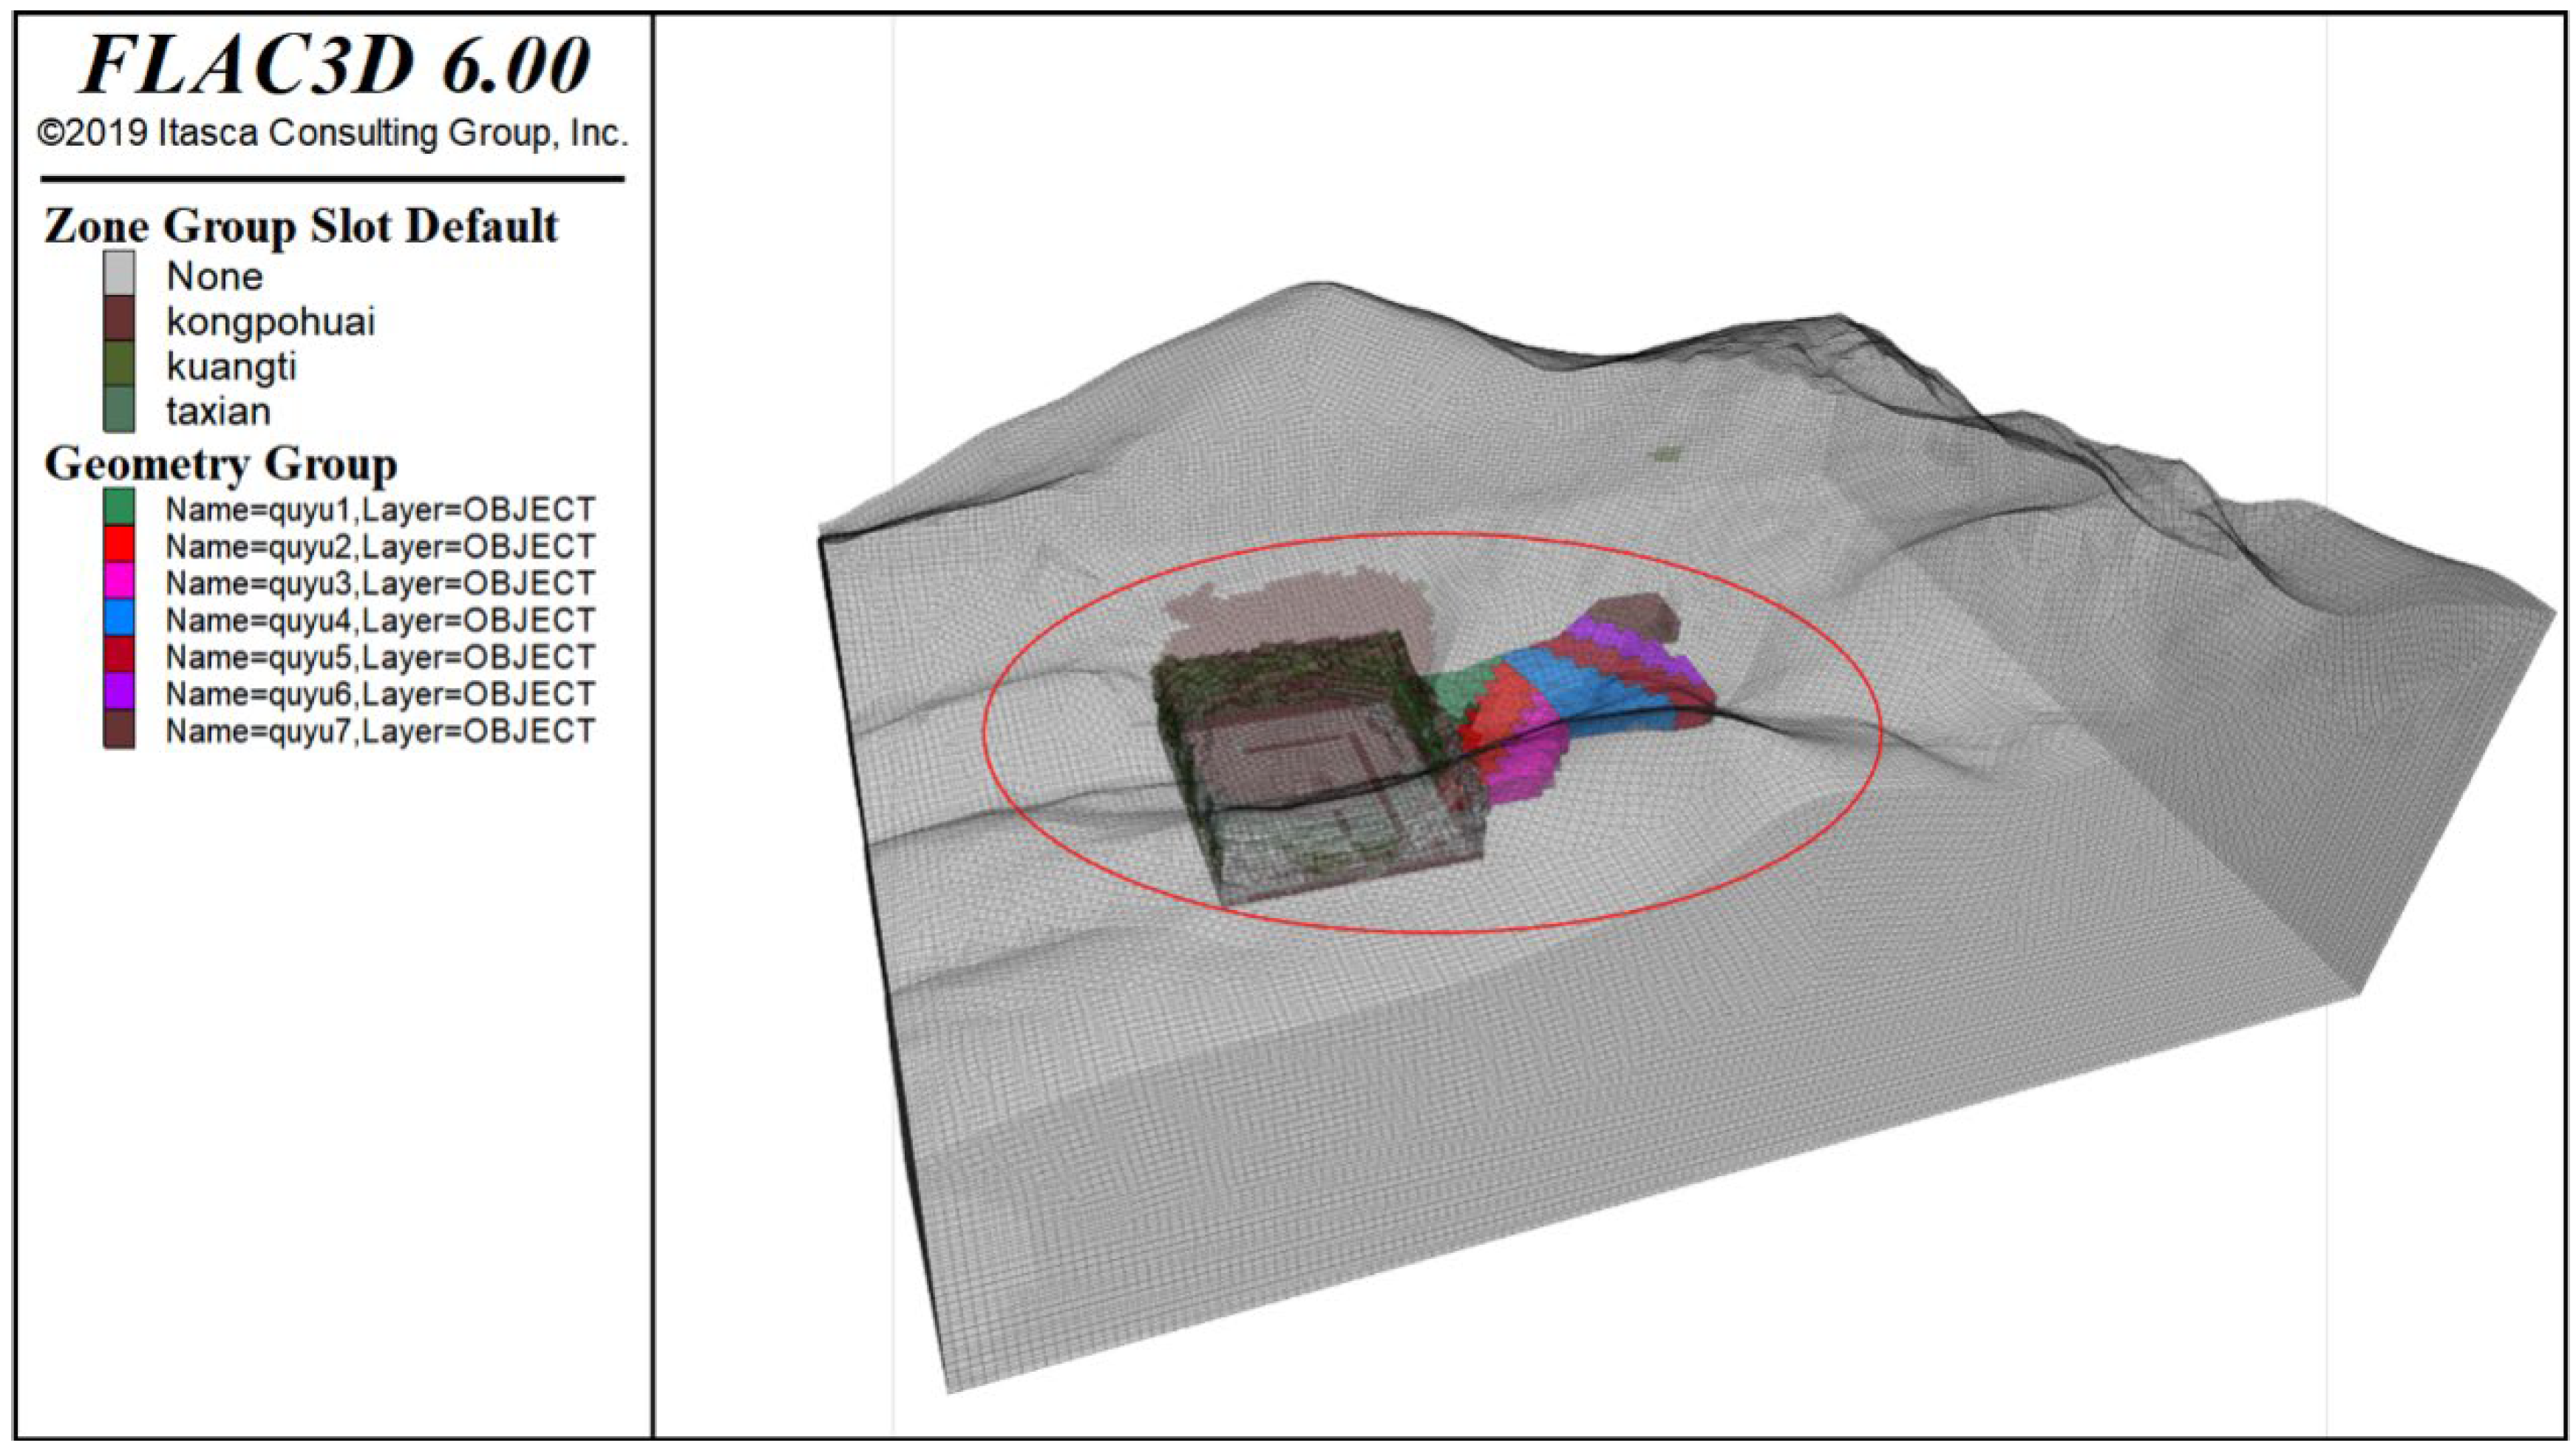
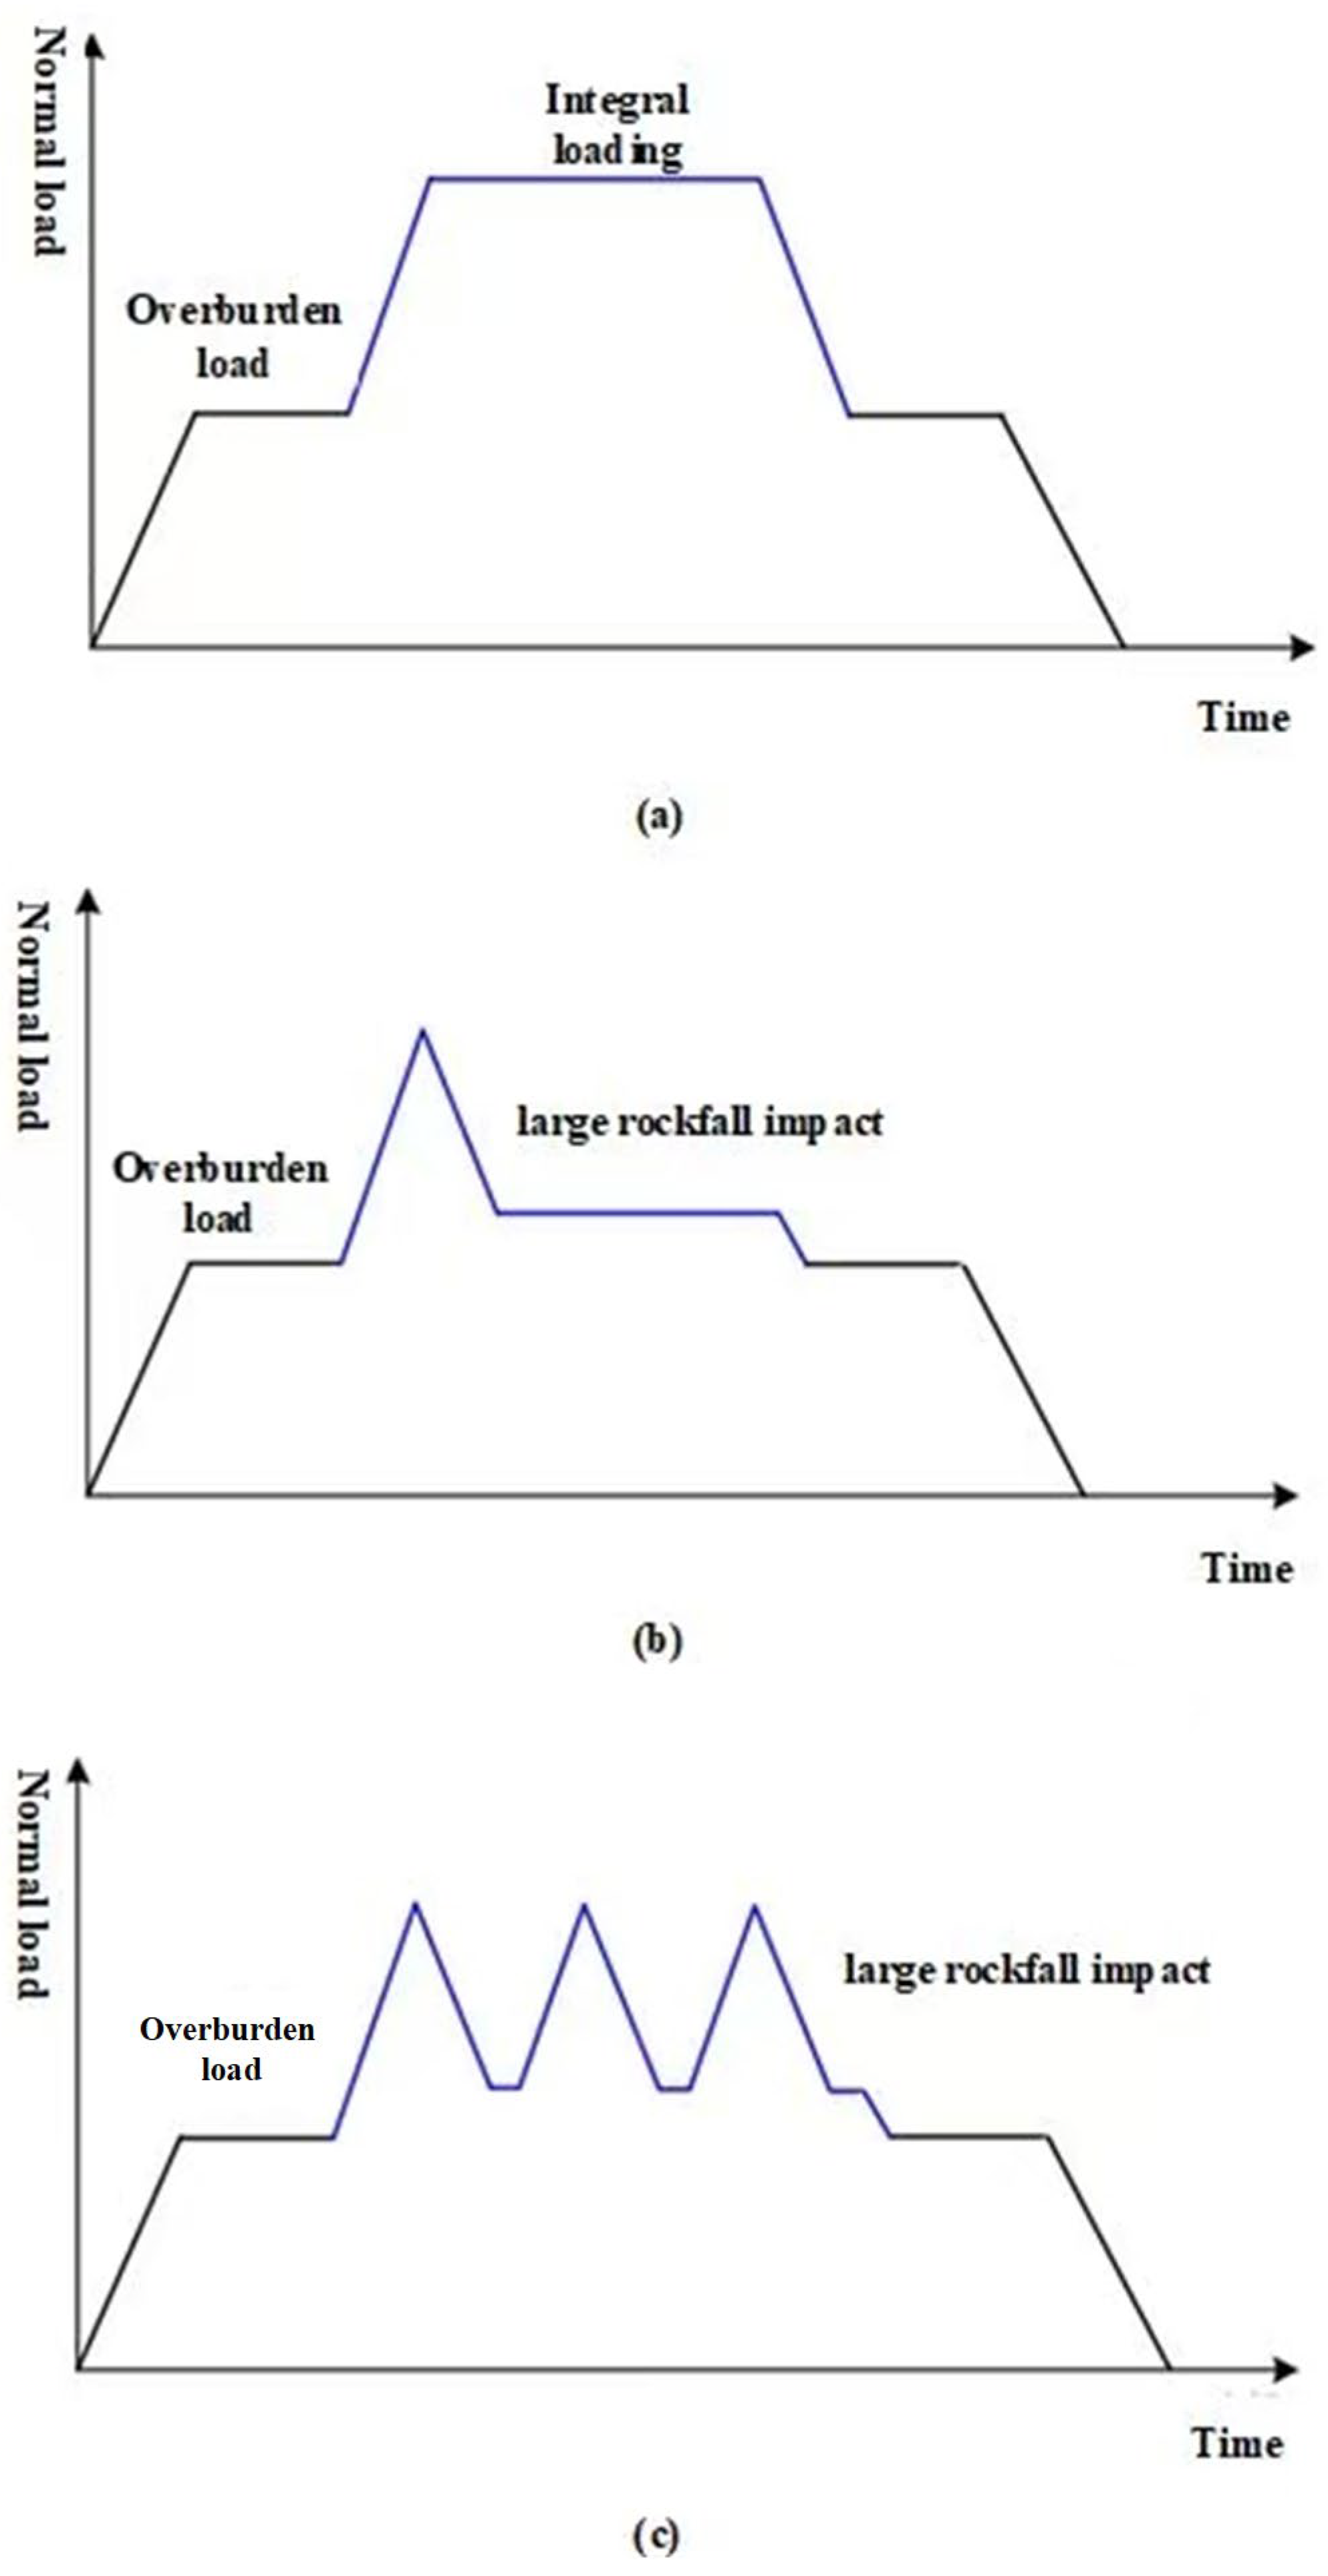
3. Simulation of Slope Collapse Impact Load

After modeling the overall slope and ore body model with Rhino, the two-dimensional section model of three types of working conditions is established by three types of horizontal, longitudinal, and oblique plane cutting methods. After importing PFC2D, ore drawing and bottom drawing are equivalent in the three types of profiles according to the steps shown in the red circle in Figure 5 (the left part is the ore body, the right part is the bottom drawing).
The general simulation steps are as follows: model introduction, lithology grouping, parameter assignment, drawing excavation, and stress monitoring. In order to meet the practice of ore drawing engineering, in the parameter assignment, we specially reinforced the bottom trough, applied a higher bonding force, and introduced the subsidence area, that is, the bonding force of the ore body in the collapse area is 0. The excavation steps of ore drawing include excavation in the first mining area, bottom drawing, and ore drawing. The excavation height of the first mining area is a one-time full excavation, the bottom drawing height is 15 m, and the ore drawing height is 8 m once until it becomes unstable. In stress monitoring, we set a measurement circle near the bottom groove to monitor the impact stress of the collapse of the upper rock mass. It is worth noting that even after all the ore bodies are discharged, there will still be some non-orebody rock mass remaining in the upper part of the bottom groove, which is also the case in actual engineering. The overlying non-orebody rock mass will buffer the impact force of the collapsed rock mass to a certain extent.

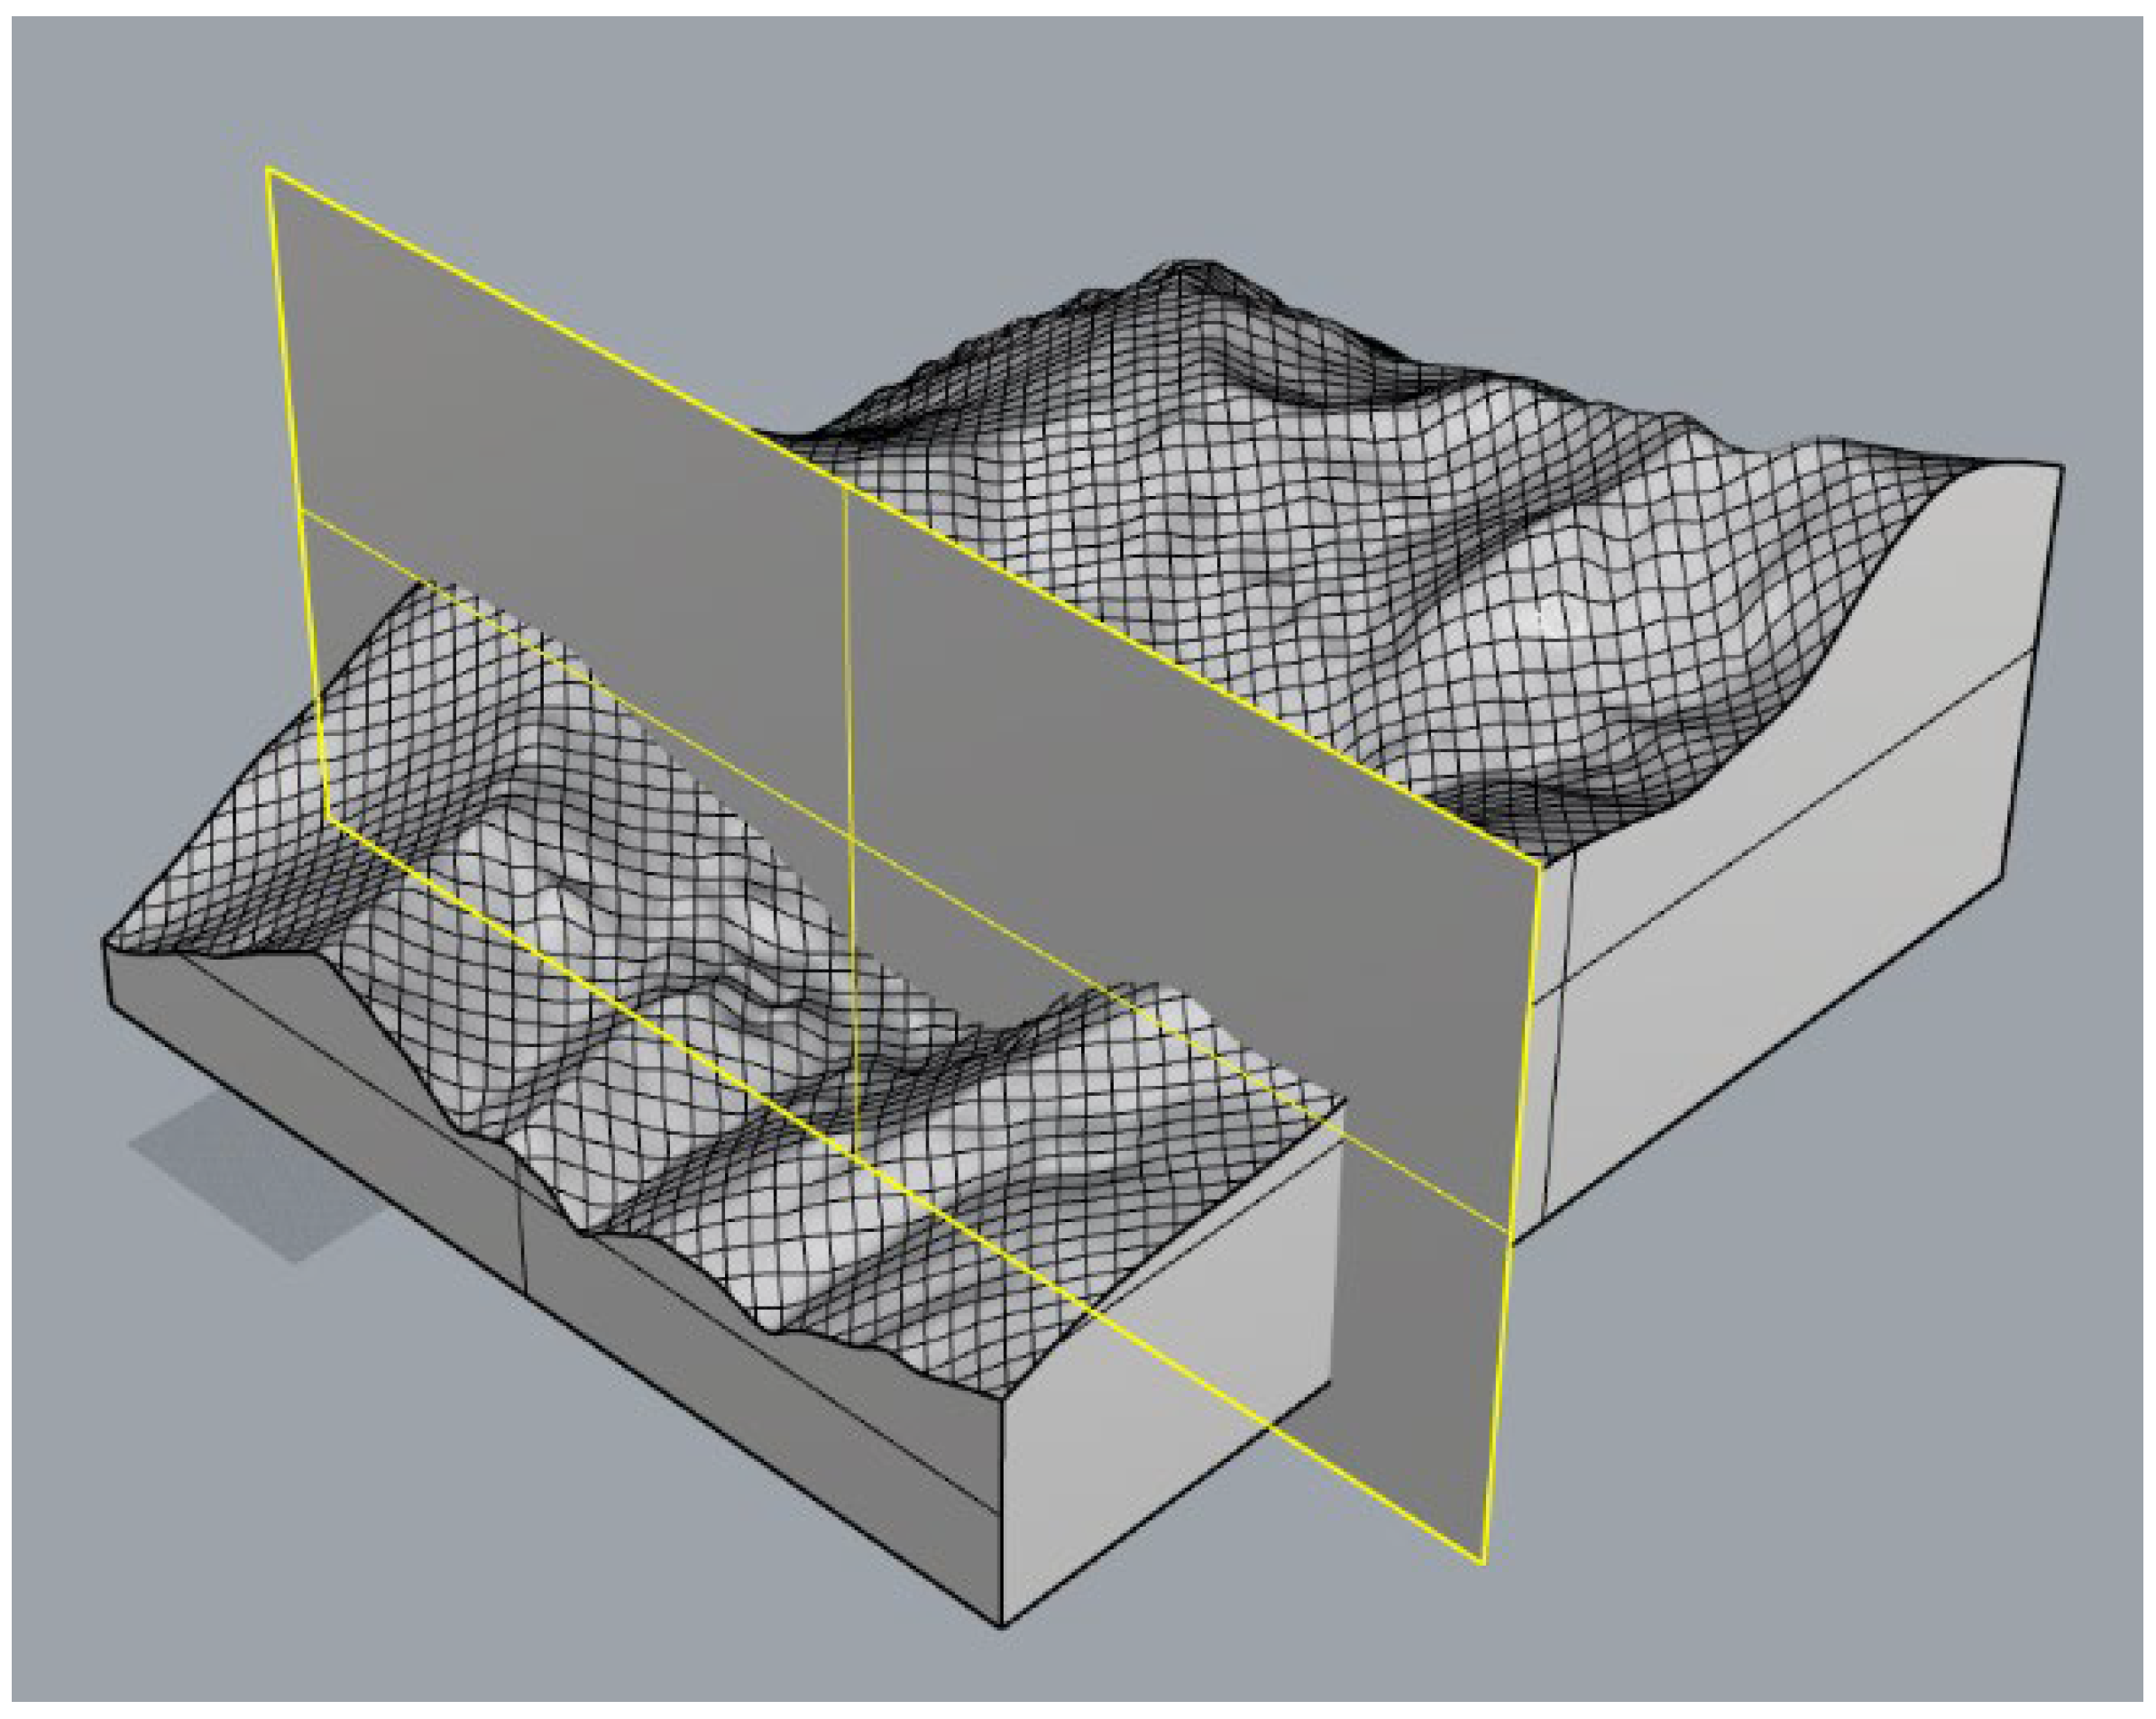
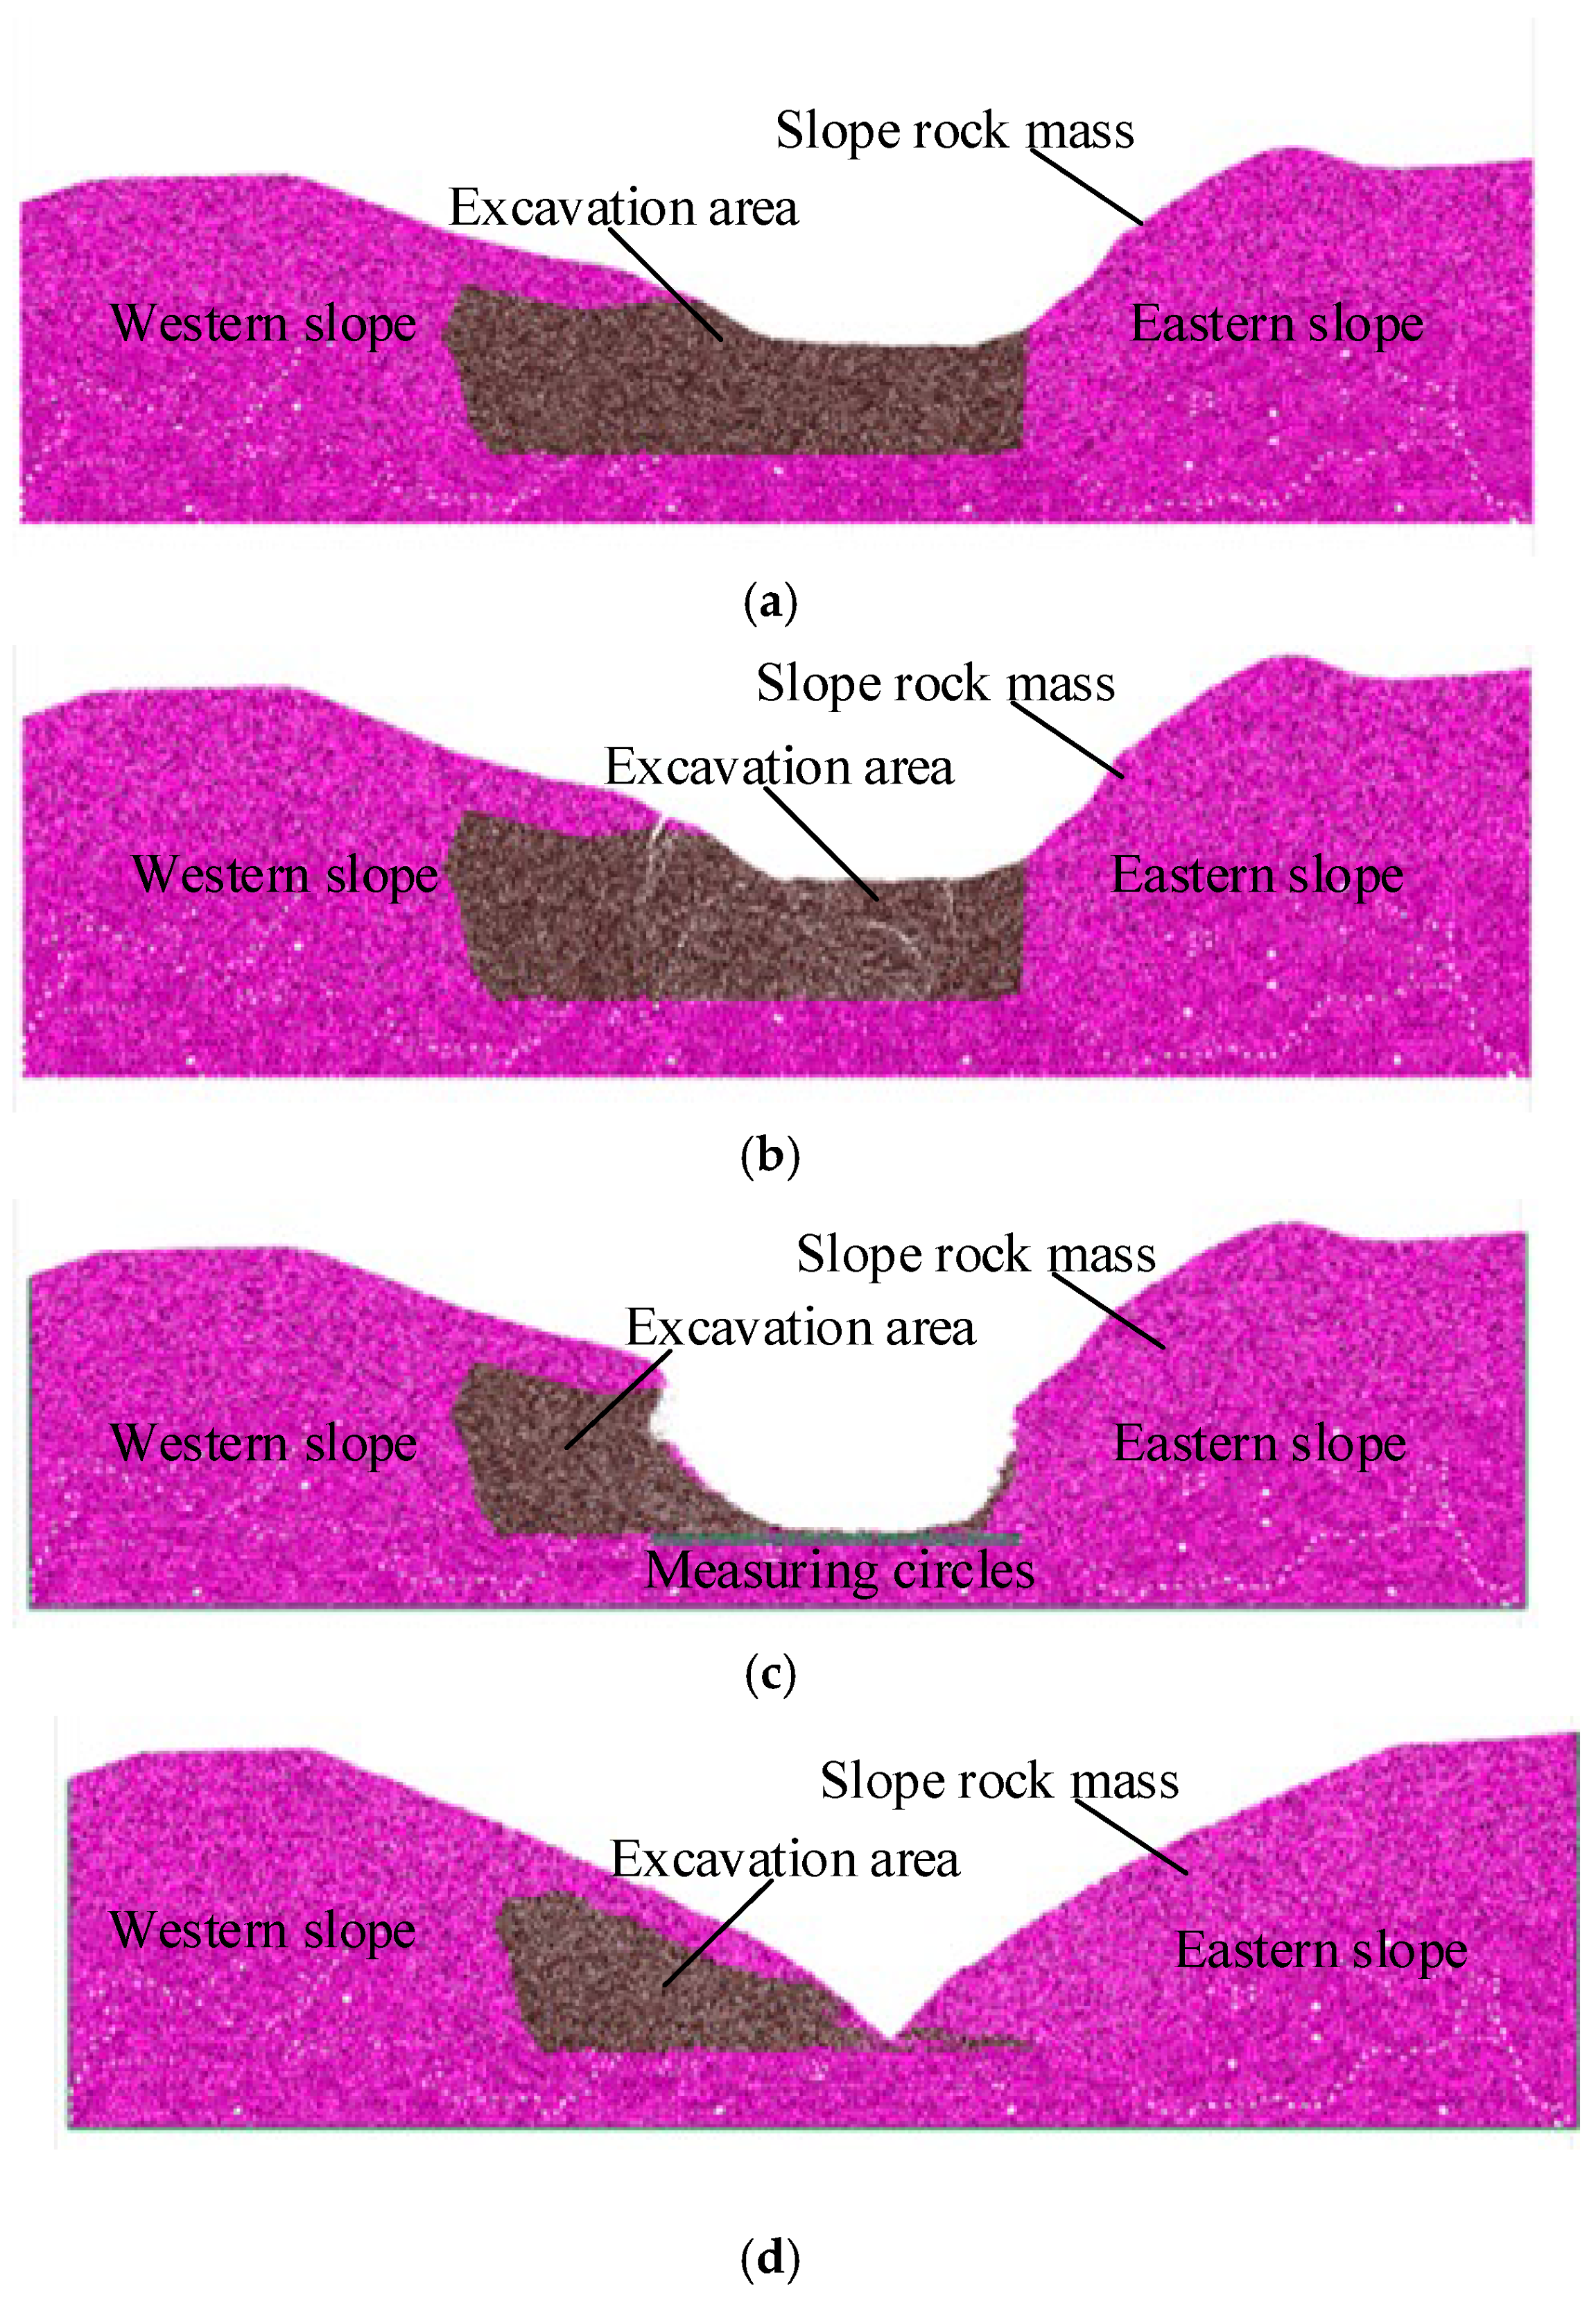
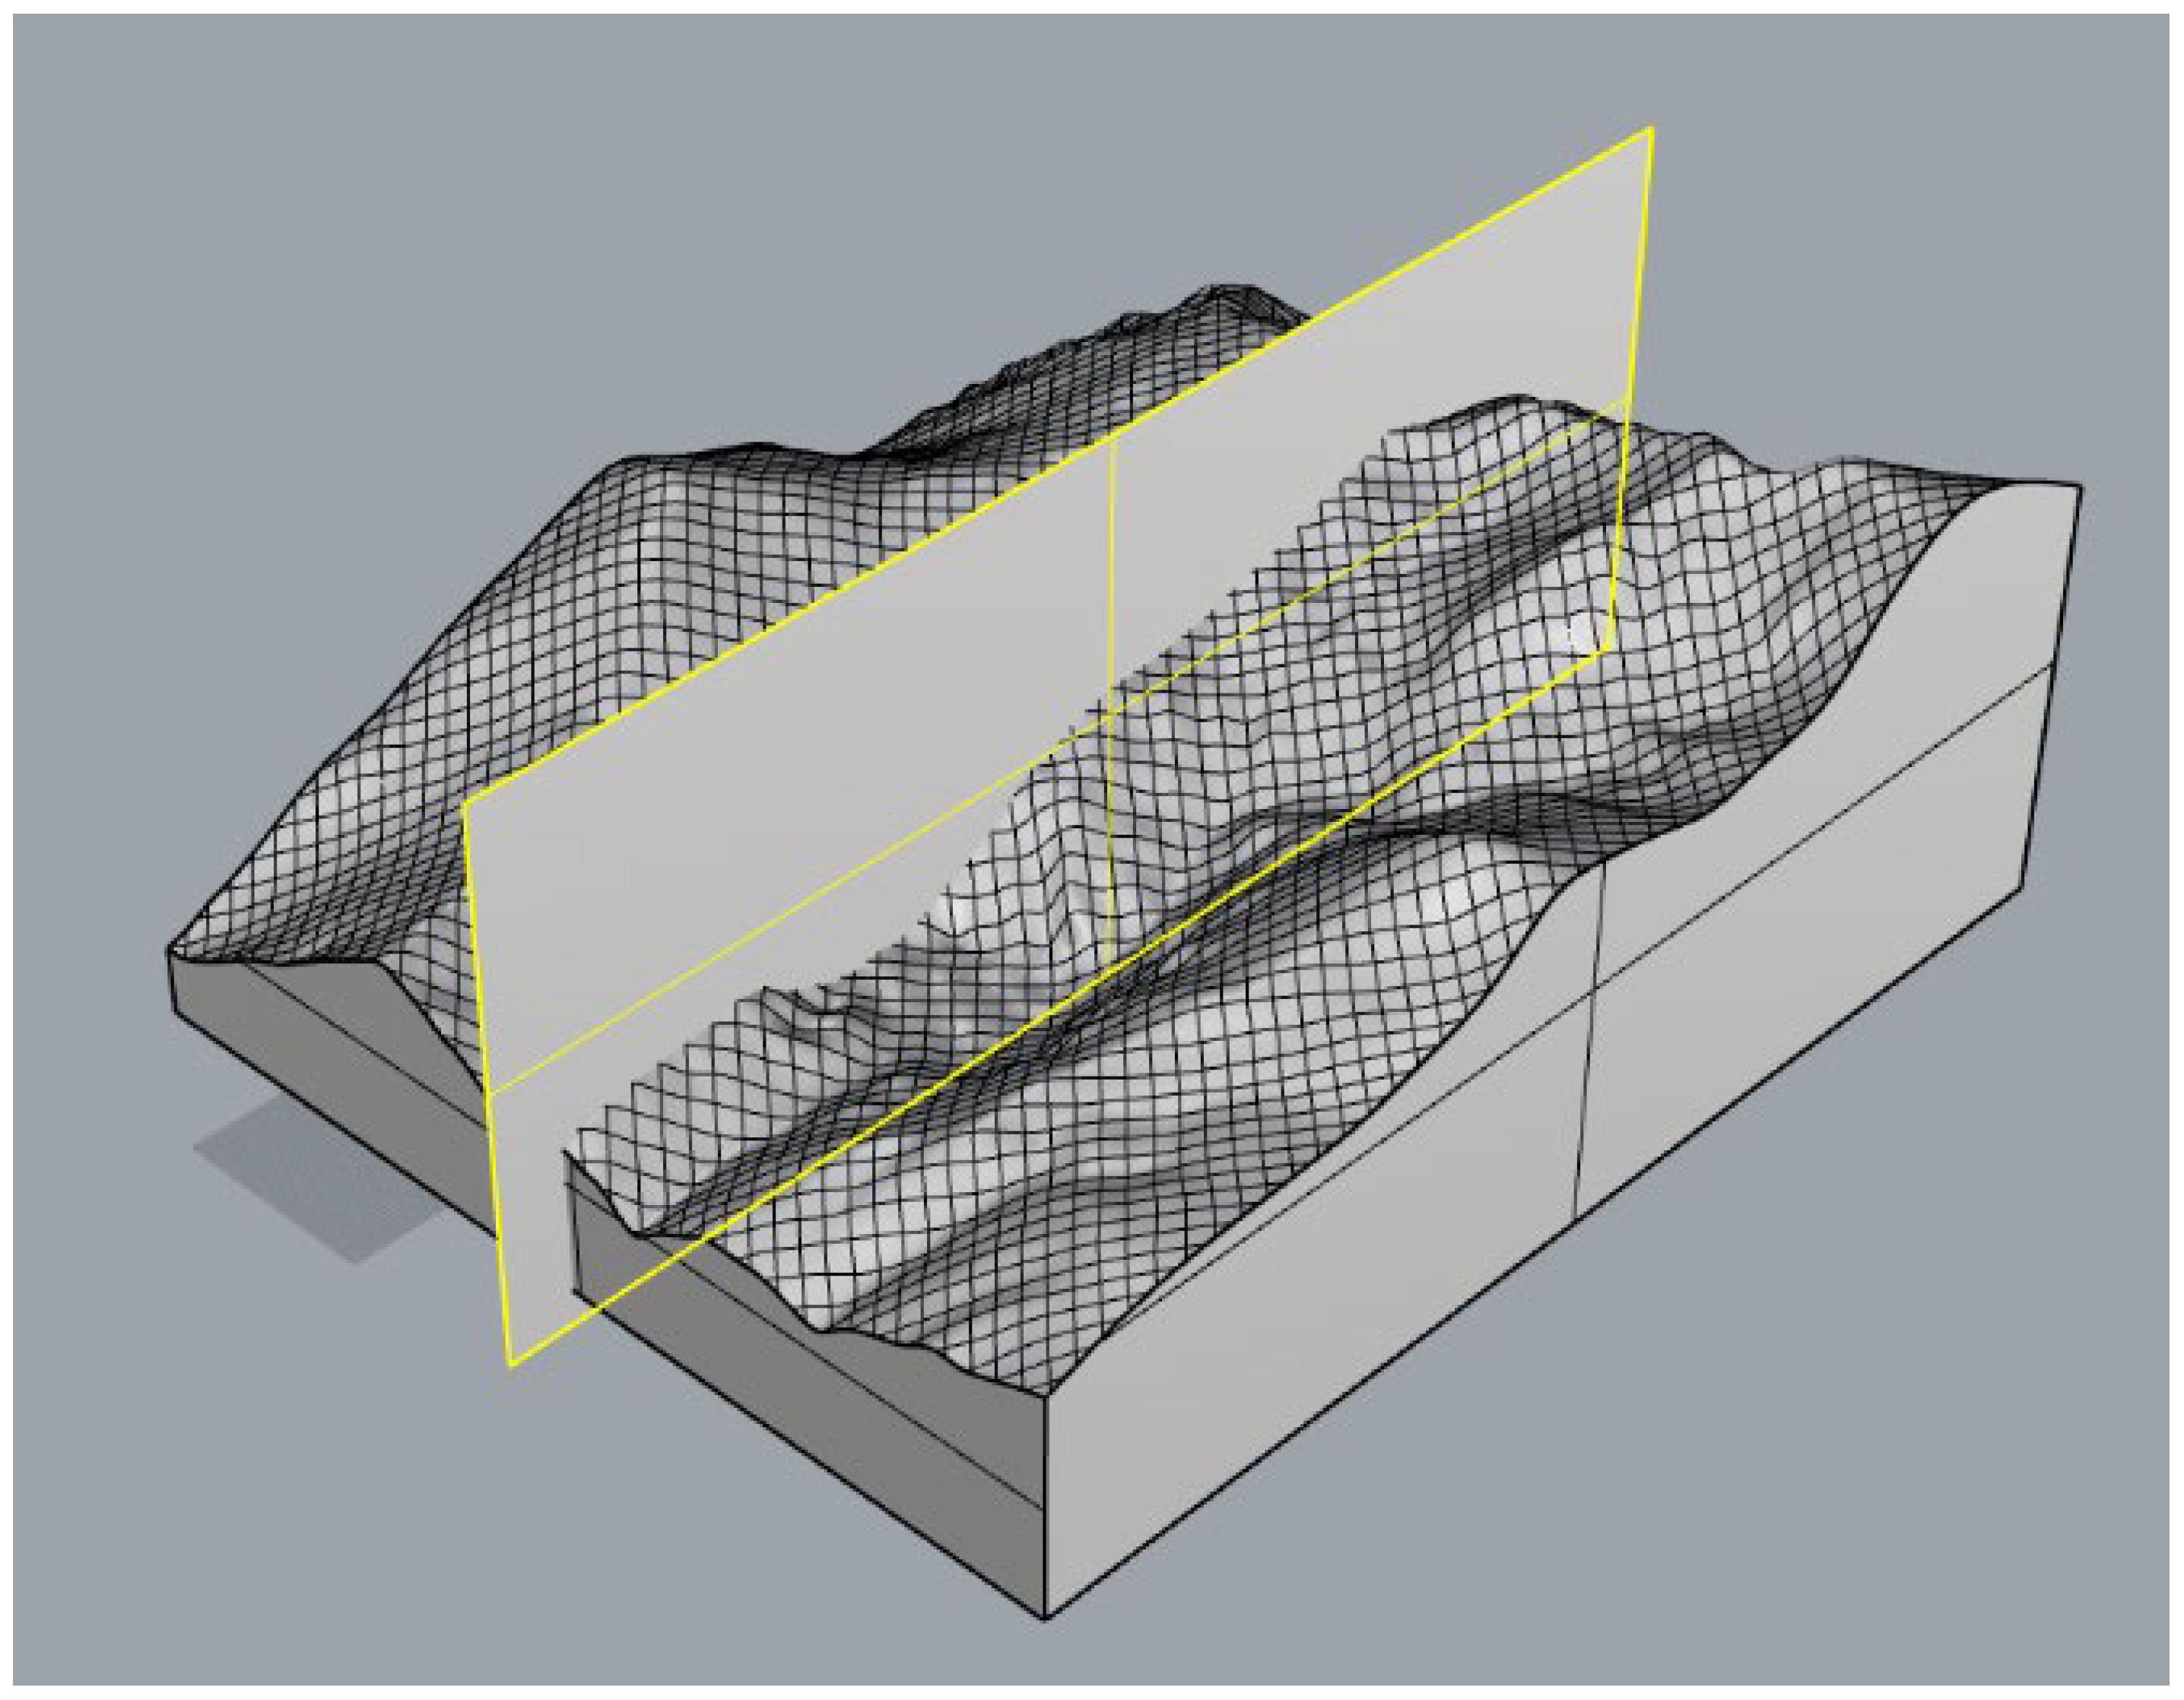
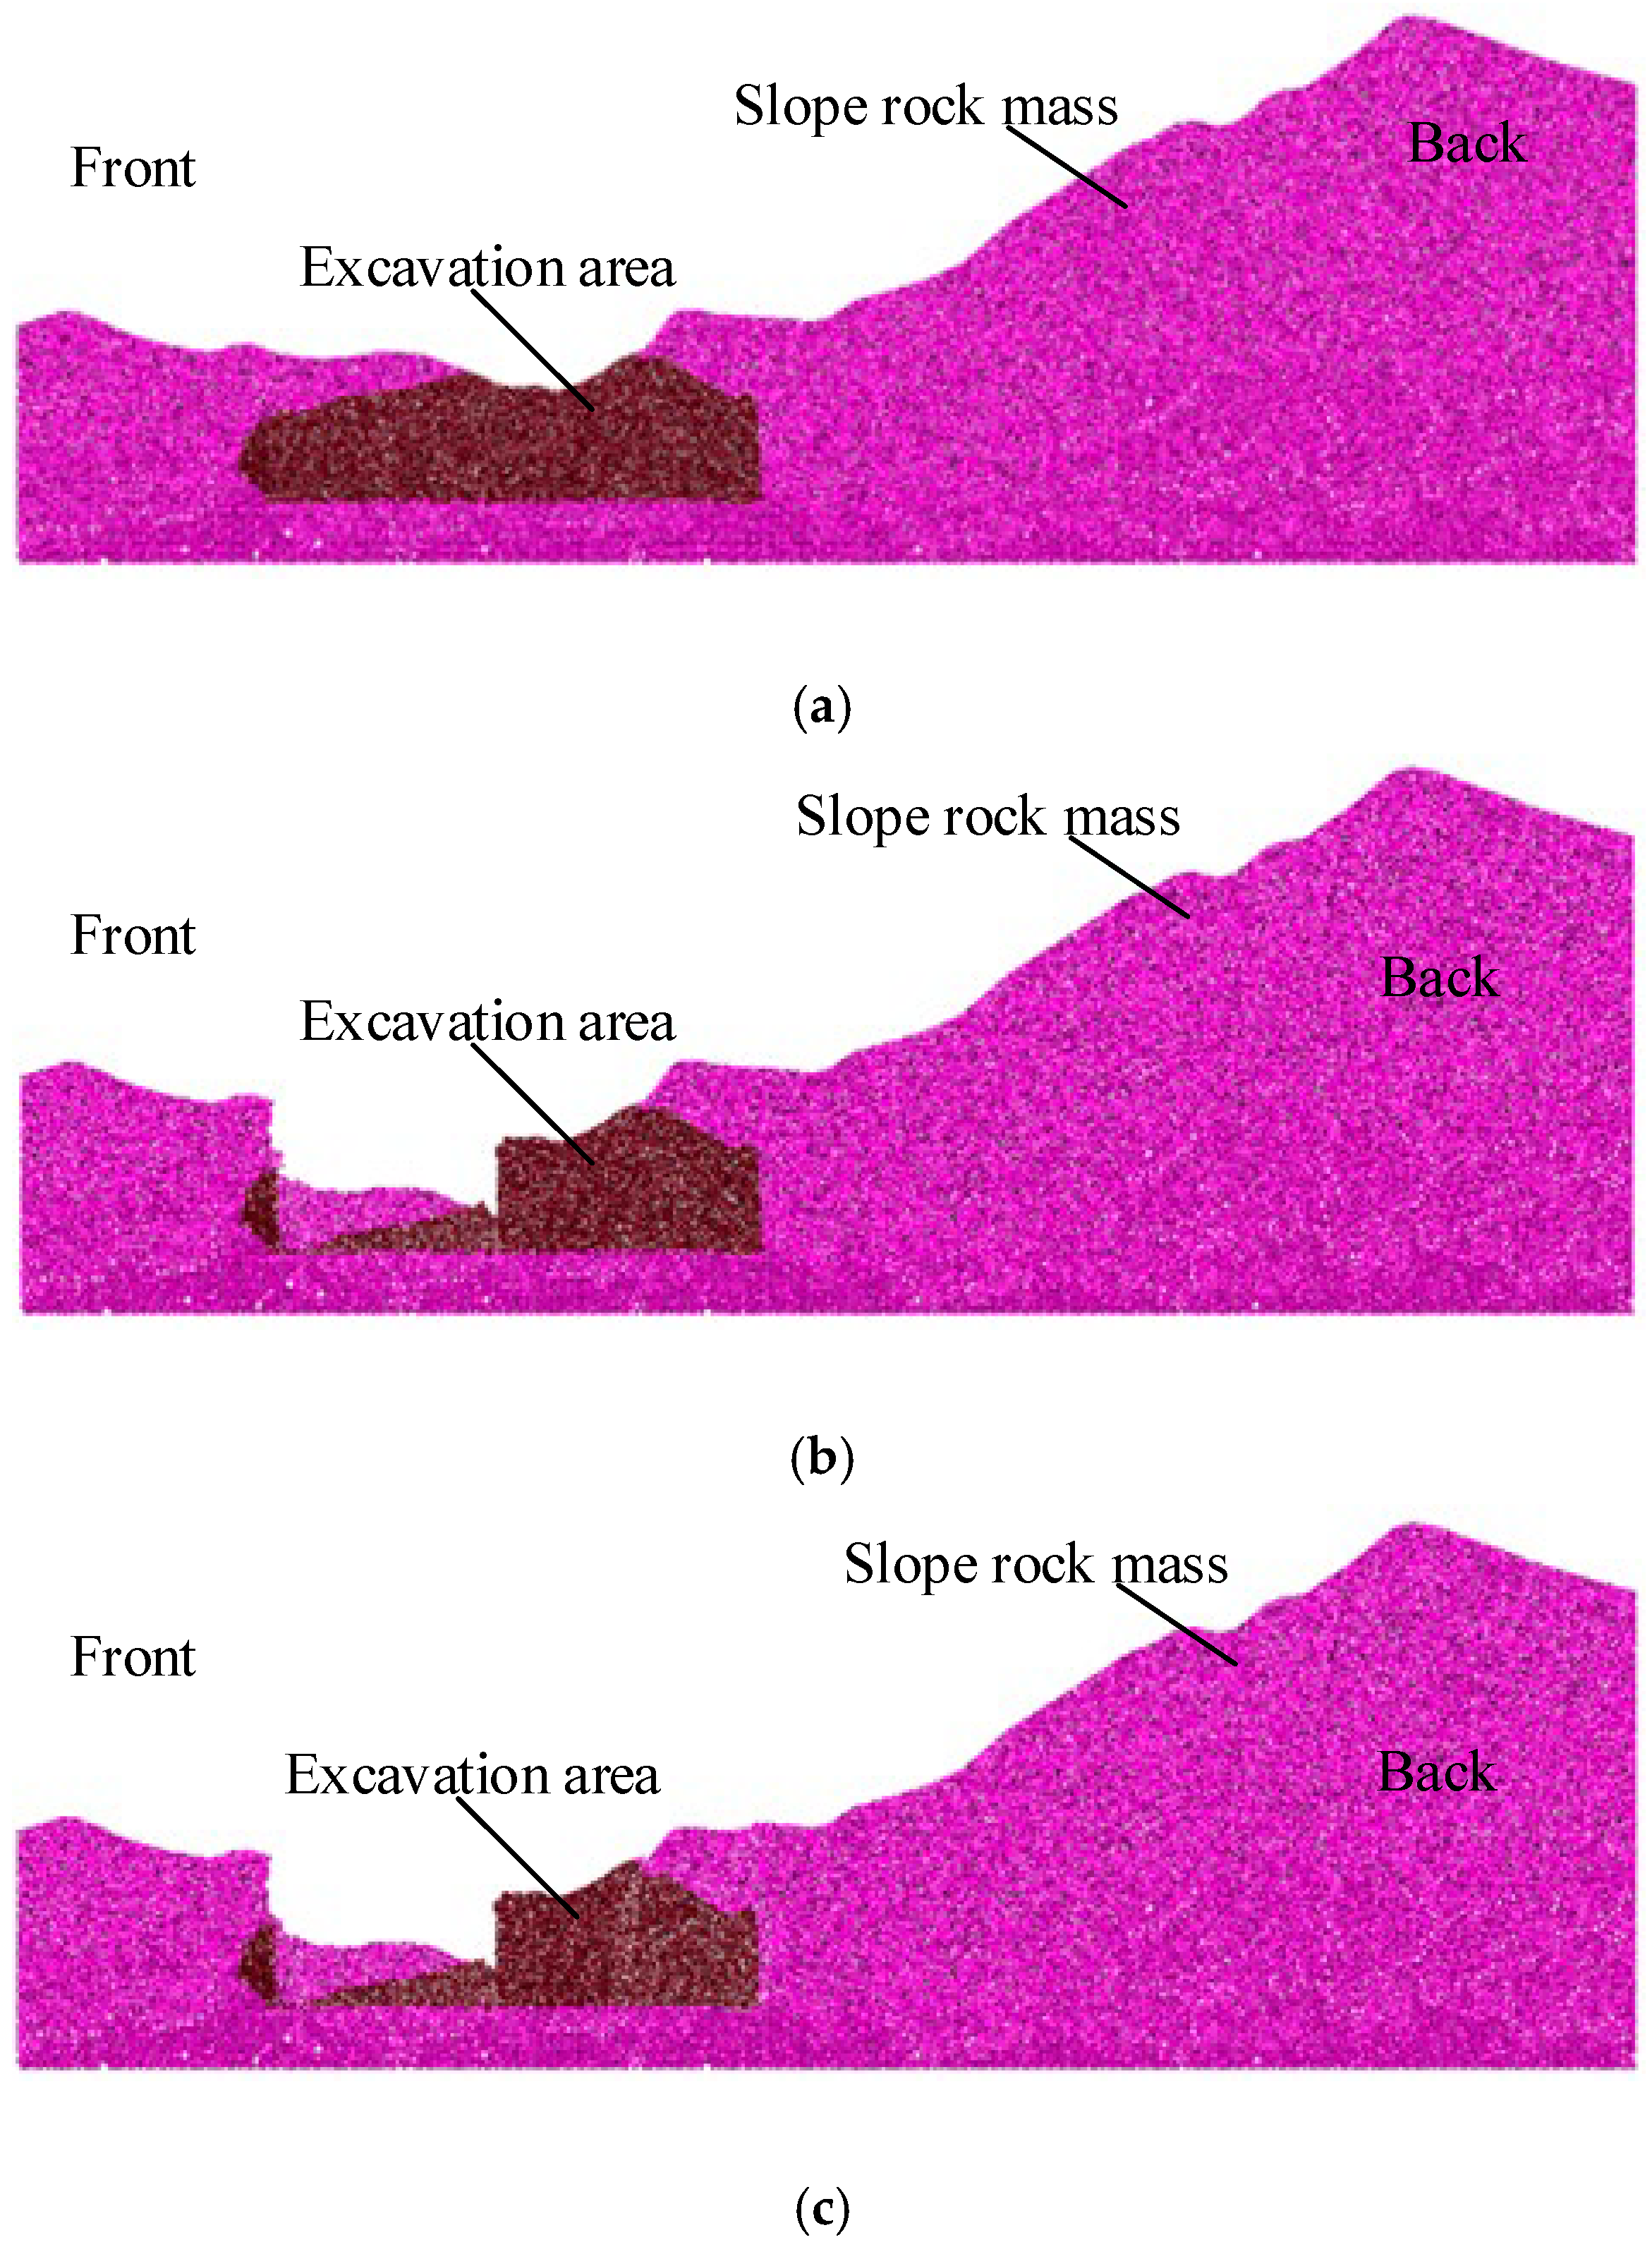
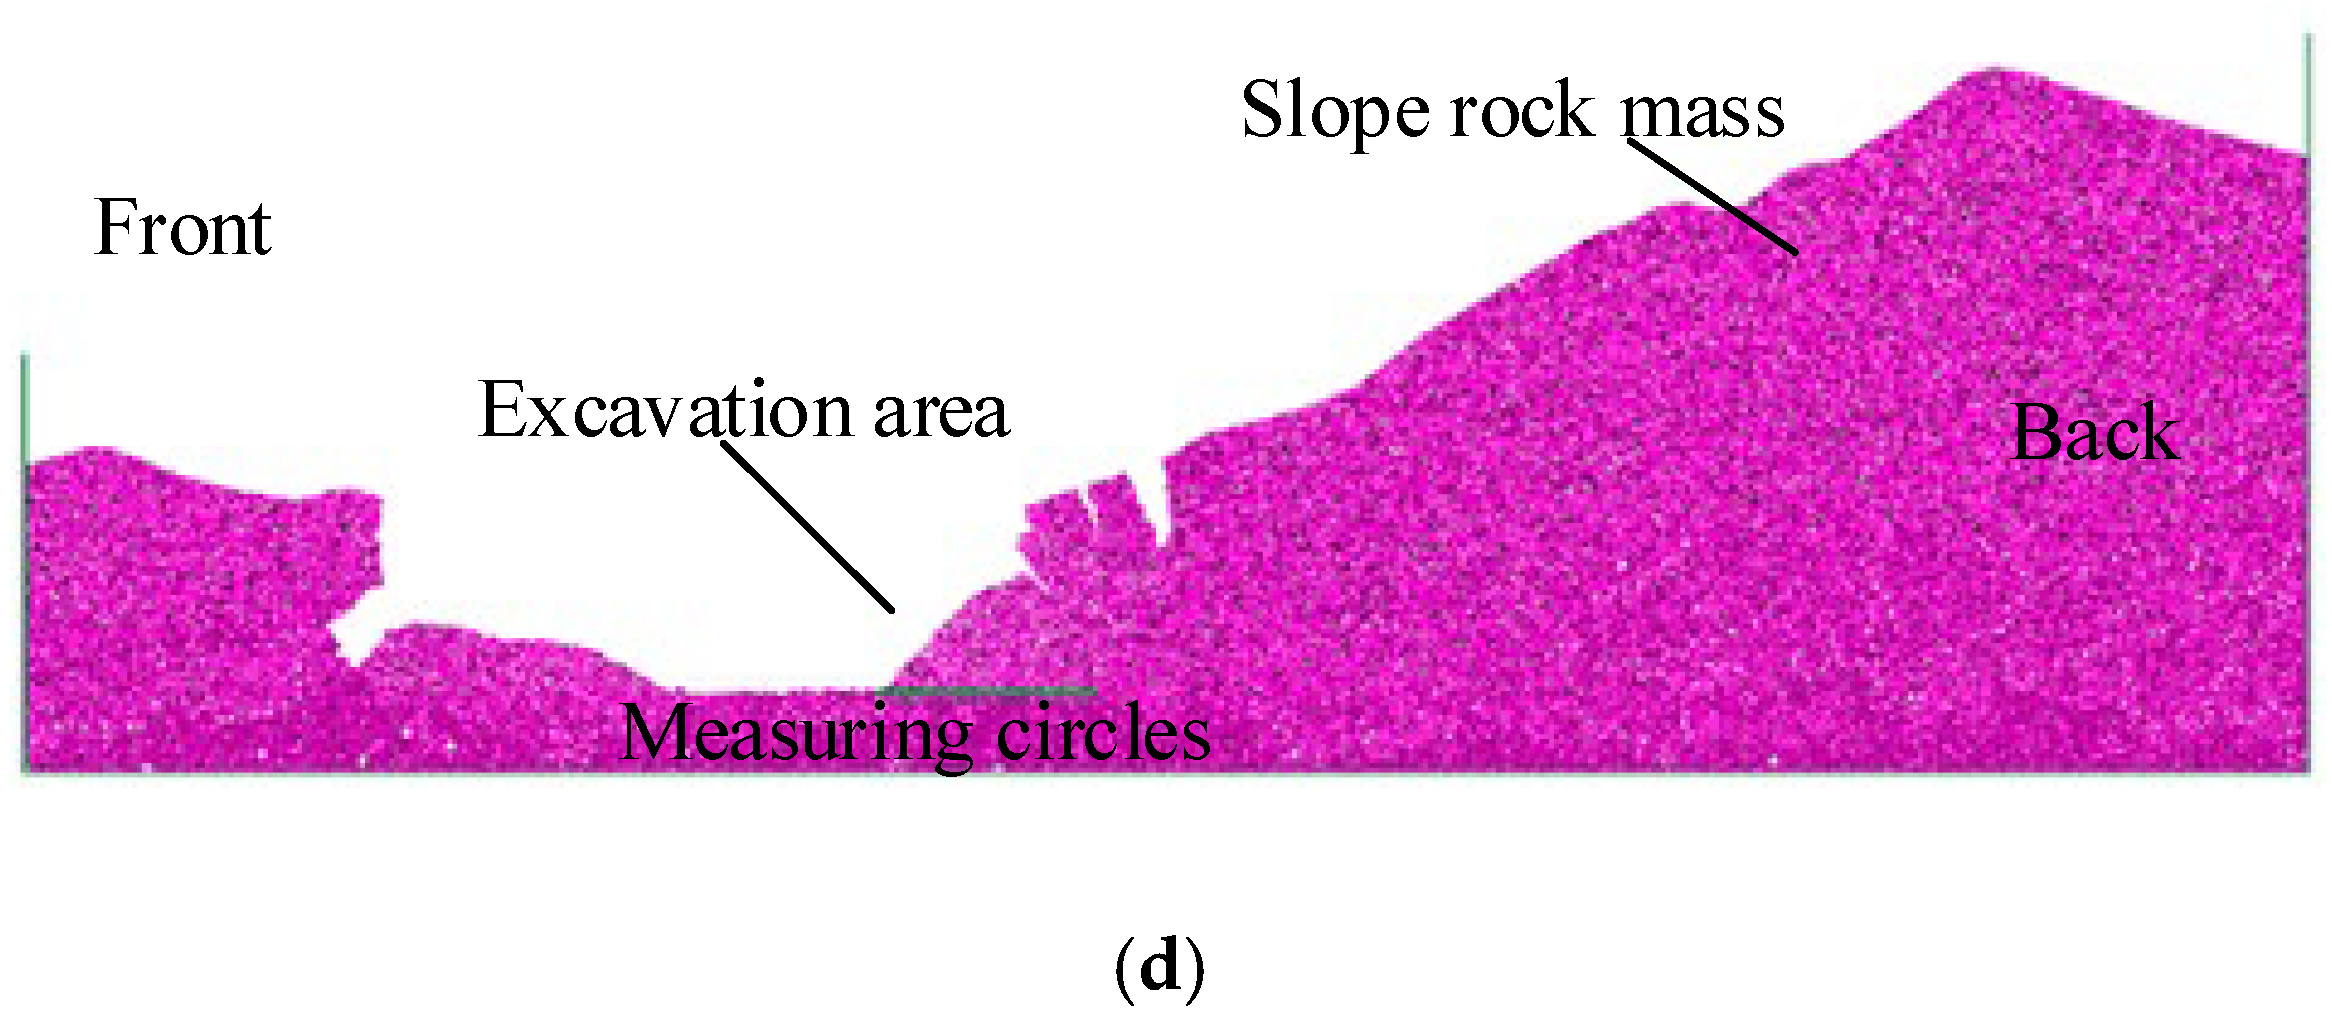
3.1. Transverse Section Impact Simulation

To investigate the impact characteristics of slope collapses in the transverse direction, a detailed numerical simulation was conducted using the discrete element method (DEM) implemented in PFC2D. The material parameters and contact parameters used in the PFC numerical model in the article are shown in Table 1. The modeling process began with the establishment of a two-dimensional section model derived from the Rhino software 7, as shown in Figure 6. This section was cut horizontally to represent the transverse profile of the slope.
The two-dimensional profile model, as illustrated in Figure 7a, consists of rock mass (purple) and ore body (brown) components. To enhance computational efficiency while maintaining engineering accuracy, large particles were used to simulate the rock mass in regions where detailed modeling was not critical. Specifically, the left region (x = −495 to −50 m), the right region (x = 1000 to 1500 m), and the bottom trough (y = 0 to 100 m) were modeled with large particles.
The simulation process included several key steps: model introduction, lithology grouping, parameter assignment, excavation, and stress monitoring. The parameter assignment was tailored to reflect the engineering practice of ore drawing, with special reinforcement applied to the bottom trough to simulate the higher bonding force typically observed in these areas. Additionally, a subsidence area was introduced by setting the bonding force of the ore body in the collapse region to zero.
In this simulation, the mesoscopic parameters of the rock material were determined by referencing the existing research findings of this project. Subsequently, the displacements and contact forces of all particles were reset to zero to eliminate the influence of the initial setup on the calculation results of axial stress and strain. To enhance the accuracy of the model, an additional equilibrium calculation was conducted to minimize the interference of initial conditions on the simulation outcomes. Since the landslide in this project was triggered by underground construction works, the excavation process in the model was realized by progressively removing PFC (Particle Flow Code) particles within the excavation area. During the landslide simulation, measurement circles were placed at the bottom of the model, above the underground cavern group, to monitor the impact forces generated during the collapse of the upper rock mass and analyze the dynamic effects of the landslide instability process on the underground caverns.
The simulation results revealed that, after the bottom pulling was completed, certain cracks appeared on the left and right slopes, but no instability occurred, as shown in Figure 7b. The middle loose area was designated as a subsidence area, represented by clearing the adhesive force, as depicted in Figure 7c. The overall state of the slope before instability is shown in Figure 7c, with 32 measurement circles (radius = 7.5 m) set near the bottom trough (y = 100 m) to monitor the Y-direction stress.
The impact stress monitoring results are presented in Figure 8. The left diagram shows the measurement circle at the left end, primarily subjected to the collapse impact of the western slope, while the right diagram shows the measurement circle at the right end, subjected to the impact of the eastern slope collapse. The impact stress analysis focused on the differences between the peaks of each curve, rather than simply taking the peak values as the final result. This approach revealed that the overall impact stress fluctuated continuously, similarly to an earthquake situation, due to the sequential caving of the slope top ore bodies rather than a single large rock mass. The peak impact stress in the western slope was approximately 4.8 MPa, with a maximum impact stress calculated from the peak differences ranging from 1.0 to 1.8 MPa. In the eastern slope, the peak impact stress was about 2.8 MPa, with a maximum impact stress calculated from the peak differences ranging from 0.8 to 1.6 MPa. The similarity in the actual maximum impact stress values, despite different peak values, validates the rationality of the peak difference calculation method.

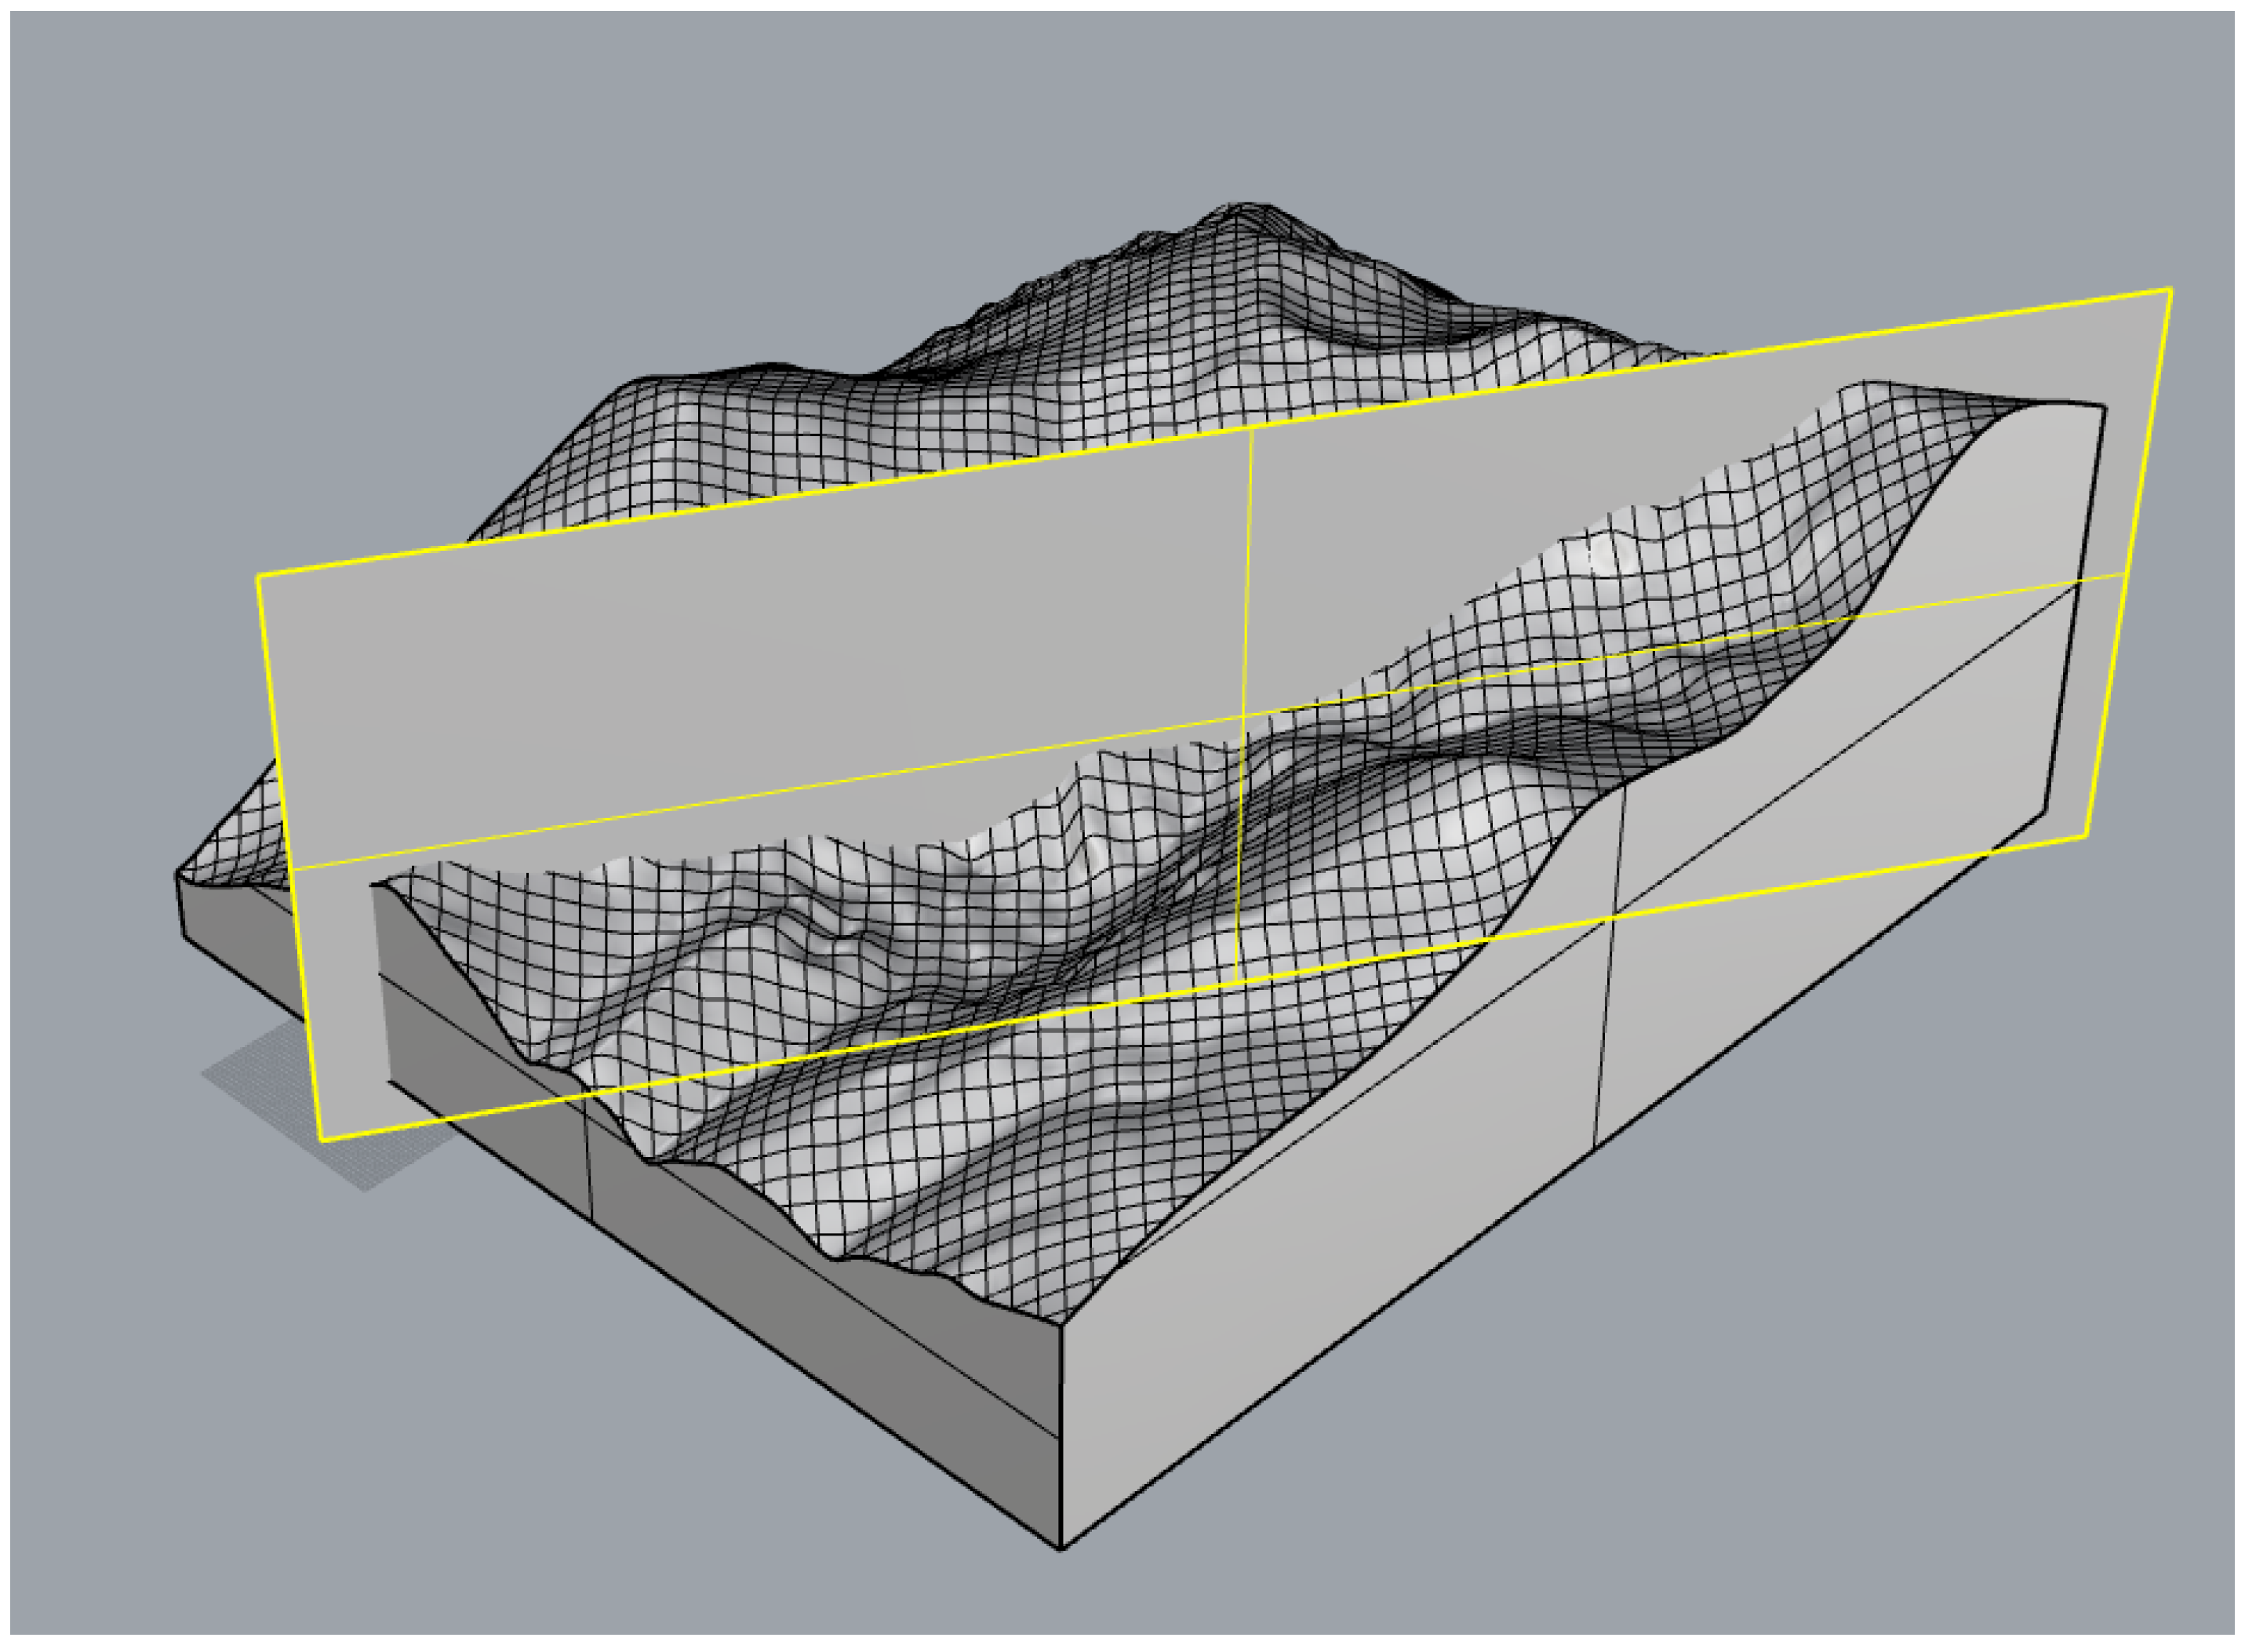
3.2. Longitudinal Profile Impact Simulation

To further investigate the impact characteristics of slope collapses in the longitudinal direction, a detailed numerical simulation was conducted using the discrete element method (DEM) implemented in PFC2D. The modeling process began with the establishment of a two-dimensional section model derived from the Rhino software, as shown in Figure 9. This section was cut longitudinally to represent the profile of the slope.
The two-dimensional profile model, as illustrated in Figure 10a, consists of rock mass (purple) and ore body (brown) components. To enhance computational efficiency while maintaining engineering accuracy, large particles were used to simulate the rock mass in regions where detailed modeling was not critical. Specifically, the left region (x = 0 to 200 m), the right region (x = 1850 to 2400 m), and the bottom trough (y = 0 to 100 m) were modeled with large particles.
The simulation process included several key steps: model introduction, lithology grouping, parameter assignment, excavation, and stress monitoring. The parameter assignment was tailored to reflect the engineering practice of ore drawing, with special reinforcement applied to the bottom trough to simulate the higher bonding force typically observed in these areas. Additionally, a subsidence area was introduced by setting the bonding force of the ore body in the collapse region to zero.
The longitudinal profile simulation considered the influence of the first mining area. Figure 10b shows the state of the model after the first mining area was excavated. The first mining area was equivalent to x = 514 to 867 m. To facilitate the simulation calculation, the first mining area was directly excavated. At this stage, the overlying rock mass exhibited significant impact stress, which was not fully accounted for in the actual situation, hence the impact stress was not considered in this phase.
After the bottom pulling was completed, certain cracks and slippage occurred in the right-side slope (northern slope), but no instability was observed, as shown in Figure 10c. The middle loose area was designated as a subsidence area, represented by clearing the adhesive force. The overall state of the slope before instability is shown in Figure 10c, with 30 measurement circles (radius = 7.5 m) set near the bottom trough (y = 100 m) to monitor the Y-direction stress.
The impact stress monitoring results are presented in Figure 11. The left diagram shows the measurement circle at the left end, primarily subjected to the collapse impact of the northern slope, while the right diagram shows the measurement circle at the right end, subjected to the impact of the northern rock mass. The impact stress analysis focused on the differences between the peaks of each curve, rather than simply taking the peak values as the final result. This approach revealed that the overall impact stress fluctuated continuously, similar to an earthquake situation, due to the sequential caving of the slope top ore bodies rather than a single large rock mass. The peak impact stress at the front end was approximately 5.5 MPa, with a maximum impact stress calculated from the peak differences ranging from 0.6 to 1.8 MPa. At the back end, the peak impact stress was about 10.4 MPa, with a maximum impact stress calculated from the peak differences ranging from 0.8 to 2.0 MPa. The similarity in the actual maximum impact stress values, despite different peak values, further validates the rationality of the peak difference calculation method.
It is worth noting that the impact stress values measured by the measurement circle at the back end were relatively high and maintained at a higher level. This is attributed to the accumulation of debris at the back end after the collapse of the northern rock mass, where the stress is no longer purely impact stress.

3.3. Oblique Profile Impact Simulation

To comprehensively investigate the impact characteristics of slope collapses in the oblique direction, a detailed numerical simulation was conducted using the discrete element method (DEM) implemented in PFC2D. The modeling process began with the establishment of a two-dimensional section model derived from the Rhino software, as shown in Figure 12. This section was cut obliquely to represent the profile of the slope.
The two-dimensional profile model, as illustrated in Figure 13a, consists of rock mass (purple) and ore body (brown) components. To enhance computational efficiency while maintaining engineering accuracy, large particles were used to simulate the rock mass in regions where detailed modeling was not critical. Specifically, the left region (x = 0 to 400 m), the right region (x = 1900 to 2800 m), and the bottom trough (y = 0 to 100 m) were modeled with large particles.
The simulation process included several key steps: model introduction, lithology grouping, parameter assignment, excavation, and stress monitoring. The parameter assignment was tailored to reflect the engineering practice of ore drawing, with special reinforcement applied to the bottom trough to simulate the higher bonding force typically observed in these areas. Additionally, a subsidence area was introduced by setting the bonding force of the ore body in the collapse region to zero.
The oblique profile simulation considered the influence of the first mining area. Figure 13a shows the state of the model after the first mining area was excavated. The first mining area was equivalent to x = 447 to 828 m. To facilitate the simulation calculation, the first mining area was directly excavated. At this stage, the overlying rock mass exhibited significant impact stress, which was not fully accounted for in the actual situation, hence the impact stress was not considered in this phase.
After the bottom pulling was completed, the right-side slope (northeastern slope) did not show obvious damage, but the ore body exhibited certain cracks and slippage, as shown in Figure 13b. The overall state of the slope before instability is shown in Figure 13c, with 17 measurement circles (radius = 7.5 m) set near the bottom trough (y = 100 m) to monitor the Y-direction stress.
The impact stress monitoring results are presented in Figure 14. The left diagram shows the measurement circle at the left end, primarily subjected to the collapse impact of the northeastern slope, while the right diagram shows the measurement circle at the right end, subjected to the impact of the northeastern rock mass. The impact stress analysis focused on the differences between the peaks of each curve, rather than simply taking the peak values as the final result. This approach revealed that the overall impact stress fluctuated continuously, similarly to an earthquake situation, due to the sequential caving of the slope top ore bodies rather than a single large rock mass.
The peak impact stress at the front end was approximately 33 MPa, with a peak value of the fluctuation area around 6 MPa, and the maximum impact stress calculated from the peak differences ranged from 1.0 to 2.0 MPa. At the back end, the peak impact stress was about 34 MPa, with a peak value of the fluctuation area around 10 MPa, and the maximum impact stress calculated from the peak differences ranged from 1.0 to 1.8 MPa. Notably, there was a region with an impact stress of 14 MPa in the back fluctuation area, where the difference value was up to 6 MPa, but the fluctuation range of the adjacent area was very small. This suggests that multiple blocks may have adhered to form a large body at this time, leading to the high difference value. Therefore, this value was not considered in the analysis.

4. Experimental Procedures

The evaluation of the bottom structure’s bearing capacity necessitates a meticulously designed experimental protocol. Given the large dimensions of the bottom structure specimen (0.8 m × 0.8 m × 0.8 m), a three-phase five-sided large-scale testing machine was deemed appropriate to accommodate the specimen size and simulate the complex loading conditions. The experimental setup involved applying a combination of static and dynamic loads to the bottom structure model, with multiple monitoring points strategically positioned to capture the mechanical response under various load scenarios.
Prior to loading, strain gauges were affixed to critical locations on the bottom structure model, including the ore accumulation trough, the roadway, and the ore extraction route, as illustrated in Figure 15. This arrangement enabled real-time monitoring of strain variations at different positions during the test, thereby providing insights into the localized damage and deformation characteristics of the structure.
To facilitate the routing of data cables from the strain gauges and stress meters, four bottom partitions were preinstalled between the loading plate and the bottom structure model. The dimensions of these partitions were carefully designed to match the size of the vein tunnel, ensuring sufficient space for the data cables while maintaining the structural integrity of the test setup.
During the loading process, the three-phase five-sided loading device was employed to apply the predetermined loads. Figure 16a presents a top view of the loading setup, highlighting the importance of maintaining a uniform confining pressure of 0.1 MPa around the specimen. This pressure level was selected to prevent excessive compaction of the granular material while ensuring the stability of the specimen during the test, thereby mimicking the natural caving conditions in a block caving mine.
The experimental system integrated a loading control system, a stress acquisition system, a strain acquisition system, and a bulk pressure acquisition system, as depicted in Figure 16. The loading was controlled based on the force value, with a loading rate of 1 kN/s. Throughout the experiment, the stress and strain data were independently monitored and recorded by two separate computers, each equipped with specialized software and hardware. This dual-monitoring approach ensured the accuracy and reliability of the data, allowing for comprehensive analysis of the mechanical behavior of the bottom structure under different loading conditions.
Based on the numerical simulation results of slope collapse impact stress, the loading scenarios were categorized into three distinct types, as shown in Figure 17. These types included the overall collapse impact curve (Figure 17a), the partial collapse large block impact curve (Figure 17b), and the progressive collapse multiple impact curve (Figure 17c). Each type of loading was carefully designed to replicate the actual impact forces that the bottom structure might experience during slope collapse events in block caving mines. The static load corresponding to the actual height of the caving ore and rock was taken into account, and the dynamic disturbance loads were applied according to the stress values obtained from the numerical simulations.

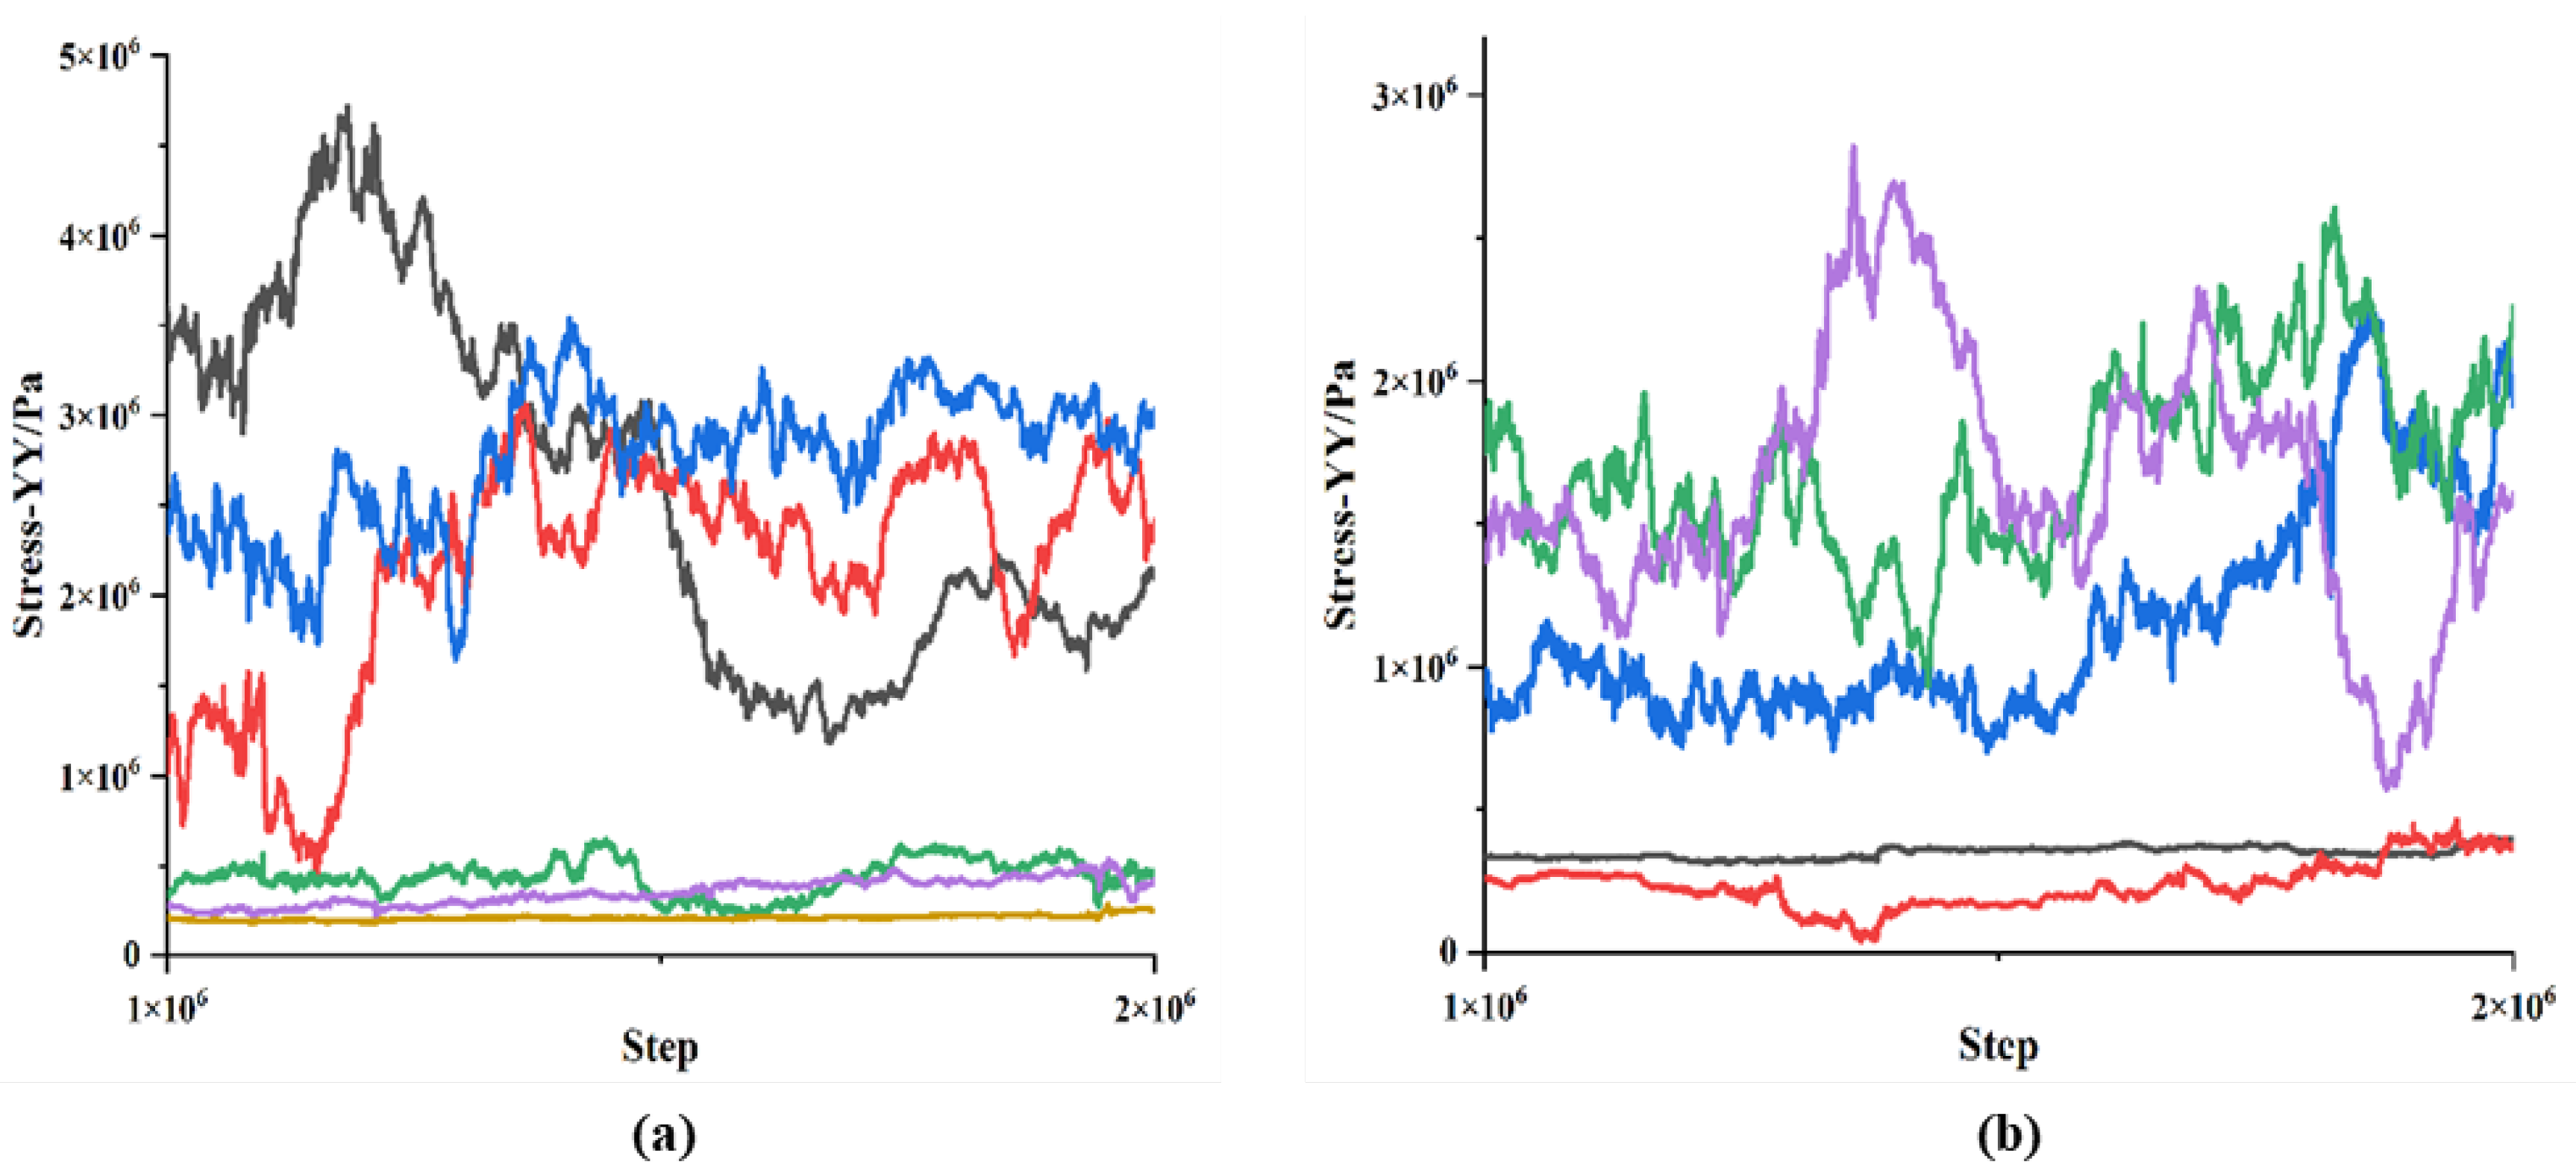
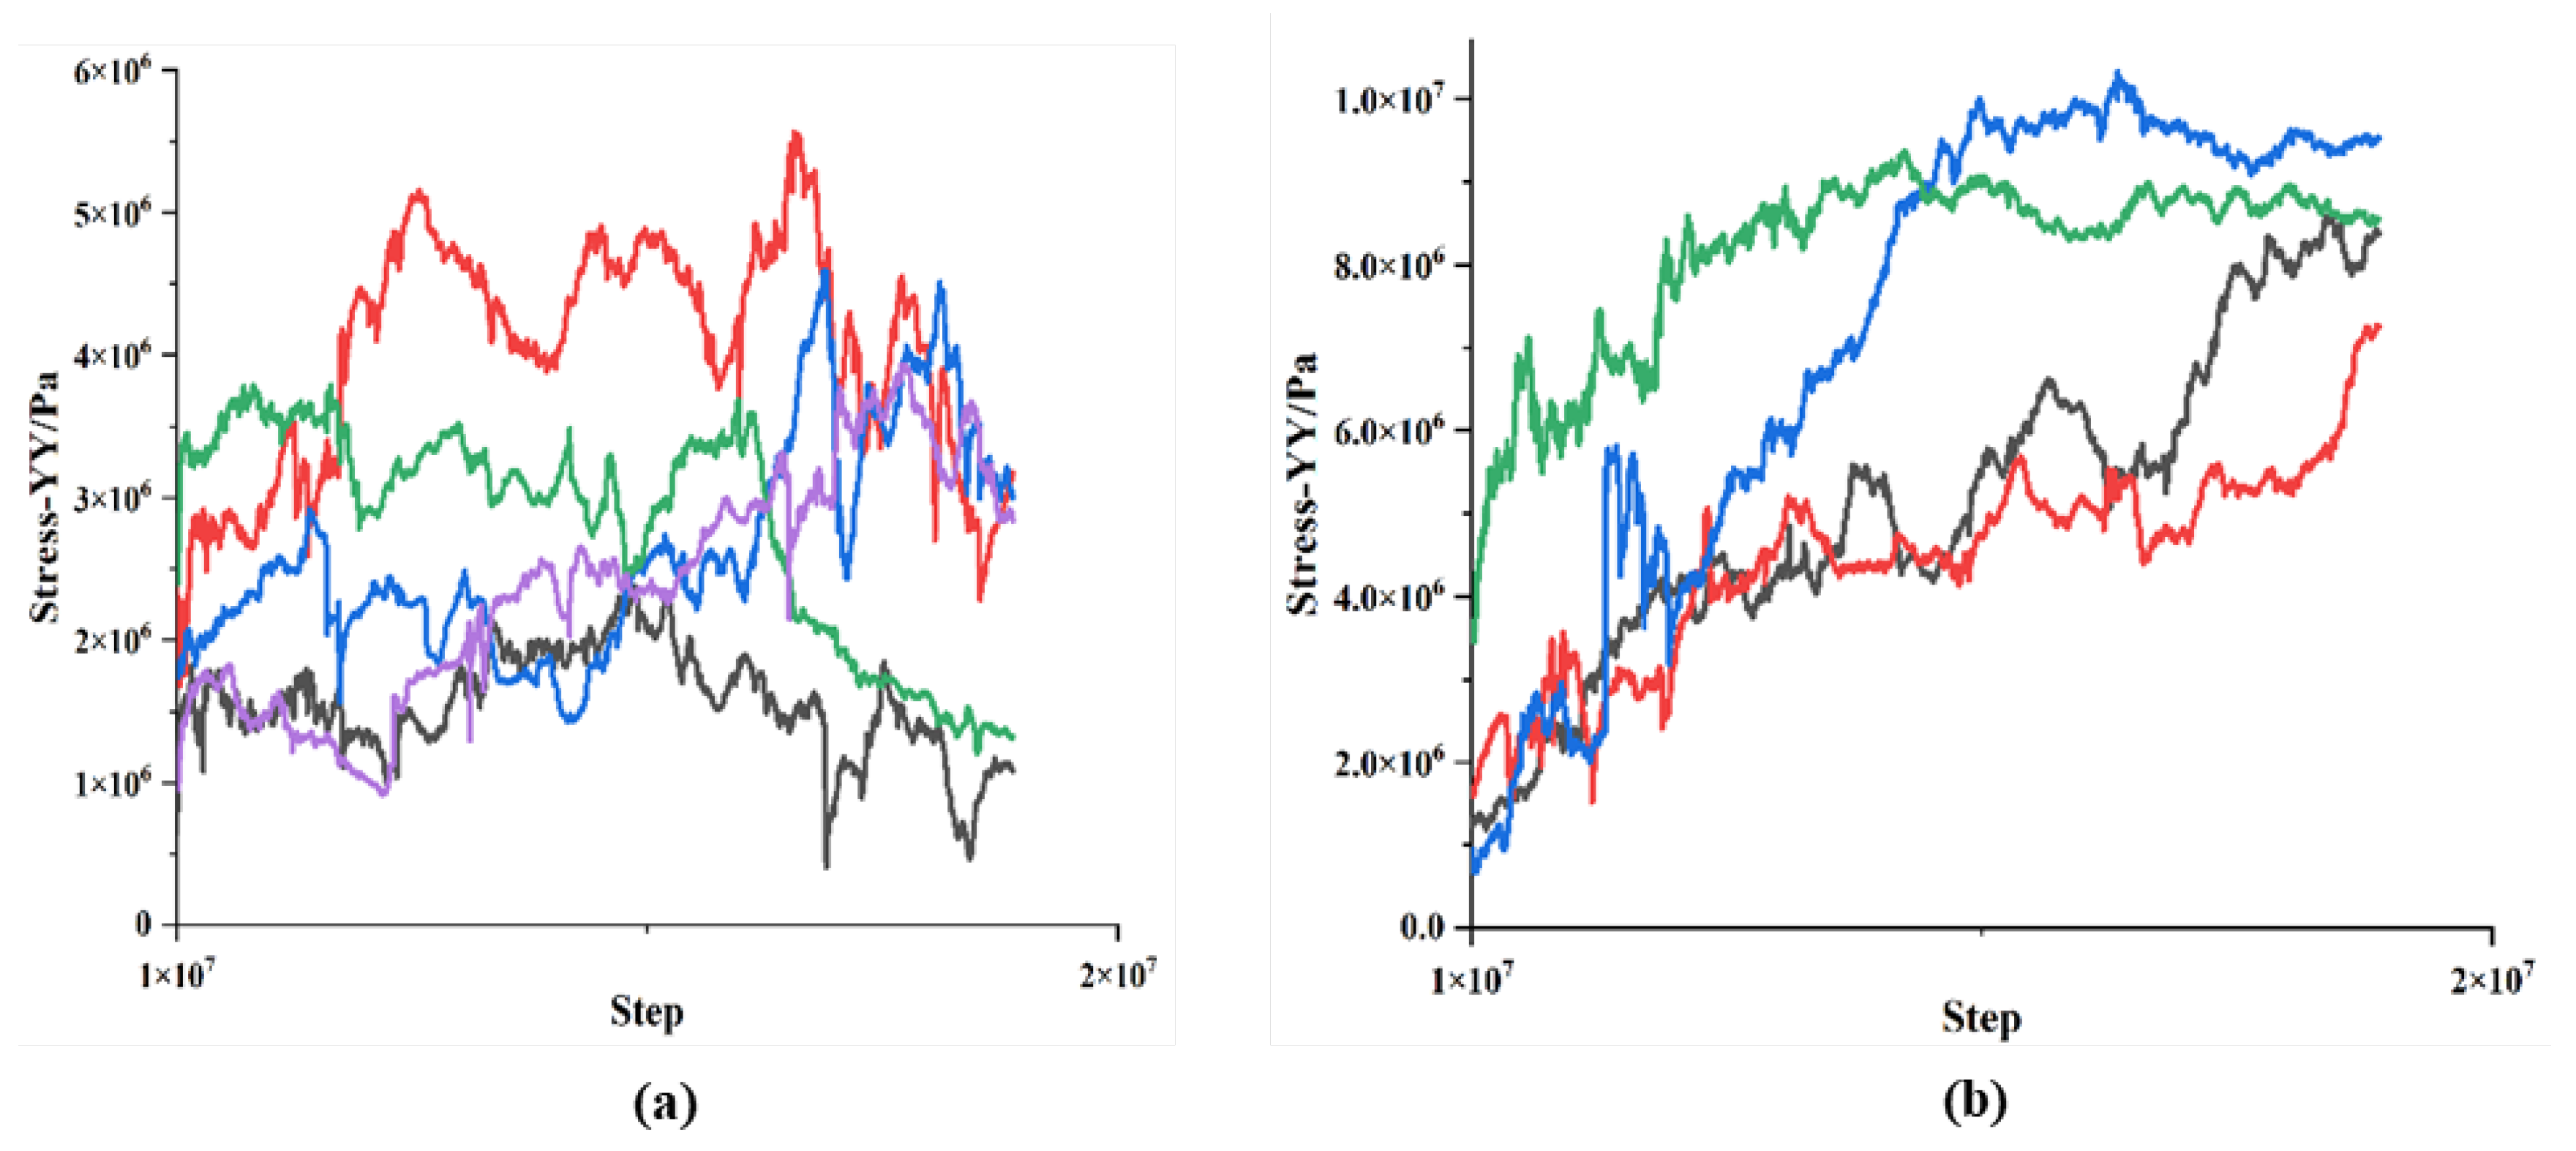
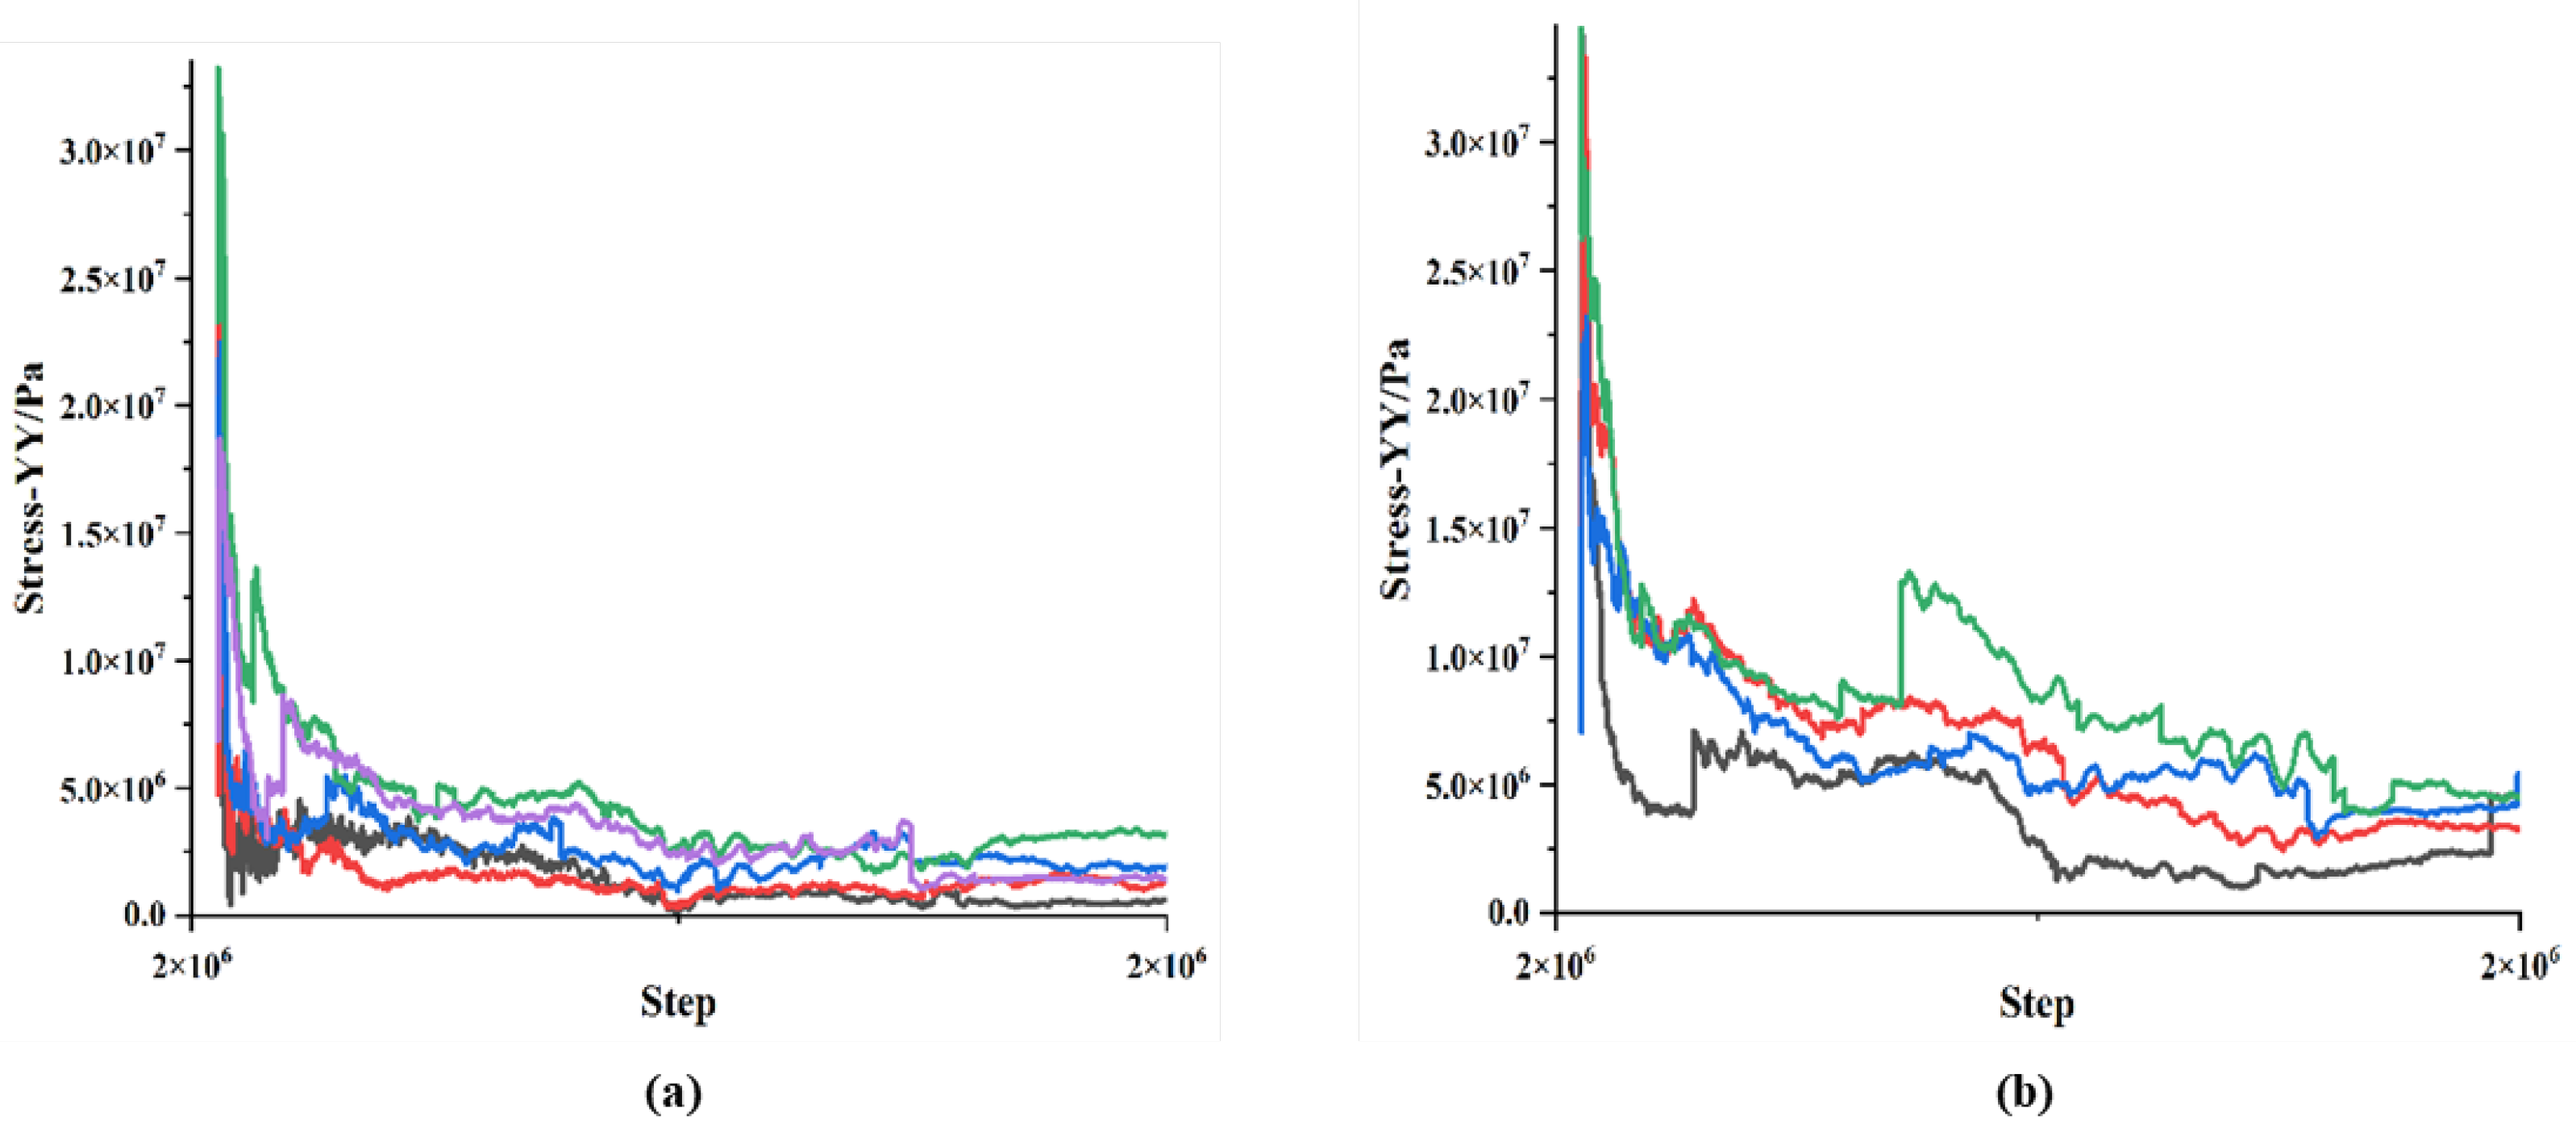
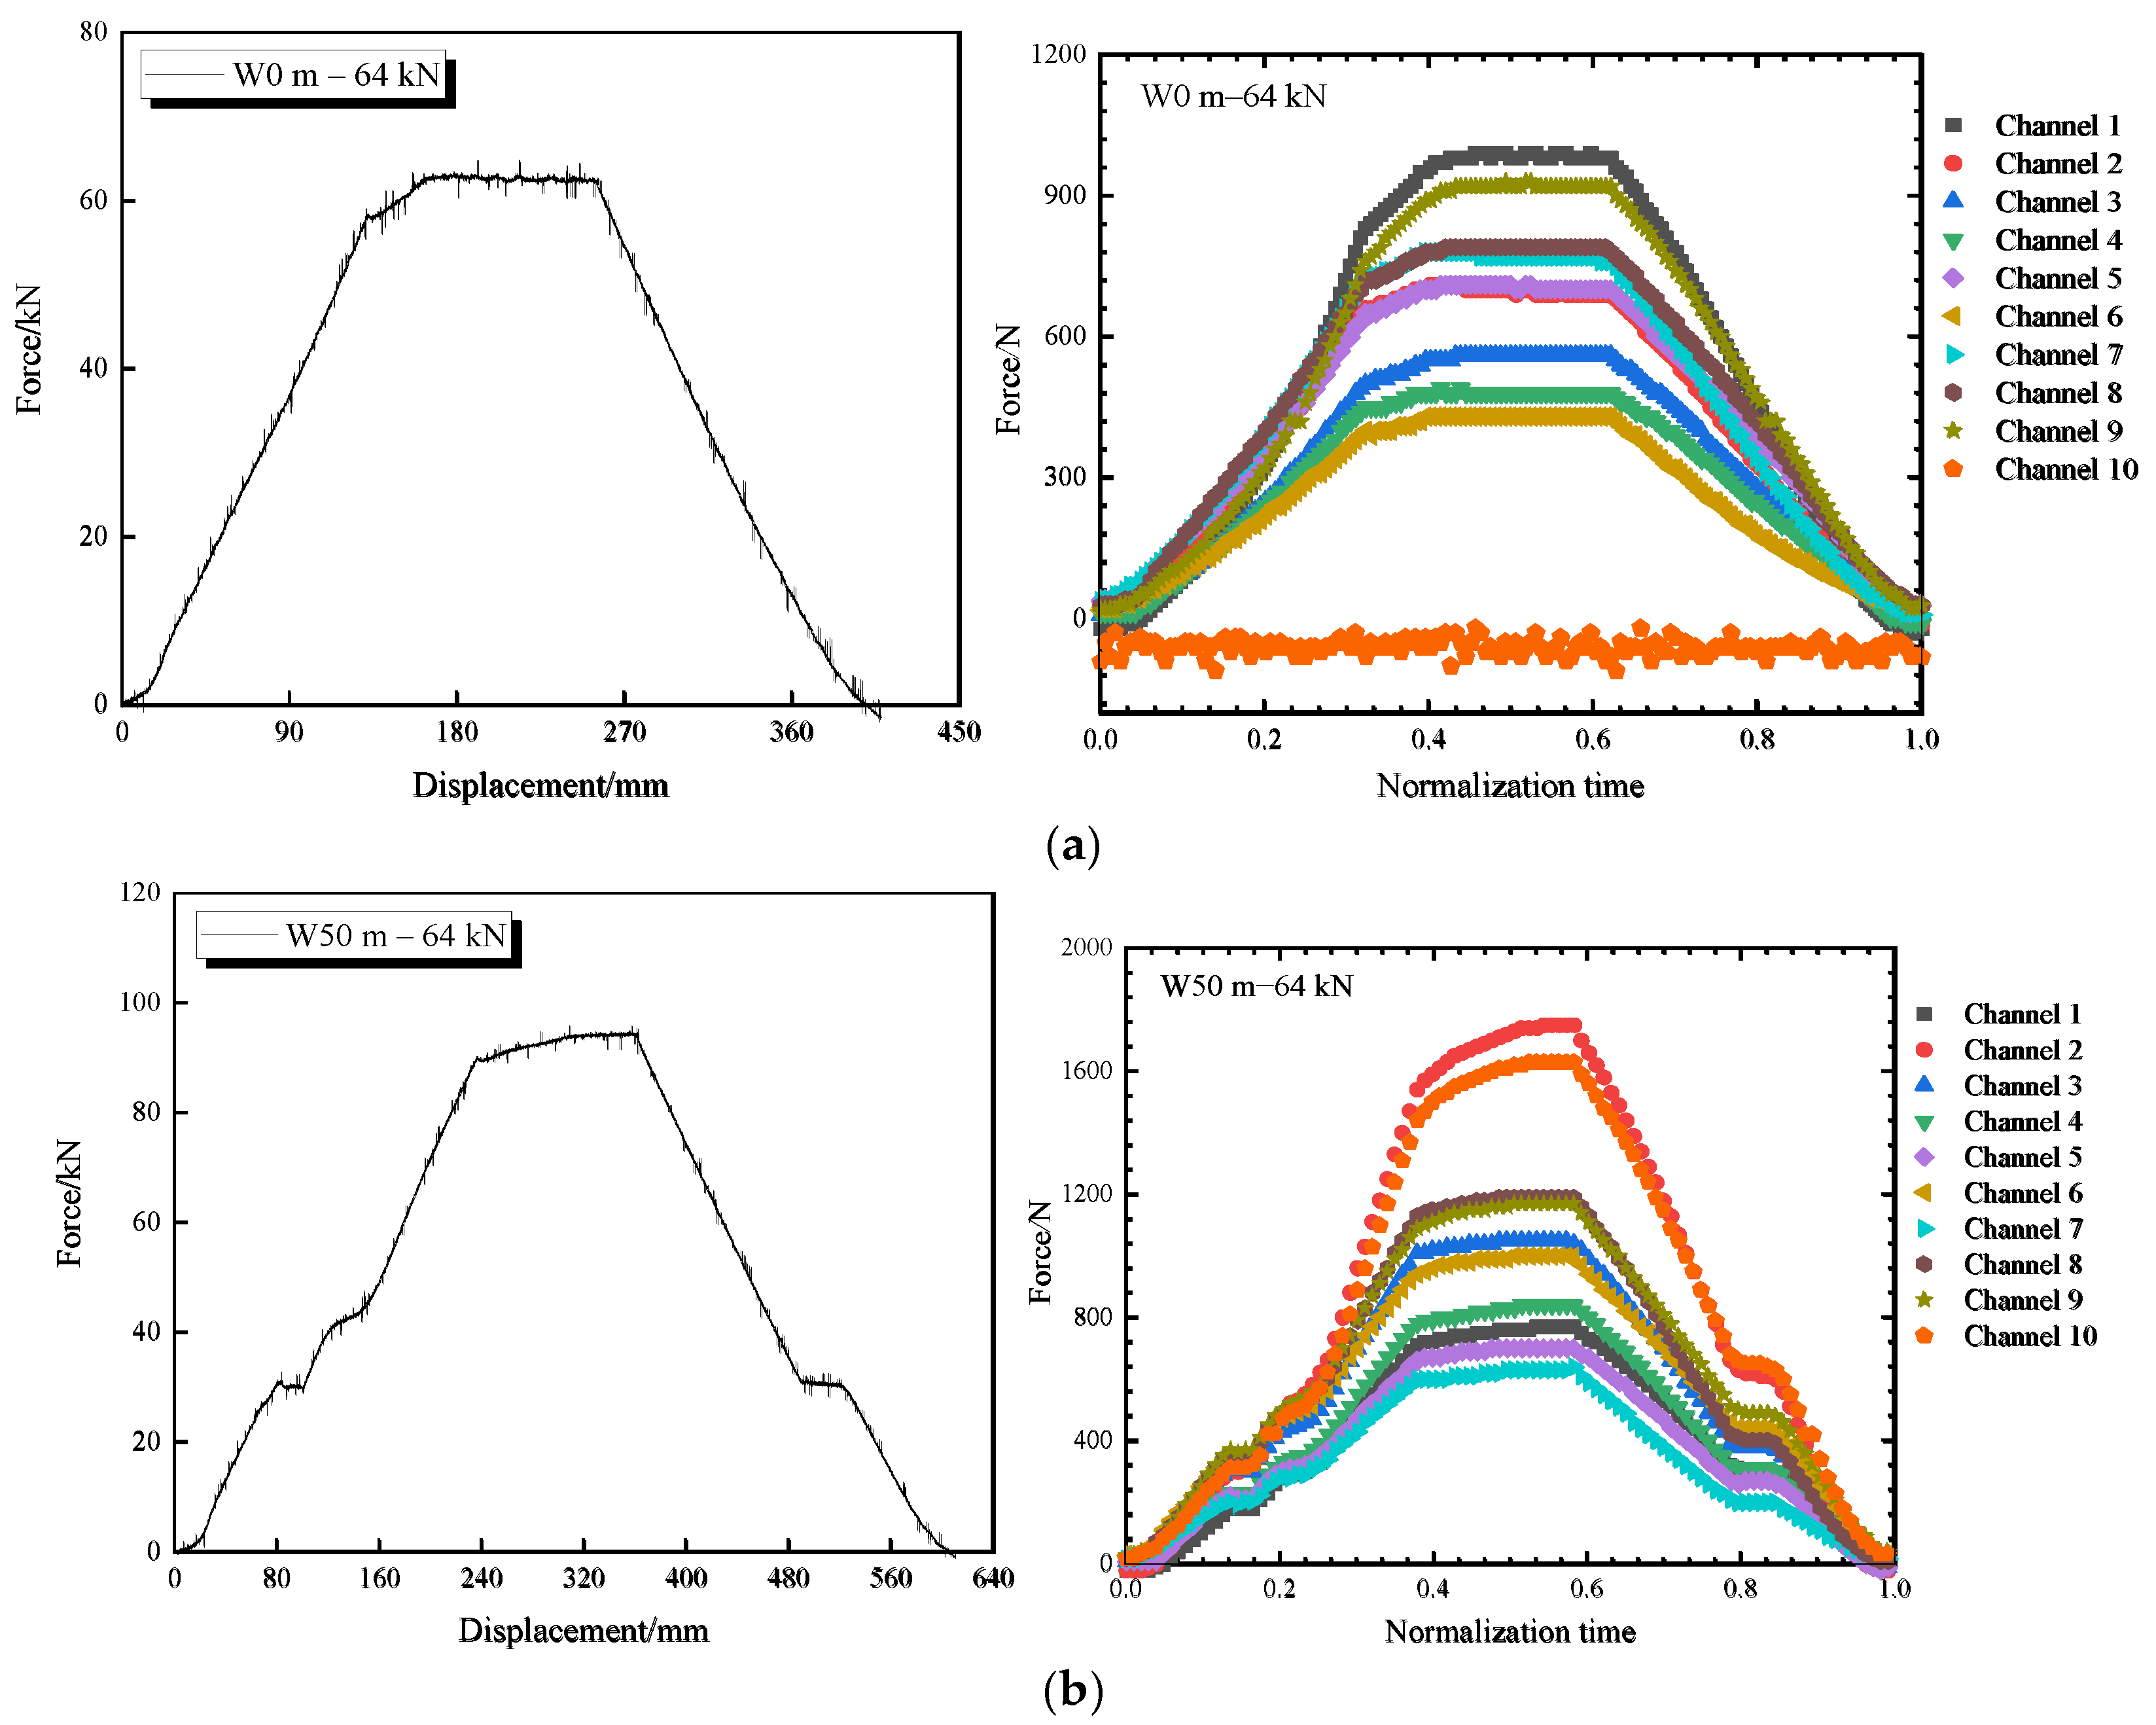
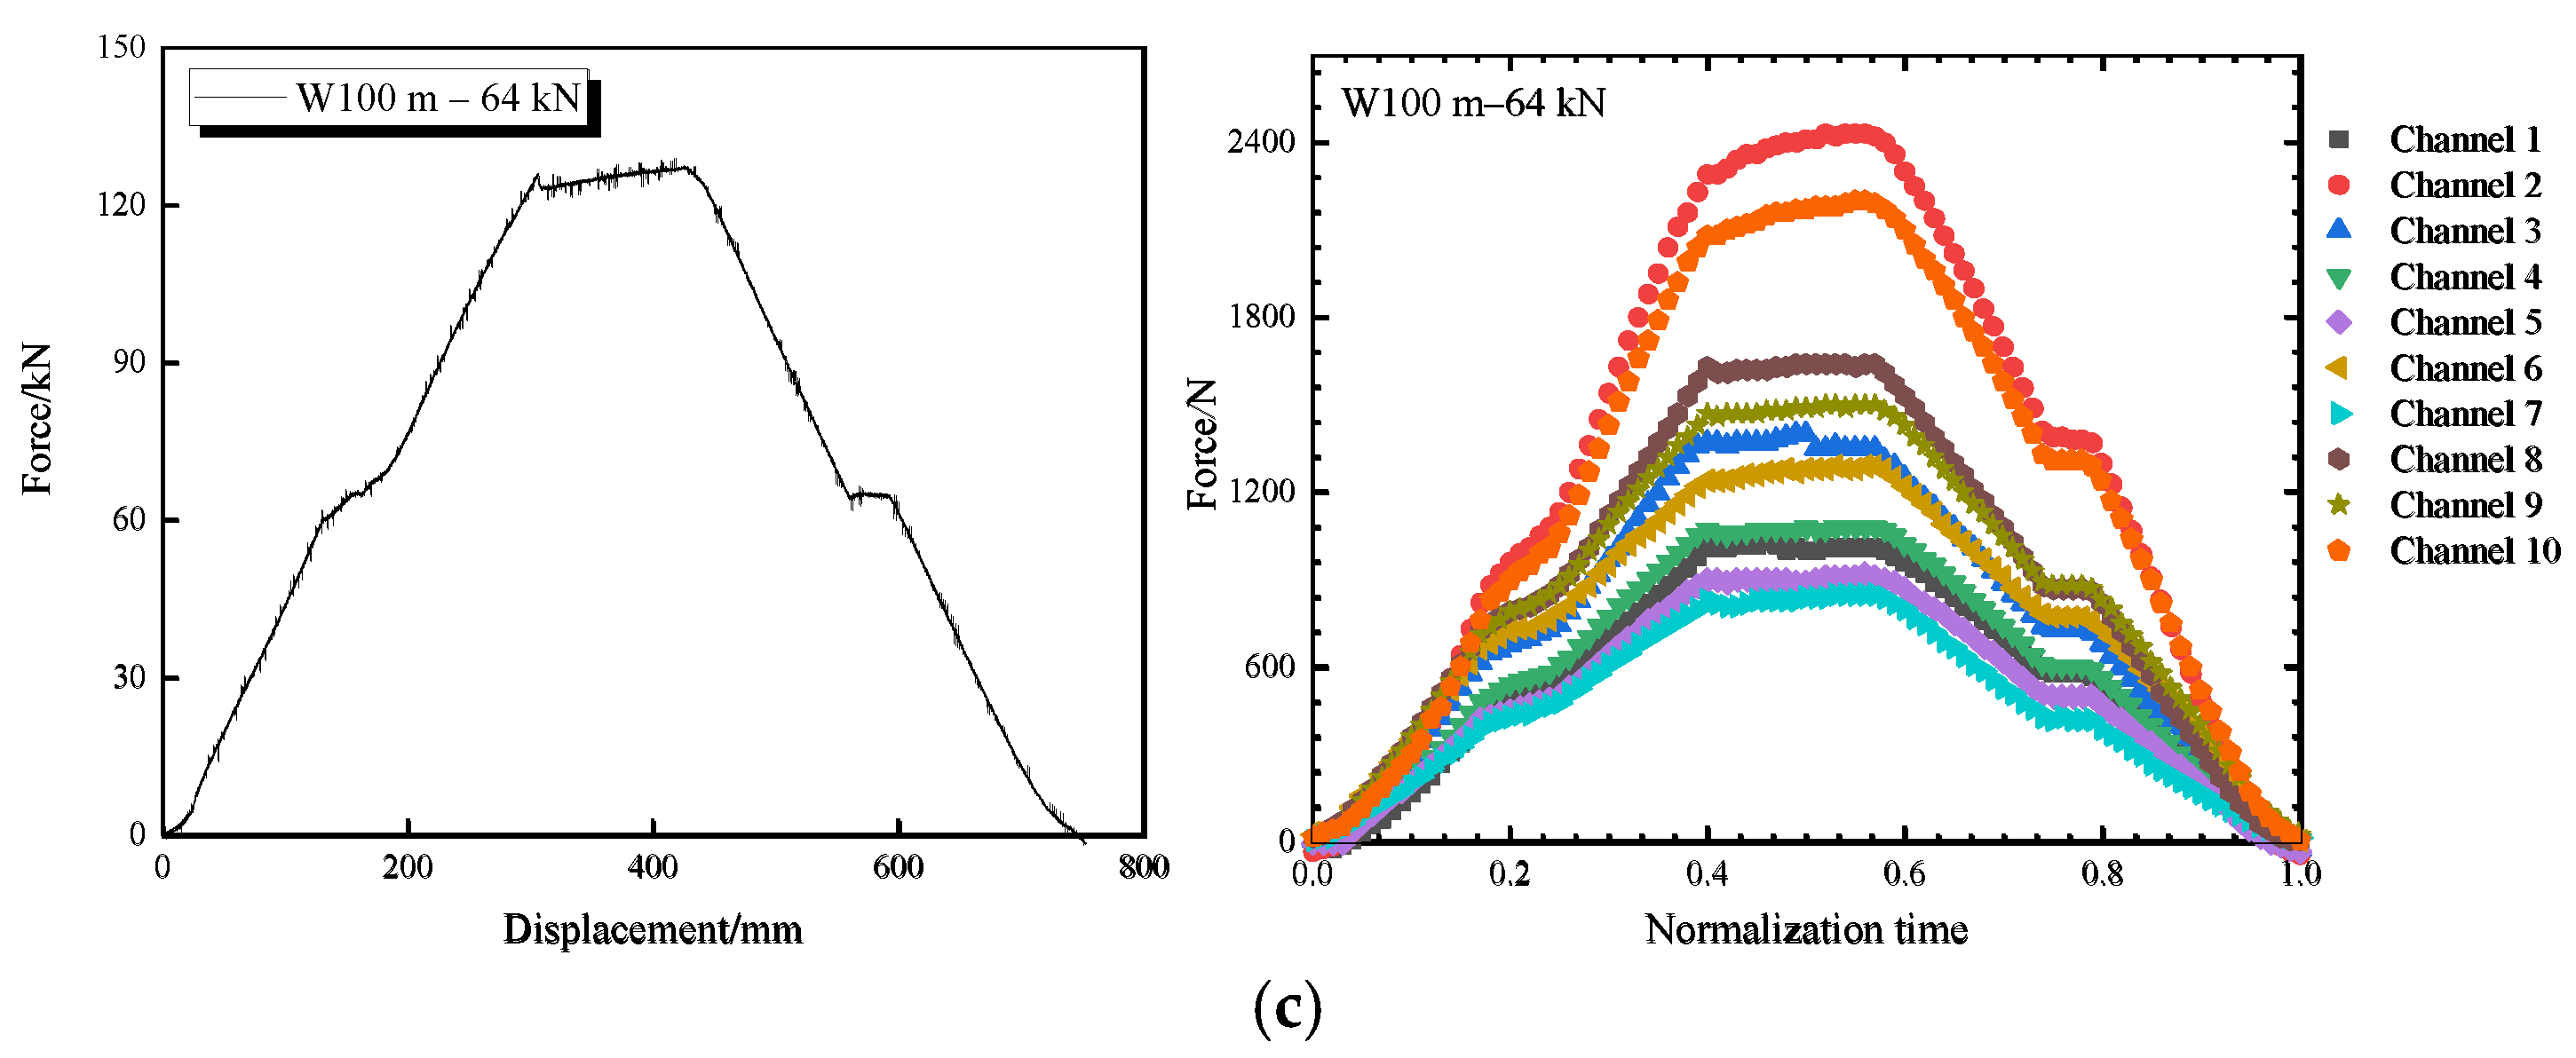
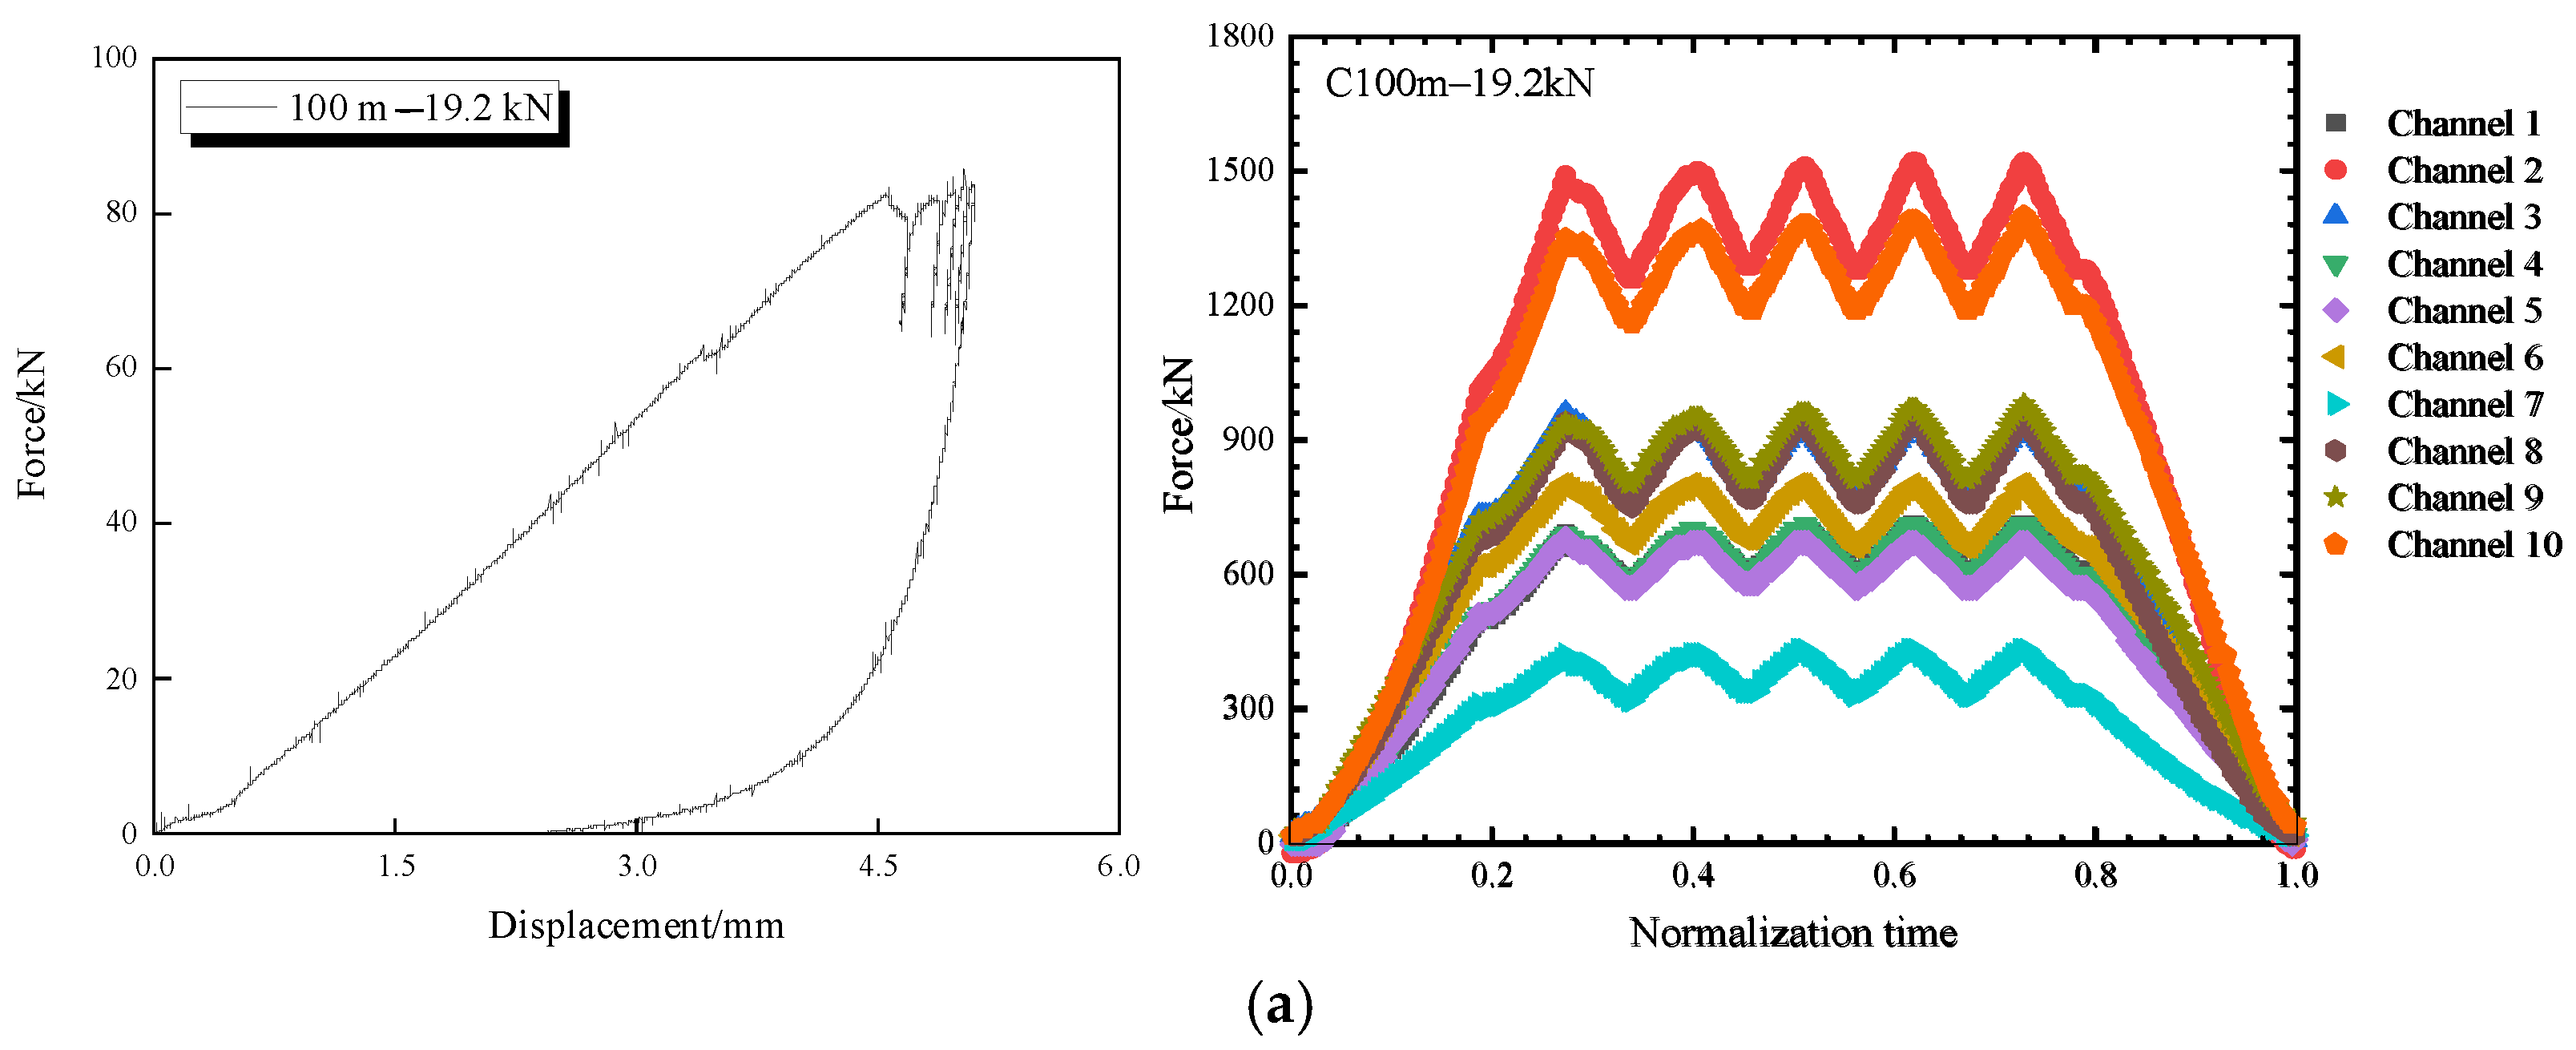
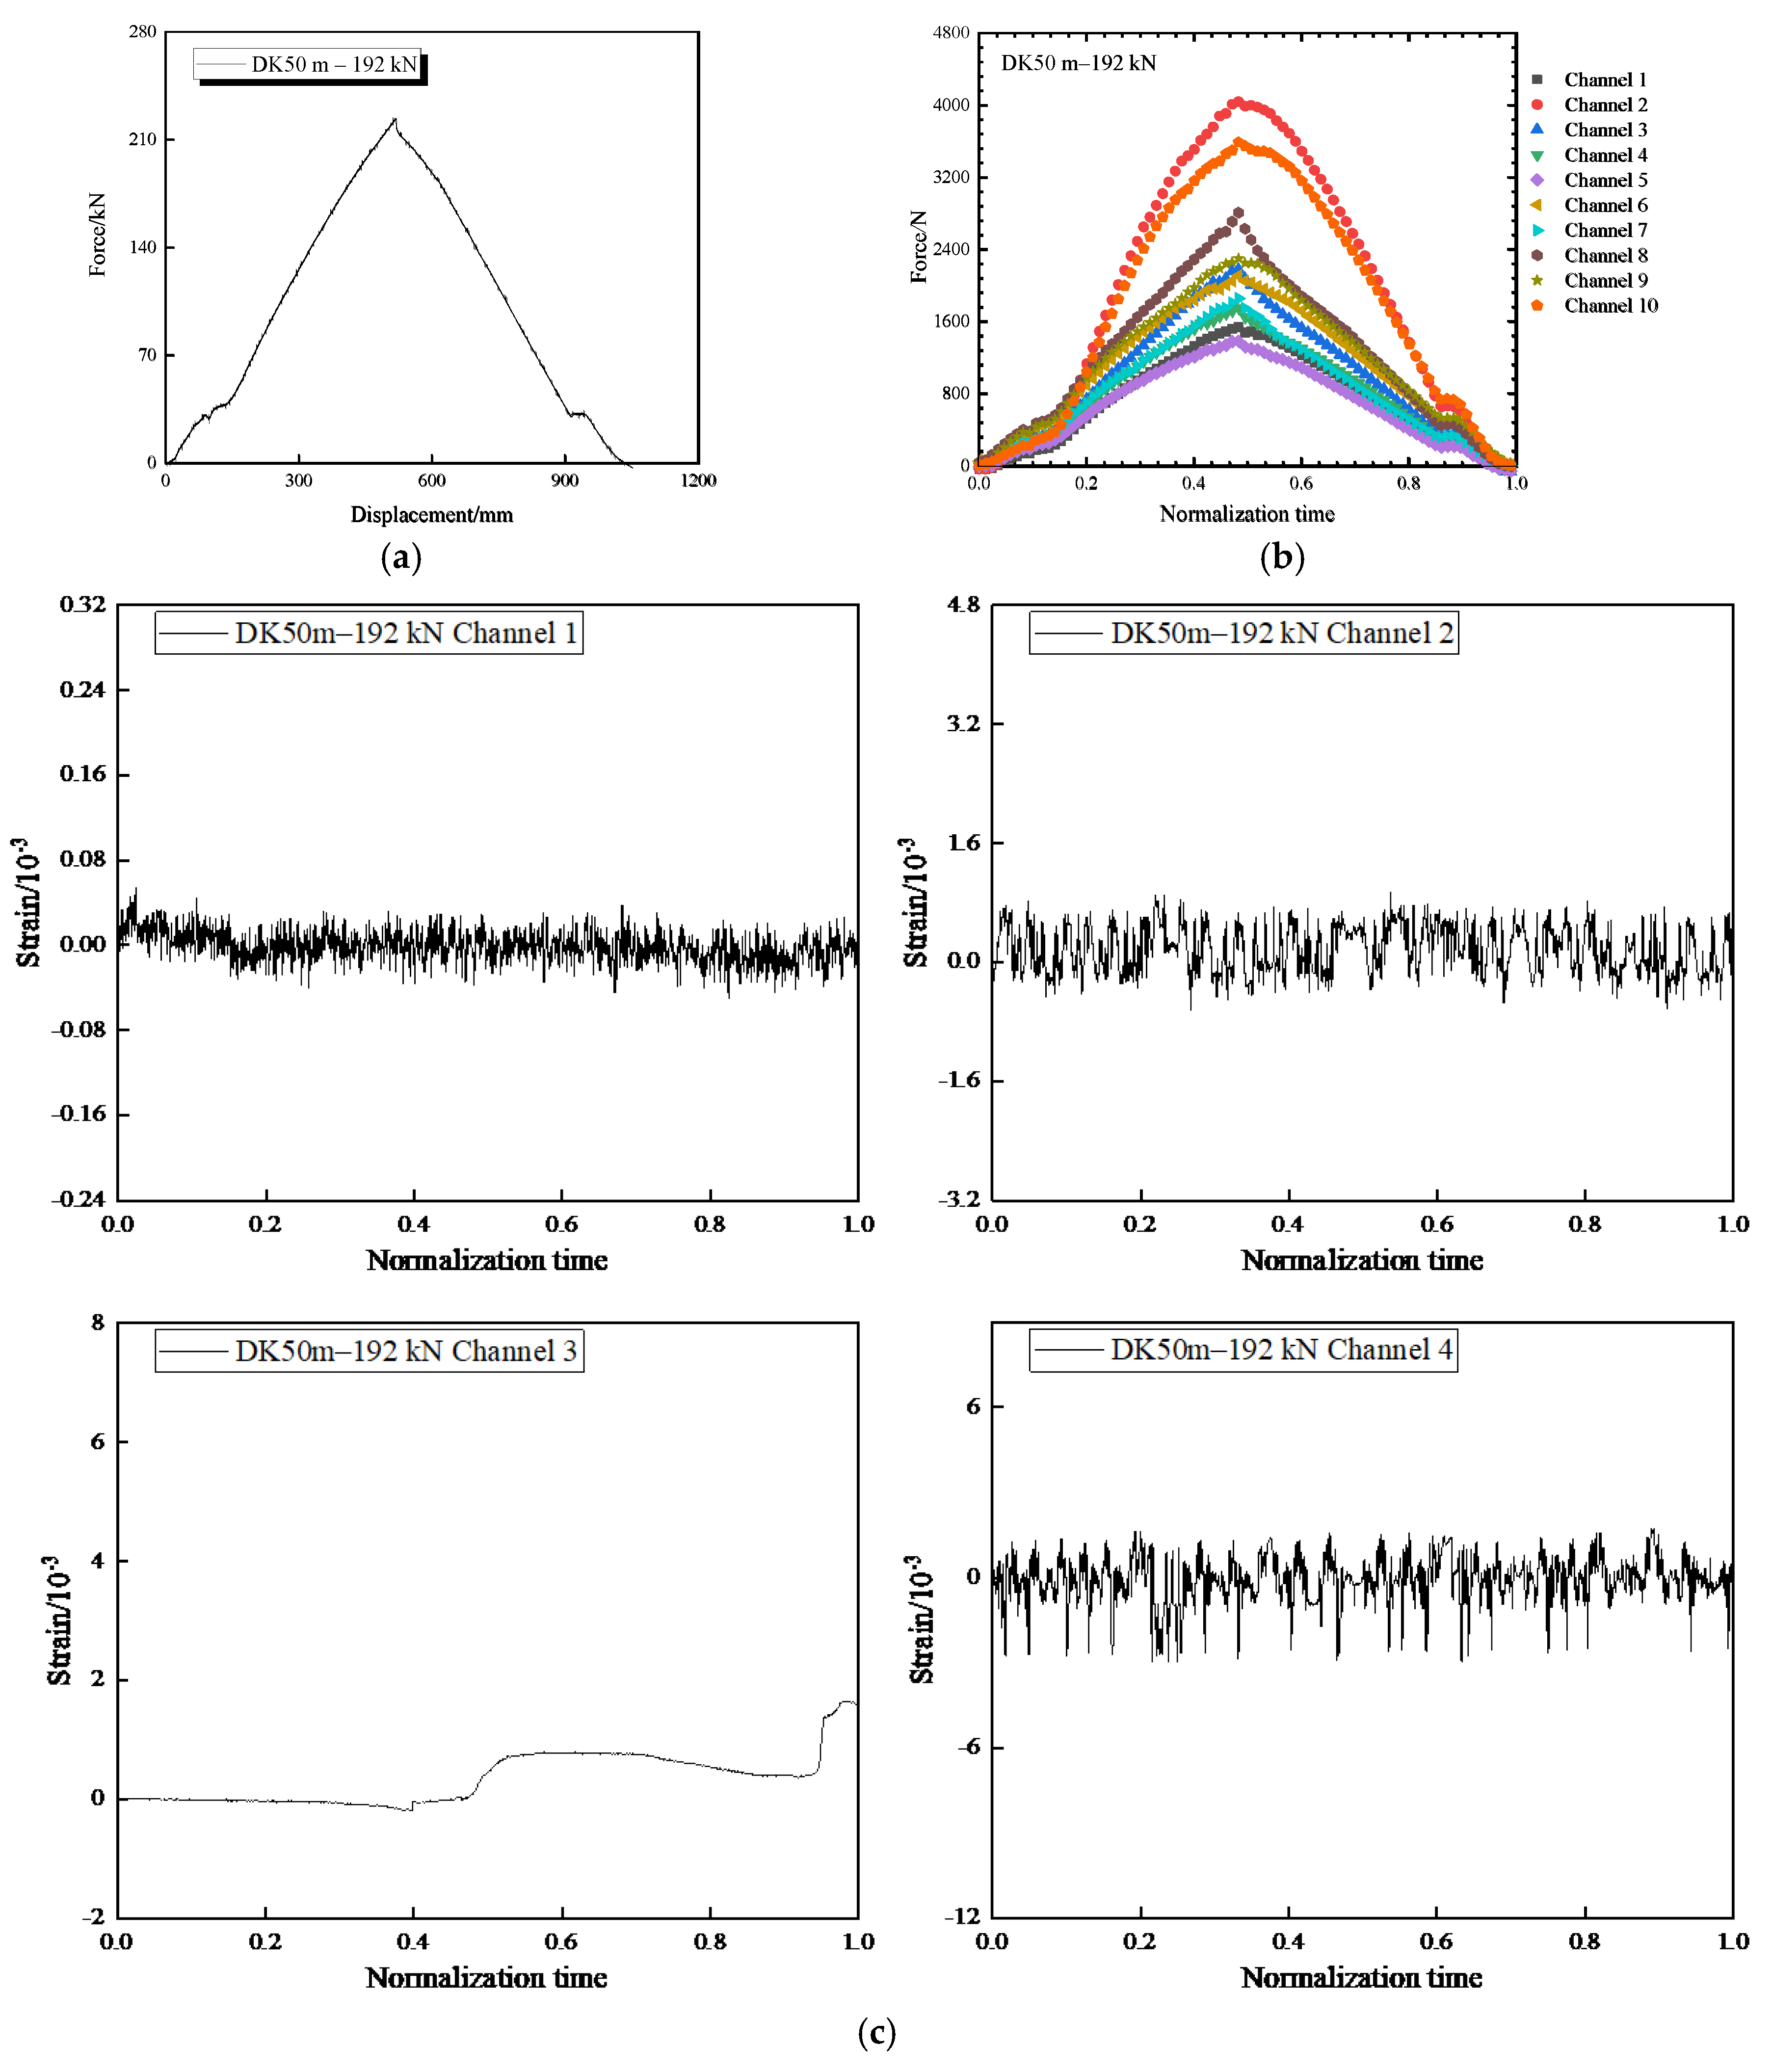
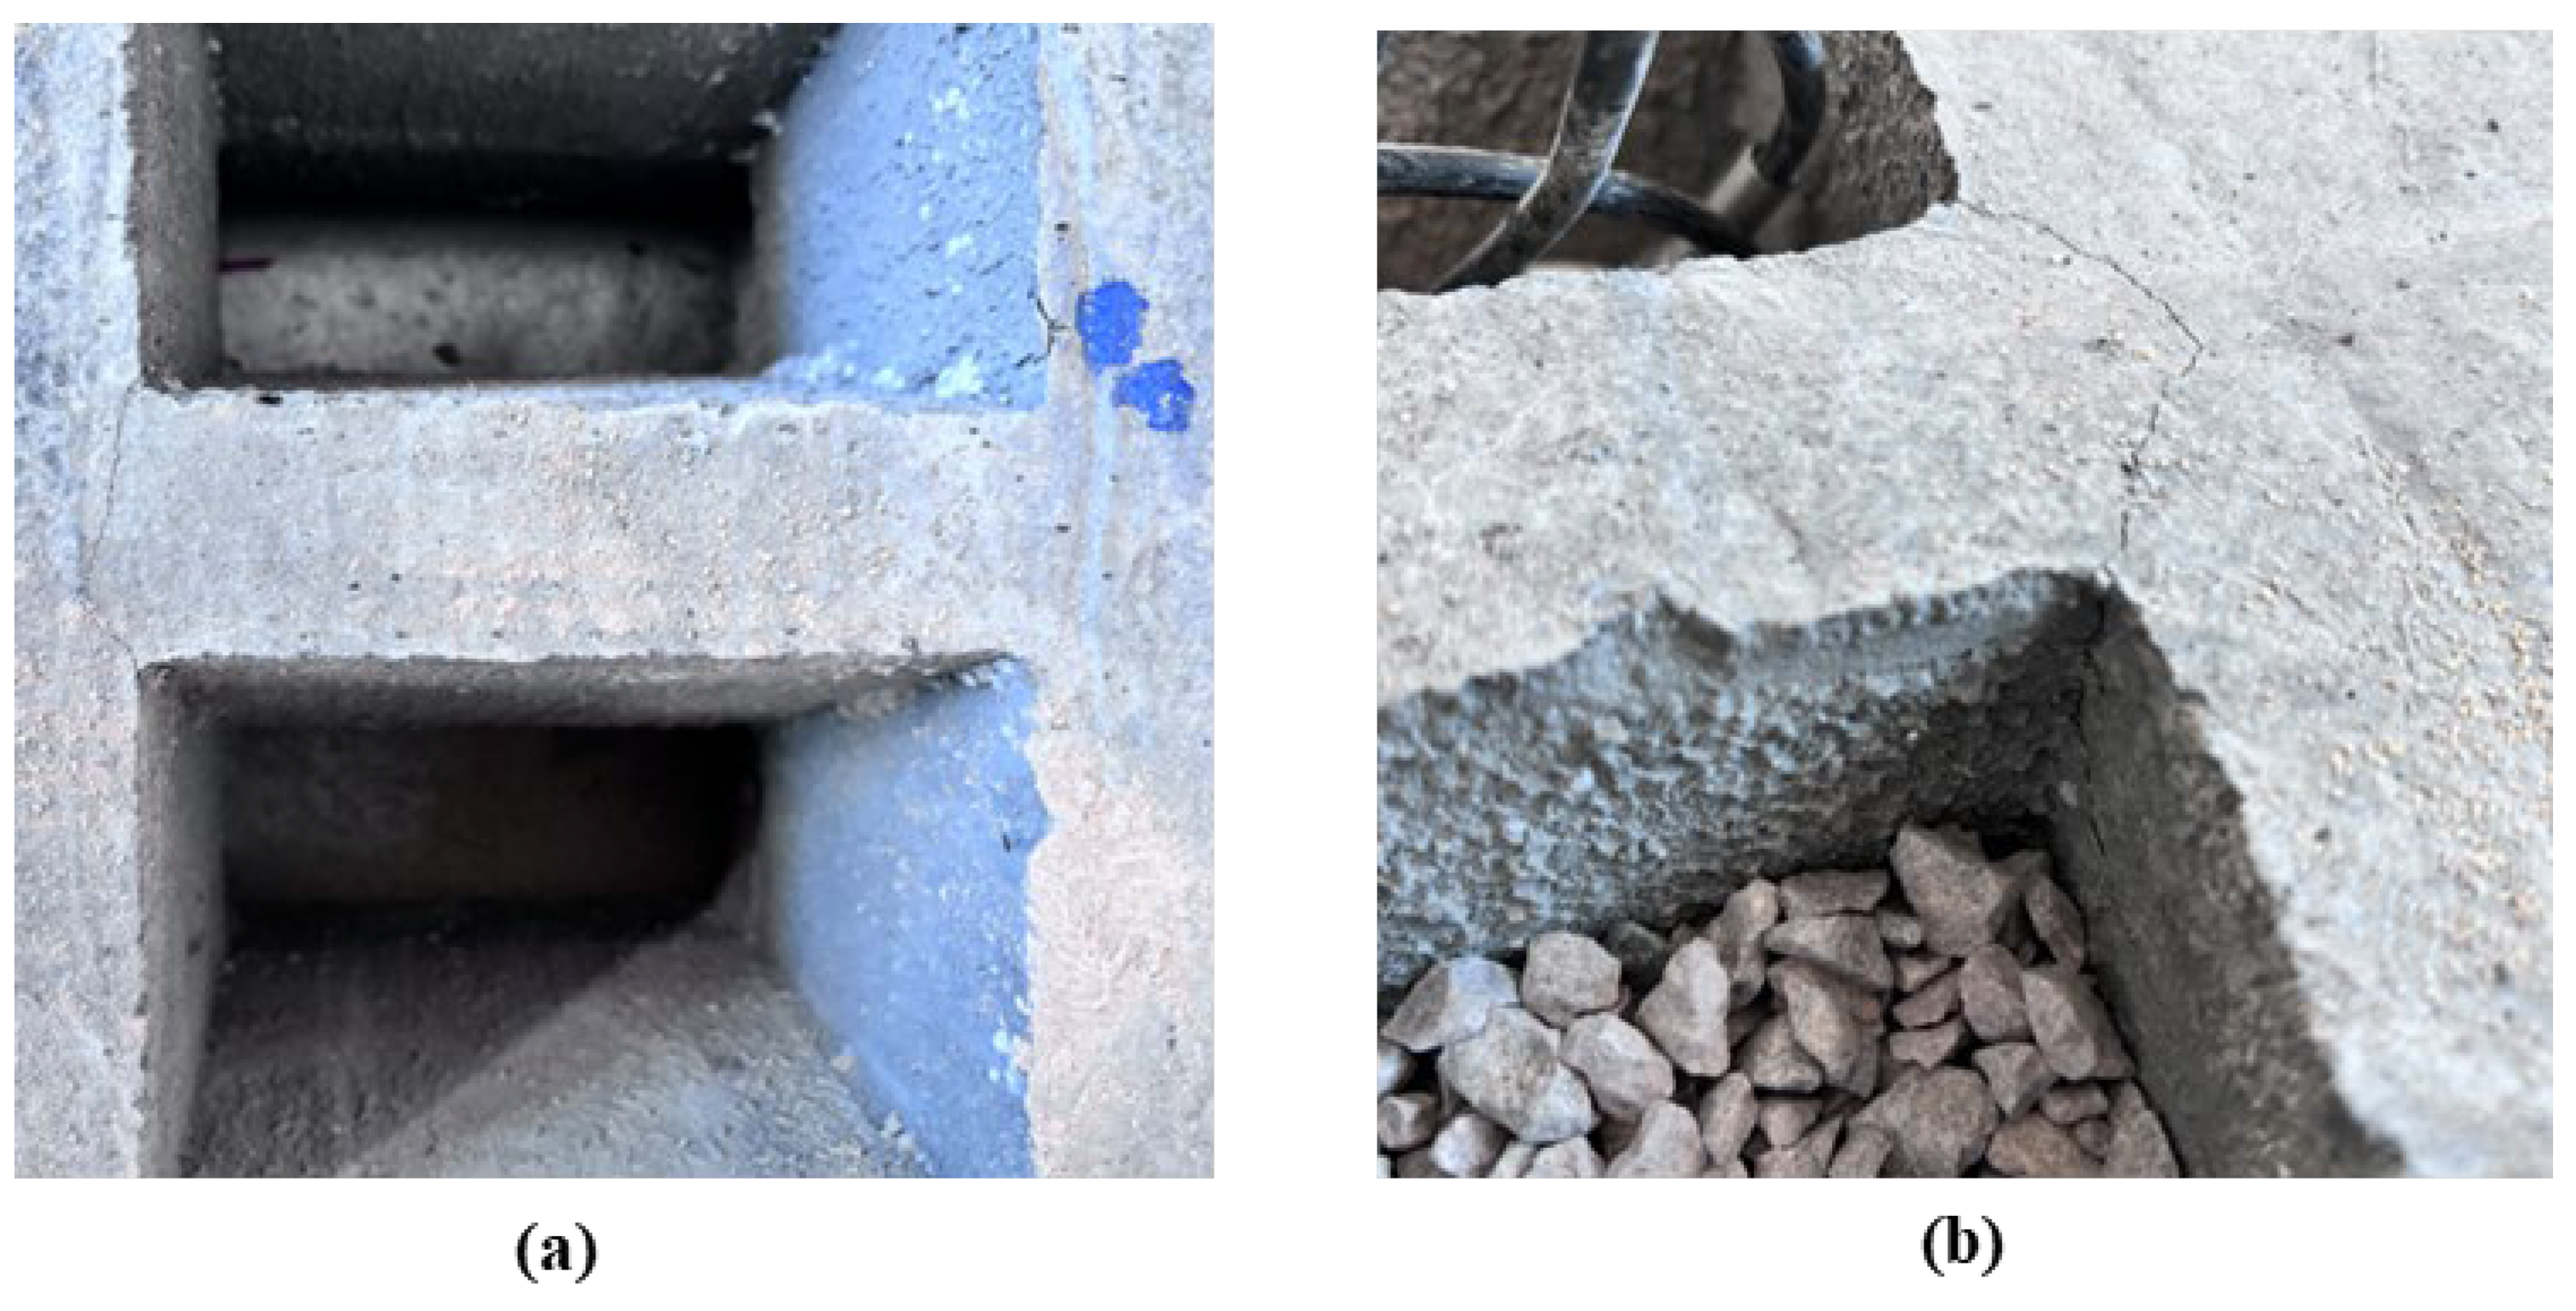
5. Overall Collapse Impact Effect

For the uncovered bottom structure, a rockfall load of 64 kN was applied at a loading rate of 1 kN/s. The load was maintained at 64 kN for 120 s before being unloaded back to the initial state. The mechanical response was characterized by a relatively linear load–displacement behavior, with the earth pressure gauges recording varying peak loads at different locations, shown in Figure 18. The highest force value was recorded in channel 2, while the lowest was in channel 10. This variation indicates the non-uniform distribution of impact forces across the bottom structure.
When the bottom structure was subjected to a 50 m overlying soil layer, the loading protocol involved an initial load of 32 kN at a rate of 1 kN/s, maintained for 30 s, followed by an increase to 96 kN, and then it was unloaded along the loading path to the initial state for 120 s. The load–displacement curve exhibited a more pronounced nonlinear behavior compared to the uncovered scenario. The earth pressure gauges recorded peak loads with the highest value in channel 2 and the lowest in channel 7. The presence of the overlying soil layer significantly altered the stress distribution and mechanical response of the bottom structure.
For the bottom structure with a 100 m overlying soil layer, the loading protocol included an initial load of 64 kN at a rate of 1 kN/s for 30 s, followed by an increase to 128 kN, and then it was unloaded along the loading path to the initial state for 120 s. The mechanical response showed even more pronounced nonlinear behavior, with significant deformation occurring during the loading to 128 kN. The earth pressure gauges recorded the highest force value in channel 2 and the lowest in channel 7. The overall peak loads were higher than in the 50 m overlying soil layer scenario, indicating that the thicker overlying soil layer resulted in higher static and dynamic forces acting on the bottom structure.
The results demonstrate that while the overall collapse impact does not lead to catastrophic failure of the bottom structure, the mechanical response is significantly influenced by the thickness of the overlying soil layer. The non-uniform distribution of impact forces across the bottom structure underscores the need for advanced numerical and experimental approaches to accurately predict the stability and failure modes under such complex loading conditions. These findings provide valuable insights for the design and assessment of bottom structures in block caving mines, emphasizing the importance of considering the combined effects of static overburden pressure and dynamic impact forces.

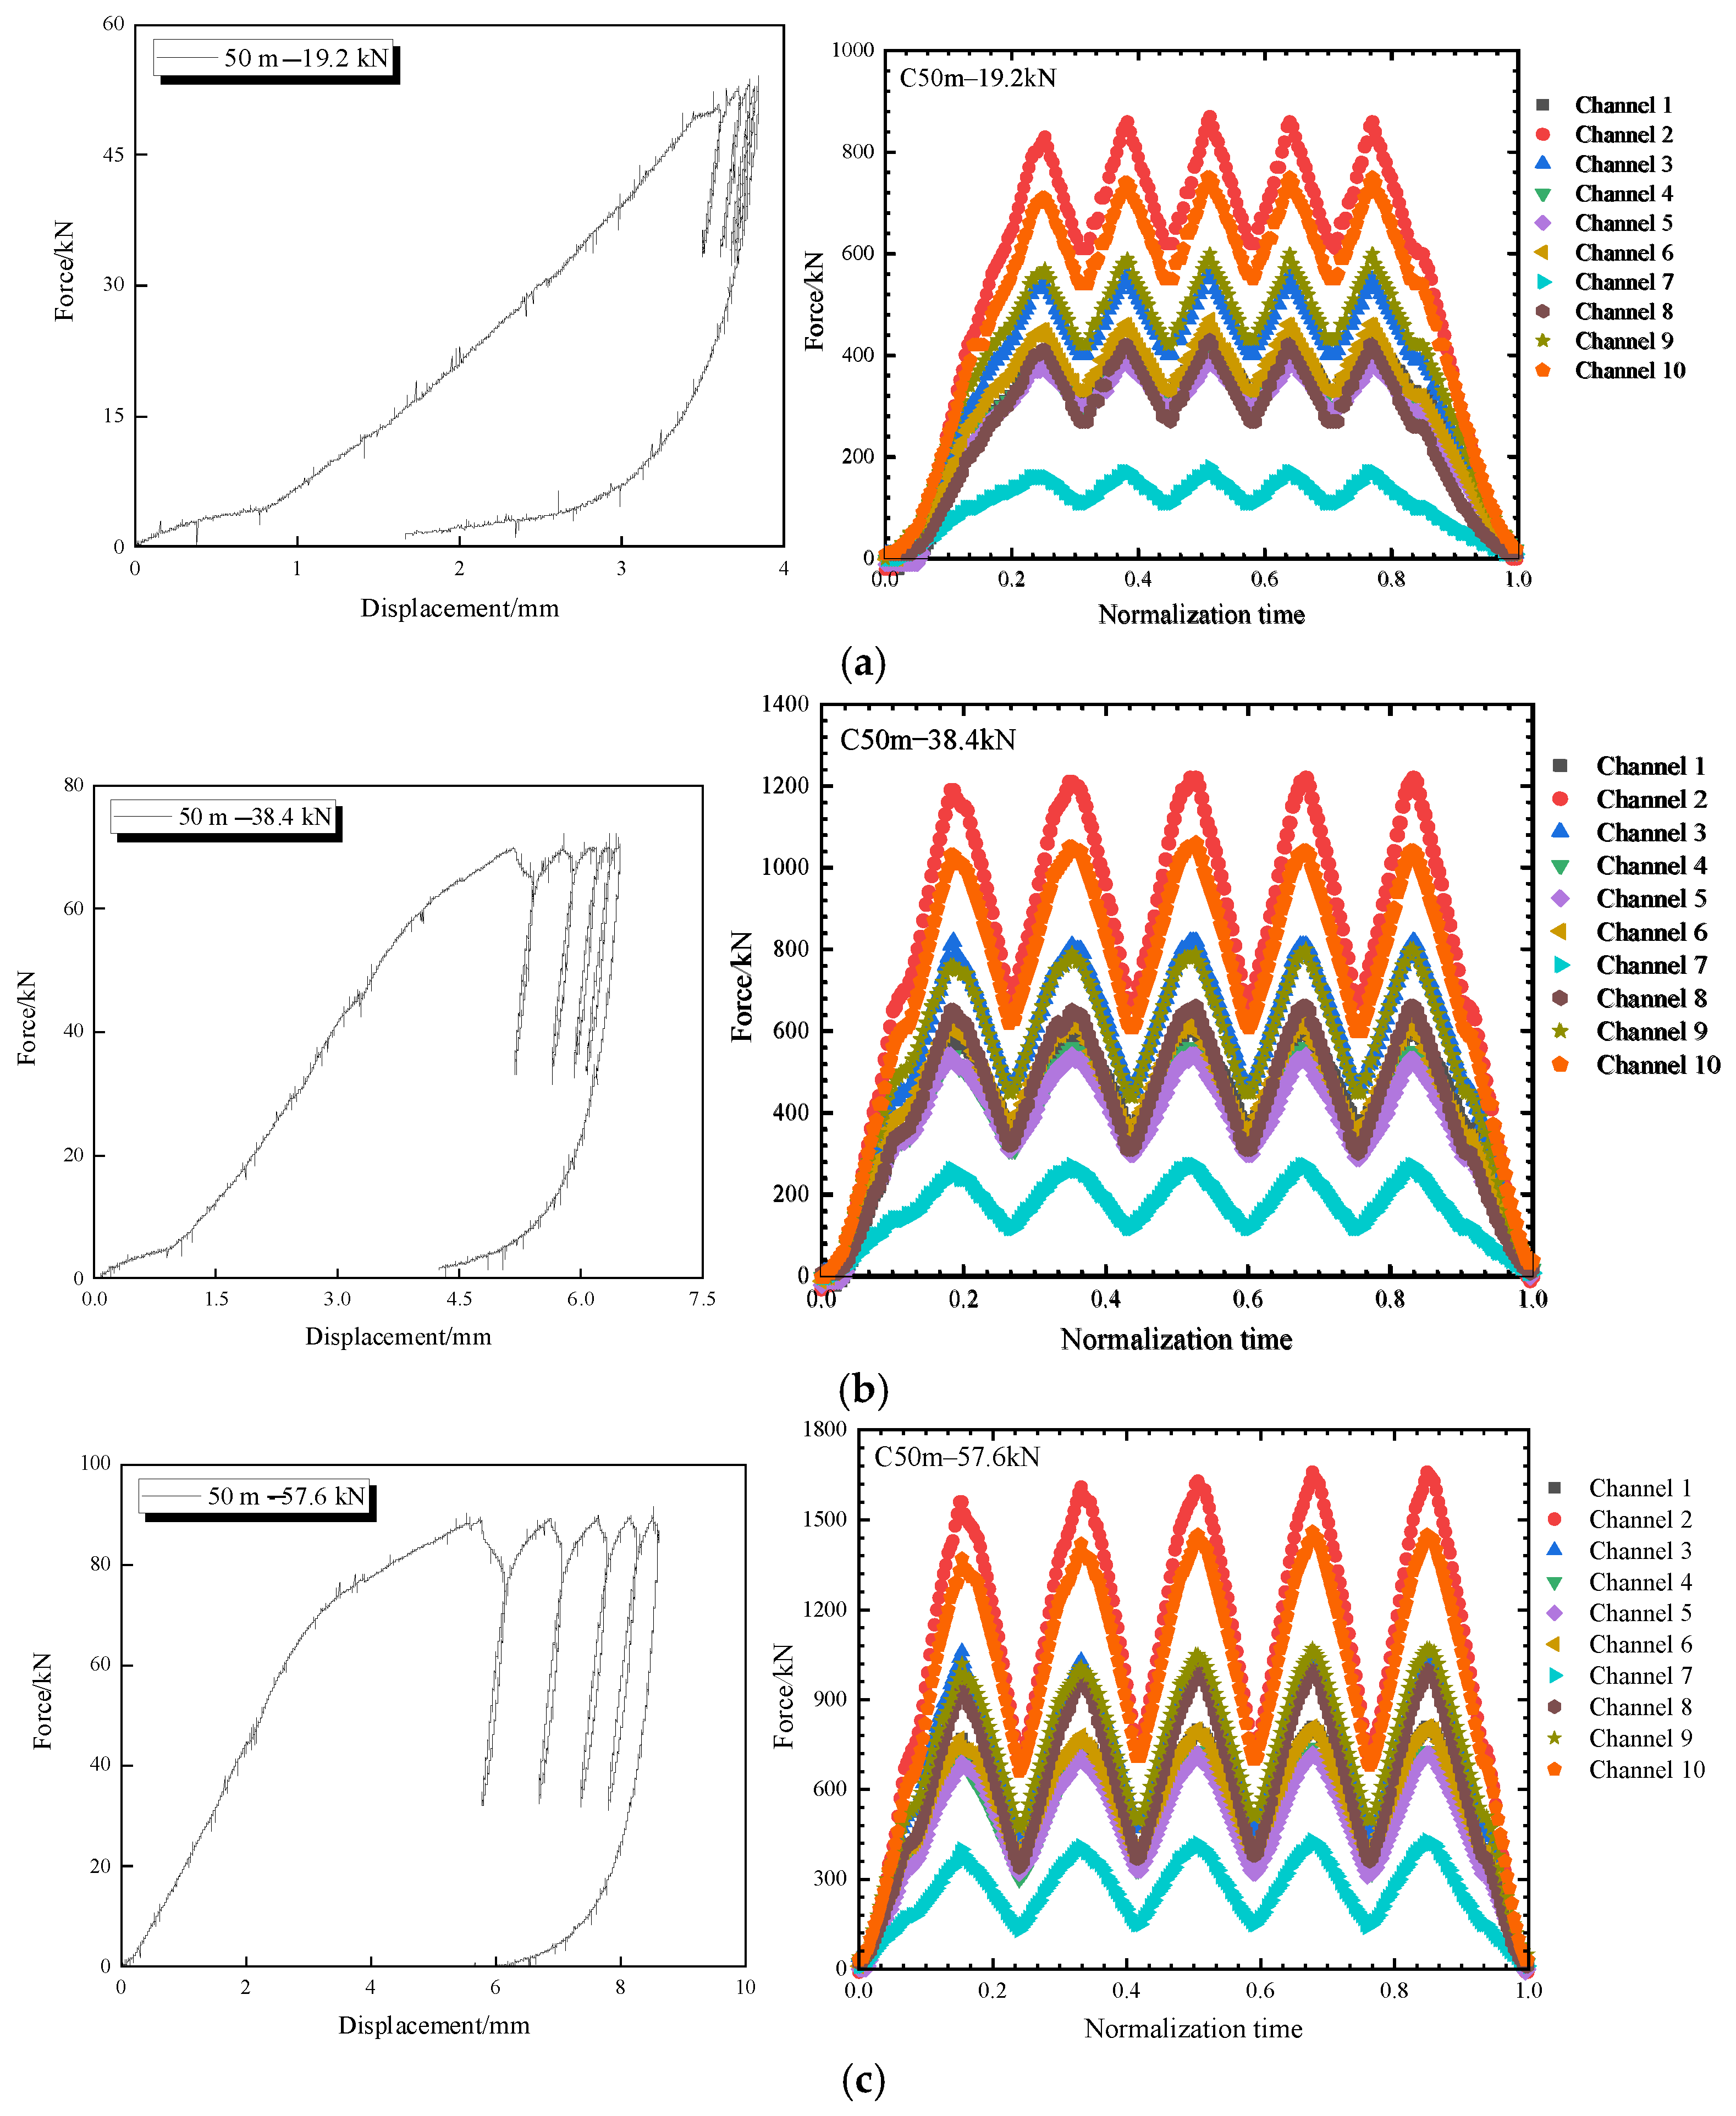
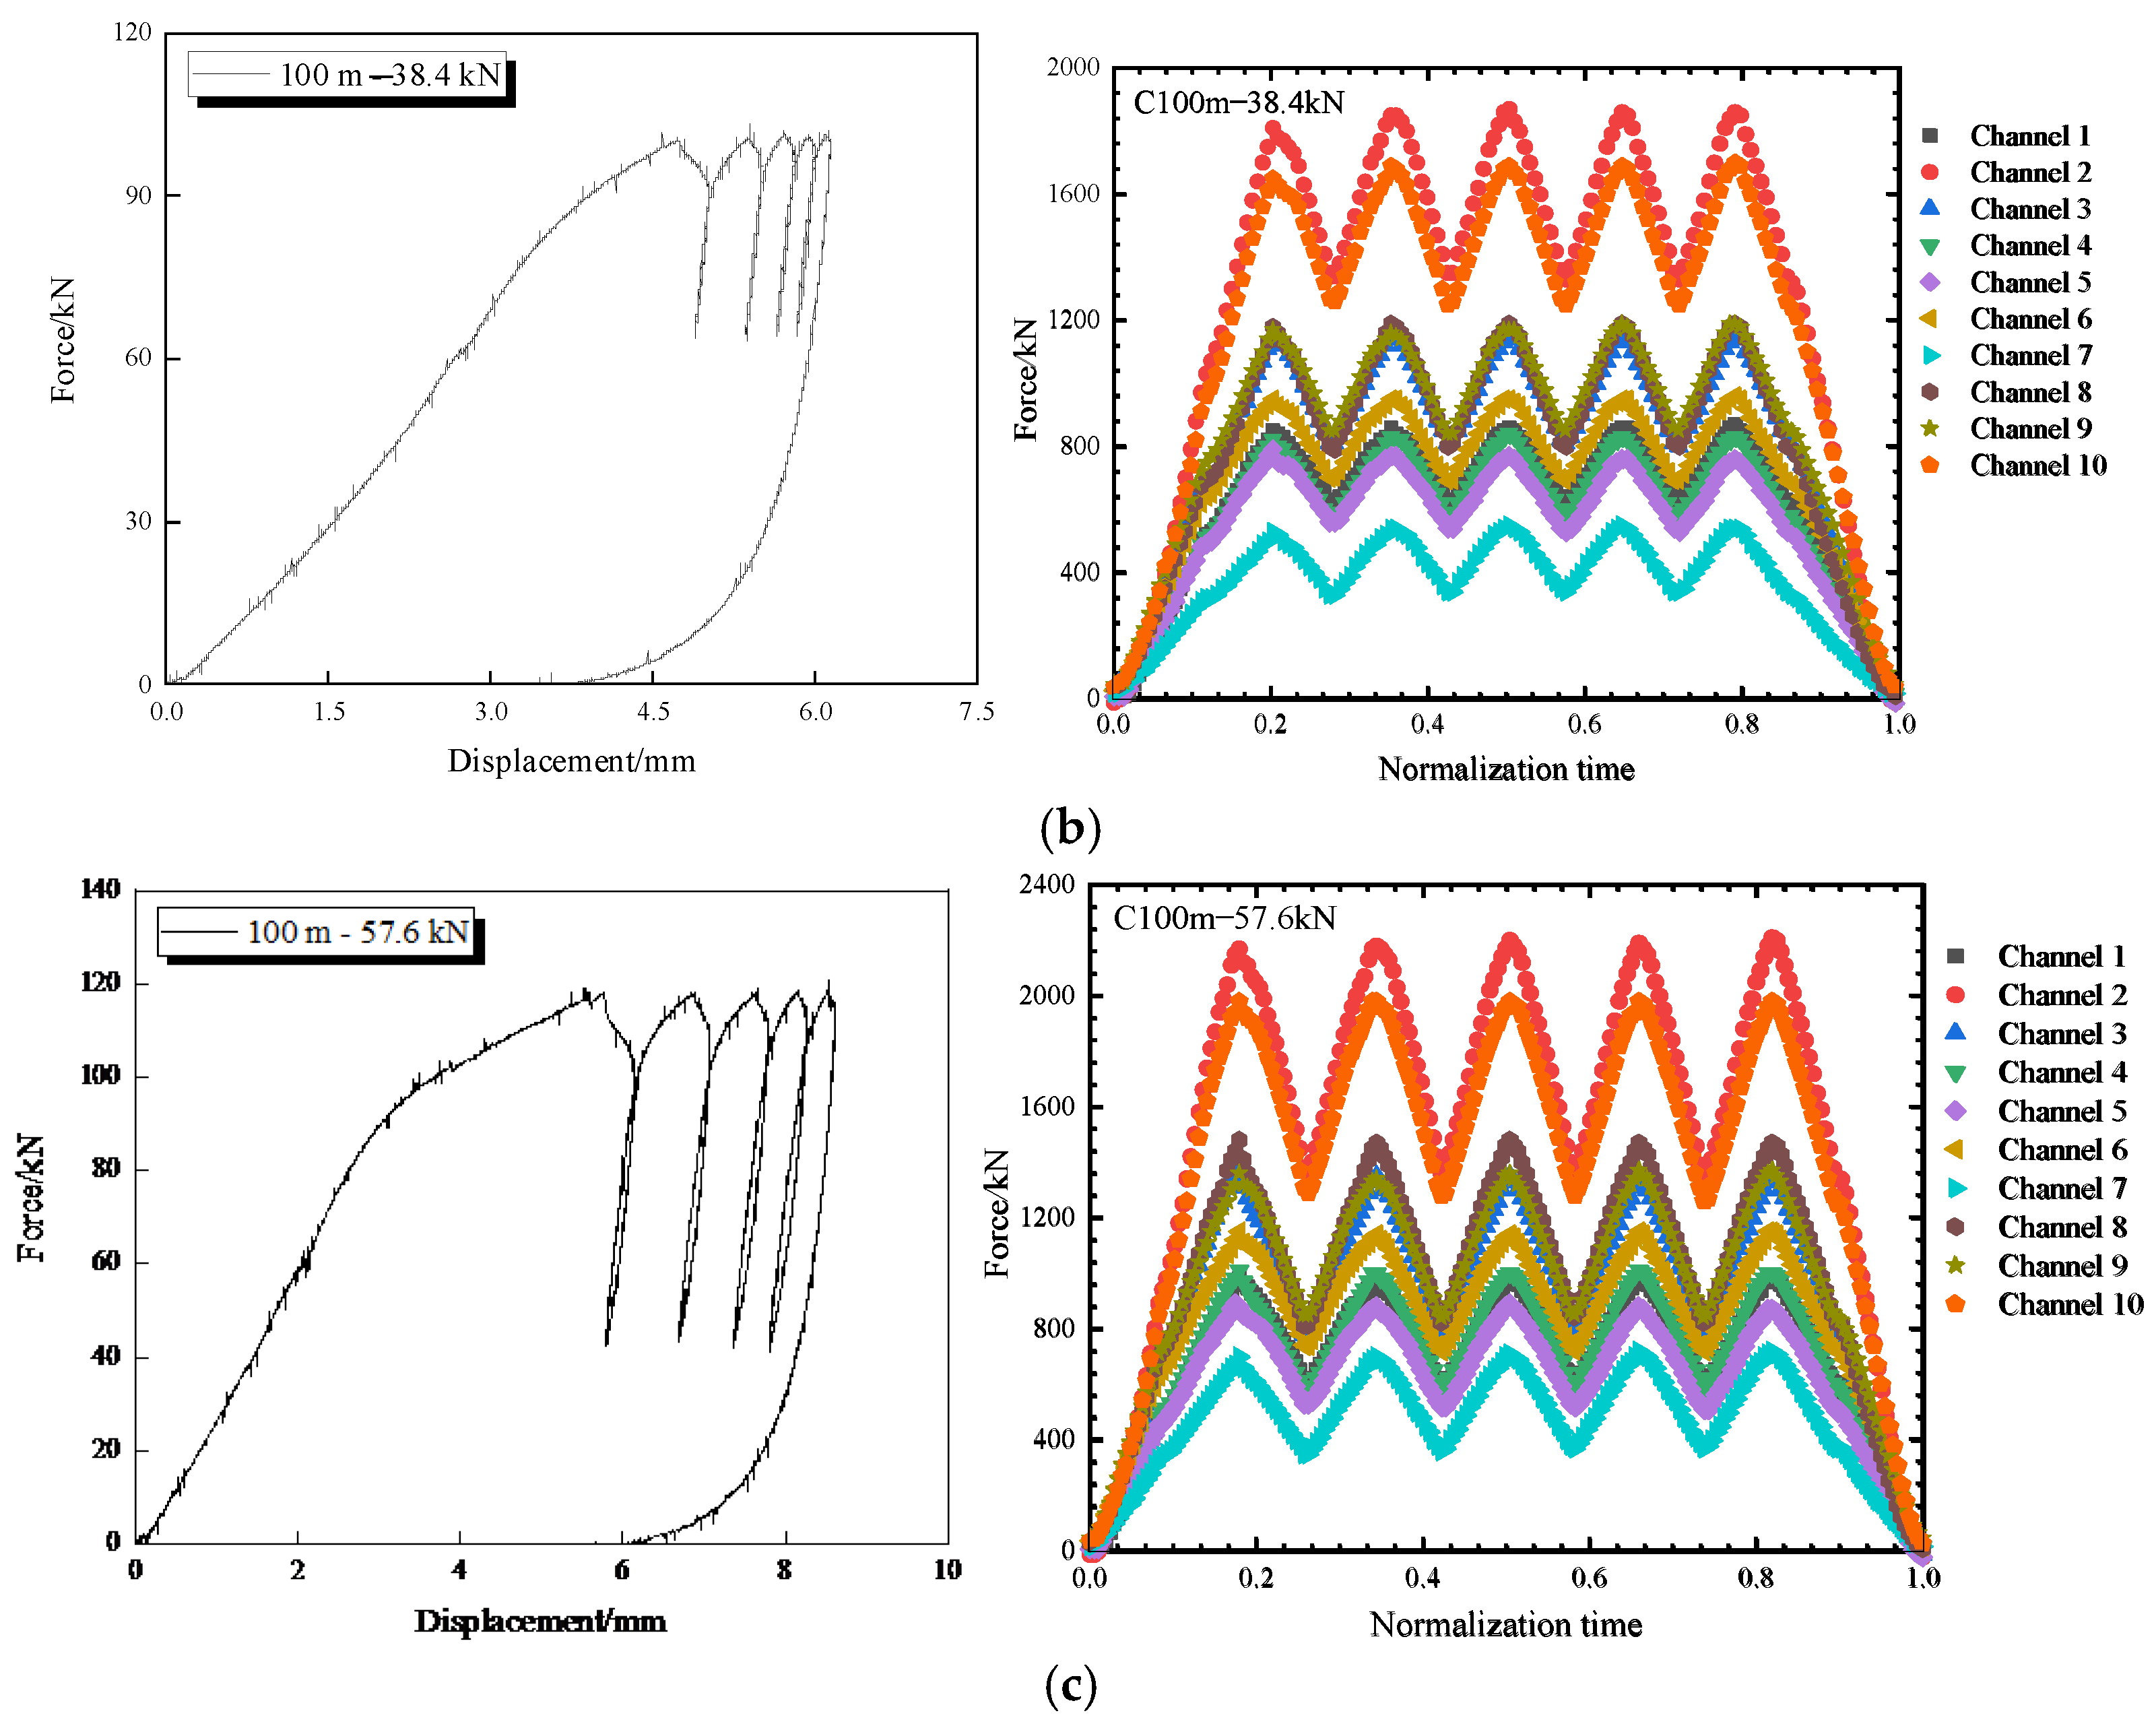
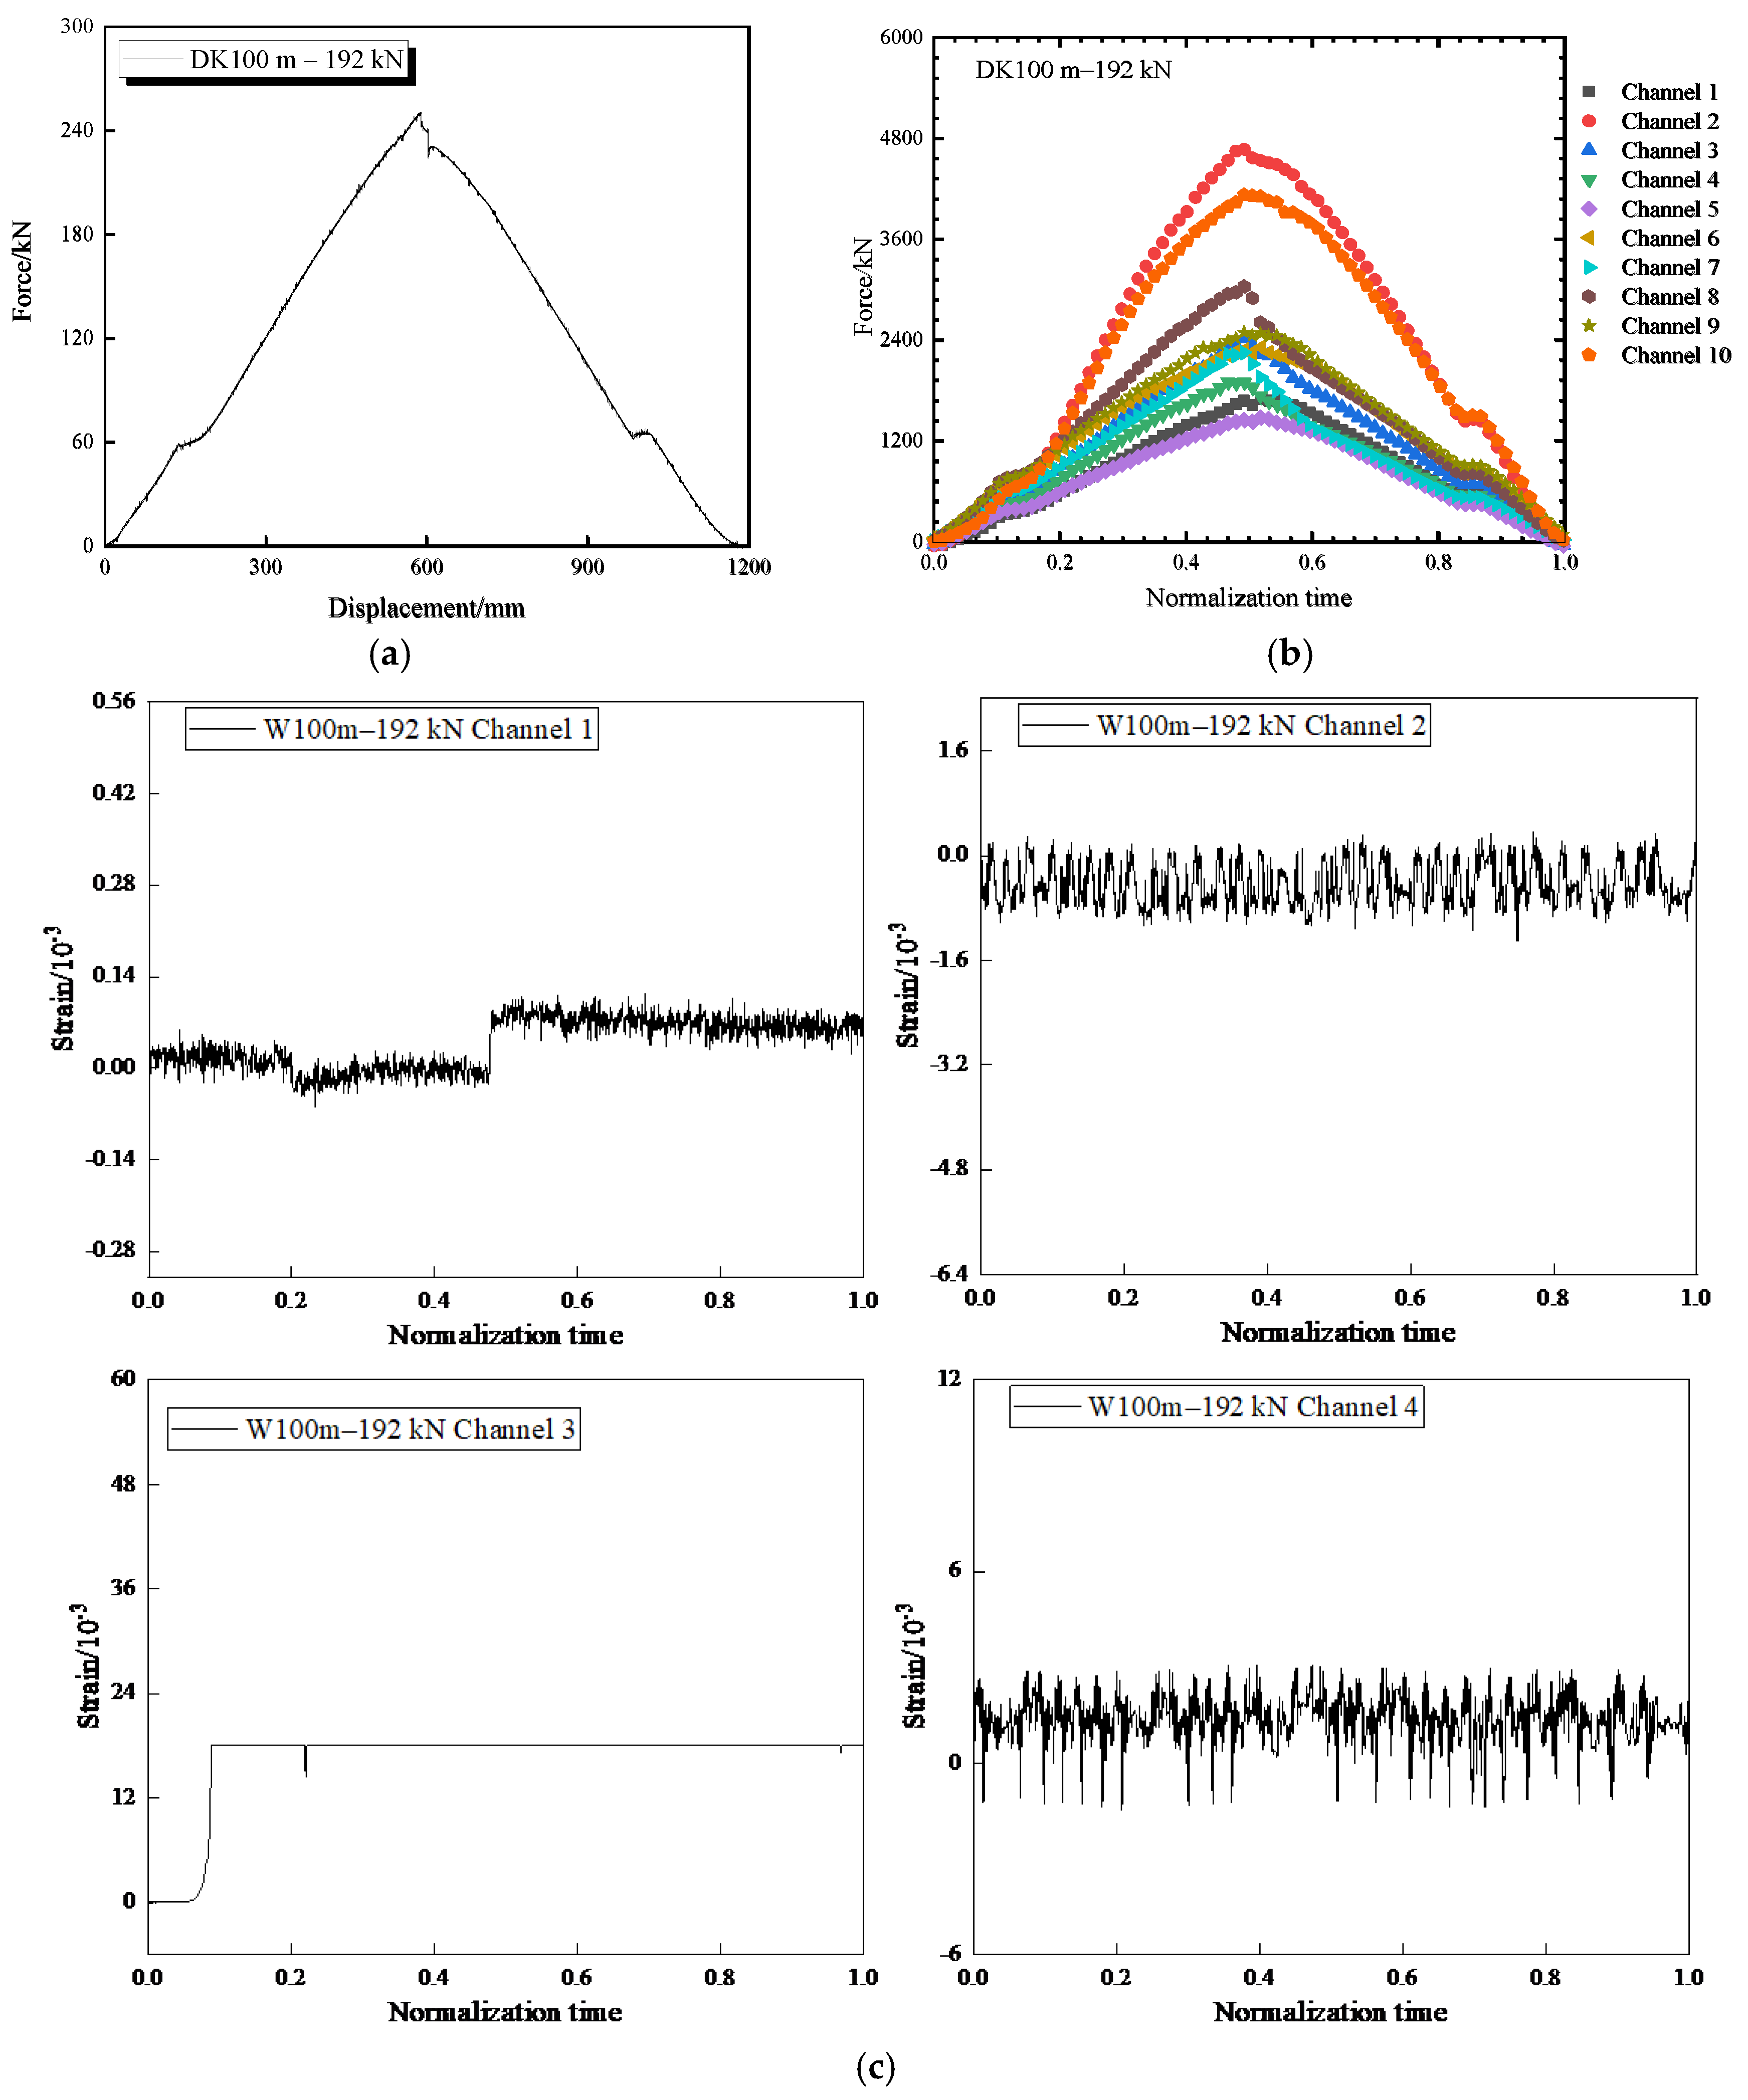
6. Multiple Impact Effects of Progressive Collapse

For the uncovered bottom structure, cyclic loads with amplitudes of 19.2 kN, 38.4 kN, and 57.6 kN were applied. The load–displacement curves (Figure 19a–c) revealed a gradual increase in deformation with each loading cycle, indicating the accumulation of damage over time. The earth pressure gauges recorded varying peak loads at different locations, with the highest force value in channel 2 and the lowest in channel 7. This variation highlights the non-uniform distribution of impact forces across the bottom structure, leading to localized damage.
When the bottom structure was subjected to a 50 m overlying soil layer, cyclic loads with upper limits of 51.2 kN, 38.4 kN, and 57.6 kN were applied (Figure 20). The load–displacement curves (Figure 20a–c) exhibited more pronounced nonlinear behavior compared to the uncovered scenario. The repeated loading and unloading cycles resulted in significant deformation, particularly during the higher amplitude loading sequences. The earth pressure gauges recorded peak loads with the highest value in channel 2 and the lowest in channel 7. The presence of the overlying soil layer significantly influenced the stress distribution and mechanical response, leading to more severe deformation and potential for damage.
For the bottom structure with a 100 m overlying soil layer, cyclic loads with upper limits of 83.2 kN, 38.4 kN, and 57.6 kN were applied (Figure 21). The load–displacement curves (Figure 21a–c) demonstrated even more pronounced nonlinear behavior. The repeated loading and unloading cycles resulted in significant deformation, particularly during the higher amplitude loading sequences. The earth pressure gauges recorded peak loads with the highest value in channel 2 and the lowest in channel 7. The thicker overlying soil layer resulted in higher static and dynamic forces acting on the bottom structure, leading to more severe deformation and potential for damage.
The cumulative damage observed in the bottom structure under multiple impact effects can be attributed to several key mechanisms. The non-uniform distribution of impact forces across the bottom structure leads to localized stress concentrations, particularly at critical locations such as the ore accumulation troughs and the pillars between troughs. The repeated application of cyclic loads results in progressive microcracking and material degradation in these high-stress regions, as evidenced by the increasing deformation and strain accumulation observed in the load–displacement curves (Figure 19, Figure 20 and Figure 21). The cyclic nature of the loading induces fatigue degradation in the material, with each loading cycle contributing to the accumulation of microcracks and the gradual weakening of the structural integrity. The dynamic nature of the impact loads results in stress wave propagation through the bottom structure, leading to dynamic amplification of the applied loads and higher peak stresses than those predicted by static analysis. The dynamic amplification effect is more pronounced in the presence of an overlying soil layer, as the additional mass and stiffness of the soil layer can modify the wave propagation characteristics and further amplify the impact forces. The repeated impacts lead to progressive failure of critical components such as the ore pillars and the inner walls of the ore accumulation troughs, with initial microcracking and material degradation accumulating over time to result in macroscopic failure modes such as pillar fracture and trough wall peeling.

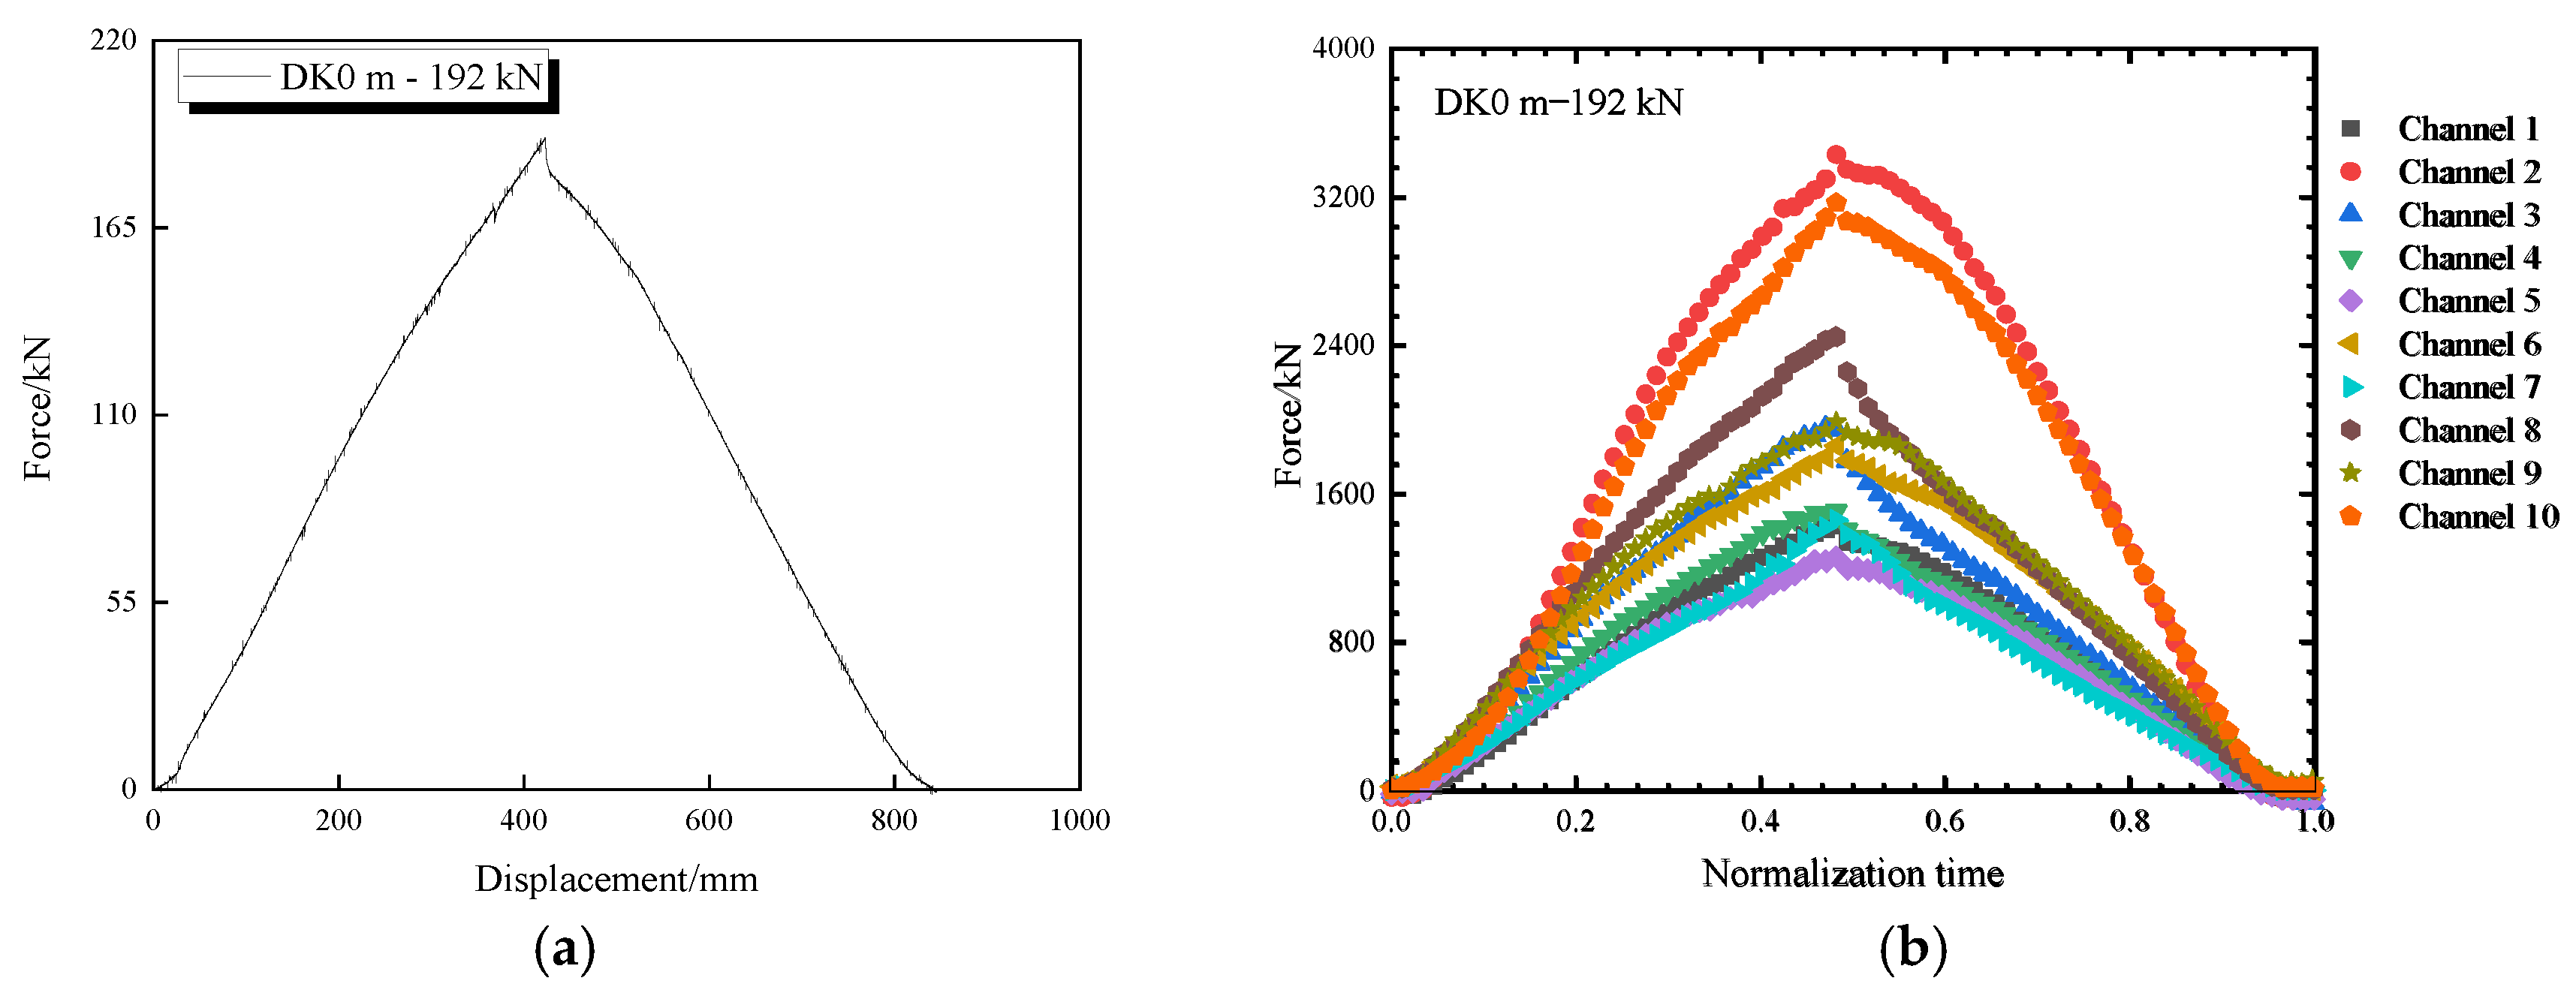
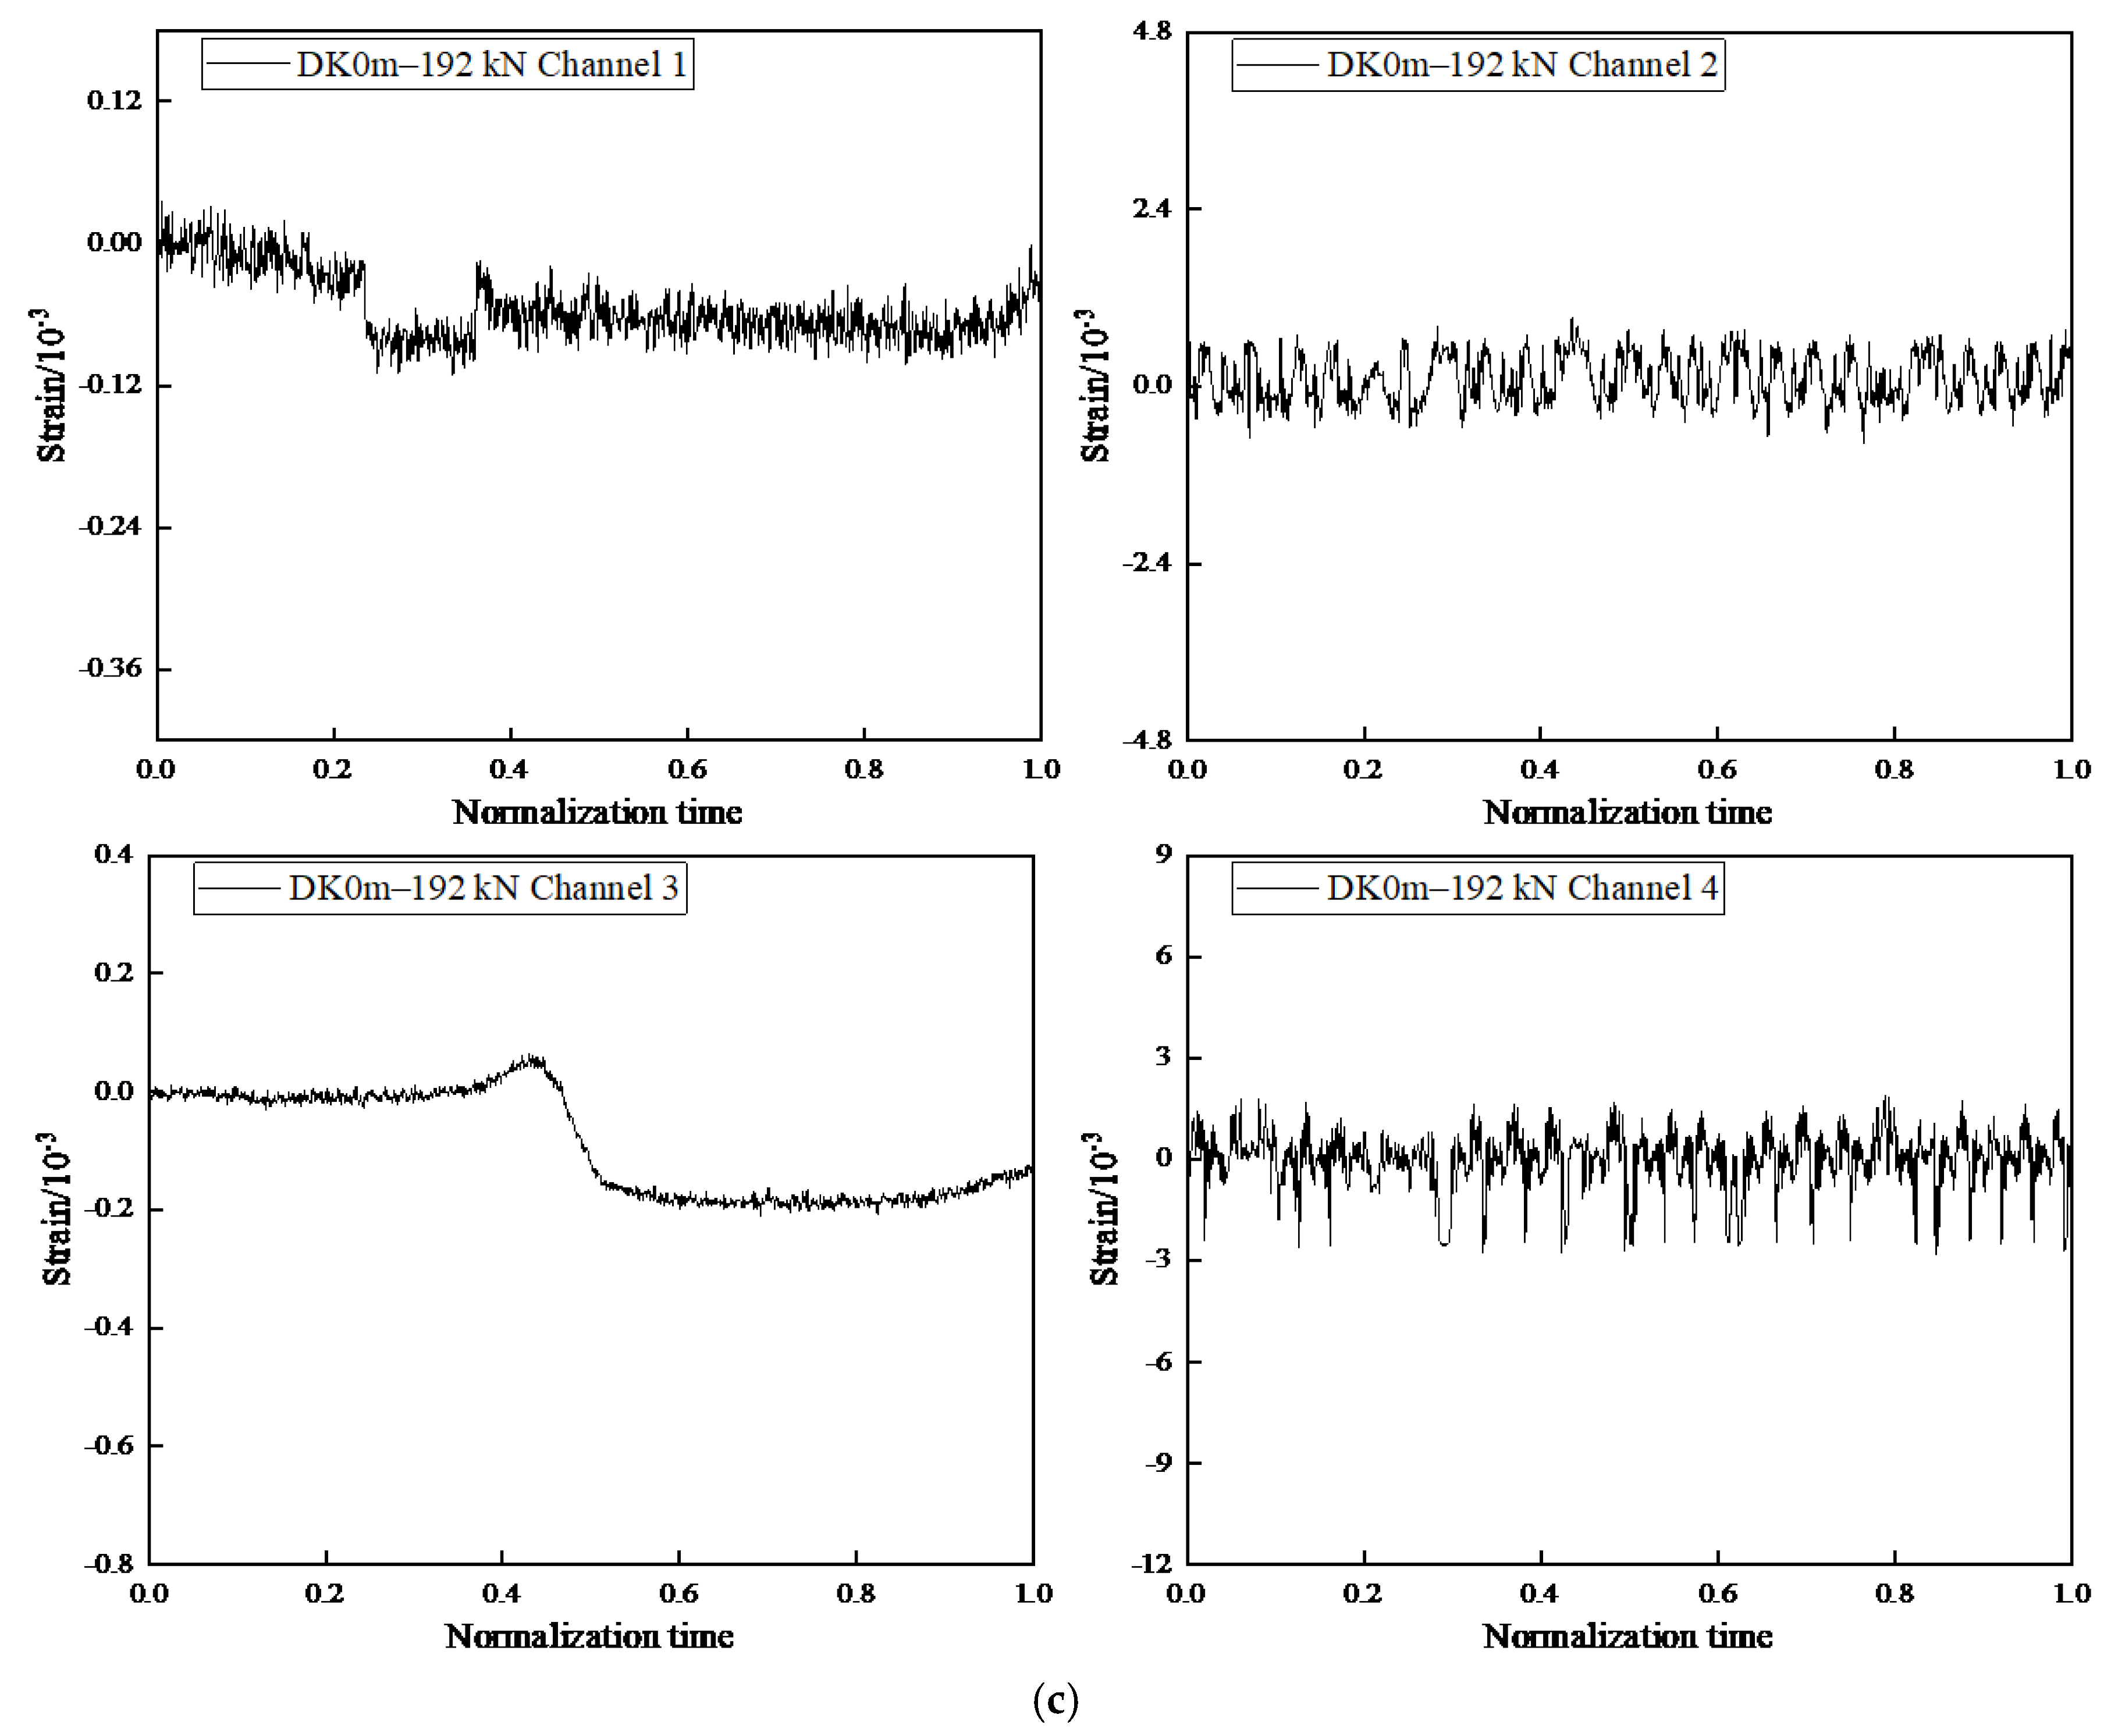
7. Overall Large Block Collapse Impact Effect

For the uncovered bottom structure, an impact load of 192 kN was applied (Figure 22). The load–displacement curve (Figure 22a) showed a significant increase in deformation, with a notable stress drop at the peak load point, indicating localized failure. The earth pressure gauges recorded varying peak loads at different locations, with the highest force value in channel 2 and the lowest in channel 5. The mechanical response revealed that the bottom structure experienced significant strain accumulation and localized damage, particularly in the form of fractured pillars between the ore accumulation troughs (Figure 23).
When the bottom structure was subjected to a 50 m overlying soil layer, an impact load of 192 kN was applied (Figure 24). The load–displacement curve (Figure 24a) exhibited more pronounced nonlinear behavior compared to the uncovered scenario. The repeated loading and unloading cycles resulted in significant deformation, particularly during the higher amplitude loading sequences. The earth pressure gauges recorded peak loads with the highest value in channel 2 and the lowest in channel 5. The presence of the overlying soil layer significantly influenced the stress distribution and mechanical response, leading to more severe deformation and potential for damage. The bottom structure sample showed fractured pillars between the ore accumulation troughs and signs of peeling failure in the trough walls (Figure 25).
For the bottom structure with a 100 m overlying soil layer, an impact load of 192 kN was applied (Figure 26). The load–displacement curve (Figure 26a) demonstrated even more pronounced nonlinear behavior. The repeated loading and unloading cycles resulted in significant deformation, particularly during the higher amplitude loading sequences. The earth pressure gauges recorded peak loads with the highest value in channel 2 and the lowest in channel 5. The thicker overlying soil layer resulted in higher static and dynamic forces acting on the bottom structure, leading to more severe deformation and potential for damage. The bottom structure sample showed fractured pillars between the ore accumulation troughs, cracking at the arch of the ore extraction route, and significant peeling and damage to the trough walls (Figure 27).
The damage observed in the bottom structure under large block collapse impact can be attributed to several key mechanisms. (1) High-Energy Impact Loading: The sudden release of high-energy impacts from large rock blocks results in significant stress concentrations at critical locations such as the ore accumulation troughs and the pillars between troughs. The high-magnitude impact loads cause immediate and localized damage, as evidenced by the fractured pillars and peeling of the trough walls (Figure 23, Figure 25 and Figure 27). (2) Stress Wave Propagation: The dynamic nature of the impact loads results in stress wave propagation through the bottom structure. These stress waves can cause dynamic amplification of the applied loads, leading to higher peak stresses than those predicted by static analysis. The dynamic amplification effect is more pronounced in the presence of an overlying soil layer, as the additional mass and stiffness of the soil layer can modify the wave propagation characteristics and further amplify the impact forces. (3) Material Degradation: The repeated application of high-magnitude impact loads results in progressive material degradation in the bottom structure. The initial microcracking and material weakening accumulate over time, leading to macroscopic failure modes such as pillar fracture and trough wall peeling. The load–displacement curves (Figure 22, Figure 24 and Figure 26) show increasing deformation and strain accumulation, indicating the progressive loss of stiffness and strength in the bottom structure. (4) Overburden Influence: The presence and thickness of the overlying soil layer significantly influence the stress distribution and mechanical response of the bottom structure. The additional static overburden pressure from the soil layer, combined with the dynamic impact forces, results in higher overall forces acting on the bottom structure. This leads to more severe deformation and potential for damage, particularly in the form of fractured pillars and trough wall peeling (Figure 25 and Figure 27).

8. Conclusions

(1) The stability of bottom structures in block caving mines is significantly challenged by impact loads generated from large rockfalls and ore collapses on slopes. This study investigated the mechanical response and failure characteristics of bottom structures under dynamic and cyclic loading conditions through a combination of discrete element method (DEM) simulations and true triaxial tests. The results provide valuable insights into the damage mechanisms and stability of bottom structures under complex loading scenarios.
(2) The impact loads generated by slope collapses can be categorized into three types: overall impact from large-scale slope collapses, localized impact from partial rock and soil mass collapses, and continuous multiple impacts from progressive slope failures. The experimental and numerical investigations revealed that while overall and multiple impact loads from slope collapses do not lead to catastrophic failure of the bottom structure, severe damage occurs under a 100 m thickness of ore and large block impacts. Specifically, the inner walls of ore accumulation troughs peel off, and ore pillars between troughs fracture and fail.
(3) The mechanical response of the bottom structure under different loading conditions was characterized by varying degrees of deformation and strain accumulation. The presence and thickness of the overlying soil layer significantly influenced the stress distribution and mechanical response, leading to more severe deformation and potential for damage. The results highlight the importance of considering the combined effects of static overburden pressure and dynamic impact forces in the design and assessment of bottom structures in block caving mines.
(4) In the future, it is necessary to conduct experiments on the impact of blasting loads on the stability of the bottom structure. As blasting loads are high-frequency loads, Hopkinson bar technology needs to be utilized to achieve the desired experimental results.

Author Contributions

Software, G.L., Z.W. and H.L.; Formal analysis, X.F.; Investigation, G.L., Z.H. and H.L.; Resources, X.F., Z.W., X.Z. and H.L.; Data curation, G.L. and Z.H.; Writing—original draft, X.F., Z.W. and X.Z.; Writing—review & editing, X.F. All authors have read and agreed to the published version of the manuscript.

Funding

This paper receives its funding from Projects (5247042340, 42277175) supported by National Natural Science Foundation of China; Project (2023JJ30657) supported by Hunan Provincial Natural Science Foundation of China; Yunnan Province Science and Technology Plan Project (202205AD160063); Hunan provincial key research and development Program (2022SK2082).

Institutional Review Board Statement

Not applicable.

Informed Consent Statement

Not applicable.

Data Availability Statement

The raw data supporting the conclusions of this article will be made available by the authors on request.

Conflicts of Interest

Authors Xinglong Feng, Guangquan Li and Zhenggao Huang were employed by the company Yunnan Diqing Non-Ferrous Metals Co., Ltd. The remaining authors declare that the research was conducted in the absence of any commercial or financial relationships that could be construed as a potential conflict of interest.

References

  1. Brown, E.T. Block Caving Geomechanics; The University of Queensland: Brisbane, Australia, 2007. [Google Scholar]
  2. Brzovic, A.; Villaescusa, E. Rock mass characterization and assessment of block-forming geological discontinuities during caving of primary copper ore at the El Teniente mine, Chile. Int. J. Rock Mech. Min. Sci. 2007, 44, 565–583. [Google Scholar] [CrossRef]
  3. Wu, A.X.; Sun, Y.Z.; Gour, S.; Shen, H.M.; Yang, B.H. Characteristics of rockburst and its mining technology in mines. J. Cent. South Univ. 2002, 9, 255–259. [Google Scholar] [CrossRef]
  4. Dorador, L.; Eberhardt, E.; Elmo, D. Influence of Block Strength and Veining on Secondary Fragmentation Related to Block Caving; International Society of Offshore and Polar Engineers: Mountain View, CA, USA, 2015. [Google Scholar]
  5. Vyazmensky, A.; Stead, D.; Elmo, D.; Moss, A. Numerical Analysis of Block Caving-Induced Instability in Large Open Pit Slopes: A Finite Element/Discrete Element Approach. Rock Mech. Rock Eng. 2010, 43, 21–39. [Google Scholar] [CrossRef]
  6. Wang, Z.; Lin, H.; Yang, C. Fatigue-thermal damage characteristics of red sandstone with a hole under high-temperature cyclic loading coupling and microstructural degradation. J. Mater. Res. Technol. 2024, 33, 3250–3263. [Google Scholar] [CrossRef]
  7. Wang, Z.; Lin, H.; Feng, X.; Yang, C.; Ou, K.; Chen, Y. Fracture characteristics and damage mechanisms of heat-treated sandstone with combined hole-joint flaws under uniaxial compression. Theor. Appl. Fract. Mech. 2025, 136, 104845. [Google Scholar] [CrossRef]
  8. Wang, Z.; Li, S.; Lin, H.; Chen, Y. Fatigue response and AE characteristics of soft and hard composite rock containing coplanar double joints. Int. J. Fatigue 2025, 198, 108994. [Google Scholar] [CrossRef]
  9. Haimson, B.; Chang, C. A new true triaxial cell for testing mechanical properties of rock, and its use to determine rock strength and deformability of Westerly granite. Int. J. Rock Mech. Min. Sci. 2000, 37, 285–296. [Google Scholar] [CrossRef]
  10. Zheng, Z.; Li, R.; Li, S.; Lu, G.; Zhang, Q.; Qiu, S. A Novel Dynamic Fractional Mechanical Model for Rock Fracture Under True Triaxial Static-Dynamic Combined Loading and its Engineering Application. Rock Mech. Rock Eng. 2024, 57, 9343–9369. [Google Scholar] [CrossRef]
  11. Shen, F.; Qiu, W.; Zhu, H.; Wu, T.; Qi, L.; Xing, M. Numerical simulation of frost heaving deformation of fractured rocks considering heat-force coupling. Theor. Appl. Fract. Mech. 2025, 138, 104921. [Google Scholar] [CrossRef]
  12. Feng, X.-T.; Zhang, X.; Kong, R.; Wang, G. A Novel Mogi Type True Triaxial Testing Apparatus and Its Use to Obtain Complete Stress–Strain Curves of Hard Rocks. Rock Mech. Rock Eng. 2016, 49, 1649–1662. [Google Scholar] [CrossRef]
  13. He, M.C.; Miao, J.L.; Feng, J.L. Rock burst process of limestone and its acoustic emission characteristics under true-triaxial unloading conditions. Int. J. Rock Mech. Min. Sci. 2010, 47, 286–298. [Google Scholar] [CrossRef]
  14. Pierce, M.E. Forecasting vulnerability of deep extraction level excavations to draw-induced cave loads. J. Rock Mech. Geotech. Eng. 2019, 11, 527–534. [Google Scholar] [CrossRef]
  15. Castro, R.; Gómez, R.; Castillo, J.; Jerez, O. Fragmentation model integrated in a gravity flow simulator for block caving planning. Granul. Matter 2024, 26, 22. [Google Scholar] [CrossRef]
  16. Sun, H.; Zhou, S.; Chen, S.; Jin, A.; Yin, Z.; Wang, X.; Dai, Z. Flow characteristics of caved ore and rock under the influence of multiple coarse particles: Insight from interparticle interaction. Granul. Matter 2024, 26, 82. [Google Scholar] [CrossRef]
  17. Zhao, Y.; Wu, Y.; Wang, Y.; He, S.; Li, X.; Zhu, L.; Wang, Z. Study on the influence of 3D pre-existing joint on rockfall fragmentation during impact based on discrete element method. Comput. Geotech. 2025, 184, 107270. [Google Scholar] [CrossRef]
  18. Sánchez, V.; Castro, R.L.; Palma, S. Gravity flow characterization of fine granular material for Block Caving. Int. J. Rock Mech. Min. Sci. 2019, 114, 24–32. [Google Scholar] [CrossRef]
  19. Castro, R.; Gómez, R.; Pierce, M.; Canales, J. Experimental quantification of vertical stresses during gravity flow in block caving. Int. J. Rock Mech. Min. Sci. 2020, 127, 104237. [Google Scholar] [CrossRef]
  20. Xiao, J.-Q.; Ding, D.-X.; Jiang, F.-L.; Xu, G. Fatigue damage variable and evolution of rock subjected to cyclic loading. Int. J. Rock Mech. Min. Sci. 2010, 47, 461–468. [Google Scholar] [CrossRef]
  21. Saavedra, F.; Morales, N.; Nelis, G.; Gómez, R. A fast method to find smooth economic envelopes for block and panel caving mines. Resour. Policy 2023, 83, 103703. [Google Scholar] [CrossRef]
  22. Luo, S.; Gong, F.-q.; Li, L.-l.; Peng, K. Linear energy storage and dissipation laws and damage evolution characteristics of rock under triaxial cyclic compression with different confining pressures. Trans. Nonferrous Met. Soc. China 2023, 33, 2168–2182. [Google Scholar] [CrossRef]
  23. Guan, Z.; Li, Y.; Lai, Z.; Zhou, H.; Qin, J.; Wen, Y.; Chen, Y.; Huang, R. Size effect of concrete based on split Hopkinson pressure bar (SHPB) test. Constr. Build. Mater. 2024, 441, 137499. [Google Scholar] [CrossRef]
  24. Rafiee, R.; Ataei, M.; KhalooKakaie, R.; Jalali, S.E.; Sereshki, F.; Noroozi, M. Numerical modeling of influence parameters in cavabililty of rock mass in block caving mines. Int. J. Rock Mech. Min. Sci. 2018, 105, 22–27. [Google Scholar] [CrossRef]
  25. Zhou, K.-p.; Li, L.; Lin, Y.; Xiong, X.; Yang, N.-g.; Chen, S.-l. New method and application of disturbance range prediction for caving method of metal ore. Trans. Nonferrous Met. Soc. China 2023, 33, 889–901. [Google Scholar] [CrossRef]
  26. Jiang, M.; Sun, W.; Wang, S.; Feng, X.; Li, Z.; Chen, H.; Chen, C. Experimental and technological research on grouting and curing of surface moraine collapse pits in block caving mining. Eng. Fail. Anal. 2025, 175, 109574. [Google Scholar] [CrossRef]
  27. Woo, K.-S.; Eberhardt, E.; Rabus, B.; Stead, D.; Vyazmensky, A. Integration of field characterisation, mine production and InSAR monitoring data to constrain and calibrate 3-D numerical modelling of block caving-induced subsidence. Int. J. Rock Mech. Min. Sci. 2012, 53, 166–178. [Google Scholar] [CrossRef]
  28. Castro, R.; Perez, Á.; Gomez, R. Evaluating wet muck risk in block caving mines: A new model. Int. J. Rock Mech. Min. Sci. 2023, 170, 105485. [Google Scholar] [CrossRef]
  29. Wu, M.; Wang, J.; Zhao, B. DEM modeling of one-dimensional compression of sands incorporating statistical particle fragmentation scheme. Can. Geotech. J. 2021, 59, 144–157. [Google Scholar] [CrossRef]
  30. Le-Feaux, R.; Castro, R.; Cortez, D.; Gómez, R.; Silva, D. A hybrid extraction level layout design for block caving. Min. Technol. 2022, 131, 51–65. [Google Scholar] [CrossRef]
  31. Jiang, B.; Wang, L.; Lu, Y.; Wang, C. Combined early warning method for rockburst in a Deep Island, fully mechanized caving face. Arab. J. Geosci. 2016, 9, 1–13. [Google Scholar] [CrossRef]
  32. Puller, J.W.; Mills, K.W.; Jeffrey, R.G.; Walker, R.J. In-situ stress measurements and stress change monitoring to monitor overburden caving behaviour and hydraulic fracture pre-conditioning. Int. J. Min. Sci. Technol. 2016, 26, 103–110. [Google Scholar] [CrossRef]
  33. Lavoie, T.; Eberhardt, E.; Pierce, M.E. Numerical modelling of rock mass bulking and geometric dilation using a bonded block modelling approach to assist in support design for deep mining pillars. Int. J. Rock Mech. Min. Sci. 2022, 156, 105145. [Google Scholar] [CrossRef]
Figure 1. Bottom structure model: (a) 3D diagram and (b) top view.
Applsci 15 06867 g001
Figure 2. Process for making large-sized models of the bottom structure: (a) mold assembly; (b) contact surface treatment; (c) specimen pouring; and (d) specimen demolding.
Applsci 15 06867 g002
Figure 3. Experimental model size and monitoring surface distribution.
Applsci 15 06867 g003
Figure 4. Layout of stress monitoring components on the monitoring surface.
Applsci 15 06867 g004
Figure 5. Schematic diagram of mining area.
Applsci 15 06867 g005
Figure 6. Schematic diagram of horizontal section modeling.
Applsci 15 06867 g006
Figure 7. Horizontal section bottoming: (a) two-dimensional schematic diagram of the horizontal section; (b) after the bottom pulling is completed, the slope body; (c) slope body and monitoring measurement circle before ore instability; (d) slope after rock collapse.
Applsci 15 06867 g007
Figure 8. Instability of cross-sectional slope: (a) monitoring of western slope impact force; (b) eastern slope impact force monitoring.
Applsci 15 06867 g008
Figure 9. Schematic diagram of longitudinal section modeling.
Applsci 15 06867 g009
Figure 10. Longitudinal profile bottoming: (a) two-dimensional schematic diagram of the horizontal section; (b) after the bottom pulling is completed, the slope body; (c) slope body and monitoring measurement circle before ore instability; (d) slope after rock collapse.
Applsci 15 06867 g010aApplsci 15 06867 g010b
Figure 11. The impact stress of unstable rock mass collapse on the bottom groove: (a) front section impact stress; (b) Rear end impact stress.
Applsci 15 06867 g011
Figure 12. Schematic diagram of oblique section modeling.
Applsci 15 06867 g012
Figure 13. Inclined profile bottom pulling: (a) two-dimensional schematic diagram of the horizontal section; (b) after the bottom pulling is completed, the slope body; (c) slope body and monitoring measurement circle before ore instability; (d) slope after rock collapse.
Applsci 15 06867 g013aApplsci 15 06867 g013b
Figure 14. The impact stress of unstable rock mass collapse on the bottom trough in the northeast slope: (a) front section impact stress; (b) post-impact stress.
Applsci 15 06867 g014
Figure 15. Adhesive of bottom structure strain gauges.
Applsci 15 06867 g015
Figure 16. Experimental system: (a) loading system; (b) stress collection system; (c) strain acquisition system; (d) bulk pressure collection system.
Applsci 15 06867 g016
Figure 17. Characteristic curve of impact load on landslide mass: (a) overall collapse impact curve; (b) partial collapse large block impact curve; and (c) progressive collapse multiple impact curve.
Applsci 15 06867 g017
Figure 18. Mechanical properties of the bottom structure of the uncovered soil layer under 64 kN large rockfall loading: (a) 0 m; (b) 50 m; (c) 100 m.
Applsci 15 06867 g018aApplsci 15 06867 g018b
Figure 19. Load–displacement curve and soil pressure–normalized time curve of cyclic loading and unloading test on the bottom structure of the uncovered soil layer: (a) amplitude of 19.2 kN; (b) amplitude of 38.4 kN; and (c) amplitude of 57.6 kN.
Applsci 15 06867 g019
Figure 20. Load–displacement curve and soil pressure–normalized time curve of cyclic loading and unloading test on the bottom structure of the overlying soil layer at 50 m: (a) amplitude of 19.2 kN; (b) amplitude of 38.4 kN; and (c) amplitude of 57.6 kN.
Applsci 15 06867 g020
Figure 21. Load–displacement curve and soil pressure–normalized time curve of cyclic loading and unloading test on the bottom structure of the overlying soil layer at a depth of 100 m: (a) amplitude of 19.2 kN; (b) amplitude of 38.4 kN; and (c) amplitude of 57.6 kN.
Applsci 15 06867 g021aApplsci 15 06867 g021b
Figure 22. The mechanical properties of the bottom structure without overlying soil layer under the impact of 192 kN large rockfall: (a) load–displacement curve; (b) soil pressure–normalized time curve; (c) strain–normalized time curve.
Applsci 15 06867 g022aApplsci 15 06867 g022b
Figure 23. Characteristics of bottom structure failure under no overlying load and large block impact: (a) broken pillar between funnels and (b) broken pillars.
Applsci 15 06867 g023
Figure 24. Mechanical characteristics of the bottom structure of the 50 m overlying soil layer under the impact of a 192 kN large rockfall: (a) load–displacement curve; (b) soil pressure–normalized time curve; (c) strain–normalized time curve.
Applsci 15 06867 g024
Figure 25. Characteristics of bottom structure failure under 50 m overlying load and large block impact: (a) the ore pillars between the ore gathering tanks are broken; (b) the ore tank is peeling off.
Applsci 15 06867 g025
Figure 26. Mechanical characteristics of the bottom structure of the 100 m overlying soil layer under the impact of a 192 kN large rockfall: (a) load–displacement curve; (b) Soil pressure–normalized time curve; (c) Strain–normalized time curve.
Applsci 15 06867 g026
Figure 27. Characteristics of bottom structure failure under 100 m overlying load and large impact: (a) the broken ore pillars between the ore gathering tanks; (b) cracking at the arch of the alley entrance; (c) pillar fracture; and (d) the ore tank is peeling off.
Applsci 15 06867 g027
Table 1. PFC parameters.
Parameters TypesPFC ParametersMagnitude
Basic parameters of particlesDensity (kg/m3)2600
Contact modulus (Ec/Gpa)6.3
Stiffness ratio (kn/ks)1.2
Coefficient of friction0.4
Small particle radius (m)1~1.66
Large particle radius (m)5~5.66
Porosity (P)0.16
Parallel bonding parametersParallel bonding stiffness ratio1.5
Parallel bond modulus6.3
Parallel bonding internal friction angle (°)36.8
Parallel bonding tensile strength (MPa)41
Parallel bonding cohesion (MPa)38
Disclaimer/Publisher’s Note: The statements, opinions and data contained in all publications are solely those of the individual author(s) and contributor(s) and not of MDPI and/or the editor(s). MDPI and/or the editor(s) disclaim responsibility for any injury to people or property resulting from any ideas, methods, instructions or products referred to in the content.

