Article

Stress Characteristics and Mechanical Behavior of Rock Masses with an Opening under Complex Deep Underground Stress Conditions

by
Mingyu Cao
1,2,
Xianyang Qiu
1,
Rihong Cao
1,*,
Zeyu Li
1,
Xiuzhi Shi
1 and
Lihai Tan
3
1
School of Resources and Safety Engineering, Central South University, Changsha 410083, China
2
Guangdong Province Dabaoshan Mining Co., Ltd., Shaoguan 512127, China
3
School of Resource Environment and Safety Engineering, University of South China, Hengyang 412001, China
*
Author to whom correspondence should be addressed.
Appl. Sci. 2024, 14(16), 7197; https://doi.org/10.3390/app14167197
Submission received: 11 June 2024 / Revised: 2 August 2024 / Accepted: 13 August 2024 / Published: 15 August 2024
(This article belongs to the Special Issue Advances and Techniques in Rock Fracture Mechanics)

Abstract

:
In this study, the impact of principal stress states on the stress characteristics and initial failure of the rock mass surrounding a three-center arch opening was investigated using complex variable function methods and Discrete Element Method (DEM) numerical modeling. First, the mapping function of the opening was determined using the trigonometric interpolation method, and the influence of the number of terms in the mapping function on its accuracy was revealed. Based on this, the far-field stress state of the underground rock mass was characterized by the ratio of the minimum to maximum principal stress (λ) and the angle (β) between the principal stress and the vertical direction. This stress state was then converted into normal and shear stresses. Using complex variable function theory, the stress characteristics at the boundary of the opening under different stress states were analyzed. Finally, DEM numerical modeling was employed to study the initial failure characteristics at the boundary of the opening and its relationship with the stress distribution. The results indicate that the lateral pressure coefficient significantly affects the stability of the opening by influencing stress concentration around the surrounding rock. Low lateral pressure coefficients lead to tensile stress concentration at the boundary perpendicular to the maximum principal stress. As the coefficient increases, tensile stress decreases, and compressive stress areas expand. While the principal stress direction has a minor effect on stress concentration, it notably impacts stress distribution at the boundary. When λ < 1.0 and β = 45°, stress distribution asymmetry is most pronounced, with the highest compressive stress. The early failure distribution aligns with stress concentration areas, validating the use of stress analysis in predicting opening stability and failure characteristics.

1. Introduction

Underground rock engineering frequently involves the construction and maintenance of structures such as tunnels, mines, and storage caverns, where the mechanical behavior of rock masses around openings is a critical factor for stability and safety. The presence of openings in rock masses significantly alters the stress distribution, leading to potential failure and instability of the surrounding rock mass [1,2,3]. Understanding the stress distribution of surrounding rock under different stress conditions and its impact on tunnel stability is crucial for ensuring the stability of engineering projects.
Traditional experimental studies have extensively investigated the mechanical behavior, failure characteristics, and energy evolution processes of rock masses with openings. Comprehensive research has been carried out to analyze the effects of different parameters, such as loading conditions, the properties of rock-like materials, and the geometry of openings [4,5,6,7]. These studies provide valuable insights into the macroscopic mechanical properties of the rock and the associated failure patterns. However, experimental conditions impose limitations; the sample size may significantly affect the results, and laboratory tests cannot accurately replicate the actual boundary conditions of underground rock engineering. Additionally, experiments primarily investigate the impact of openings on the mechanical properties and failure characteristics of rock masses, but they struggle to comprehensively explain the mechanical behavior characteristics of the surrounding rock based on stress mechanisms. The inability to precisely simulate in situ stress conditions and the scale effects further complicate the extrapolation of laboratory findings to real-world scenarios. Therefore, while traditional experiments are invaluable for understanding basic mechanical responses, they need to be complemented with analytical or numerical methods to provide a more holistic understanding of the mechanical behavior of rock masses.
Analytical solutions offer a theoretical approach for systematically analyzing stress distributions. They can precisely describe the changes in the stress field of rock masses under different stress conditions and, when combined with numerical simulations, provide better predictions of failure modes and stability of the surrounding rock. The stress state of the rock mass surrounding circular openings has been extensively investigated due to its simple geometry. For rock masses with openings of intricate shapes, the complex variable function method has been extensively employed for stress analysis because of its distinct advantages in managing complex geometrical problems [8]. This theoretical framework enables more precise analytical solutions for rock stress, particularly around tunnels in homogeneous, isotropic elastic rock masses [9,10,11]. Zhao et al. [12] investigated the analytical solution for the rock stress surrounding a square tunnel under various confining stress conditions. For stress analysis of rock masses with such openings, the mapping function can be determined using formulas, significantly reducing the computational complexity. For stress analysis of rock masses with complex-shaped openings in underground engineering, optimization algorithms are also a powerful method for solving the corresponding mapping functions. Wu et al. [13] used the Box complex algorithm to solve the mapping function for rock masses with commonly encountered underground openings such as horseshoe-shaped tunnels. They analyzed the stress concentration factor of the surrounding rock through analytical stress solutions. In this study, the fracture behavior of the samples, demonstrated by mechanical tests, was accurately predicted using analytical solutions, highlighting the reliability of the complex variable function method. Tan et al. [14] utilized complex variable theory to derive the stress distribution around rock masses with complex-shaped openings. The study introduced an improved method for calculating the mapping function, which defines the relationship between the physical and mapped planes. Based on this method, Tan et al. [15] further investigated the stress distribution and mechanical behavior of rock masses with openings of various shapes under different lateral pressure coefficients. These studies involve various research factors such as different opening shapes and lateral pressure coefficients. In addition to the theory of complex functions, they also include research methods like numerical simulation and mechanical testing. Overall, these studies mainly solve the mapping functions through polygonal methods or optimization algorithms. Their findings indicate that the stress distribution characteristics around the opening primarily depend on the shape of the opening and the lateral pressure coefficient. When the opening boundary has sharp corners or there is a significant difference between the maximum and minimum principal stresses, the stress distribution around the opening rock mass shows noticeable non-uniformity with localized stress concentration. Comparisons between stress analytical solutions and mechanical test results further reveal that the characteristics of the stress distribution are consistent with the initial instability modes of the surrounding rock mass, based on which the stability and initial failure modes of the opening can be determined.
These studies provide a comprehensive analytical framework for understanding the stress distribution and mechanical behavior of rock masses containing openings, offering valuable insights into the design and stability assessment of underground structures. These studies contribute to the optimization of engineering designs and the mitigation of potential failure risks in underground rock engineering. However, almost all these studies assume that the maximum and minimum principal stresses are aligned with the vertical and horizontal directions, respectively. Due to the constraints of experimental conditions, many laboratory tests are conducted under uniaxial compression conditions. Although this assumption significantly simplifies the calculation process and reduces the complexity of the solution, it can lead to substantial errors when the principal stress directions do not align with the vertical or horizontal directions. Some studies have found that the stability of openings, such as tunnels and roadways, is optimal when the local stress direction is orthogonal to the opening, while the stability decreases and the failure characteristics are influenced when the local stress direction is inclined [16,17,18,19]. This indicates that the orientation of the in situ stress significantly impacts the stability and failure modes of the openings (e.g., deformation patterns, crack initiation, and propagation). However, these studies are primarily based on numerical simulations or laboratory mechanical tests, focusing on the mechanical properties and failure characteristics of the specimens without explaining the influence mechanism from the perspective of the stress field. To address these limitations, this study integrates analytical solutions with numerical simulations to systematically investigate the stress distribution around three-center arch openings under different geo-stress states characterized by lateral pressure coefficient and principal geo-stress direction, and its impact on the failure characteristics of the surrounding rock. The aim is to bridge the gap between mechanical properties and stress-field influence mechanisms, offering a more comprehensive understanding of how stress orientations affect opening stability.

2. Methods

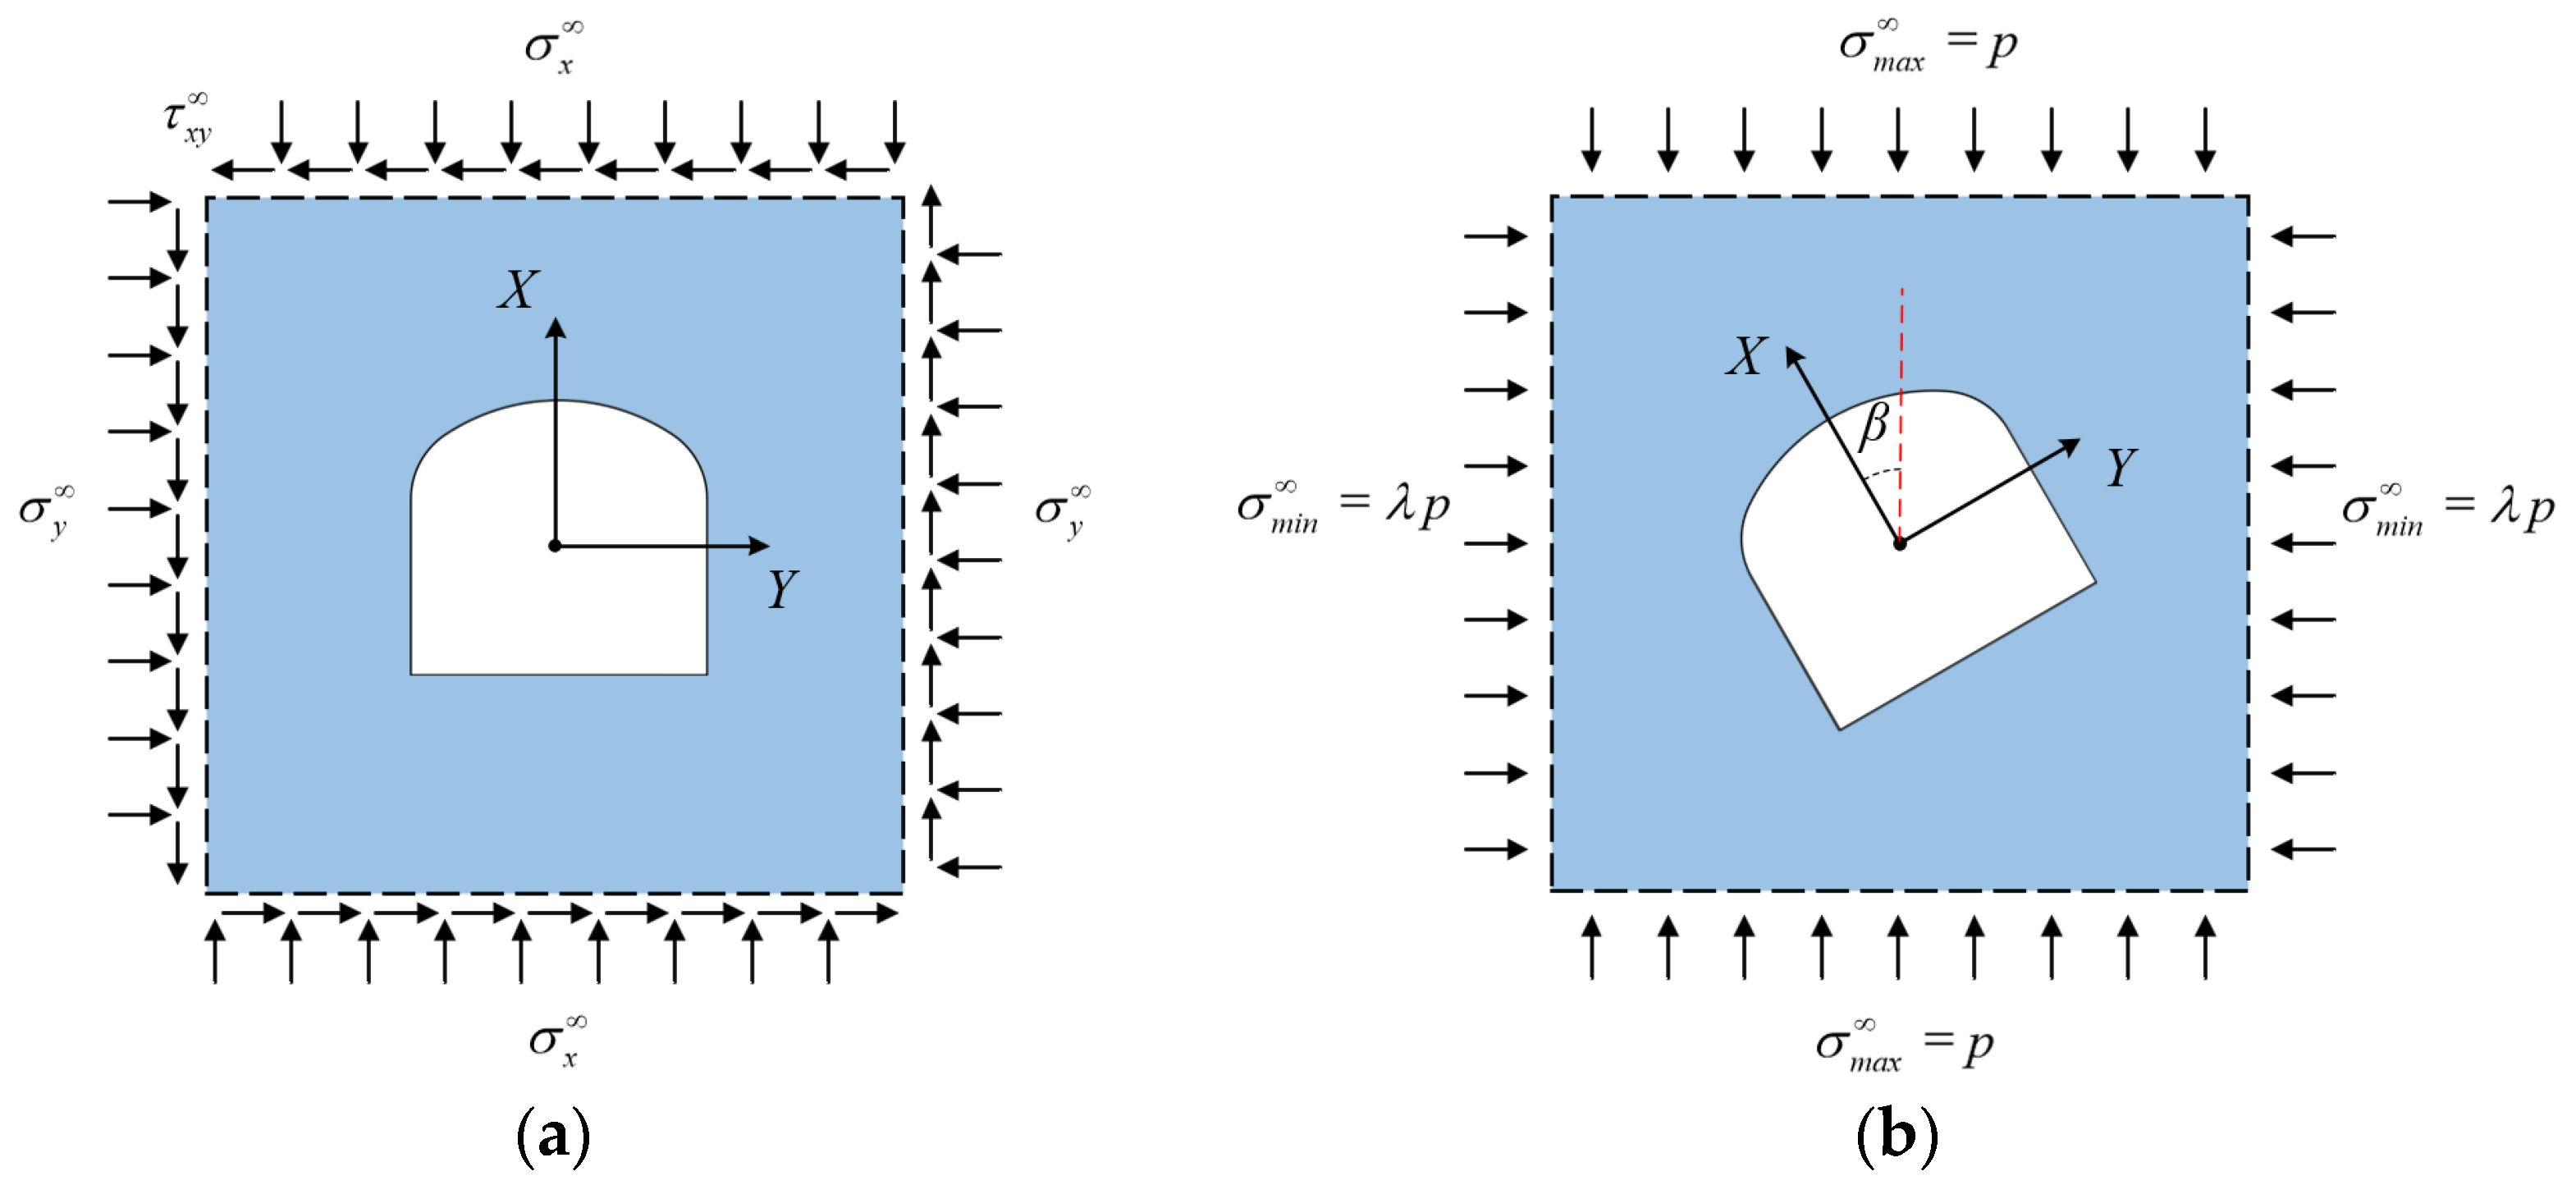
2.1. Complex Function Method for Analytical Stress Solutions

The underground environment typically consists of various types of rock formations, which may lead to heterogeneity in the rock mass and uneven distribution of geo- stress [20]. However, for deep underground engineering tunnels, when the integrity and homogeneity of the surrounding rock are good, in a stable state of elastic deformation, the plane of the tunnel section far from both ends of the tunnel can be simplified to the plane strain model with a single opening, as shown in Figure 1a. Taking the centroid of the opening as the coordinate origin, the three stress components σ x , σ y , and τ x y at any point on this plane in the Cartesian coordinate system can be expressed as [21]:
{ σ x + σ y = 4 R e [ φ 1 ( z ) ] σ x σ y + 2 i τ x y = 2 [ z ¯ φ 1 ( z ) + ψ 1 ( z ) ]
where φ 1 ( z ) and ψ 1 ( z ) are complex stress functions dependent on the complex variable z. As per the Riemann mapping theorem, any simply connected domain with multiple boundary points on the z-plane can be transformed into a unit circle on the complex ζ-plane using a mapping function z = w(ζ). By converting the stress components in Equation (1) to expressions in polar coordinates and substituting them into the mapping function, the relationships for the stress components in polar coordinates can be obtained as follows [22]:
{ σ ρ + σ θ = 4 Re [ Φ ( ζ ) ] σ θ σ ρ + 2 i τ ρ θ = 2 ζ 2 ρ 2 ω ( ζ ) [ ω ¯ ( ζ ) Φ ( ζ ) + ω ( ζ ) Ψ ( ζ ) ]
where Φ ( ζ ) and Ψ ( ζ ) are the complex potential functions, given by:
{ Φ ( ζ ) = φ ( ζ ) ω ( ζ ) Ψ ( ζ ) = ψ ( ζ ) ω ( ζ )
The boundary condition on the hole boundary is specified by [22]:
f ( σ ) = φ ( σ ) + ω ( σ ) ω ( σ ) ¯ φ ( σ ) ¯ + ψ ( σ ) ¯
In this equation, σ represents any point on the boundary of the unit circle. By combining Equations (2) and (4), the complex stress functions φ ( ζ ) and ψ ( ζ ) can be solved [23].
To facilitate the stress solution, the three far-field stress components under the stress state shown in Figure 1a were transformed into the principal stress state shown in Figure 1b by rotating the coordinate system. In this state, the far-field stress can be represented by σmax, β, and λ, where σmax is the maximum principal stress, λ is the lateral pressure coefficient (the ratio of the minimum principal stress to the maximum principal stress), and β is the angle between the direction of the maximum principal stress and the x-axis. The transformation formulas are as follows:
{ σ x = σ 1 + σ 3 2 + σ 1 σ 3 2 cos ( 2 β ) σ y = σ 1 + σ 3 2 σ 1 σ 3 2 cos ( 2 β ) τ x y = σ 1 σ 3 2 sin ( 2 β )
To comprehensively study the impact of stress state on the stress distribution around the surrounding rock of the three-center arch opening, the study considered 42 different combinations of λ and β. These combinations were converted into a general stress state for the stress solution, as detailed in Figure 1. The subsequent analytical solutions and numerical simulations were conducted based on these scenarios. Assuming the far-field maximum principal stress σmax = p, λ increments by 0.2 from 0 to 1. For each λ, β increments were 15° from 0° to 90°. When λ = 1, then τxy = 0 and both σx and σy are equal to p.

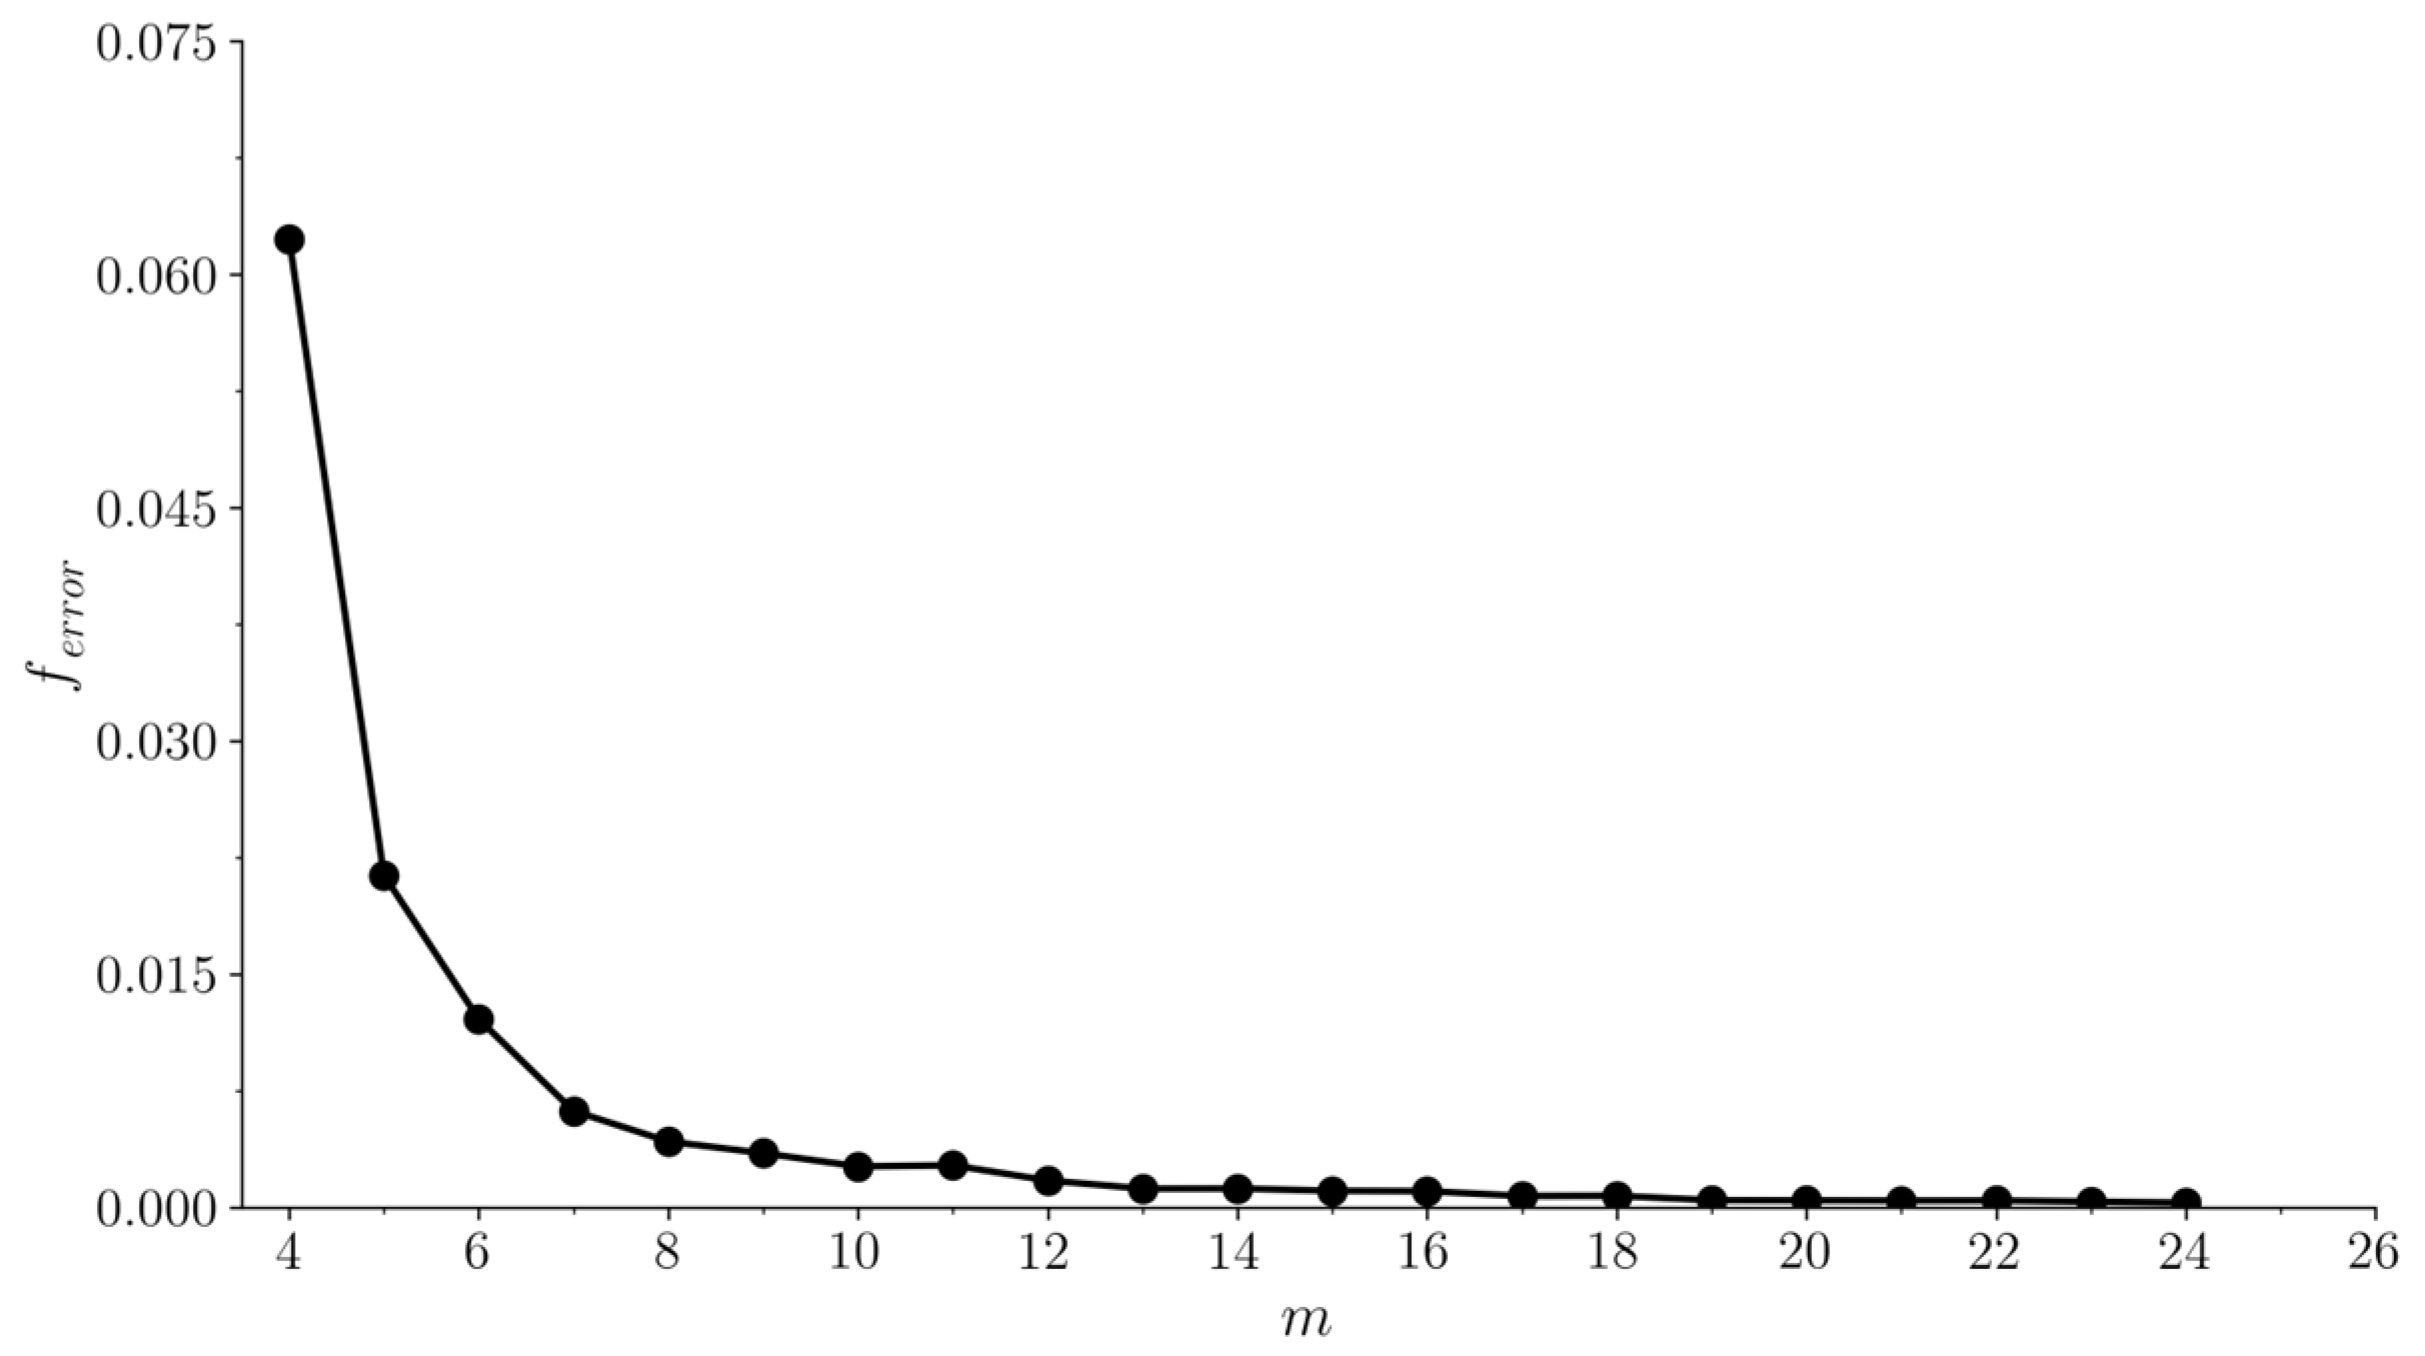
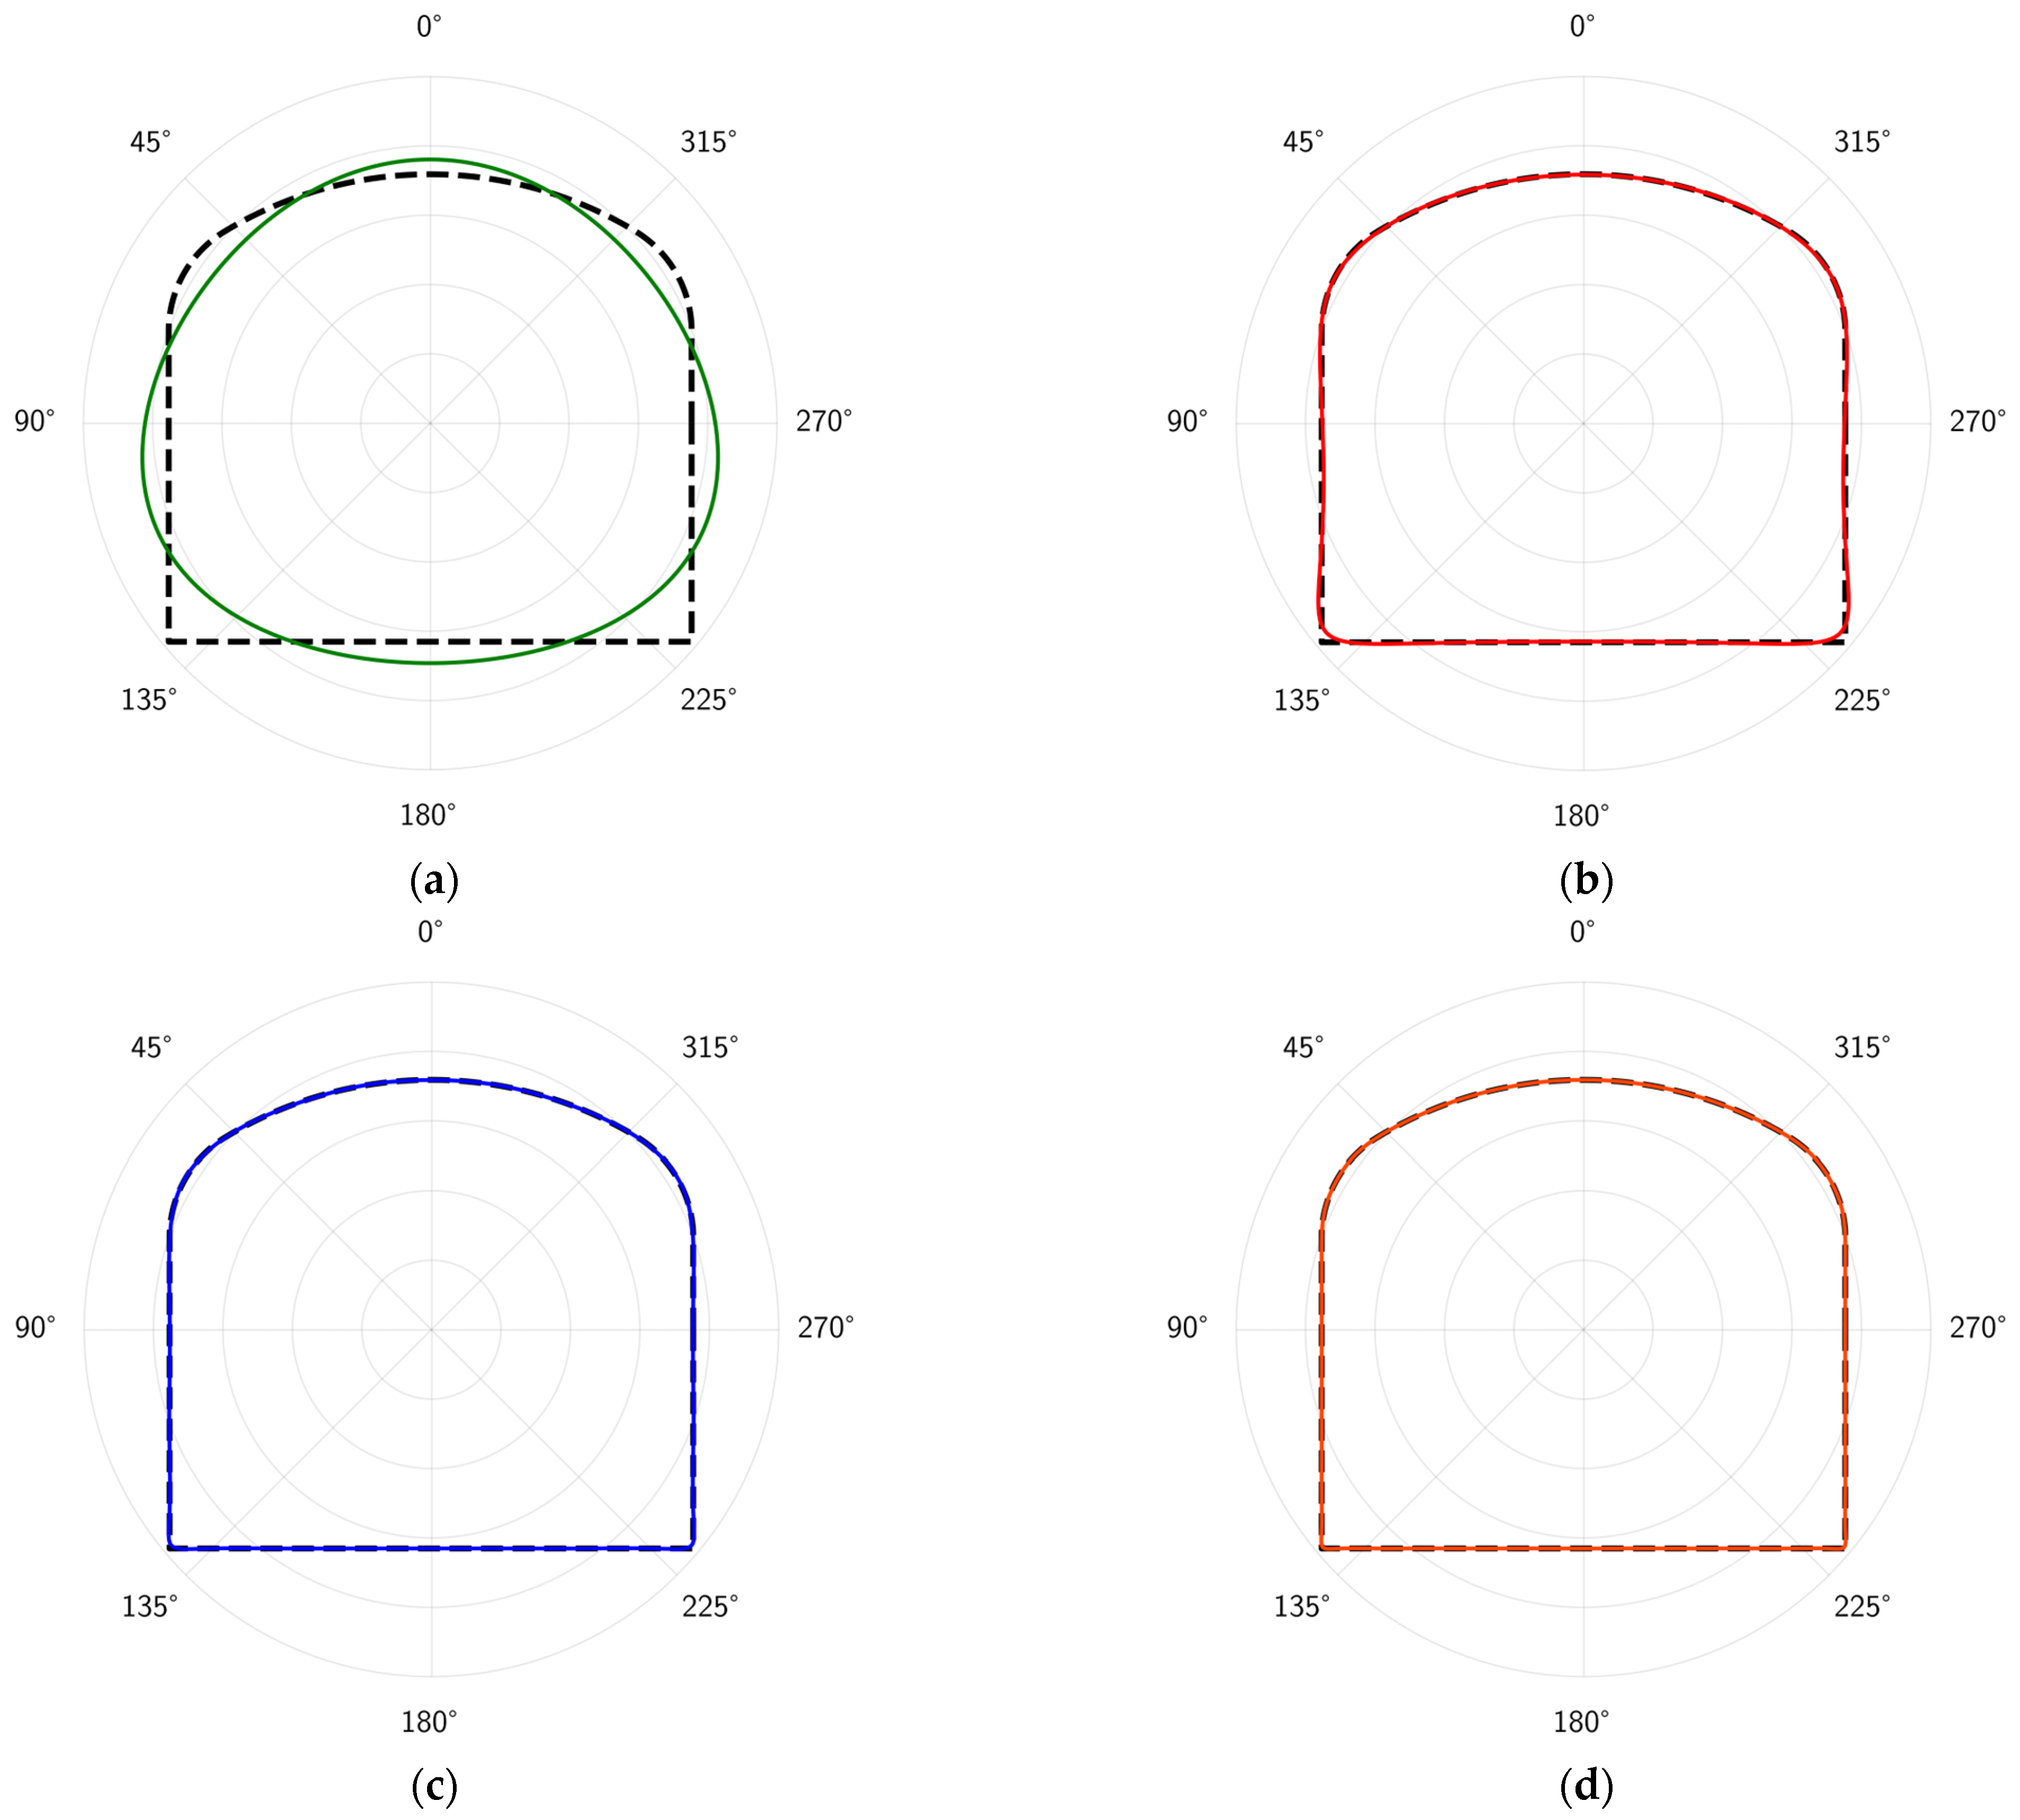
2.2. Determination of Mapping Function

The mapping function that transforms the region outside the opening in the z-plane to the region outside the unit circle in the ζ-plane is expressed as:
Z = ω ( ζ ) = k = 1 C k ζ 2 k
where Ck is a complex number, but when the opening is symmetric about the x-axis, Ck is real. The more complex the shape of the opening, the more terms of Ck are needed to improve the accuracy of the mapping shape. Generally, only the first few terms of Ck are sufficient to achieve adequate accuracy. The mapping function, taking only the first m terms, can be expressed as:
Z = ω ( ζ ) = k = 1 m C k ζ 2 k
In this study, the three-center arch-shaped opening is an axially symmetric figure; therefore, Ck is real.
For any point σ at the boundary of the unit circle in the ζ-plane with polar coordinates (1, θ), it can be expressed as:
σ = cos θ + i sin θ
In a similar manner, for the corresponding point t of σ on the boundary of the opening in the z-plane, represented in polar coordinates as (r, α), it can be expressed as:
t = r cos α + i r sin α
Substituting Equations (8) and (9) into Equation (7) yields:
r cos α + i r sin α = k = 1 m { C k cos [ ( k 2 ) θ ] i C k sin [ ( k 2 ) θ ] }
By extracting the real and imaginary parts, the following equation is obtained:
{ r cos α = k = 1 m { C k cos [ ( k 2 ) θ ] } r sin α = k = 1 m { C k sin [ ( k 2 ) θ ] }
Based on Equation (11), the trigonometric interpolation method can be used to solve for Ck, thereby determining the mapping function. Tan et al. [18] have conducted a detailed study on this method, which is not elaborated here.
Assuming the mapping point of σj is (rσ, ασ), its corresponding point on the opening boundary is ( r σ ( 0 ) , α σ ) . By uniformly sampling n points σj (1, θj) from the unit circle, the average absolute relative error of the n points can be defined as [15]:
f e r r o r = 1 n j = 1 n | r σ r σ ( 0 ) | r σ ( 0 )
Generally, the greater the number of sampling points n, the higher the accuracy of the mapping function. However, too many sampling points can lead to a decrease in computational efficiency. In this study, it was found that the accuracy of the mapping function stabilizes when n exceeds 50. Ultimately, n was set to 200 in all cases to balance computational efficiency and accuracy. Figure 2 shows the variation in the mapping function error ferror as the number of mapping function coefficients m increases. It can be seen that the error is as high as 0.065 at m = 4. As the number of terms increases from 4 to 8, the error significantly decreases to below 0.015. This phase shows the most notable reduction in error, indicating that increasing the number of terms has a significant effect on reducing the error. When m increases from 8 to 15, the error continues to decrease slowly. During this phase, the error gradually approaches zero, but the rate of decrease diminishes considerably. Although increasing the number of terms still reduces the error, the effect is markedly less significant compared to the initial phase. When m exceeds 15, the error stabilizes and nearly stops changing, approaching zero. In this phase, increasing the number of terms has almost no effect on improving the error, and the error curve becomes flat. As shown in Figure 3a, when m = 6, the mapped shape already closely matches the original shape. When m is greater than or equal to 10, the mapped shape is almost identical to the original shape. In this study, to balance computational accuracy and efficiency, m = 16 was chosen. At this point, the mapped shape is almost identical to the original shape, and the mapping function error is nearly zero. The expression is as follows:
ω = { 0.5797 x 0.0151 0.0372 x 1 + 0.0346 x 2 0.0629 x 3 + 0.0178 x 4 + 0.0093 x 5 0.005 x 6 + 0.0034 x 7 0.002 x 8 0.001 x 9 + 0.0021 x 10 0.0012 x 11 0.0003 x 12 + 0.0004 x 13 0.0004 x 14 }

3. Results

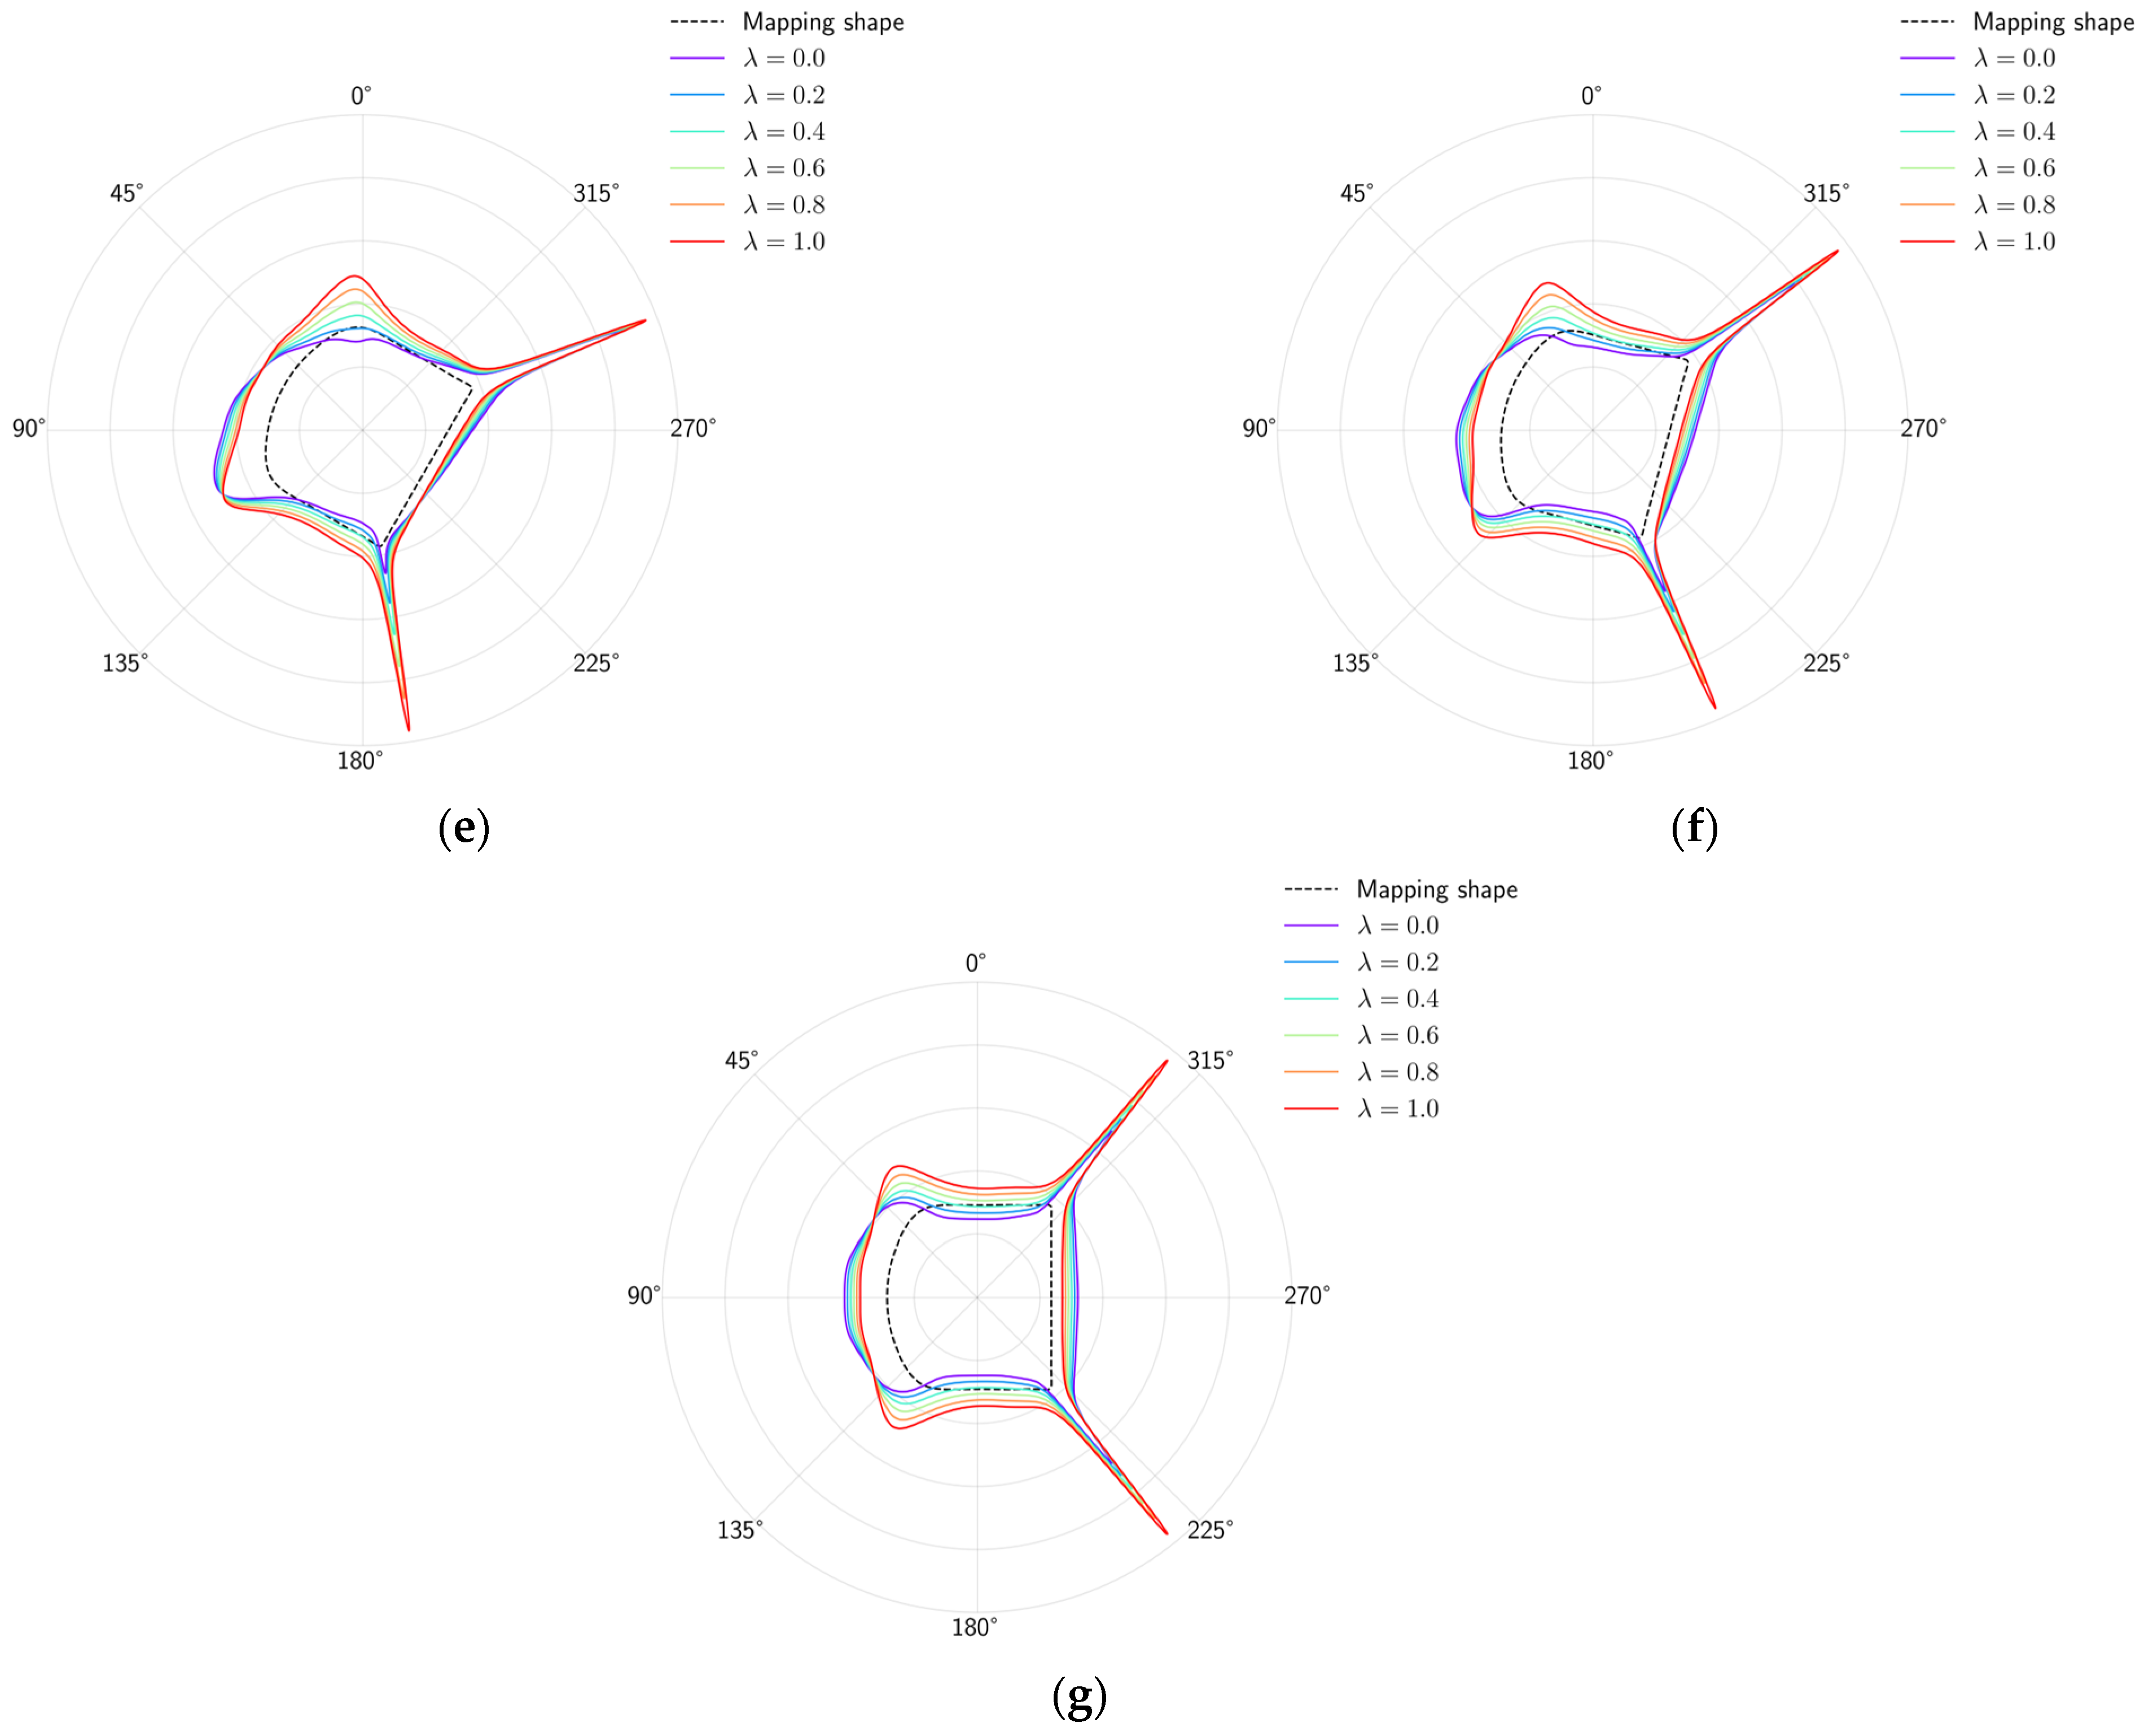
3.1. Stress Distribution Characteristics

Based on Table 1, the mathematical calculation model of the plane containing a single opening shown in Figure 1b can be transformed into the general stress state shown in Figure 1a. By solving the equations, the stress functions of the plane containing a single opening can be determined, and through these formulas, the stress state at any point within the plane can be obtained. According to the mathematical model shown in Figure 1a, the study solved the stress functions for the plane containing the opening under different λ and β conditions. In practical engineering, the failure of the surrounding rock of an opening often begins at a certain area of the opening boundary. Therefore, the stress characteristics of the opening boundary were selected as the focus of this study. The distribution curves of the boundary hoop stress are shown in Figure 4, where the dashed lines represent the initial mapped shape. The portions of the stress curves inside the opening are negative, indicating tensile stress, while those outside are positive, indicating compressive stress. The stress solution data are provided in the Supplementary Materials.
It can be observed from Figure 4a that when β = 0° (maximum principal stress σθ,max is vertical), the stress distribution is symmetrical. The stress curves show sharp changes around 135° and 225°, corresponding to the corners of the opening’s straight walls where the compressive stress reaches its maximum. As λ increases, the compressive stress concentration in these two regions also increases. Specifically, when λ reaches 1.0 (red curve), the compressive stress concentration in these regions is the most pronounced. On the other hand, when λ is below 0.4, tensile stress appears in the roof and floor regions of the opening, and the maximum tensile stress occurs in the middle regions at 90° and 270°, indicating that without or with low lateral pressure, the middle regions of the roof and floor of the opening are prone to tensile failure. As λ increases, the tensile stress in these regions around the opening gradually decreases, transforming completely into compressive stress when λ reaches 0.4.
As β increases to 15° (Figure 4b), it can be observed that due to the inclination of the principal stress, the stress distribution along the opening boundary begins to exhibit slight distortion, with the positions of maximum and minimum stress shifting slightly. The stress distribution curve shows a certain degree of asymmetry. As β continues to increase to 45° (Figure 4d), this asymmetry in stress becomes more pronounced under low lateral pressure coefficients (λ). However, as λ increases, this asymmetry gradually decreases. In all cases, when λ = 1, the stress distribution along the opening boundary is symmetrical along the geometric symmetry axis of the opening.
As β increases from 45° to 90° (Figure 4d–g), the stress distribution exhibits new characteristics, gradually returning to a symmetrical state. When β reaches 90° (Figure 4g), meaning the horizontal stress is the maximum principal stress, the stress distribution becomes symmetrical again but differs significantly from when β = 0°. Although the two straight wall corners of the opening remain the areas of maximum compressive stress, the roof and floor have transitioned from regions of tensile stress concentration to regions of compressive stress concentration under low lateral pressure coefficients. Conversely, the original sides of the opening have shifted from compressive stress to tensile stress states.
Figure 5 summarizes the variation in the maximum and minimum hoop stresses at the opening boundary with different λ as β changes. Overall, the maximum hoop stress exhibits a trend in first increasing and then decreasing with β. For all λ values, the maximum hoop stress curve reaches a peak at β = 45°, indicating that at this angle, the hoop stress on the tunnel boundary is the highest. This trend is most pronounced when λ = 0. As λ increases, while the overall trend remains consistent for λ < 1, the variation curve becomes flatter. This flattening indicates a reduced sensitivity in the maximum hoop stress to changes in β at higher lateral pressure coefficients, which may imply greater stability under varying stress orientations. When λ = 1, the principal stress orientation no longer has any impact on the stress at the opening boundary.
The variation trend in the minimum hoop stress with β is relatively smooth. Near β = 45°, the minimum hoop stress fluctuates slightly, but the changes are minor. When λ < 0.4, the minimum hoop stress is generally less than 0, indicating that tensile stress is likely to form at the opening boundary under low lateral pressure coefficients. However, as λ increases, the minimum hoop stress gradually rises, and the tensile stress regions transition to compressive stress regions. When λ = 1.0, the minimum hoop stress at the opening boundary stabilizes at around 0.61p.
This analysis shows that the distribution of hoop stress around the three-center arch opening exhibits significant complexity with changes in the principal stress direction and lateral pressure coefficient. When the maximum principal stress is either vertical or horizontal, the stress distribution is relatively symmetrical. However, as the principal stress angle changes and λ < 1, the stress distribution gradually becomes asymmetrical. This phenomenon is most pronounced when λ = 0 and β = 45°. In practical engineering applications, it is essential to pay special attention to situations where the principal stress direction is not aligned with the vertical stress direction. Furthermore, the influence of the lateral pressure coefficient (λ) cannot be underestimated. The results suggest that designs should incorporate measures to reinforce structures under low lateral pressure conditions. Overall, the tunnel structures should be designed appropriately based on the principal stress direction and lateral pressure coefficient to ensure the safety and stability of the tunnel. Understanding the specific stress distribution patterns associated with different combinations of β and λ allows for more targeted and efficient design modifications, reducing the likelihood of overdesignand optimizing resource allocation.

3.2. Initial Failure Mode

According to the stress analysis, the direction of the geo-stress and the lateral pressure coefficient can significantly affect the stress distribution around the opening within the rock mass, which in turn may impact the stability and failure characteristics of the opening. This study introduces the Discrete Element Method (DEM) numerical simulation to reveal the influence of stress conditions on the failure characteristics of the opening. In this study, the PFC2D 6.0 software was used for numerical simulation of the mechanical behavior of samples containing openings. PFC2D software is a DEM simulation tool used to model the behavior of rock and soil materials. It is widely applied in the field of rock mechanics engineering to analyze the mechanical behavior, stability, and failure patterns of rock mass [24]. The linear parallel bond contact model was employed as the constitutive model for rock mass in the numerical modeling. This model effectively describes the mechanical behavior of rock or rock-like materials and has been widely applied in numerical simulations of rock mechanical failure [25].
Sandstone is a common rock found in deep underground mines, which is used as the reference material in the numerical simulation, and its mesoscale parameters are calibrated through uniaxial compression tests and are presented in Table 2.
The geometry of the numerical model is shown in Figure 6, with the opening shape consistent with that used in the analytical calculation. To facilitate comparison between the analytical and numerical results, the opening area is set to 1 m2, and the numerical simulation scheme is identical to the theoretical calculation. To minimize boundary effects, the overall model size is set to 7 m × 7 m. When the lateral pressure coefficient λ = 0, the two side walls are set to non-active. When λ > 0, the side walls are set to servo control mode, with their stress equal to the product of axial stress and λ, which changes with the axial stress.
Due to the fact that the dimensions within the sample are much smaller than the overall sample size, the overall mechanical properties of the sample are minimally affected by the opening and cannot reflect the impact of stress direction on the stability of the opening. Alternatively, the study provides the distribution of initial failures at the opening boundary in some typical cases, which is presented in Figure 7. To better illustrate the damage of the surrounding rock, Figure 7 only presents the failure distribution within the central square region of the models. In the figure, the red areas represent fractures formed by contact failures between two contacting balls.
As shown in Figure 7, the initial failure distribution characteristics of the surrounding rock well validate the results of the stress analysis. In all cases, initial failures occur in areas of compressive or tensile stress concentration. For example, when λ = 0, the regions of the opening boundary perpendicular to the maximum principal stress direction exhibit significant tensile stress concentration, leading to initial tensile cracks in these areas (Figure 7a–d). It is obvious that without lateral pressure, tensile stresses dominate the failure process, resulting in tensile crack initiation. When λ = 0.2, the tensile stress concentration around the opening is no longer evident, and the formation and development of tensile cracks are inhibited. Accordingly, tensile failures no longer occur in the tensile stress regions around the opening. This transition highlights the impact of increasing lateral pressure in mitigating tensile stress and preventing tensile failures. As λ continues to increase, the tensile stress around the opening significantly decreases and gradually transforms into compressive stress, with initial failures around the opening primarily resulting from compressive stress concentration.
When the maximum principal stress is vertical or horizontal (β = 0° or β = 90°), the hoop stress exhibits a symmetrical distribution about the opening’s axis of symmetry. In these cases, the initial cracks around the opening also display a roughly symmetrical distribution. As λ increases, the regions of compressive stress concentration around the opening expand, correspondingly increasing the extent of initial failures along the opening boundary. Changes in β cause asymmetry in the stress distribution around the opening, leading to a shift in the failure locations to one side. This asymmetry, induced by the principal stress orientation, complicates the prediction of failure zones and necessitates adaptive design measures to address the varying stress conditions.
The comprehensive analysis combining analytical stress solutions and numerical simulations robustly validates the initial failure modes around the opening. Significant stress concentration areas revealed by the analytical stress solutions align well with the numerical simulation results, identifying these zones as potential sites for initial failures. For instance, as the lateral pressure coefficient (λ) increases, the analytical solutions indicate a reduction in tensile stress around the opening, transitioning these regions into compressive stress zones. The numerical simulations corroborate this transition, showing a corresponding inhibition of tensile crack formation and a shift towards compressive stress-induced failures. When the lateral pressure coefficient is low (λ ≤ 0.4), due to the lack of or insufficient lateral constraints, the rock mass is more likely to fail under lower external loads (Figure 7a–d). This phenomenon particularly agrees with the analytical stress distribution in the corresponding models shown in Figure 4, where the low lateral pressure (λ ≤ 0.4) results in significant tensile stress concentrations. Additionally, as the principal stress angle (β) changes, the numerical simulations reveal corresponding shifts in the failure locations, consistent with the analytical predictions. This correlation confirms that the analytical approach accurately captures the critical stress zones prone to failure, demonstrating the effectiveness of these methods in predicting opening failure patterns.
Overall, the integration of analytical and numerical methods provides a comprehensive understanding of the stress-induced failure mechanisms around openings. This combined approach not only validates the predictive accuracy of the analytical models but also offers detailed insights into the stress evolution and failure progression, which is essential for designing effective reinforcement strategies and ensuring the stability of underground structures.

4. Conclusions

This study systematically investigated the stress distribution and mechanical behavior of rock masses with a three-center arch opening under various complex deep underground stress conditions with varying lateral pressure coefficients (λ) and principal stress directions (β). Combined with DEM numerical modeling, the study investigated their impact on the initial failure characteristics at the opening boundary. The main conclusions of the study are as follows:
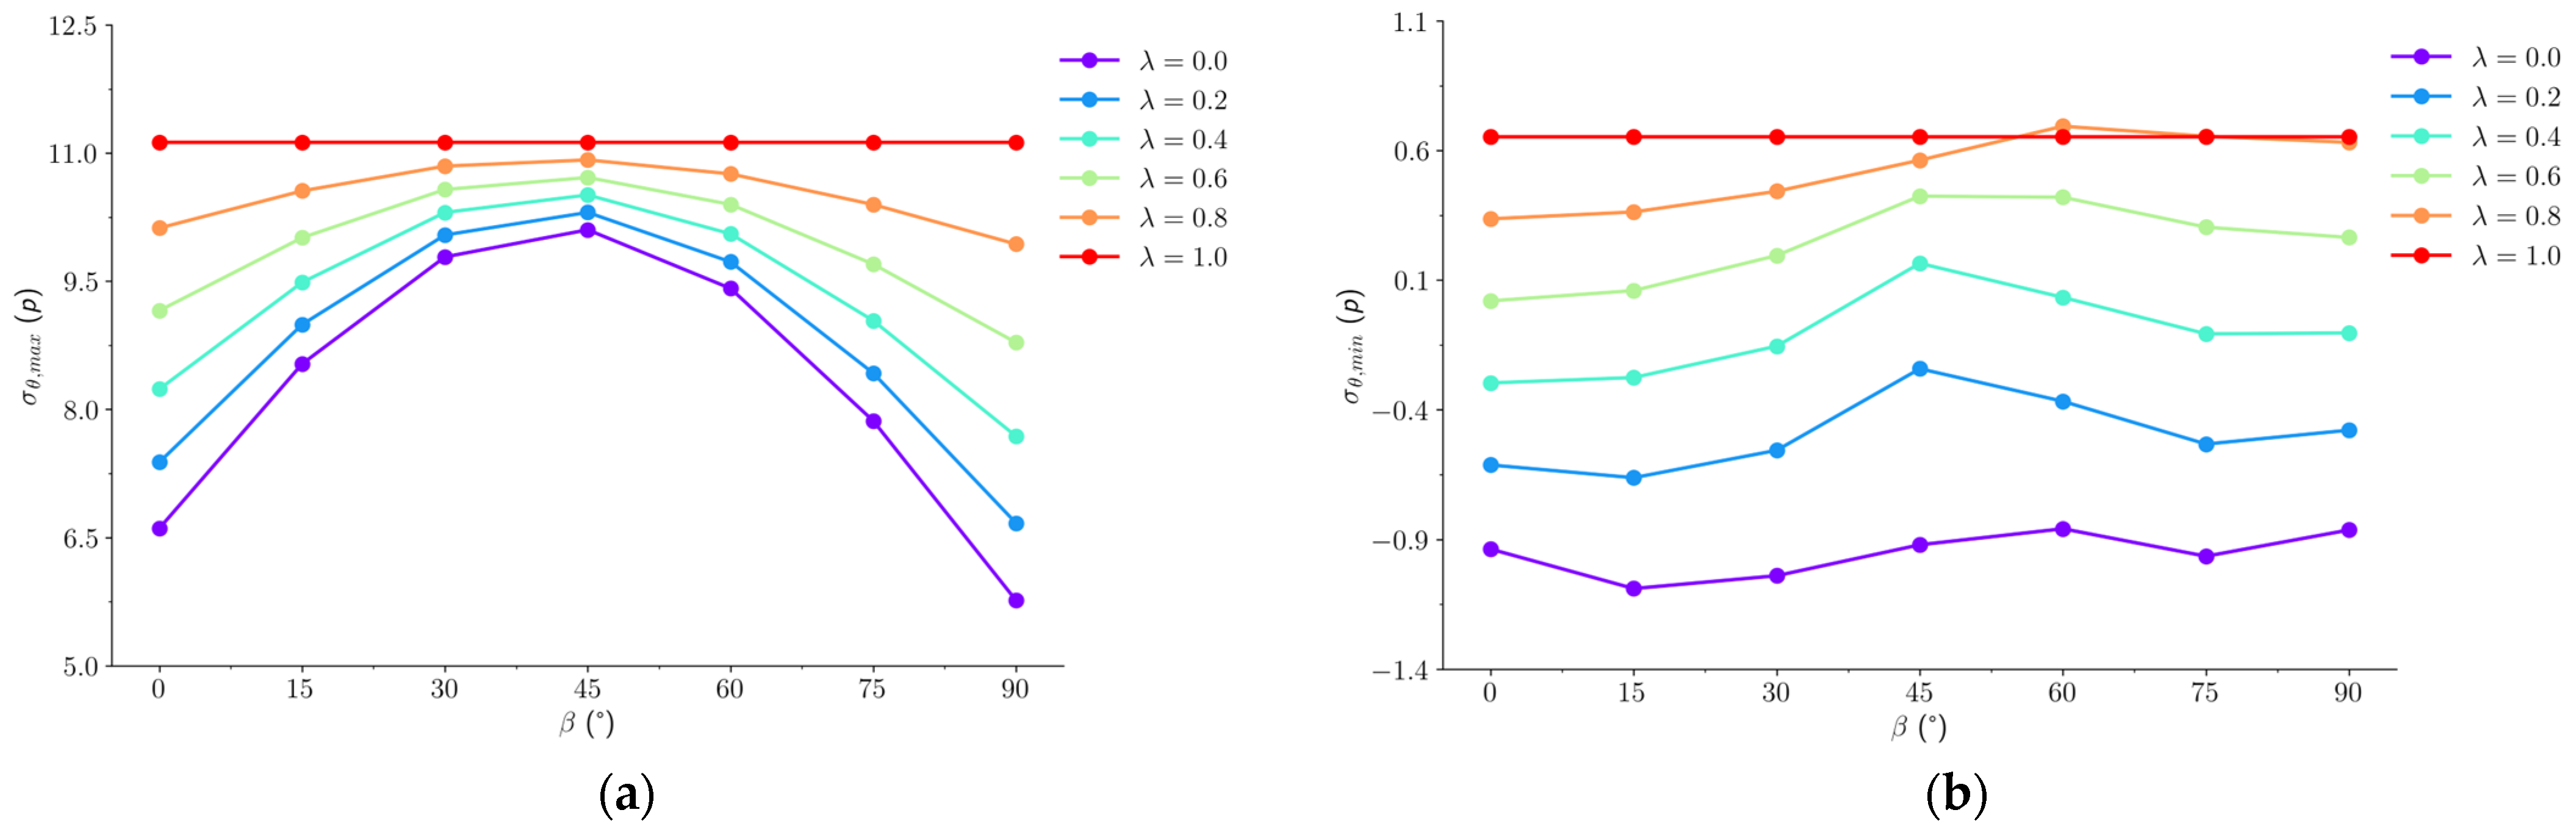
  • The lateral pressure coefficient mainly affects the stability of the opening by influencing the stress concentration around the surrounding rock. When the lateral pressure coefficient is at a low level, tensile stress concentration is likely to occur in the boundary area of the opening perpendicular to the maximum principal stress. Within the scope of this study, as the lateral pressure coefficient increases, the tensile stress disappears, and the compressive stress region expands, enhancing the stability of the opening.
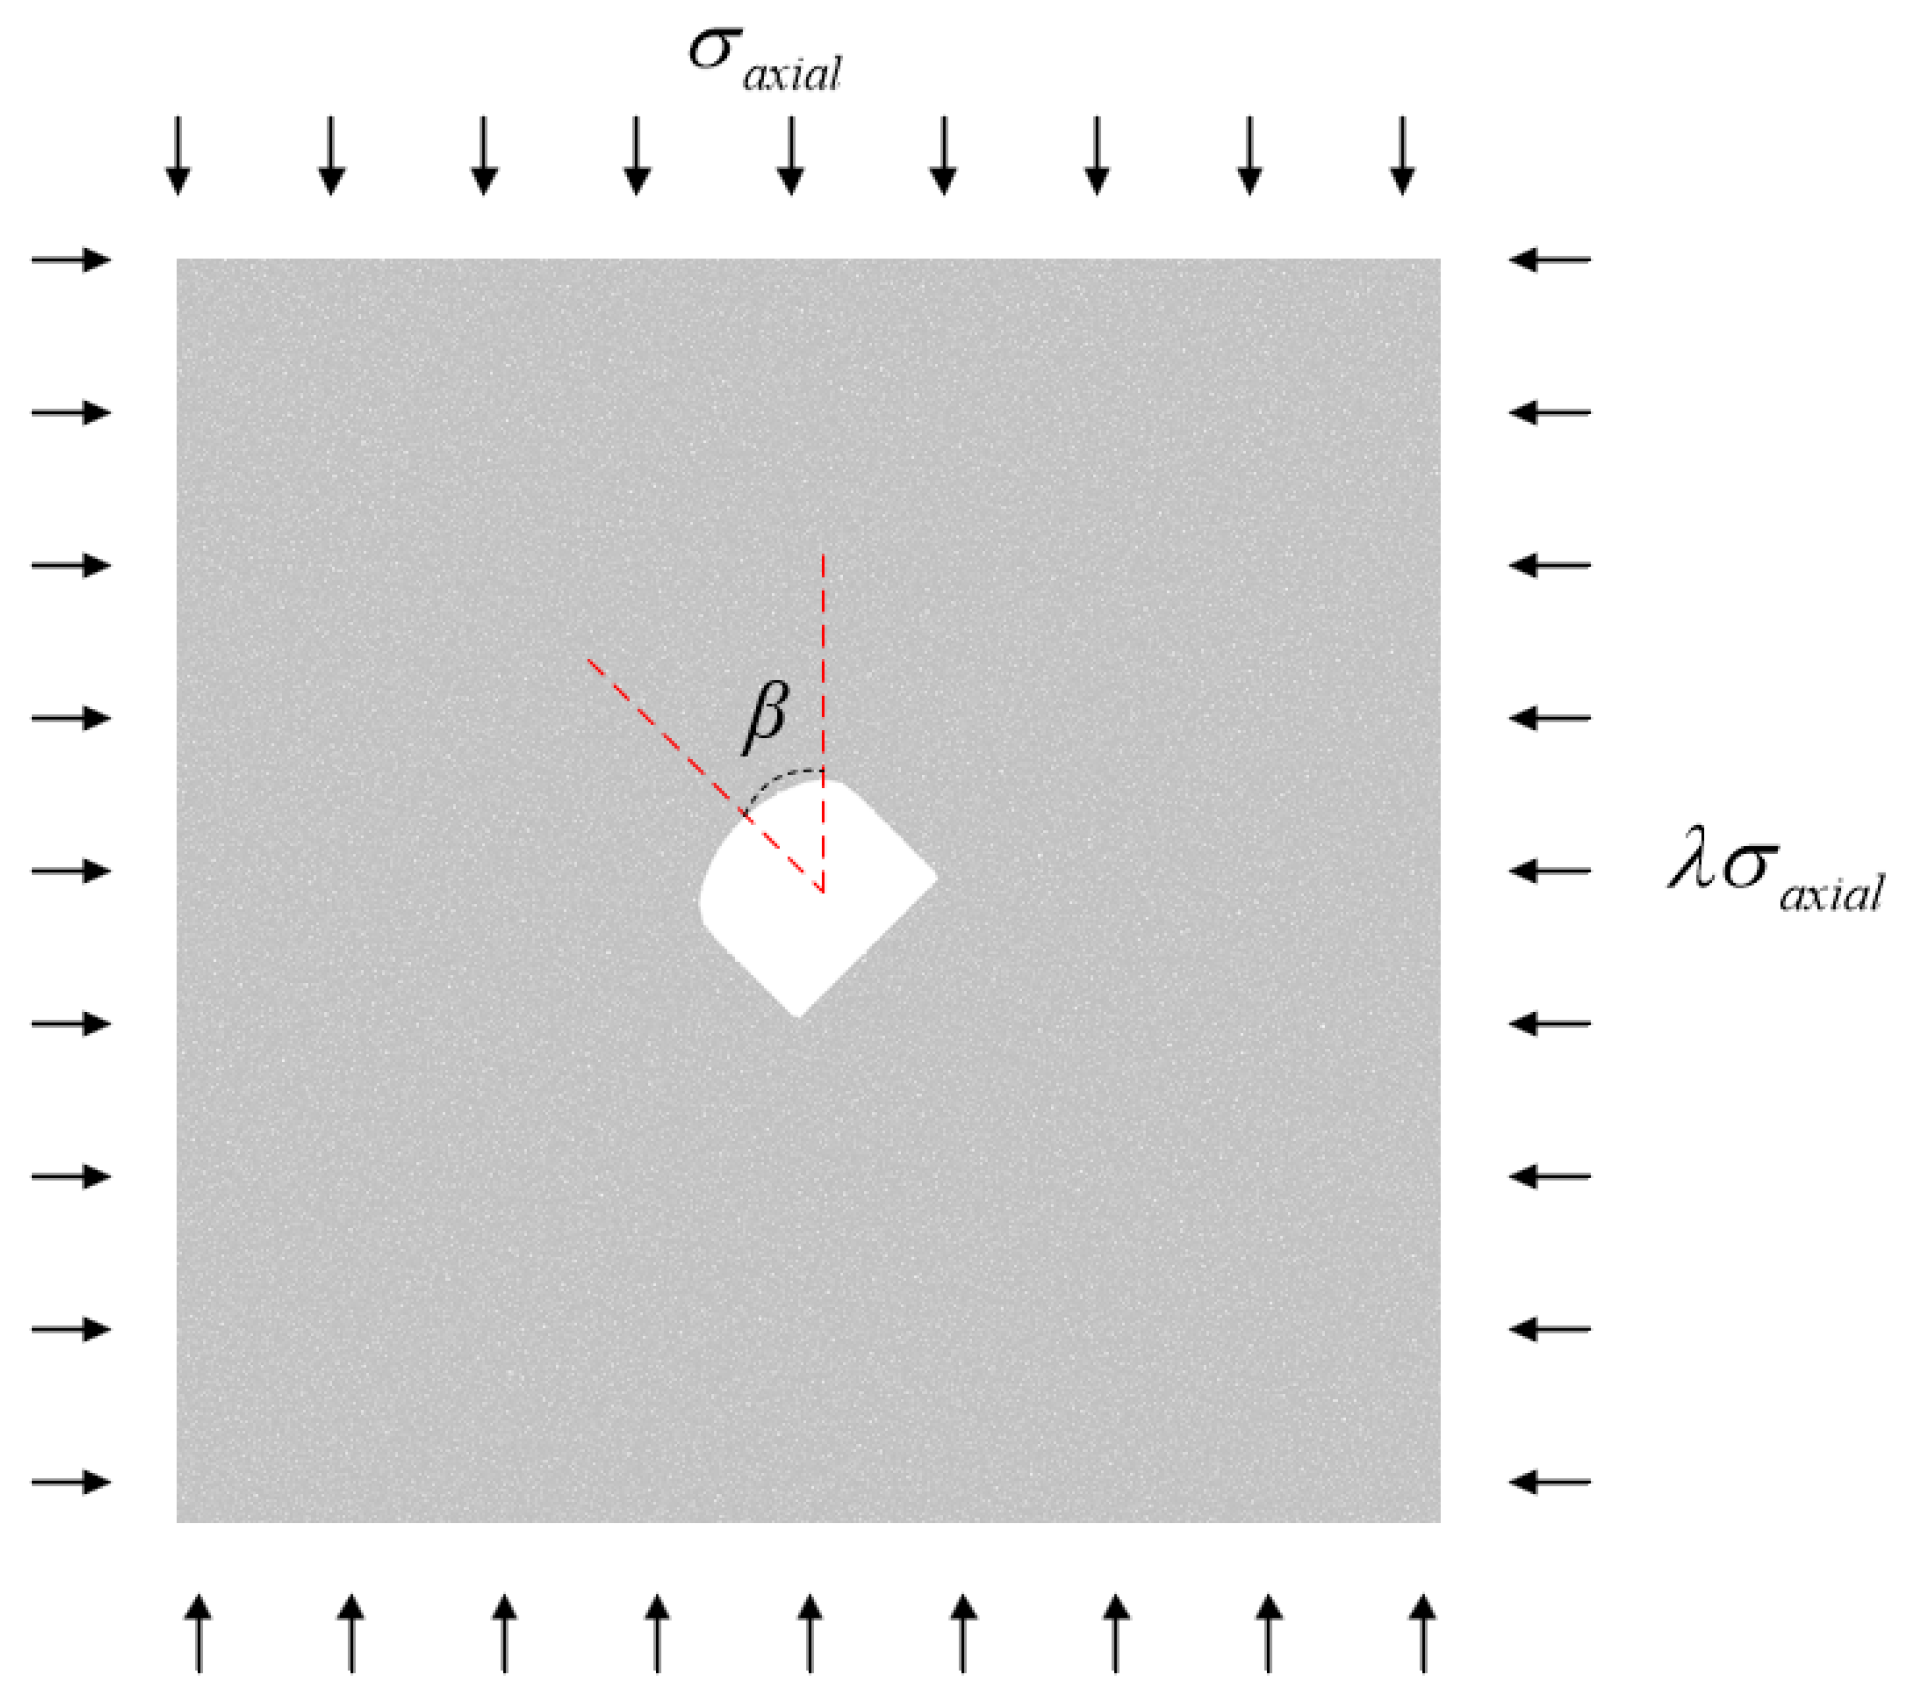
  • The direction of the principal stress has a minor effect on the degree of tensile stress concentration around the surrounding rock of the opening, but it significantly impacts the stress distribution at the boundary of the opening. When the angle between the maximum principal stress in the plane and the vertical direction is 45°, the compressive stress at the corners of the opening’s straight walls reaches its maximum. This region is prone to failure due to the high compressive stress. In cases where the lateral pressure coefficient is not equal to 1, the stress distribution asymmetry is most pronounced.
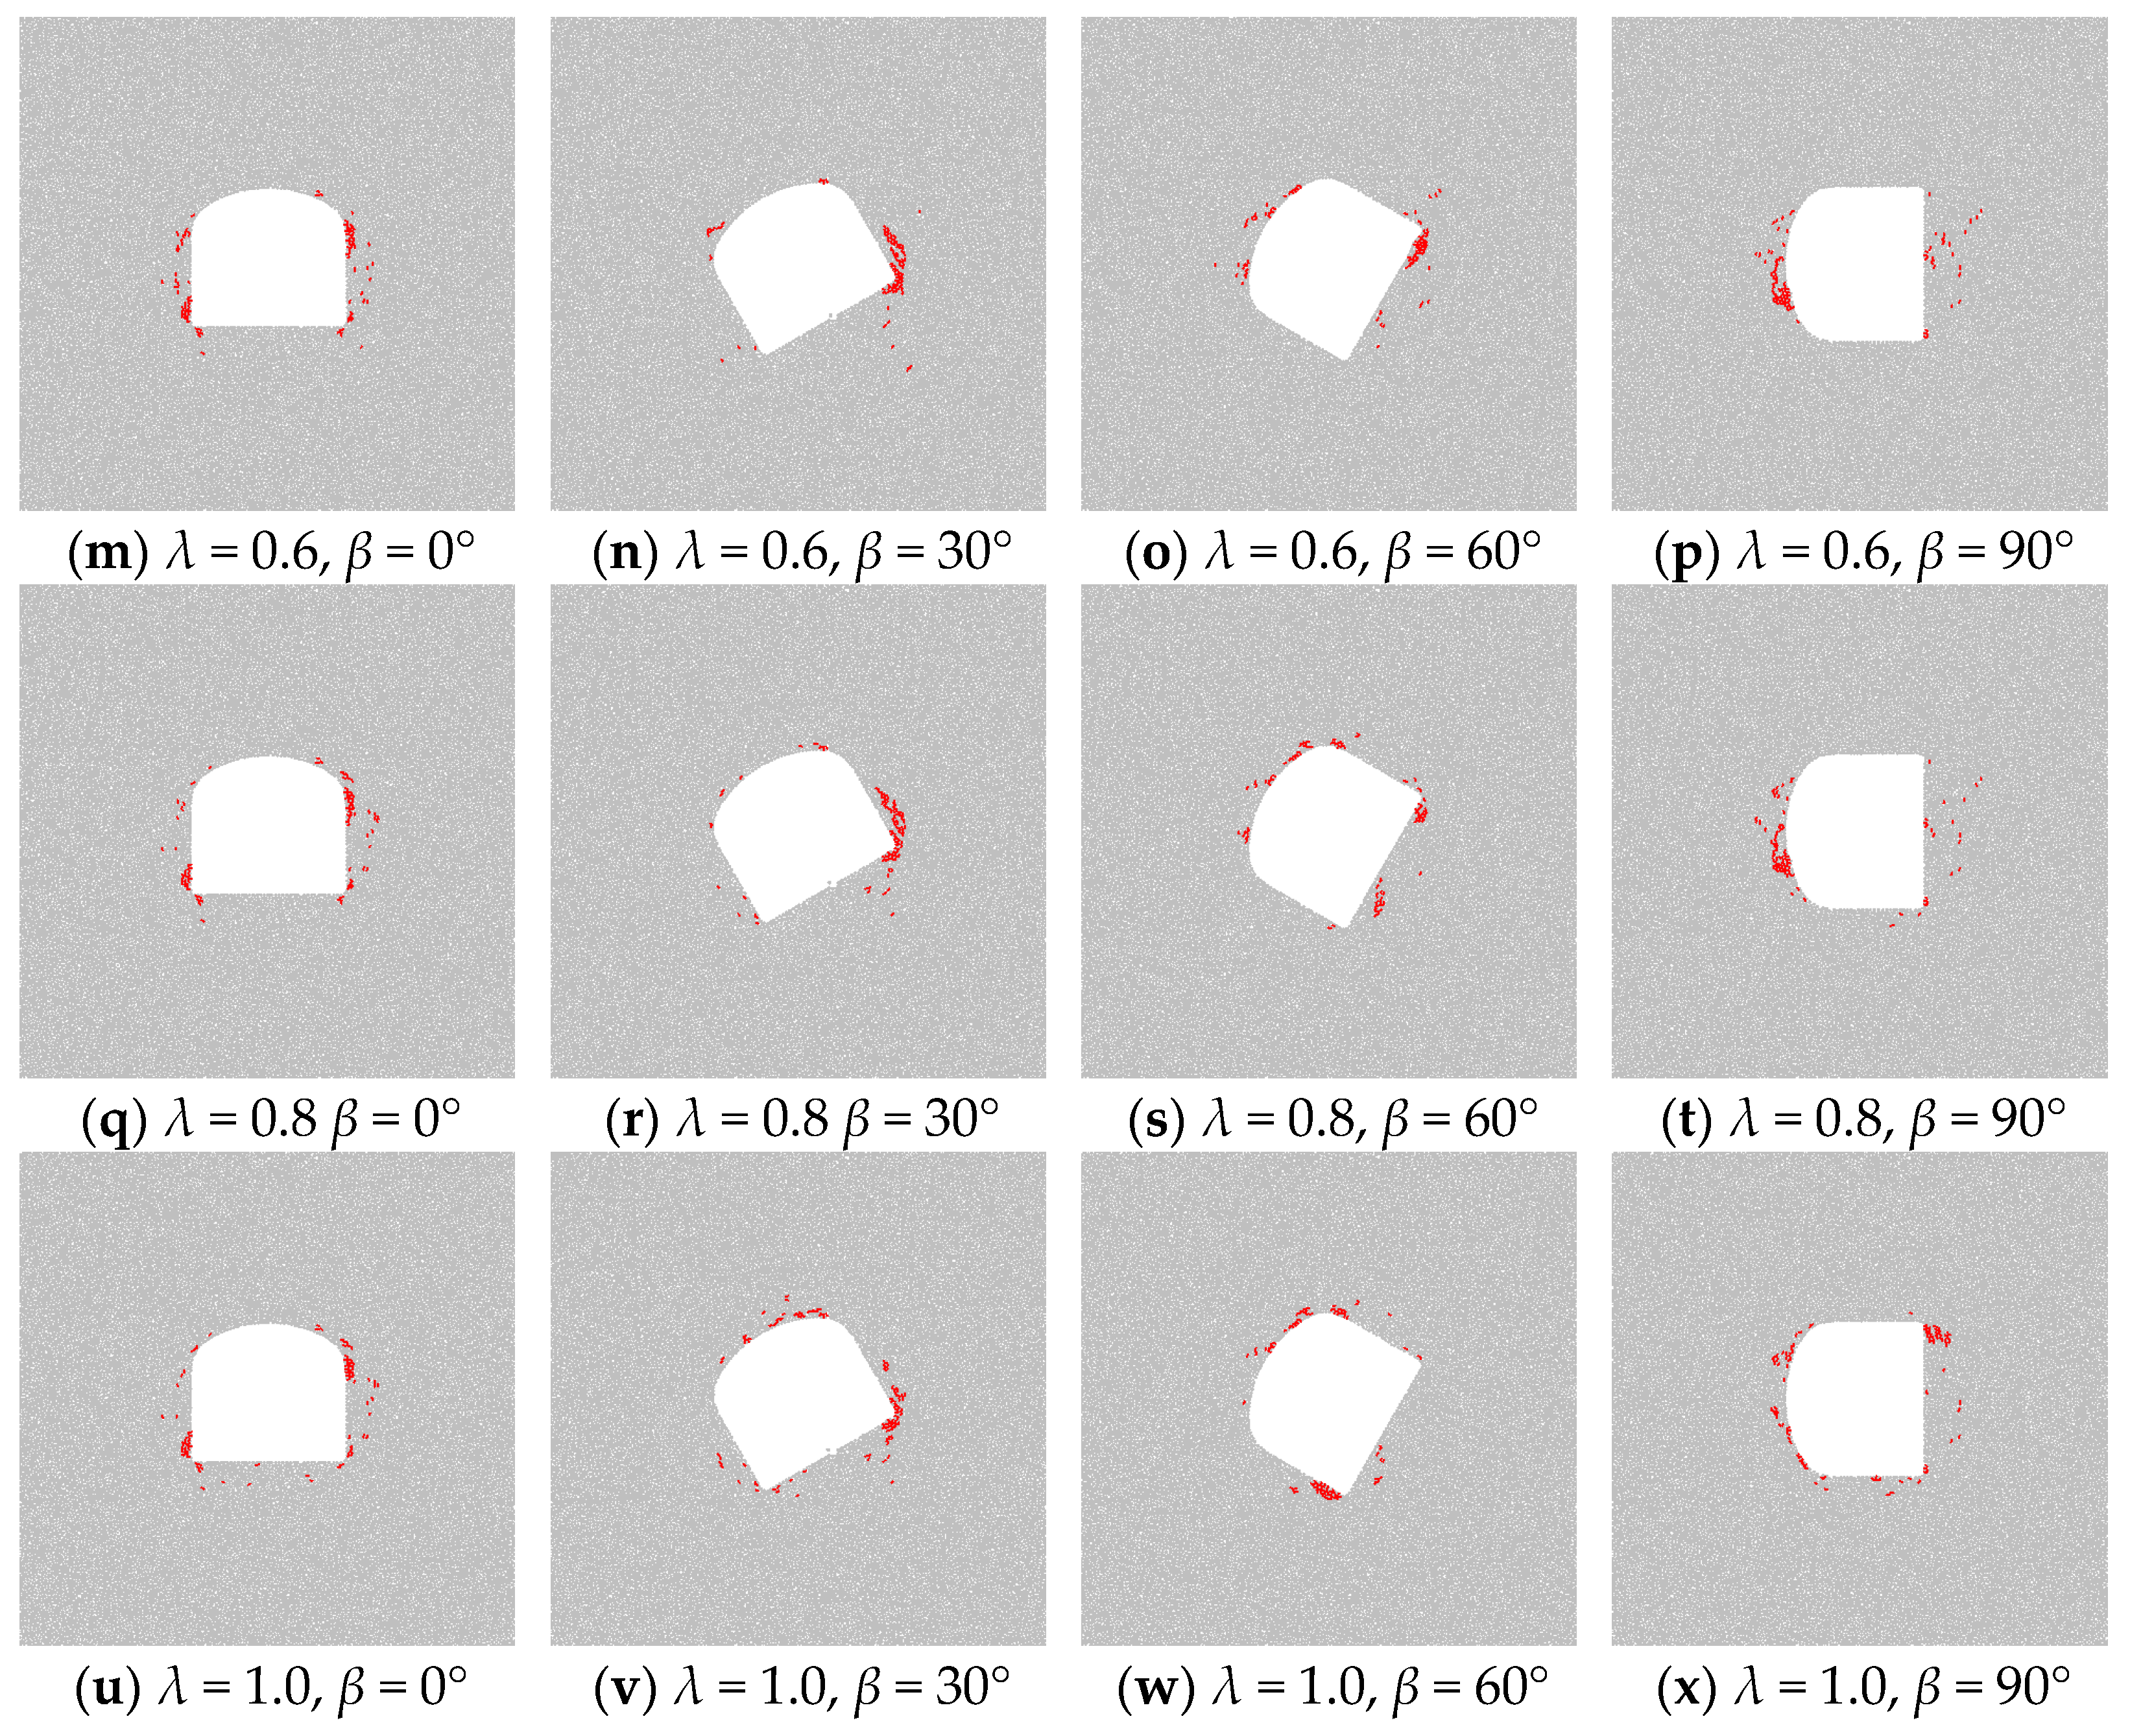
  • DEM numerical simulations confirmed that initial failures occur in areas of compressive or tensile stress concentration, validating the analytical stress solutions. As the lateral pressure coefficient increases, the tensile stress decreases and eventually disappears, while the compressive stress-induced failure range significantly expands.

Supplementary Materials

The following supporting information can be downloaded at: https://figshare.com/articles/dataset/Raw_Data_for_applsci-14-07197/26789905?file=48673189 (accessed on 12 August 2024).

Author Contributions

Data curation, M.C. and Z.L.; formal analysis, L.T. and M.C.; investigation, R.C., X.S. and X.Q.; methodology, X.S., R.C. and X.Q. All authors have read and agreed to the published version of the manuscript.

Funding

This research was funded by projects of the National Natural Science Foundation of China (No. 52104110, 52374152), Hunan Provincial Natural Science Foundation of China (No. 2020JJ5743), Key R&D projects of the 14th Five Year Plan (No. 2022YFC2904602); and the CRSRI Open Research Program (No. CKWV2019738/KY).

Institutional Review Board Statement

Not applicable.

Informed Consent Statement

Not applicable.

Data Availability Statement

The data used to support the findings of this study are available from the corresponding author upon request.

Conflicts of Interest

Author Mingyu Cao was employed by the Guangdong Province Dabaoshan Mining Co., Ltd. The remaining authors declare that the research was conducted in the absence of any commercial or financial relationships that could be construed as a potential conflict of interest.

References

  1. Zhou, Z.; Cai, X.; Li, X.; Cao, W.; Du, X. Dynamic Response and Energy Evolution of Sandstone under Coupled Static–Dynamic Compression: Insights from Experimental Study into Deep Rock Engineering Applications. Rock Mech. Rock Eng. 2020, 53, 1305–1331. [Google Scholar] [CrossRef]
  2. Li, Z.; Ren, T.; Li, X.; Cheng, Y.; He, X.; Lin, J.; Qiao, M.; Yang, X. Full-scale pore structure characterization of different rank coals and its impact on gas adsorption capacity: A theoretical model and experimental study. Energy 2023, 277, 127621. [Google Scholar] [CrossRef]
  3. Tan, L.; Ren, T.; Dou, L.; Sun, J.; Yang, X.; Qiao, M. Moisture penetration and distribution characterization of hard coal: A µ-CT study. Int. J. Coal Sci. Technol. 2024, 11, 55. [Google Scholar] [CrossRef]
  4. Tan, L.; Ren, T.; Yang, X.; He, X. A numerical simulation study on mechanical behaviour of coal with bedding planes under coupled static and dynamic load. Int. J. Min. Sci. Technol. 2018, 28, 791–797. [Google Scholar] [CrossRef]
  5. Cao, R.-h.; Yao, R.; Hu, T.; Wang, C.; Li, K.; Meng, J. Failure and mechanical behavior of transversely isotropic rock under compression-shear tests: Laboratory testing and numerical simulation. Eng. Fract. Mech. 2021, 241, 107389. [Google Scholar] [CrossRef]
  6. Xin, J.; Jiang, Q.; Li, S.; Chen, P.; Zhao, H. Fracturing and Energy Evolution of Rock around Prefabricated Rectangular and Circular Tunnels under Shearing Load: A Comparative Analysis. Rock Mech. Rock Eng. 2023, 56, 9057–9084. [Google Scholar] [CrossRef]
  7. Feng, F.; Li, X.; Rostami, J.; Li, D. Modeling hard rock failure induced by structural planes around deep circular tunnels. Eng. Fract. Mech. 2019, 205, 152–174. [Google Scholar] [CrossRef]
  8. Soni, S.; Saindane, U. Stress Analysis of Infinite Plate with Elliptical Hole; Springer: Singapore, 2019; pp. 535–545. [Google Scholar]
  9. Cao, X.; Gong, W.; Zhou, F.; Dai, G. Stress Analytical Solution for Shallow Buried Lined Circular Tunnel under the Deformation of Surrounding Rock Inner Edge. Geotech. Geol. Eng. 2019, 37, 3771–3780. [Google Scholar] [CrossRef]
  10. Xiao, W.; Zhang, D.; Li, S.; Lu, J. Fracture evolution and fracture mechanism of tunnel surrounding rock: A case study based on laboratory tests and theoretical analysis. Fatigue Fract. Eng. Mater. Struct. 2023, 46, 2617–2638. [Google Scholar] [CrossRef]
  11. Wu, H.; Zhao, G.-y.; Ma, S.-w. Failure behavior of horseshoe-shaped tunnel in hard rock under high stress: Phenomenon and mechanisms. Trans. Nonferrous Met. Soc. China 2022, 32, 639–656. [Google Scholar] [CrossRef]
  12. Zhao, G.; Yang, S. Analytical solutions for rock stress around square tunnels using complex variable theory. Int. J. Rock Mech. Min. Sci. 2015, 80, 302–307. [Google Scholar] [CrossRef]
  13. Wu, H.; Ma, D. Fracture response and mechanisms of brittle rock with different numbers of openings under uniaxial loading. Geomech. Eng. 2021, 25, 481–493. [Google Scholar]
  14. Tan, L.; Ren, T.; Dou, L.; Yang, X.; Qiao, M.; Peng, H. Analytical stress solution and mechanical properties for rock mass containing a hole with complex shape. Theor. Appl. Fract. Mech. 2021, 114, 103002. [Google Scholar] [CrossRef]
  15. Tan, L.; Ren, T.; Dou, L.; Yang, X.; Wang, G.; Peng, H. Analytical Stress Solution and Numerical Mechanical Behavior of Rock Mass Containing an Opening under Different Confining Stress Conditions. Mathematics 2021, 9, 2462. [Google Scholar] [CrossRef]
  16. Jiang, H.; Li, R.; Wang, L.; Li, C.; Su, G. Influence of Principal Stress Direction on the Fracture Characteristics of Granite with an Inverted U-Shaped Cavity. Int. J. Civ. Eng. 2023, 21, 1835–1851. [Google Scholar] [CrossRef]
  17. Lu, J.; Yin, G.; Zhang, D.; Li, X.; Huang, G.; Gao, H. Mechanical properties and failure mode of sandstone specimen with a prefabricated borehole under true triaxial stress condition. Geomech. Energy Environ. 2021, 25, 100207. [Google Scholar] [CrossRef]
  18. Zhao, Y.; Wu, J. The Influence of Underground Cavity on The Stability of Tunnel Excavation. Int. J. Nat. Resour. Environ. Stud. 2024, 2, 64–77. [Google Scholar] [CrossRef]
  19. Pu, S.; Wu, R.; Wu, S.; Cheng, H.; Cao, L.; Ren, Z. Analysis of Deformation Characteristics and Failure Mechanism of Interbedded Surrounding Rock Tunnels Based on Principal Stress Difference. Int. J. Geomech. 2024, 24, 04024197. [Google Scholar] [CrossRef]
  20. Abbaszadeh Shahri, A.; Larsson, S.; Renkel, C. Artificial intelligence models to generate visualized bedrock level: A case study in Sweden. Model. Earth Syst. Environ. 2020, 6, 1509–1528. [Google Scholar] [CrossRef]
  21. Muskhelishvili, N.I. Some Basic Problems of the Mathematical Theory of Elasticity; Springer Science & Business Media: New York, NY, USA, 2013. [Google Scholar]
  22. Ukadgaonker, V.; Rao, D. Stress distribution around triangular holes in anisotropic plates. Compos. Struct. 1999, 45, 171–183. [Google Scholar] [CrossRef]
  23. Hromadka, T.V.; Lai, C. The Complex Variable Boundary Element Method in Engineering Analysis; Springer Science & Business Media: New York, NY, USA, 2012. [Google Scholar]
  24. Itasca Consulting Group, Inc. Particle Flow Code 6.0; Itasca: Minneapolis, MN, USA, 2017; Volume 4. [Google Scholar]
  25. Zhang, X.-P.; Liu, Q.; Wu, S.; Tang, X. Crack coalescence between two non-parallel flaws in rock-like material under uniaxial compression. Eng. Geol. 2015, 199, 74–90. [Google Scholar] [CrossRef]
Figure 1. Far-field stress state in a plane: (a) non-principal stress state; (b) principal stress state.
Applsci 14 07197 g001
Figure 2. Evolution curve of the mapping function error with increasing m.
Applsci 14 07197 g002
Figure 3. Comparison of mapped shape and original shape of the opening: (a) m = 4; (b) m = 8; (c) m = 16; (d) m = 24.
Applsci 14 07197 g003
Figure 4. Hoop stress distribution curves at the opening boundary under different θ and λ: (a) β = 0°; (b) β = 15°; (c) β = 30°; (d) β = 45°; (e) β = 60°; (f) β = 75°; (g) β = 90°.
Applsci 14 07197 g004aApplsci 14 07197 g004b
Figure 5. Variation curves of maximum and minimum hoop stress at the opening boundary with β under different λ: (a) maximum hoop stress; (b) minimum hoop stress.
Applsci 14 07197 g005
Figure 6. Geometry of rock mass containing an opening in the DEM numerical model.
Applsci 14 07197 g006
Figure 7. Initial failure distribution in the surrounding rock around the opening in typical cases.
Applsci 14 07197 g007aApplsci 14 07197 g007b
Table 1. Calculation cases with various geo-stress states.
Principal Stress StateNon-Principal Stress State
λβσxσyτxy
001.0000.0000.000
150.9330.0670.250
300.7500.2500.433
450.5000.5000.500
600.2500.7500.433
750.0670.9330.250
900.0001.0000.000
0.201.0000.2000.000
150.9460.2540.200
300.8000.4000.346
450.6000.6000.400
600.4000.8000.346
750.2540.9460.200
900.2001.0000.000
0.401.0000.4000.000
150.9600.4400.150
300.8500.5500.260
450.7000.7000.300
600.5500.8500.260
750.4400.9600.150
900.4001.0000.000
0.601.0000.6000.000
150.9730.6270.100
300.9000.7000.173
450.8000.8000.200
600.7000.9000.173
750.6270.9730.100
900.6001.0000.000
0.801.0000.8000.000
150.9870.8130.050
300.9500.8500.087
450.9000.9000.100
600.8500.9500.087
750.8130.9870.050
900.8001.0000.000
1.001.0001.0000.000
151.0001.0000.000
301.0001.0000.000
451.0001.0000.000
601.0001.0000.000
751.0001.0000.000
901.0001.0000.000
Table 2. Rock parameters for the PFC2D numerical model.
ρμEck* E ¯ c k ¯ * c ¯ σ ¯ t
2.70 g/cm30.5773.2 GPa1.03.2 GPa1.021.1 MPa13.2 MPa
ρ: density; μ: friction coefficient; Ec: effective modulus; k*: normal-to-shear stiffness ratio; E ¯ c : bond effective modulus; k ¯ * : bond normal-to-shear stiffness ratio; c ¯ : cohesion; σ ¯ t : bond tensile strength.
Disclaimer/Publisher’s Note: The statements, opinions and data contained in all publications are solely those of the individual author(s) and contributor(s) and not of MDPI and/or the editor(s). MDPI and/or the editor(s) disclaim responsibility for any injury to people or property resulting from any ideas, methods, instructions or products referred to in the content.

