Article

Rainfall Erosivity Main Features and Their Associated Synoptic Conditions in North-Eastern Romania

1
Doctoral School of Geosciences, Alexandru Ioan Cuza University of Iași, 700506 Iași, Romania
2
Department of Geography, Faculty of Geography and Geology, Alexandru Ioan Cuza University of Iași, 700506 Iași, Romania
*
Author to whom correspondence should be addressed.
Appl. Sci. 2025, 15(12), 6785; https://doi.org/10.3390/app15126785
Submission received: 13 May 2025 / Revised: 6 June 2025 / Accepted: 11 June 2025 / Published: 17 June 2025
(This article belongs to the Section Environmental Sciences)

Abstract

:
In the actual context of climate change and increased multiannual climate variability, rainfall erosivity is one important topic linking geomorphological and climatological studies. Rainfall modeling is specific for a large part of the Romanian territory, and the estimation of rainfall erosivity is very important because it supports a better management of the arable land. The study is spatially focused on the extra-Carpathian region of Moldova, located in the northeastern part of Romania. Two rainfall erosivity indices were used: Fournier Index and Modified Fournier Index. To complete this analysis, we also used hourly data from two meteorological stations located over the most critical area of soil erosion in Romania (Cârja and Mădârjac). Our results reconfirm the extension of the critical season for soil erosion from May to July over the analyzed region, with its peak clearly defined during June. Based on the maximum hourly rainfall intensities, the synoptic aspects which led to the fall of significant amounts of precipitation in a short time interval were discussed. This analysis outlines the prevalent role of convective systems during summer, developed either within westerly flow or blocking conditions, seconded by the action of deep Mediterranean cyclones in late spring or early autumn. The results could be helpful in a very necessary attempt to develop and implement arable land management policies aiming to limit soil erosion in northeastern Romania, which is very necessary for the next decades when climate change is expected to increase this soil degradation process.

1. Introduction

Soil erosion represents a critical global issue, posing a significant threat to food security, ecosystem stability, and sustainable land management, particularly in vulnerable regions worldwide [1]. Rainfalls are recognized as one of the primary drivers of soil erosion [2,3], with their role being extensively documented in recent studies [4,5]. In addition, the contribution of extreme wind events to soil degradation has gained increasing attention, particularly in arid and semi-arid regions, where their impact rivals that of rainfall [6,7]. However, water, whether from rainfall or snowmelt, remains the dominant morphogenetic agent, shaping landforms and driving the dynamic evolution of slopes through a diversity of processes such as sheet, rill, and gully erosion [8,9,10].
Rainfall aggressiveness is the most appropriate parameter through which the erosion capacity of a torrential rainfall can be determined. Erosion is triggered by the energy shock caused by torrential rains, but also by the quick organization of the liquid runoff. Rainfall erosivity expresses the ability of liquid precipitation to have a significant erosion impact. This parameter is defined most frequently as rainfall index, representing the product of the kinetic energy of a rainfall and its intensity calculated over a period of 30 min [11]. Due to the difficulties of calculating this index, caused by the scarcity of the precipitation data at sub-hourly level, it is important to mention that rainfall aggressiveness is often expressed by other methods that are easier to apply. Even if their accuracy is lower, some of them have a higher suitability for generalizations and synthesis studies at regional level [12]. Overall, rainfall aggressiveness follows an annual cycle [13], driven by combined climate conditions and land use/cover seasonality, being conducive to a plethora of complex environmental and agricultural problems. These include the degradation of the physical, chemical, and biological properties of the soil [14], accelerated nutrient depletion [15], and reduced agricultural productivity [16], which is projected to worsen under future climate scenarios [17]. Recent research has also highlighted the compounding effects of land use change and intensifying extreme weather events, which exacerbate erosion rates and threaten long-term cropland viability [18]. In Romania, the alternation between prolonged droughts and heavy rainfall periods has also led to significant disruptions in the multiannual climate pattern over large areas, resulting in changes in the frequency and intensity of extreme climate events such as heavy precipitation [19,20]. Also, these sequences of severe rainy periods with dry ones are increasingly damaging to agriculture, one of the main economic fields of the country. Thus, land degradation under both climate change and human impact has been recognized as a major environmental threat, especially in the Moldavian Plateau of northeastern Romania [21]. Under these circumstances, estimation of rainfall aggressiveness could contribute to a more accurate assessment of soil loss through erosional processes that, consequently, lead to proper agricultural land use patterns in accordance with best sustainable management practices.
Besides the general very good and extensive knowledge on the topic of soil erosion induced by rainfall aggressiveness, the atmospheric conditions associated with this environmental issue have not been extensively previously investigated. Even if the synoptic conditions associated with atmospheric instability or hail occurrence [22] are well understood for northeastern Romania and can serve as proxies in understanding the synoptic conditions associated with soil erosion, the need for an applied study on this topic is high and therefore the presented study is meant to respond to this need.
Thus, the current study aims to assess erosivity in the analyzed region using two well-known and established indices, to explore the climatological insights of hourly level precipitation amounts that can bring details on rainfall aggressiveness, and especially to draw a comprehensive image of the synoptic conditions associated with the heavy precipitations. This last part represents by far the most important contribution of the current study to the field of soil rainfall erosion.

2. Materials and Methods

2.1. Geographical Profile of the Study Area

The analyzed region is represented by the extra-Carpathian Moldova, which is located in the northeastern part of Romania (Figure 1a–c), consisting of the Moldavian Subcarpathians to the west, the Zăbrăuți Platform to the south-west, and the Moldavian Plateau, with the following subunits: the Suceava Plateau (NW), Moldavian Plain (NE), Bârlad Plateau (central-south), Covurlui Plateau (SE), and Elan Plain (E). Altitudes vary between 32 m in the Prut valley bordering the region to the east and 911 m on the Pleșu Peak in the northwestern part, close to the Carpathian Mountains. The study area encompasses a surface area of 29,254 km2 with a mean elevation of 229 m, exhibiting a general topographic gradient that decreases from the northwest to the southeast. This physiographic trend is further evidenced by the predominance of southern and southeastern-facing slopes across the region. Anthropogenic activities have substantially altered the natural vegetation cover, with agricultural land use—particularly crop production—now dominating most of the landscape as observed for Fălciu Hills area [23].
As in most parts of Romania, the region is known to record the maximum annual precipitation amount in May–July (Figure 1d, e), with the highest amount of precipitation within a 24 h interval in Romania [24,25] which is generally considered an indicator of the increased climate continentalism in the eastern part of the country and leads to higher soil erosion susceptibility.
Therefore, from a geomorphological perspective, the region is known for the high extension and intensity of erosional processes that are considered a combined effect of sedimentary lithology, fragile soils, and regional meteorological conditions under widespread improper human impact in terms of deforestation and agricultural practices [26,27,28]. As a result, the central-southern part of the analyzed region, corresponding to the Bârlad Plateau, records the highest values of eroded land (with a local value exceeding 25 t/ha/year) in the entire extra-Carpathian region of Romania [29]. This contributes significantly to the higher pressure on arable land, leading to soil degradation [30].
The northeastern part of Romania is a region with an important agricultural economy, based on crop production a long time in the past, as accurately reflected by the historical land use [12]. An important part of this area is still dominated by subsistence agriculture, described by very low yields, while the constant need for new agricultural land generates a significant pressure, especially on forestland [31].

2.2. Data Used

In this study, we have used multiple types of meteo-climatic data. Firstly, in order to give a general overview of soil erosion over northeastern Romania, we have used the ERA-5 dataset [32]. In addition, the same type of data was used to depict the synoptic conditions associated with the most intense rainfalls over the analyzed region. Therefore, a database of downscaled bioclimatic indicators derived from the ERA-5 reanalysis [33] and available on the Copernicus Climate Data Store was used. The database contains the mean values of 76 bioclimatic indicators for the period 1979–2024, at a spatial resolution of 1 km × 1 km. The indicators utilized in this study encompass annual precipitation (BIO12) and the precipitation of the wettest month (BIO13), employed for the calculation of the Fournier Index. The monthly mean precipitation values were further leveraged for the determination of the Modified Fournier Index. The data were extracted from the database using climate data operators (CDO) [34], as well as the ncdf4 package in R program language [35]. The subsequent processing and interpolation was also conducted in R using the terra, sf, stars, and dplyr packages. The processed raster files were imported in QGIS 3.16 to obtain the final cartographic products.
Secondly, in order to enhance the accuracy of the analysis developed firstly on gridded datasets [36], we have also used ground-based data from two independent weather stations (Cârja in Vaslui County and Mădârjac in Iași County, Figure 1c). We underline that these two weather stations are self-managed weather stations, offering the advantage of hourly precipitation amount resolution that can provide more precise insights at the regional and local scale on rainfall intensity [37,38]. It is also important to note that these two weather stations bring new information on hourly rainfall data in some areas largely uncovered by official weather measurements in northeastern Romania. The data from these weather stations were collected from 2013 to 2019, representing a time interval sufficiently consistent to draw the general image of synoptic conditions associated with intense rainfall at the hourly level. Out of the hourly data from the two weather stations, we selected those days that recorded at least one hour with rainfall greater than 5 mm, building a dataset consisting of 63 independent days between 2013 and 2019. Using all these days, the synoptic climatology of moderate and heavy rains was built, using two methods.
The general synoptic conditions were delineated through the utilization of composite maps from the aforementioned period, encompassing the spatial distribution of the following parameters: 500 hPa geopotential height, sea level pressure (SLP), Convective Available Potential Energy (CAPE), and precipitation amount. Concurrently, distinct weather patterns were identified through the implementation of a Self-Organizing Maps (SOMs) methodology. The data necessary for conducting the composite analysis maps and the SOMs, which serve as a pillar for building the synoptic climatology of moderate and heavy rains, were also downloaded from the ERA-5 gridded dataset [32].

2.3. Methods

2.3.1. Fournier Index (FI) and Modified Fournier Index (MFI)

Generally, there is a strong link between the annual rainfall distribution and the amount of eroded soil. Many researchers [9,12,39,40,41] have shown that the Fournier Index and the Modified Fournier Index are indispensable in studying rainfall erosivity.
To calculate the first index (Table 1), we used the average monthly amount of precipitation for the rainiest month of the year (pmax) and the annual amount of precipitation (P): F = pmax2/P.
While the Fournier Index takes into account precipitations amounts from the rainiest month of the year, Arnoldus [43] proposed a modification to this index (Table 2) so that precipitations of other months are considered. Its formula uses the average monthly amount of precipitation (Pi) and the annual precipitation amount (P): M F I = i = 1 12 P i 2 / P .

2.3.2. Self-Organizing Maps (SOM)

As a type of unsupervised neural network, Self-Organizing Maps (SOMs) are primarily used for visualization and exploratory analysis of large datasets [44]. They employ an unsupervised learning method, and the training of the network is carried out using a competitive learning algorithm [45]. SOM preserves the topological structure of the input data, meaning similar data points are mapped close together. This is particularly valuable in geosciences, where atmospheric systems exhibit continuous, rather than discrete patterns. The method’s suitability for synoptic climatology lies in its capacity to handle nonlinear atmospheric data while visualizing transitions between circulation patterns [46].
In this study, the Self-Organizing Maps (SOM) algorithm was applied to classify atmospheric circulation patterns using a one-dimensional topological structure, implemented via the COST-733 software [47,48]. Unlike the typical two-dimensional SOM grid, this configuration arranged neurons linearly, with each neuron connected only to its left and right neighbors. The classification was performed using three neurons, and the learning process began with an initial learning rate of 0.1, which decreased linearly to 0.01 over 10,000 iterations, ensuring a gradual refinement of the neural network’s weights. This approach leveraged SOM’s ability to preserve topological relationships in high-dimensional atmospheric data, clustering similar circulation patterns into neighboring nodes while maintaining the continuous nature of atmospheric states [49]. To assess the robustness of the classification, we performed internal validation by analyzing cluster coherence and the quantization error, ensuring that the resulting patterns were well-separated and meteorologically meaningful.

3. Results and Discussions

3.1. Spatial Distribution of Rainfall Aggressiveness in Northeastern Romania

In the eastern part of Romania, the annual distribution of heavy rains is recorded between May and September, with the highest frequency occurring in June, followed by July, August, September, and May [12]. For larger periods of time, it appears that 56.8% of the heavy rainfall was recorded between 15 May and 20 June, an interval that overlaps with the critical erosion season for the Moldavian Plateau [50].
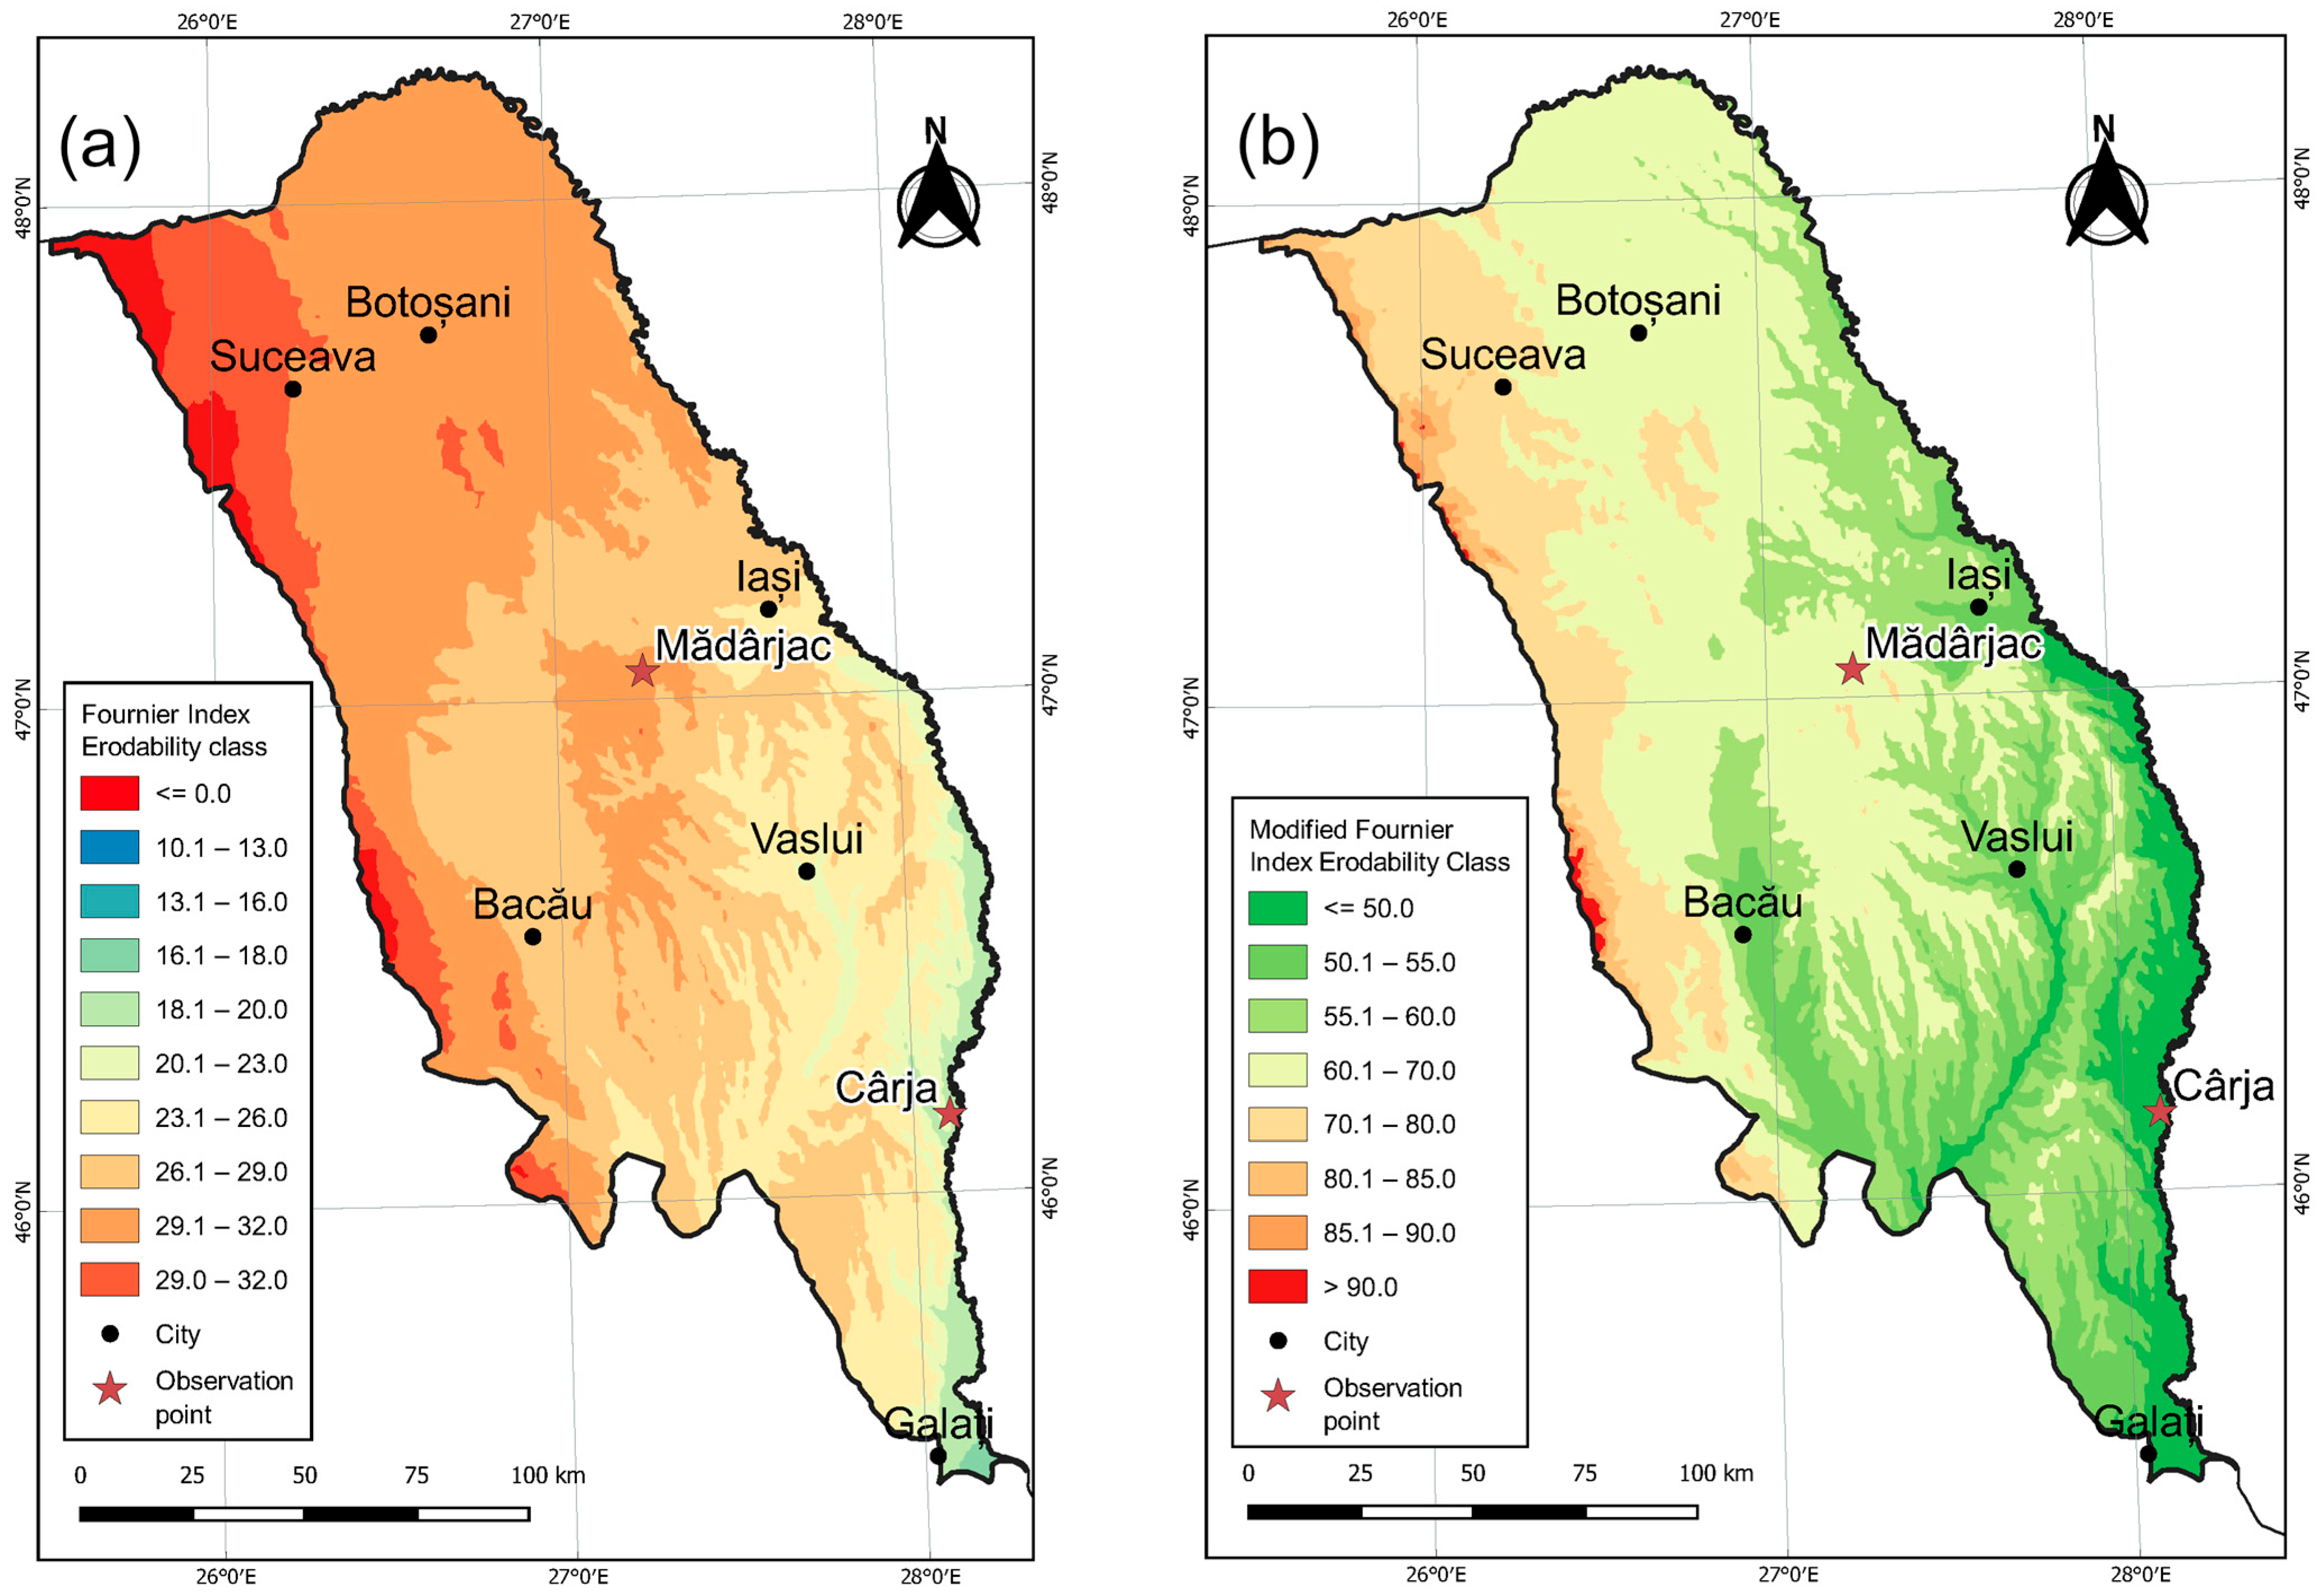
Thus, we calculated the Fournier Index for the period 1979–2018 using ERA-5 reanalysis dataset. The Fournier Index is based on the amount of rainfall, and therefore, the minimum values obtained over the analyzed region are between 13 and 16 (very low erosion class with soil losses between 0–5 t/ha/year), located in the southeastern part of the extra-Carpathian Moldova where the annual precipitation amount is the lowest over the entire analyzed region (Figure 2a). Conversely, the maximum values reach 36 (low erosion class with soil losses of 5–12 t/ha/year) along the boundaries with the mountainous terrain. Although this estimated value of erosion does not seem high, it signifies an important loss, significantly exceeding the natural soil regeneration capacity. Furthermore, the topography of the region, as indicated in Figure 1b, has been demonstrated to exert a substantial influence on erosion rates, with significantly higher values observed in hilly regions compared to plains, particularly in the central and southeastern regions of the study area [51,52].
Our results indicate similar values to those reported for other regions in Romania. Thus, Fournier Index values range from 10 to 16 over the Bucharest area [40], while in the Secașul Mare Basin, values show very low aggressiveness in the lower area of the basin and low to moderate aggressiveness in the higher area of the basin [9].
During the same time interval, the Modified Fournier Index registered values between 42.3 (very low erosion class) and 103.7 (moderate erosion class). The maximum values were concentrated mainly in the area of the Suceava Plateau in the northwest and the Moldavian Subcarpathians in the west, while the minimum values were found in the southeastern part (Figure 2b). However, when lithological and land cover factors are considered, the soil erosion is highest in this south-eastern part, with annual soil erosion loss peaking up to 25 t/h/year [51], being expected to increase at the highest rate across the arable region of Romania in both moderate and extreme climate change scenarios [52]. Moreover, in situ measurements of soil erosion in this critical region shown that peak years reach 60 t/ha/year, in direct relation with rainfall aggressiveness index [53]. At the European scale, values like these are among the highest values for lowland regions besides important areas of southern Spain or Italy [3].
Other studies have shown that the Modified Fournier Index ranges from 53.6 to 66.6 in Bucharest [40]. According to the aggressiveness classes of the Modified Fournier Index, in the Secașul Mare Basin, for altitudes below 200 m, the rainfall aggressiveness is very low, increasing at altitudes over 800 m to moderate [9]. Moreover, the annual cycle reveals substantial differences from one month to another: from very low aggressiveness between December and March to very high aggressiveness in June and July [12]. In brief, both analyzed indices are contingent upon precipitation levels, leading to the concentration of maximum values in elevated regions where orographic effects result in heightened precipitation amounts.

3.2. The Analysis of Hourly Precipitation Amounts

Each rain event has a mean intensity, represented by the total amount of water that falls during the entire event, as well as a maximum intensity, represented by the highest recorded intensity during the rain [54].
To assess these rainfall aspects related to intensity, we used the available data of precipitation amount at the hourly level, covering the 2013–2019 period, from two weather stations located in critical areas for soil erosion over the region (Cârja in the south-east and Mădârjac in the central part of the analyzed region). The March–November interval, which is particularly relevant for soil erosion, was considered in this study. Consequently, we calculated an intensity per minute for each month, based on hourly data.
At the Cârja weather station (Table 3), the majority of the maximum hourly precipitation amount was recorded in June. The highest value reached was 34.6 mm/h on June 24th, 2013, followed by another 26.8 mm over the subsequent two hours. Furthermore, June reaches the highest mean rainfall intensity (0.26 mm/min) for hours recording precipitations, followed by July and September (0.15 and 0.16 mm/min, respectively), months with fewer hours with precipitations. One can also easily observe the very high variability from one year to another, with some years, such as 2014–2015, exhibiting no significant occurrences of intense rainfall.
The dataset for Mădârjac weather station, from the central part of the analyzed region, show the same general features. In this case, the maximum hourly intensity was reached in 2018, again in June with a maximum of 33.6 mm/h (Table 4).
The critical rainfall aggressiveness season, which is defined as the period of maximum risk of severe rainfall, extends from May to July for both observation points, as is common for the entire region [50].
As was the case with the Cârja weather station, we can easily see that September records higher values of the rainfall intensity compared to August due to the intense convective processes associated with the first cold advections in early autumn. The observed differences between the two locations are primarily attributable to altitude, which can result in a slight increase in orographic uplift at the Mădârjac weather station.
It is important to note that the hourly precipitation levels recorded at these two locations (ranging from 30 to 35 mm/h) are notably lower when compared to long term datasets wherein maximum hourly precipitation amounts frequently surpass 40 mm/h [55]. Due to the short time interval of observations, limited to 2013–2019 for both analyzed weather stations, the maximum values of hourly rainfall amount is very likely to be underestimated, since in nearby regions like Dobrogea, similar values surpass 60 mm/h [55]. However, even extreme flash floods events have been characterized by hourly precipitation amounts of 35 mm [56], underlining the climatical relevance of our results. Overall, from our analysis, we can conclude that these record high values of hourly precipitation amount exceeding 40 mm have a low return period, so that their erosion potential is rather limited, being associated with rare and extreme erosion events and not with regular pluvial erosion conditions.
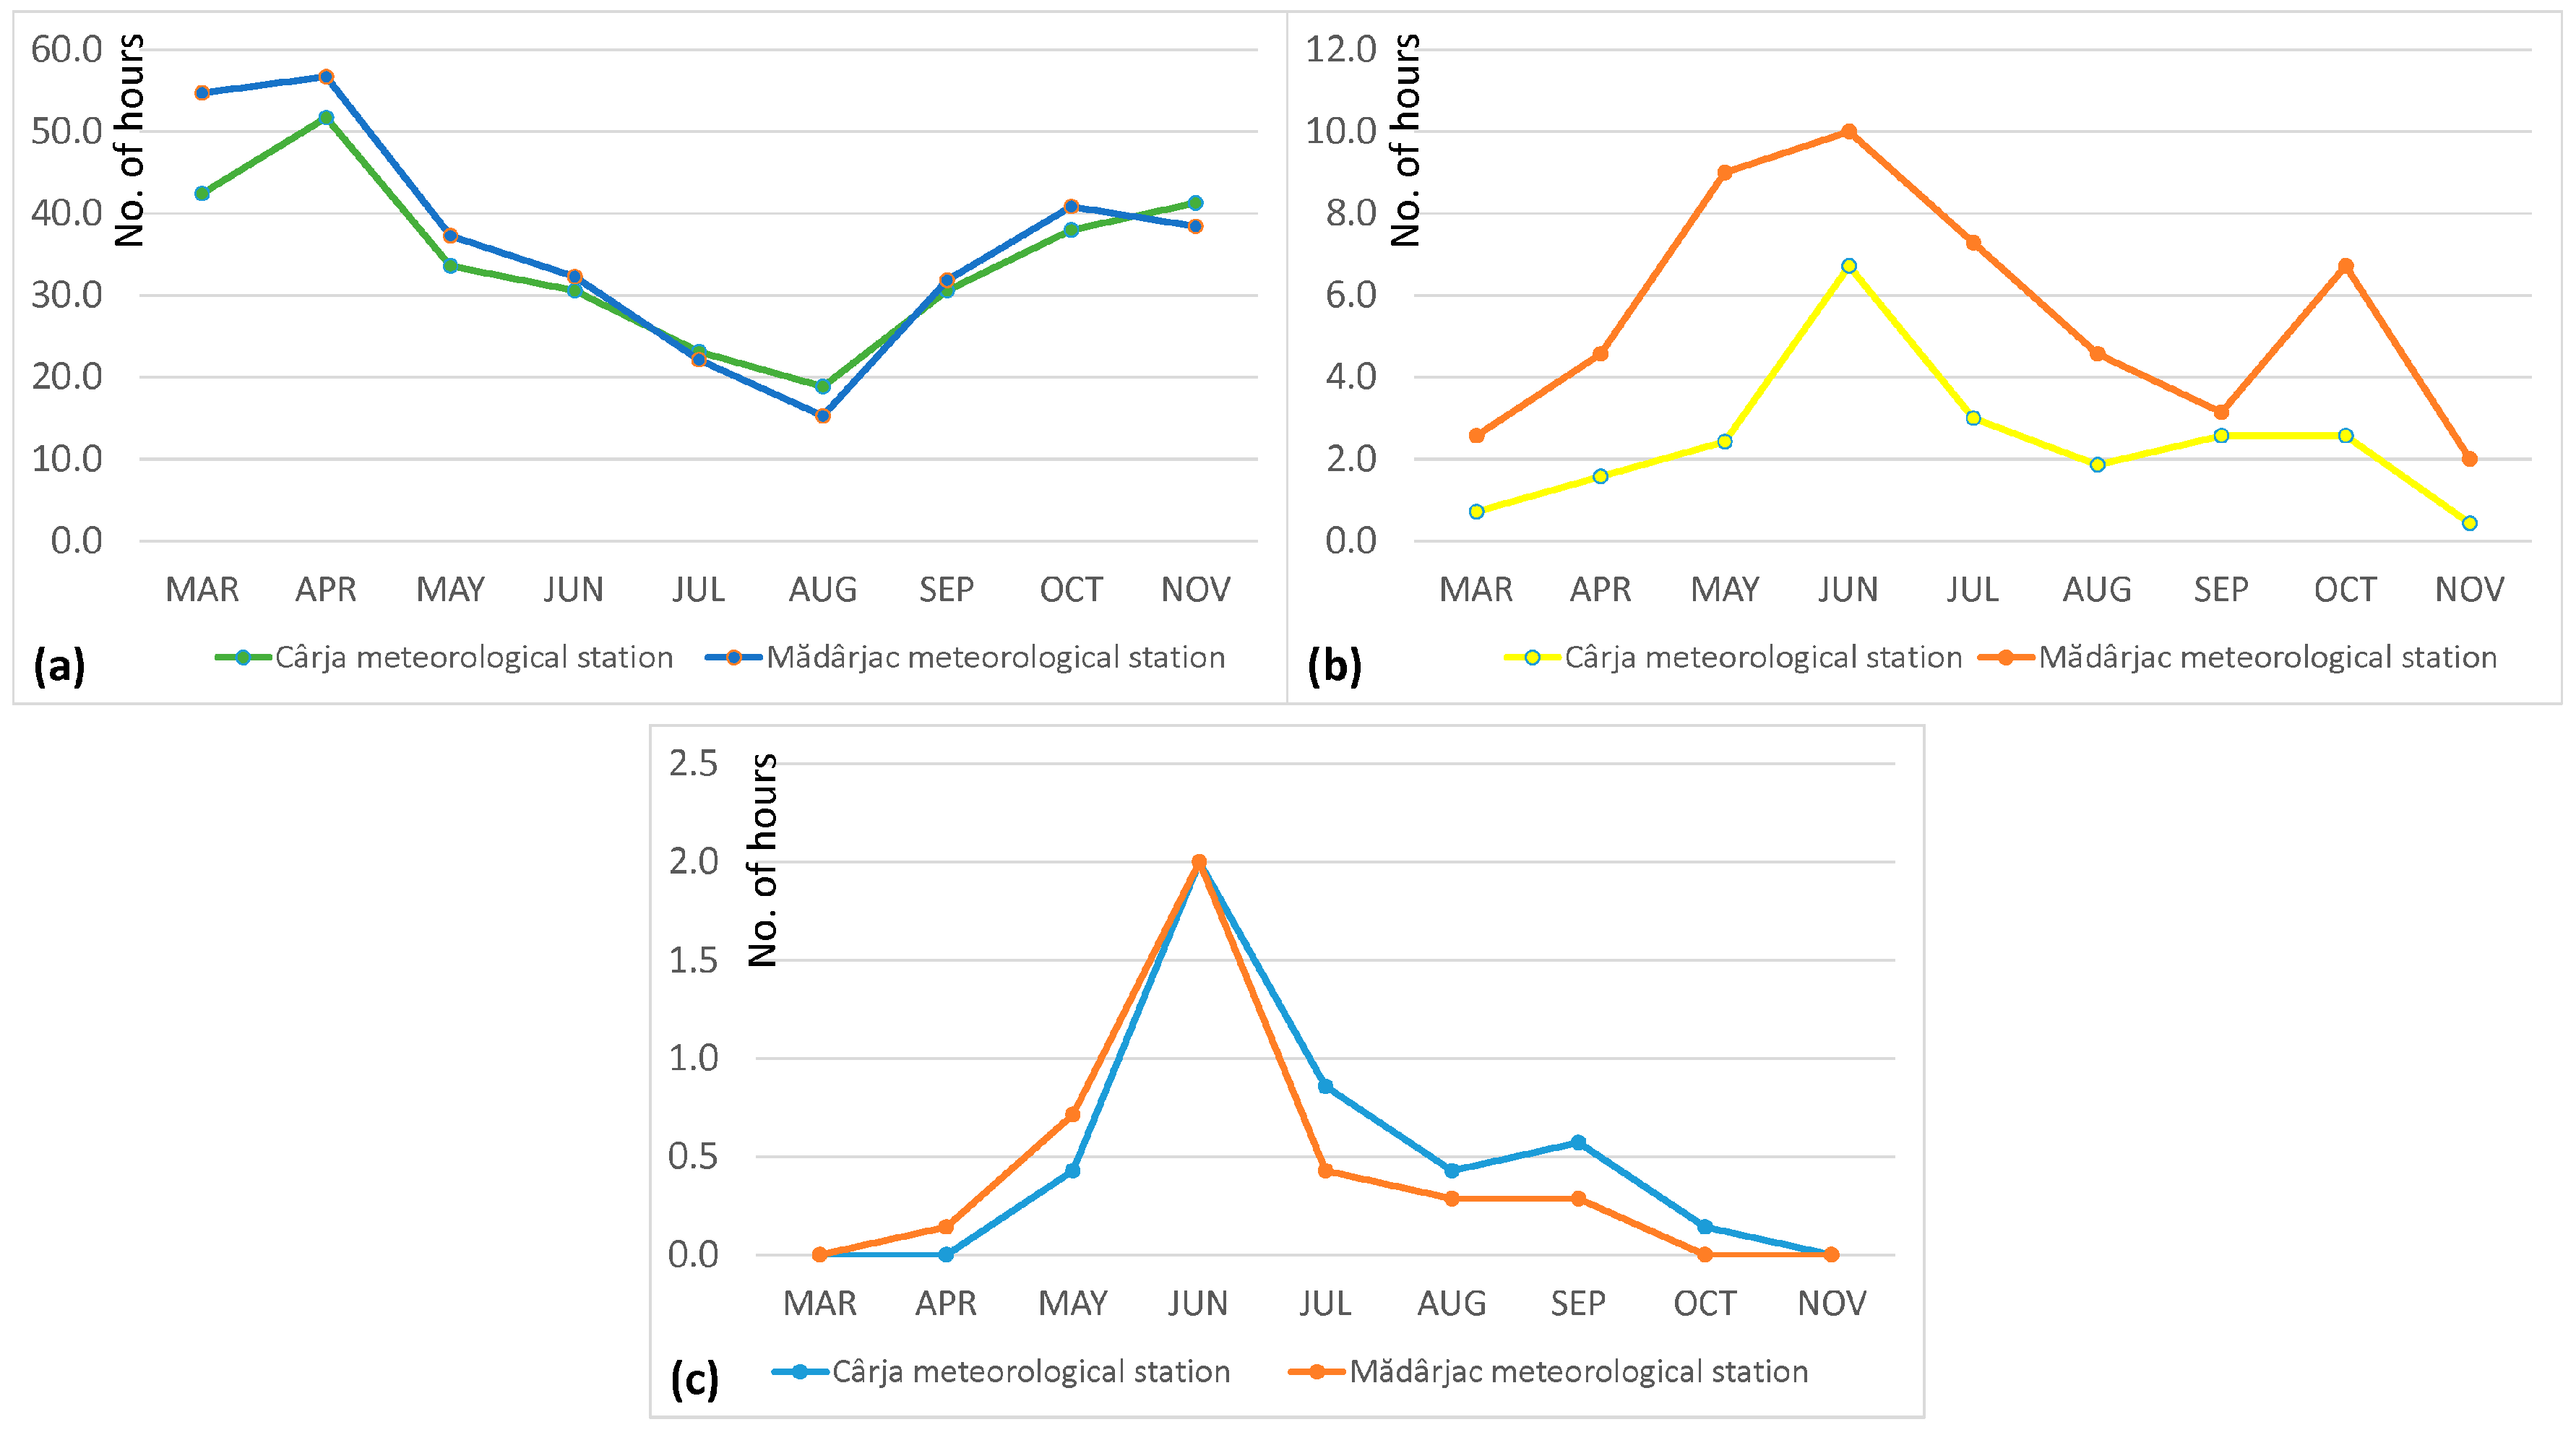
Further, the values of hourly precipitation amount were classified by their intensity classes according to Skreekanth et al. [57]. The simplified classes used in this study are the following: <2.5 mm/h for light rain, 2.6–10.0 mm/h for moderate rain, and >10 mm/h for heavy rain. The hourly precipitation data from the two weather stations for 2013–2019 were then classified into one of the three types of rainfall intensity and the monthly frequency of this classes were calculated and represented as graphs (Figure 3).
Firstly, it can be observed that most of the precipitation amounts below 2.5 mm/h (Figure 3a) fall in April, followed by March and November. Between 2013 and 2019, in April, at the Mădârjac weather station, 56.7 h of light precipitation were recorded, while at the Cârja weather station, 51.7 h of this kind were recorded. Conversely, in August, with reduced precipitation and increased rainfall intensity, the number of hours with light rainfall intensity was less than 20.
The onset of the summer season is accompanied by an increase in atmospheric instability, leading to an elevated frequency of convective rainfall, particularly during the months of June and July. Conversely, August is marked by the predominance of dry periods, accompanied by a substantial decline in precipitation amounts. Consequently, June is observed to be the month in which the maximum number of hours with moderate precipitation (2.6 and 10 mm/h) is recorded (Figure 3b). Specifically, 6.7 h were recorded at Cârja and 10 h at Mădârjac, with the difference mainly attributed to the altitudinal difference. Heavy rains are relatively rare phenomena, usually occurring during intense convective processes. Heavy rains are uncommon for March–April and October–November, but are prevalent during the entire period from May to September. In these months, heavy rains occur, on average, for a duration of 0.5 h per year. As can be seen in the case of the analyzed area, precipitation with an intensity greater than 10 mm/h is specific to June at the two weather stations (Figure 3c).
In Romania, convective rains are most frequent during early summer, particularly in June and July, across the hilly and plain regions east of the Carpathians. These rains are driven by both advective and local processes. Although less frequent than in the others summer months, convective rains also occur in August, primarily in areas west of the Carpathians, where dry periods are more dominant and local convective processes play a key role [58]. The period from late May to early July is particularly critical for soil erosion in these regions, as highlighted by Ioniță and Ouatu [50]. The intense heating of the land surface during this time triggers strong convective updrafts, such as rapid uplift over topographic obstacles or fast ascents during frontal processes. When these processes occur within humid air masses, condensation rapidly leads to the development of torrential rains [59]. This combination of factors makes the early summer months a high-risk period for extreme rainfall and subsequent soil erosion in the region.
By far, May–July represents the period with the highest atmospheric instability over the region, as indicated by the maximum frequency of hail recorded in this period [22].

3.3. Synoptic Analysis of Days with Heavy Rainfalls

Overall, it is widely known that the most prone synoptic conditions favorable to the occurrence of heavy rainfall are associated with the development of well-organized convective systems as a direct consequence of increased atmospheric instability. The atmospheric instability leading to heavy precipitation could be specific for the contact between different types of air masses, represented by various types of frontal systems, or manifests within a single unstable air mass. In such conditions, daytime radiative heating of the surface can augment the tropospheric lapse rate, thereby generating robust updrafts, particularly when the middle and upper layers of the troposphere are cold and dominated by upper-level troughs or cut-off low systems [25,60].
The general image of the heavy rainfall events was built based on the days recording at least one hourly interval of precipitation amount exceeding 5 mm. In this way, based on the two weather stations, between 2013 and 2019, we summed up a total number of 63 independent days.
The composite maps of these days highlight, at sea level, a synoptic pattern that can be considered typical for days with increased atmospheric instability, especially in north-eastern part of Romania [22].
Firstly, the composite maps indicate a ridge structure extending over the European continent from the Azores region to northeastern Europe, while a low-pressure area prevails in the south-eastern part of the continent, imposing an easterly atmospheric circulation in the Black Sea region, including the region of Romania (Figure 4a). These sea-level conditions are also associated with an upper level structure characterized by a long-wave upper trough that can sustain cold air at this level, imposing atmospheric instability on lower levels (Figure 4b).
This general overview of the synoptic conditions conducive to heavy rainfall in the study region was facilitated by self-organizing maps (SOMs) of all 63 days selected for analysis. The application of this method has enabled the identification of three major weather patterns types that favor intense rainfalls.
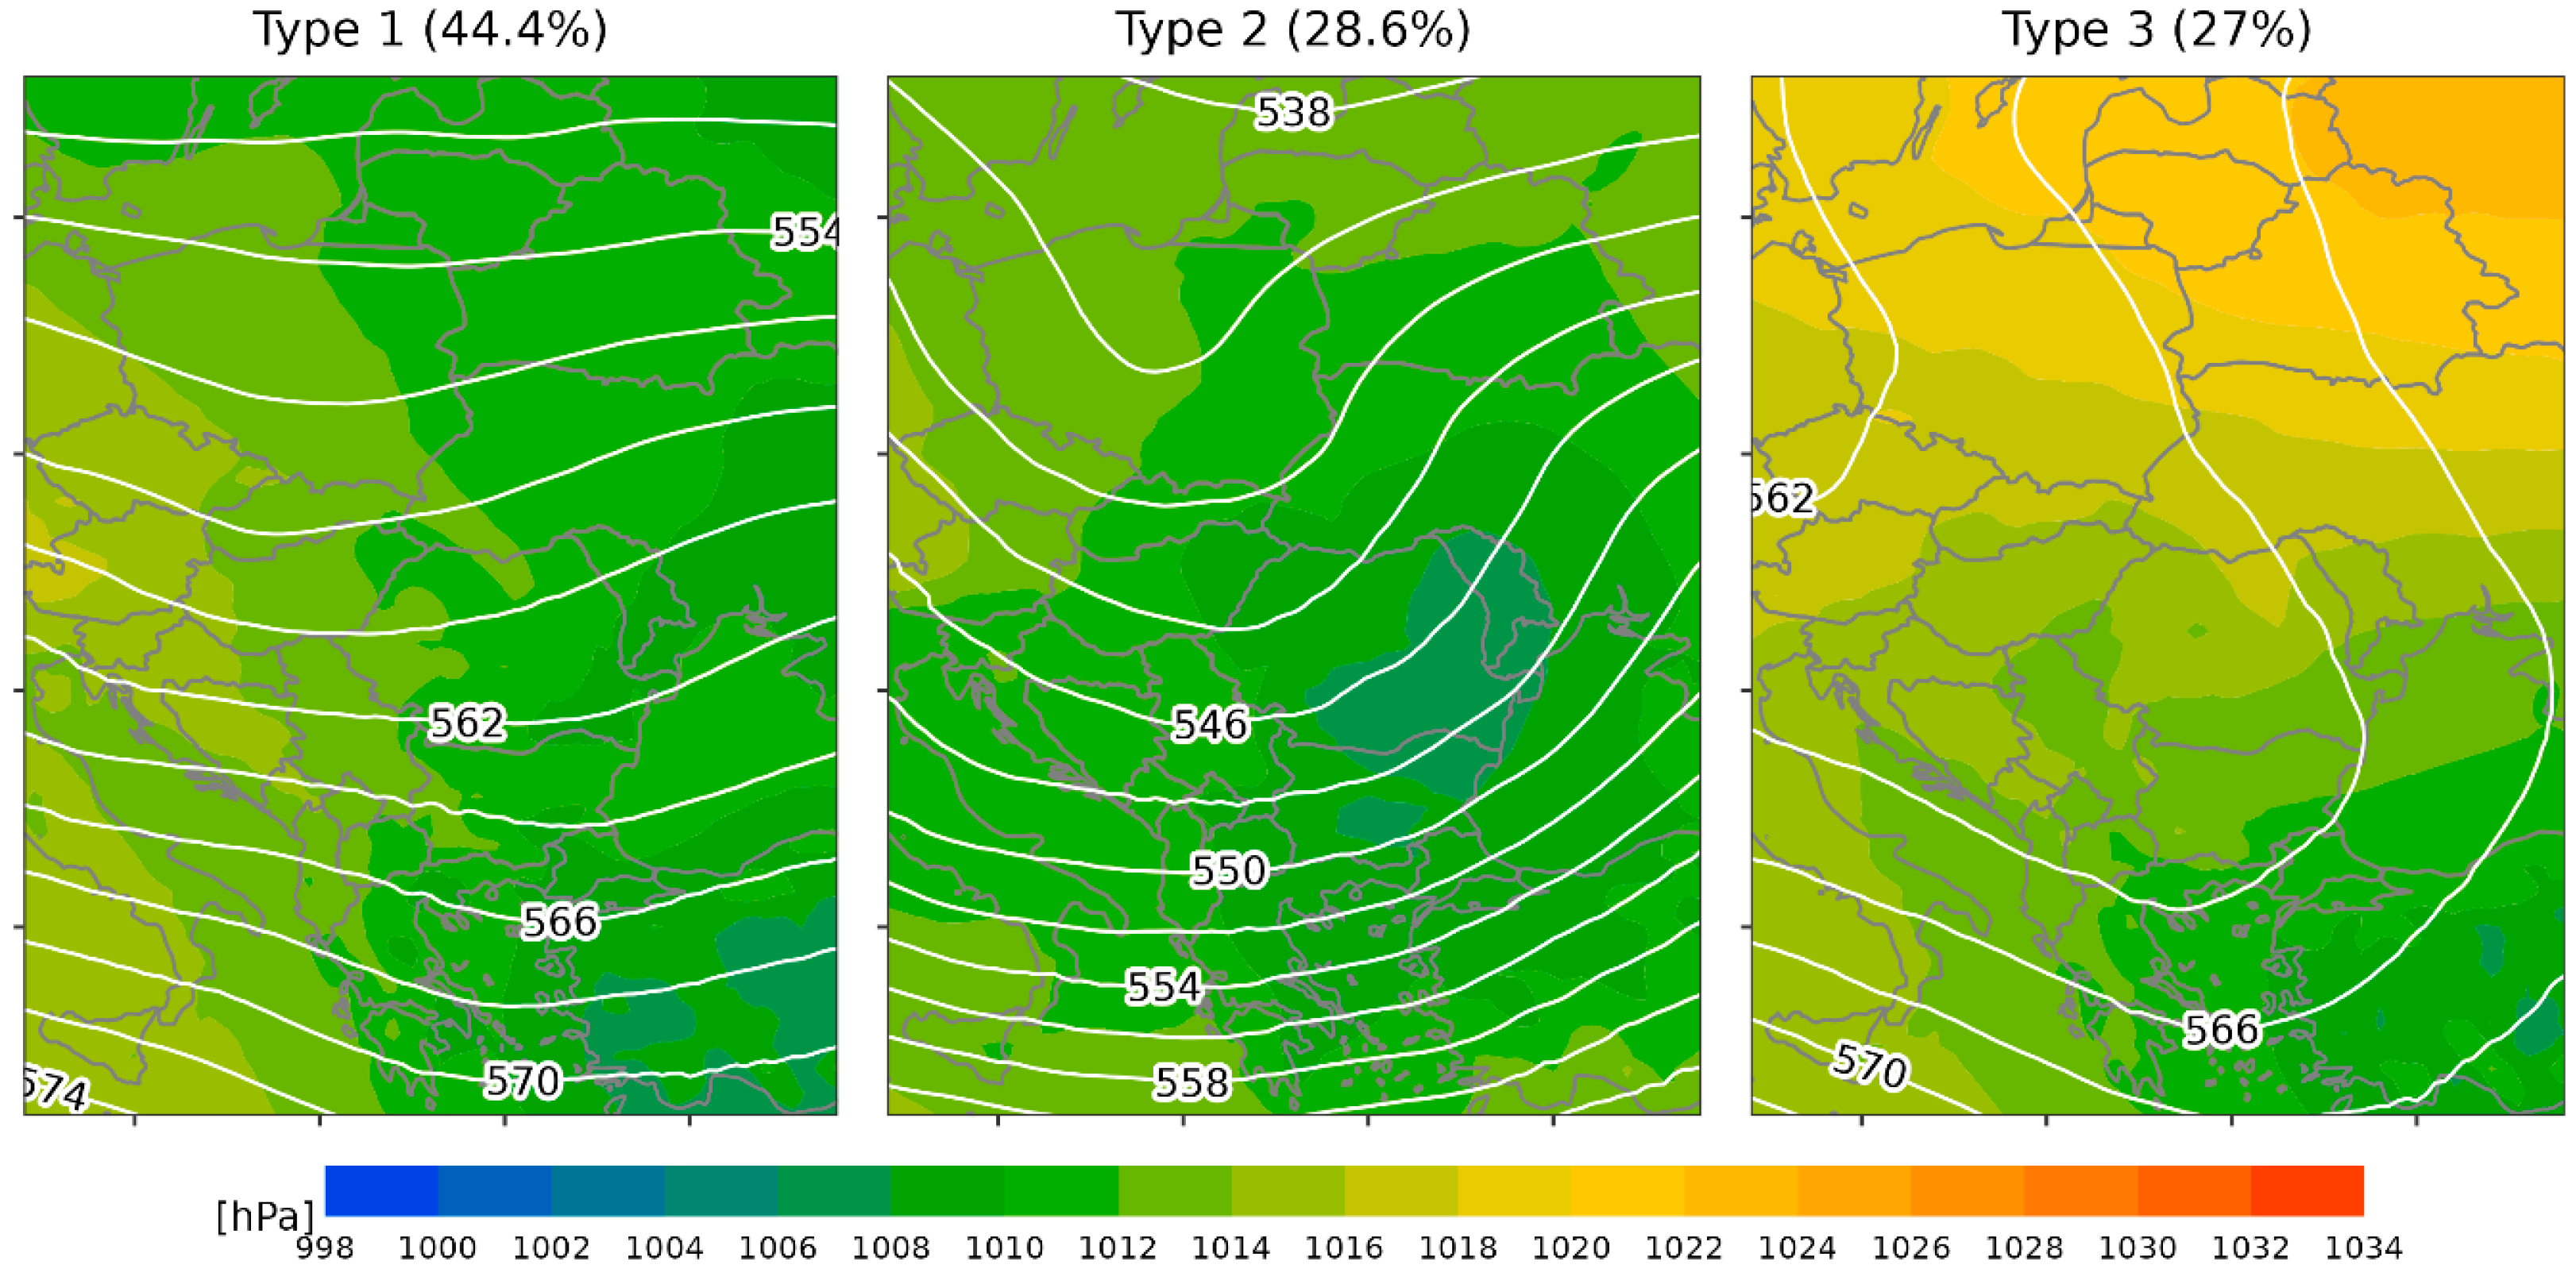
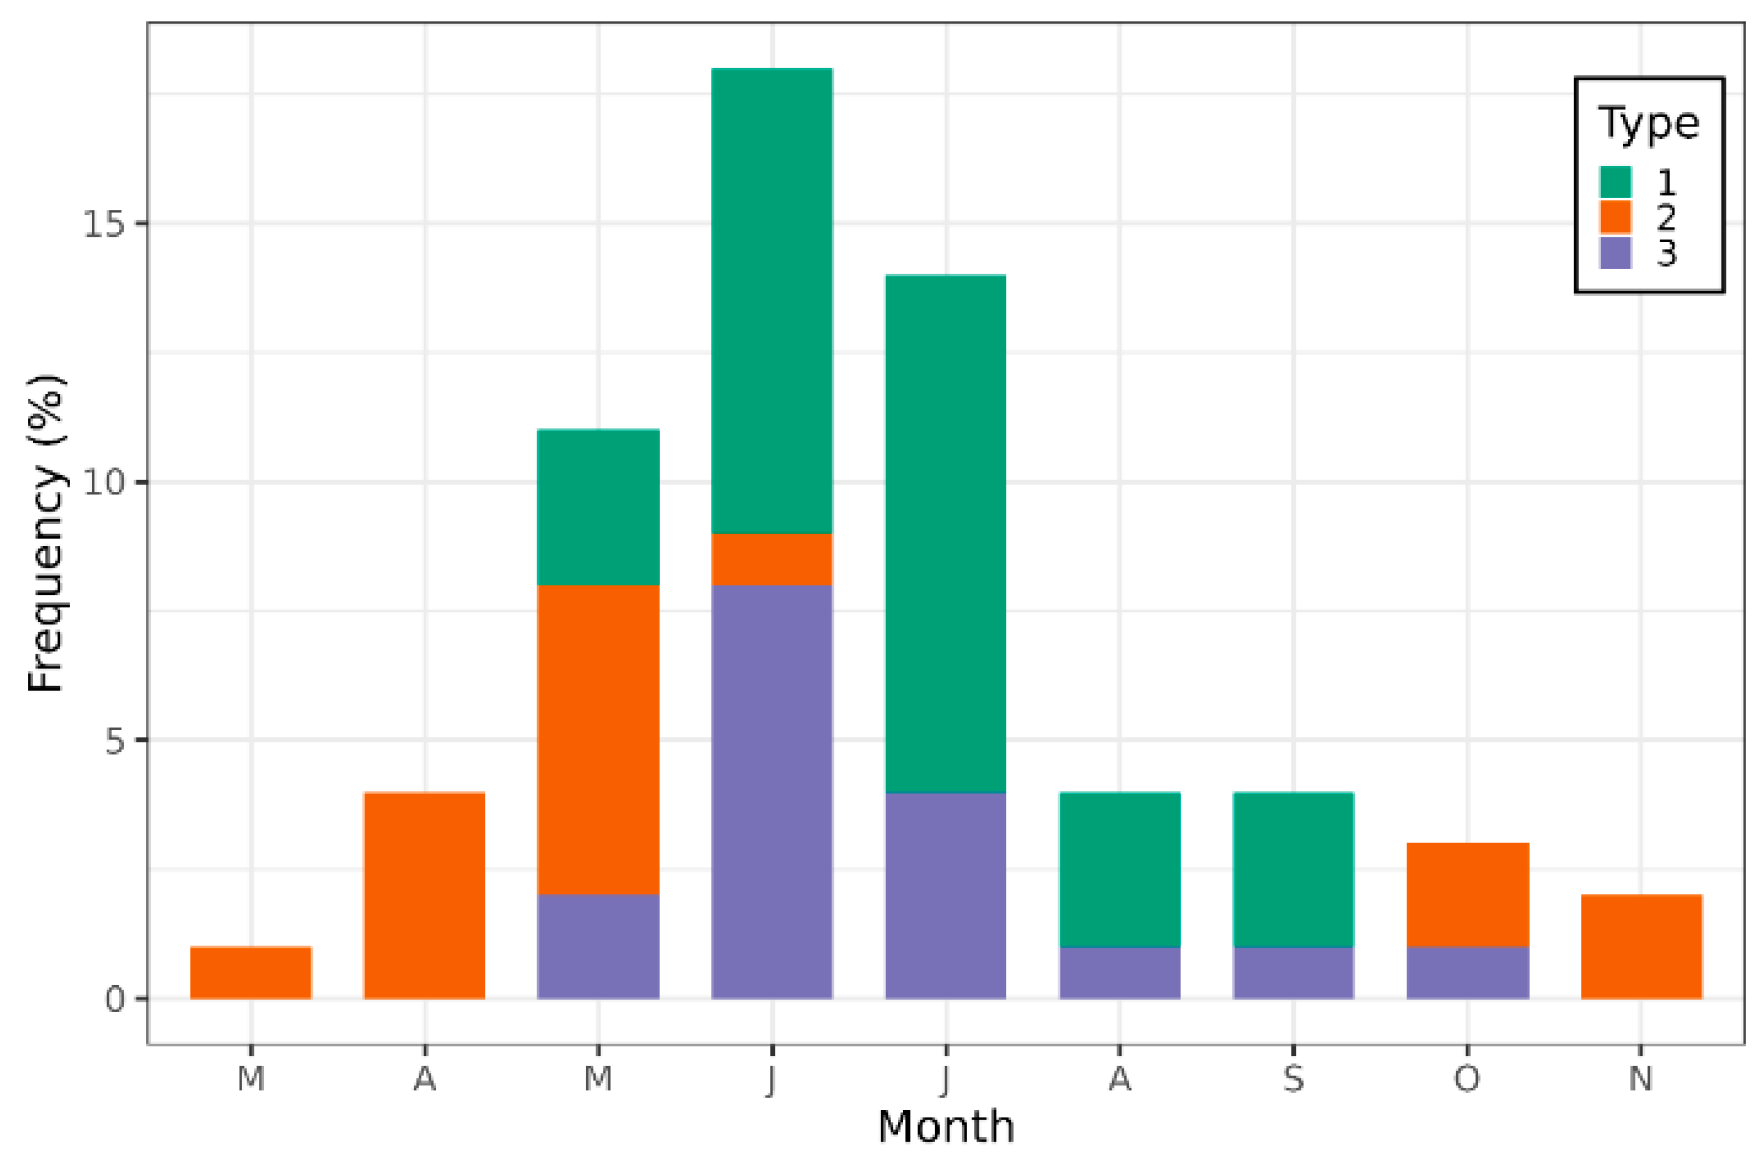
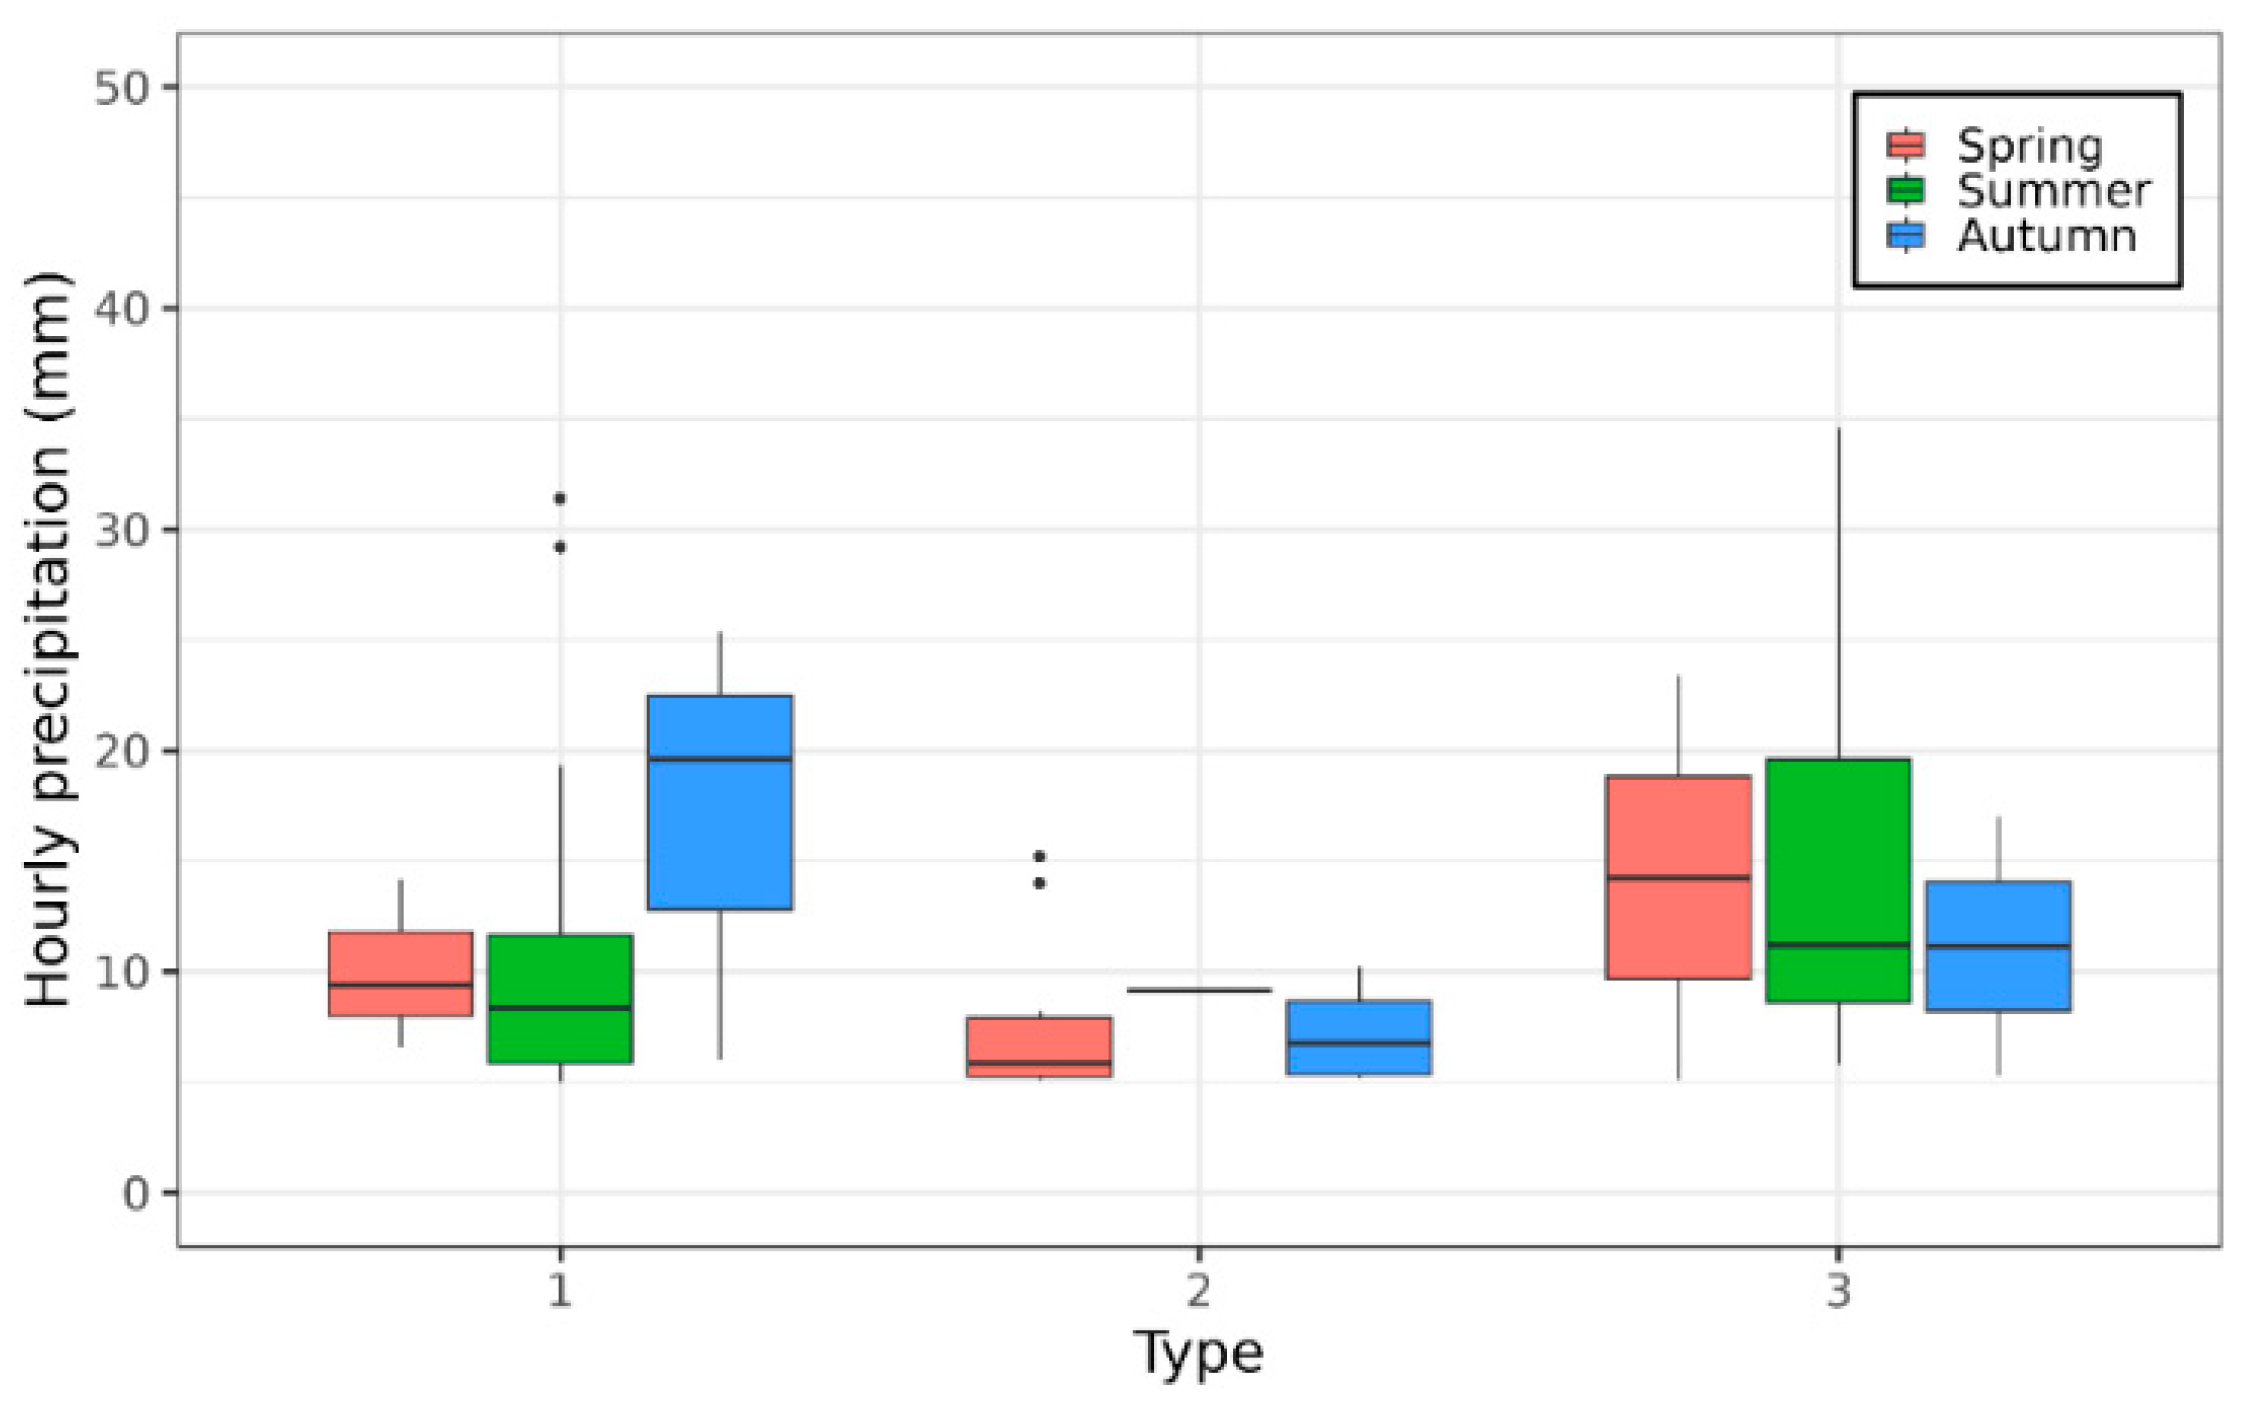
The prevalent weather pattern associated with heavy rainfall (Type 1, accounting for 44.4% of heavy rainfall days) is defined by a strong zonal westerly flow in the upper atmosphere, combined with a relatively weak pressure gradient and mild cyclonic conditions at the surface (Figure 5). This pattern is most characteristic of the warm season, particularly between May and September, with peak occurrence in June and July, when it serves as the primary synoptic driver of heavy rainfall events. During September, this weather pattern is responsible for the highest hourly precipitation totals of approximately 20 mm, driven by infrequent but exceptionally intense rainfall events that are typical of this month (Figure 6).
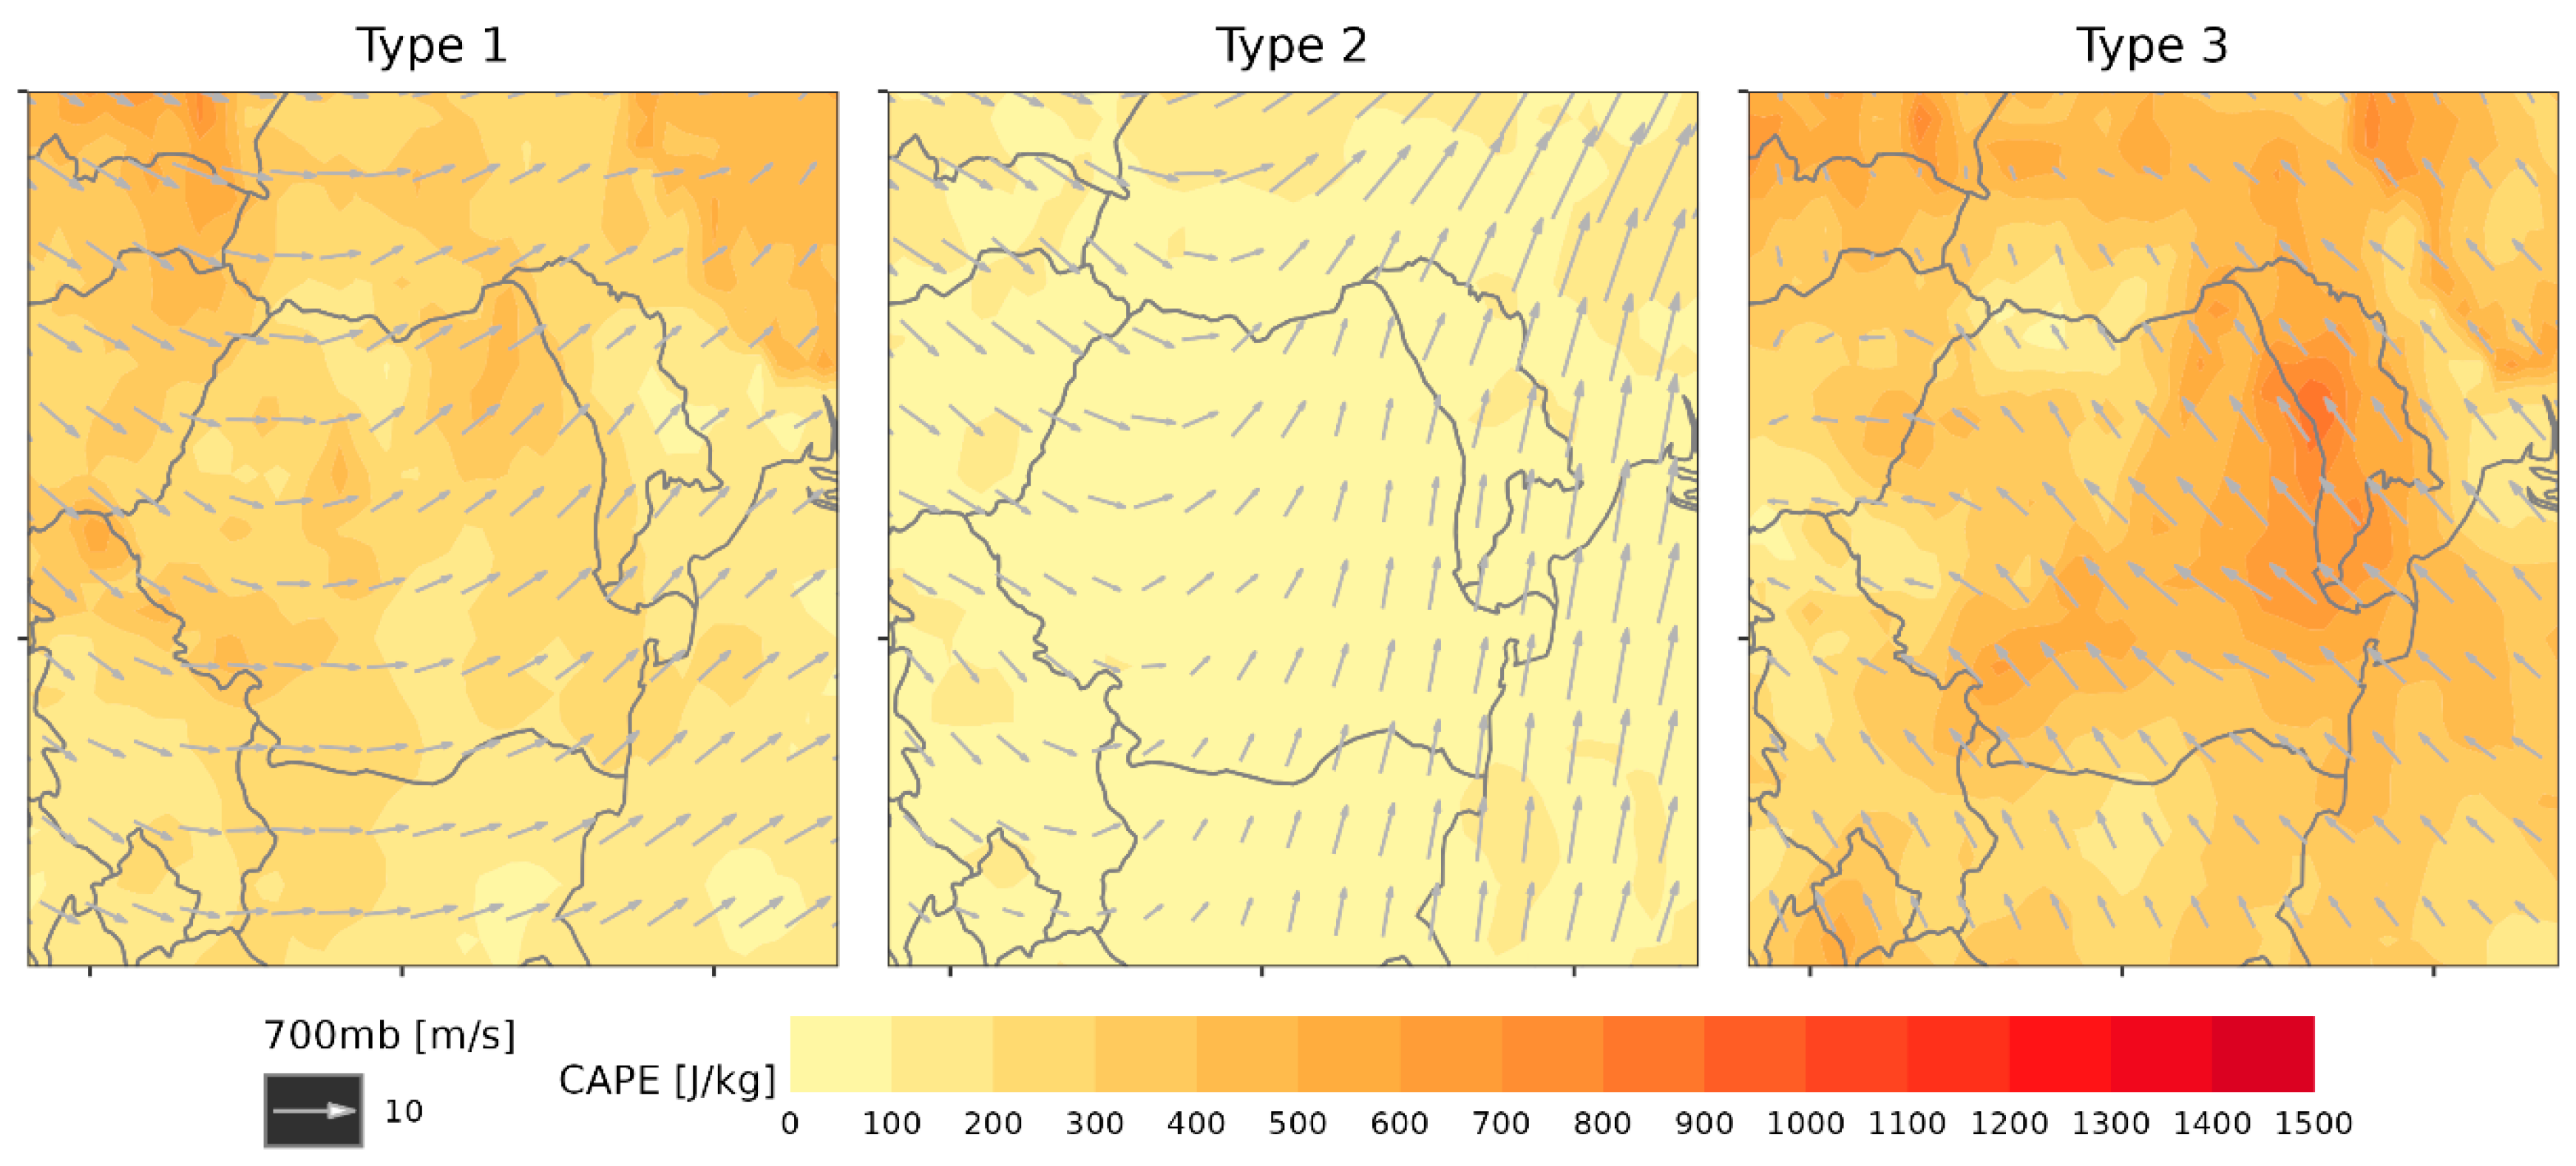
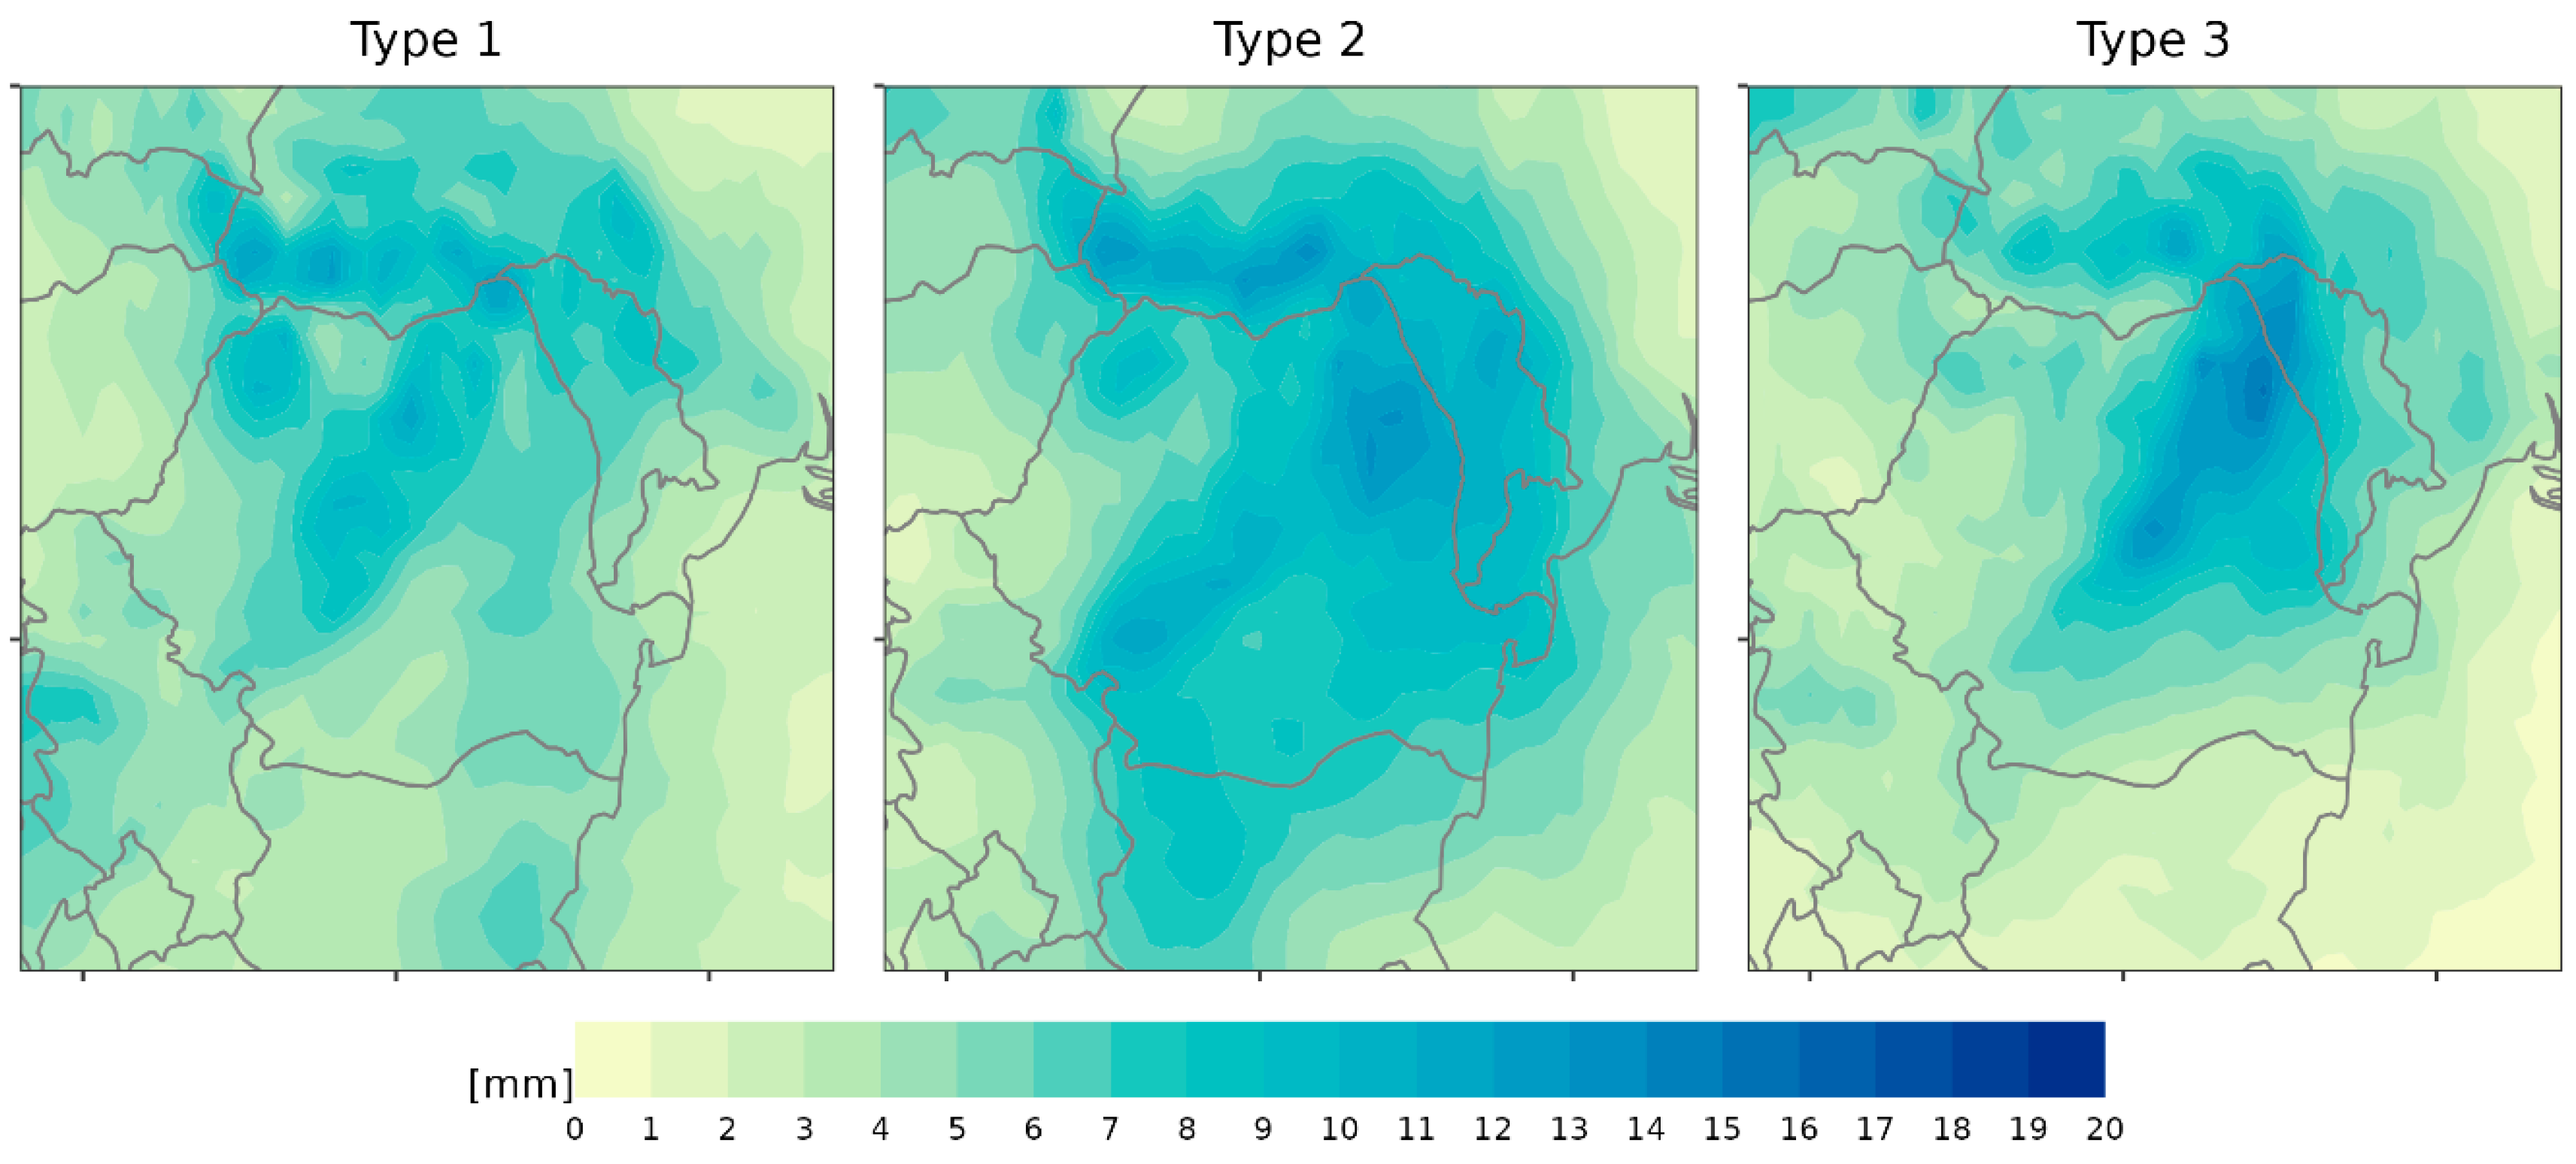
Atmospheric conditions under Type 1 are marked by moderate CAPE values, indicating high instability capable to support convective activity. The 700 hPa wind vector, oriented from the south-west, leads to the same direction of storm cell movement (Figure 7). This is likely to increase the likelihood of intense soil erosion on west-facing slopes. The daily mean precipitation for Type 1 events averages around 10 mm (Figure 8), with a clear spatial gradient showing higher amounts in the northern parts of northeastern Romania compared to the south.
While the total precipitation amounts are not the highest among the three major weather patterns, the frequency and distribution of Type 1 events make it a critical factor in shaping the region’s erosion dynamics. Additionally, the timing of these events during the warm season, when agricultural activities are at their peak, further amplifies their impact on soil stability and land management.
The second most significant weather pattern (Type 2), accounting for 28.6% of heavy rainfall days, is characterized by the influence of Mediterranean cyclones that cross the Balkan Peninsula and propagate into the Black Sea region. This synoptic pattern is marked by a long-wave trough extending meridionally (north–south) across Romania in the mid-troposphere, while surface-level cyclonic conditions dominate the study area. This pattern is particularly active during the transitional seasons of spring and autumn, although the precipitation intensity per event is the lowest among the three major weather types identified (Figure 8).
The rainfall associated with this pattern is predominantly a frontal one, as evidenced by the consistently low CAPE values (Figure 7). Frontal precipitation bands are driven by a prevailing southerly wind flow, which transports moist air masses into the region. Daily precipitation records reveal a distinct maximum in north-eastern Romania (Figure 9), underscoring the importance of this weather pattern in causing consistent precipitation amounts fueled by humidity originating not only from the Mediterranean but also from the Black Sea region [61].
While the individual rainfall events under this pattern are generally moderate in intensity, their prolonged duration—often spanning a couple of days—can lead to significant soil erosion. This is particularly true in north-eastern Romania, where the combination of sustained rainfall and low vegetation cover during early spring exacerbates erosion risks. The lack of dense vegetation during this period reduces soil cohesion and increases susceptibility to erosion, as the protective effect of plant roots and canopy cover is minimal. Furthermore, the gradual saturation of soils over extended rainfall events enhances surface runoff, amplifying the erosive impact. This is proved by the fact that during two successive rainfalls events totaling 47 mm and 51 mm, respectively, occurred on 10–11 June 1980 and 22–24 July 1980, respectively, other studies reported a triple value of runoff and soil losses compared to individual rainfall of similar intensity [2].
The third major weather pattern associated with heavy rainfall (Type 3, accounting for 27% of events) is characterized by a persistent anticyclonic blocking system over north-eastern Europe. This blocking pattern establishes a dominant easterly flow over north-eastern Romania, which is frequently enriched with atmospheric moisture sourced from the northern Black Sea. In the mid- to upper troposphere, a long-wave trough channels cold air masses into the region, creating conditions of heightened atmospheric instability. This is reflected in the elevated CAPE values, particularly over the study area (Figure 7). The composite maps of this upper-level trough reveal the presence of cut-off low-pressure systems, which are typical under anticyclonic blocking conditions. These cut-off lows, when displaced toward lower latitudes, significantly enhance atmospheric instability and play a critical role in driving heavy rainfall events across Romania, particularly between April and September [25]. At the 700 hPa level, the south-easterly wind vector underscores the influx of moisture from the Black Sea, further fueling the convective processes.
This synoptic configuration is most frequently associated with heavy rainfall during May to July, with a peak in June, making it the primary contributor to annual precipitation during this period. The hourly mean precipitation under this pattern exceeds 10 mm (Figure 8), with summer values reaching the highest recorded levels of up to 35 mm during the study period. Consequently, this weather pattern delivers the highest regional precipitation totals among the three major synoptic types, with the maximum rainfall concentrated in the central-northern part of the study region, particularly near the Mădârjac weather station (Figure 9).
Heavy precipitation under Type 3 conditions is typically driven by convergence lines that propagate from the south-east to the north-west, often organizing into multi-cell storm systems. Given this predominant storm trajectory, east-facing slopes are supposed to be most exposed to high-intensity rainfall and are therefore at greater risk of soil erosion. However, during the summer months, this erosive potential is mitigated by the dense natural and agricultural vegetation cover, which stabilizes the soil and reduces runoff. Despite this buffering effect, the combination of intense rainfall and steep terrain in certain areas can still lead to localized erosion, particularly in regions where vegetation cover is less dense or where land use practices exacerbate vulnerability.

4. Conclusions

In this study, the spatial and temporal patterns of rainfall erosivity over northeastern Romania have been outlined using the ERA-5 Land dataset and hourly precipitation data. The Fournier Index revealed a distinct regional gradient, with rainfall erosivity decreasing from north to south and from mountainous areas to lowlands. However, as previously indicated in the literature, the annual amount of the eroded soil across the region is more uniformly distributed, largely due to the heightened pedo-lithological susceptibility in the central-southern part of the study area.
By examining hourly precipitation data from the Cârja and Mădârjac weather stations, we identified that the highest rainfall intensity occurs in June, while elevated erosivity extends from May to July. Although the analysis is based on a relatively short time series, it successfully captures the dominant synoptic conditions driving heavy precipitation events. During the summer months, high atmospheric instability prevails, fueled by either west-to-east moving storm cells or easterly blocking circulations. In contrast, spring and autumn are characterized by moderate rainfall erosivity, primarily driven by frontal precipitation associated with Mediterranean cyclones. This analysis should be detailed in further studies with hourly or even sub-hourly data from more weather stations over the region and with longer data series that could enforce the soundness of the scientific approach from a long-term climatic perspective.
These findings underscore the complex interplay between synoptic weather patterns, rainfall intensity, and soil erosion dynamics in northeastern Romania. The study highlights the need for region-specific soil conservation strategies, particularly in areas with high pedo-lithological susceptibility, to mitigate the impacts of erosive rainfall events. Future research should focus on extending the temporal scope of the analysis and incorporating additional factors, such as land use changes and climate variability, to further refine our understanding of soil erosion processes in the region.

Author Contributions

Conceptualization, L.S.; formal analysis, R.H. and M.M.; methodology, R.H., L.S., P.I. and L.N.; supervision, L.S., I.-G.B. and L.N.; validation, L.S., P.I., I.-G.B. and L.N.; visualization, R.H.; writing—original draft, R.H. and M.M.; writing—review and editing, L.S., P.I., I.-G.B. and L.N. All authors have read and agreed to the published version of the manuscript.

Funding

This research was funded by the Geoscience Doctoral School of the Department of Geography from Faculty of Geography and Geology, Alexandru Ioan Cuza University of Iasi, Romania.

Institutional Review Board Statement

Not applicable.

Informed Consent Statement

Not applicable.

Data Availability Statement

The raw data supporting the conclusions of this article will be made available by the authors on request.

Acknowledgments

This study received technical support from the Department of Geography from Faculty of Geography and Geology, Alexandru Ioan Cuza University of Iasi, Romania, which offered us full access to the remote sensing and GIS laboratories. Acknowledgment is also given to the infrastructure support from the Operational Program Competitiveness 2014–2020, Axis 1, under POC/448/1/1 research infrastructure projects for public R&D institutions/Sections F 2018, through the Research Center with Integrated Techniques for Atmospheric Aerosol Investigation in Romania (RECENT AIR) project, under grant agreement MySMIS no. 127324.

Conflicts of Interest

The authors declare no conflicts of interest.

Abbreviations

The following abbreviations are used in this manuscript:
CAPEConvective Available Potential Energy
SLPSea Level Pressure
SOMSelf-Organizing Maps

References

  1. Borrelli, P.; Robinson, D.A.; Panagos, P.; Lugato, E.; Yang, J.E.; Alewell, C.; Wuepper, D.; Montanarella, L.; Ballabio, C. Land Use and Climate Change Impacts on Global Soil Erosion by Water (2015–2070). Proc. Natl. Acad. Sci. USA 2020, 117, 21994–22001. [Google Scholar] [CrossRef] [PubMed]
  2. Ioniță, I. Procese de degradare a regiunilor deluroase. In Geomorfologie Aplicată; Editura Universității “Alexandru Ioan Cuza”: Iași, Romania, 2000. [Google Scholar]
  3. Panagos, P.; Borrelli, P.; Poesen, J.; Ballabio, C.; Lugato, E.; Meusburger, K.; Montanarella, L.; Alewell, C. The New Assessment of Soil Loss by Water Erosion in Europe. Environ. Sci. Policy 2015, 54, 438–447. [Google Scholar] [CrossRef]
  4. Panagos, P.; Borrelli, P.; Matthews, F.; Liakos, L.; Bezak, N.; Diodato, N.; Ballabio, C. Global Rainfall Erosivity Projections for 2050 and 2070. J. Hydrol. (Amst.) 2022, 610, 127865. [Google Scholar] [CrossRef]
  5. Li, R.; Gao, J.; He, M.; Jing, J.; Xiong, L.; Chen, M.; Zhao, L. Effect of Rock Exposure on Runoff and Sediment on Karst Slopes under Erosive Rainfall Conditions. J. Hydrol. Reg. Stud. 2023, 50, 101525. [Google Scholar] [CrossRef]
  6. Niacsu, L.; Sfica, L.; Ursu, A.; Ichim, P.; Bobric, D.E.; Breaban, I.G. Wind Erosion on Arable Lands, Associated with Extreme Blizzard Conditions within the Hilly Area of Eastern Romania. Environ. Res. 2019, 169, 86–101. [Google Scholar] [CrossRef]
  7. Alzahrani, A.J.; Alghamdi, A.G.; Ibrahim, H.M. Assessment of Soil Loss Due to Wind Erosion and Dust Deposition: Implications for Sustainable Management in Arid Regions. Appl. Sci. 2024, 14, 10822. [Google Scholar] [CrossRef]
  8. Ionita, I. Gully Development in the Moldavian Plateau of Romania. Catena 2006, 68, 133–140. [Google Scholar] [CrossRef]
  9. Costea, M. Using the Fournier Indexes in estimating rainfall erosivity. Case study—The Secașul Mare Basin. Aerul Apa. Compon. Ale Mediu. 2012, 2012, 313–320. [Google Scholar]
  10. Vanmaercke, M.; Panagos, P.; Vanwalleghem, T.; Hayas, A.; Foerster, S.; Borrelli, P.; Rossi, M.; Torri, D.; Casali, J.; Borselli, L.; et al. Measuring, Modelling and Managing Gully Erosion at Large Scales: A State of the Art. Earth Sci. Rev. 2021, 218, 103637. [Google Scholar] [CrossRef]
  11. Wischmeier, W.; Smith, D.D. Predicting Rainfall Erosion Losses: A Guide to Conservation Planning; Agricultural Handbook nr. 537; United State Departement of Agriculture (USDA): Washington, DC, USA, 1978. [Google Scholar]
  12. Stângă, I. Rainfall aggressiveness in the eastern part of Romania. In Analele Științifice ale Universității “Al. I. Cuza” Iași; Universității “Alexandru Ioan Cuza”: Iași, Romania, 2011; Volume LVII, s. II-C, Geografie. [Google Scholar]
  13. Mega, M.; Damian, A.-D. Climate Seasonality and Its Relevance for Soil Erosion during Summer in Extra-Carpathian Moldova. Present Environ. Sustain. Dev. 2020, 14, 193–205. [Google Scholar] [CrossRef]
  14. Lal, R.; Ahmadi, M.; Bajracharya, R.M. Erosional Impacts on Soil Properties and Corn Yield on Alfisols in Central Ohio. Land Degrad. Dev. 2000, 11, 575–585. [Google Scholar] [CrossRef]
  15. Wang, C.; Huang, C.; Zhang, S.; Zhang, L.; Li, T.; Peng, J.; Zhang, L. Research Progress on Nitrogen and Phosphorus Loss in Small Watersheds: A Regional Review. Water 2023, 15, 2894. [Google Scholar] [CrossRef]
  16. Pimentel, D. Soil Erosion: A Food and Environmental Threat. Environ. Dev. Sustain. 2006, 8, 119–137. [Google Scholar] [CrossRef]
  17. Calvin, K.; Dasgupta, D.; Krinner, G.; Mukherji, A.; Thorne, P.W.; Trisos, C.; Romero, J.; Aldunce, P.; Barret, K.; Blanco, G.; et al. IPCC, 2023: Climate Change 2023: Synthesis Report, Summary for Policymakers. In Contribution of Working Groups I, II and III to the Sixth Assessment Report of the Intergovernmental Panel on Climate Change; Core Writing Team, Lee, H., Romero, J., Eds.; IPCC: Geneva, Switzerland, 2023; pp. 1–34. [Google Scholar]
  18. Borrelli, P.; Alewell, C.; Yang, J.E.; Bezak, N.; Chen, Y.; Fenta, A.A.; Fendrich, A.N.; Gupta, S.; Matthews, F.; Modugno, S.; et al. Towards a Better Understanding of Pathways of Multiple Co-Occurring Erosion Processes on Global Cropland. Int. Soil Water Conserv. Res. 2023, 11, 713–725. [Google Scholar] [CrossRef]
  19. Dragotă, C.S. Precipitațiile Excedentare în România; Editura Academiei Române: Bucharest, Romania, 2006. [Google Scholar]
  20. Busuioc, A.; Caian, M.; Cheval, S.; Bojariu, R.; Boroneanț, C.; Baciu, M.; Dumitrescu, A. Variability and Climate Change in Romania; Editura PRO Universitaria București: Bucharest, Romania, 2010. [Google Scholar]
  21. Ioniță, I.; Chelaru, P.; Niacșu, L.; Butelcă, D.; Andrei, A. Landslide distribution and their recent development within the Central Moldavian Plateau of Romania. Carpathian J. Earth Environ. Sci. 2014, 9, 241–252. [Google Scholar]
  22. Sfîcă, L.; Istrate, V.; Hrițac, R.; Machidon, O. The Continental and Regional Synoptic Background Favorable for Hailstorms Occurrence in North-Eastern Romania. Prog. Phys. Geogr. 2023, 47, 3–31. [Google Scholar] [CrossRef]
  23. Ionita, I.; Niacsu, L.; Petrovici, G.; Blebea-Apostu, A.M. Gully development in eastern Romania: A case study from Falciu Hills. Nat. Hazards 2015, 79, 113–138. [Google Scholar] [CrossRef]
  24. Sandu, I.; Pescaru, V.-I.; Poiană, I. Climate of Romania; Romanian Academy Publishing House: Bucharest, Romania, 2008; 365p. (In Romanian) [Google Scholar]
  25. Dobri, R.-V.; Sfîcă, L.; Ichim, P.; Harpa, G.-V. The Distribution of the Monthly 24-Hour Maximum Amount of Precipitation in Romania According to Their Synoptic Causes. Geogr. Tech. 2017, 12, 62–72. [Google Scholar] [CrossRef]
  26. Moțoc, M.; Ioniță, I.; Nistor, D. Erosion and climatic risk at the wheat and maize crops in the Moldavian Plateau. Rom. J. Hydrol. Water Resour. 1998, 5, 1–38. [Google Scholar]
  27. Ioniță, I.; Rădoane, M.; Mircea, S. 1.13 Romania. In Soil Erosion in Europe; Boardman, J., Poesen, J., Eds.; John Wiley: Chichester, UK, 2006; pp. 155–166. [Google Scholar]
  28. Niacsu, L.; Bucur, D.; Ionita, I.; Codru, I.-C. Soil Conservation Measures on Degraded Land in the Hilly Region of Eastern Romania: A Case Study from Puriceni-Bahnari Catchment. Water 2022, 14, 525. [Google Scholar] [CrossRef]
  29. Patriche, C.V. Applying RUSLE for Soil Erosion Estimation in Romania under Current and Future Climate Scenarios. Geoderma Reg. 2023, 34, e00687. [Google Scholar] [CrossRef]
  30. Prăvălie, R.; Patriche, C.; Săvulescu, I.; Sîrodoev, I.; Bandoc, G.; Sfîcă, L. Spatial Assessment of Land Sensitivity to Degradation across Romania. A Quantitative Approach Based on the Modified MEDALUS Methodology. Catena 2020, 187, 104407. [Google Scholar] [CrossRef]
  31. Niacșu, L.; Ioniță, I.; Curea, D. Optimum agricultural land use in the hilly area of Eastern Romania. Case study: Pereschiv catchment. Carpathian J. Earth Environ. Sci. 2015, 10, 183–192. [Google Scholar]
  32. Copernicus Climate Change Service (C3S). ERA5: Fifth Generation of ECMWF Atmospheric Reanalyses of the Global Climate; Copernicus Climate Change Service Climate Data Store (CDS): Brussels, Belgium, 2020; Volume 15. [Google Scholar]
  33. Copernicus Climate Change Service (C3S). Downscaled Bioclimatic Indicators for Selected Regions from 1979 to 2018 Derived from Reanalysis; Climate Data Store (CDS): Brussels, Belgium, 2021. [Google Scholar] [CrossRef]
  34. Schulzweida, U. CDO User Guide 2023. Available online: https://zenodo.org/records/10020800 (accessed on 12 October 2024).
  35. R Core Team. R: A Language and Environment for Statistical Computing; R Foundation for Statistical Computing: Vienna, Austria, 2024; Available online: https://www.R-project.org/ (accessed on 1 January 2025).
  36. Mankin, K.R.; Mehan, S.; Green, T.R.; Barnard, D.M. Review of Gridded Climate Products and Their Use in Hydrological Analyses Reveals Overlaps, Gaps, and the Need for a More Objective Approach to Selecting Model Forcing Datasets. Hydrol. Earth Syst. Sci. 2025, 29, 85–108. [Google Scholar] [CrossRef]
  37. Sfîcă, L.; Ichim, P.; Apostol, L.; Machidon, O. Three Years of Observations on Global Solar Radiation at Mădârjac Weather Station (270 m)—Central Moldavian Plateau. Present Environ. Sustain. Dev. 2017, 11, 109–117. [Google Scholar] [CrossRef]
  38. Sfîcă, L.; Ichim, P.; Ion, C.; Baltag, Ș.-E.; Ignat, A. Filling the Gap of Meteorological Data along the Prut River Valley, Romania—Cârja Experimental Weather Station. Aerul Apa Compon. Ale Mediu. 2021, 169–180. [Google Scholar] [CrossRef]
  39. Dumitraşcu, M.; Dragotă, C.-S.; Grigorescu, I.; Dumitraşcu, C.; Vlăduţ, A. Key Pluvial Parameters in Assessing Rainfall Erosivity in the South-West Development Region, Romania. J. Earth Syst. Sci. 2017, 126, 60. [Google Scholar] [CrossRef]
  40. Rusănescu, M.; Durbaca, I.; Stoian, E.V. The Indexes in Estimating Rainfall Erosivity—Case Study Bucharest. In Proceedings of the International Symposium “The Environment and the Industry”, Bucharest, Romania, 20–21 September 2018. [Google Scholar]
  41. Nedealcov, M. Agresivitatea Pluvială și Periculozitatea Exceselor Pluviometrice în Posibilitatea Declanșării Proceselor erozionale. Starea actuală a componentelor de mediu. 2019, 142–150. Available online: https://www.researchgate.net/publication/353904909_Agresivitatea_pluviala_si_periculozitatea_exceselor_pluviometrice_in_posibilitatea_declansarii_proceselor_erozionale (accessed on 1 January 2025).
  42. Fournier, F. Climat et Érosion: Relation Entre L’érosion du sol par L’eau et les Précipitations Atmosphériques. Ph.D. Thesis, et Sciences Humaines de L’Université de Paris, Paris, France, 1960. [Google Scholar]
  43. Arnoldus, H.M.J. An Approximation of the Rainfall Factor in the Universal Soil Loss Equation; John Wiley and Sons: New York, NY, USA, 1980; pp. 127–132. [Google Scholar]
  44. Vesanto, J.; Alhoniemi, E. Clustering of the Self-Organizing Map. IEEE Trans. Neural Netw. 2000, 11, 586–600. [Google Scholar] [CrossRef]
  45. Ponmalai, R.; Kamath, C. Self-Organizing Maps and Their Applications to Data Analysis; Office of Scientific and Technical Information (OSTI): Oak Ridge, TN, USA, 2019. [Google Scholar]
  46. Liu, Y.; Weisberg, R.H. A Review of Self-Organizing Map Applications in Meteorology and Oceanography. In Self Organizing Maps—Applications and Novel Algorithm Design; InTech: London, UK, 2011; ISBN 9789533075464. [Google Scholar]
  47. Philipp, A.; Bartholy, J.; Beck, C.; Erpicum, M.; Esteban, P.; Fettweis, X.; Huth, R.; James, P.; Jourdain, S.; Kreienkamp, F.; et al. Cost733cat—A Database of Weather and Circulation Type Classifications. Phys. Chem. Earth. 2010, 35, 360–373. [Google Scholar] [CrossRef]
  48. Philipp, A.; Beck, C.; Huth, R.; Jacobeit, J. Development and Comparison of Circulation Type Classifications Using the COST 733 Dataset and Software: Development and comparison of circulation type classificatios. Int. J. Climatol. 2016, 36, 2673–2691. [Google Scholar] [CrossRef]
  49. Philippopoulos, K.; Deligiorgi, D. A Self-Organizing Maps Multivariate Spatio-Temporal Approach for the Classification of Atmospheric Conditions. In Neural Information Processing; Springer: Berlin/Heidelberg, Germany, 2012; pp. 544–551. ISBN 9783642344770. [Google Scholar]
  50. Ioniță, I.; Ouatu, O. Sezonul critic de eroziune în Colinele Tutovei. In Analele Științifice ale Universității “Al. I. Cuza” Iași; Universității “Alexandru Ioan Cuza”: Iași, Romania, 1990; Volume XXXVI, s. IIC. [Google Scholar]
  51. Patriche, C.V. Quantitative assessment of rill and interrill soil erosion in Romania. Soil Use Manag. 2019, 35, 257–272. [Google Scholar] [CrossRef]
  52. Patriche, C.V.; Roșca, B.; Pîrnău, R.G.; Vasiliniuc, I.; Irimia, L.M. Simulation of Rainfall Erosivity Dynamics in Romania under Climate Change Scenarios. Sustainability 2023, 15, 1469. [Google Scholar] [CrossRef]
  53. Ionita, I.; Nistor, D. Soil Erosion Control in the Moldavian Plateau of Eastern Romania. In Proceedings of the International Symposium “Multidisciplinary Approaches to Soil Conservation Strategies”, Müncheberg, Germany, 11–13 May 2001; Book of Abstracts. p. 28. [Google Scholar]
  54. Tudose, T.; Croitoru, A.E.; Haidu, I. Some Aspects on Rainfall Maximuk Intensity in Northwestern Romania. In Proceedings of the International Multidisciplinary Scientific GeoConference: SGEM, Albena, Bulgaria, 16–22 June 2013; p. 771. [Google Scholar]
  55. Irașoc, A.; Ionac, N.; Dumitrescu, A.; Beteringhe, A. Extreme Rainfall Intensities at Sub-Hourly Temporal Scale in Dobrudja (Romania). Geogr. Tech. 2024, 19, 103–120. [Google Scholar] [CrossRef]
  56. Mihu-Pintilie, A.; Urzică, A.; Stoleriu, C.C.; Pricop, C.I. Integrating LiDAR-derived DEM, rainfall radar data, and SAR imagery for 2D HEC-RAS modelling to assess the severity of pluvial flash floods induced by Storm Boris in SE Romania. Geomat. Nat. Hazards Risk 2025, 16, 2488190. [Google Scholar] [CrossRef]
  57. Sreekanth, T.S.; Varikoden, H.; Sukumar, N.; Mohan Kumar, G. Microphysical Characteristics of Rainfall during Different Seasons over a Coastal Tropical Station Using Disdrometer. Hydrol. Process. 2017, 31, 2556–2565. [Google Scholar] [CrossRef]
  58. Dobri, R.-V.; Apostol, L.; Istrate, V. Characteristics of precipitations distribution induced by cut-off low cyclone activity in Romania during the warm semester. Air Pollut. Clim. Change 2019, 19, 907–913. [Google Scholar]
  59. Apostol, L. Precipitațiile Atmosferice în Subcarpații Moldovei; Editura Universității din Suceava: Bucharest, Romania, 2000. [Google Scholar]
  60. Tudose, T.; Haidu, I. Some aspects of the relationship between synoptic-scale wind and convective cells’motion generating heavy rains in the north-western Romania. Aerul Apa. Compon. Ale Mediu. 2012, 1, 276–281. [Google Scholar]
  61. Ionițe, I.; Sfîcă, L. The Black Sea as Contributor to the Precipitation Amount on Moldova Region. In Proceedings of the 2nd Intenational Scientific Conference Geobalcanica, Skopje, Macedonia, 10–12 June 2016; pp. 51–58. [Google Scholar] [CrossRef]
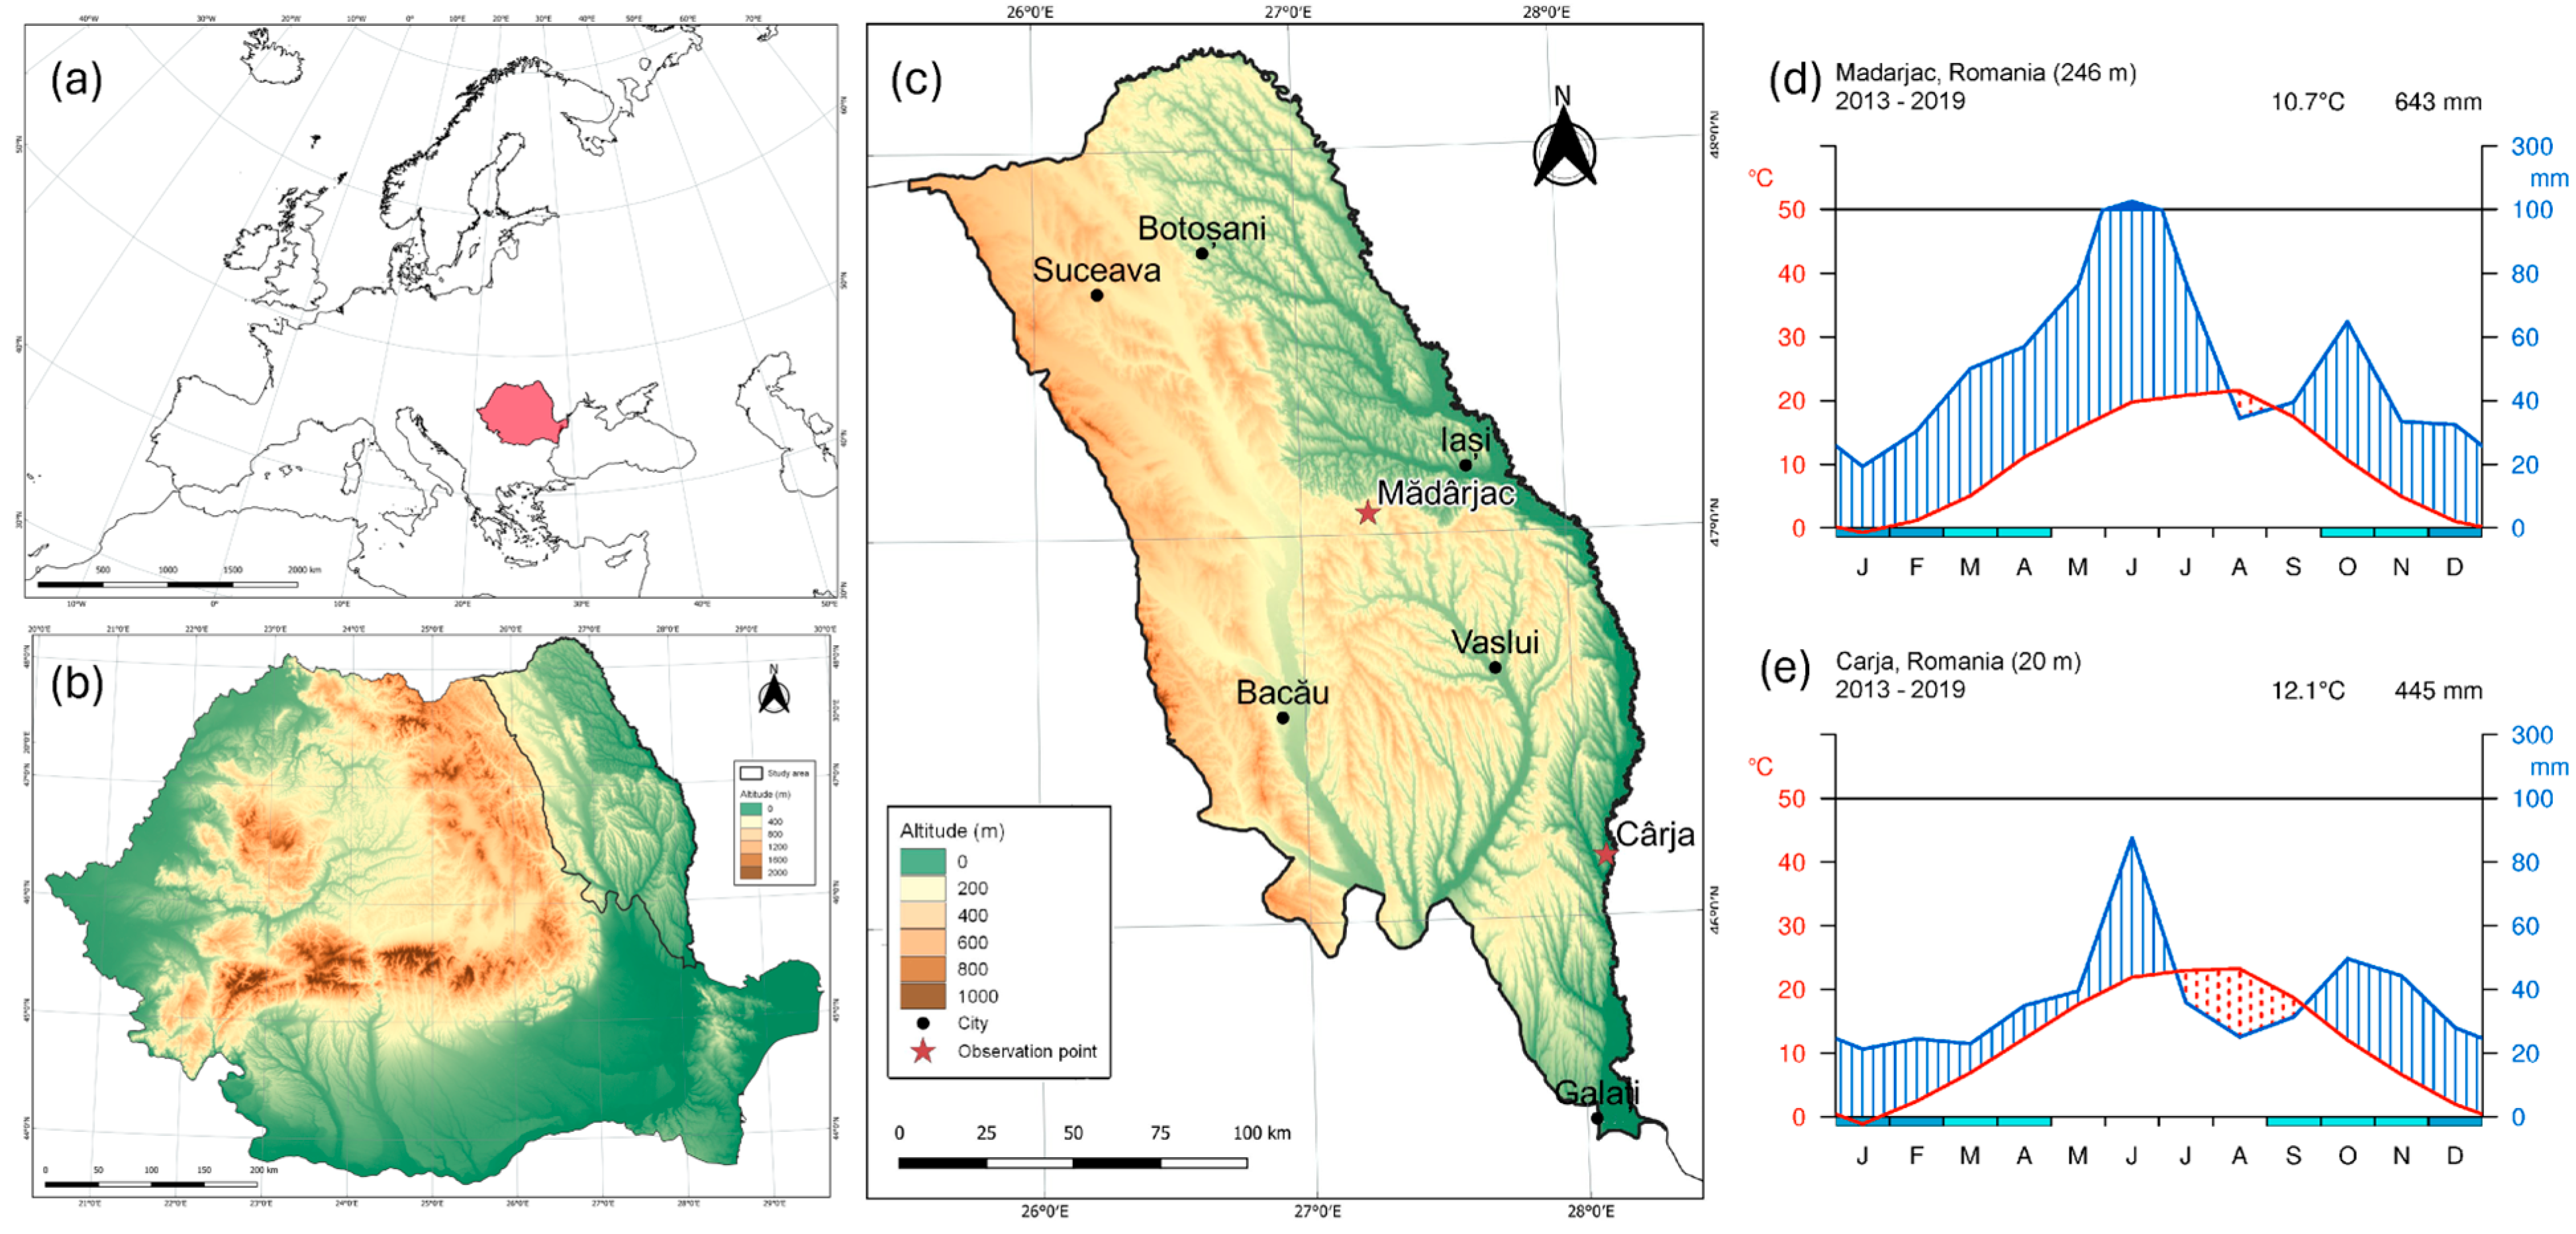
Figure 1. Geographical location of the study area at continental (a) and country (b) scales, hypsometric characteristics (c), and Walter–Lieth climograms for Mădârjac (d) and Cârja (e) weather stations.
Applsci 15 06785 g001
Figure 2. The spatial distribution of Fournier Index Erodibility classes (a) and Modified Fournier Index Erodibility classes (b) in northeastern Romania for 1979–2018.
Applsci 15 06785 g002
Figure 3. Monthly evolution of the average number of hours with light (a), moderate (b), and heavy (c) intensity of precipitation (2013–2019) in northeastern Romania.
Applsci 15 06785 g003
Figure 4. Composite maps of sea-level pressure (a) and 500 hPa geopotential height (b) at continental scale for days with heavy precipitation (2013–2019) in the central part of the Moldavian Plateau.
Applsci 15 06785 g004
Figure 5. Self-organizing maps (SOM) based on sea level pressure (hpa) and 500 hPa geopotential height (white lines) describing the main synoptic patterns associated with the days with heavy intensity precipitation (2013–2019) in the Moldavian Plateau.
Applsci 15 06785 g005
Figure 6. The share (%) of the three SOM synoptic patterns in the monthly heavy precipitation occurrence in the Moldavian Plateau between March and November (2013–2019).
Applsci 15 06785 g006
Figure 7. Composite CAPE maps and mean vector wind for the three types of synoptic patterns (SOMs) associated with heavy precipitation in (2013–2019) in the Moldavian Plateau.
Applsci 15 06785 g007
Figure 8. Seasonal hourly precipitation amount (mm) for the three SOM synoptic patterns associated with the occurrence of heavy precipitation in the Moldavian Plateau (2013–2019).
Applsci 15 06785 g008
Figure 9. Composite precipitation amount (mm) for the three types of synoptic patterns (SOMs) associated with the occurrence of heavy precipitation in (2013–2019) in the Moldavian Plateau.
Applsci 15 06785 g009
Table 1. Erosion classes based on Fournier Index values [42].
Erosion ClassFournier IndexSoil Loss (t/ha/year)
Very Low0–200–5
Low20–405–12
Moderate40–6012–50
Severe60–8050–100
Very severe80–100100–200
Extremely severe>100>200
Table 2. Erosion classes based on Modified Fournier Index values [43].
Erosion ClassFournier Index
Very Low0–60
Low60–90
Moderate90–120
High120–160
Very high>160
Table 3. Maximum monthly precipitation intensity (mm/min) derived from hourly data during 2013–2019 at the Cârja weather station (bold italic indicates the monthly maximum).
Month/Year2013201420152016201720182019Average
March0.070.030.020.030.060.020.010.03
April0.090.070.030.030.10-0.080.05
May0.250.110.020.090.080.080.160.11
June0.580.040.060.150.290.180.510.26
July0.210.030.030.040.320.170.250.15
August0.330.010.030.030.060.050.120.09
September0.42-0.020.020.340.040.100.16
October0.080.040.010.110.040.050.170.07
November0.040.03-0.140.05-0.030.05
Annual average0.230.050.030.070.150.070.160.11
Maximum/hour34.66.603.569.1020.410.730.416.5
Table 4. Maximum monthly precipitation intensity (mm/min) derived from hourly data during 2013–2019 at Mădârjac weather station (bold italic indicates the monthly maximum).
Month/Year2013201420152016201720182019Average
March0.060.140.070.04-0.130.030.08
April0.100.130.040.310.060.100.100.12
May0.260.390.050.090.100.080.200.17
June0.450.200.160.32-0.560.330.34
July0.140.420.020.170.170.200.090.17
August0.170.100.080.210.150.070.160.13
September0.080.070.110.130.370.070.310.16
October0.020.090.060.15-0.040.130.08
November0.090.05-0.070.030.010.010.04
Annual average0.230.180.070.160.150.140.150.14
Maximum/hour27.225.29.618.822.033.619.622.3
Disclaimer/Publisher’s Note: The statements, opinions and data contained in all publications are solely those of the individual author(s) and contributor(s) and not of MDPI and/or the editor(s). MDPI and/or the editor(s) disclaim responsibility for any injury to people or property resulting from any ideas, methods, instructions or products referred to in the content.