Abstract
The precise identification and non-destructive measurement of structural features and defects in semiconductor wafers are essential for ensuring process integrity and sustaining high yield in advanced manufacturing environments. Unlike conventional measurement techniques, scanning acoustic microscopy (SAM) is an advanced method that provides detailed visualizations of both surface and internal wafer structures. However, in practical industrial applications, the scanning time and image quality of SAM significantly impact its overall performance and utility. Prolonged scanning durations can lead to production bottlenecks, while suboptimal image quality can compromise the accuracy of defect detection. To address these challenges, this study proposes LinearTGAN, an improved generative adversarial network (GAN)-based model specifically designed to improve the resolution of linear acoustic wafer images acquired by the breakthrough rotary scanning acoustic microscopy (R-SAM) system. Empirical evaluations demonstrate that the proposed model significantly outperforms conventional GAN-based approaches, achieving a Peak Signal-to-Noise Ratio (PSNR) of 29.479 dB, a Structural Similarity Index Measure (SSIM) of 0.874, a Learned Perceptual Image Patch Similarity (LPIPS) of 0.095, and a Fréchet Inception Distance (FID) of 0.445. To assess the measurement aspect of LinearTGAN, a lightweight defect segmentation module was integrated and tested on annotated wafer datasets. The super-resolved images produced by LinearTGAN significantly enhanced segmentation accuracy and improved the sensitivity of microcrack detection. Furthermore, the deployment of LinearTGAN within the R-SAM system yielded a 92% improvement in scanning performance for 12-inch wafers while simultaneously enhancing image fidelity. The integration of super-resolution techniques into R-SAM significantly advances the precision, robustness, and efficiency of non-destructive measurements, highlighting their potential to have a transformative impact in semiconductor metrology and quality assurance.
1. Introduction
Semiconductor wafers have experienced significant advances in recent years, becoming a cornerstone of the electronics industry and enabling the large-scale production of high-performance and cost-effective electronic components [1]. As electronic devices continue to shrink in size, the detection and measurement of defects and anomalies at the wafer level are crucial to ensuring product quality. Automated inspection systems often employ advanced imaging techniques such as optical and electron microscopy [2]. Optical microscopy is constrained by its resolution and inability to image subsurface structures, making it less suitable for the detection of nanoscale defects in wafers. While electron microscopy provides higher resolution, it requires complex sample preparation, offers a limited field of view, and can be destructive to delicate materials. To overcome these limitations, scanning acoustic microscopy (SAM) has emerged as a promising alternative, offering non-invasive and high-resolution (HR) imaging of both surface and subsurface features [3].
Obtaining HR images typically requires a considerable increase in scanning time due to the need for smaller step sizes during the scanning process. For instance, using a traditional scanning system such as the TSAM-400 (Ohlab, Busan, Republic of Korea), scanning a 12-inch wafer (300 mm × 300 mm) with a step size of 50 micrometers (µm) takes approximately 2727 seconds (s) [4]. However, increasing the step size to 100 µm can reduce the scanning time to around 1363 s [4]. While this adjustment significantly improves scanning efficiency, it also leads to a noticeable decline in image quality, as larger step sizes result in lower spatial resolution and reduced detail in the captured images. This trade-off between image resolution and scanning time presents a considerable challenge in industrial semiconductor applications, where both high throughput and detailed defect detection are crucial for maintaining production quality and yield. Therefore, achieving an optimal balance between resolution and scanning speed requires innovative approaches to system performance enhancement.
Enhancing the performance of the SAM system is essential to reduce scanning time without compromising image quality. Hiep PV et al. introduced the FSAM system, which integrates four 100 MHz ultrasonic transducers to significantly shorten the scanning time of a 12-inch wafer to approximately 200 s [4]. Although the FSAM system achieves a notable reduction in scanning time compared to the TSAM-400, it remains expensive due to the need for multiple transducers. Kim D et al. proposed a new scanning module based on a single slider crank and ball-screw mechanism, designed to enable fast movement and low-cost development [5]. However, this design is limited in performance, as it cannot achieve a frame rate of 20 fps and is only suitable for small samples. Notably, most mechanical modifications are based on the conventional SAM system, which relies on a linear motor as the primary scanning mechanism. Therefore, transitioning from a linear motor to a rotary motor is a crucial step in developing an advanced rotary scanning acoustic microscopy (R-SAM) system that enhances both scanning speed and overall efficiency.
In addition, ensuring the quality of scanned images is equally important for the effective application of SAM systems in industrial settings. Traditional signal processing techniques used to enhance image quality often encounter limitations in preserving fine details, particularly when scanning large samples at high speeds. Deep learning approaches, particularly generative adversarial networks (GANs) [6], have emerged as powerful tools for improving image quality in non-destructive testing (NDT) and imaging systems like SAM. The adversarial training paradigm inherent to GANs enables the learning of complex mappings from low-resolution (LR) to HR representations, thereby facilitating the generation of super-resolved outputs that closely approximate ground-truth HR data. In this study, we propose LinearTGAN, a GAN-based transformer model designed to enhance the resolution of linear images acquired from our R-SAM system. This architecture was selected for its synergistic integration of the generative fidelity of GANs with the global context modeling capabilities of transformer blocks, enabling effective reconstruction of both localized textures and long-range spatial dependencies. To improve convergence and generalization with limited training data, transfer learning was employed by initializing the encoder with pretrained weights, leveraging transferable low-level features. Furthermore, a dynamic loss function was introduced to adaptively balance pixel-wise, perceptual, and adversarial components, ensuring a stable trade-off between structural accuracy and perceptual quality across diverse imaging scenarios. Unlike traditional methods that rely solely on image filtering or interpolation, LinearTGAN is specifically adapted to the statistical and structural characteristics of SAM imaging data. The network was trained using a composite dataset comprising authentic LR scan acquisitions alongside synthetically degraded HR samples, allowing it to concurrently learn the noise distributions and degradation artifacts inherent to practical R-SAM imaging, as well as the high-frequency content present in clean HR scans. By training the model with this hybrid dataset, LinearTGAN effectively learned both the noise characteristics present in real-world data and the fine structural details captured in HR images.
The main contributions of this research are summarized as follows:
- We prepared a self-built dataset of linear acoustic images captured from our R-SAM system for 12-inch wafers. The limitation of the small dataset was addressed by utilizing a combination of real LR images obtained from the scanning process and synthetic images generated from HR scans using a degradation model.
- LinearTGAN is an optimized GAN-based model incorporating a generator with eight residual Swin Transformer blocks and a U-Net discriminator. This architecture enhances image reconstruction and resolution, improving the precision of defect measurement in acoustic wafer imaging.
- A comprehensive evaluation demonstrates that images enhanced by LinearTGAN lead to substantial improvements in defect segmentation accuracy across all key performance metrics, validating its effectiveness in advancing the precision of non-destructive defect detection and segmentation.
- The integration of our R-SAM system with the LinearTGAN model results in a 92% enhancement in scanning performance for a 12-inch wafer compared to a conventional SAM system, reducing the total scan duration to approximately 206 s while maintaining HR image quality.
2. Background and Related Work
Traditional SAM system: Conventional SAM systems employing linear motors for rapid scanning have been widely used in wafer material quality assessment studies. Qu J et al. demonstrated the application of high-frequency SAM for identifying subsurface damage, residual stress, and coating thickness in wafers and other materials [7]. Sun AY et al. employed SAM for the comprehensive evaluation of silicon wafers, including thickness and chamfer measurements, surface and subsurface analysis, and the detection and characterization of internal defects [8]. Additionally, Ramanathan S et al. utilized SAM and silicon wafer samples to assess resolution limits across different transducers, providing valuable insights into the capabilities of SAM for HR imaging [9]. However, these experimental studies primarily utilized SAM as an inspection tool for wafer evaluation without implementing any mechanical modifications to the system to reduce scanning time or enhance the overall performance of the SAM system.
R-SAM system: Our new R-SAM system retains the core components of the traditional SAM system, including a scanning stage, ultrasound transducer, pulser/receiver, digitizer, and PC [10]. However, it introduces a significant enhancement by replacing the linear motor with a rotary motor to improve system performance (see details in Supplementary Movie S1). This design modification enables smoother and more consistent motion during the scanning process, particularly for large-area samples, addressing the limitations of linear motor-based systems in terms of scanning speed and mechanical precision. The current iteration of the R-SAM system represents a tailored solution specifically designed for the inspection of 12-inch wafer samples, demonstrating a significant advancement in NDT for semiconductor applications. The integration of a rotary motor enhances the scalability and throughput of the system, making it highly efficient and suitable for large-scale industrial wafer inspections.
Linear acoustic images in the R-SAM system: Figure 1 shows a linear scanned image. To support the new rotational movement, we developed specialized software designed to integrate seamlessly with the R-SAM system, ensuring efficient data acquisition and processing. This software synchronizes the rotary motor with the data collection process, allowing for precise control of the scanning trajectory and maintaining consistent image resolution across the entire scanning area. The raw scan data is initially acquired in a linear format, which is subsequently transformed into a polar coordinate representation for further processing and visualization (as presented in Figure 1). In this study, we chose to apply the LinearTGAN model to the linear scan data rather than the polar coordinate representation, as the linear format retains the original, unprocessed data, ensuring data integrity and minimizing the risk of information loss during the transformation process. This approach ensures that the deep learning model operates on the most accurate and complete form of the input data, enhancing the reliability of the reconstructed HR images while preserving key structural details essential for accurate wafer inspections.
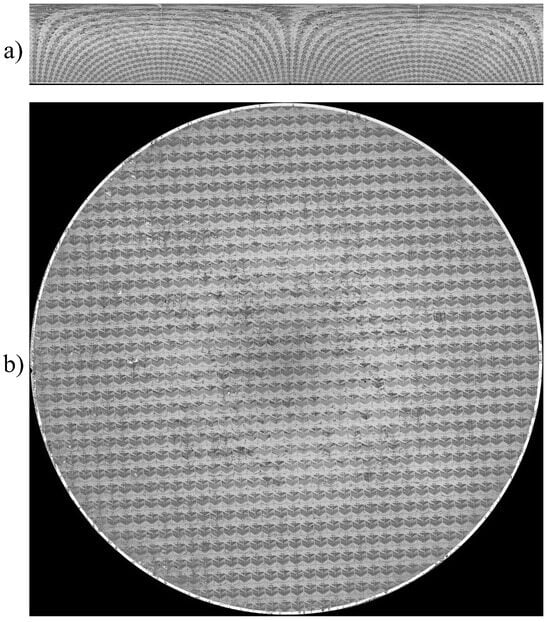
Figure 1.
(a) The original linear scanned image; (b) the processed image in polar coordinates.
Acoustic image SR and measurement: Traditional methodologies, such as the inversion model [11], synthetic aperture focusing technique (SAFT) [12], and nonlinear coupling methods [13], have significantly improved the resolution of SAM imaging, enabling more detailed and precise analyses. However, these techniques face several limitations. For instance, inversion models are computationally complex and sensitive to noise, affecting image quality with large datasets. SAFT, despite enhancing resolution through virtual aperture synthesis, is resource-intensive and prone to artifacts with non-uniform samples. Nonlinear coupling methods can surpass the diffraction limit but require sophisticated setups, high-power ultrasound sources, and precise calibration, making their implementation challenging in practical industrial settings. These conventional methods often face difficulties in balancing resolution enhancement and processing efficiency, posing constraints for high-throughput inspections where rapid and reliable imaging is essential.
Recently, deep learning-based techniques have emerged as highly promising alternatives, showcasing significant potential for advancement [14,15,16]. Banerjee P et al. introduced a deep learning-based method to achieve HR imaging of 17 distinct coin types using acoustic microscopy [17]. Sharma A et al. introduced HDL-SAM, a hybrid deep learning framework that integrates SwinIR and U-Net architectures to enhance the resolution of acoustic images [18]. This approach effectively improves the signal-to-noise ratio, accommodates variations in scanning step size, and optimizes transducer frequency, enabling HR imaging. Makra Á et al. conducted a comparative analysis of two conventional deconvolution-based techniques and a deep learning-based method for resolution enhancement of SAM images [19]. The study demonstrated that, despite utilizing a relatively limited training dataset, the deep learning approach substantially surpassed the performance of the classical deconvolution methods.
Deep learning-based approaches for acoustic image SR have increasingly used GAN techniques, enabling convolutional neural networks (CNNs) to effectively extract feature representations from intricate data distributions [20]. A GAN architecture comprises two components: a generator network and a discriminator network. The generator network is designed to map random input vectors to a defined image space, while the discriminator is tasked with distinguishing between authentic images and those generated by the model. Somani A et al. integrated GANs with hypergraph-based techniques to achieve significant improvements in SAM image resolution and quality [21]. Banerjee P et al. proposed a methodology involving the training of multiple GAN architectures to perform acoustic image inpainting, effectively filling missing regions in the original images and generating a 4× super-resolved output [22]. To address the challenge of limited datasets, Sha Y et al. introduced a GAN framework enhanced with a residual attention module, designed to enhance the quality and detail of SAM images for flip-chip samples, resulting in an enriched dataset with improved image quality and quantity [23].
In this study, we leveraged the advantages of the GAN architecture to develop an enhanced model, LinearTGAN, specifically designed for linear acoustic imaging in wafer inspection applications. A comprehensive evaluation of our LinearTGAN was performed using four distinct metrics, and its performance was compared to multiple state-of-the-art (SOTA) SR models. This comprehensive analysis provides an objective assessment and effectively demonstrates the efficacy of our model in acoustic SR imaging tasks for wafer inspection in industrial applications.
3. Methodology
3.1. Overview of LinearTGAN
Figure 2 illustrates the architecture of LinearTGAN, comprising three key components: the degradation, the generator, and the discriminator model. The degradation process generates synthetic LR images from HR-scanned images to simulate input conditions. The generator model reconstructs SR images from LR inputs by learning a mapping function through feature extraction and reconstruction. Finally, the discriminator evaluates the SR-generated images, distinguishing between real HR images and those produced by the generator, thereby facilitating adversarial learning to enhance image quality and realism. The subsequent sections provide a detailed analysis of these components.
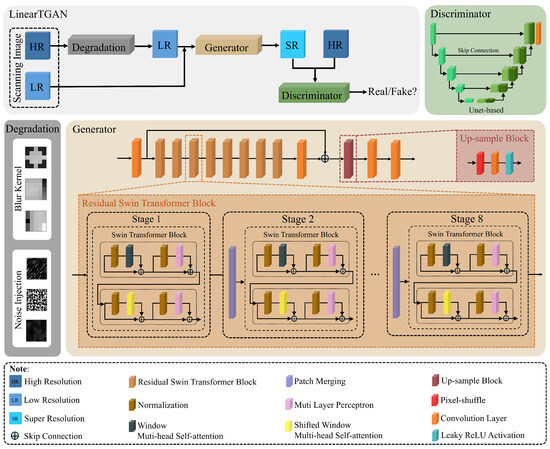
Figure 2.
Schematic representation of the LinearTGAN architecture.
3.2. Degradation Network
We synthesize LR images using the high-order degradation model implemented in Real-ESRGAN [24]. In the high-order degradation model, downsampling is typically a fundamental operation for generating LR images. However, with our specific data type and pre-processing steps, the input image size is already reduced to 256 × 256 before the degradation process. As a result, the resizing step is omitted in this stage. Consequently, our degradation process focuses solely on applying blur effects and introducing noise. The detailed configurations for this procedure are described below.
Blur: Blur degradation is formulated as a convolution process utilizing a blur kernel, with isotropic and anisotropic Gaussian filters commonly employed as standard approaches [25]. The selection between these filter types is determined probabilistically by comparing a randomly generated value against a predefined threshold at time t. Here, if the value exceeds 0.5, an isotropic Gaussian blur is applied; otherwise, an anisotropic Gaussian blur is utilized [26]. In this study, the blur kernel size is randomly selected from the set of , while the isotropic and anisotropic Gaussian filters are characterized by values drawn from the range of . To preserve spatial consistency, reflection padding is employed, ensuring that the dimensions of the blurred output remain unchanged.
Noise: Gaussian noise and Poisson noise [27], two commonly applied noise types, were incorporated with probabilities of and , respectively. Subsequently, the noisy images underwent JPEG compression, with the quality factor selected within the range of .
3.3. Generator Network
Our LinearTGAN model was customized by enhancing the SwinIR framework with the integration of eight Residual Swin Transformer Blocks (RSTBs) [28], as illustrated in Figure 2. These RSTBs are specifically designed to improve feature extraction and representation by leveraging the shifted-window multi-head self-attention (MSA) mechanism [29], which replaces the conventional MSA in traditional transformer blocks. Each block features a shifted-window MSA module, facilitating localized self-attention within non-overlapping windows while introducing cross-window interactions to expand the receptive field. This is followed by two multi-layer perceptrons (MLPs) [30], introducing non-linearity and enhancing the capacity for representation learning. Layer normalization is applied before both the MSA and MLP modules to normalize feature distributions and ensure stable training. Additionally, residual skip connections are integrated after each module, establishing shortcut pathways that facilitate gradient propagation during backpropagation. This connection architecture effectively mitigates the problem of the disappearance of the gradient, enhancing both the stability of the training and the efficiency of convergence. By retaining essential input information through identity mappings while simultaneously learning residual functions, the skip connections facilitate seamless feature integration across multiple levels of abstraction. These eight Swin Transformer blocks iteratively refine input features through window-based self-attention mechanisms and shifted-window partitioning, allowing for efficient multi-scale feature extraction essential for high-quality image upscaling. Through progressive feature refinement and attention-driven learning, these blocks play a pivotal role in the LinearTGAN architecture, enabling the generation of photo-realistic HR outputs with enhanced perceptual quality.
3.4. Discriminator Network
In the GAN architecture, the generator and discriminator network operate as two distinct yet intrinsically interconnected components that work collaboratively to facilitate adversarial learning. The generator model is designed to generate data that closely aligns with the distribution of the training dataset to ensure a high degree of realism, while the discriminator evaluates the authenticity of the input data by determining whether it is produced by the model or directly obtained from the training dataset. In this paper, to improve the effectiveness of the discriminator model in the SR task, a U-Net-based architecture is employed [31]. This design supports multi-scale feature extraction, enabling the discriminator to capture both fine-grained local details and broader global structural patterns within images. These architectural enhancements increase the overall performance of the discriminator and provide valuable feedback to the generator, strengthening the adversarial process and promoting the production of high-quality, perceptually convincing images [32]. The combination of the transformer generator and the U-Net discriminator establishes a robust framework that pushes the boundaries of image quality and realism in LinearTGAN.
4. Experimental Design
4.1. Research Questions
In this study, we evaluate the effectiveness of our approach by addressing the following three research questions (RQs):
RQ1: How effective is LinearTGAN in enhancing linear acoustic image quality?
RQ2: How efficient is LinearTGAN in improving wafer measurement and inspection performance?
RQ3: How feasible is the system-level implementation of LinearTGAN in practical applications?
4.2. Datasets
Ten 12-inch wafer samples were meticulously prepared to ensure optimal conditions for scanning and data acquisition. Imaging data were collected using the USI RSAM 300 system developed by Ohlabs Corp, Busan, Korea, which is designed for high-speed acoustic imaging [10]. The resulting dataset comprises two distinct image types: an HR dataset captured with a scanning step size of 50 µm and an LR dataset acquired with a step size of 100 µm. The time required to complete the HR scan, ensuring superior image quality, is 727 s, whereas the scanning process for LR images is significantly faster, taking approximately 206 s. A detailed description of the scanning procedure using the R-SAM system is provided in Supplementary Movie S1. The original scanned acoustic images have a spatial resolution of 19,200 × 3000 pixels in width and height. All linear images were subsequently divided into non-overlapping patches of 256 × 256 pixels, ensuring efficient processing and model training. This patch size was chosen to achieve an optimal balance between capturing fine-grained structural features, such as material boundaries and defects, and adhering to the memory and computational constraints of GAN and Transformer architectures. Moreover, it facilitates efficient mini-batch training and inference while preserving perceptual quality, enabling robust and scalable SR suitable for industrial SAM applications.
4.3. Detailed Training
In the training process, the dataset was randomly divided into training, validation, and testing subsets using a 7:2:1 ratio. The LinearTGAN model was implemented in PyTorch 2.4.1 with CUDA 12.4 and Python 3.9. All experiments for SR tasks were performed on a system equipped with an Intel Core i7-12700 processor, 64 GB of RAM, an NVIDIA GeForce RTX 3090 GPU, and an NVIDIA Tesla T4 GPU. The model was trained with a learning rate of and executed for a total of 10,000 epochs. The loss function integrates pixel-wise loss [33], perceptual loss [34], and adversarial loss [6], where pixel-wise loss ensures accurate reconstruction of fine image details, perceptual loss captures high-level semantic features, and adversarial loss enhances the realism of generated images. The mathematical formulations of these loss functions are defined as follows:
where represents the overall loss function, comprising , , and , which correspond to the pixel-wise loss, perceptual loss, and adversarial loss, respectively. The weighting coefficients (, , and ) control the relative contributions of each loss term, ensuring a well-balanced optimization process during training. In this study, , , and are set to 1, 0.5, and 0.05, respectively, to achieve an optimal between pixel-wise accuracy, perceptual quality, and adversarial learning objectives.
4.4. Evaluation Metrics
To evaluate the performance of our LinearTGAN model, four standard SR metrics were employed: Peak Signal-to-Noise Ratio (PSNR) [35], Structural Similarity Index Measure (SSIM) [35], Learned Perceptual Image Patch Similarity (LPIPS) [36], and Fréchet Inception Distance (FID) [37]. PSNR is a pixel-wise evaluation metric that measures the ratio between the maximum possible pixel value and the Mean Squared Error (MSE) [38] between the reference image and the generated image. It measures how closely the pixel intensities in the generated image match those of the reference image, with higher PSNR values indicating better image quality. SSIM evaluates image quality by comparing structural information, luminance, and contrast between the reference image and the generated image. While PSNR focuses on pixel-level accuracy, SSIM aligns more closely with human visual perception, as it considers the structural similarity of images. LPIPS measures perceptual similarity between the reference and generated images using deep feature representations extracted from pre-trained neural networks. This study utilized AlexNet [39] and VGG [40] as feature extraction networks. In contrast to PSNR and SSIM, which primarily address pixel-level and structural fidelity, LPIPS captures high-level perceptual differences, emphasizing semantic features and overall image realism. Lower LPIPS scores indicate a closer perceptual match between the generated and reference images. Lastly, FID quantifies perceptual quality by measuring the distributional similarity between feature representations of real and generated images. A lower FID score signifies reduced divergence between these distributions, indicating higher realism and improved generative performance. All metrics are defined mathematically as follows:
where MAX represents the maximum pixel intensity value and MSE denotes the mean squared error between two images (x and y).
with
where the luminance term (L(x, y)) quantifies the similarity in the mean intensity between images x and y, the contrast term (C(x, y)) evaluates the similarity in contrast between the two images, and the structure term S(x, y), assesses their structural correspondence. Here, and , and , and are the mean values, the variances, and the covariance between images x and y, respectively.
with:
where and denote the width and height of the feature map at layer j, while and correspond to the internal activations of a pretrained CNN and the scaled channel-wise weight vector ().
where and represent the mean feature vectors of image sets x and y, respectively, while and denote the covariance matrices of feature activations for these image sets. The term corresponds to the squared Euclidean distance [41] between the mean feature vectors, quantifying the shift in feature distributions. The trace operator, , computes the sum of the diagonal elements, which reflects differences in feature covariance, and represents the square root of the product of the two covariance matrices, capturing second-order statistical differences between the distributions.
4.5. Baseline
We compare our proposed LinearTGAN with the bicubic interpolation method [42] and four SOTA SR methods, including CARN [41], BSRGAN [43], Real-ESRGAN [24], and TransENet [44]. CARN enhances hierarchical feature learning through cascading residual connections and group convolutions, enabling efficient SR with reduced computational complexity. BSRGAN introduces a more realistic degradation model that effectively simulates complex real-world image degradations through a series of meaningful operations, including blur, downsampling, noise addition, JPEG compression, and their combinations with appropriate random parameters. This realistic degradation modeling allows BSRGAN to handle diverse and complex real-world scenarios, producing more natural-looking reconstructions. Real-ESRGAN extends ESRGAN by incorporating a high-order degradation model, allowing it to handle complex real-world degradations. TransENet, a transformer-based SR model, utilizes self-attention mechanisms to model global contextual relationships, improving high-frequency texture reconstruction and structural coherence in HR images.
Other SR models, such as SAN [45], HAN [46], and IGNN [47], were excluded from this comparison due to their reliance on computationally intensive attention mechanisms, increased processing demands, and limited accessibility compared to the selected approaches. This study systematically evaluates LinearTGAN in terms of reconstruction accuracy, perceptual fidelity, and computational efficiency, benchmarking its performance against established SR models. By providing a rigorous comparative analysis, this evaluation offers valuable insights into the strengths and limitations of LinearTGAN relative to existing SR techniques.
5. Experimental Results
5.1. RQ1: How Effective Is LinearTGAN in Enhancing Linear Acoustic Image Quality?
5.1.1. Quantitative Results
Table 1 presents the average quantitative results across multiple evaluation metrics. Detailed results for each wafer are provided in Supplementary Figure S1. These findings provide a comprehensive assessment of the effectiveness of various SR approaches in reconstructing high-quality images. Bicubic interpolation remains a widely used and computationally efficient baseline for SR evaluation. However, due to the specificity of our dataset, it achieves a PSNR of 27.341 dB and an SSIM of 0.848, which are significantly lower than those obtained by deep learning-based methods. This highlights its inherent limitations in accurately recovering details and maintaining structural coherence, often leading to blurred artifacts and degraded perceptual quality in reconstructed images.

Table 1.
Quantitative evaluation of models across performance metrics. The best and second-best results are indicated in red and blue, respectively. ↑ Higher score is better, and ↓ Lower score is better.
Our proposed LinearTGAN model demonstrates significant improvements over the compared methods, achieving the highest PSNR of 29.479 dB and the best SSIM of 0.874. This superior performance underscores its ability to effectively reconstruct fine textures, recover high-frequency details, and maintain the structural integrity of acoustic images. Additionally, LinearTGAN obtains the lowest LPIPS scores (0.095 with AlexNet and 0.182 with VGG), indicating a higher degree of perceptual similarity to the ground truth compared to both CNN-based and transformer-based models. Furthermore, the FID score of 0.445, which is substantially lower than those of competing methods, reinforces the realism and fidelity of the generated images.
The CNN-based CARN model achieves a competitive PSNR of 28.887 dB and an SSIM of 0.873, reflecting strong performance among conventional deep architectures. However, its limitations in artifact suppression and texture consistency reduce its effectiveness in high-quality image reconstruction. GAN-based models like BSRGAN and Real-ESRGAN show lower perceptual quality, with elevated LPIPS and FID scores due to sensitivity to real-world degradations. The transformer-based TransENet exhibits moderate performance (PSNR of 26.437 dB and SSIM of 0.772), highlighting challenges in generalizing across diverse structures. Figure 3 illustrates the PSNR and FID relative to model complexity, with additional metrics in Supplementary Figure S2. These results underscore the superior reconstruction capability of LinearTGAN, which outperforms CNN, GAN, and Transformer-based models in pixel-level accuracy and perceptual quality, establishing it as an SOTA approach for high-fidelity image SR.
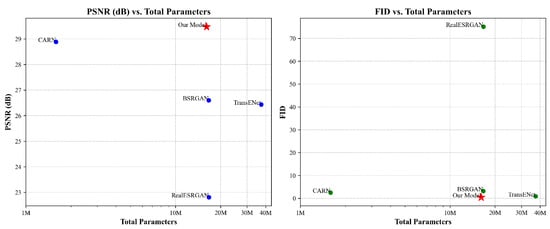
Figure 3.
PSNR and FID results with the total number of parameters of different methods for image SR.
5.1.2. Qualitative Results
Figure 4 presents qualitative comparisons of SR results for linear acoustic imaging, highlighting differences in reconstruction quality across models. Bicubic interpolation fails to reconstruct intricate structures, leading to excessively smoothed textures and significant blurring artifacts. While CARN achieves sharper reconstructions than Bicubic interpolation, it still struggles with artifact suppression and texture consistency. The GAN-based models (BSRGAN and Real-ESRGAN) enhance perceptual quality by generating sharper textures. However, they frequently over-enhance details, introducing noticeable distortions in complex patterns. TransENet, the Transformer-based model, effectively restores global structures but exhibits difficulty in recovering high-frequency textures, particularly in wafer regions with intricate structural variations.
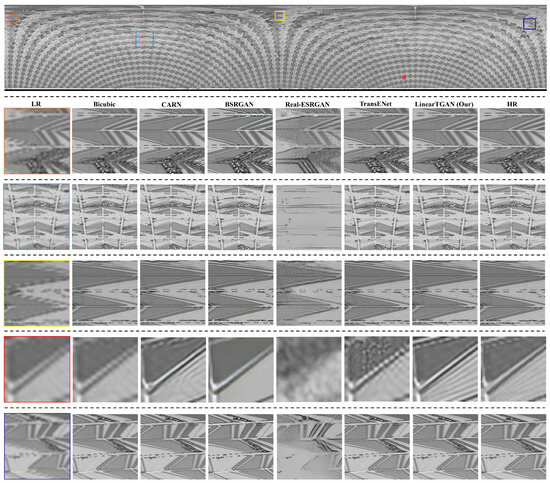
Figure 4.
Visual comparisons of the results. Zoom in for a more detailed analysis.
Our proposed LinearTGAN model produces visually superior reconstructions, resembling the ground-truth images. LinearTGAN effectively recovers fine textures and high-frequency details while maintaining structural coherence (see Supplementary Figure S3 for a detailed comparison of the final scanned image in polar coordinates). By integrating adversarial learning with a Transformer-guided enhancement strategy, LinearTGAN can suppress artifacts, mitigate distortions, and preserve intricate spatial details with high fidelity. Its ability to accurately reconstruct fine features further demonstrates its robustness in high-fidelity SR reconstruction for acoustic imaging. In comparison to CNN and Transformer-based approaches, LinearTGAN effectively mitigates noise, restores fine textures, and preserves intricate spatial details, demonstrating its superior performance in high-fidelity SR reconstruction for acoustic imaging. These findings further validate the quantitative advances of LinearTGAN, emphasizing its superior performance in both pixel-level accuracy and perceptual quality.
5.2. RQ2: How Efficient Is LinearTGAN in Improving Wafer Measurement and Inspection Performance?
5.2.1. Measurement Performance
A defect detection and segmentation experiment was conducted to evaluate the impact of the proposed SR model on measurement performance. Figure 5 provides an overview of the entire evaluation process. Since the dataset did not contain naturally occurring crack defects, pseudo-defect images were synthesized by superimposing artificial defect masks onto crack-free LR images using OpenCV, enabling a controlled and consistent experimental setup. The SR model was integrated as a preprocessing step and a post-enhancement module. A segmentation network based on the YOLOv8-seg architecture [48] was trained using HR images and evaluated on a test set comprising image patches with dimensions of 640 × 640. The evaluation was performed on three input types: original LR images, SR outputs generated by the proposed model, and HR ground-truth images.
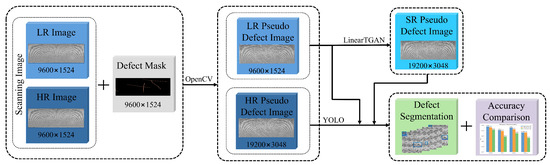
Figure 5.
Schematic of the workflow for defect segmentation evaluation.
Figure 6 presents the quantitative evaluation of defect detection and segmentation performance based on four standard metrics: precision, recall, , and [49]. The HR inputs yielded the highest performance across all metrics, serving as the upper bound for comparison. The SR images generated by the proposed model closely approximated the HR baseline, exhibiting only minor deviations. In contrast, LR inputs demonstrated significantly reduced performance, particularly in recall (0.573) and (0.530), underscoring the limitations of LR data for accurate segmentation. These findings confirm that the SR model successfully reconstructs critical structural details, thereby enhancing segmentation accuracy and reinforcing its applicability to non-destructive defect inspection workflows. For a detailed qualitative comparison of segmentation outcomes, refer to Supplementary Figure S4.
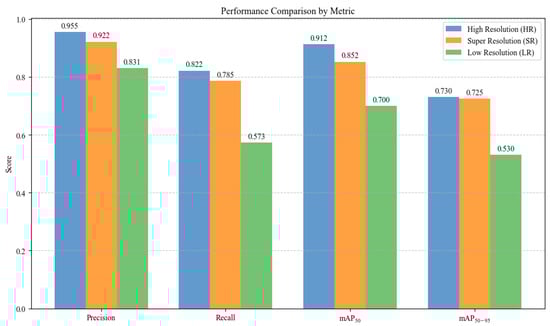
Figure 6.
Defect segmentation performance comparison.
5.2.2. Inspection Performance
Balancing high-fidelity image reconstruction with computational efficiency is a critical requirement for real-world deployment in semiconductor inspection workflows. The proposed LinearTGAN architecture was specifically designed to address this trade-off, incorporating approximately 16 million parameters, enabling real-time inference on standard commercial GPUs without compromising output quality. This computational parsimony facilitates seamless integration into inline wafer inspection pipelines, where both accuracy and throughput are essential. As illustrated in Table 2, the integration of LinearTGAN with the R-SAM system yields significant performance gains. Specifically, the USI RSAM 300 system operating at a 50 µm step size achieves a substantial reduction in scanning duration from 2727 s with the conventional TSAM-400 system to 763 s, while preserving the original image resolution of 6000 × 6000 pixels. This configuration requires no additional post-processing, resulting in a scanning efficiency of 72%. These results underscore the effectiveness of LinearTGAN in enabling high-precision inspection with markedly improved operational efficiency, thereby demonstrating its suitability for deployment in advanced semiconductor manufacturing environments.
Table 2.
Comparison of scanning performance.
Scanning performance further improves when LinearTGAN is applied to the USI RSAM 300 system at a 100 µm step size. Here, the initial resolution is reduced to 3000 × 3000 pixels to accelerate data acquisition. SR reconstruction using LinearTGAN enhances the resolution to 6000 × 6000 pixels, enabling effective restoration of HR images. This advanced approach dramatically reduces the scanning time to 190 s, with an additional 16 sec allocated for SR processing, resulting in a total acquisition time of just 206 s. Integrating LinearTGAN with R-SAM enables the system to achieve an exceptional scanning performance of 92%, representing a substantial breakthrough over conventional scanning methodologies. These findings highlight the capability of LinearTGAN in enhancing wafer inspection and measurement performance, demonstrating its effectiveness as an efficient and scalable solution for a wide range of semiconductor applications.
5.3. RQ3: How Feasible Is the System-Level Implementation of LinearTGAN in Practical Applications?
The system-level feasibility of LinearTGAN is validated through a structured deployment framework, as illustrated in Figure 7. The model is initially trained using Python and the PyTorch deep learning framework, generating a pre-trained .pth file. For deployment, this file is converted to the Open Neural Network Exchange (ONNX) format to ensure compatibility with ONNX Runtime, enabling seamless integration into a C# environment. This conversion supports efficient inference execution within the software backend. The ONNX model is encrypted before deployment to comply with security standards in industrial applications, ensuring protection against unauthorized access and supporting secure inference execution. These processes demonstrate the practical applicability of LinearTGAN for real-time deployment in industrial systems.
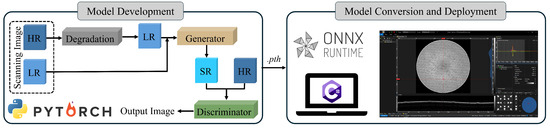
Figure 7.
Deployment framework of the proposed model.
6. Ablation Studies for LinearTGAN
In ablation studies, we systematically evaluated the architectural design and key components of the LinearTGAN model to assess their contributions to image reconstruction quality and overall performance. We trained the model and evaluated its PSNR and LPIPS (VGG) performance using a self-constructed acoustic dataset of 200 randomly selected images, each with a 256 × 256 pixel resolution, ensuring no overlap with training and test datasets. This analysis provides a comprehensive understanding of the effectiveness of each component in improving SR capabilities.
Effect of Swin Transformer Blocks (STBs): Figure 8 presents an in-depth analysis of the impact of STBs on the performance of LinearTGAN. The results indicate that increasing the number of STBs from 4 to 8 significantly enhances image reconstruction quality, improving the PSNR from 24.917 dB to 26.864 dB and reducing the LPIPS from 0.674 to 0.465. These improvements highlight the essential role of STBs in capturing long-range dependencies, refining fine textures, and enhancing structural coherence. However, beyond 8 STBs, performance improvements diminish, with the PSNR stabilizing at 26.895 dB for 12 blocks, while LPIPS fluctuates slightly to 0.417. Thus, the -eight-STB configuration achieves an optimal balance between image quality and efficiency, making it the most suitable choice for high-precision SR tasks within the LinearTGAN framework.
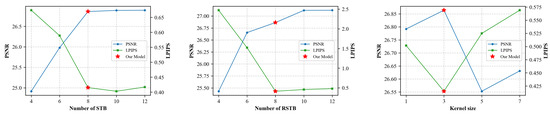
Figure 8.
Ablation study under different settings of LinearTGAN.
Effect of Residual Swin Transformer Block (RSTBs): We adopt a similar experimental setup as that used for the STBs to assess the impact of RSTBs on the performance of LinearTGAN. The results indicate that increasing the number of RSTBs enhances the ability of the model to recover high-frequency details and maintain structural consistency in image reconstruction, as shown in Figure 8. However, beyond eight RSTBs, the performance improvements become negligible, while computational complexity rises significantly. The slight variations observed in LPIPS values beyond this threshold suggest that additional RSTBs offer limited perceptual benefits. These findings highlight the critical role of RSTBs in improving image quality while emphasizing the diminishing returns associated with excessive stacking. Therefore, to achieve a well-balanced compromise between reconstruction accuracy and computational efficiency, we set the number of RSTBs to eight, as this configuration ensures high reconstruction quality while reducing processing costs.
Effect of Residual Connection (RC): Figure 8 displays a detailed analysis of the impact of different RC kernel sizes on model performance. An RC facilitates an identity-based pathway between various blocks and the reconstruction module, enabling the effective aggregation of multi-level features. The results indicate that the 3 × 3 kernel configuration achieves an optimal balance, effectively preserving fine details and enhancing perceptual quality. In contrast, the 1 × 1 kernel demonstrates limited capability in capturing local neighboring information compared to the 3 × 3 convolution. Additionally, performance deteriorates with larger kernel sizes, such as 5 × 5 and 7 × 7. This decline can likely be attributed to over-smoothing effects and increased computational complexity, which may hinder generalization. After extensive analysis, the 3 × 3 kernel was identified as the most effective configuration, striking an optimal balance between pixel-level accuracy and perceptual fidelity within the LinearTGAN framework. This selection ultimately enhances structural coherence and improves overall image reconstruction quality.
7. Conclusions
This study introduces LinearTGAN, a deep learning-driven SR model designed to enhance the resolution of linear acoustic wafer images while maintaining scanning efficiency. Extensive experimental evaluations demonstrate that LinearTGAN consistently outperforms conventional CNN-based, GAN-based, and Transformer-based approaches, exhibiting superior pixel-level accuracy and perceptual quality performance. Further evaluation using YOLOv8-seg confirms its efficacy in improving defect detection and segmentation, with precision, recall, and mAP scores closely matching those of HR inputs. Moreover, the seamless integration of LinearTGAN with R-SAM effectively mitigates the trade-off between scanning speed and image quality, achieving a 92% reduction in scanning time compared to conventional scanning systems while successfully restoring HR imaging. Ablation studies validate the significance of key architectural components in preserving fine texture details, ensuring structural coherence, and optimizing computational efficiency, reinforcing the robustness of the model in high-fidelity SR reconstruction.
The present evaluation was conducted using a self-built dataset comprising ten wafers, with LR inputs generated through synthetic degradation of HR scans to ensure controlled benchmarking conditions. To enhance model robustness, the training dataset incorporated authentic LR acquisitions alongside synthetically degraded HR counterparts, capturing a broad range of structural variations and noise characteristics representative of R-SAM imaging. While this hybrid strategy contributes to improved generalization, broader empirical validation remains essential. Future research will focus on expanding the dataset to include a wider variety of wafer materials, geometries, and defect modalities, thereby enhancing the model’s adaptability. Additionally, to support integration into real-time semiconductor manufacturing workflows, ongoing work will prioritize the optimization of computational efficiency through lightweight architectures and network pruning. With these advances, LinearTGAN is expected to emerge as an effective solution for NDT wafer inspection and measurement, offering a scalable, high-performance approach to quality control and instrumentation in semiconductor manufacturing while reducing operational complexity and inspection time.
Supplementary Materials
The following supporting information can be downloaded at: https://www.mdpi.com/article/10.3390/app15126780/s1.
Author Contributions
Conceptualization, T.T.H.V., T.H.V. and T.N.N.; Methodology, T.T.H.V. and T.N.N.; Software, T.H.V.; Validation, T.T.H.V., T.H.V. and T.N.N.; Formal analysis, J.C., L.H.T. and V.H.M.D.; Data curation, V.B.N. and W.L.; Writing—original draft, T.T.H.V.; Writing—review and editing, T.T.H.V.; T.H.V., T.N.N. and S.M.; Visualization, J.O.; Supervision, J.O. and S.M. All authors have read and agreed to the published version of the manuscript.
Funding
This research was supported by a National Research Foundation of Korea (NRF) grant funded by the Korea government (MSIT) (no. 2022R1A5A8023404) and the Pukyong National University Industry–University Cooperation Foundation’s 2024 Post-Doc support project.
Institutional Review Board Statement
Not applicable.
Data Availability Statement
The data used in this article is not made public. If you need to use them, please contact the corresponding author.
Conflicts of Interest
Author Junghwan Oh was employed by the company Ohlabs Corp. The remaining authors declare that the research was conducted in the absence of any commercial or financial relationships that could be construed as a potential conflict of interest.
References
- Kamal, K. The Silicon Age: Trends in Semiconductor Devices Industry. J. Eng. Sci. Technol. Rev. 2022, 15, 110–115. [Google Scholar] [CrossRef]
- Lechien, T.; Dehaerne, E.; Dey, B.; Blanco, V.; Halder, S.; De Gendt, S.; Meert, W. Automated semiconductor defect inspection in scanning electron microscope images: A systematic review. arXiv 2023, arXiv:2308.08376. [Google Scholar]
- Khuri-Yakub, B. Scanning acoustic microscopy. Ultrasonics 1993, 31, 361–372. [Google Scholar] [CrossRef]
- Pham, V.; Vo, T.; Vu, D.; Choi, J.; Park, S.; Mondal, S.; Lee, B.-I.; Oh, J. Development of fast scanning module with a novel bubble solution applied to scanning acoustic microscopy system for industrial nondestructive inspection. Expert Syst. Appl. 2023, 228, 120273. Available online: https://www.sciencedirect.com/science/article/pii/S0957417423007753 (accessed on 12 April 2025). [CrossRef]
- Kim, D.; Oh, H.; Choi, J.; Vo, T.; Vu, D.; Mondal, S.; Lee, B.; Oh, J. Development of high-speed scanning acoustic microscopy system: Simplified design and stabilization. Eng. Sci. Technol. Int. J. 2025, 61, 101911. [Google Scholar] [CrossRef]
- Goodfellow, I.; Pouget-Abadie, J.; Mirza, M.; Xu, B.; Warde-Farley, D.; Ozair, S.; Courville, A.; Bengio, Y. Generative adversarial networks. Commun. ACM 2020, 63, 139–144. [Google Scholar] [CrossRef]
- Qu, J.; Blau, P.; Shih, A.; McSpadden, S.; Pharr, G.; Jang, J. Scanning acoustic microscopy for non-destructive evaluation of subsurface characteristics. In Proceedings of the 6th International Conference on Frontiers of Design and Manufacturing (SM Wu Symposium on Manufacturing Sciences), Xi’an, China, 10–12 June 2004; Volume 435. [Google Scholar]
- Sun, A.; Ju, B. The acoustic micro integrated detection technique for silicon wafer processing. Adv. Mater. Res. 2012, 497, 151–155. [Google Scholar] [CrossRef]
- Ramanathan, S.; Semmens, J.; Kessler, L. High-frequency acoustic microscopy studies of buried interfaces in silicon. In Proceedings of the 56th Electronic Components and Technology Conference, San Diego, CA, USA, 30 May–2 June 2006; p. 4. [Google Scholar]
- Ohlabs Corp., Busan, Republic of Korea. [Online]. Available online: https://www.youtube.com/watch?v=SglCbQLm6C4 (accessed on 14 April 2025).
- Bertero, M.; De Mol, C. III Super-resolution by data inversion. Prog. Opt. 1996, 36, 129–178. [Google Scholar]
- Langenberg, K.; Berger, M.; Kreutter, T.; Mayer, K.; Schmitz, V. Synthetic aperture focusing technique signal processing. NDT Int. 1986, 19, 177–189. [Google Scholar] [CrossRef]
- Kalaycıoğlu, T.; Özgüven, H. Nonlinear structural modification and nonlinear coupling. Mech. Syst. Signal Process. 2014, 46, 289–306. [Google Scholar] [CrossRef]
- Ağalday, M.F.; Çınar, A. Improvement of a subpixel convolutional neural network for a super-resolution image. Appl. Sci. 2025, 15, 2459. [Google Scholar] [CrossRef]
- Jing, T.; Liu, C.; Chen, Y. A lightweight single-image super-resolution method based on the parallel connection of convolution and Swin Transformer blocks. Appl. Sci. 2025, 15, 1806. [Google Scholar] [CrossRef]
- Waseem, I.; Habib, M.; Rehman, E.; Bibi, R.; Yousaf, R.M.; Aslam, M.; Jilani, S.F.; Younis, M.W. Enhanced learning enriched features mechanism using deep convolutional neural network for image denoising and super-resolution. Appl. Sci. 2024, 14, 6281. [Google Scholar] [CrossRef]
- Banerjee, P.; Akarte, S.; Kumar, P.; Shamsuzzaman, M.; Butola, A.; Agarwal, K.; Prasad, D.; Melandsø, F.; Habib, A. High-resolution imaging in acoustic microscopy using deep learning. Mach. Learn. Sci. Technol. 2024, 5, 015007. [Google Scholar] [CrossRef]
- Sharma, A.; Somani, A.; Banerjee, P.; Melandsø, F.; Habib, A. HDL-SAM: A Hybrid Deep Learning Framework for High-Resolution Imaging in Scanning Acoustic Microscopy. In Proceedings of the Synthetic Data for Computer Vision Workshop@ CVPR 2024, Seattle, WA, USA, 17–21 June 2024. [Google Scholar]
- Makra, Á.; Bost, W.; Kalló, I.; Horváth, A.; Fournelle, M.; Gyöngy, M. Enhancement of acoustic microscopy lateral resolution: A comparison between deep learning and two deconvolution methods. IEEE Trans. Ultrason. Ferroelectr. Freq. Control 2019, 67, 136–145. [Google Scholar] [CrossRef]
- Mansourifar, H.; Moskovitz, A.; Klingensmith, B.; Mintas, D.; Simske, S. GAN-based satellite imaging: A survey on techniques and applications. IEEE Access 2022, 10, 118123–118140. [Google Scholar] [CrossRef]
- Somani, A.; Banerjee, P.; Rastogi, M.; Habib, A.; Agarwal, K.; Prasad, D. Image inpainting with hypergraphs for resolution improvement in scanning acoustic microscopy. In Proceedings of the IEEE/CVF Conference on Computer Vision and Pattern Recognition, Vancouver, BC, Canada, 18–22 June 2023; pp. 3113–3122. [Google Scholar]
- Banerjee, P.; Mishra, S.; Yadav, N.; Agarwal, K.; Melandsø, F.; Prasad, D.; Habib, A. Image inpainting in acoustic microscopy. AIP Adv. 2023, 13, 045225. [Google Scholar] [CrossRef]
- Sha, Y.; He, Z.; Gutierrez, H.; Du, J.; Yang, W.; Lu, X. Small sample classification based on data enhancement and its application in flip chip defection. Microelectron. Reliab. 2023, 141, 114887. [Google Scholar] [CrossRef]
- Wang, X.; Xie, L.; Dong, C.; Shan, Y. Real-esrgan: Training real-world blind super-resolution with pure synthetic data. In Proceedings of the IEEE/CVF International Conference on Computer Vision, Montreal, QC, Canada, 10–17 October 2021; pp. 1905–1914. [Google Scholar]
- Geusebroek, J.; Smeulders, A.; Van De Weijer, J. Fast anisotropic gauss filtering. IEEE Trans. Image Process. 2003, 12, 938–943. [Google Scholar] [CrossRef]
- Zhang, K.; Zuo, W.; Zhang, L. Learning a single convolutional super-resolution network for multiple degradations. In Proceedings of the IEEE Conference on Computer Vision and Pattern Recognition, Salt Lake City, UT, USA, 18–22 June 2018; pp. 3262–3271. [Google Scholar]
- Le Montagner, Y.; Angelini, E.; Olivo-Marin, J. An unbiased risk estimator for image denoising in the presence of mixed Poisson–Gaussian noise. IEEE Trans. Image Process. 2014, 23, 1255–1268. [Google Scholar] [CrossRef]
- Liu, Z.; Lin, Y.; Cao, Y.; Hu, H.; Wei, Y.; Zhang, Z.; Lin, S.; Guo, B. Swin transformer: Hierarchical vision transformer using shifted windows. In Proceedings of the IEEE/CVF International Conference on Computer Vision, Montreal, QC, Canada, 10–17 October 2021; pp. 10012–10022. [Google Scholar]
- Zhao, L.; Gao, J.; Deng, D.; Li, X. SSIR: Spatial shuffle multi-head self-attention for single image super-resolution. Pattern Recognit. 2024, 148, 110195. [Google Scholar] [CrossRef]
- Kruse, R.; Mostaghim, S.; Borgelt, C.; Braune, C.; Steinbrecher, M. Multi-layer perceptrons. Comput. Intell. Methodol. Introd. 2022, 53–124. [Google Scholar]
- Ronneberger, O.; Fischer, P.; Brox, T. U-net: Convolutional networks for biomedical image segmentation. In Proceedings of the Medical Image Computing And Computer-Assisted Intervention–MICCAI 2015: 18th International Conference, Munich, Germany, 5–9 October 2015; Proceedings, Part III 18. pp. 234–241. [Google Scholar]
- Dong, X.; Lei, Y.; Wang, T.; Thomas, M.; Tang, L.; Curran, W.; Liu, T.; Yang, X. Automatic multiorgan segmentation in thorax CT images using U-net-GAN. Med. Phys. 2019, 46, 2157–2168. [Google Scholar] [CrossRef] [PubMed]
- Yan, Z.; Yang, X.; Cheng, K. Joint segment-level and pixel-wise losses for deep learning based retinal vessel segmentation. IEEE Trans. Biomed. Eng. 2018, 65, 1912–1923. [Google Scholar] [CrossRef] [PubMed]
- Johnson, J.; Alahi, A.; Fei-Fei, L. Perceptual losses for real-time style transfer and super-resolution. In Proceedings of the Computer Vision–ECCV 2016: 14th European Conference, Amsterdam, The Netherlands, 11–14 October 2016; Proceedings, Part II 14. pp. 694–711. [Google Scholar]
- Hore, A.; Ziou, D. Image quality metrics: PSNR vs. SSIM. In Proceedings of the 2010 20th International Conference on Pattern Recognition, Istanbul, Turkey, 23–26 August 2010; pp. 2366–2369. [Google Scholar]
- Benecki, P.; Kostrzewa, D.; Kawulok, M. Perceptual Loss for Training Multi-Image Super-Resolution. In Proceedings of the IGARSS 2023-2023 IEEE International Geoscience and Remote Sensing Symposium, Pasadena, CA, USA, 16–21 July 2023; pp. 6330–6333. [Google Scholar]
- Heusel, M.; Ramsauer, H.; Unterthiner, T.; Nessler, B.; Hochreiter, S. Gans trained by a two time-scale update rule converge to a local nash equilibrium. Adv. Neural Inf. Process. Syst. 2017, 30. [Google Scholar]
- Botchkarev, A. Performance metrics (error measures) in machine learning regression, forecasting and prognostics: Properties and typology. arXiv 2018, arXiv:1809.03006. [Google Scholar]
- Chen, H.; Widodo, A.; Wisnujati, A.; Rahaman, M.; Lin, J.; Chen, L.; Weng, C. AlexNet convolutional neural network for disease detection and classification of tomato leaf. Electronics 2022, 11, 951. [Google Scholar] [CrossRef]
- Koonce, B.; Koonce, B. Vgg network. In Convolutional Neural Networks with Swift for Tensorflow: Image Recognition and Dataset Categorization; Springer: Berlin/Heidelberg, Germany, 2021; pp. 35–50. [Google Scholar]
- Fadnavis, S. Image interpolation techniques in digital image processing: An overview. Int. J. Eng. Res. Appl. 2014, 4, 70–73. [Google Scholar]
- Li, Y.; Agustsson, E.; Gu, S.; Timofte, R.; Van Gool, L. Carn: Convolutional anchored regression network for fast and accurate single image super-resolution. In Proceedings of the European Conference on Computer Vision (ECCV) Workshops, Munich, Germany, 8–14 September 2018. [Google Scholar]
- Zhang, K.; Liang, J.; Van Gool, L.; Timofte, R. Designing a practical degradation model for deep blind image super-resolution. In Proceedings of the IEEE/CVF International Conference on Computer Vision, Montreal, QC, Canada, 10–17 October 2021; pp. 4791–4800. [Google Scholar]
- Lei, S.; Shi, Z.; Mo, W. Transformer-based multistage enhancement for remote sensing image super-resolution. IEEE Trans. Geosci. Remote Sens. 2021, 60, 1–11. [Google Scholar] [CrossRef]
- Dai, T.; Cai, J.; Zhang, Y.; Xia, S.; Zhang, L. Second-order attention network for single image super-resolution. In Proceedings of the IEEE/CVF Conference on Computer Vision and Pattern Recognition, Long Beach, CA, USA, 15–20 June 2019; pp. 11065–11074. [Google Scholar]
- Yang, Z.; Yang, D.; Dyer, C.; He, X.; Smola, A.; Hovy, E. Hierarchical attention networks for document classification. In Proceedings of the 2016 Conference of the North American Chapter of the Association for Computational Linguistics: Human Language Technologies, San Diego, CA, USA, 12–17 June 2016; pp. 1480–1489. [Google Scholar]
- Zhou, S.; Zhang, J.; Zuo, W.; Loy, C. Cross-scale internal graph neural network for image super-resolution. Adv. Neural Inf. Process. Syst. 2020, 33, 3499–3509. [Google Scholar]
- Jocher, G.; Chaurasia, A.; Qiu, J. YOLO by Ultralytics. (2023, 1). Available online: https://github.com/ultralytics/ultralytics (accessed on 5 March 2025).
- Reis, D.; Kupec, J.; Hong, J.; Daoudi, A. Real-time flying object detection with YOLOv8. arXiv 2023, arXiv:2305.09972. [Google Scholar]
Disclaimer/Publisher’s Note: The statements, opinions and data contained in all publications are solely those of the individual author(s) and contributor(s) and not of MDPI and/or the editor(s). MDPI and/or the editor(s) disclaim responsibility for any injury to people or property resulting from any ideas, methods, instructions or products referred to in the content. |
© 2025 by the authors. Licensee MDPI, Basel, Switzerland. This article is an open access article distributed under the terms and conditions of the Creative Commons Attribution (CC BY) license (https://creativecommons.org/licenses/by/4.0/).