Article

Sustainable Phosphate Capture from Urban Wastewater Treatment Plants Towards a Nutrient Recovery and Water Reuse Strategy

by
Andreia F. Santos
1,
Paula Alvarenga
2,
Licínio M. Gando-Ferreira
1 and
Margarida J. Quina
1,*
1
Department of Chemical Engineering, CERES, University of Coimbra, 3030-790 Coimbra, Portugal
2
Associate Laboratory TERRA, LEAF—Linking Landscape, Environment, Agriculture and Food Research Center, School of Agriculture, University of Lisbon, Tapada da Ajuda, 1349-017 Lisboa, Portugal
*
Author to whom correspondence should be addressed.
Appl. Sci. 2025, 15(12), 6761; https://doi.org/10.3390/app15126761
Submission received: 14 May 2025 / Revised: 8 June 2025 / Accepted: 10 June 2025 / Published: 16 June 2025
(This article belongs to the Section Applied Biosciences and Bioengineering)

Abstract

:
This study proposes and evaluates a two-step phosphorus (P) recovery strategy that combines chemical precipitation with adsorption to comply with the updated EU Urban Wastewater Treatment Directive (Directive (EU) 2024/3019), which sets stricter limits on nutrient discharge and promotes resource recovery. The objective was to enhance the P removal efficiency beyond that achieved by conventional precipitation. A laboratory-scale design of experiments was conducted using real wastewater with an initial P concentration of 10 mg P/L post-precipitation and was extended to 1 and 40 mg P/L to assess broader applicability. The optimal lab-scale conditions (30 cm bed height and 5 mL/min flow rate) resulted in a saturated bed fraction (FSB) of 0.425 and a breakthrough time of 126 min. The process was successfully scaled up to a column with a height of 60 cm and a diameter of 4 cm, achieving a higher FSB (0.764), improved adsorption capacity (84.1 mg P/kg), and reduced unused bed (40%). The integrated system maintained effluent P levels below 0.5–0.7 mg P/L for over 400 min, demonstrating regulatory compliance and operational reliability. These findings confirmed the feasibility and scalability of combining precipitation with adsorption for enhanced P recovery in wastewater treatment systems.

1. Introduction

The recovery of phosphorus (P) from wastewater is increasingly important in the water process engineering sector. More than 90% of the P demand corresponds to the fertilizer industry, while the remainder is used in detergents, food supplements, pesticides, and medicine industries [1,2,3]. However, due to the excess of P in the diet of people and animals, the surplus of this element is eliminated through human excreta, manure, and solid waste [4,5]. Detergents also contribute to the concentration of P in domestic wastewater. In addition to this relevant environmental aspect, P and phosphate rock were reconfirmed in the 2023 Critical Raw Materials (CRM) List [6]. Thus, it is important to use less P (e.g., by minimizing the input in goods) and promote recycling (e.g., by maximizing the recovery and reuse of P in waste streams). The CRM Act (in force on 23 May 2024) set goals to improve the sustainability and circularity of CRM in the European Union (EU) market by taking measures to increase the collection of CRM-rich waste and ensure its recycling into secondary CRM [7]. In addition, the new Urban Wastewater Treatment Directive (Directive (EU) 2024/3019) introduced updated guidelines, including stricter monitoring of chemical pollutants, pathogens, and antimicrobial resistance, as well as promoting the reuse of treated urban wastewater to address water scarcity. Specifically, concerning P in wastewater treatment plants (WWTP), the directive mandates tertiary treatment by 2039. New discharge limits and minimum P removal percentages relative to influent load are proposed: 0.7 mg P/L or 87.5% reduction (10,000–150,000 population equivalent (pe)) and 0.5 or 90% reduction (>150,000 pe). In the context of regulations for agricultural reuse of treated wastewater, some countries have set specific P concentration limits. For example, Portugal has set a limit of 5 mg P/L, while Cyprus allows concentrations up to 10 mg P/L [8].
To meet these goals, various strategies and technologies are available for P recovery from wastewater and for preparing water for reuse, with chemical precipitation and adsorption being among the most commonly employed methods. Previous studies have investigated an innovative chemical precipitation approach to recover P in the form of high-purity struvite while minimizing interference from calcium compounds [9]. Despite achieving promising results and producing a high-quality product suitable for soil application, the P concentration in the treated wastewater decreased from around 100 mg P/L (concentration in the inlet stream of anaerobic digestion) to 10 mg P/L. However, this concentration still exceeds the previously mentioned regulatory limits. Therefore, integrating both technologies presents an effective strategy to enhance the P removal efficiency.
In this context, it is worth noting that our previous studies on batch adsorption using eggshells calcined at 700 °C for 60 min demonstrated promising results for P removal from wastewater, achieving an adsorption capacity of approximately 5 mg P/g at 25 °C. These experiments revealed that the main mechanism of P removal in this adsorbent/adsorbate system is physisorption based on electrostatic attraction. In addition, ligand exchange and microprecipitation may contribute to this phenomenon. In addition, the buffering capacity of wastewater helps stabilize the pH when the adsorbent meets the liquid. Although batch experiments offer valuable insights into the potential of calcined eggshells as adsorbents for P removal, the results may not translate directly to large-scale applications. When treating larger volumes of wastewater, the adsorption capacities observed in batch tests are likely overestimated, as scale-up introduces changes in the operating conditions and system dynamics that affect performance. Thus, studying adsorbent behavior under dynamic conditions is essential for accurately predicting breakthrough curves and effectively scaling up the process to an industrial level [10,11]. This strategy should be optimized using fixed-bed experiments. Several key parameters must be thoroughly investigated in fixed-bed adsorption experiments because they significantly influence the performance of the adsorbent. These include the feed concentration, flow rate (which determines the contact time), and bed height. Additionally, the characteristics of the matrix used for adsorbate recovery should not be overlooked. In particular, the presence of other competing elements within the matrix is a critical factor, especially in wastewater treatment, owing to its complex and variable composition.
To the best of our knowledge, only a limited number of studies have investigated the removal of P from wastewater using calcined eggshells in fixed-bed column experiments. Some studies have combined eggshells with other wastes, such as corn stalks [12] and fly ash [13], to prepare low-cost adsorbents. However, these studies were conducted using simulated or pig wastewater. A recent study using rejected wastewater from an anaerobic sludge dewatering process (with an orthophosphate concentration of approximately 30 mg P/L) combined a submerged anaerobic membrane bioreactor and two adsorption columns (eggshell and seagrass as adsorbents). The eggshell was thermally treated at 900 °C for 30 min, and the seagrass was treated at 500 °C for 60 min. The column was operated in continuous mode, and high P removal efficiencies were obtained with eggshells (>90%) [14]. However, this study did not include the determination of breakthrough curves to obtain relevant parameters to scale up the process, such as the breakthrough time, stoichiometric time, and fraction of saturated bed (FSB) [15]. Alternatively, some studies have investigated the use of other low-cost adsorbents, such as biochar derived from wood residues [16] and biosolids pyrolysis [17], for P removal from wastewater. While these studies have shown promising results, none of them progressed to a scale-up design. Moreover, desorption is typically considered the final step for the exhausted adsorbent without exploring the potential of P recycling through soil application, an aspect that aligns closely with the goals of the present study. Specifically, no scientific studies to date have investigated the integration of the newly proposed struvite precipitation approach (discussed before) with fixed-bed adsorption using calcined eggshells —a dual-P recovery system—to achieve P concentrations below regulatory limits and enable water for reuse.
Thus, the main objectives of the present study were (i) to optimize the operating conditions of the adsorption process in the wastewater stream after chemical precipitation, specifically regarding the flow rate and column height; (ii) to analyze the impact of different feed concentrations and assess the feasibility of implementing the adsorption system independently of chemical precipitation; (iii) to evaluate the behavior of coexisting SO42− ions under dynamic studies, given the interference observed in previous batch experiments [18]; and (iv) to develop a scale-up design of the adsorption column. Desorption tests were not performed, as the aim was to assess the potential use of the P-loaded adsorbent as a fertilizer in future agronomic experiments (which are beyond the scope of this work).

2. Materials and Methods

2.1. Materials Collection

Wastewater samples were collected in a Portuguese WWTP with a treatment capacity of approximately 40,000 m3/day. According to previous characterization studies [19], the collection point was selected after centrifugation of the digestate form in an anaerobic digestion reactor. The sample characterization and methods used are summarized in Table S1 (Supplementary Materials). The concentration of soluble reactive P (orthophosphate) in the samples was approximately 40 mg/L. The samples were stored at 4 °C until further use. Eggshell waste was collected in a bakery, washed, air-dried, and ground to a particle size range of 0.5–1.19 mm. The samples were washed again with distilled water to remove impurities, air-dried, and stored under dry conditions. The adsorbent was prepared by calcining the eggshells in a muffle furnace at 700 °C for 60 min. The furnace was preheated to ensure a stable temperature during the calcination process. After calcination, the samples were allowed to cool naturally to room temperature inside a furnace before removal. The resulting material, hereafter referred to as CES700, was stored under dry conditions until used in adsorption experiments. The selected calcination temperature and duration were based on prior optimization studies conducted by the authors in batch systems [18]. A batch of approximately 1 kg of adsorbent was prepared at the laboratory scale using a muffle furnace. During the initial 20 min, the furnace operated in startup and warming mode at 4.6 kW, consuming about 1.53 kWh. Once the target temperature of 700 °C was reached, the furnace required a minimum power of 1.15 kW for 60 min, consuming an additional 1.15 kWh. In total, the energy consumption was 2.68 kWh per kilogram of adsorbent. Based on the average electricity price in the EU for the first half of 2024, 0.1867 €/kWh [20], the estimated production cost of the adsorbent was approximately 0.50 €/kg. Several studies have reported comparable costs for various low-cost adsorbents. For example, chitosan-calcite activated at low temperatures using chemical agents has an estimated cost of 0.49 €/kg [21], whereas sweater-modified biochar costs approximately 0.36 €/kg [22]. Additionally, the cost of chemically modified spent coffee grounds and pine bark has been reported to be 6.00 €/kg and 2.28 €/kg, respectively. However, in the latter case, these costs include not only the treatment expenses but also the costs associated with raw materials, collection, and transportation [23]. The main characteristics of the adsorbent CES700 are listed in Table 1.

2.2. Fixed-Bed Experiments

Fixed-bed experiments were performed using a laboratory column with an internal diameter (d) of 2 cm and height (h) of 40 cm. The bed was filled with CES700 at a fixed height for each experiment, and the remaining space was filled with small glass spheres (inert material). The wastewater was percolated through the column in ascending flow (defined for each experiment) at room temperature (20 ± 1 °C) using a peristaltic pump (Minipuls3-Gilson, Gilson SAS, Sarcelles, France). Several samples were collected from the top of the column at predetermined time intervals. The remaining soluble reactive P concentration in the liquid was measured using the ascorbic acid method (EPA Method 365.3) [19].
The plot of the normalized concentration (Ct,P/C0,P) versus the time of the experiment allowed the determination of the breakthrough curves, and several parameters were estimated to be important for scaling up the process at the industrial level. In particular, the breakthrough time (tbp) and exhaustion time (tex) correspond to the time at which the concentration of P at the column outlet was approximately 5% and 95% of the initial P concentration, respectively. The stoichiometric time was calculated according to Equation (1) using numerical integration of the breakthrough curve [25].
t s t = 0 t 1 C t , P C 0 , P d t
where C0,P and Ct,P (mg P/L) are the P initial and concentrations at time t.
The adsorption time (Δtads) is the difference between tex and tbp:
Another relevant parameter is the fraction of saturated beds (FSB), which represents the ratio of the total mass of P adsorbed in the column until the breakthrough and saturation times (Equation (2)) [25].
F S B = 0 t b p 1 C t , P C 0 , P d t 0 t 1 C t , P C 0 , P d t
The adsorption capacity (qe in mg P/kg adsorbent), residence time (τ), mass transfer zone length (MTZ), and length of the unused bed (LUB) under dynamic conditions were calculated using Equations (3)–(6), respectively [26,27].
q e = Q C 0 , P m t = 0 t = t e 1 C t , P C 0 , P
τ = ε b V Q
M T Z = h 1 t b p t e x
L U B = h ( 1 F S B )
where Q (L/min) is the flow rate, m (kg) is the adsorbent mass, εb (-) is the bed void fraction, V (cm3) is the bed volume, and h (cm) is the bed height.
The Bohart-Adams [28], Thomas [29], and Yoon-Nelson [30] models are normally used to estimate kinetic parameters related to the adsorption process in dynamic systems. However, these models are mathematically equivalent and can be expressed in terms of a logistic equation (Equation (7)), as discussed by Chu [31]. These models are used to overcome some difficulties arising from the mathematical solution of the intraparticle diffusion models. Indeed, these models were developed based on simplifying hypotheses, making them less complex and time-consuming while still providing accurate predictions.
C t , P C 0 , P = 1 1 + exp ( a b t )
where a and b are general parameters of the logistic equation. The logistic equation was fitted to the experimental data to estimate parameters (a and b). The equations and parameters of the Bohart-Adams, Thomas, and Yoon-Nelson models, expressed in terms of the logistic equation, are presented in the Supplementary Materials.

2.2.1. Experimental Design Planning

An experimental design was carried out by changing two important variables in the adsorption process: flow rate (5–10 mL/min) and bed height (20–40 cm). The initial concentration of soluble reactive P in the sample was approximately 40 mg/L. However, in this experimental design, the concentration was adjusted to approximately 10 mg P/L to simulate the integration of adsorption following chemical precipitation, as discussed in the Introduction section and illustrated in Figure 1.
A full factorial design was applied, as summarized in Table 2, with a total of nine runs. The adsorption process was optimized to minimize Δtads and reduce the unused fraction of the bed while maximizing the FSB. The results were analyzed using JMP Statistical Discovery software (version 17), and the standard least-squares regression method allowed the development of different models and established optimal conditions.

2.2.2. Influence of Feed Concentration and Co-Existing Ions

The influence of different P feed concentrations (1, 10, and 40 mg P/L; original concentration) was tested to evaluate the feasibility of implementing this process at different locations in the WWTP. In addition, previous batch experiments [18] have revealed a strong influence on the selectivity of the adsorbent for P in the presence of SO42− (560 mg/L). Thus, experiments in a fixed-bed column were carried out to determine the concentration of this ion in the solution as a function of time (a similar breakthrough curve, but for SO42− instead of P). These experiments were conducted at 20 ± 1 °C with a flow rate of 5 mL/min and bed height of 30 cm.

2.3. Scale-Up Design

The height of the large-lab-scale column was obtained according to the geometric, kinematic, and dynamic similarity criteria. Based on the geometric criteria, the ratio between the bed height and column diameter for both cases (lab-scale-column—h/d and large-lab-scale column—H/D) was kept constant. In addition, the superficial fluid velocity was maintained constant in both cases to ensure the same mass transfer and hydrodynamic conditions [26]. The large lab-scale column diameter was set to 4 cm. Considering the optimal conditions obtained in the design of experiments (h = 30 cm, Q = 5 mL/min), the bed height of the large-scale column was set at 60 cm, and the flow rate at 20 mL/min. The large-lab-scale column experiment was conducted at 20 ± 1 °C with an initial P concentration of 10 mg/L.
The length of the unused bed (LUB) method was employed to calculate the main parameters to operate in an industrial-scale column based on previous large-lab-scale results. According to this method, if the adsorption stops at the breakthrough point, part of the adsorbent capacity remains unused. This fraction is proportional to the distance between the location of the stoichiometric front (hst) and the bed height at the lab-scale (h), as shown in Equation (8),
L U B = h h s t
In summary, LUB is related to the adsorption rate, and as the mass transfer processes become slower, LUB becomes longer [15]. Considering that hst moves at the same velocity as the real front, the travel velocity (uz) can be defined using either tbp or tst, as shown in Equation (9).
u z = h s t t b p = h t s t
Combining Equations (8) and (9) the Equation (10), may be obtained,
L U B = u z t s t t b p = t s t t b p t s t h
By rearranging Equation (10), it is possible to determine a relationship to calculate the breakthrough time for different bed heights.
t b p = 1 u z ( h L U B )

3. Results and Discussion

3.1. Optimization of Phosphorus Adsorption in Fixed-Bed Column

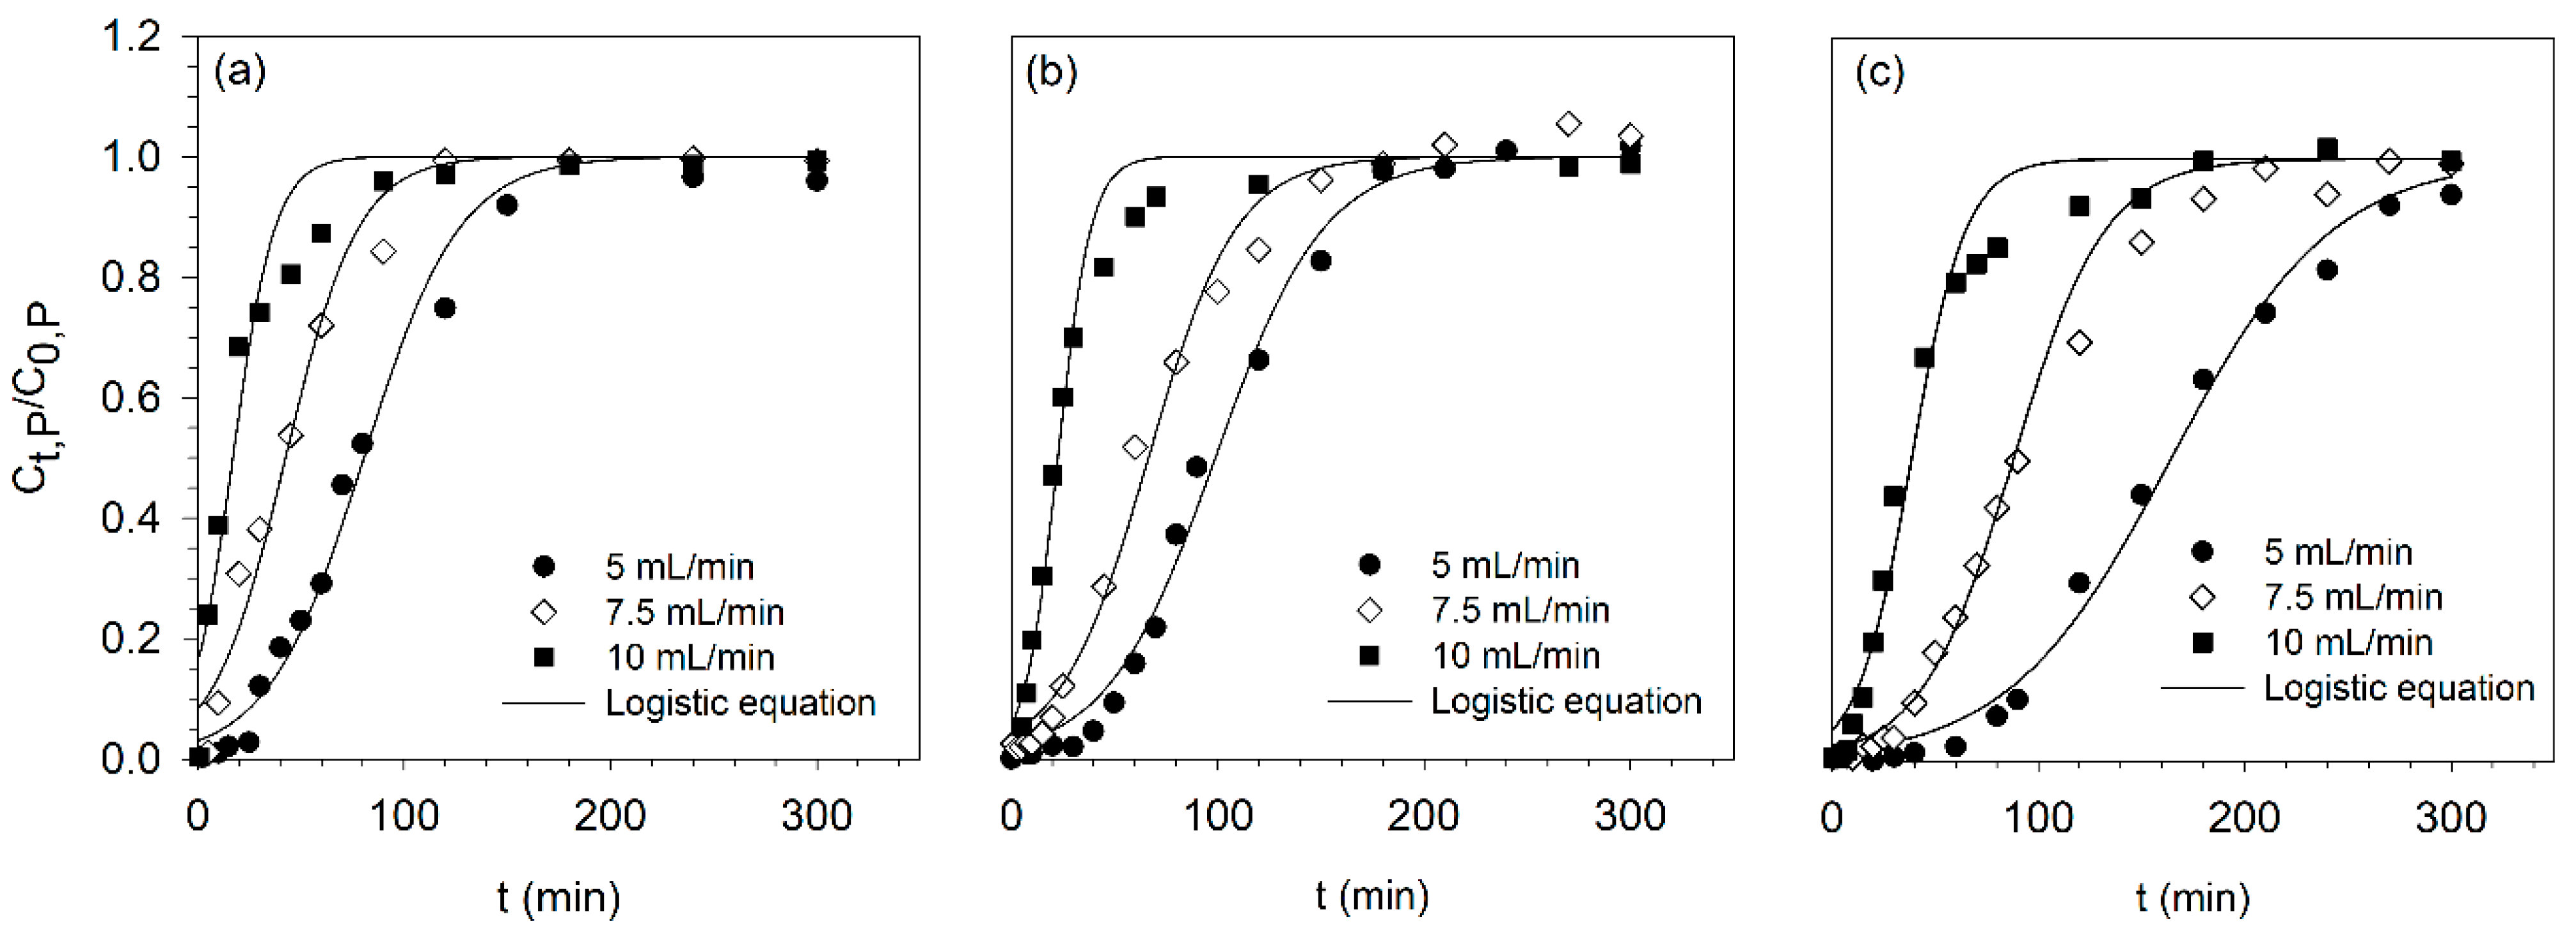
In this study, the effects of bed height and flow rate (and consequently, fluid superficial velocity) were optimized owing to their relevance to the design of a fixed-bed adsorption system. Figure 2a–c show the experimental breakthrough curves under different initial conditions, that is, different heights. From the data in Figure 2, Table 3 indicates that by increasing the flow rate (or fluid superficial velocity) at a constant bed height, the most relevant times (tbp, tex, tst, and Δtads) decreased significantly. For example, for a bed height of 20 cm, the exhaustion time was reduced from 148 min to 87 min by doubling the flow rate. This occurred because the contact time between the adsorbent and phosphate ions decreased when the superficial velocity increased, resulting in a lower mass transfer efficiency from the wastewater to the adsorbent. In contrast, for the same flow rate, the exhaustion time increased as the bed height increased because more active sites were available to bind the phosphate ions, and consequently, a broader mass transfer zone was observed.
The FSB increased with the bed height for the same flow rate but decreased with the flow rate for the same bed height. Indeed, the percentage ratio between LUB and h showed the highest value for the experiments with the lowest bed height (20 cm), where more than 90% of the bed was not used in the experiment at 10 mL/min. This percentage was the lowest (about 56%), with bed heights of 40 cm and 5 mL/min. Thus, the flow rate influences the bed utilization efficiency, and this parameter should not be too large to optimize the column use [32]. Regarding the adsorption capacity, the values did not exhibit a trend consistent with the change in h. The maximum qe values were obtained at 20 cm and 5 mL/min. Other study found that the breakthrough time and adsorption capacity decreased with increasing flow rate due to the presence of a mass transfer zone closer to the exit of the column [33]. In the present study, it was not possible to corroborate this statement for the adsorption capacity values when using 7.5 mL/min, despite the values being in the same order of magnitude. Nevertheless, the lowest adsorption capacity was observed at the highest flow rate (10 mL/min). This may be because lower flow rates led to higher residence times of P in the column. Consequently, longer contact between the wastewater and the adsorbent is achieved, helping to reach equilibrium before the ions move out of the column [34].
The previous results discussed from the design of experiments aimed at determining the optimal conditions for operating a lab-scale column using a few experiments and concluding which factor affects the process the most. These optimal conditions were used to scale up the process. The response parameters considered were FSB and Δtads, and the software JMP Statistical Discovery was used to assess the significance of the effects of h and Q on these parameters at a 95% confidence level. The response variables FSB and Δtads were influenced by both factors h and Q, with p-values of 0.0002 and 0.0013, respectively (for FSB), and 0.0173 and 0.0021, respectively (for Δtads). The quadratic terms did not significantly affect the behavior of the response variables. For the FSB, the flow rates have a greater influence on the data, while Δtads is more dependent on the bed height. Thus, the predictive models for FSB and Δtads without considering the quadratic terms, are shown in Equations (12) and (13)
F S B = 0.253 0.1255   Q + 0.0728   h
Δ t a d s = 121.32 17.592   Q + 31.908   h
where Q′ and h′ are the normalized variables. These predictive models will allow the determination of FSB and Δtads values for other initial operating conditions within the range studied in the present work (20 < h < 40 cm and 5 < Q < 10 mL/min). Figure 3 plots the experimental versus predicted values for FSB and Δtads, where it can be concluded that the former parameter is better predicted by the model (R2 = 0.985).
According to Table 4, the experimental and predicted results were similar, with relative errors below 10% in most cases. This indicates that the developed models are appropriate for determining the values of these two variables when experimental work cannot be carried out.
Two additional experiments were conducted (runs 10 and 11) to validate the models. The operating conditions were as follows: (i) run 10: h = 25 cm, Q = 8.5 mL/min, and (ii) run 1: h = 35 cm, Q = 6.5 mL/min.
This set of experiments was aimed at determining the optimal operating conditions for the scale-up of the system. Considering the maximization of FSB and minimization of the time between exhaustion and breakthrough (Δtads), the analytical optimal solutions given by the software were found when h = 30 cm and Q = 5 mL/min. These conditions will form the basis for proceeding with the experiments and scaling up the process.

3.2. Effect of Feed Concentration on Breakthrough Curve

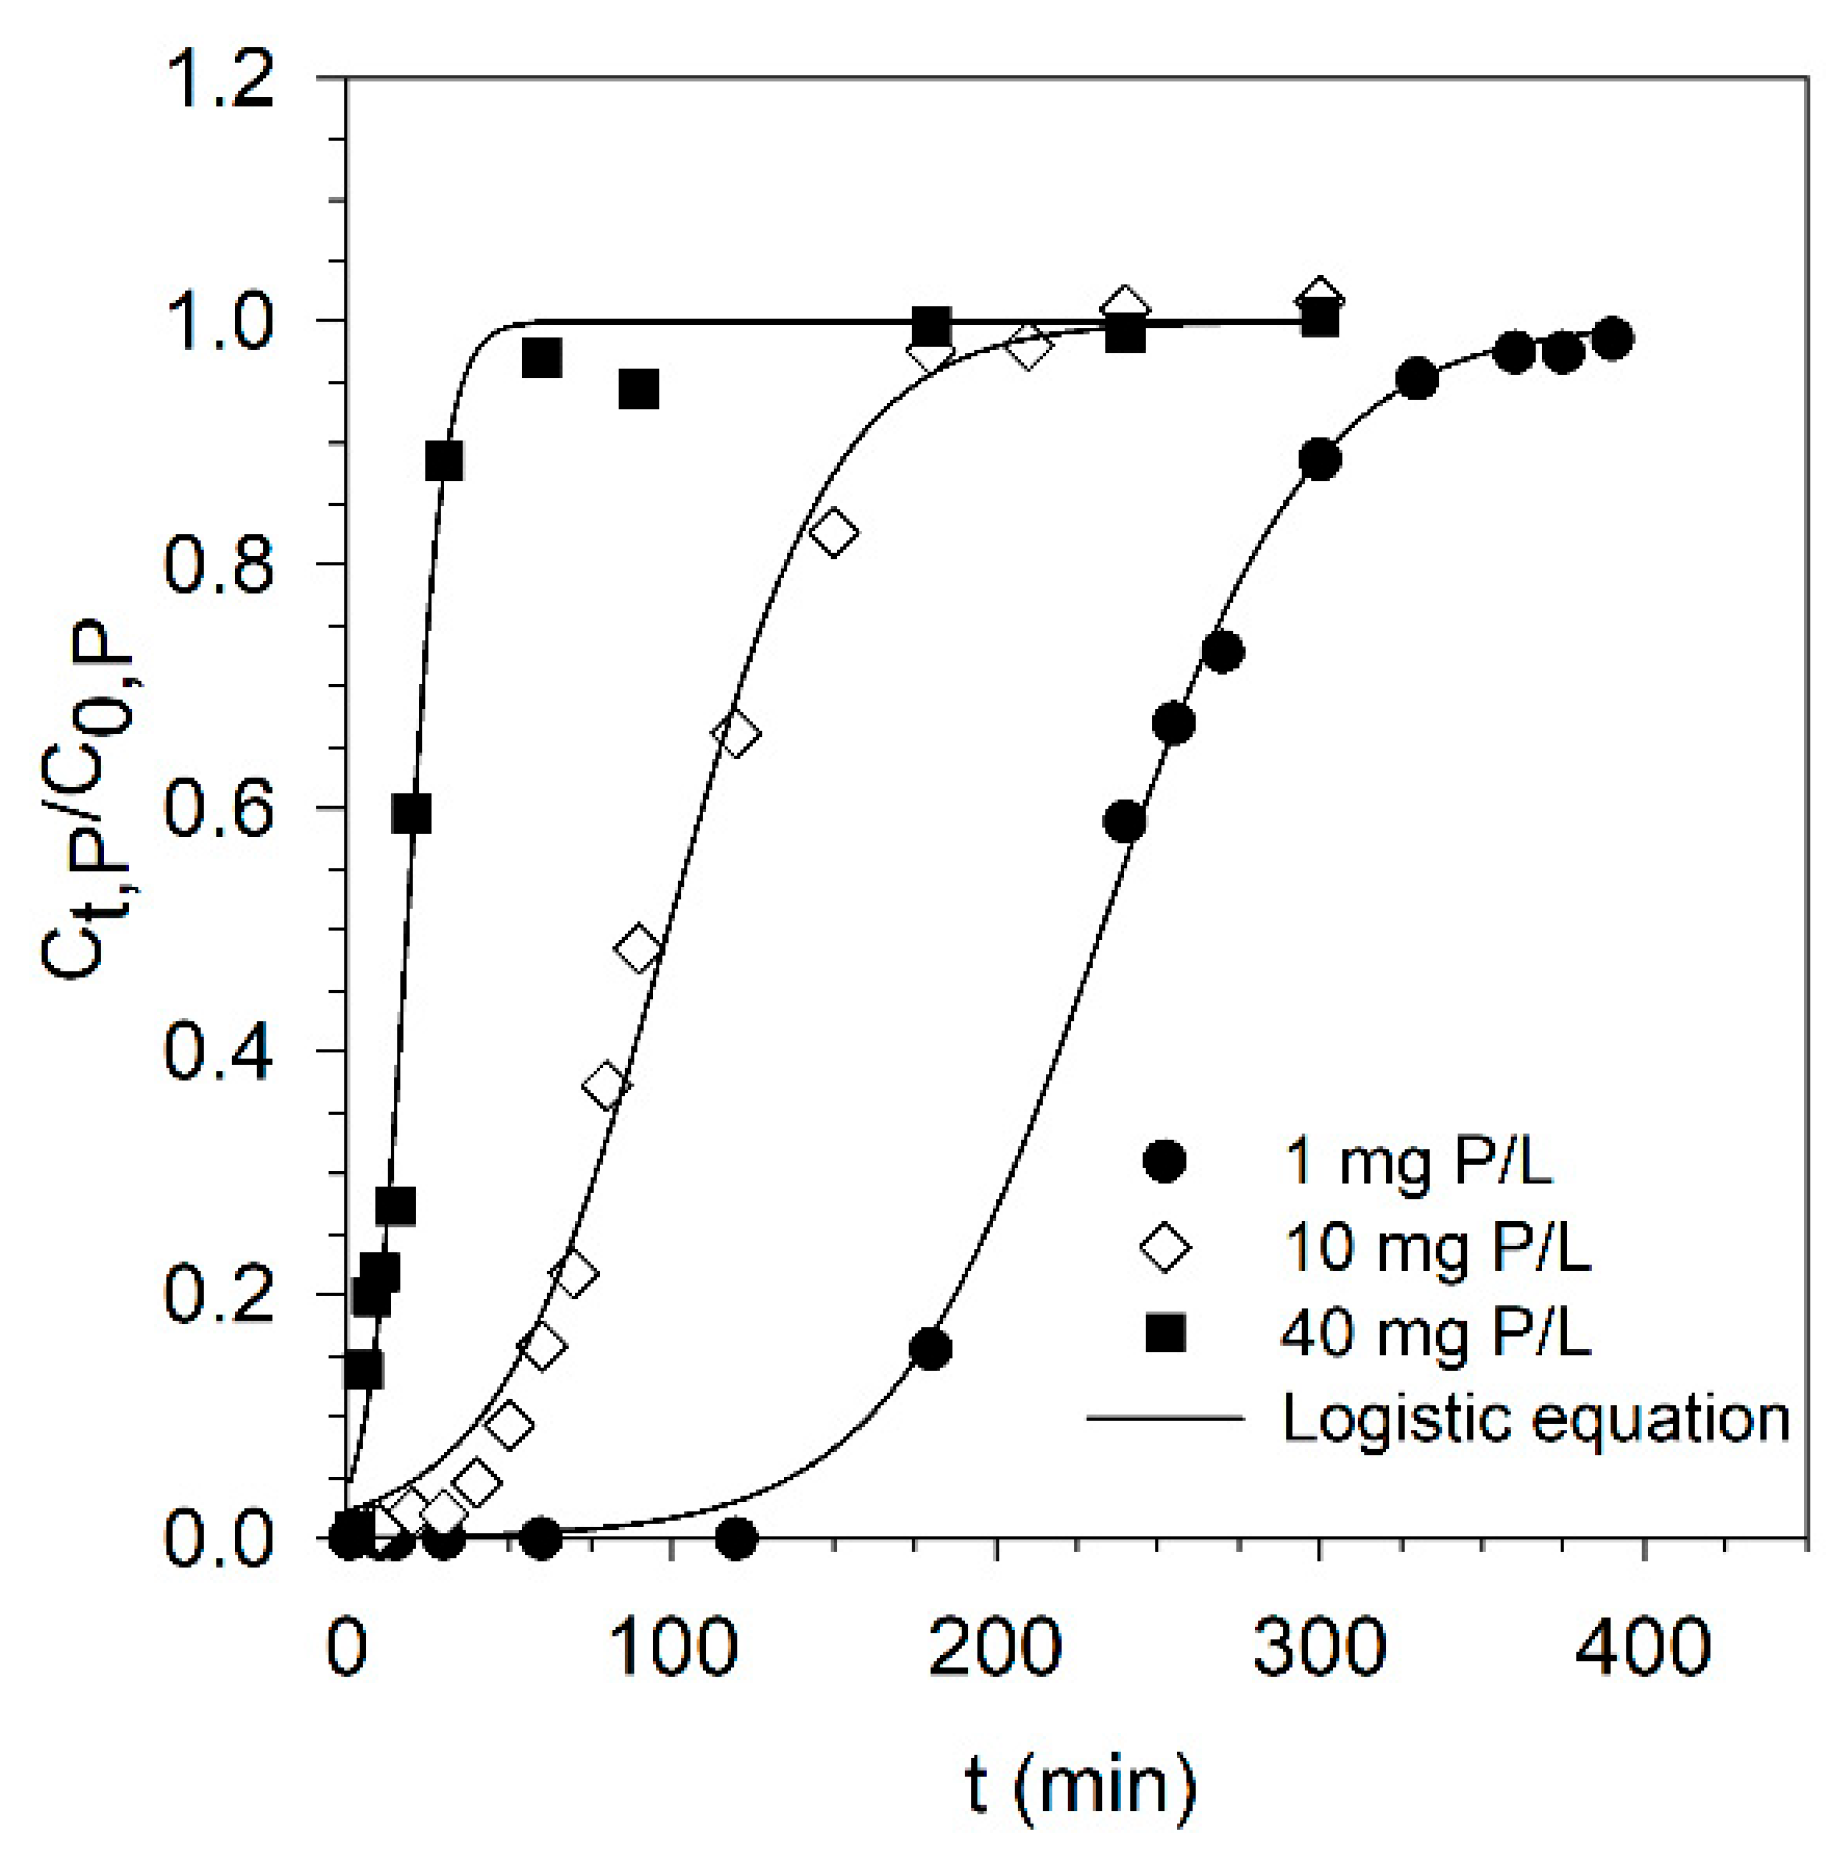
The performance of the adsorbent at different feed concentrations was tested, as shown in Figure 4 and Table 5, to evaluate the possibility of implementing the adsorption system at different locations in the WWTP. Experiments with a feed concentration of 10 mg P/L were conducted to evaluate the viability of implementing this process after chemical precipitation to form struvite [35], combining two processes (precipitation and adsorption) to recover P and reduce its concentration to the minimum possible.
As expected, the breakthrough time decreased sharply from around 140 to 3 min as the P concentration increased from 1 to 40 mg/L. The breakthrough curve becomes steeper, and the adsorbent reaches saturation faster, resulting in shorter exhaustion times. This behavior is likely due to the reduced mass transfer resistance at higher P concentrations [25,34,36]. In addition, the FSB value is low when the column is fed at an initial concentration of 40 mg P/L. Around 85% of the bed is not used during the process. Thus, under these conditions, the adsorption process using CES700 is not advantageous. Its application is recommended for streams with concentrations between 1 and 10 mg P/L to maximize the efficiency of the adsorbent. The most effective way to apply this technique to WWTP is through its integration with chemical precipitation, implementing adsorption as a complementary step in a combined strategy.
Regarding the influence of coexisting SO42− ions, it was not possible to determine a breakthrough curve due to the difference in the magnitude of the ion concentrations. The inlet and outlet concentrations of SO42− were the same for about 300 min of the experiment (Q = 5 mL/min, h = 30 cm), contrary to what was found previously in batch experiments [18]. The observed difference in SO42− interference between the batch and fixed-bed experiments may be due to the longer contact time in batch systems, which allows greater competition between sulfate ions and phosphate ions. In contrast, continuous flow and shorter contact times in fixed-bed systems may limit such competition. However, further studies are required to understand this behavior better.

3.3. Simulation of Sorption Data

Table 6 summarizes the parameters obtained from the logistic equation fitting and for the Bohart-Adams, Thomas, and Yoon-Nelson models (also see Supplementary Materials, Figure S1). As shown in Figure 2 and Figure 4, the logistic equation accurately describes the experimental data. When the Logistic equation parameters are used to predict the empirical model parameters, it can be concluded that the Bohart-Adams models do not correctly represent the experimental data, especially regarding the experimental adsorption capacity and the adsorption capacity determined by the model. The relative errors were higher than 60% in almost all runs (except for runs 12 and 13). In contrast, the Thomas and Yoon-Nelson models showed a better prediction of the experimental data. Thus, these two models can be used confidently to predict the breakthrough curves for the same adsorbent/adsorbate system on large-scale columns. The rate constants of the different models (kba, kth, and kyn) increased with superficial velocity and decreased with increasing bed height. In addition, for the same bed height and superficial velocity (Runs 2 and 12), these constants decreased for higher feed concentrations. Regarding τyn found by the Yoon-Nelson model adjustment, these values are quite close to those found experimentally (t50%). As expected, a lower τyn is observed for higher superficial velocities (Runs 7, 8, and 9) since the adsorbent saturates faster under these conditions.

3.4. Scale-Up

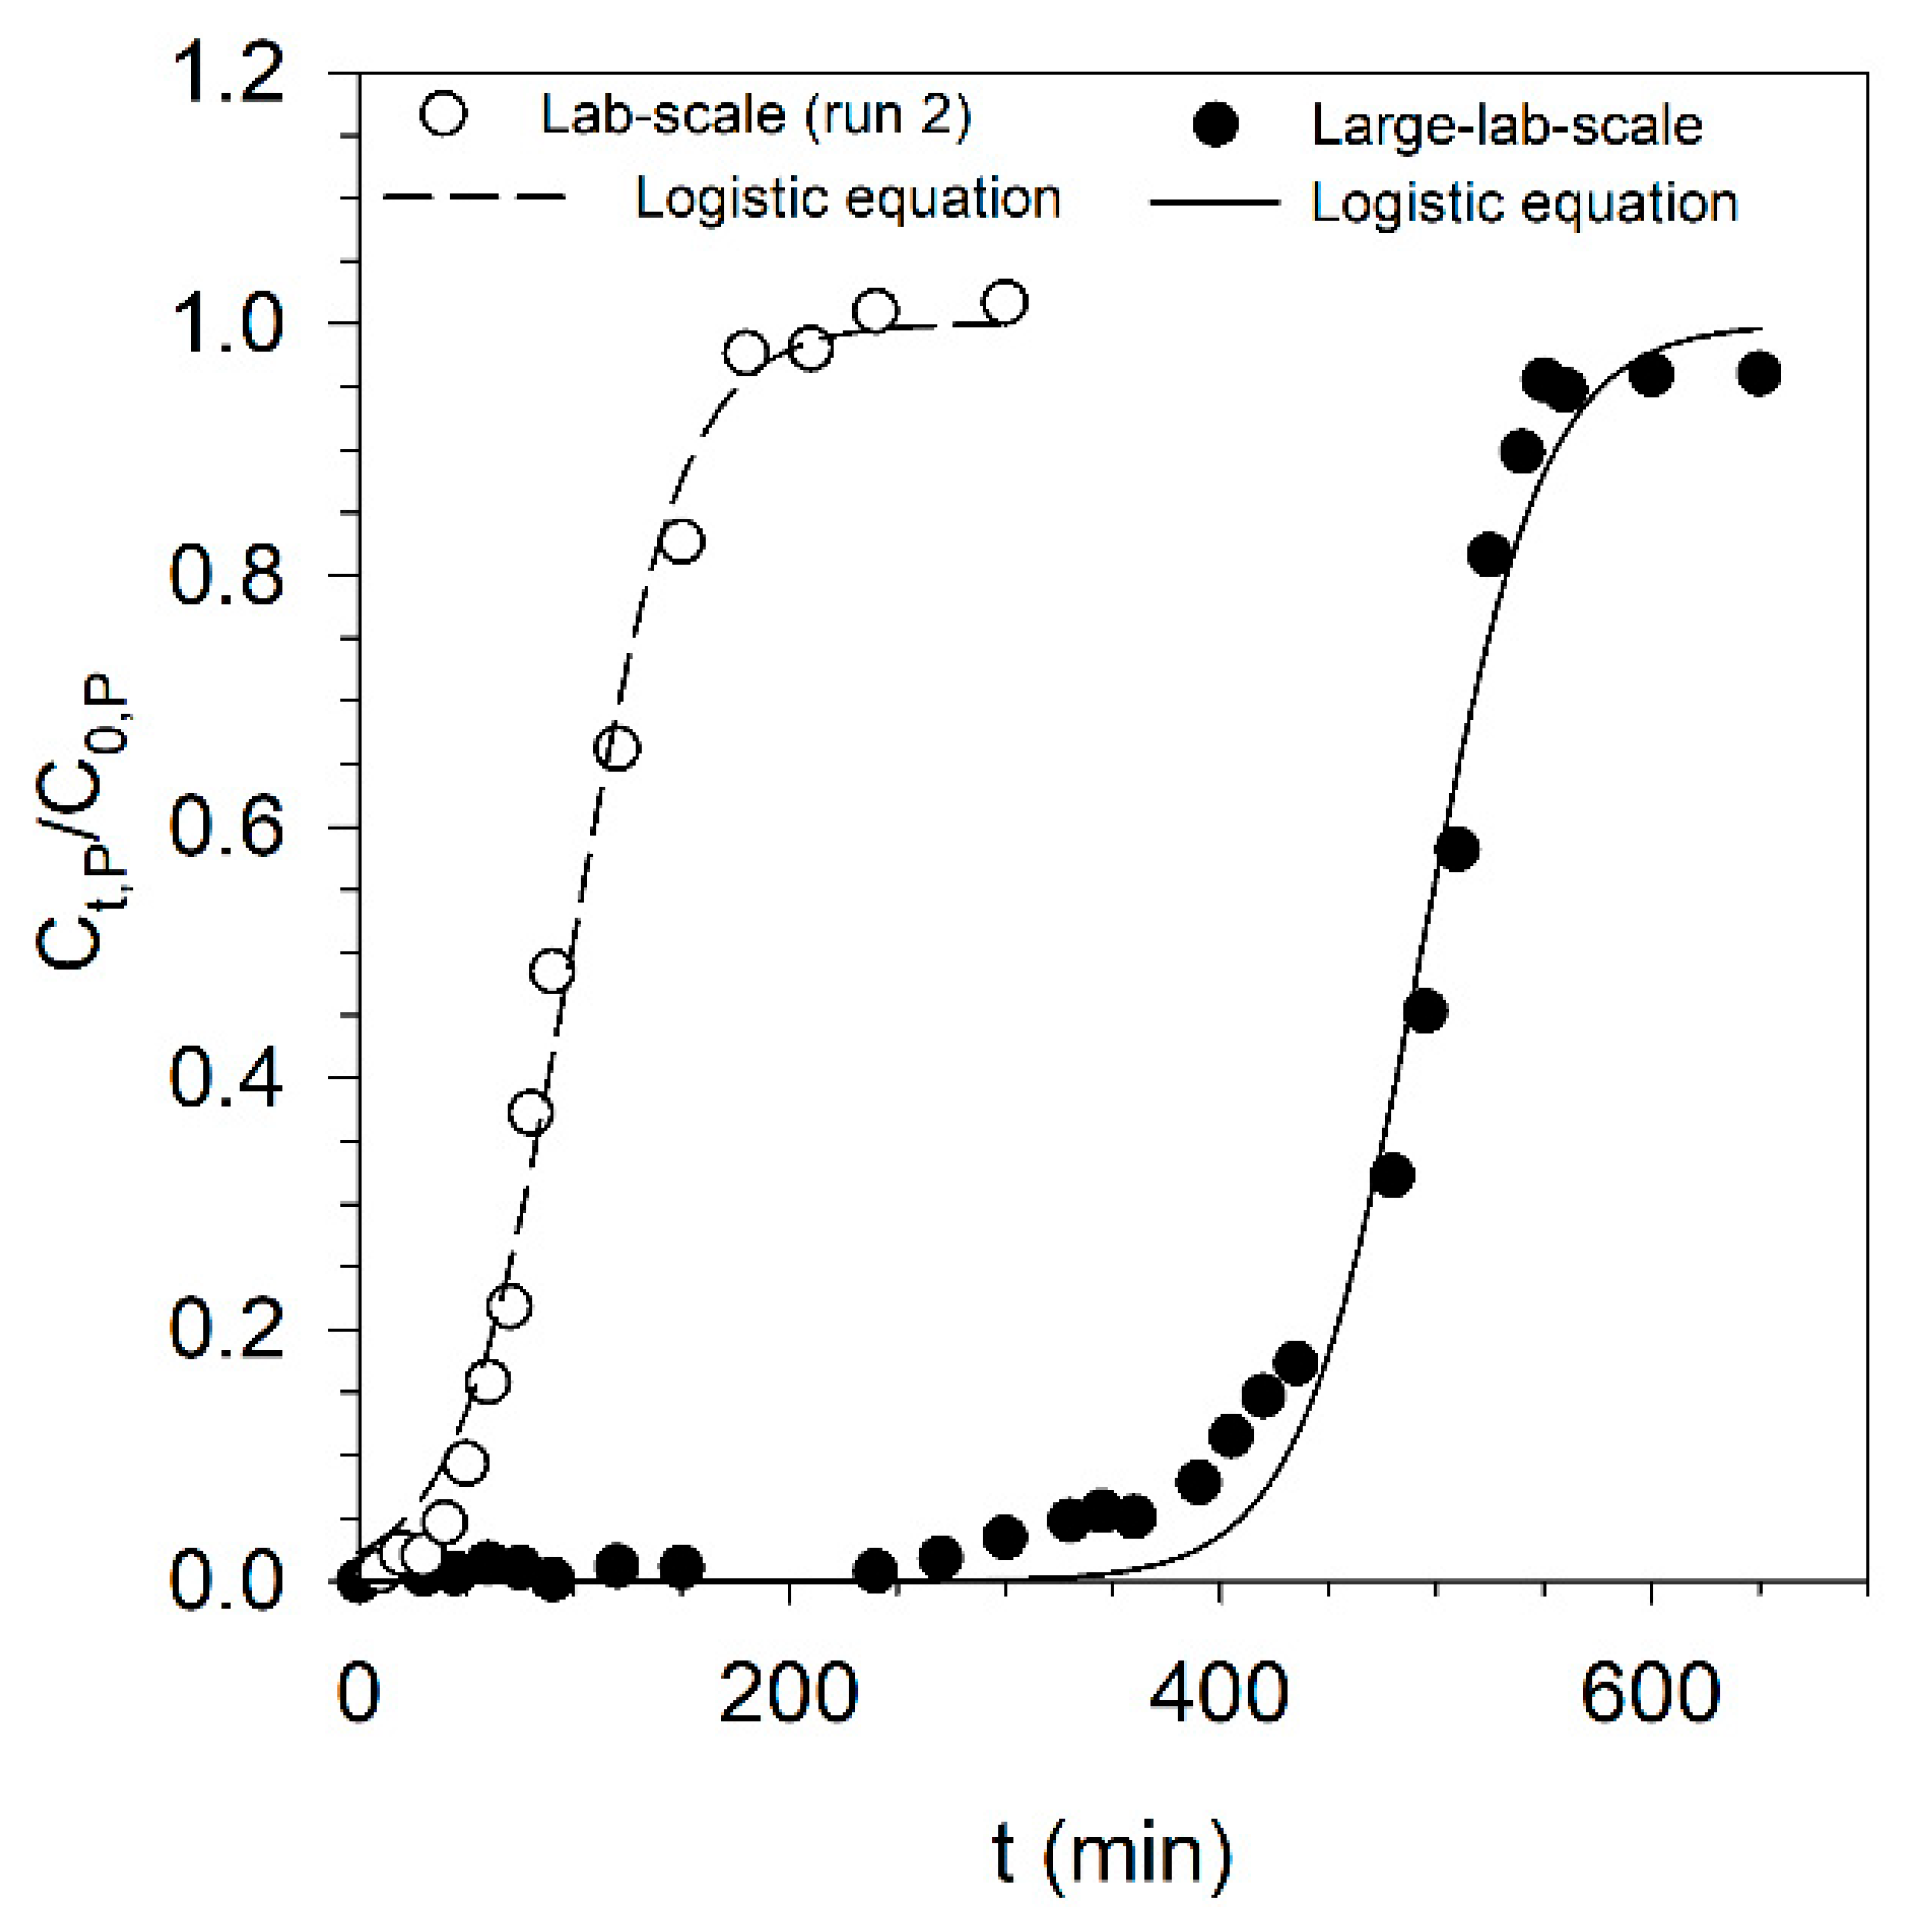
Considering the criteria previously described in Section 2.3, the scale-up experiment was conducted with a large lab-scale column with a 60 cm bed height (H) and a 4 cm internal diameter (D). The flow rate was kept constant at 20 mL/min, assuming that the superficial fluid velocity was constant in both scenarios (lab and large-scale). As the determination of the large-scale bed dimensions was set based on the optimal conditions determined in the lab-scale experiments (Q = 5 mL/min, h = 30 cm), the breakthrough curves of both experiments are shown in Figure 5.
The experimental data indicated that the breakthrough time was approximately 300 min, which is about eight times higher than that found at the lab-scale (run 2). However, the rate constants predicted by the models were of the same order in both cases (Table 6 and Table 7), and the breakthrough curves have a similar shape. This scale-up experiment showed that it is possible to achieve higher FSB (increased from 0.425 to 0.764) and adsorption capacity values (increased from 70.9 to 84.1 mg/kg) than in the best conditions at the lab scale. The improvement in the FSB observed after scaling up can be attributed to factors such as enhanced mass transfer efficiency and improved bed packing in the larger column. These factors likely contributed to the more effective utilization of the adsorbent at that scale. The percentage of unused beds relative to the height of the bed decreased from 58 to 40% after scaling up the process. In addition, it was possible to maintain the effluent with final concentrations below 0.5 and 0.7 mg P/L (Urban Wastewater Treatment Directive—Directive (EU) 2024/3019) for 400 and 435 min of operation, respectively.
Some studies have investigated the removal of P using other low-cost adsorbents. A literature study reported that an adsorbent derived from leftover coal materials effectively removed P from a solution with an initial concentration of 25 mg/L under a flow rate of 1 mL/min and a bed height of 8 cm. The total phosphate and sorption capacity of the coal-based material was approximately 243 mg/kg [10]. In another study, calcium-modified attapulgite achieved a maximum adsorption capacity of 13.5 mg/g (equivalent to 13,500 mg/kg), as estimated by the Thomas model [32]. However, these values may be overestimated, as the experiments were conducted using synthetic wastewater, which lacks the complexity and competing interaction characteristics of real wastewater matrices considered in the present study.
According to the results of both scales, the goal is to predict whether it is viable to operate CES700 in an industrial column and for how long. The LUB method, Equations (8)–(11), was used to simulate this behavior, assuming that the LUB and uz at the industrial scale are equal to those found in the large-lab-scale experiment. If a bed height of 1 m was intended for use on an industrial scale, the expected tbp and tst values would be around 600 and 730 minThe diameter of an industrial column can also be estimated. For that, the superficial velocity (0.01592 m/min) was maintained under optimal conditions (Run 2) and large-lab-scale conditions, and a treated flow rate of about 50 m3/day was assumed after the anaerobic digestion process [19]. Due to the reasonable scale-up reasons, it was assumed that this flow rate would be treated in five parallel columns. According to these considerations, the estimated column diameter was 0.75 m. These results and lab-scale models offer useful insights. However, to improve the accuracy of full-scale design, this information should be complemented by pilot-scale on-site experiments and the application of mechanistic models to achieve a realistic interpretation of mass transfer mechanisms.

4. Conclusions

This study contributes to addressing the new EU directives on nutrient recovery and water preparation for reuse (Directive (EU) 2024/3019), with the added value of using real wastewater, an aspect often overlooked in many studies. The dual-P recovery system was validated, and it was concluded that the effectiveness of this low-cost adsorbent was significantly enhanced when applied to the treated stream following chemical precipitation.
The lab-scale experimental design showed, with 95% confidence, that both the operating parameters, bed height, and flow rate significantly affect the fraction of saturated bed and adsorption time. The optimal conditions for maximizing FSB and minimizing Δtads were found to be h = 30 cm and Q = 5 mL/min. Tests with different initial P concentrations (1, 10, and 40 mg P/L) showed that adsorption with CES700 is not feasible for streams with concentrations above 10 mg P/L, such as those after centrifugation, confirming previous batch study results [14]. Approximately 86% of the bed remained unused at 40 mg P/L. Unlike the findings from batch experiments [14], the presence of SO42− ions in the effluent did not affect P removal under dynamic conditions with a bed height of 30 cm and a flow rate of 5 mL/min.
The scale-up experiments demonstrated the strong performance of the adsorbent, with the FSB increasing from 0.425 to 0.764 and the adsorption capacity improving from 70.9 to 84.1 mg P/kg under optimal lab-scale conditions. The unused fraction of the bed was reduced to only 40% of its height after scaling up. Additionally, the process consistently maintained effluent P concentrations below 0.5 and 0.7 mg P/L, thus meeting the discharge limits set by the Urban Wastewater Treatment Directive—Directive (EU) 2024/3019 for over 400 min of continuous operation.

Supplementary Materials

The following supporting information can be downloaded at: https://www.mdpi.com/article/10.3390/app15126761/s1, Figure S1: Bohart-Adams, Thomas, and Yoon-Nelson fitting for the design of experiments developed; Table S1: Characterization of wastewater sample and methods used; Table S2: Parameters of the models compared to the logistic equation parameters.

Author Contributions

Conceptualization, A.F.S., L.M.G.-F. and M.J.Q.; methodology, A.F.S., L.M.G.-F. and M.J.Q.; investigation, A.F.S.; writing—original draft preparation, A.F.S.; writing—review and editing, P.A., L.M.G.-F. and M.J.Q.; supervision, P.A., L.M.G.-F. and M.J.Q. All authors have read and agreed to the published version of this manuscript.

Funding

Andreia F. Santos acknowledges the Fundação para a Ciência e Tecnologia (FCT) for the Ph.D. Grant (2020.08213.BD). Andreia F. Santos, Licínio M. Gando-Ferreira, and Margarida J. Quina acknowledge the financial support to CERES (https://doi.org/10.54499/UIDB/00102/2020 and https://doi.org/10.54499/UIDP/00102/2020), financed by FCT through national funds. P. Alvarenga acknowledges the support of LEAF—Linking Landscape, Environment, Agriculture and Food Research Centre (Ref. UIDB/04129/2020 and UIDP/04129/2020) and the Associate Laboratory TERRA).

Institutional Review Board Statement

Not applicable.

Informed Consent Statement

Not applicable.

Data Availability Statement

The original contributions presented in this study are included in the article/supplementary material. Further inquiries can be directed to the corresponding author(s).

Conflicts of Interest

The authors declare no conflicts of interest.

References

  1. De Boer, M.A.; Wolzak, L.; Slootweg, J.C. Phosphorus Recovery and Recycling, 1st ed.; Ohtake, H., Tsuneda, S., Eds.; Springer: Singapore, 2019; ISBN 978-981-10-8030-2. [Google Scholar]
  2. Cieślik, B.; Konieczka, P. A review of phosphorus recovery methods at various steps of wastewater treatment and sewage sludge management. The concept of “no solid waste generation” and analytical methods. J. Clean. Prod. 2017, 142, 1728–1740. [Google Scholar] [CrossRef]
  3. Huygens, D.; Saveyn, H. Agronomic efficiency of selected phosphorus fertilisers derived from secondary raw materials for European agriculture. A meta-analysis. Agron. Sustain. Dev. 2018, 38, 38–52. [Google Scholar] [CrossRef]
  4. Carrillo, V.; Fuentes, B.; Gómez, G.; Vidal, G. Characterization and recovery of phosphorus from wastewater by combined technologies. Rev. Environ. Sci. Biotechnol. 2020, 19, 389–418. [Google Scholar] [CrossRef]
  5. Mayer, N.; Kaltschmitt, M. Closing the phosphorus cycle: Current P balance and future prospects in Germany. J. Clean. Prod. 2022, 347, 131272. [Google Scholar] [CrossRef]
  6. European Commission. Study on the Critical Raw Materials for the EU 2023: Final Report; European Commission: Brussels, Belgium, 2023. [Google Scholar]
  7. European Commission. Critical Raw Materials Act. Available online: https://single-market-economy.ec.europa.eu/sectors/raw-materials/areas-specific-interest/critical-raw-materials/critical-raw-materials-act_en (accessed on 11 June 2024).
  8. Santos, A.F.; Alvarenga, P.; Gando-Ferreira, L.M.; Quina, M.J. Urban Wastewater as a Source of Reclaimed Water for Irrigation: Barriers and Future Possibilities. Environments 2023, 10, 17. [Google Scholar] [CrossRef]
  9. Santos, A.F.; Abreu, R.L.; Alvarenga, P.; Gando-Ferreira, L.M.; Quina, M.J. An innovative two-step methodology for struvite recovery from wastewater with high purity and agronomic potential. J. Water Process Eng. 2024, 67, 106206. [Google Scholar] [CrossRef]
  10. Mekonnen, D.T.; Alemayehu, E.; Lennartz, B. Fixed-Bed Column Technique for the Removal of Phosphate from Water Using Leftover Coal. Materials 2021, 14, 5466. [Google Scholar] [CrossRef]
  11. Negrea, A.; Mihailescu, M.; Mosoarca, G.; Ciopec, M.; Duteanu, N.; Negrea, P.; Minzatu, V. Estimation on Fixed-Bed Column Parameters of Breakthrough Behaviors for Gold Recovery by Adsorption onto Modified/Functionalized Amberlite XAD7. Int. J. Environ. Res. Public Health 2020, 17, 6868. [Google Scholar] [CrossRef]
  12. Sun, C.; Cao, H.; Huang, C.; Wang, P.; Yin, J.; Liu, H.; Tian, H.; Xu, H.; Zhu, J.; Liu, Z. Eggshell based biochar for highly efficient adsorption and recovery of phosphorus from aqueous solution: Kinetics, mechanism and potential as phosphorus fertilizer. Bioresour. Technol. 2022, 362, 127851. [Google Scholar] [CrossRef]
  13. Sun, C.; Huang, C.; Wang, P.; Yin, J.; Tian, H.; Liu, Z.; Xu, H.; Zhu, J.; Hu, X.; Liu, Z. Low-cost eggshell-fly ash adsorbent for phosphate recovery: A potential slow-release phosphate fertilizer. Water Res. 2024, 255, 121483. [Google Scholar] [CrossRef]
  14. Photiou, P.; Poulizou, M.; Vyrides, I. Recovery of phosphates from anaerobic MBR effluent using columns of eggshell and seagrass residues and their final use as a fertilizer. Sustain. Chem. Pharm. 2023, 33, 101039. [Google Scholar] [CrossRef]
  15. Worch, E. Adsorption Technology in Water Treatment, 1st ed.; De Gruyter: Berlin, Germany, 2012. [Google Scholar]
  16. Muscarella, S.M.; Trapani, D.D.; Laudicina, V.A.; Mannina, G. Phosphorus recovery from ultrafiltered membrane wastewater by biochar adsorption columns: The effect of loading rates. Heliyon 2024, 10, e34659. [Google Scholar] [CrossRef]
  17. Pap, S.; Karmann, C.; Thompson, T.; McConnell, R.; Kennedy, T.; Taggart, M.A. Insights into phosphate removal and recovery from wastewater using biosolids biochar: Pyrolysis optimisation, mechanistic and column studies. J. Water. Proc. Eng. 2025, 75, 107954. [Google Scholar] [CrossRef]
  18. Santos, A.F.; Lopes, D.V.; Alvarenga, P.; Gando-Ferreira, L.M.; Quina, M.J. Phosphorus removal from urban wastewater through adsorption using biogenic calcium carbonate. J. Environ. Manag. 2024, 351, 119875. [Google Scholar] [CrossRef]
  19. Santos, A.F.; Alvarenga, P.; Gando-Ferreira, L.M.; Quina, M.J. Phosphorus concentration and speciation in urban wastewater for potential recovery. In WASTES: Solutions, Treatments and Opportunities IV; CRC Press: Boca Raton, FL, USA, 2023; ISBN 9781003345084. [Google Scholar]
  20. European Commission. Electricity Price Statistics. Available online: https://ec.europa.eu/eurostat/statistics-explained/index.php?title=Electricity_price_statistics (accessed on 6 May 2025).
  21. Pap, S.; Kirk, C.; Bremner, B.; Sekulic, M.T.; Gibb, S.W.; Maletic, S.; Taggart, M.A. Synthesis optimisation and characterisation of chitosan-calcite adsorbent from fishery-food waste for phosphorus removal. Environ. Sci. Pollut. Res. 2020, 27, 9790–9802. [Google Scholar] [CrossRef]
  22. Zhang, M.; He, M.; Chen, Q.; Huang, Y.; Zhang, C.; Yue, C.; Yang, L.; Mu, J. Feasible synthesis of a novel and low-cost seawater-modified biochar and its potential application in phosphate removal/recovery from wastewater. Sci. Total. Environ. 2020, 824, 153833. [Google Scholar] [CrossRef]
  23. Silva, B.; Martins, M.; Rosca, M.; Rocha, V.; Lago, A.; Neves, I.C.; Tavares, T. Waste-based biosorbents as cost-effective alternatives to commercial adsorbents for the retention of fluoxetine from water. Sep. Purif. Technol. 2020, 235, 116139. [Google Scholar] [CrossRef]
  24. Santos, A.F.; Arim, A.L.; Lopes, D.V.; Gando-Ferreira, L.M.; Quina, M.J. Recovery of phosphate from aqueous solutions using calcined eggshell as an eco-friendly adsorbent. J. Environ. Manag. 2019, 238, 451–459. [Google Scholar] [CrossRef]
  25. Arim, A.L.; Neves, K.; Quina, M.J.; Gando-Ferreira, L.M. Experimental and mathematical modelling of Cr(III) sorption in fixed-bed column using modified pine bark. J. Clean. Prod. 2018, 183, 272–281. [Google Scholar] [CrossRef]
  26. Vilardi, G.; Rodriguez-Rodriguez, J.; Ochando-Pulido, J.; di Palma, L.; Verdone, N. Fixed-bed reactor scale-up and modelling for Cr(VI) removal using nano iron-based coated biomass as packing material. Chem. Eng. J. 2019, 361, 990–998. [Google Scholar] [CrossRef]
  27. Juela, D.; Vera, M.; Cruzat, C.; Astudillo, A.; Vanegas, E. A new approach for scaling up fixed-bed adsorption columns for aqueous systems: A case of antibiotic removal on natural adsorbent. Process Saf. Environ. Prot. 2022, 159, 953–963. [Google Scholar] [CrossRef]
  28. Bohart, G.S.; Adams, E.Q. Some aspects of the beahvior of charcoal with repect to chlorine. J. Am. Chem. Soc. 1920, 42, 523–544. [Google Scholar] [CrossRef]
  29. Thomas, H.C. Heterogeneous ion exchange in a flowing system. J. Am. Chem. Soc. 1944, 66, 1664–1666. [Google Scholar] [CrossRef]
  30. Yoon, Y.H.; Nelson, J.H. Application of Gas Adsorption Kinetics I. A Theoretical Model for Respirator Cartridge Service Life. Am. Ind. Hyg. Assoc. J. 1984, 45, 509–516. [Google Scholar] [CrossRef]
  31. Chu, K.H. Breakthrough curve analysis by simplistic models of fixed bed adsorption: In defense of the century-old Bohart-Adams model. Chem. Eng. J. 2020, 380, 122513. [Google Scholar] [CrossRef]
  32. Lv, N.; Li, X. Phosphorus removal from wastewater using Ca-modified attapulgite: Fixed-bed column performance and breakthrough curves analysis. J. Environ. Manag. 2023, 328, 116905. [Google Scholar] [CrossRef]
  33. Jang, J.; Lee, D.S. Effective phosphorus removal using chitosan/Ca-organically modified montmorillonite beads in batch and fixed-bed column studies. J. Hazard. Mater. 2019, 375, 9–18. [Google Scholar] [CrossRef]
  34. Nguyen, T.A.H.; Ngo, H.H.; Guo, W.S.; Pham, T.Q.; Li, F.M.; Nguyen, T.V.; Bui, X.T. Adsorption of phosphate from aqueous solutions and sewage using zirconium loaded okara (ZLO): Fixed-bed column study. Sci. Total Environ. 2015, 523, 40–49. [Google Scholar] [CrossRef]
  35. Santos, A.F.; Mendes, L.S.; Alvarenga, P.; Gando-Ferreira, L.M.; Quina, M.J. Nutrient Recovery via Struvite Precipitation from Wastewater Treatment Plants: Influence of Operating Parameters, Coexisting Ions, and Seeding. Water 2024, 16, 1675. [Google Scholar] [CrossRef]
  36. Jurado-Davila, V.; De Oliveira, J.T.; Estumano, D.; Féris, L.A. Fixed-bed column for phosphate adsorption combining experimental observation, mathematical simulation, and statistics: Classical and Bayesian. Sep. Purif. Technol. 2023, 317, 123914. [Google Scholar] [CrossRef]
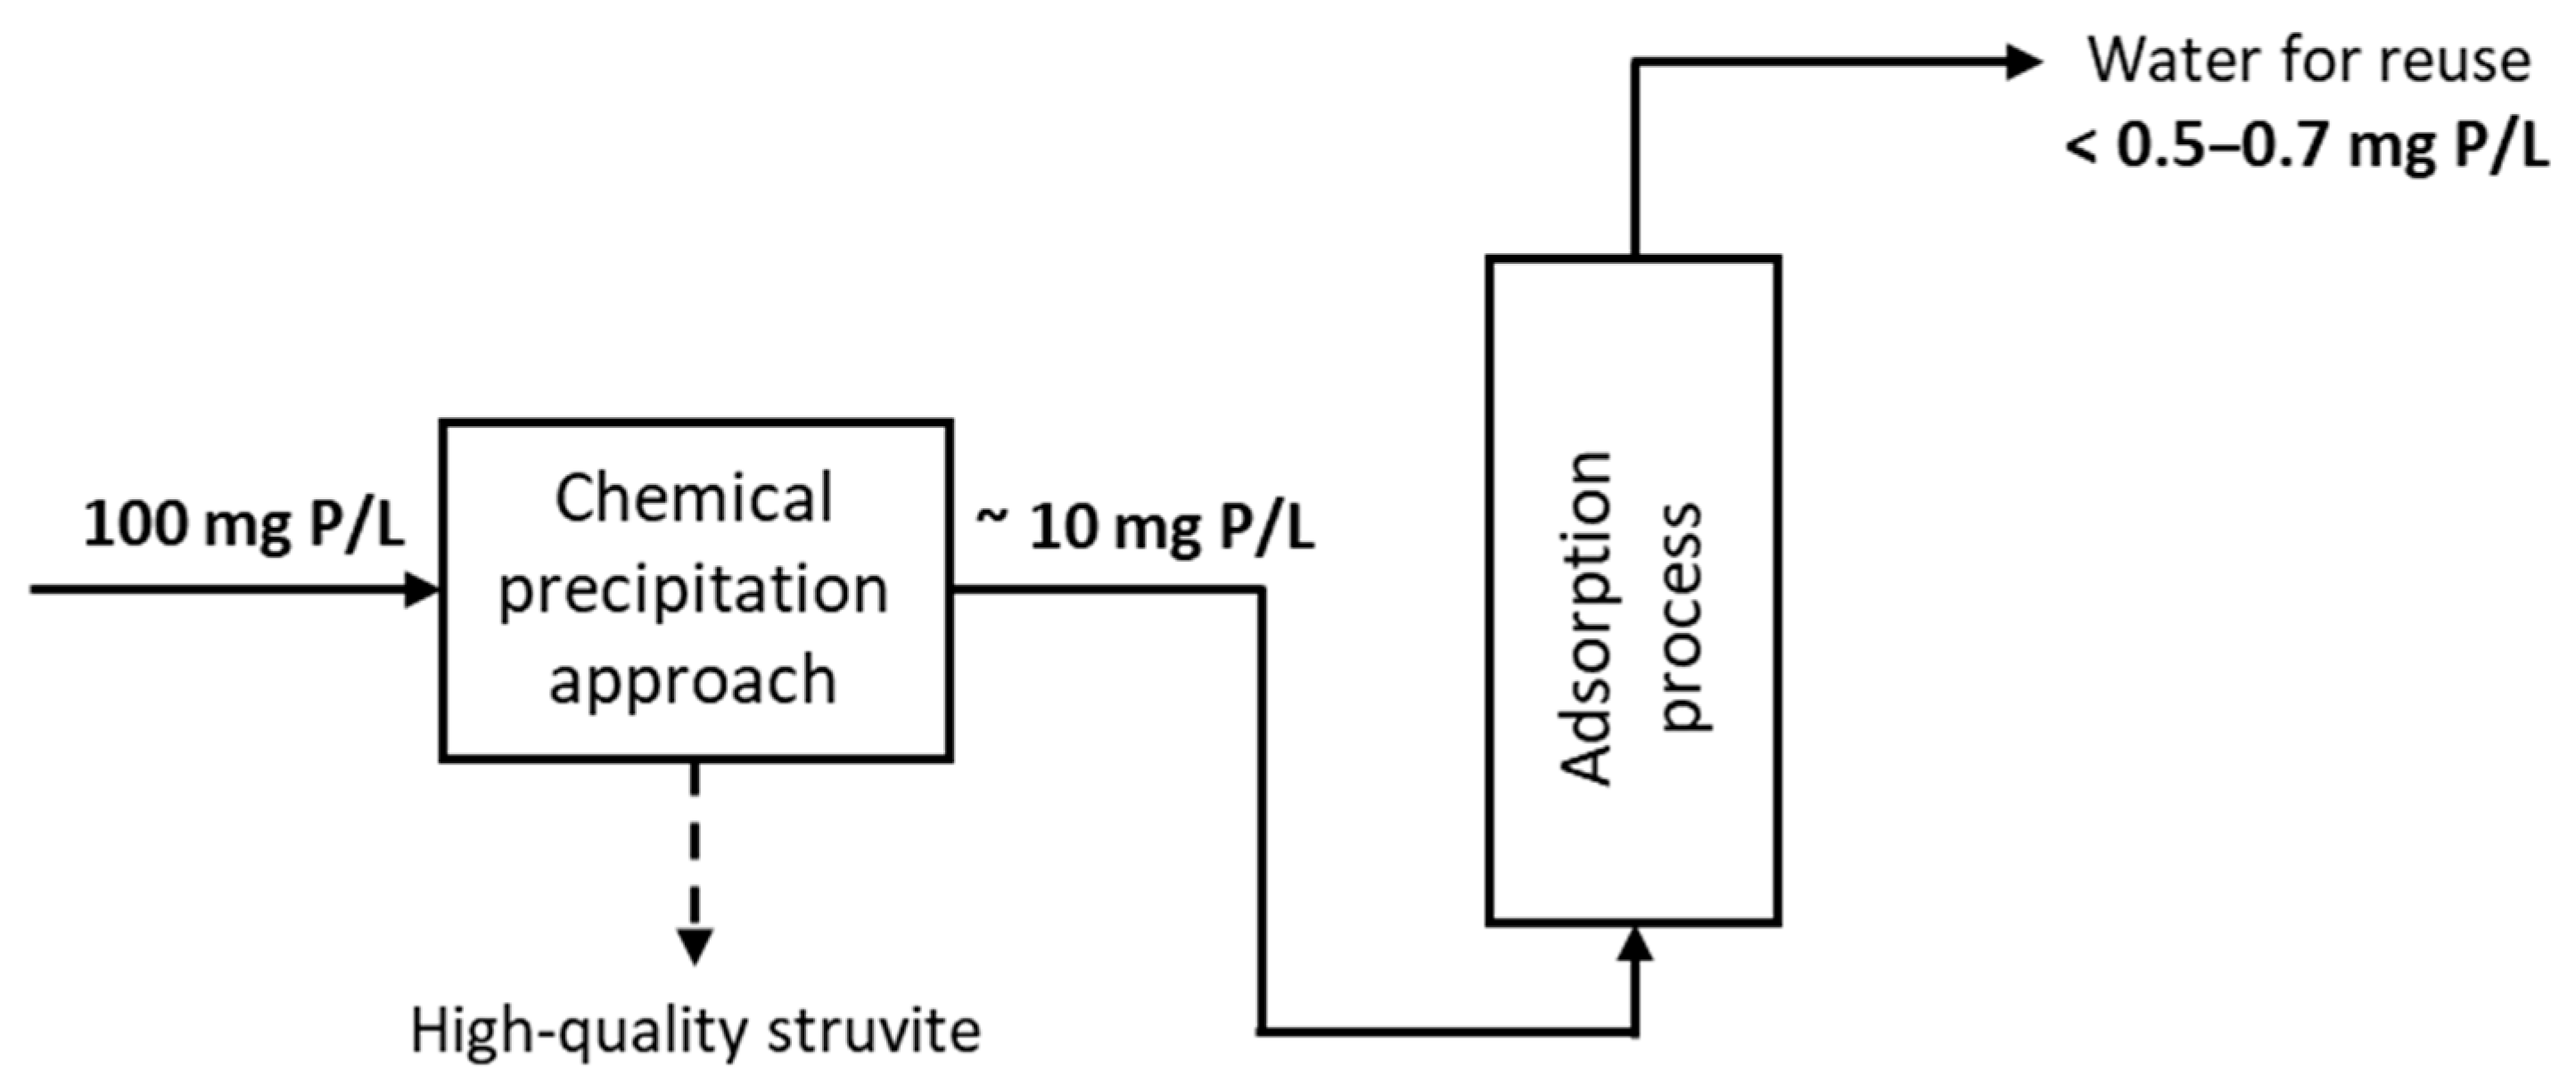
Figure 1. Schematic representation of the proposed integration of chemical precipitation [9] and adsorption as a dual phosphorus recovery strategy.
Applsci 15 06761 g001
Figure 2. Experimental breakthrough curves for different initial conditions: (a) h = 20 cm, (b) h = 30 cm, and (c) h = 40 cm [10 mg P/L, 20 ± 1 °C, pH 7.33], including fitting with Logistic Equation (7).
Applsci 15 06761 g002
Figure 3. Experimental versus predicted (a) FSB and (b) Δtads.
Applsci 15 06761 g003
Figure 4. Experimental breakthrough curve for different initial P concentrations in wastewater [Q = 5 mL/min; h = 30 cm; 20 ± 1 °C] and fitting with Logistic Equation (7).
Applsci 15 06761 g004
Figure 5. Breakthrough curves of lab-scale columns under optimum conditions (Q = 5 mL/min, h = 30 cm) and a large-lab-scale column (Q = 20 mL/min, H = 60 cm), and fitted with Logistic Equation (7) [10 mg P/L, 20 ± 1 °C, pH 7.33].
Applsci 15 06761 g005
Table 1. Characterization of the adsorbent (CES700) [18,24].
dp (mm)εbρb (g/cm3)pHpHzpcSBET (m2/g)Vpore (cm3/g)
0.5–1.190.520.70–0.759.848.431.830.003
dp—particle diameter; εb—bulk porosity; ρb—bulk density; pHzpc—pH of zero-point charge; SBET—BET specific area; Vpore—pore volume.
Table 2. Conditions of the experiments according to a full factorial design in a lab-scale column [10 mg P/L, 20 ± 1 °C, pH 7.33].
RunQ (mL/min)h (cm)RunQ (mL/min)h (cm)RunQ (mL/min)h (cm)
152047.52071020
253057.53081030
354067.54091040
Q—flow rate; h—bed height.
Table 3. Parameters calculated to assess the process performance for different initial conditions.
RunQ (mL/min)h (cm)tbp (min)tex (min)tst (min)Δtads (min)FSBqe (mg P/kg Adsorbent)MTZ (cm)tr (min)LUB (cm)
15.02026.114884.31220.30910716.56.6613.8
25.03040.416695.11260.42570.922.79.9917.3
35.04069.42661591960.43685.829.613.322.5
47.5207.4111146.91040.14991.218.74.4417.0
57.53016.514769.01310.23972.326.66.6622.8
67.54031.919098.51580.32594.733.38.8827.0
710201.7886.726.684.90.06758.719.63.3318.7
810304.8811032.81050.14937.428.75.0025.5
910409.3715846.51480.20166.637.66.6631.9
Q—flow rate; h—bed height (lab-scale); tbp—breakthrough time; tex—exhaustion time; tst—stoichiometric time; Δtads—difference between tex and tbp; FSB—fraction of saturated bed; qe—adsorption capacity; MTZ—mass transfer zone; tr—residence time; LUB—length of unused bed.
Table 4. Experimental and predicted results for FSB and Δtads.
RunFSB
Experimental
FSB
Predicted
REFSB (%)Δtads (min)
Experimental
Δtads (min)
Predicted
REΔtads (%)
10.3090.30901221210.82
20.4250.4054.701261389.52
30.4360.4554.361961855.62
40.1490.1575.371041040.00
50.2390.2535.881311217.63
60.3250.3036.771581686.33
70.0670.05813.484.985.91.18
80.1490.1543.361051031.90
90.2010.2041.491481501.35
100.2040.16718.211998.317.4
110.3520.3345.111551447.09
Relative error: R E = X exp X p r e d X e x p · 100 .
Table 5. Parameters calculated to assess the process performance for different initial P concentrations [Q = 5 mL/min; h = 30 cm; 20 ± 1 °C].
C0 (mg P/L)
1 (Run 12)10 (Run 2)40 (Run 13)
tbp (min)13940.43.34
tex (min)32916652.9
tst (min)22810123.7
Δtads (min)18912649.5
FSB0.6120.4250.141
qe (mg P/kg)17.570.960.1
MTZ (cm)17.322.728.1
LUB (cm)11.617.325.6
tbp—breakthrough time; tex—exhaustion time; tst—stoichiometric time; Δtads—difference between tex and tbp; FSB—fraction of saturated bed; qe—adsorption capacity; MTZ—mass transfer zone; LUB—length of unused bed.
Table 6. Parameters of the models fitted to breakthrough curves.
Logistic EquationBohart-Adams ModelThomas ModelYoon-Nelson Model
Runa
(-)
b
(1/min)
kba
(L/mg min)
qba
(mg/kg)
kth
(L/mg min)
qth
(mg/kg)
kyn
(1/min)
τyn
(min)
t50% (min)
13.4790.0430.00427.10.00494.20.04380.576.7
23.7710.0380.00422.30.00477.30.03898.992.6
34.1890.0260.00327.60.00389.90.026164159
42.4210.0570.00618.30.00664.50.05742.641.4
53.1270.0470.00521.10.00571.20.04766.558.9
63.9520.0450.00518.00.00562.30.04587.890.3
71.6660.0980.01012.20.01044.50.09817.113.8
82.8200.1250.0139.580.01330.60.12522.621.1
92.9440.0770.00811.20.00836.80.07738.533.9
127.1260.0310.0035.780.00318.50.031232228
133.1630.1710.01717.90.01759.10.17118.418.5
kba—rate constant of Bohard-Adams model; qba—maximum adsorption capacity of Bohard-Adams model; kth—rate constant of Thomas model; qth—maximum adsorption capacity of Thomas model; kyn—rate constant of Yoon-Nelson; τyn—time required to 50% of the bed saturation according to Yoon-Nelson model; t50%—experimental time required to 50% of the bed saturation.
Table 7. Parameters calculated to assess the process performance in a large lab-scale column, both experimentally and predicted [Q = 20 mL/min; H = 60 cm; 20 ± 1 °C].
Experimental ResultsPredicted Results
tbp (min)334Logistic Equation
tex (min)570a (-)17.33
tst (min)438b (1/min)0.035
Δtads (min)236Bohart-Adams model
FSB0.764kba (L/mg.min)0.003
qe (mg P/kg)84.1qba (mg/kg)61.29
MTZ (cm)24.8Thomas model
LUB (cm)14.2kth (L/mg.min)0.003
qths (mg/kg)121
Yoon-Nelson model
kyn (1/min)0.035
τ (min)495
t50% (min)506
tbp—breakthrough time; tex—exhaustion time; tst—stoichiometric time; Δtads—difference between tex and tbp; FSB—fraction of saturated bed; qe—adsorption capacity; MTZ—mass transfer zone; LUB—length of unused bed; kba—rate constant of Bohard-Adams model; qba—maximum adsorption capacity of Bohard-Adams model; kth—rate constant of Thomas model; qth—maximum adsorption capacity of Thomas model; kyn—rate constant of Yoon-Nelson; τ—time required to 50% of the bed saturation.
Disclaimer/Publisher’s Note: The statements, opinions and data contained in all publications are solely those of the individual author(s) and contributor(s) and not of MDPI and/or the editor(s). MDPI and/or the editor(s) disclaim responsibility for any injury to people or property resulting from any ideas, methods, instructions or products referred to in the content.