
Comprehensive Optimization of Air Quality in Kitchen Based on Auxiliary Evaluation Indicators

Abstract
1. Introduction
2. Description of Numerical Method
2.1. Mathematical Model
2.2. Air Quality Evaluation Metrics
2.2.1. Evaluation Index: ADPI
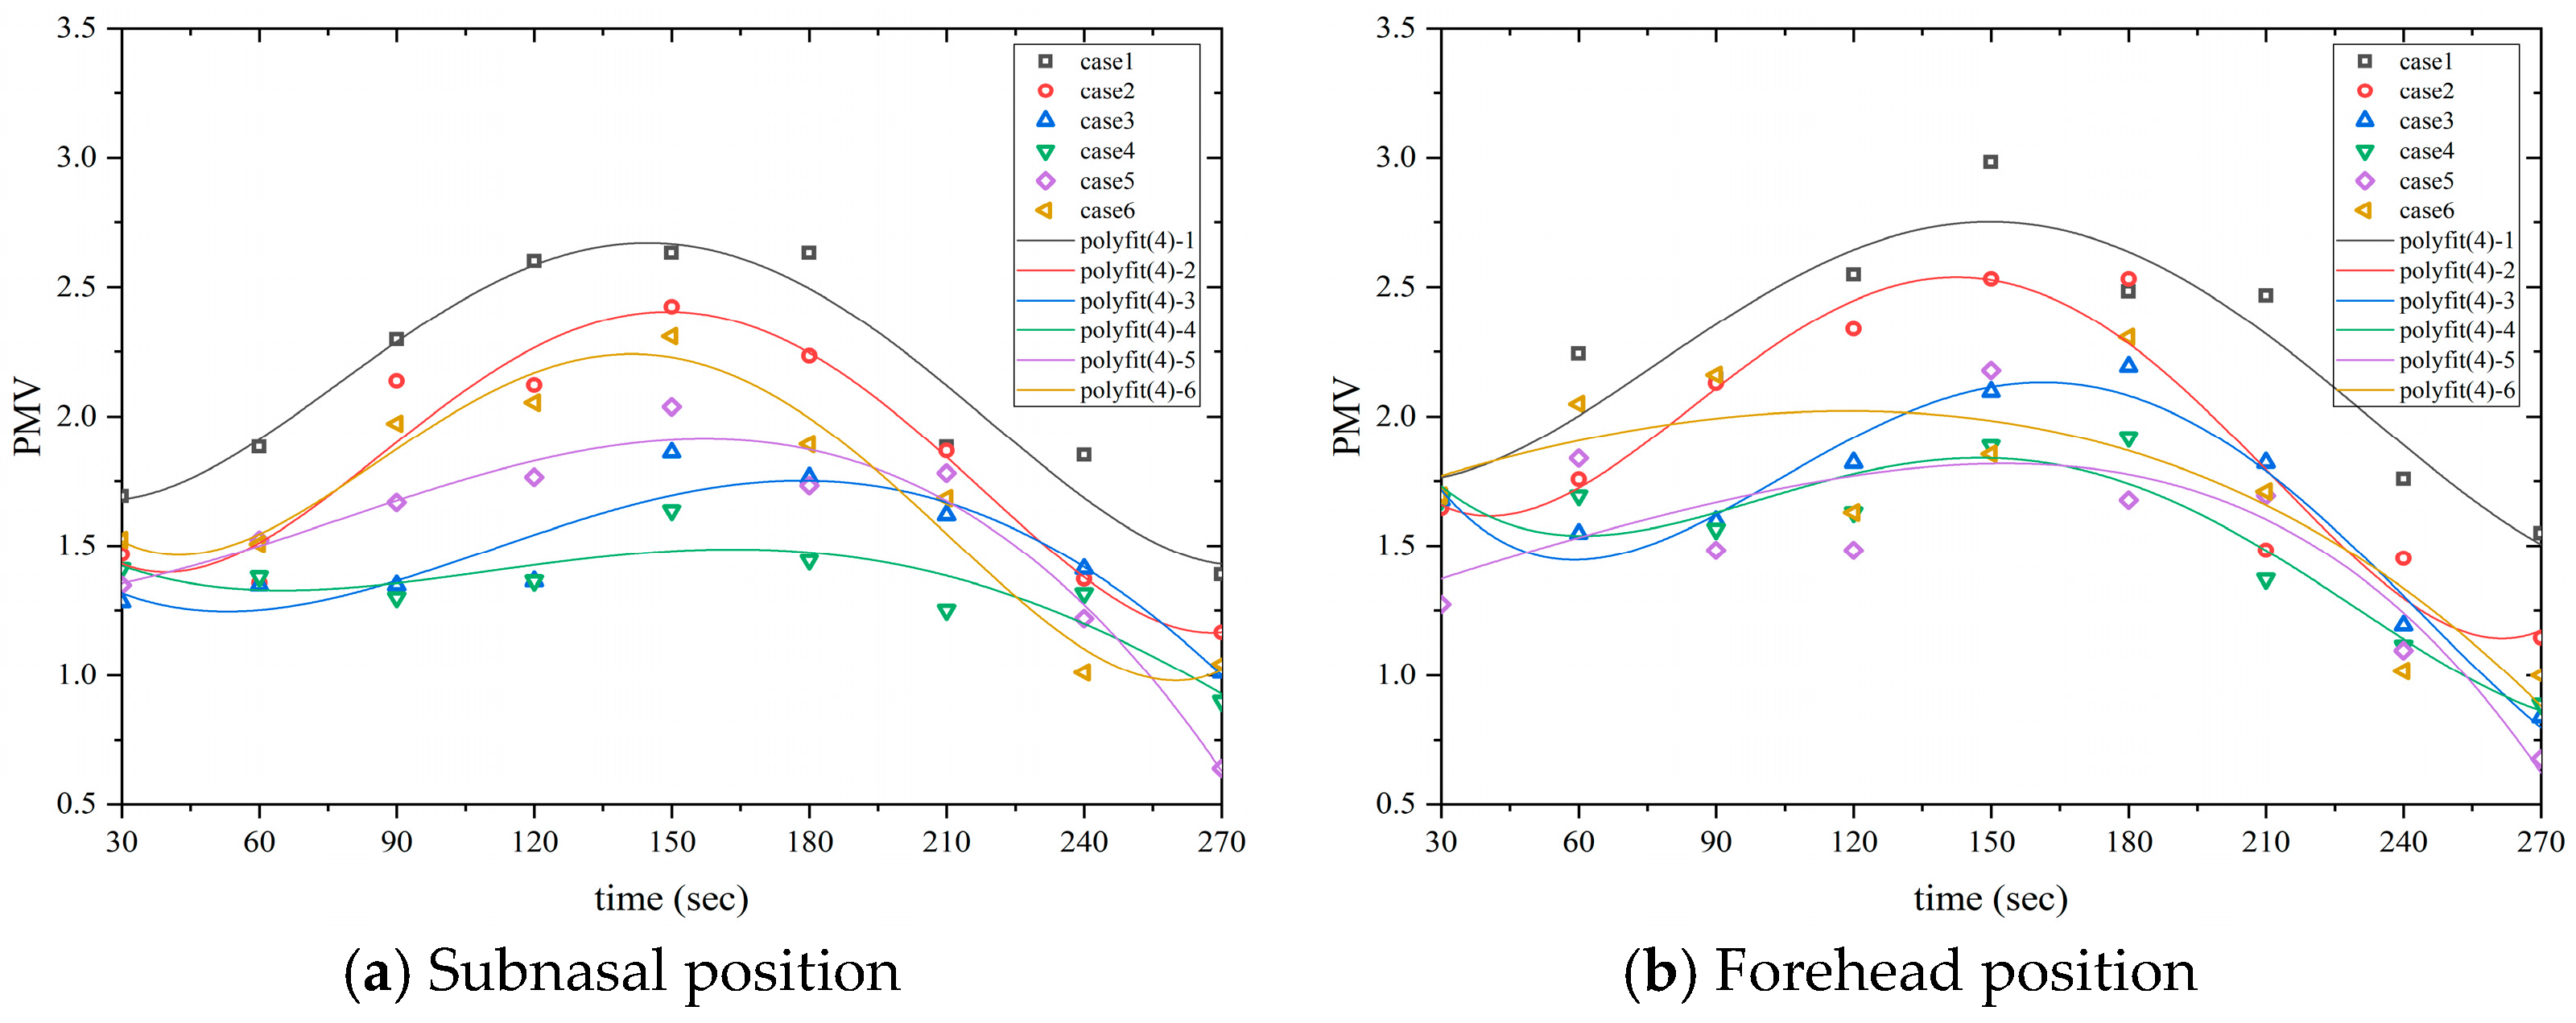
2.2.2. Evaluation Index: PMV
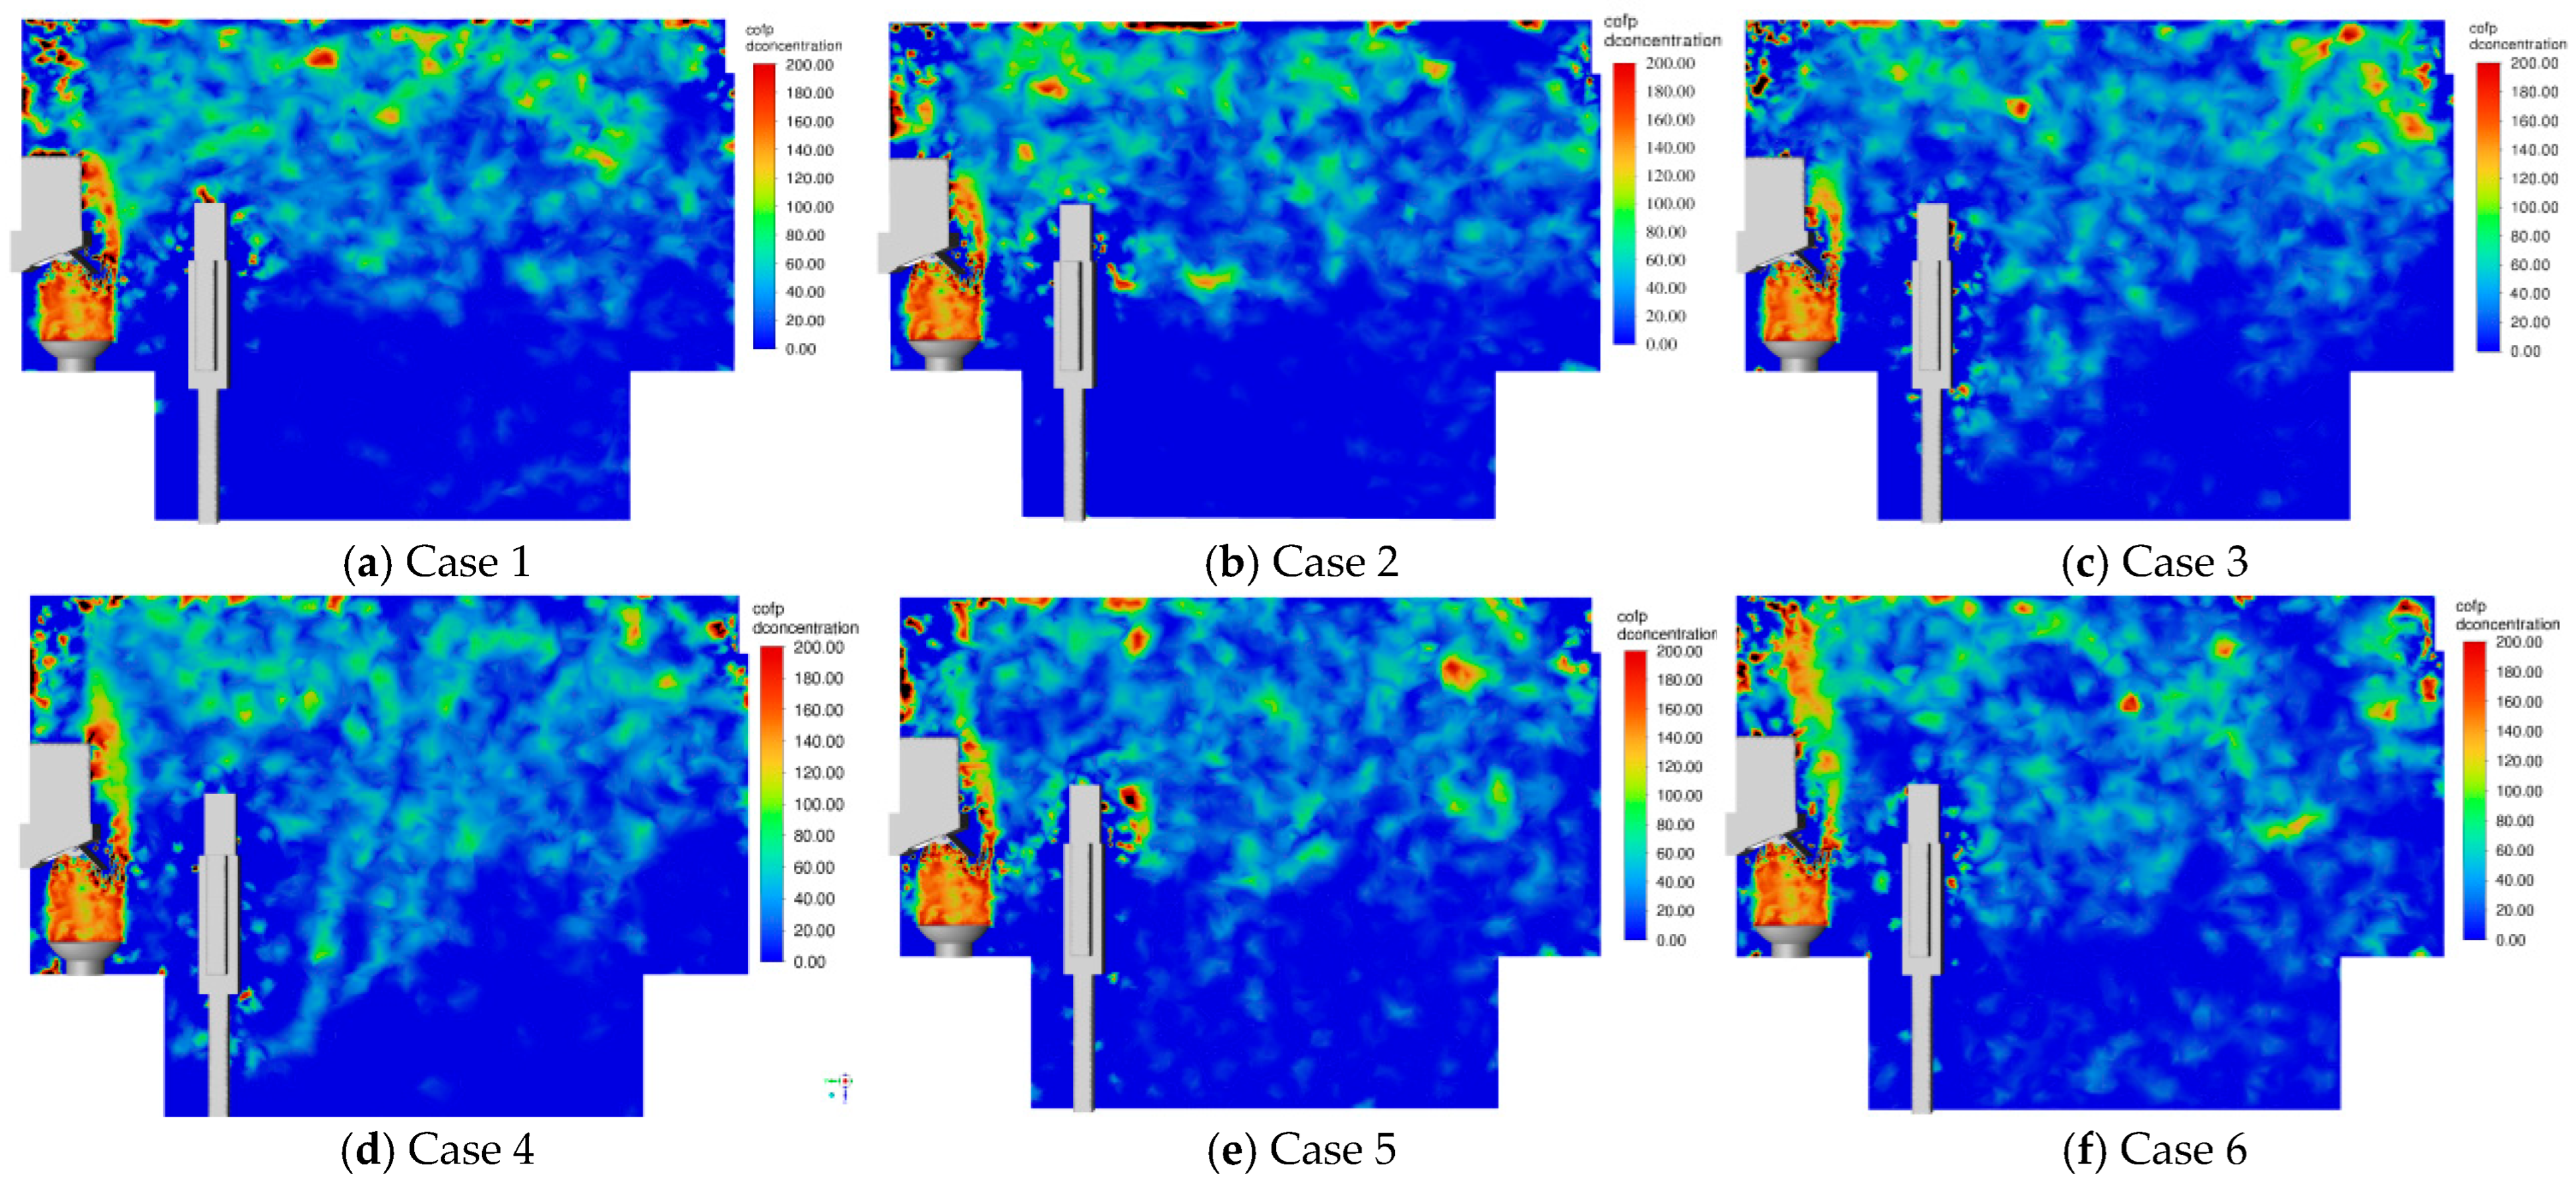
2.2.3. Evaluation Index: Inhalable Particulate Matter
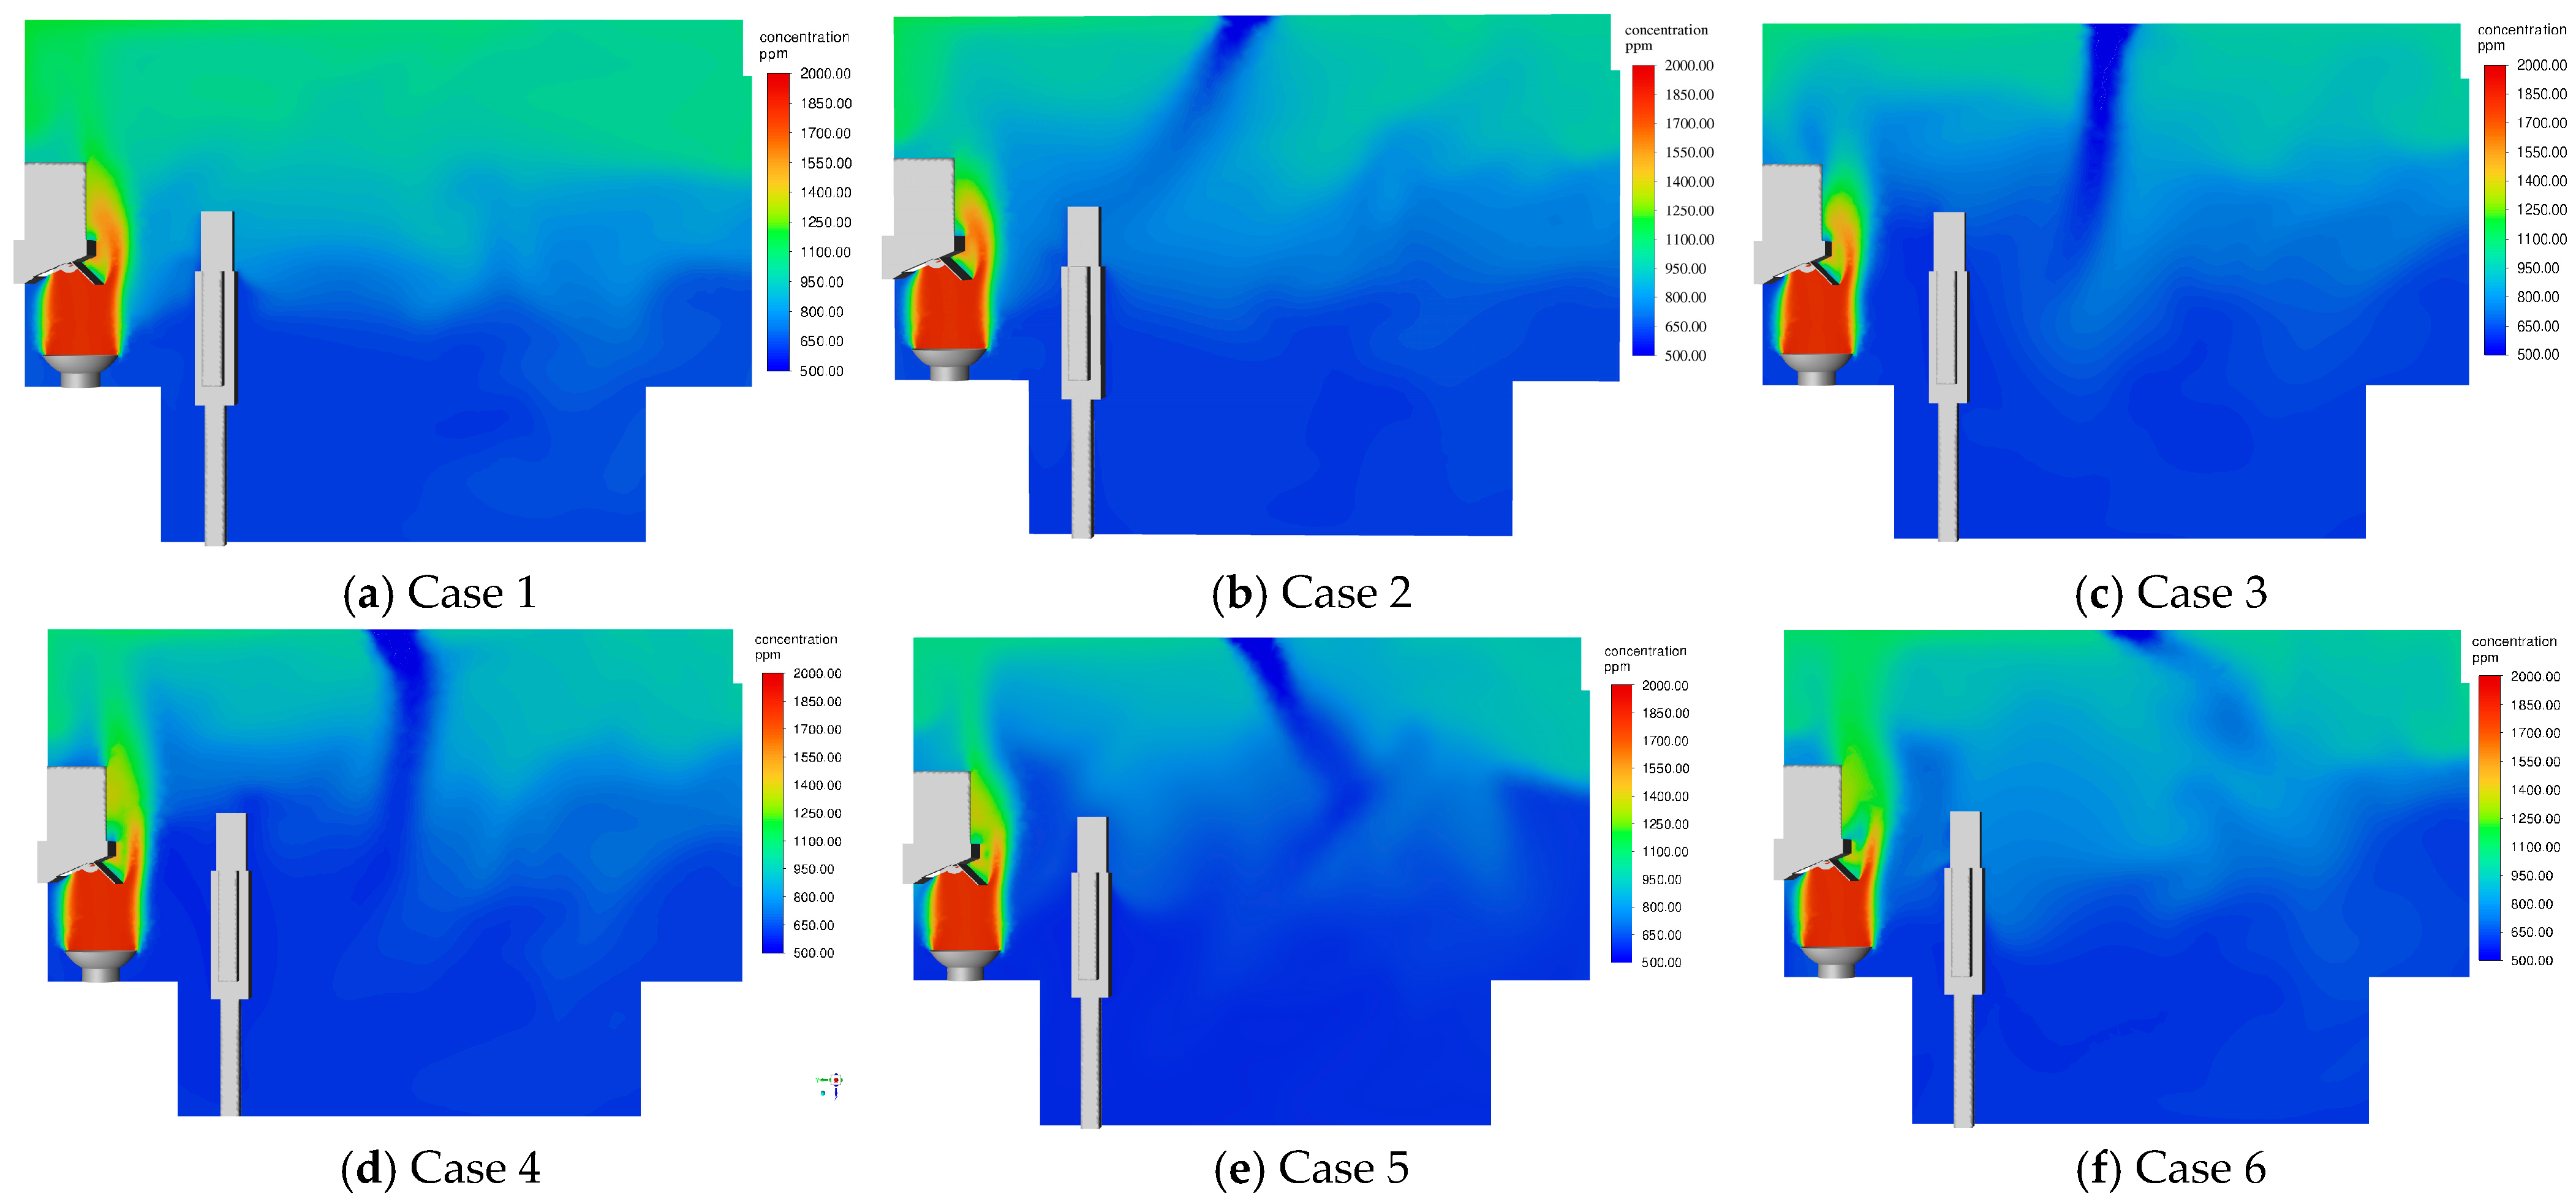
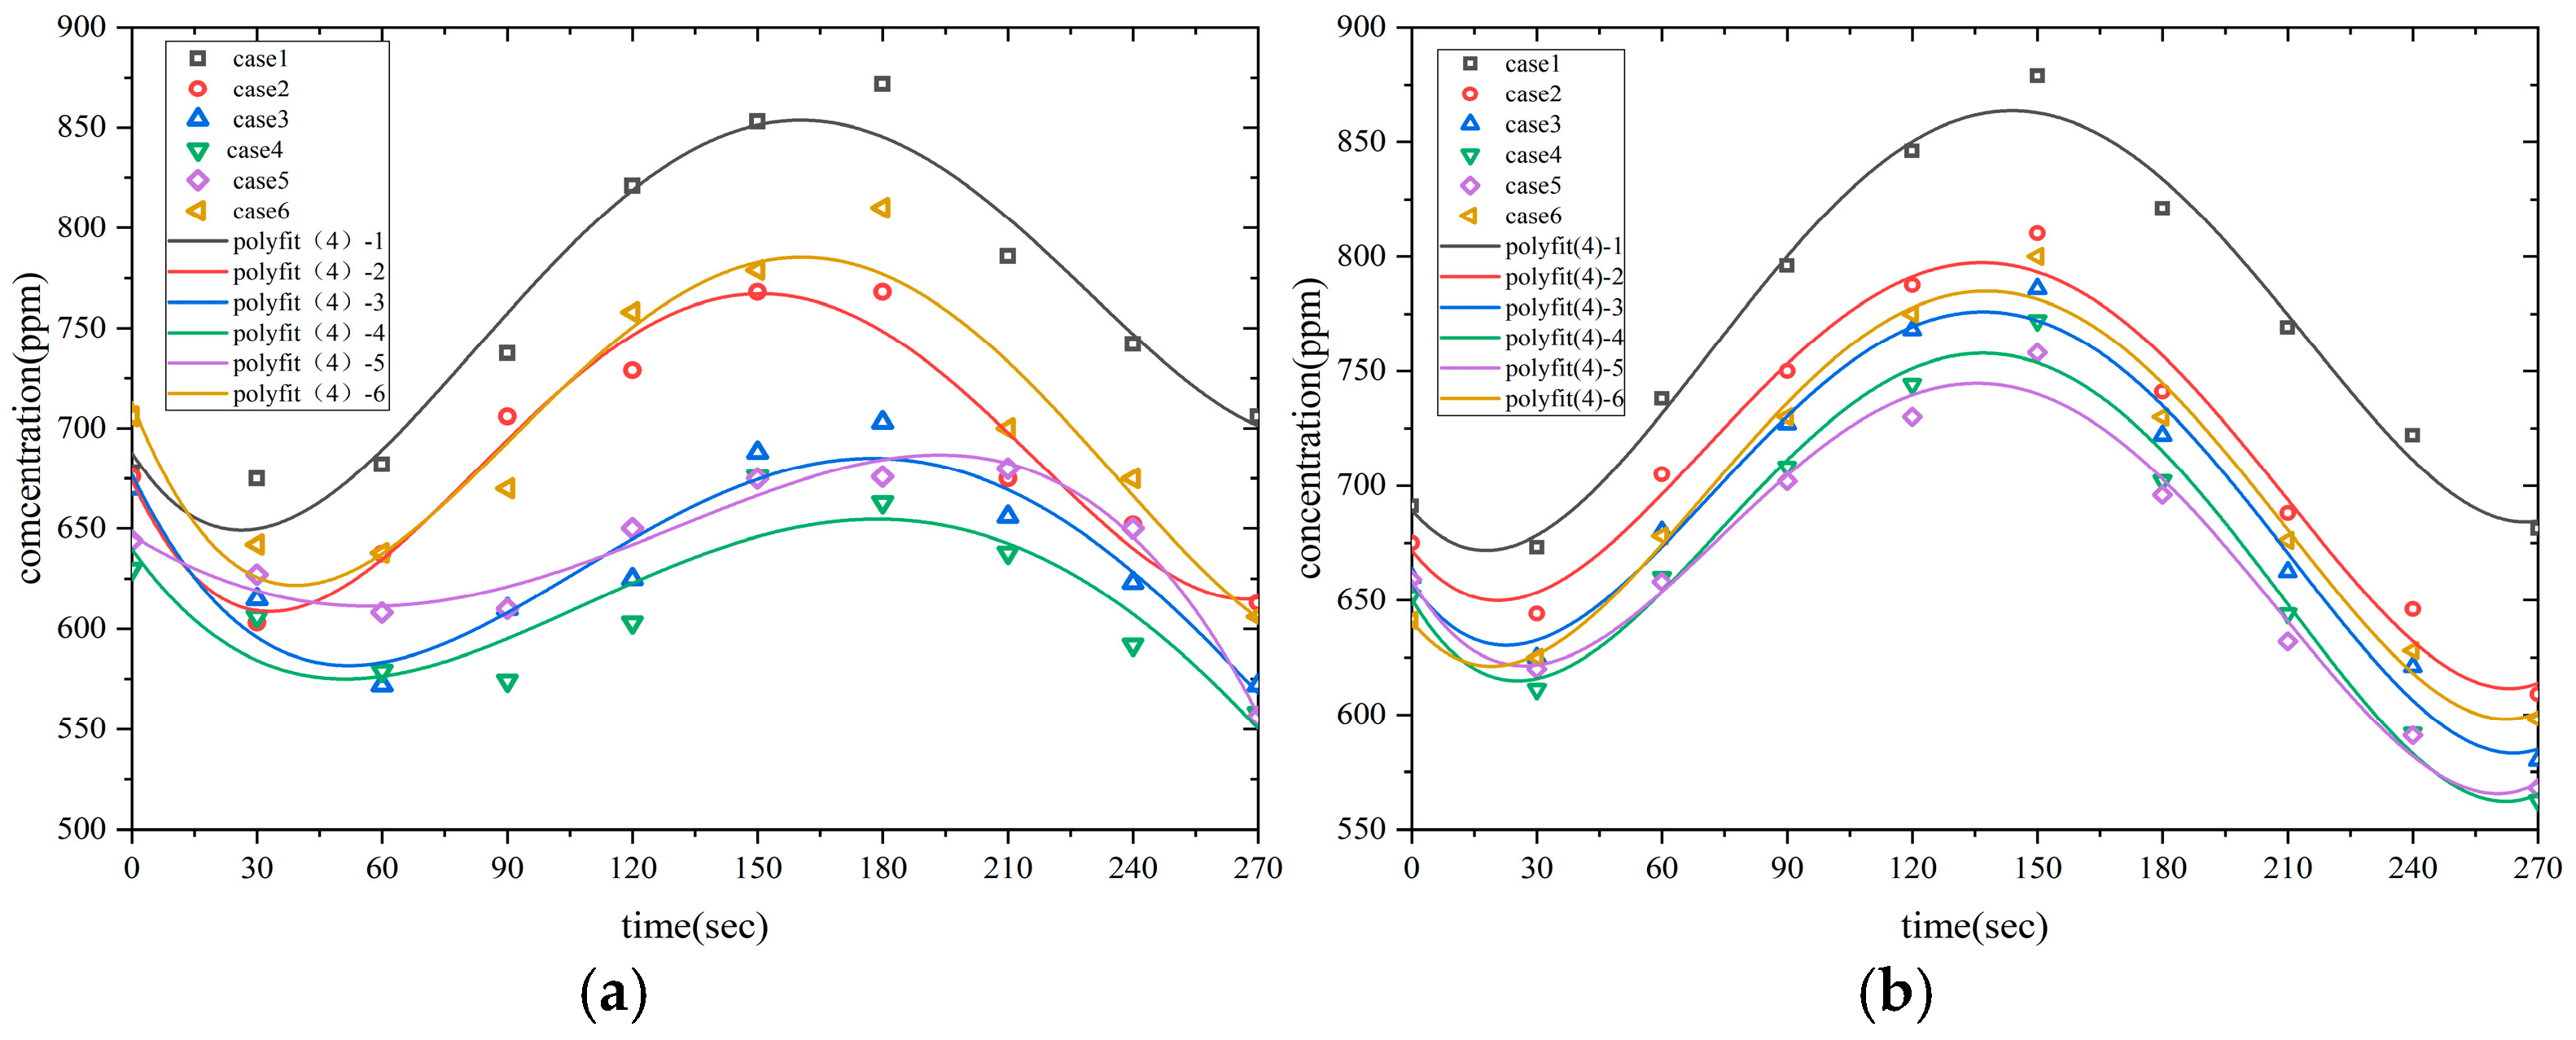
2.2.4. Evaluation Index: CO2 Concentration
2.3. Application of the Auxiliary Evaluation Index
2.3.1. Initial Definition and Limitations
2.3.2. Improved Formulation
2.3.3. Comparative Analysis with Established IAQ Metrics
3. Experimental and Numerical Validation
3.1. Experimental Testing
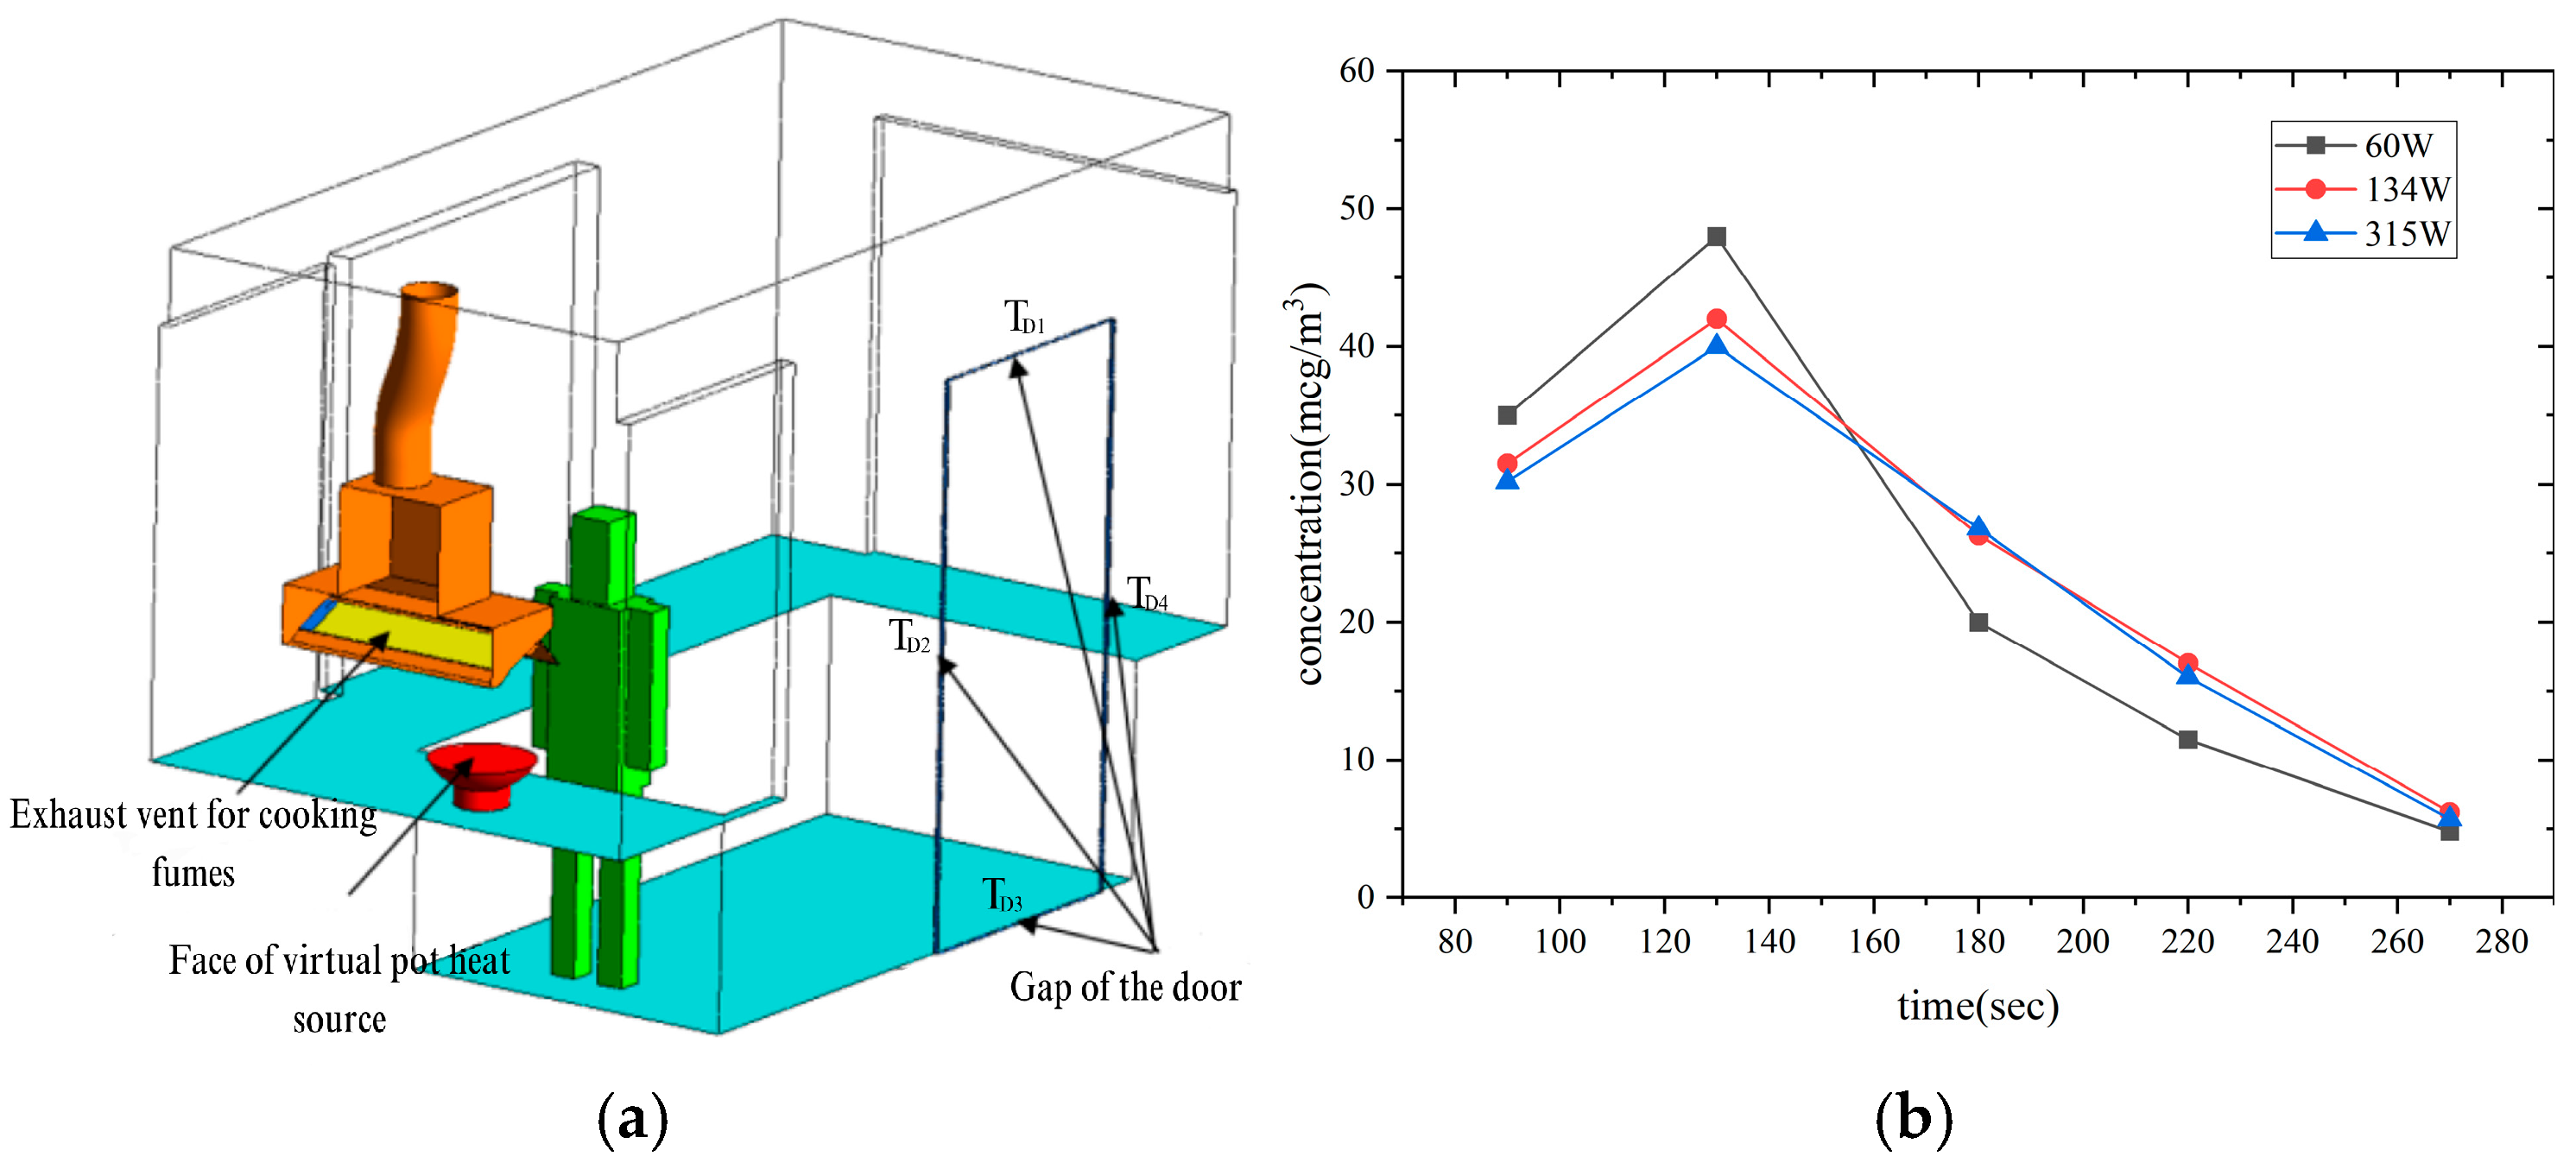
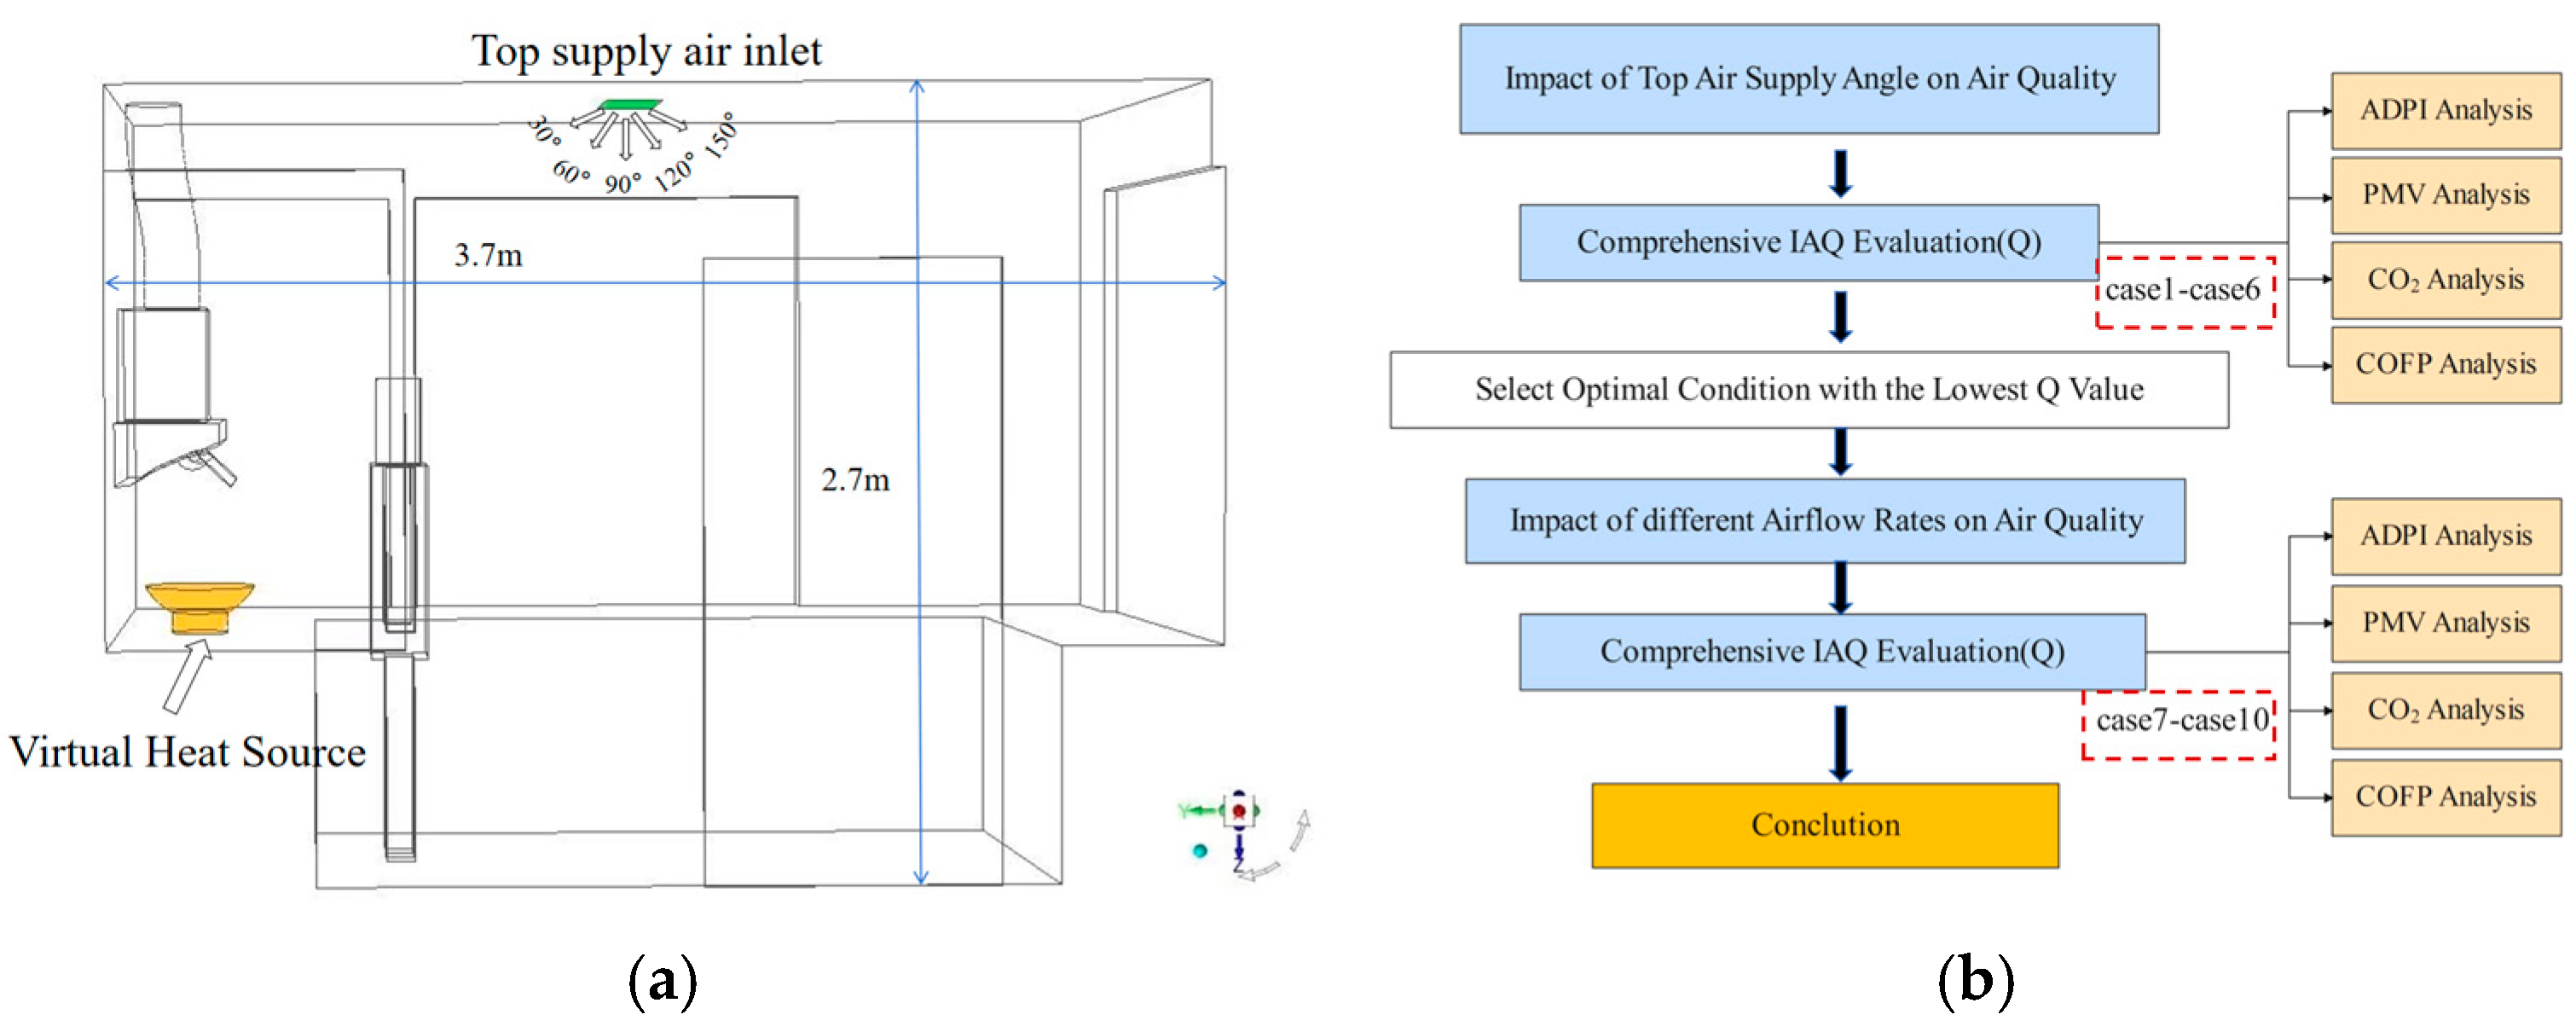
3.2. Geometric Model and Mesh Generation
3.3. Physical Model and Boundary Condition Settings
3.4. Numerical Simulation
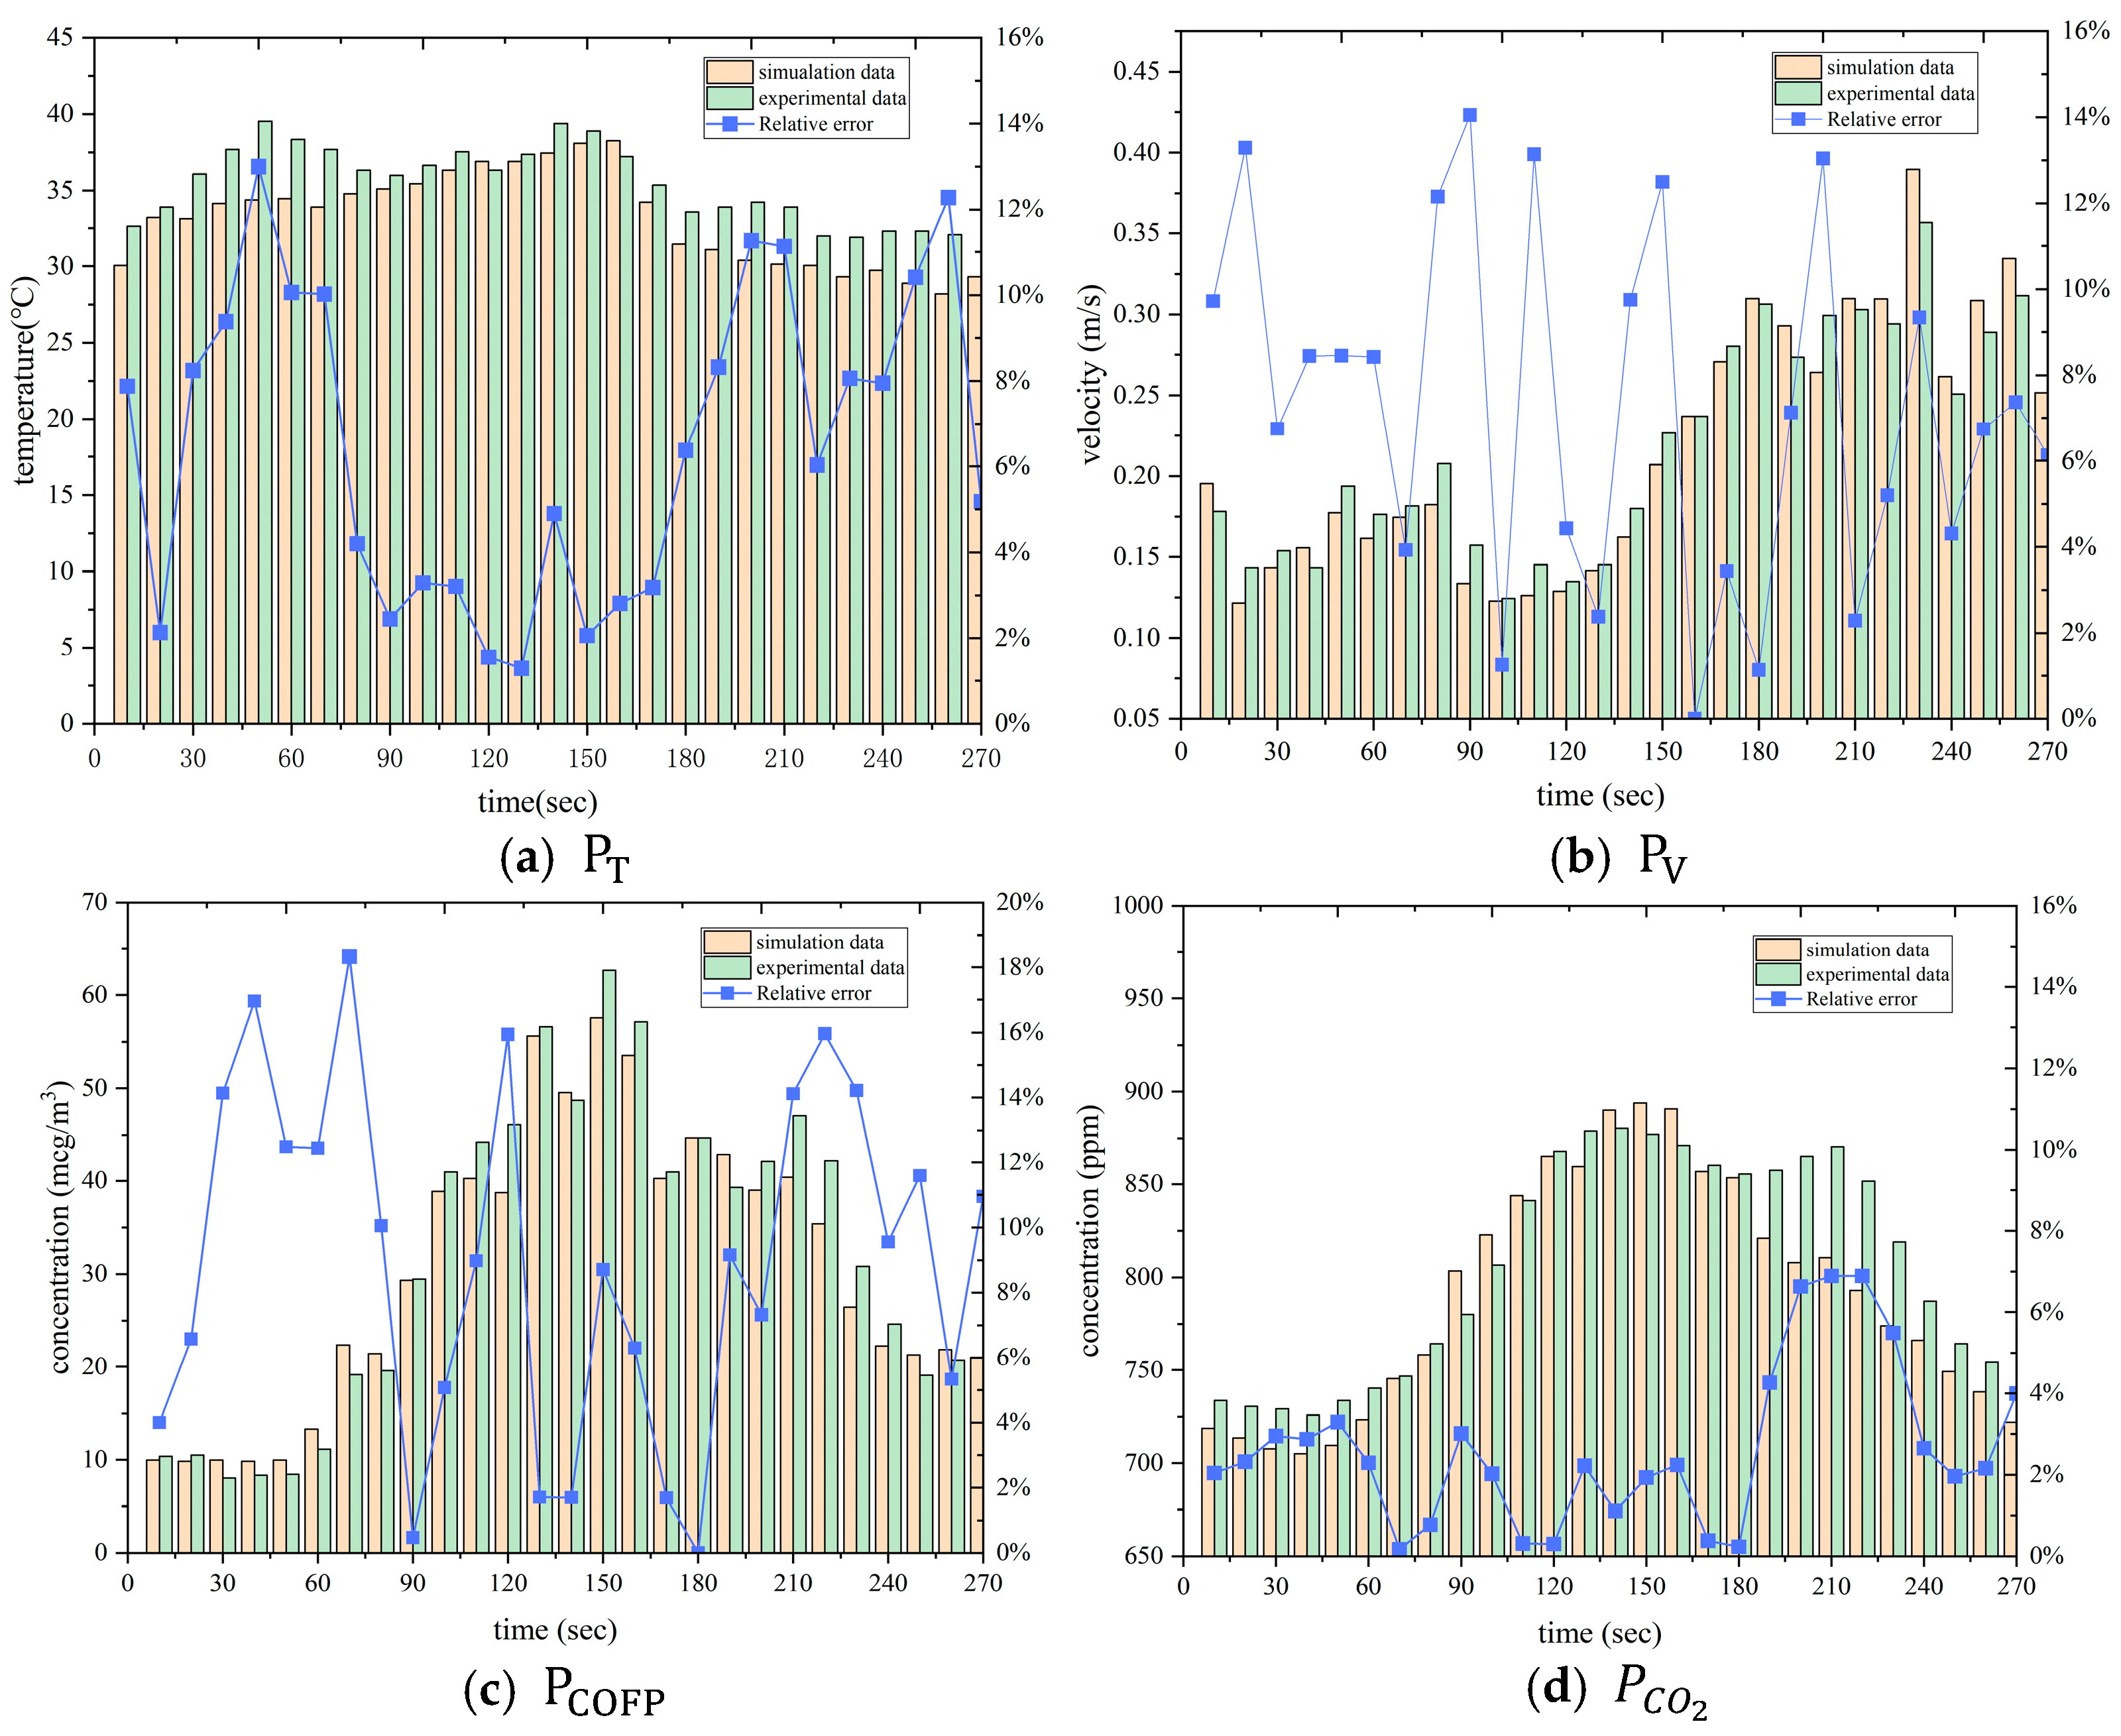
3.5. Quantitative Analysis of Kitchen Air Quality
3.6. Experimental Repeatability and Measurement Uncertainty
4. Optimization Analysis of Kitchen Air Quality
4.1. Optimization Strategies
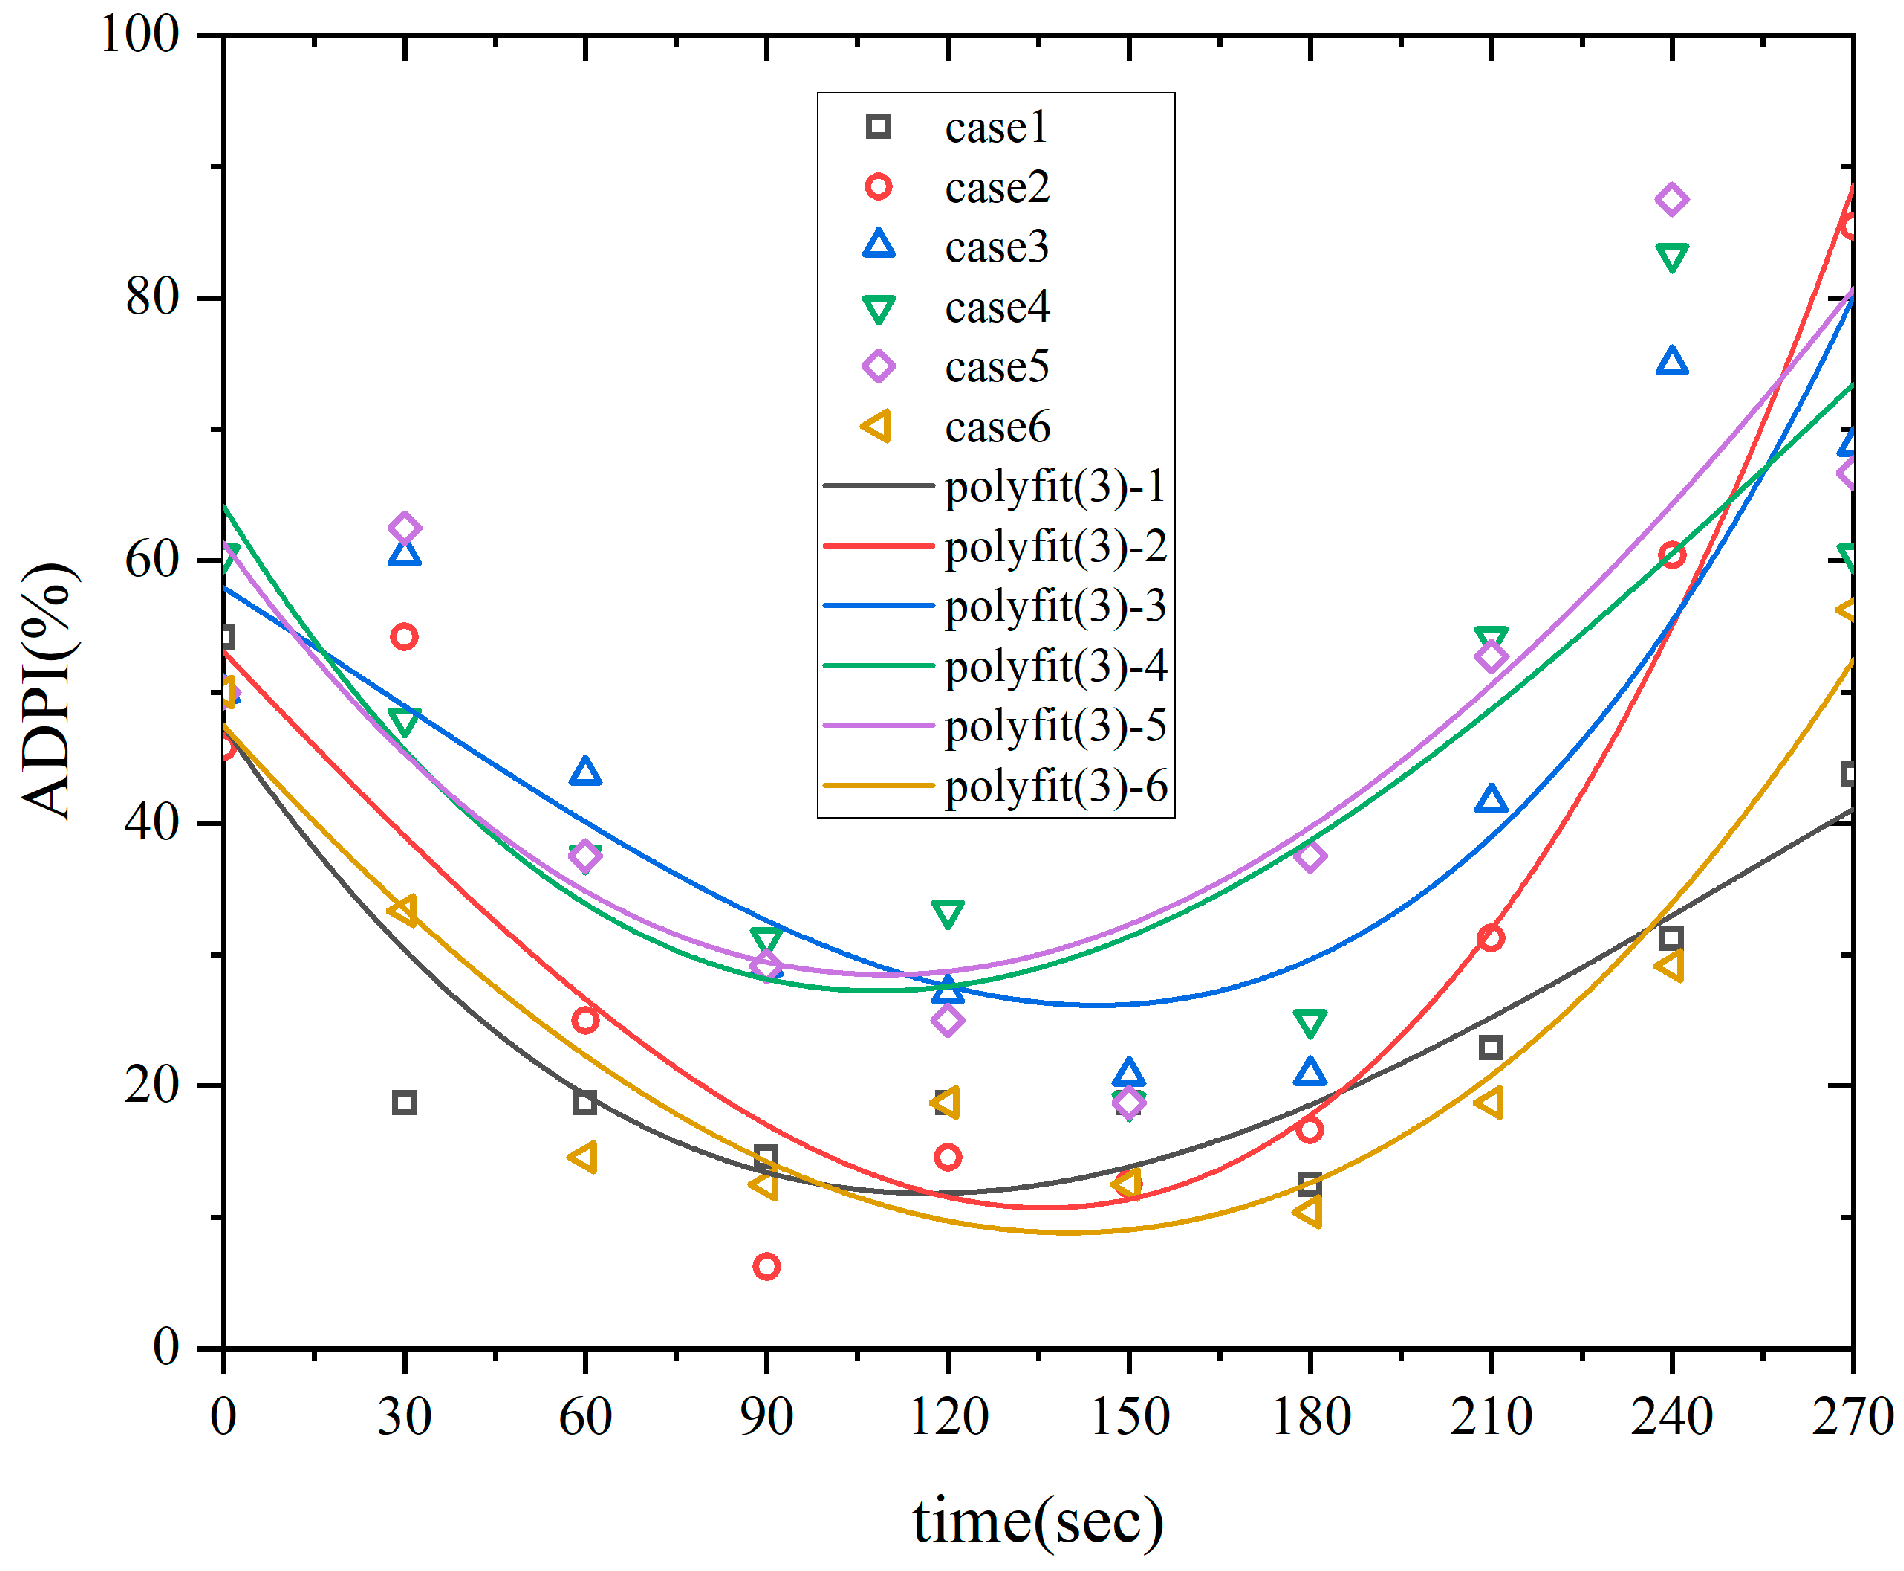
4.2. Simulation Results of Different Working Conditions
4.3. Statistical Significance of Q-Index Improvement
5. Conclusions
5.1. Study Limitations and Future Perspectives
- (1)
- Experiments and simulations focused on an enclosed kitchen without examining interactions with adjacent spaces (e.g., open-plan kitchens integrated with dining/living areas). Future work should investigate multi-zone ventilation synergy and pollutant migration pathways.
- (2)
- (3)
- The Q-index methodology shows promise for broader application. Future research should explore its adaptation and validation in diverse indoor environments with high air quality demands and vulnerable populations, such as kitchens in elderly care facilities, schools, hospitals, and daycare centers, where pollutant exposure and thermal comfort are critical public health concerns. Investigating the transferability of the weighting scheme and optimization approach in these contexts could significantly extend the societal impact of this work.
5.2. Key Findings and Sustainability Implications
5.2.1. Technical Innovations and Performance Enhancement
- A comprehensive evaluation index, Q, was introduced, incorporating four air quality indicators: ADPI, PMV, CO2, and COFP, to assess overall air quality during cooking.
- Initial unoptimized conditions yielded substandard IAQ: ADPI: 21.59%, PMV: 2.138, CO2: 738.6 ppm, COFP: 29.3 µg/m3.
- Optimization of top air supply angle (90°) and airflow rate (2.268 m3/min) significantly enhanced performance: ADPI: 57.5%, PMV: 1.334, CO2: 622.75 ppm, and COFP: 22.77 µg/m3. This represents a 29.5% reduction in air pollution impact versus baseline.
- The statistical rigor of Q-index improvements was established through ANOVA, with effect sizes exceeding measurement uncertainties. The 22–24% reductions in COFP/CO2 and 29.5% Q-index decline (p < 0.001) confirm that optimization is not attributable to experimental noise. Future studies should expand replicates to address cooking process variability.
5.2.2. Sustainability Implications
- The 29.5% Q-index reduction translates to a 24% decrease in peak CO2 exposure (from 638 ppm baseline) and 22% lower COFP in breathing zones, mitigating respiratory health risks associated with prolonged exposure to kitchen pollutants [1,2,4]. This improvement in occupant health and well-being directly contributes to Sustainable Development Goal 3 (Good Health and Well-being), specifically target 3.9 aiming to substantially reduce deaths and illnesses from hazardous chemicals and air pollution.
- Optimized airflow (2.268 m3/min) incurs only a 5% energy penalty versus baseline while avoiding the 20–30% over-ventilation typical in conventional systems, demonstrating quantifiable IAQ–energy balance. This reduction in unnecessary energy consumption supports the development of more sustainable and resource-efficient buildings, aligning with Sustainable Development Goal 11 (Sustainable Cities and Communities), particularly target 11.6 on reducing the adverse environmental impact of cities, including air quality.
- The Q-index provides a metrics-driven framework to resolve IAQ–comfort–energy tradeoffs, supporting evidence-based ventilation standards for sustainable urban kitchens. This methodological contribution offers a practical tool for policymakers and building designers striving to meet SDG targets related to health and sustainable urbanization.
Author Contributions
Funding
Institutional Review Board Statement
Informed Consent Statement
Data Availability Statement
Acknowledgments
Conflicts of Interest
References
- Ding, M.; Zhang, S.; Wang, J.; Ye, F.; Chen, Z. Study on spatial and temporal distribution characteristics of the cooking oil fume particulate and carbon dioxide based on CFD and experimental analyses. Atmosphere 2023, 14, 1522. [Google Scholar] [CrossRef]
- Zhou, B.; Chen, F.; Dong, Z.; Nielsen, P.V. Study on pollution control in residential kitchen based on the push-pull ventilation system. Build. Environ. 2016, 107, 99–112. [Google Scholar] [CrossRef]
- Pryor, J.T.; Cowley, L.O.; Simonds, S.E. The Physiological Effects of Air Pollution: Particulate Matter, Physiology and Disease. Front. Public Health 2022, 10, 882569. [Google Scholar] [CrossRef]
- Pini, L.; Giordani, J.; Concoreggi, C.; Zanardini, E.; Pini, A.; Perger, E.; Bargagli, E.; Bona DDi Ciarfaglia, M.; Tantucci, C. Effects of short-term exposure to particulate matter on emergency department admission and hospitalization for asthma exacerbations in Brescia district. J. Asthma Off. J. Assoc. Care Asthma 2022, 59, 1290–1297. [Google Scholar] [CrossRef]
- Habre, R.; Zhou, H.; PEckel, S.; Enebish, T.; Fruin, S.; Bastain, T.; Rappaport, E.; Gilliland, F. Short-term effects of airport-associated ultrafine particle exposure on lung function and inflammation in adults with asthma. Environ. Int. 2018, 118, 48–59. [Google Scholar] [CrossRef]
- Posselt, K.P.; Neuberger, M.; Köhler, D. Fine and ultrafine particle exposure during commuting by subway in Vienna. Wien. Klin. Wochenschr. 2019, 131, 374–380. [Google Scholar] [CrossRef]
- Rittner, R.; Flanagan, E.; Oudin, A.; Malmqvist, E. Health Impacts from Ambient Particle Exposure in Southern Sweden. Int. J. Environ. Res. Public Health 2020, 17, 5064. [Google Scholar] [CrossRef]
- Delgado-Saborit, J.M.; Aquilina, N.J.; Meddings, C.; Baker, S.; Harrison, R.M. Relationship of personal exposure to volatile organic compounds to home, work and fixed site outdoor concentrations. Sci. Total Environ. 2011, 409, 78–88. [Google Scholar] [CrossRef] [PubMed]
- Klepeis, N.E.; Nelson, W.C.; Ott, W.R.; Robinson, J.P.; Tsang, A.M.; Switzer, P.; Behar, J.V.; Hern, W.H.; Engelmann, S.C. The National Human Activity Pattern Survey (NHAPS): A resource for assessing exposure to environmental pollutants. J. Expo. Anal. Environ. Epidemiol. 2001, 11, 31–52. [Google Scholar] [CrossRef]
- Fanger, P.O. Thermal Comfort Analysis and Applications in Environment Engineering. Environ. Eng. 1972, 45, 244. [Google Scholar]
- Toftum JJorgensen, A.S.; Fanger, P.O. Upper limits for indoor air humidity to avoid uncomfortably humid skin. Energy Build. 1998, 28, 1–13. [Google Scholar] [CrossRef]
- Kuchen, E.; Fisch, M. Spot Monitoring: Thermal comfort evaluation in 25 office buildings in winter. Build. Environ. 2008, 44, 839–847. [Google Scholar] [CrossRef]
- Buratti, C.; Mariani, R.; Moretti, E. Mean age of air in a naturally ventilated office: Experimental data and simulations. Energy Build. 2011, 43, 2021–2027. [Google Scholar] [CrossRef]
- Chen, Z.; Xin, J.; Liu, P. Air quality and thermal comfort analysis of kitchen environment with CFD simulation and experimental calibration. Build. Environ. 2020, 172, 106691. [Google Scholar] [CrossRef]
- Song, J. Research on the Impact of Ventilation and Air Conditioning System Forms on Indoor Air Quality. Build. Therm. Vent. Air Cond. 2021, 40, 89–93. [Google Scholar]
- Fan, L. Research on the Impact of Residential Ventilation Systems on Indoor Air Quality; Beijing University of Civil Engineering and Architecture: Beijing, China, 2021. [Google Scholar]
- Lin, J.; Zhou, T.; Qiu, Y. Numerical Simulation of Thermal Comfort Suitability of Cabin Under Different Air Conditioning Working Conditions. Fluid Dyn. Gas Dyn. 2022, 46, 86–93. [Google Scholar]
- Wang, F.; Lin, X.; Hou, Y. Impact of Radiation Air Supply Methods on Cabin Thermal Comfort of Ships. Ship Eng. 2022, 44, 69–75. [Google Scholar] [CrossRef]
- Zhang, C.Q.; Yang, F.; Xia, Y.F.; He, L.J.; Yu, Y.L.; Zeng, L.J.; Cao, C.S.; Gao, J. Make-up air optimization and demand exhaust rate of commercial kitchens under multiple cookers operation. J. Build. Eng. 2024, 89, 109274. [Google Scholar] [CrossRef]
- Zhang, S.Y.; Huang, X.Y.; Li, A.; Yu, B.S.; Jiang, Y.; Peng, L.; Chen, Z.L. Improving kitchen thermal comfort in summer based on optimization of airflow distribution. J. Build. Eng. 2024, 96, 110614. [Google Scholar] [CrossRef]
- Li, J.Q.; Liu, A.Q.; Yu, L.; Meng, C.; Ma, Y.C.; Dong, J.K. Influence and optimal operating parameters of slit make-up air system on low-energy kitchen environment. J. Build. Eng. 2024, 94, 110016. [Google Scholar] [CrossRef]
- Song, Y.L.; Chen, X.; Zhang, Z.; Cao, S.; Du, T.; Guo, H.F. Studies on the control of kitchen pollutants by exhaust hood with air-filled slots. J. Build. Eng. 2022, 48, 103891. [Google Scholar] [CrossRef]
- Liu, Y.; Li, C.; Ma, H.Q.; Luo, X.M. Performance of local supply-exhaust ventilation around stove with numerical simulation in a residential kitchen. J. Build. Eng. 2024, 87, 109078. [Google Scholar] [CrossRef]
- Xie, W.H.; Gao, J.; Lv, L.P.; Hou, Y.M.; Cao, C.S.; Zeng, L.G.; Xia, Y.F. Parametrized design for the integration of range hood and air cleaner in the kitchen. J. Build. Eng. 2021, 43, 102878. [Google Scholar] [CrossRef]
- Wu, X.; Cui, W.Z.; Wang, Y.X.; Xiang, W.F. Human thermal comfort in kitchen with different ventilation modes based on a coupled CFD and thermoregulation model. J. Build. Eng. 2024, 94, 110000. [Google Scholar] [CrossRef]
- Lin, J.; Wu, J.; Lian, M. Optimization of Cabin Thermal Comfort Based on ADPI and Blowing Sensation Index. Fluid Dyn. Gas Dyn. 2018, 46, 40–45. [Google Scholar]
- Li, J.; Wu, X.; Yang, R. Analysis of Improvement Measures for the Concentration of Harmful Substances in Ships. China Water Transp. 2013, 13, 204–205. [Google Scholar]
- Zhang, S.; Li, B.; Li, A. Research on Constant-Flow Water-Saving Device Based on Dynamic Mesh Transient Flow Field Analysis. Water 2024, 16, 2427. [Google Scholar] [CrossRef]
- JCGM 100:2008; Evaluation of Measurement Data—Guide to the Expression of Uncertainty in Measurement. BIPM: Sèvres, France, 2008.


| Sensation Description | Hot | Warm | Slightly Warm | Neutral | Slightly Cool | Cool | Cold |
|---|---|---|---|---|---|---|---|
| PMV Value | +3 | +2 | +1 | 0 | −1 | −2 | −3 |
| Transition Stage | (μg/m3) | Indicate | |
|---|---|---|---|
| IT-1 | Annual Average | 70 | Initial target value, suitable for areas with poor air quality, aimed at gradually reducing PM10 concentrations. |
| Daily Average | 150 | ||
| IT-2 | Annual Average | 50 | A more stringent target, suitable for areas that have reached the IT-1 standard, encouraging further reduction of PM10 pollution. |
| Daily Average | 100 | ||
| IT-3 | Annual Average | 30 | A higher target value, aimed at further improving air quality, suitable for regions that have achieved the IT-2 standard. |
| Daily Average | 57 | ||
| Guideline | Annual Average | 20 | The ultimate goal, based on epidemiological studies, aimed at minimizing the health risks associated with PM10 exposure. |
| Daily Average | 50 | ||
| CO2 Concentration/ppm | Air Pollution Level | Hazard |
|---|---|---|
| <700 | Clean air | None |
| 700~1000 | Meets hygienic standards | Unpleasant odour |
| 1000~1500 | Mild pollution | Air deterioration, discomfort for occupants |
| 1500~2000 | Discomfort for most occupants | |
| 2000~3000 | Severe pollution | Respiratory discomfort |
| 3000~4000 | Headache, tinnitus, eye irritation | |
| >8000 | Respiratory distress, lethargy, severe cases may lead to death |
| Index | Scope | Key Metrics | Weighting Approach | Limitations in Kitchens |
|---|---|---|---|---|
| Q-Index | Residential kitchens | ADPI, PMV, CO2, COFP | Physics-based | N/A (tailored for cooking emissions) |
| LEED IAQ | Generic buildings | VOC, CO2, PM2.5, ventilation rates | Fixed thresholds | Neglects transient COFP, thermal plumes |
| NABERS IAQ | Commercial offices | CO2, temperature, humidity | Statistical aggregation | Ignores occupant proximity to pollutants |
| Boundary Name | Boundary Type | Settings |
|---|---|---|
| Virtual Heat Source (Pot) | Velocity-inlet | Temperature: Follow Formula (12) ; Vertical Velocity Profile: 1.5 m/s |
| Door Gap | Pressure-inlet | Gauge Pressure: 17 Pa Measured Temperatures: TD1–TD4 are 299.3, 297.8, 298.7, 298.4 K |
| Exhaust Vent | Pressure-outlet | Negative Pressure: 17 Pa Temperature: 283 K |
| Human Body Surface | Wall (Heat-Flux) | Summer Condition, Surface Heat-Flux: Roughness Height: 0 |
| Other Surfaces | Wall (No-Slip) | No-Slip Adiabatic Walls Surface Roughness Height: 0 Temperature: 299 K |
| Original Condition | 100%-ADPI | Subnasal PMV | Inhalation Area CO2 (ppm) | Entire Kitchen CO2 (ppm) | Inhalation Area COFP (μg/m3) | Entire Kitchen COFP (μg/m3) | Q |
|---|---|---|---|---|---|---|---|
| 78.41 | 2.081 | 736.3 | 740.9 | 29.67 | 28.93 | 1.634 | |
| Ideal Value | 100 | 1 | 700 | 700 | 50 | 50 | 1 |
| Parameter | Instrument | Uncertainty | Reproducibility (CV) |
|---|---|---|---|
| CO2 Concentration | ST8310 recorder | ±50 ppm | 2.1% |
| COFP | LH3016 particle counter | ±5% of reading | 4.3% |
| Air Velocity | Testo 405i anemometer | ±0.03 m/s | 1.8% |
| Temperature | TP9000 data logger | ±0.2 °C | 0.9% |
| Conditions | Case 1 (Original Condition) | Case 2 | Case 3 | Case 4 | Case 5 | Case 6 |
|---|---|---|---|---|---|---|
| Air Supply Angle (deg) | 0 | 30 | 60 | 90 | 120 | 150 |
| Conditions | 100%-ADPI | Forehead PMV | Subnasal PMV | Inhalation Area CO2 (ppm) | Entire Kitchen CO2 (ppm) | Inhalation Area COFP (μg/m3) | Entire Kitchen COFP (μg/m3) | Q |
|---|---|---|---|---|---|---|---|---|
| Case 1 | 78.41 | 2.194 | 2.081 | 736.3 | 740.9 | 29.67 | 28.93 | 1.634 |
| Case 2 | 64.47 | 1.888 | 1.779 | 659.1 | 688.0 | 28.41 | 27.24 | 1.414 |
| Case 3 | 57.99 | 1.637 | 1.455 | 619.3 | 667.9 | 25.71 | 27.87 | 1.274 |
| Case 4 | 55.60 | 1.520 | 1.335 | 595.6 | 651.5 | 23.73 | 26.74 | 1.209 |
| Case 5 | 53.48 | 1.490 | 1.523 | 623.6 | 648.5 | 26.70 | 26.44 | 1.226 |
| Case 6 | 77.19 | 1.713 | 1.673 | 680.9 | 679.9 | 30.55 | 27.29 | 1.483 |
| Conditions | Case 7 | Case 8 | Case 9 | Case 10 |
|---|---|---|---|---|
| airflow rate (m3/min) | 2.052 (−5%) | 1.944 (−10%) | 2.268 (+5%) | 2.376 (+10%) |
| Conditions | 100%-ADPI | Forehead PMV | Subnasal PMV | Inhalation Area CO2 (ppm) | Entire Kitchen CO2 (ppm) | Inhalation Area COFP (μg/m3) | Entire Kitchen COFP (μg/m3) | Q |
|---|---|---|---|---|---|---|---|---|
| Case 7 | 60.61 | 1.572 | 1.271 | 625.1 | 657.3 | 25.29 | 27.62 | 1.260 |
| Case 8 | 58.89 | 1.591 | 1.390 | 613.1 | 650.7 | 24.43 | 27.49 | 1.257 |
| Case 9 | 52.50 | 1.465 | 1.223 | 594.4 | 651.1 | 19.52 | 26.02 | 1.152 |
| Case 10 | 52.22 | 1.461 | 1.220 | 588.0 | 648.2 | 22.07 | 26.37 | 1.154 |
| Comparison Group | F-Statistic | p-Value | Significant Pairs (p < 0.05) | Mean Q ± SD |
|---|---|---|---|---|
| Air supply angle | F = 37.2 | <0.001 | Case 4 vs. all others | Case 1: 1.634 ± 0.04 Case 4: 1.209 ± 0.03 |
| Airflow rate | F = 29.8 | <0.001 | Case 9 vs. 7, 8, 10 | Case 9:1.152 ± 0.02 Case10:1.154 ± 0.03 |
Disclaimer/Publisher’s Note: The statements, opinions and data contained in all publications are solely those of the individual author(s) and contributor(s) and not of MDPI and/or the editor(s). MDPI and/or the editor(s) disclaim responsibility for any injury to people or property resulting from any ideas, methods, instructions or products referred to in the content. |
© 2025 by the authors. Licensee MDPI, Basel, Switzerland. This article is an open access article distributed under the terms and conditions of the Creative Commons Attribution (CC BY) license (https://creativecommons.org/licenses/by/4.0/).
Share and Cite
Huang, H.; Zhang, S.; Zhao, X.; Chen, Z. Comprehensive Optimization of Air Quality in Kitchen Based on Auxiliary Evaluation Indicators. Appl. Sci. 2025, 15, 6755. https://doi.org/10.3390/app15126755
Huang H, Zhang S, Zhao X, Chen Z. Comprehensive Optimization of Air Quality in Kitchen Based on Auxiliary Evaluation Indicators. Applied Sciences. 2025; 15(12):6755. https://doi.org/10.3390/app15126755
Chicago/Turabian StyleHuang, Hai, Shunyu Zhang, Xiangrui Zhao, and Zhenlei Chen. 2025. "Comprehensive Optimization of Air Quality in Kitchen Based on Auxiliary Evaluation Indicators" Applied Sciences 15, no. 12: 6755. https://doi.org/10.3390/app15126755
APA StyleHuang, H., Zhang, S., Zhao, X., & Chen, Z. (2025). Comprehensive Optimization of Air Quality in Kitchen Based on Auxiliary Evaluation Indicators. Applied Sciences, 15(12), 6755. https://doi.org/10.3390/app15126755