
Design Strategies for Mobile Click-and-Load Waiting Scenarios

 , ,
, ,
Abstract
1. Introduction
- Systematically categorizing mobile click-to-load scenarios and clearly defining three typical scenarios: tab page, content page, and half-screen page;
- Constructing a comprehensive design framework that encompasses interface strategy, symbol strategy, and layout strategy;
- Employing a multidimensional evaluation system to systematically investigate users’ subjective experiences during the click-to-load process, thereby providing a theoretical basis for design practice and assisting designers in optimizing feedback strategies across different transition scenarios to enhance the mobile waiting experience and interaction quality.
2. Related Work
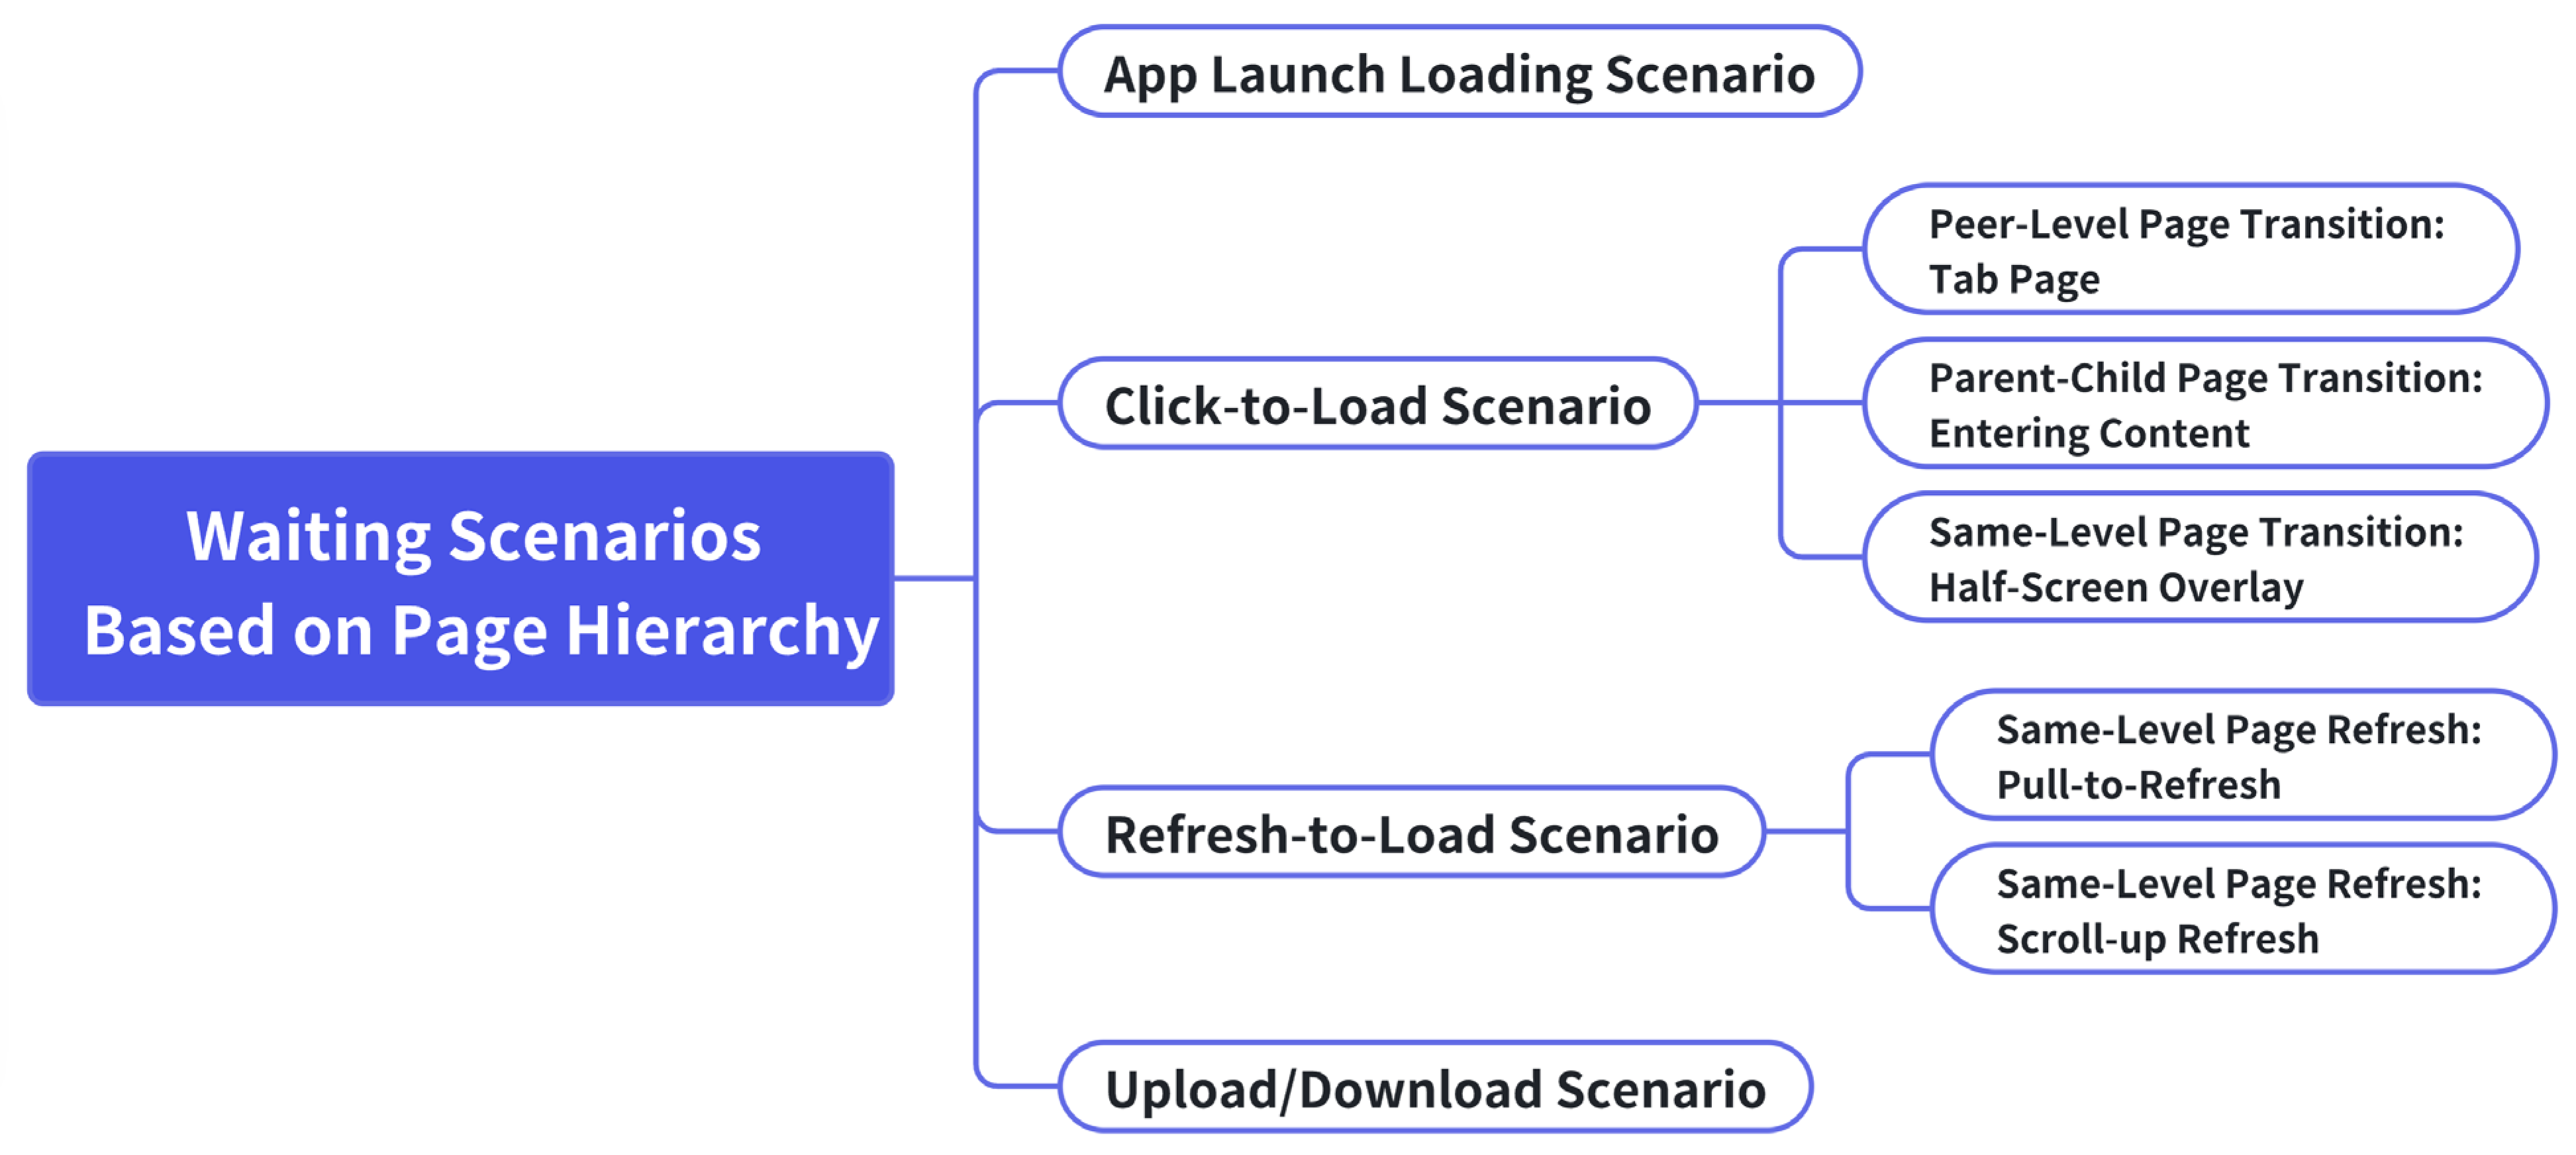
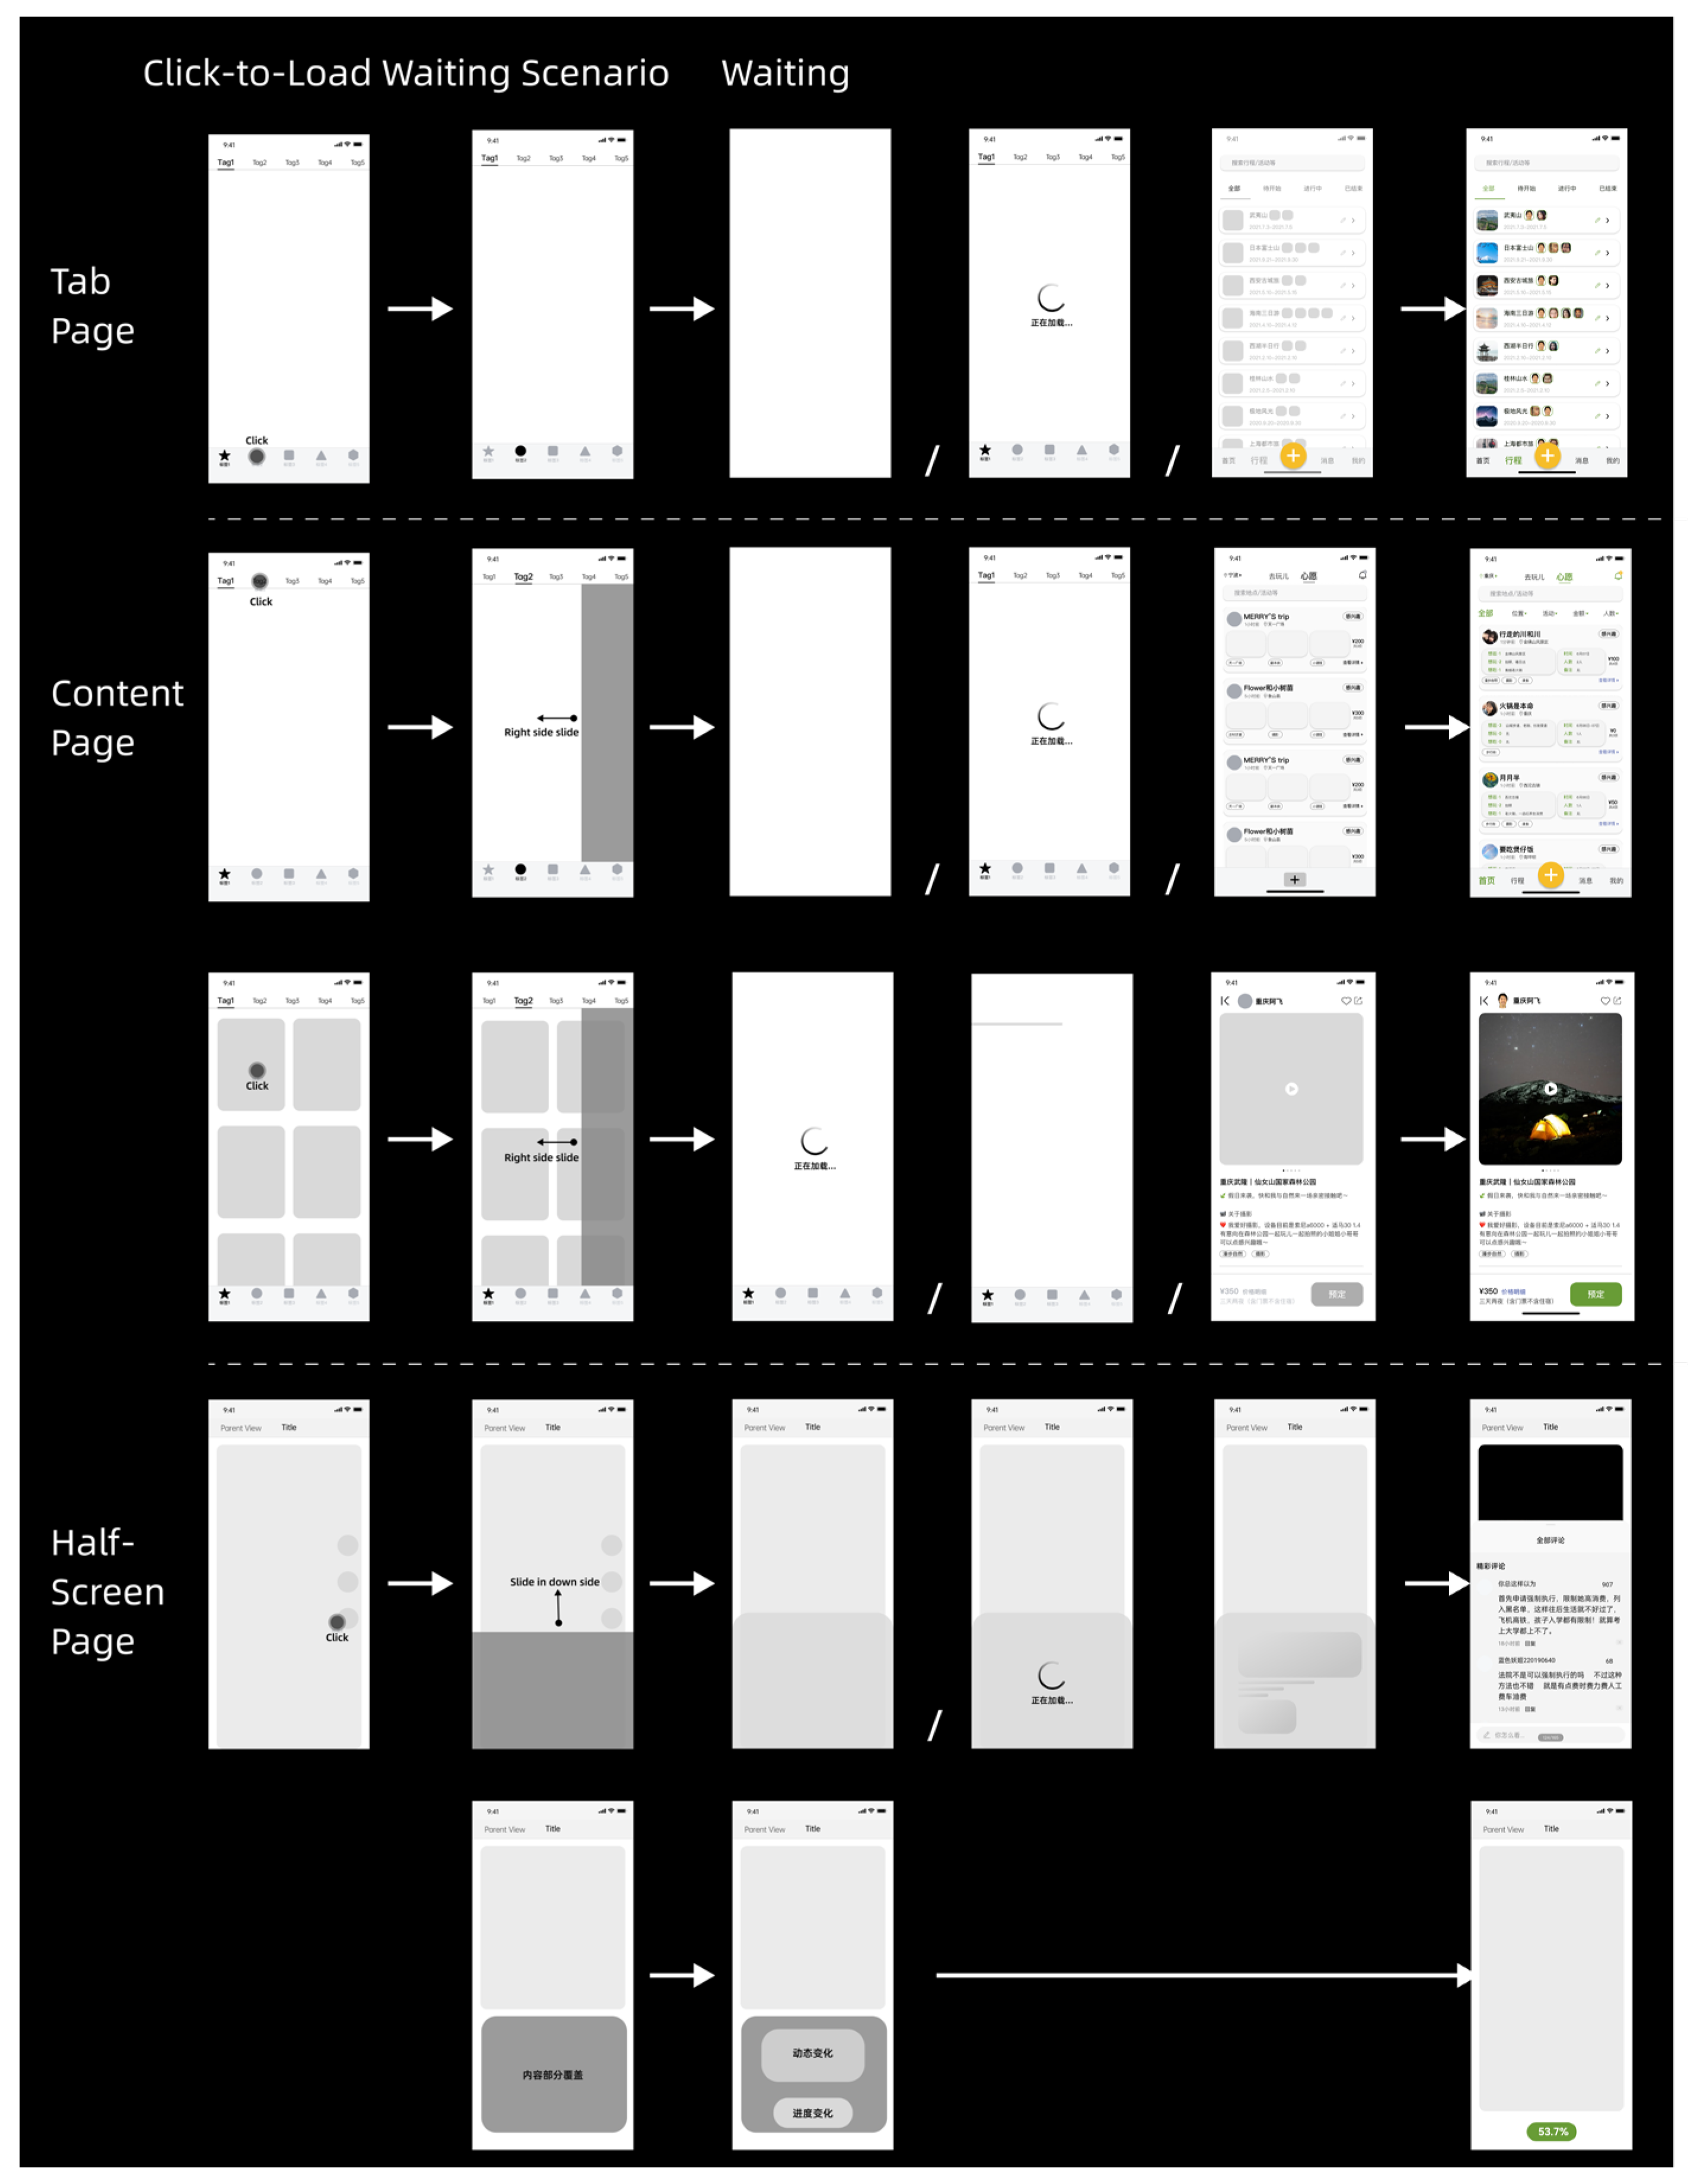
2.1. Classification of Loading Waiting Scenarios
- Tab page transitions refer to lateral switches between pages at the same level, commonly observed in the functional tabs of a home page’s bottom navigation bar. When a user clicks on a tab—such as “Home”—thereby triggering a loading operation, the system updates the page content to display the most recent data.
- Content page transitions involve hierarchical changes between parent and subordinate pages. This is often seen in content-centric applications, such as those featuring videos or illustrated notes, where users click on titles, images, or card modules to navigate from an information aggregation page to a subpage that presents detailed content.
- Half-screen transitions entail the partial overlay of a new interface on the existing page, which is a pattern frequently found in interactive zones like comment sections or pop-up detail panels. This type of transition typically appears as a floating layer that does not completely obscure the underlying page and supports localized refreshes to update its content.
2.2. Design Strategies for Waiting Scenarios
2.3. Design of Waiting Experience Metrics
- User Experience Satisfaction Metrics: hese originated from the Customer Satisfaction (CSAT) theory proposed in 1965 and typically utilize a five-point Likert scale to assess users’ immediate evaluations upon completing product functions (ranging from “very satisfied” to “very dissatisfied”). This metric is widely applied in the fields of internet services, e-commerce, and software products as a fundamental tool for measuring user satisfaction with design, interface, and functionality [36,37,38].
- Time Perception Metrics: These include methods such as the time perception technique and subjective loading speed questionnaires. The former focuses on users’ ability to perceive and reproduce time intervals, reflecting differences in attention and cognitive load; the latter captures users’ subjective ratings of loading time, thereby revealing the relationship between design fillers and users’ intuitive impressions, which can assist designers in optimizing loading strategies [39].
- Emotion-Related Metrics: Researchers employ instruments such as the PANAS scale [40] and the DASS-21 scale [41] to assess users’ emotional states during waiting periods. In recent years, the Self-Assessment Manikin (SAM), a graphical emotion self-report tool based on valence–arousal level dimensions [42], has been widely used in user emotion research. This tool allows users to indicate their emotional state through intuitive cartoon figures, thereby avoiding potential misinterpretations associated with textual descriptions.
3. Methodology
3.1. Research Purpose
- Do different page transition scenarios have differential impacts on users’ time perception and waiting evaluations?
- How do the three interface design strategies (interface style, loading indicator, and page layout) individually affect users’ waiting experiences in various transition scenarios?
- Are there significant differences among design strategies across different transition scenarios in terms of time perception, loading speed, satisfaction, emotional valence, and arousal level?
- Is there a universal design strategy that is applicable across multiple transition scenarios?
- How are users’ subjective preferences for different transition scenarios associated with their evaluations of the waiting experience?
3.2. Experiment Design
- Experiment 1: Interface Strategy Experiment
- Experiment 2: Loading Indicator Strategy Experiment
- Experiment 3: Layout Strategy Experiment
- Time Perception: Participants used the keyboard to replicate the perceived waiting duration.
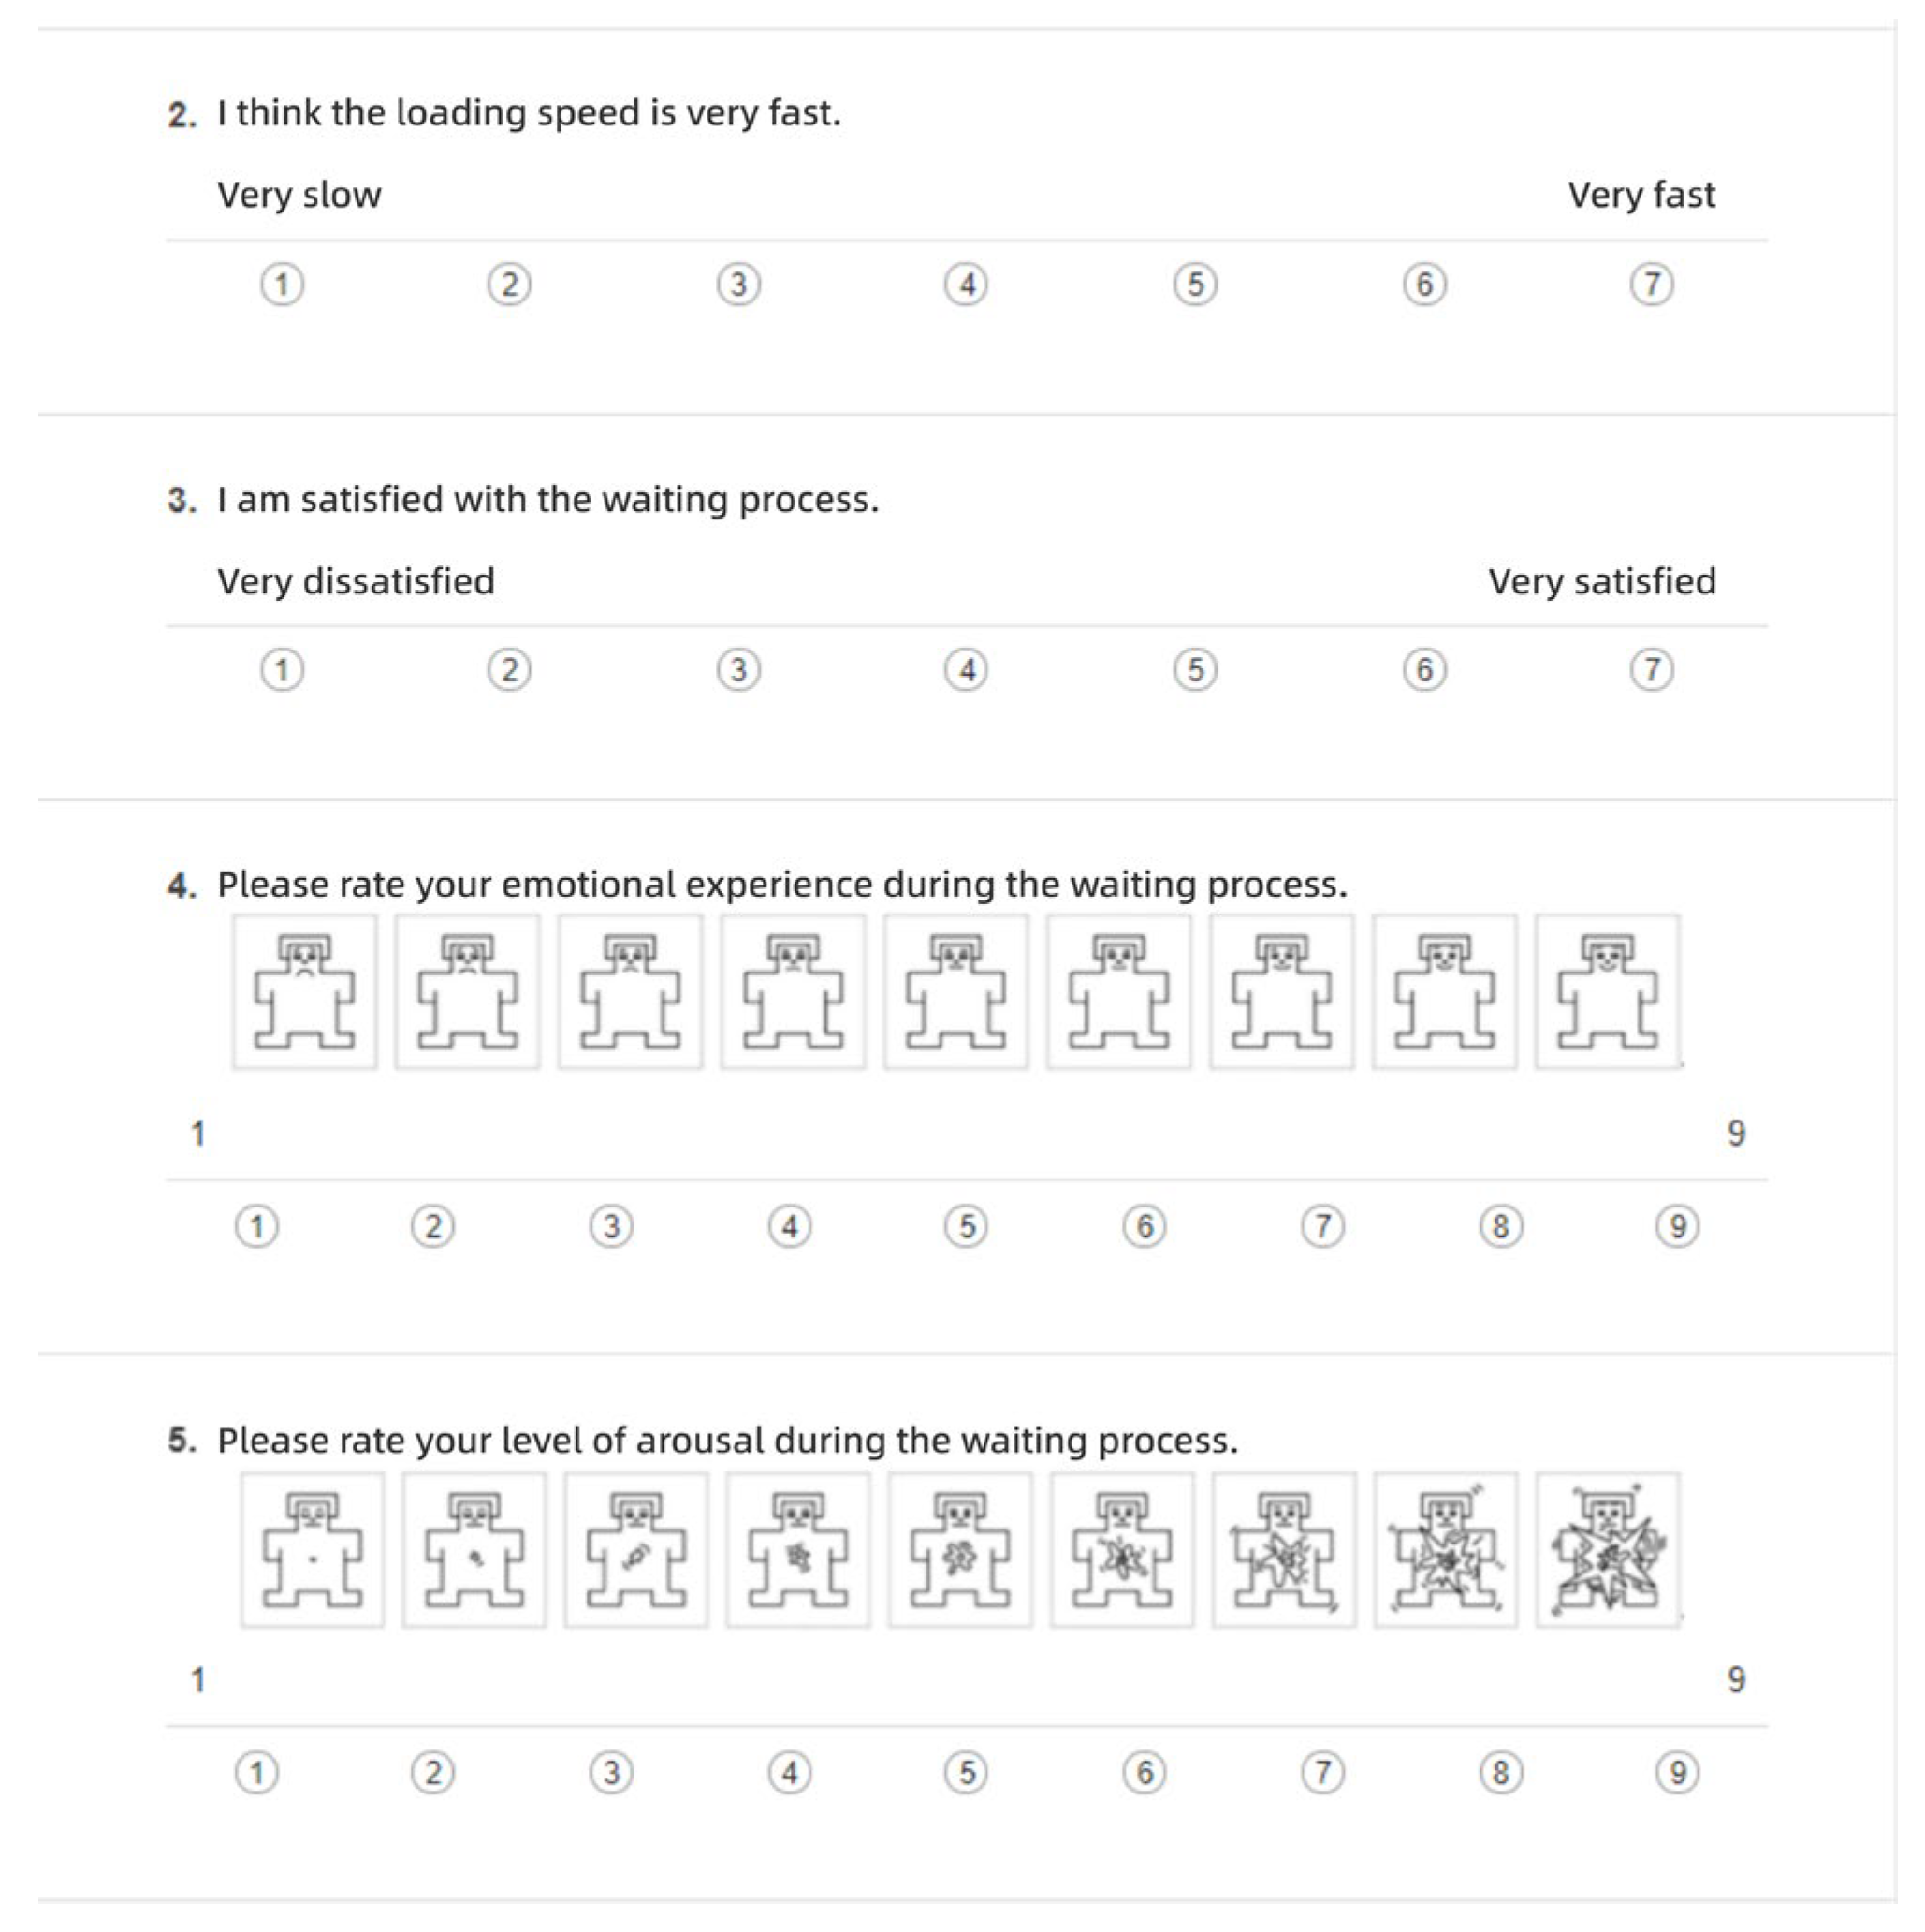
- Loading Speed: Participants provided a subjective rating of the loading speed, ranging from very slow (1) to very fast (7).
- Satisfaction: Participants rated their satisfaction with the current waiting experience, with scores ranging from very dissatisfied (1) to very satisfied (7).
- Emotional Valence: Participants rated their current emotional state during the waiting phase, with values ranging from very unhappy (1) to very happy (9).
- Arousal Level: This rating reflects the intensity of the participants’ emotions, ranging from low arousal level (1) to high arousal level (9).
3.3. Participants
3.4. Experimental Setting, Equipment, and Materials
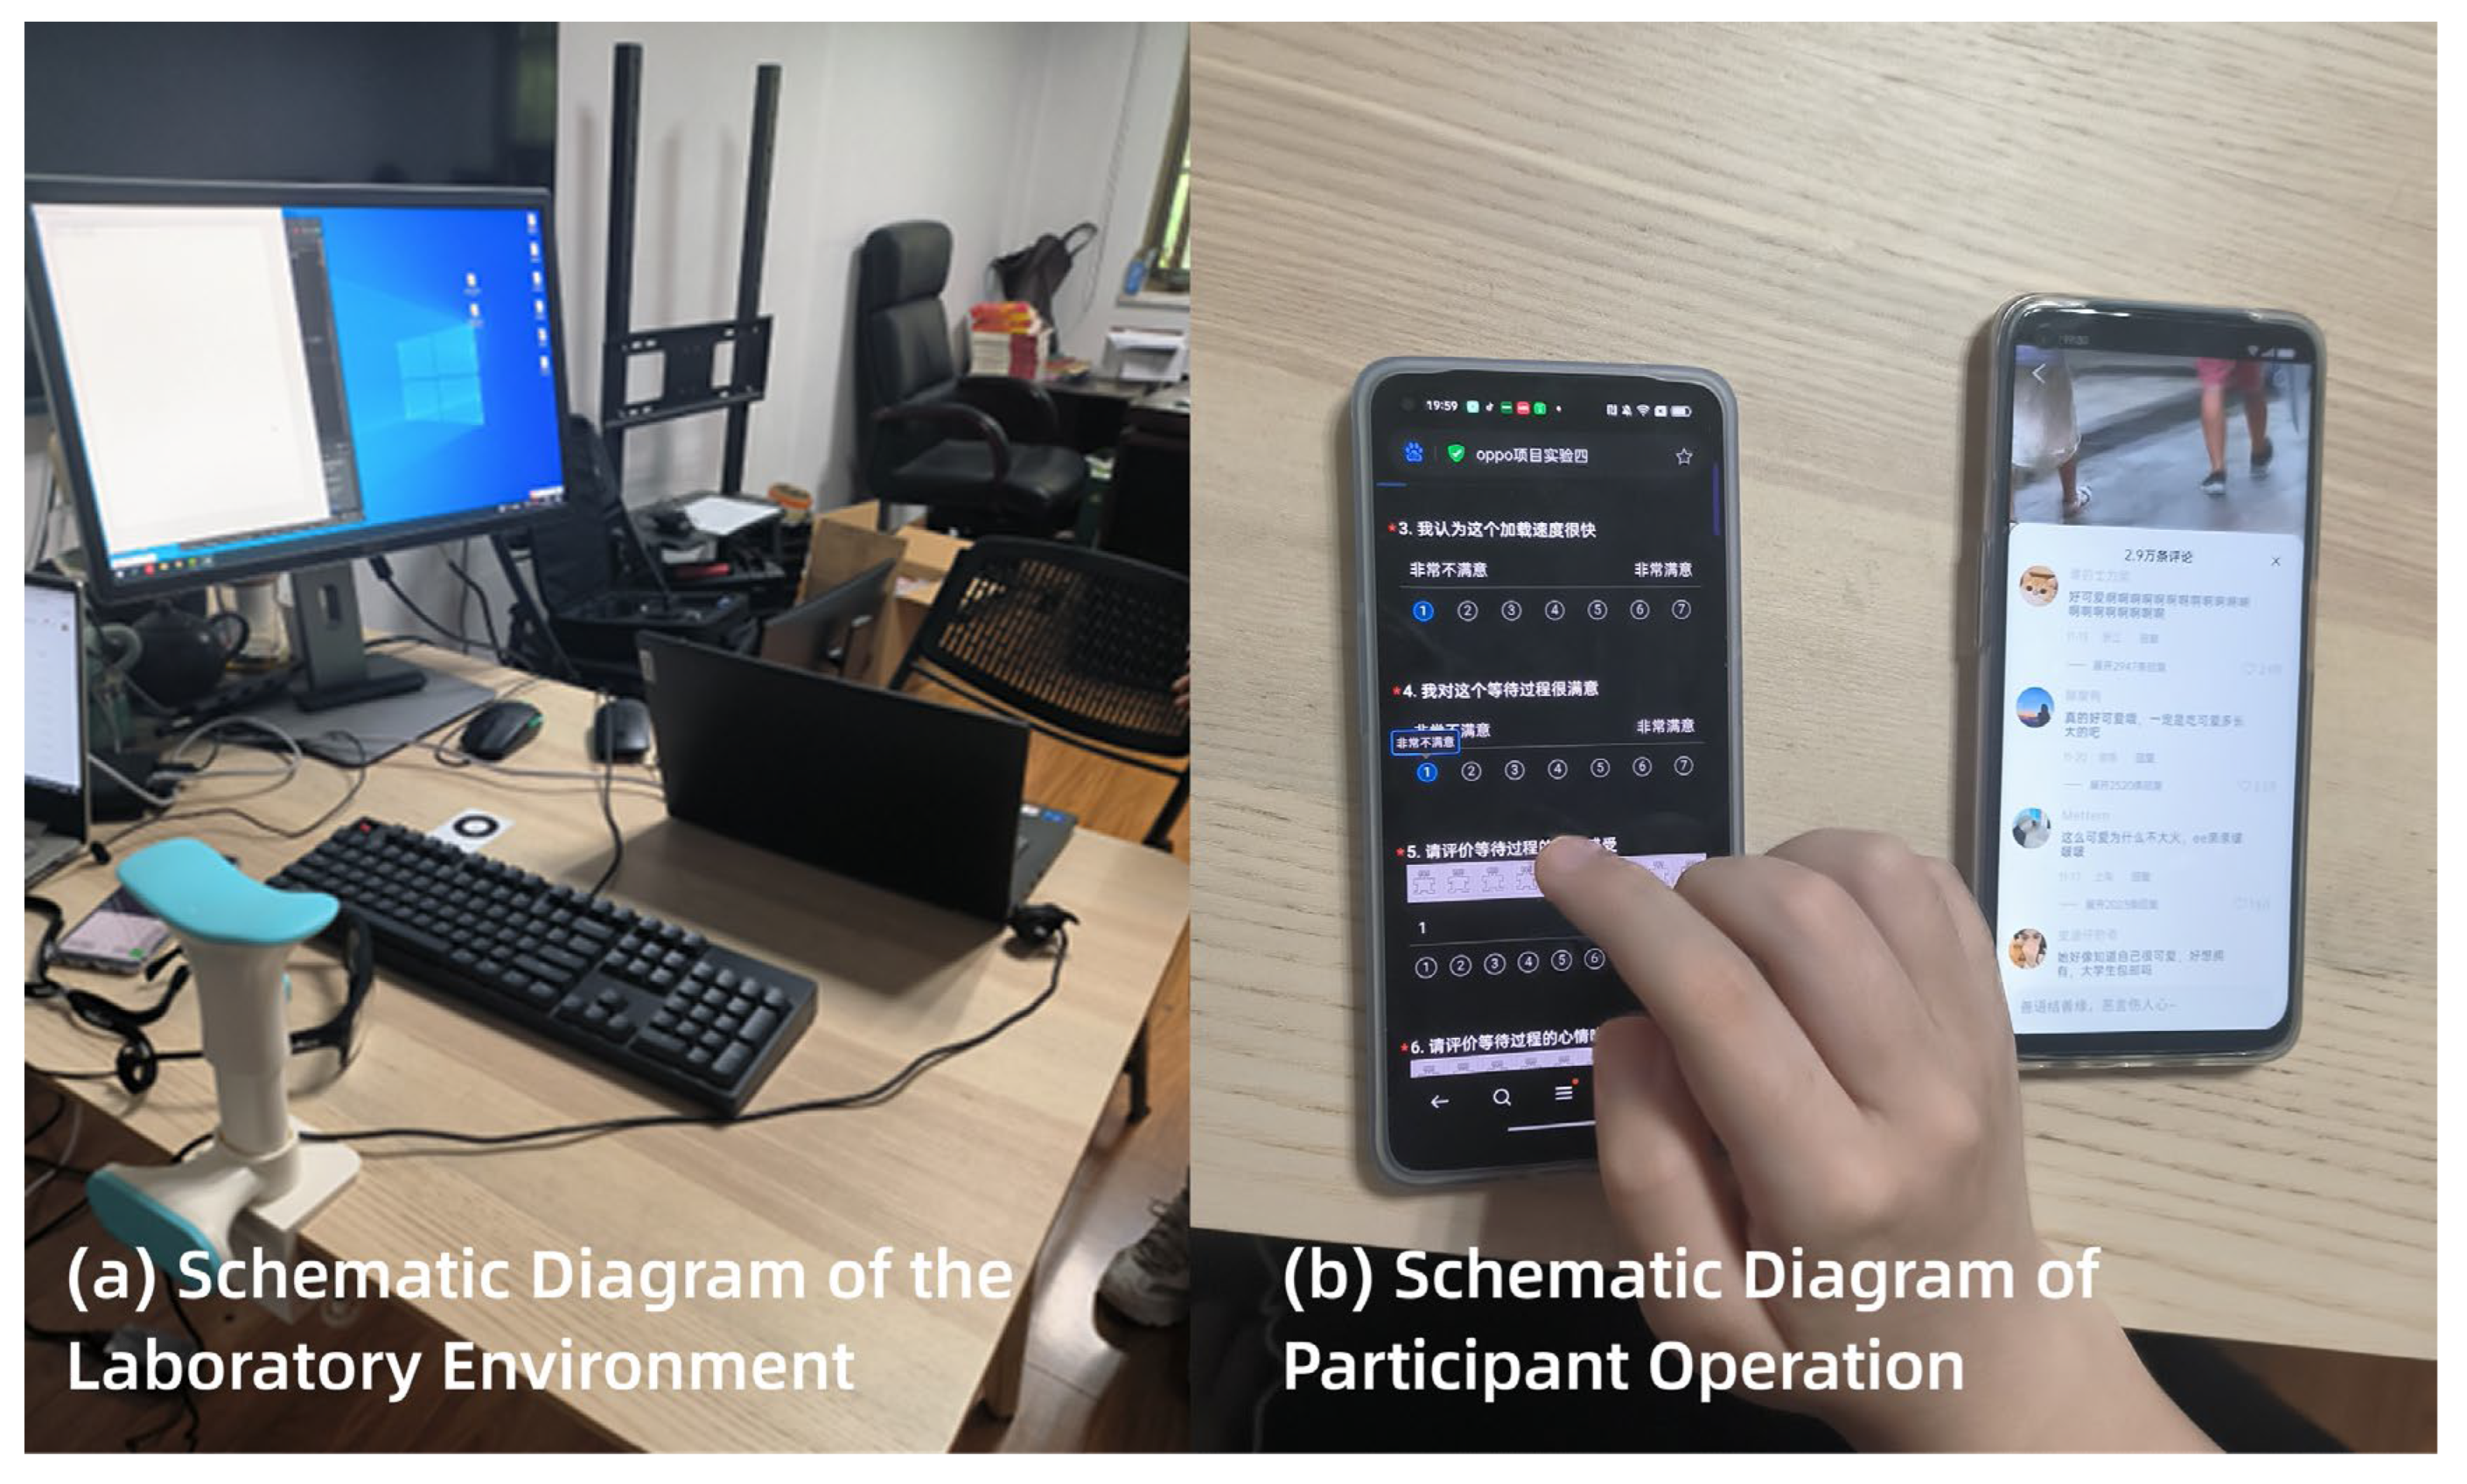
3.4.1. Equipment Description
3.4.2. Experimental Environment
3.4.3. Materials Description
- Python Program Code:
- 2.
- Experimental Stimuli:
- 3.
- Questionnaire Materials:
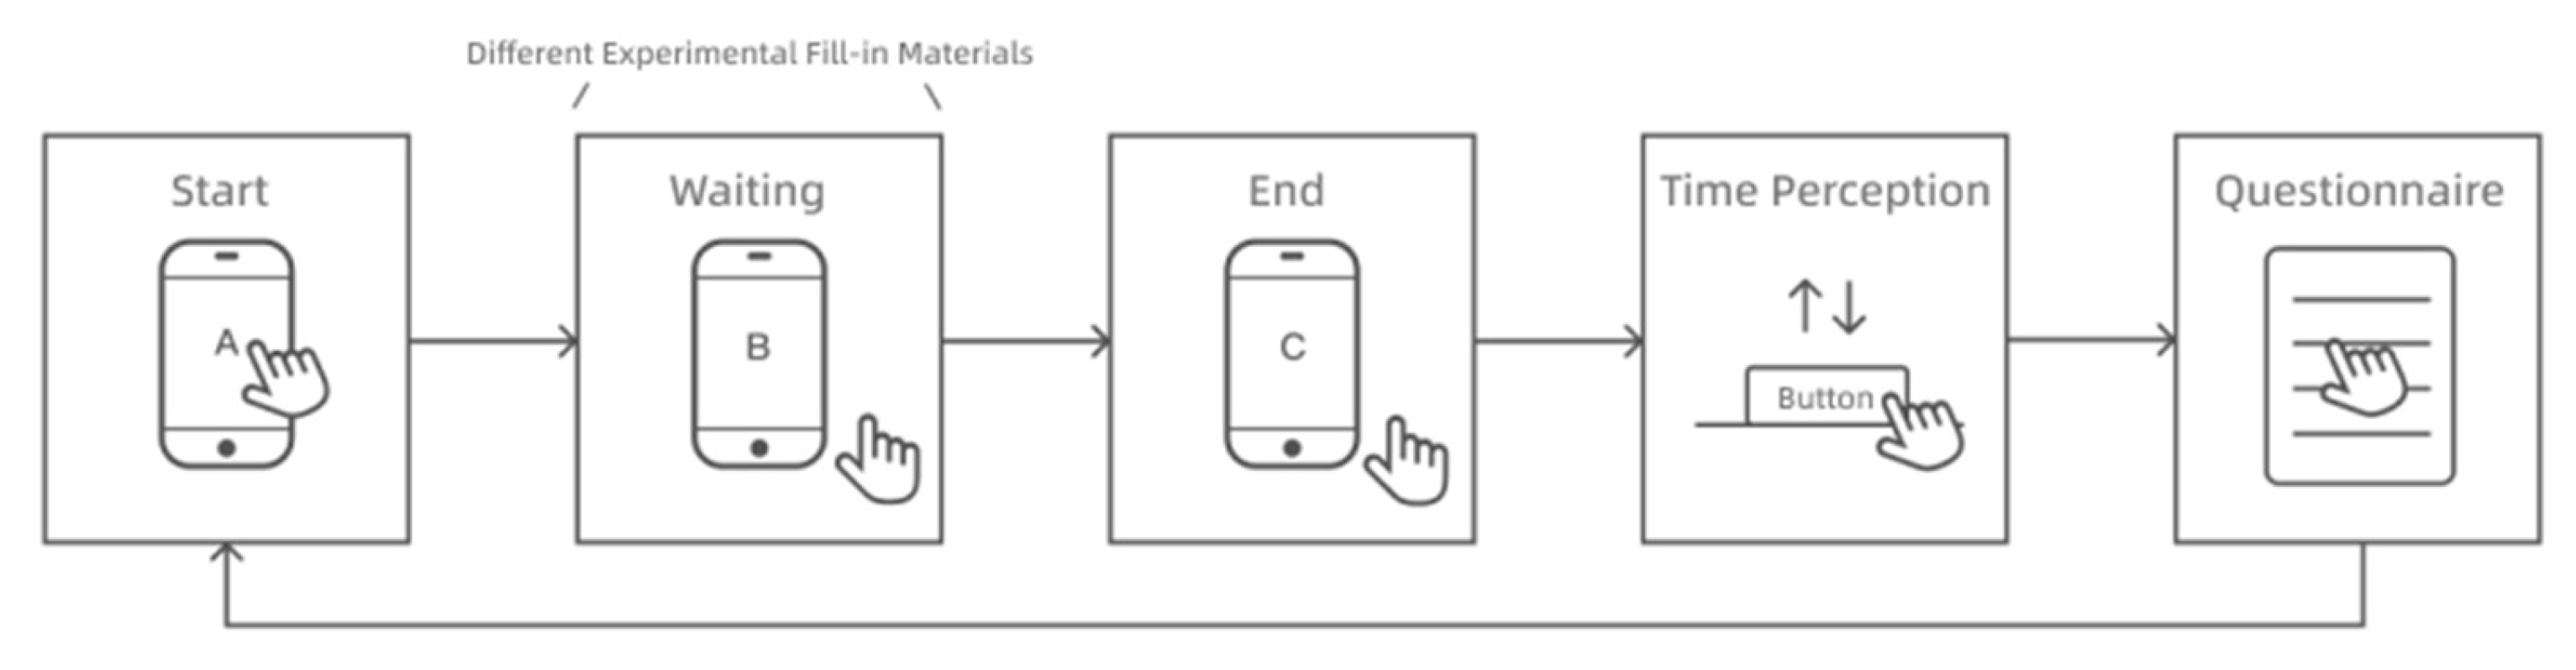
3.5. Procedure
- The experimenter instructed the participant to operate the smartphone in a designated context. After triggering a loading scenario, the participant was asked to perceive the duration of the loading screen.
- Once the perceived loading was complete, the participant was instructed to reproduce the experienced duration by holding down the space bar on the keyboard. The length of time the space bar was held down (in seconds) was recorded as the dependent variable, “time perception”.
- Following the time perception task, participants completed a subjective questionnaire. Based on their own perceptions, they rated the prior loading scenario across four dimensions: satisfaction, loading speed, emotional valence, and arousal level. This process was repeated for each loading sub-scenario.
4. Results
4.1. Waiting Interface Strategies in Page-Level Transitions
4.1.1. Tab Page Hierarchical Navigation Scenario
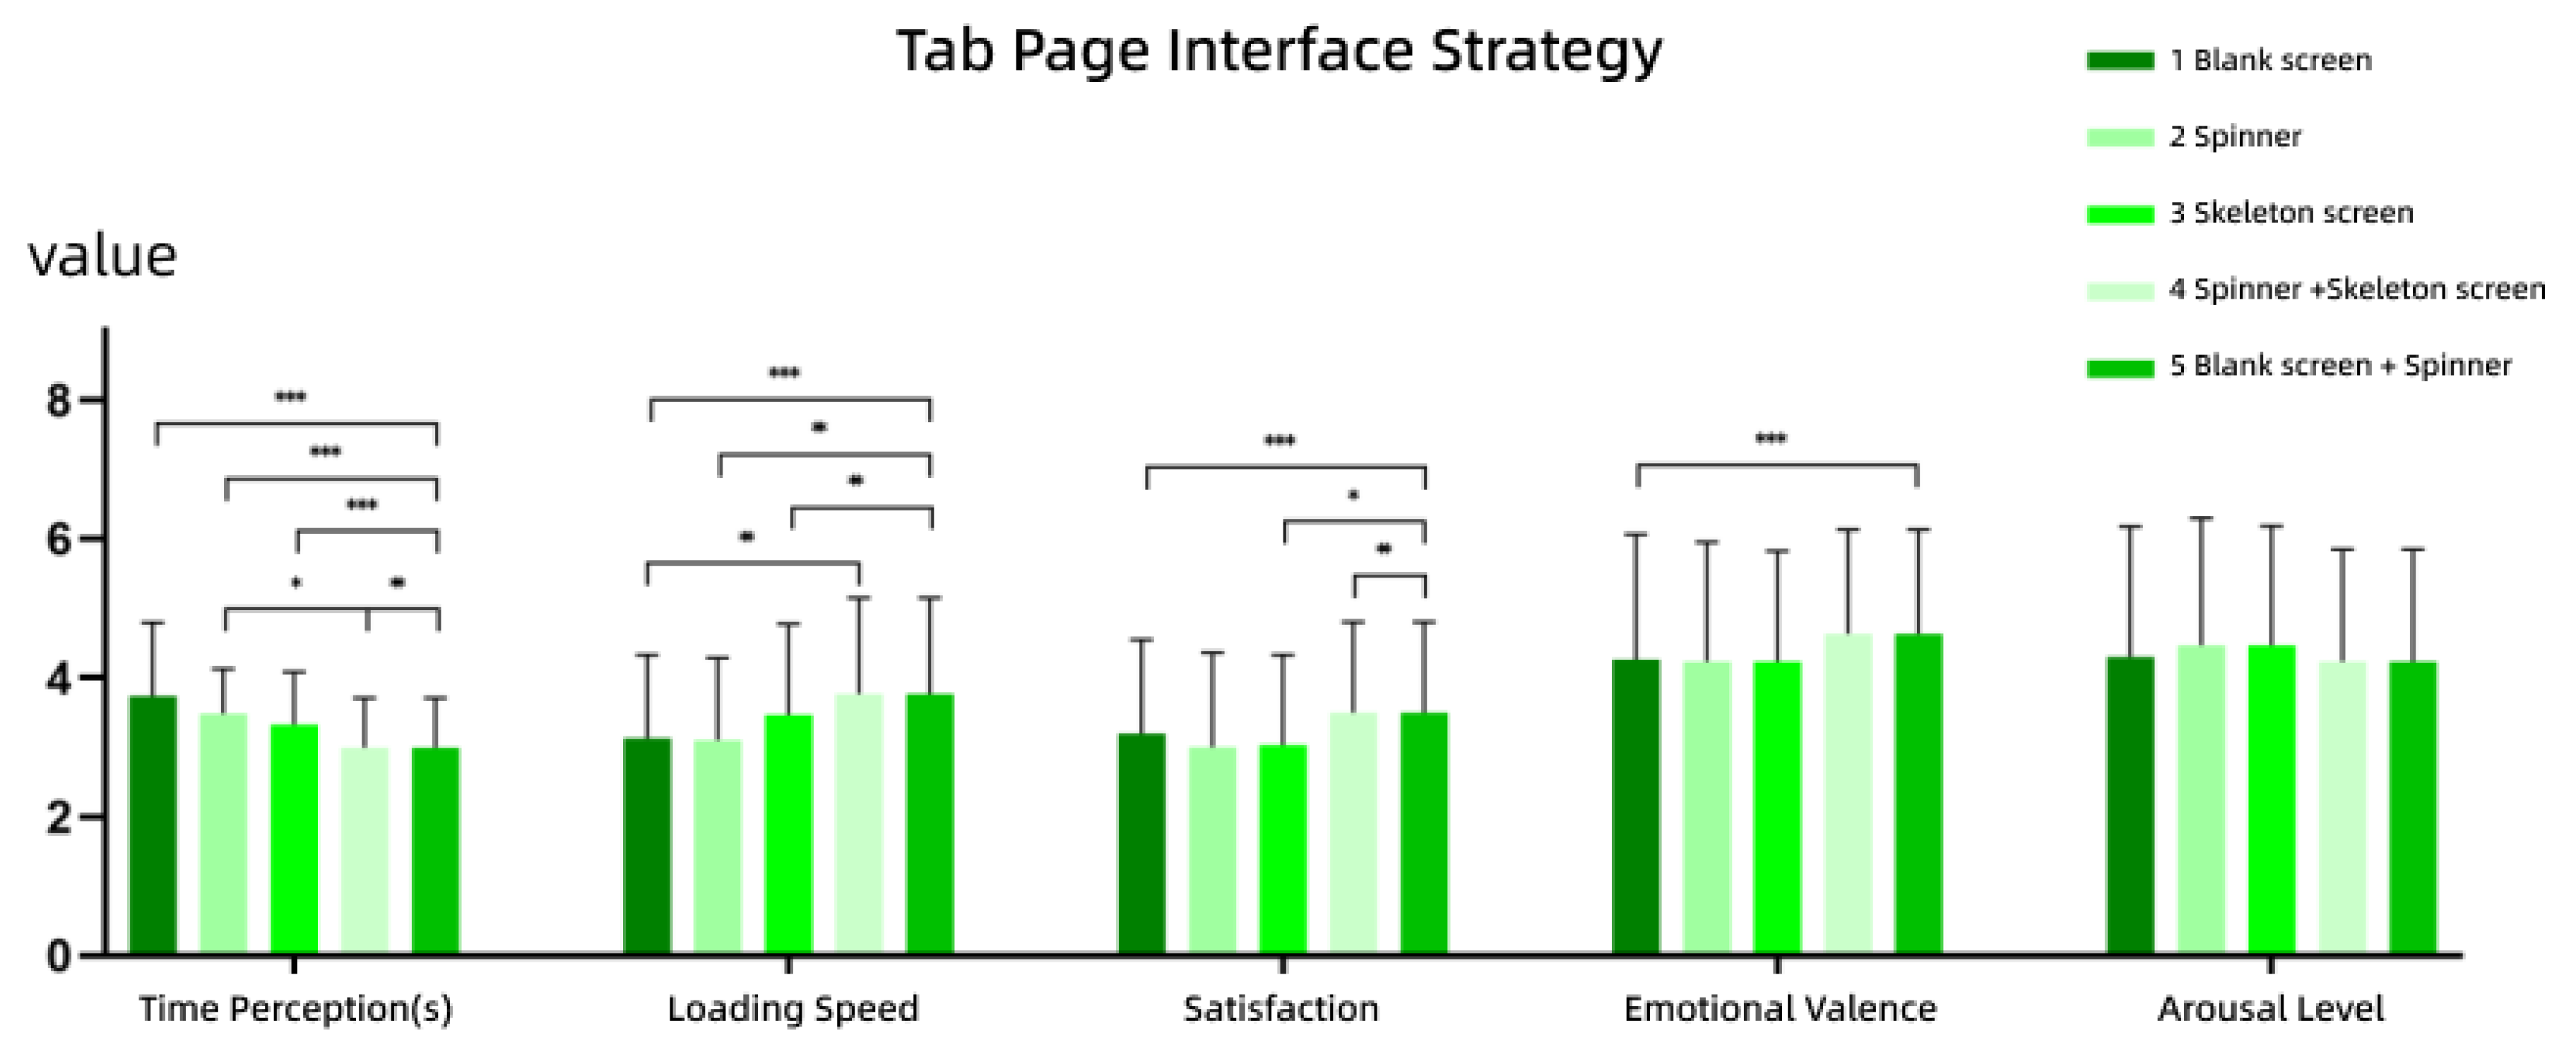
- Time Perception: The time perception for Interface 5 was significantly lower than that for Interfaces 1, 2, 3, and 4, indicating that users perceived a shorter duration when interacting with Interface 5. Moreover, the time perception for Interface 4 was significantly lower than for Interface 2. This suggests that within the group of loading animations featuring a spinner, the addition of a two-stage skeleton screen (as shown in Interface 4) reduced users’ perceived waiting time.
- Satisfaction: Satisfaction ratings for Interface 5 were significantly higher than those for Interfaces 1, 3, and 4, indicating that users were more satisfied with Interface 5 compared to the other three.
- Loading Speed: Interface 5 was rated significantly higher in loading speed than Interfaces 1, 2, and 3. Given that the objective waiting time remained constant across all conditions, this result implies that users subjectively experienced Interface 5 to be faster.
- Emotional Valence: Interface 5 received significantly higher ratings for emotional valence compared to Interface 1, suggesting that it elicited more positive emotions. Interface 1, as a blank screen without any feedback during the waiting period, failed to provide users with a sense of progress, potentially contributing to more negative emotional responses.
4.1.2. Content Page Hierarchical Navigation Scenario
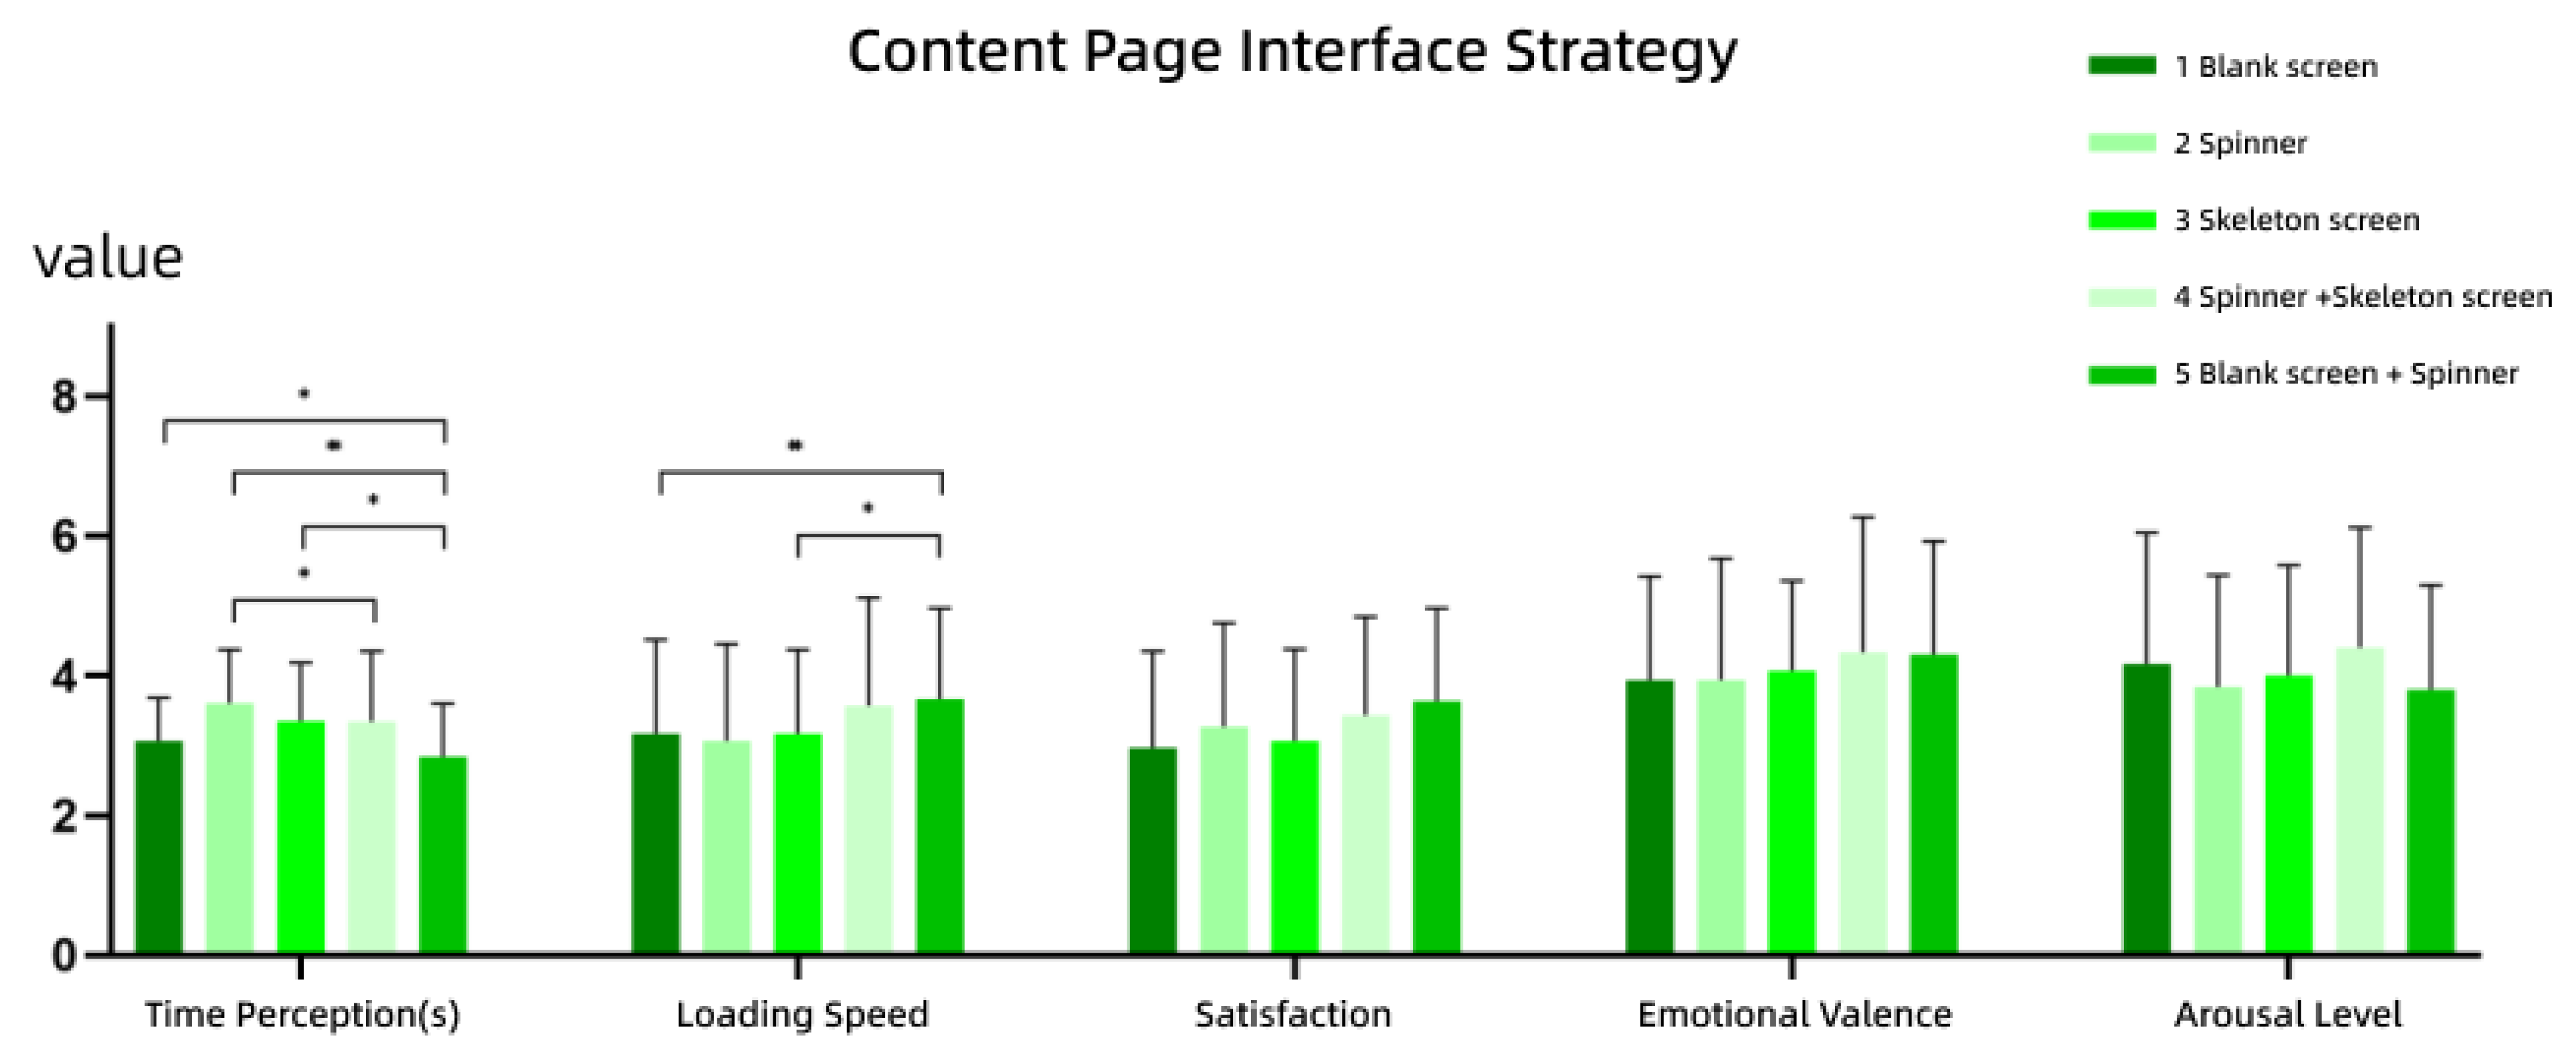
- Time Perception: The reproduced duration for Interface 5 was significantly lower than that Interfaces 1, 2, and 3, indicating that users perceived Interface 5 to have a shorter wait time. Additionally, Interface 4 had a significantly lower perception of time than Interface 2, suggesting that the inclusion of a two-stage skeleton screen in spinner-based loading interfaces reduced users’ perceived wait duration.
- Loading Speed: Interface 5 yielded significantly higher loading speed than Interfaces 1 and 3. Given that the actual waiting time remained constant across conditions, this indicates that users subjectively experienced Interface 5 to be faster.
4.1.3. Half-Screen Page Hierarchical Navigation Scenario
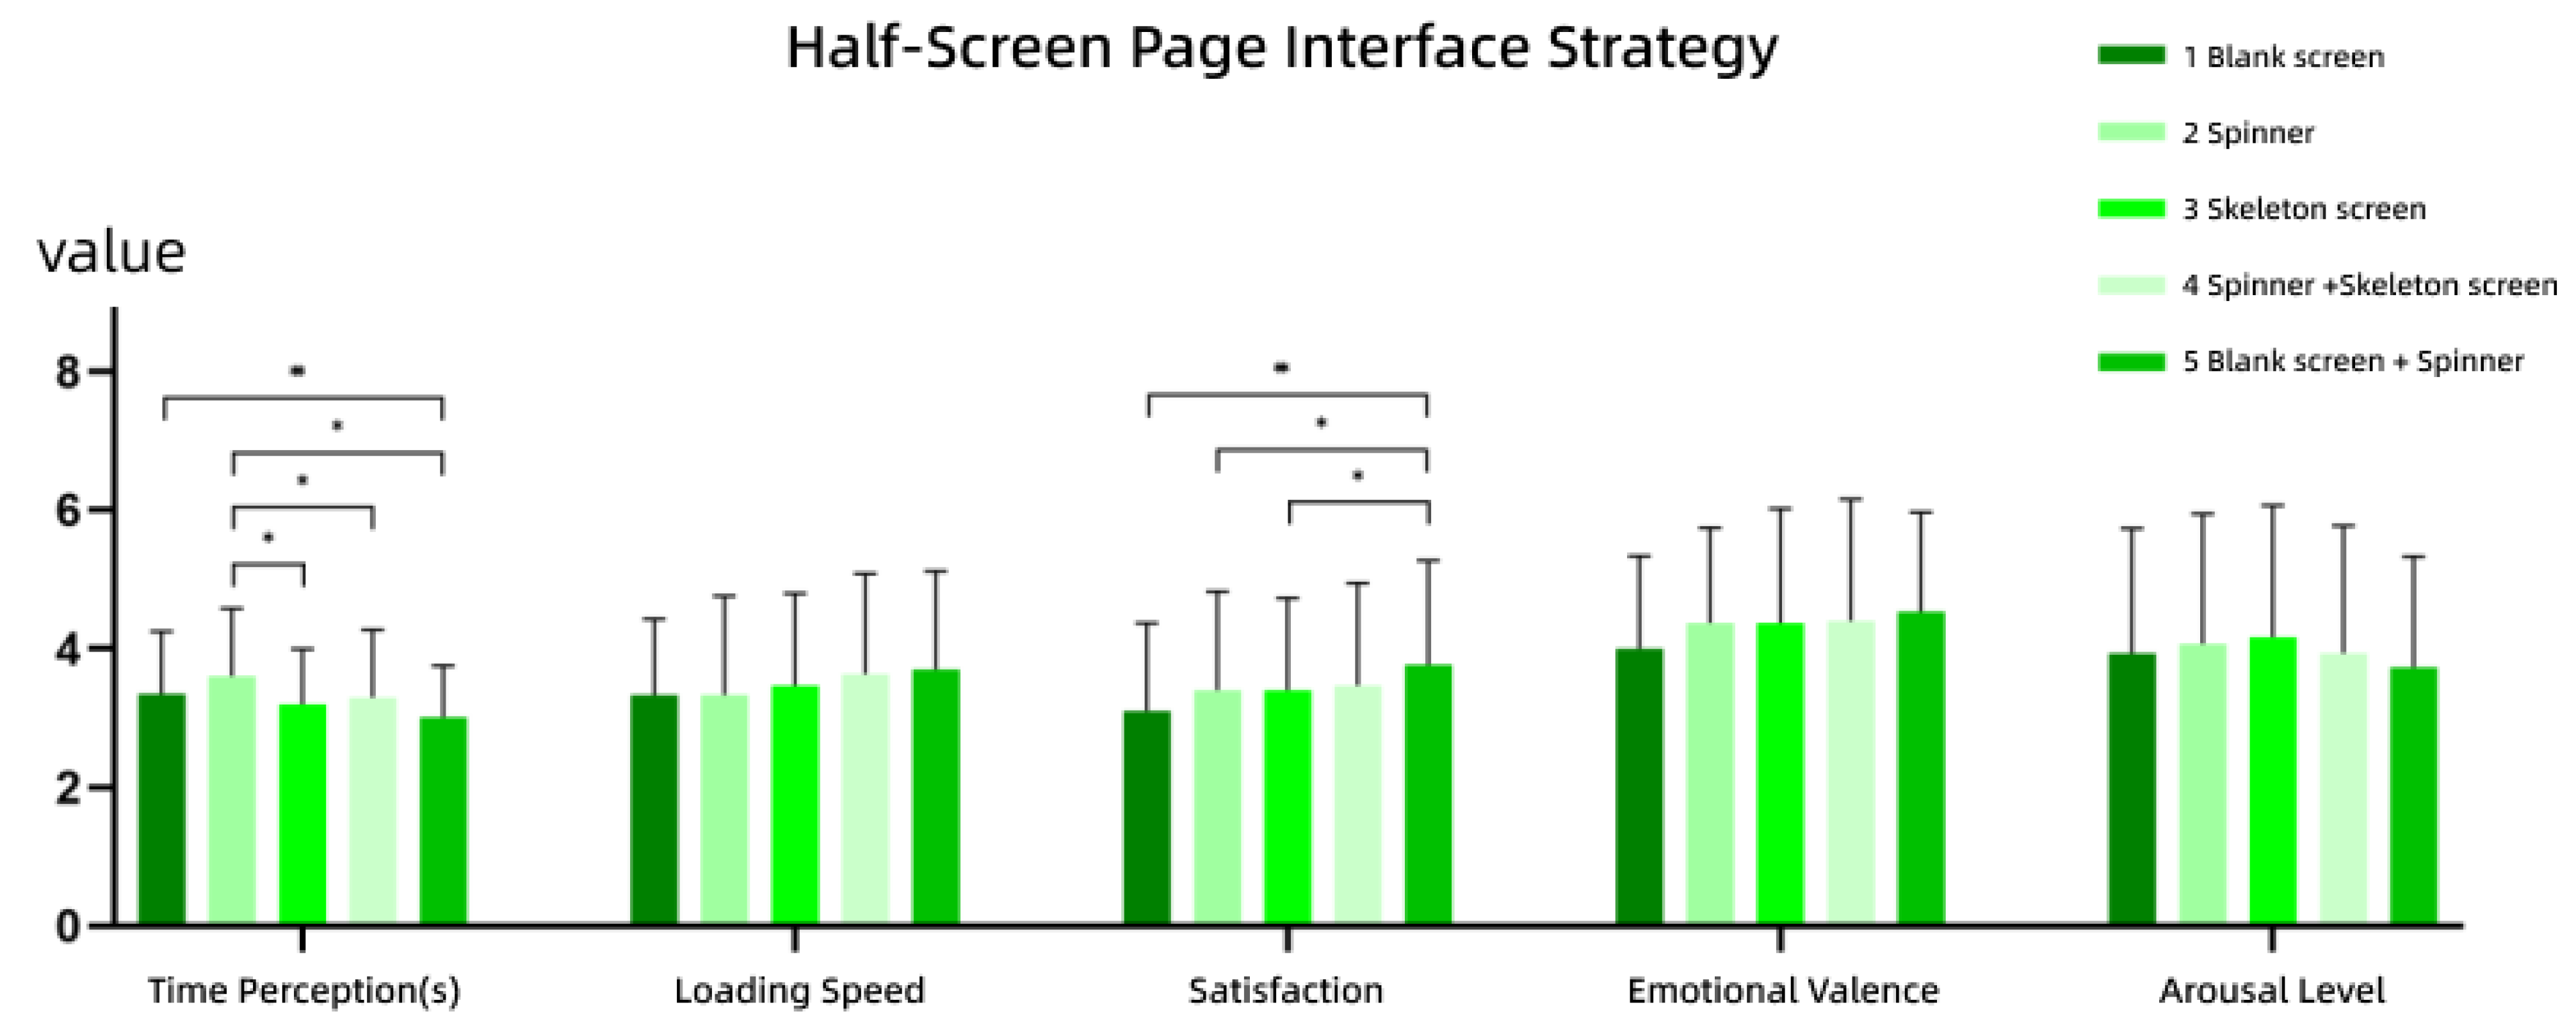
- Time Perception: The time perception for Interface 5 was significantly lower than that of Interfaces 1 and 2, indicating that users perceived a significantly shorter wait duration using Interface 5. Interface 2 showed a significantly higher time perception than Interfaces 3, 4, and 5, suggesting that, among spinner-based interfaces, adding a secondary screen (such as a blank or skeleton screen) helped reduce the perceived waiting time.
- Satisfaction: Interface 5 yielded significantly higher satisfaction than Interfaces 1, 2, and 3, demonstrating that users preferred the dual-stage feedback design (blank screen + spinner) over single-element strategies.
4.2. Loading Symbol Strategies for Hierarchical Page Transitions
4.2.1. Tab Page Scenario
- (1)
- Icons
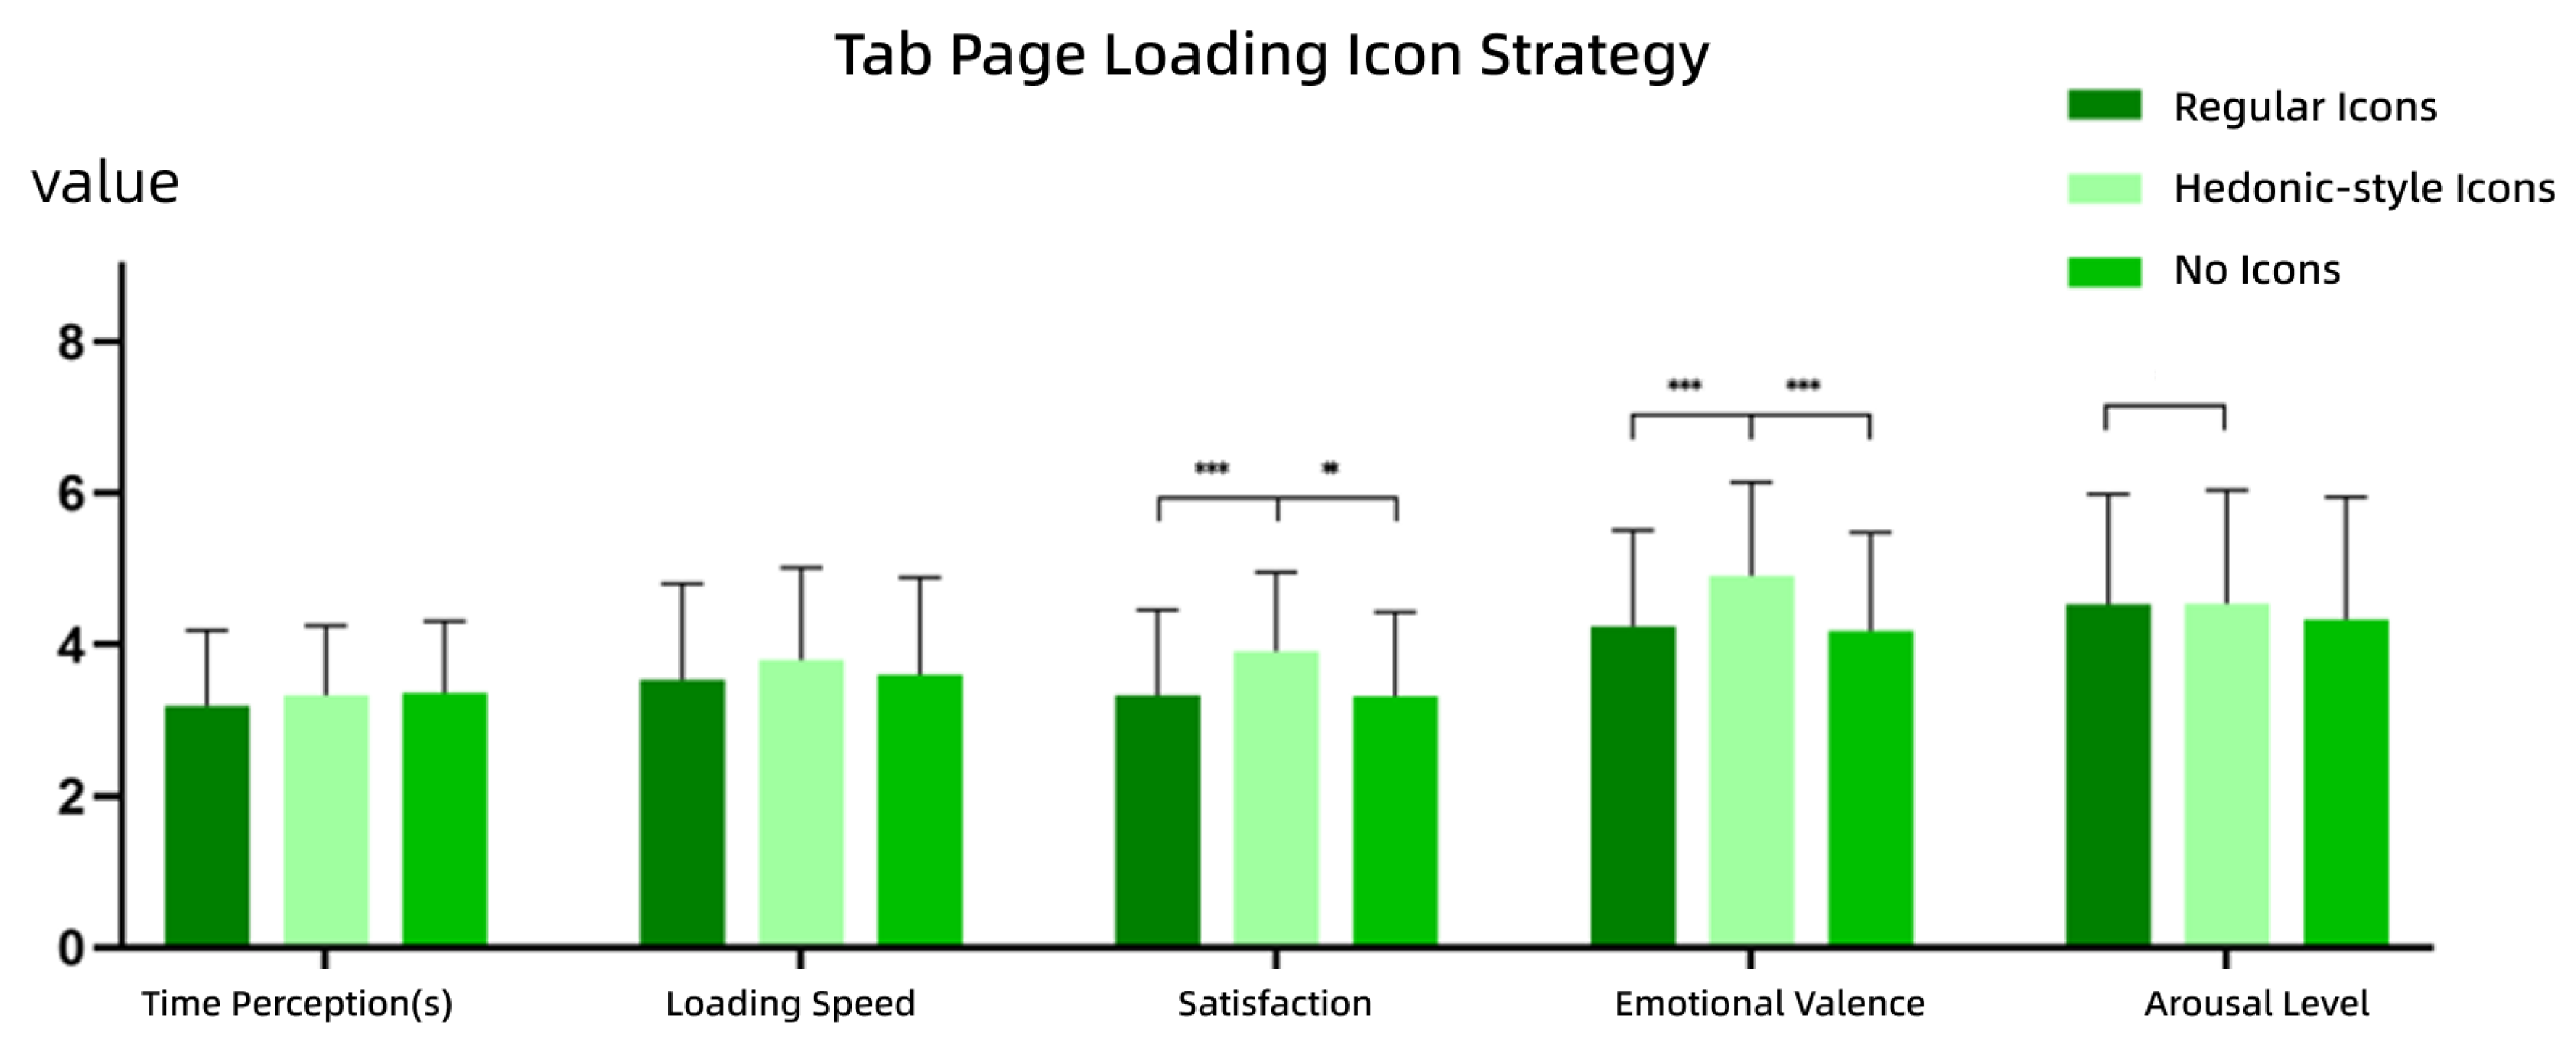
- Satisfaction: Participants reported significantly higher satisfaction for the hedonic-style icon conditions compared to both the regular icon and no icon conditions. This suggests that users tend to prefer hedonic-style icons, likely due to their visual appeal and entertainment value. No significant difference was found between the regular icons and no icon conditions.
- Emotional Valence: The hedonic-style icon condition also led to significantly more positive emotional responses than the other two conditions, indicating that hedonic-style icons can evoke more favorable affective experiences. There was no significant difference between regular icons and no icon conditions.
- Arousal Level: No significant difference was found across the icon strategies, suggesting that icon type does not notably affect users’ arousal levels.
- (2)
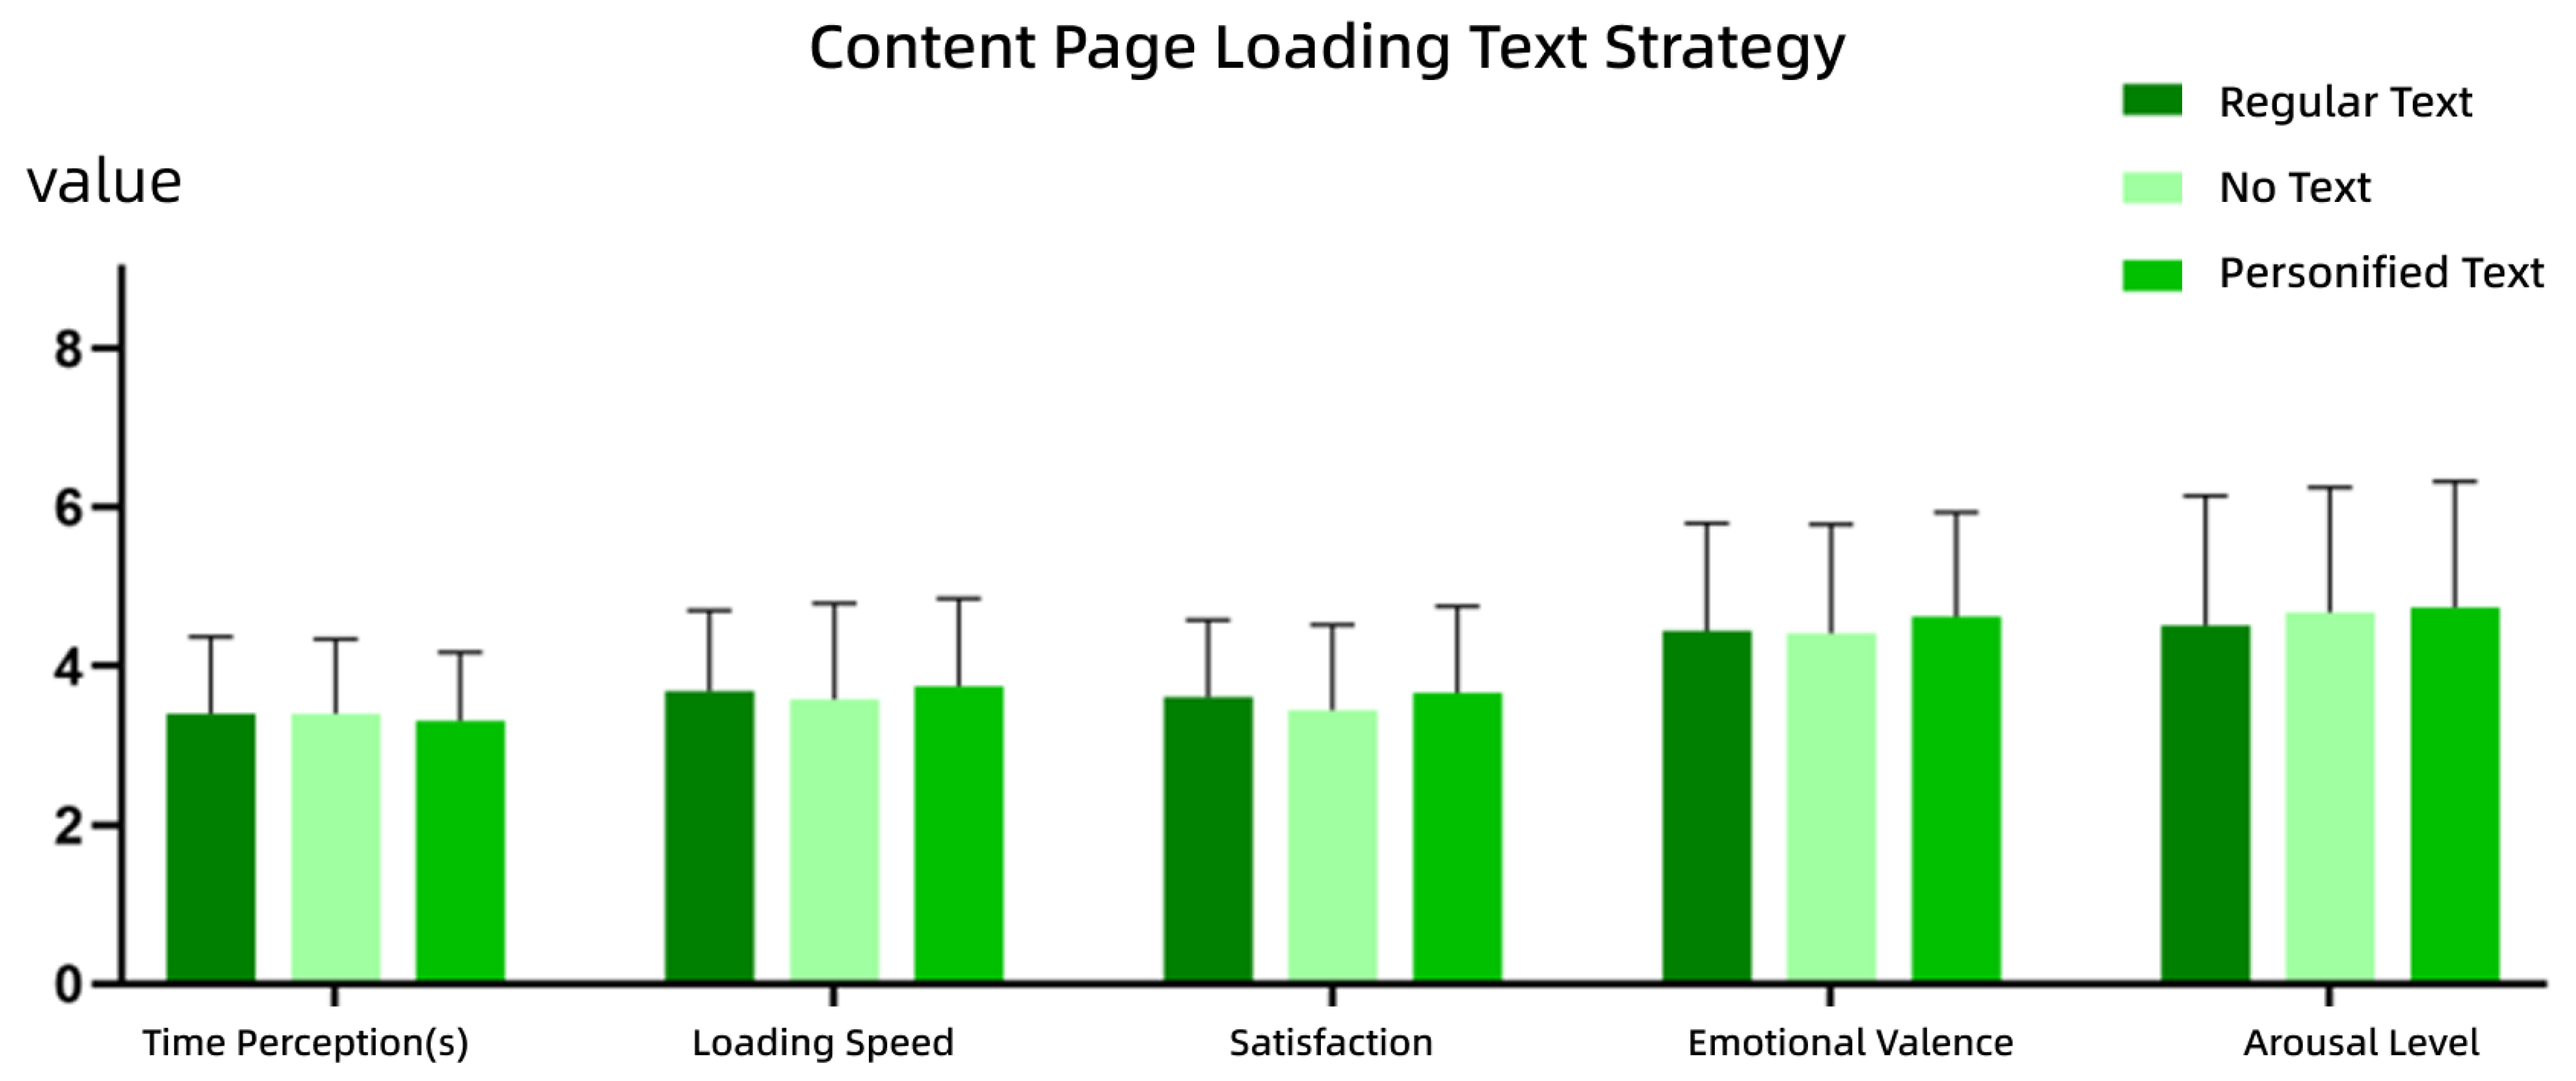
- Text
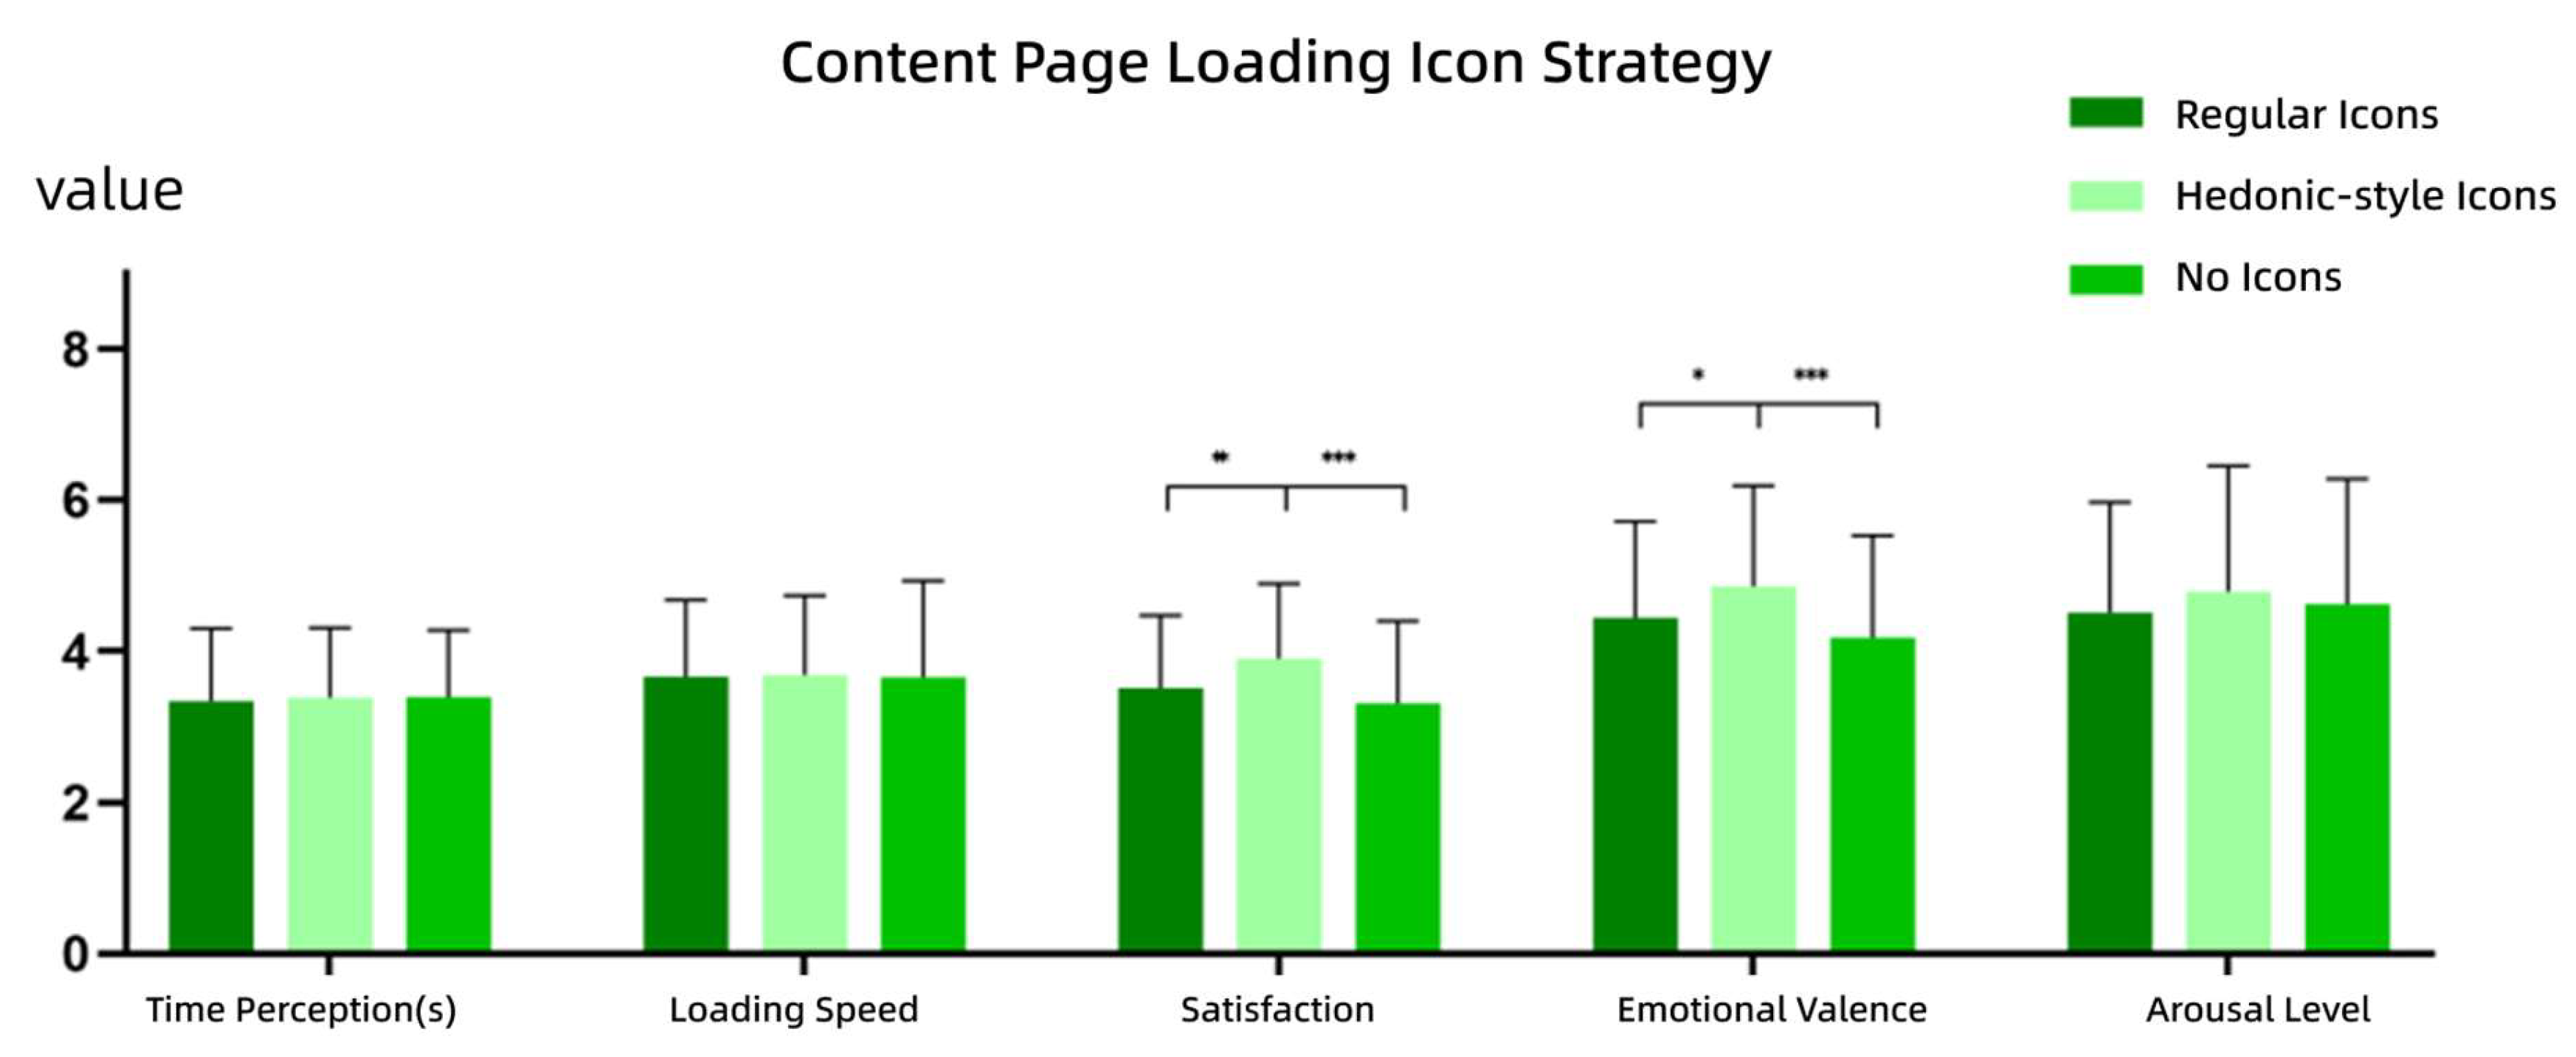
4.2.2. Content Page Scenario
- (1)
- Icons
- Satisfaction: The hedonic-style icon condition resulted in significantly higher satisfaction ratings compared to both the regular icon and no icon conditions, suggesting that users prefer hedonic-style icons, likely due to their engaging and entertaining appearance. There was no significant difference in satisfaction between the regular icons and no icon conditions.
- Emotional Valence: Emotional valence scores were significantly higher in the Hedonic-style icon condition than in the other two conditions, indicating that hedonic-style icons elicit more positive emotional experiences. No significant difference was found between regular icons and no icon conditions.
- (2)
- Text
4.2.3. Half-Screen Page Scenario
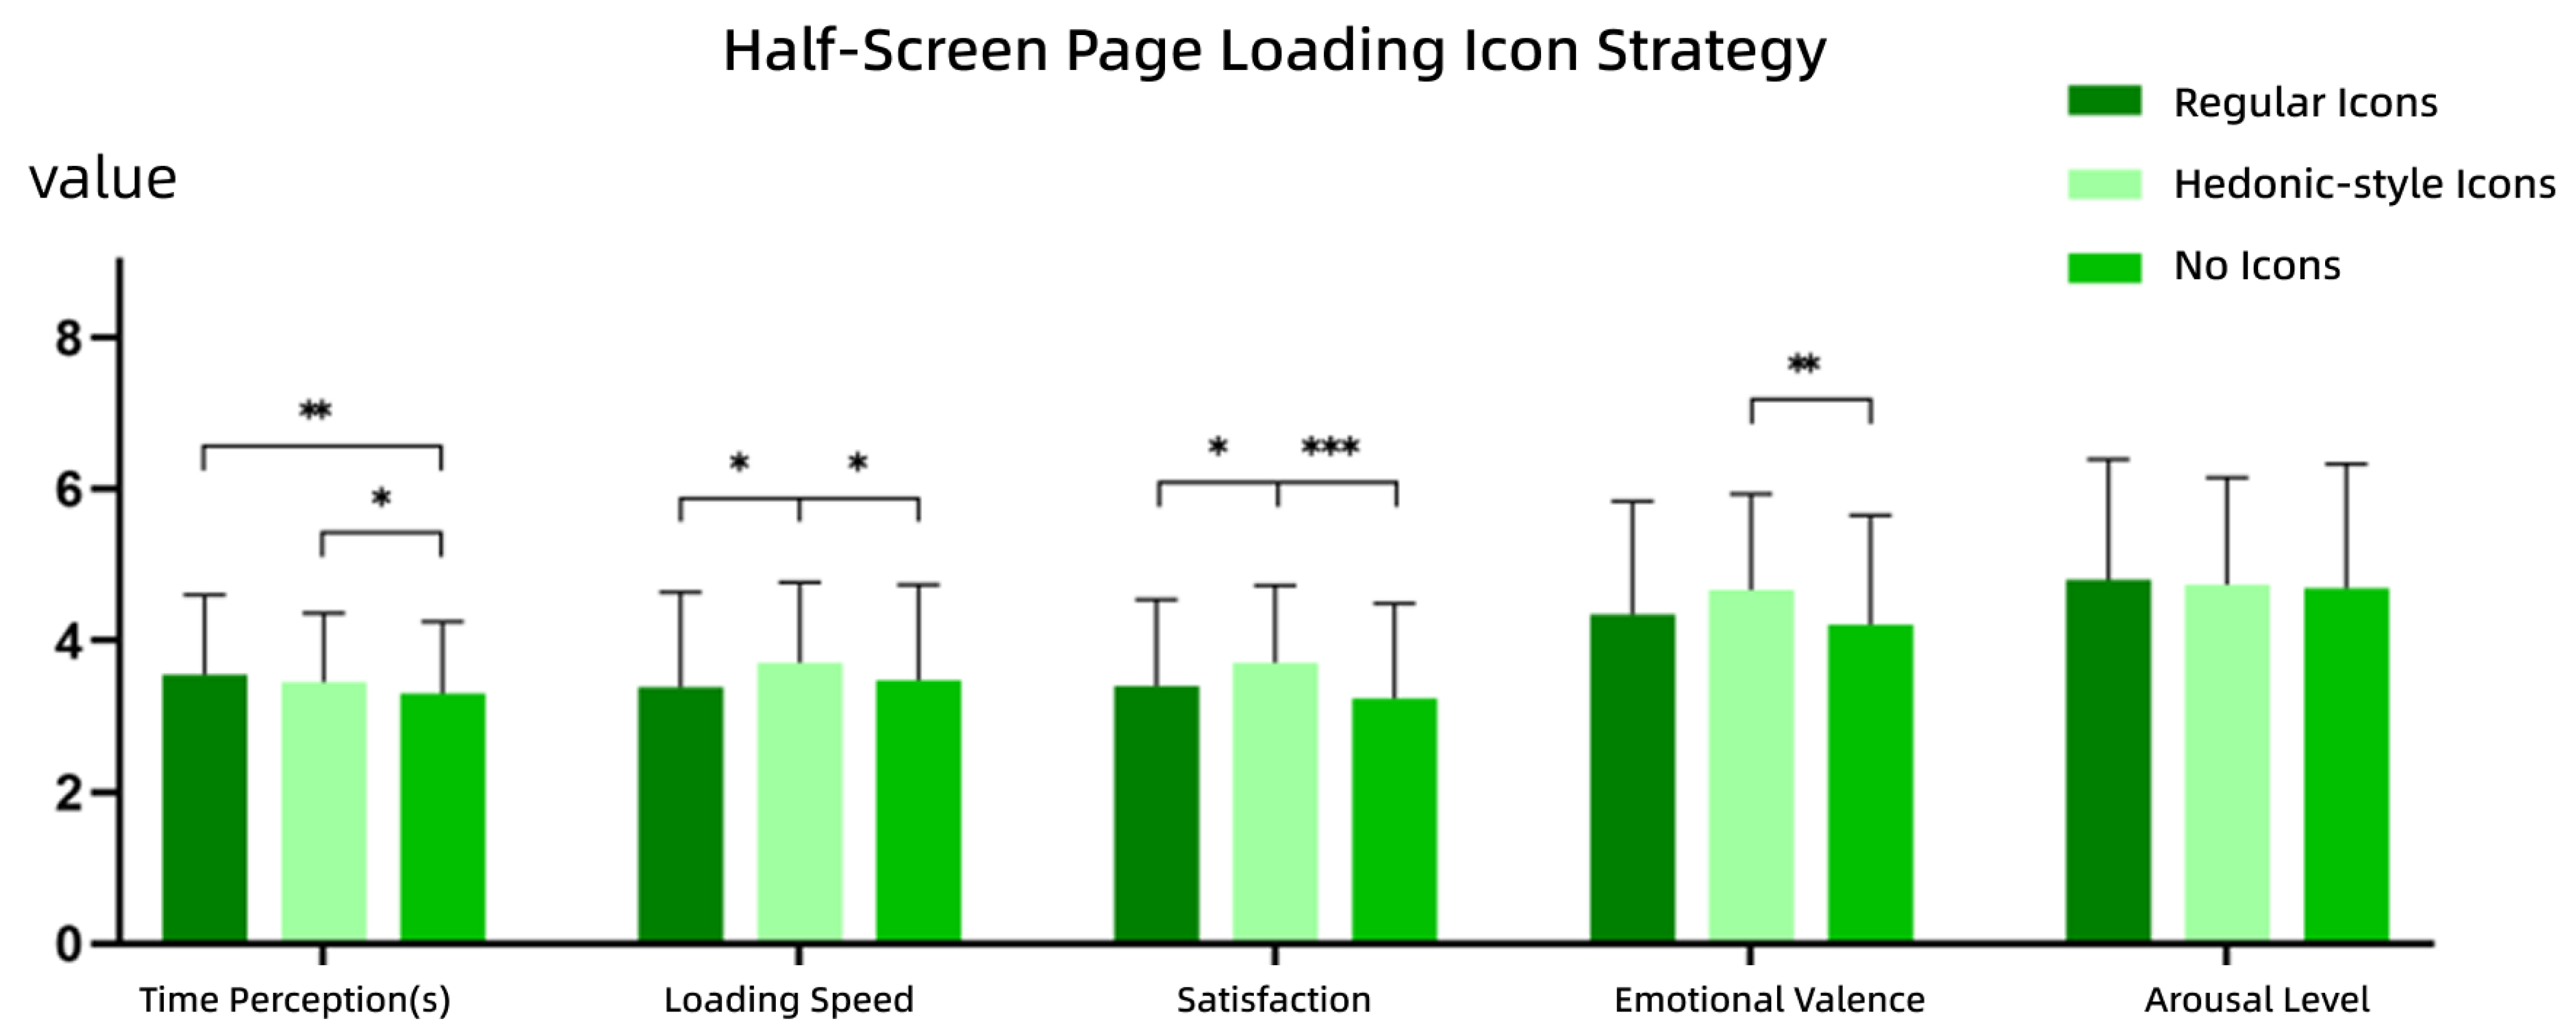
- (1)
- Icons
- Time Perception: No icon led to significantly lower time perception than both the regular icon and hedonic-style icon, suggesting that users perceived less time to pass when no icon was present. There was no significant difference in time perception between regular and hedonic-style icons.
- Loading Speed: Hedonic-style icons resulted in significantly faster perceived loading speeds than both the regular icon and no icon, suggesting that users felt the hedonic-style icon loaded faster. No significant difference was found between regular icons and no icon conditions.
- Satisfaction: Hedonic-style icons resulted in significantly higher satisfaction than both regular icons and no icons, indicating that users preferred the hedonic-style icon, likely due to its appeal and entertainment value. No significant difference in satisfaction was found between regular icons and no icons.
- Emotional Valence: Hedonic-style icons induced significantly higher emotional valence than no icons, suggesting that hedonic-style icons elicit more positive emotional experiences. No significant difference was found between the regular icons and no icons in terms of emotional valence.
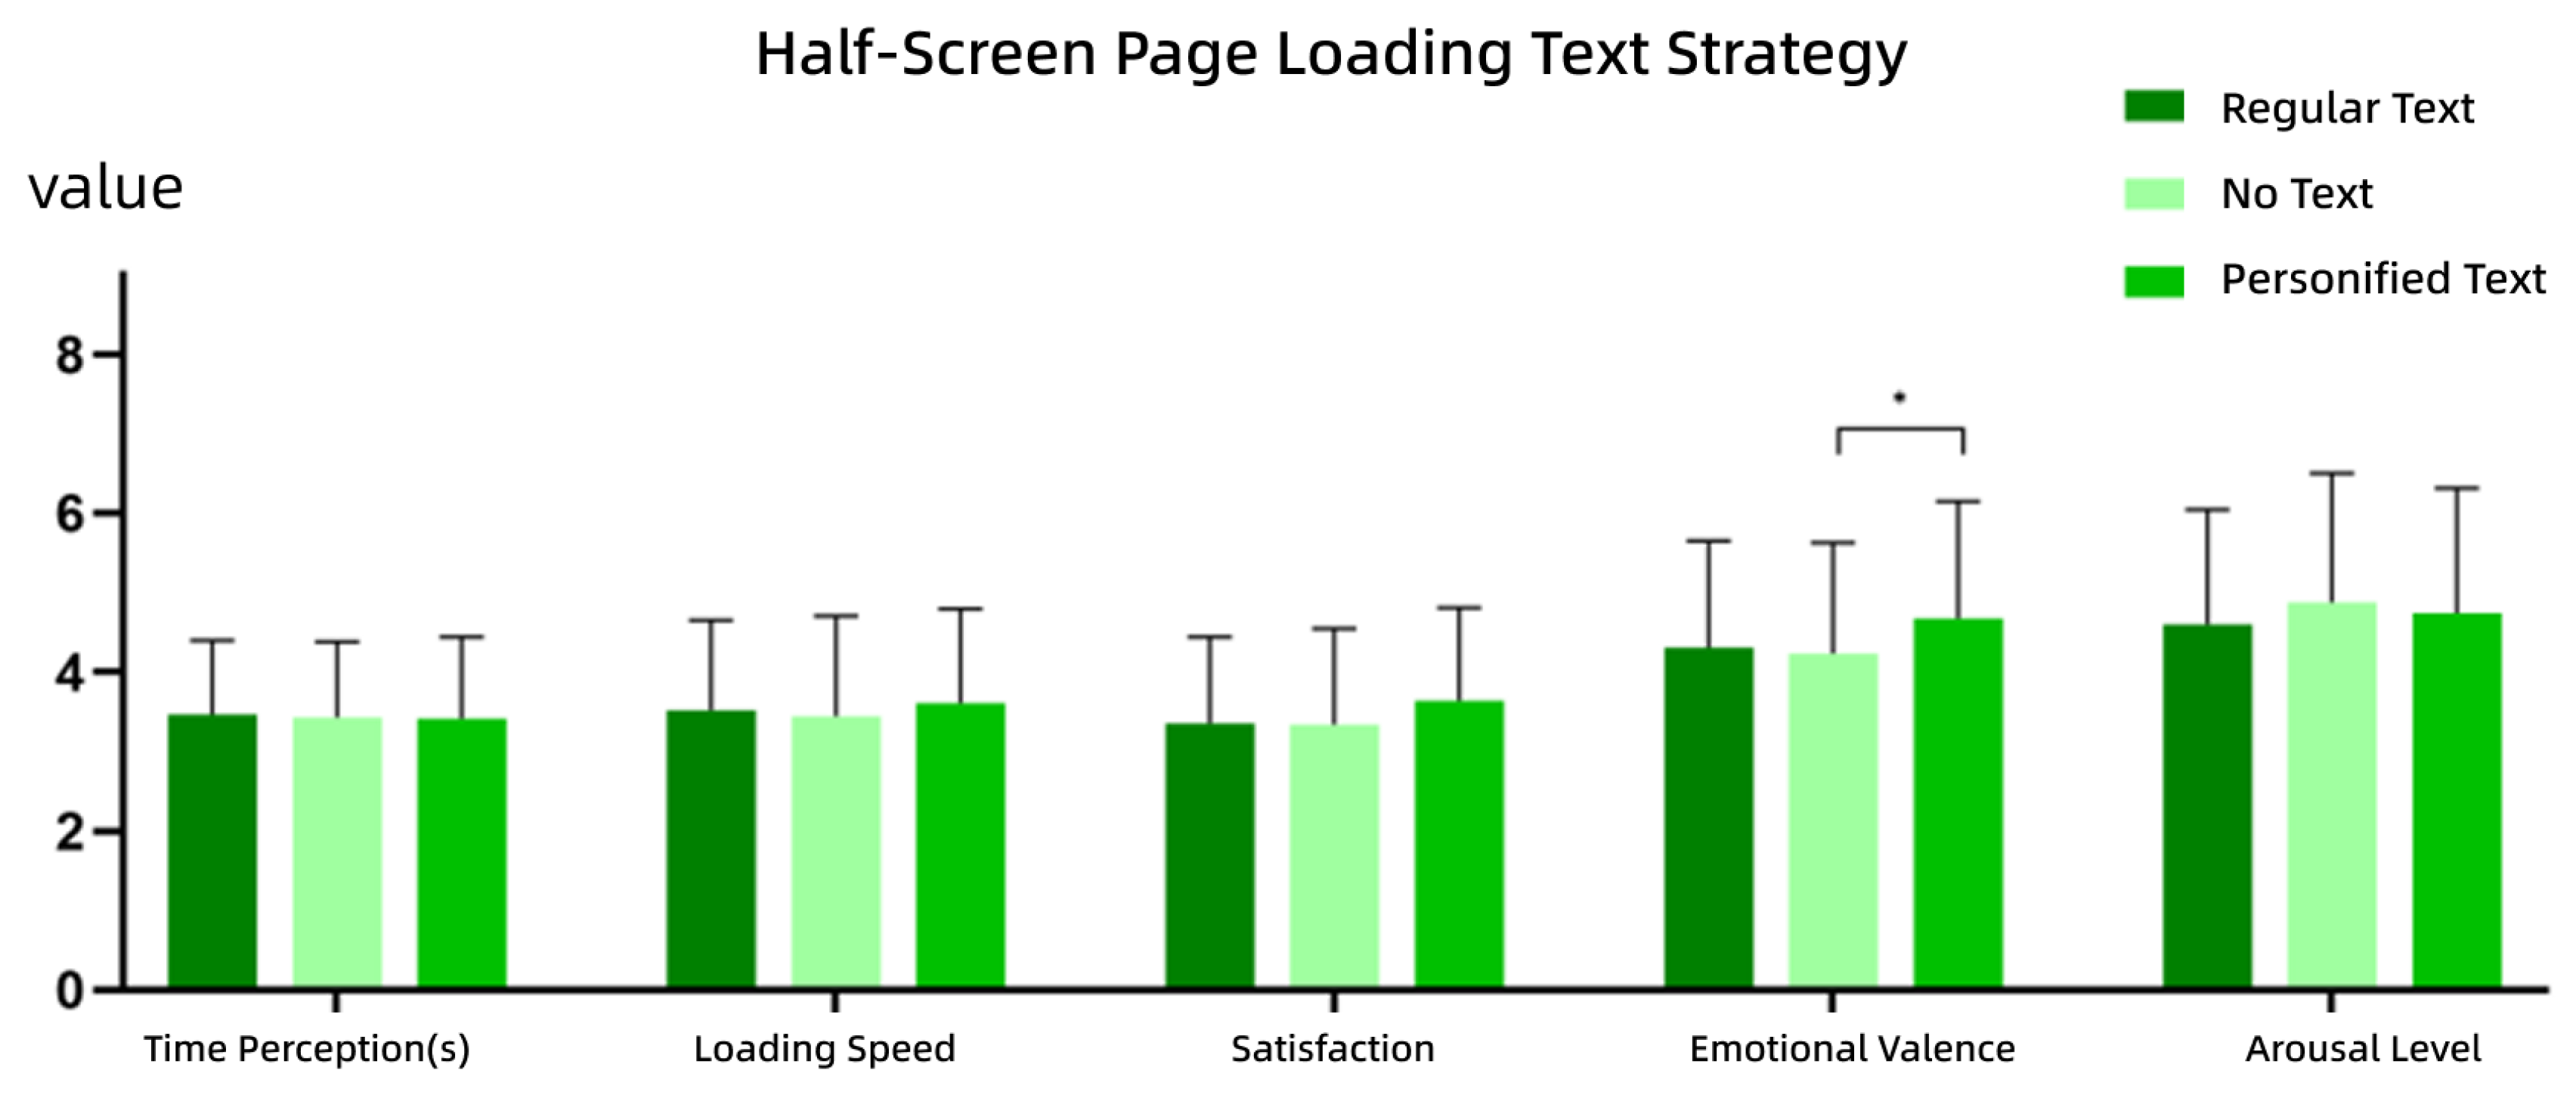
- (2)
- Text
4.3. Page Hierarchy Transitions: Layout Strategies
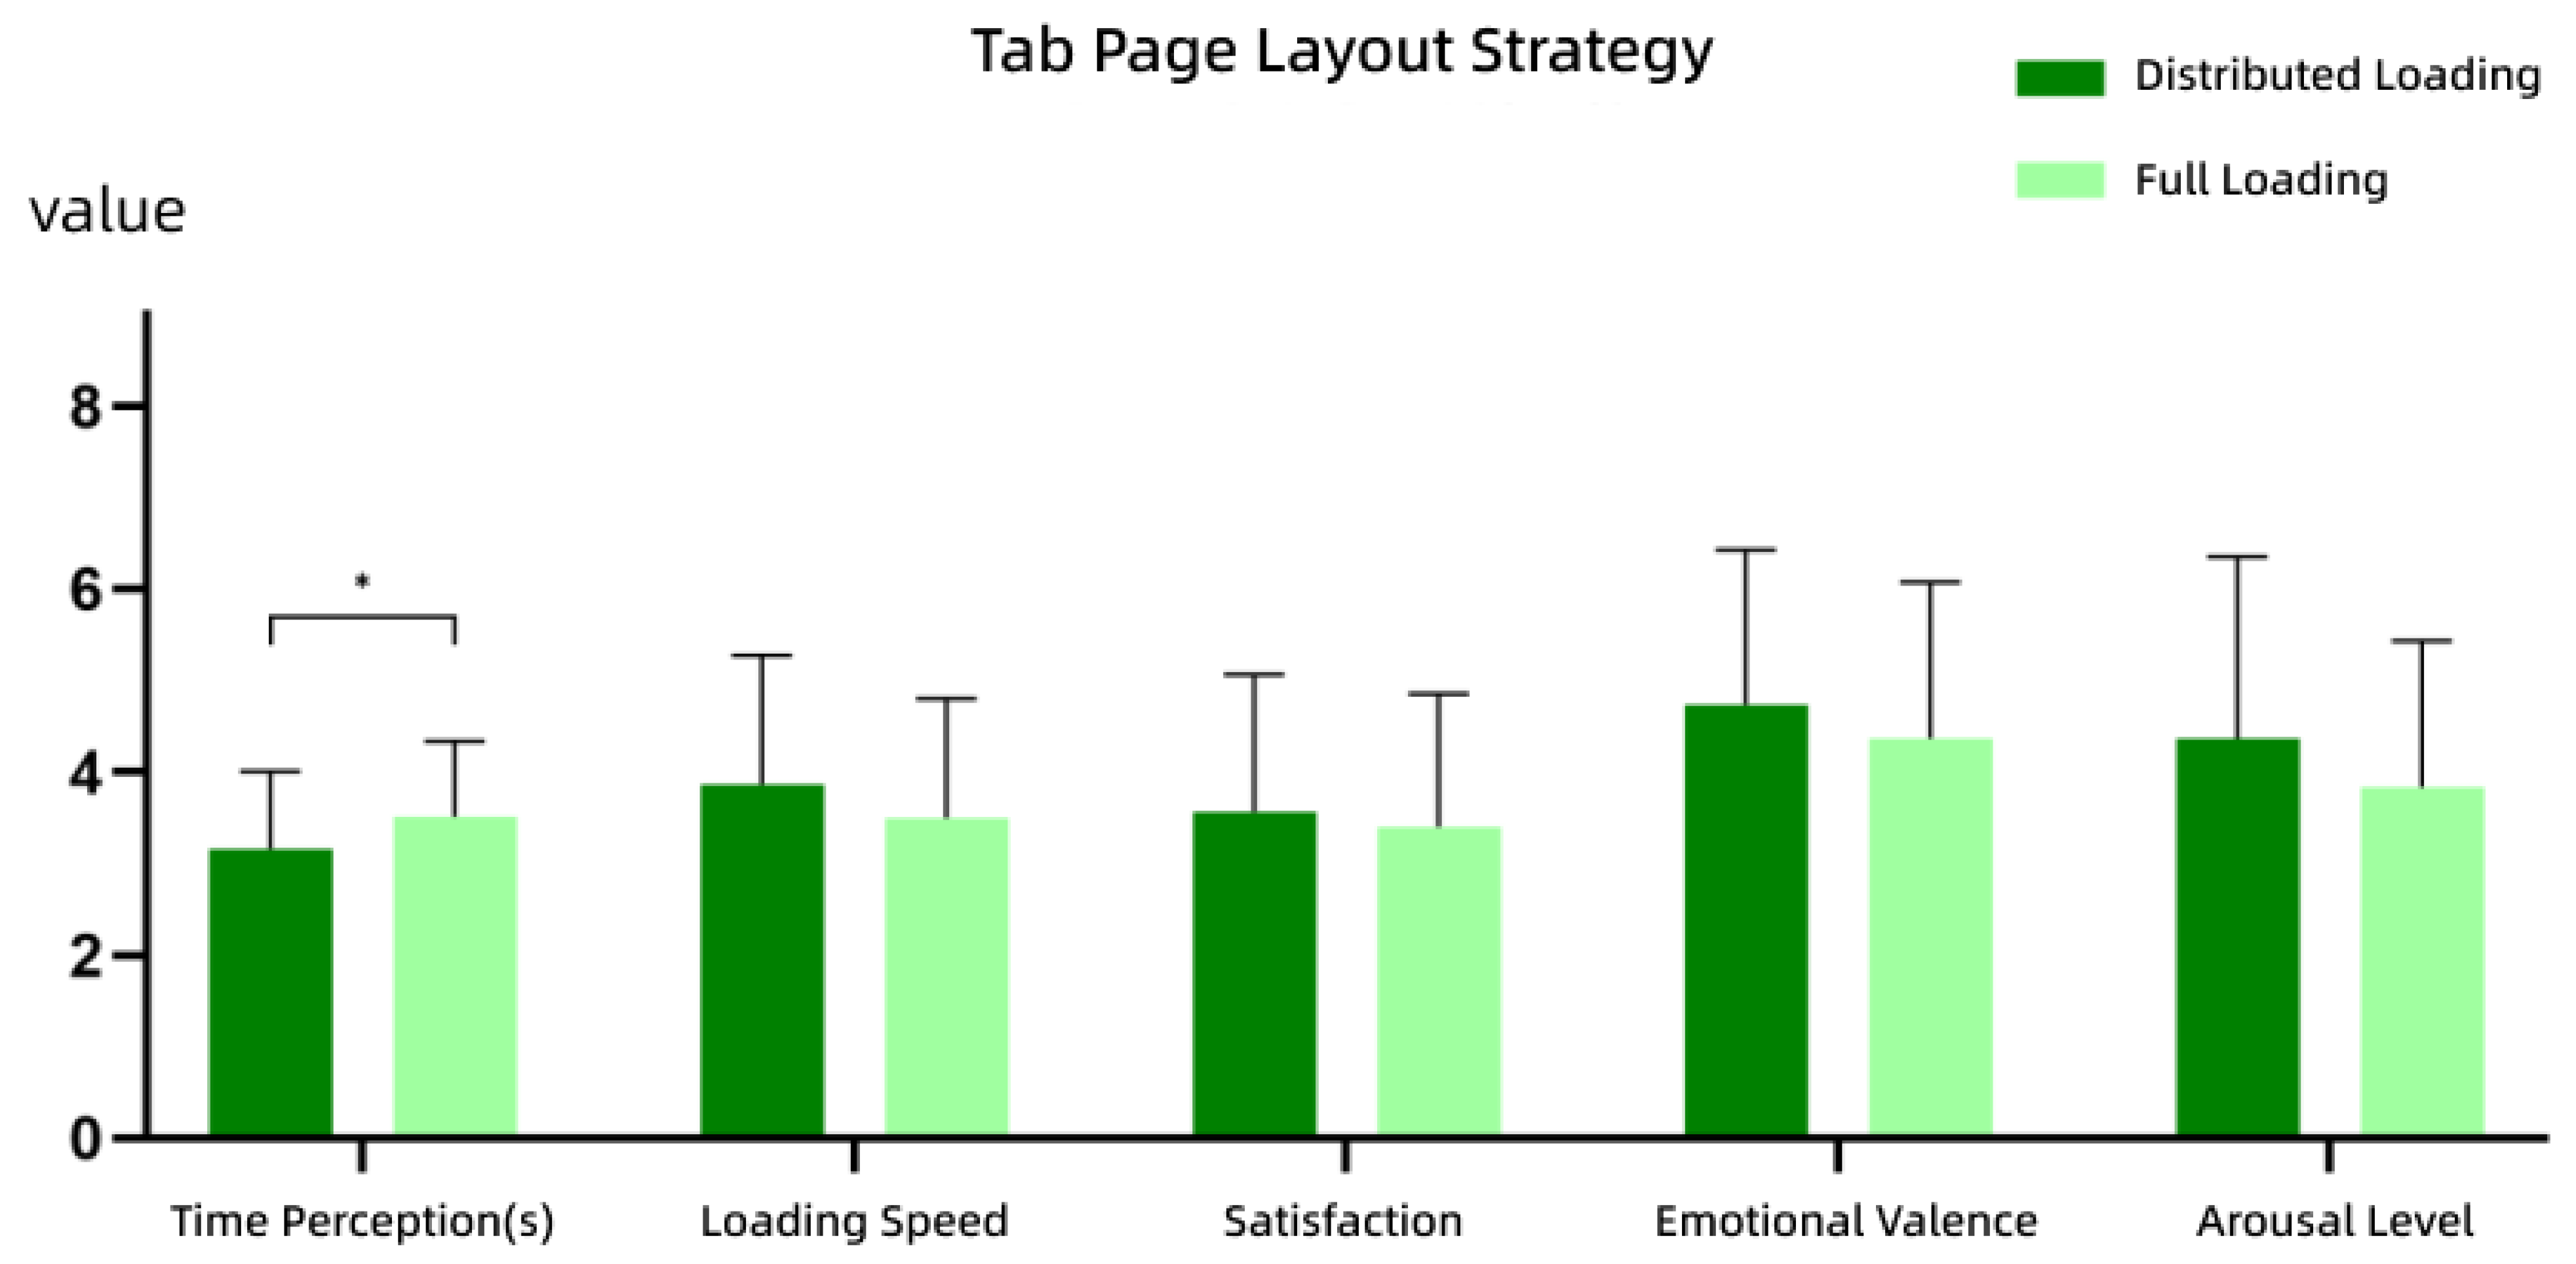
4.3.1. Tab Page Scenario
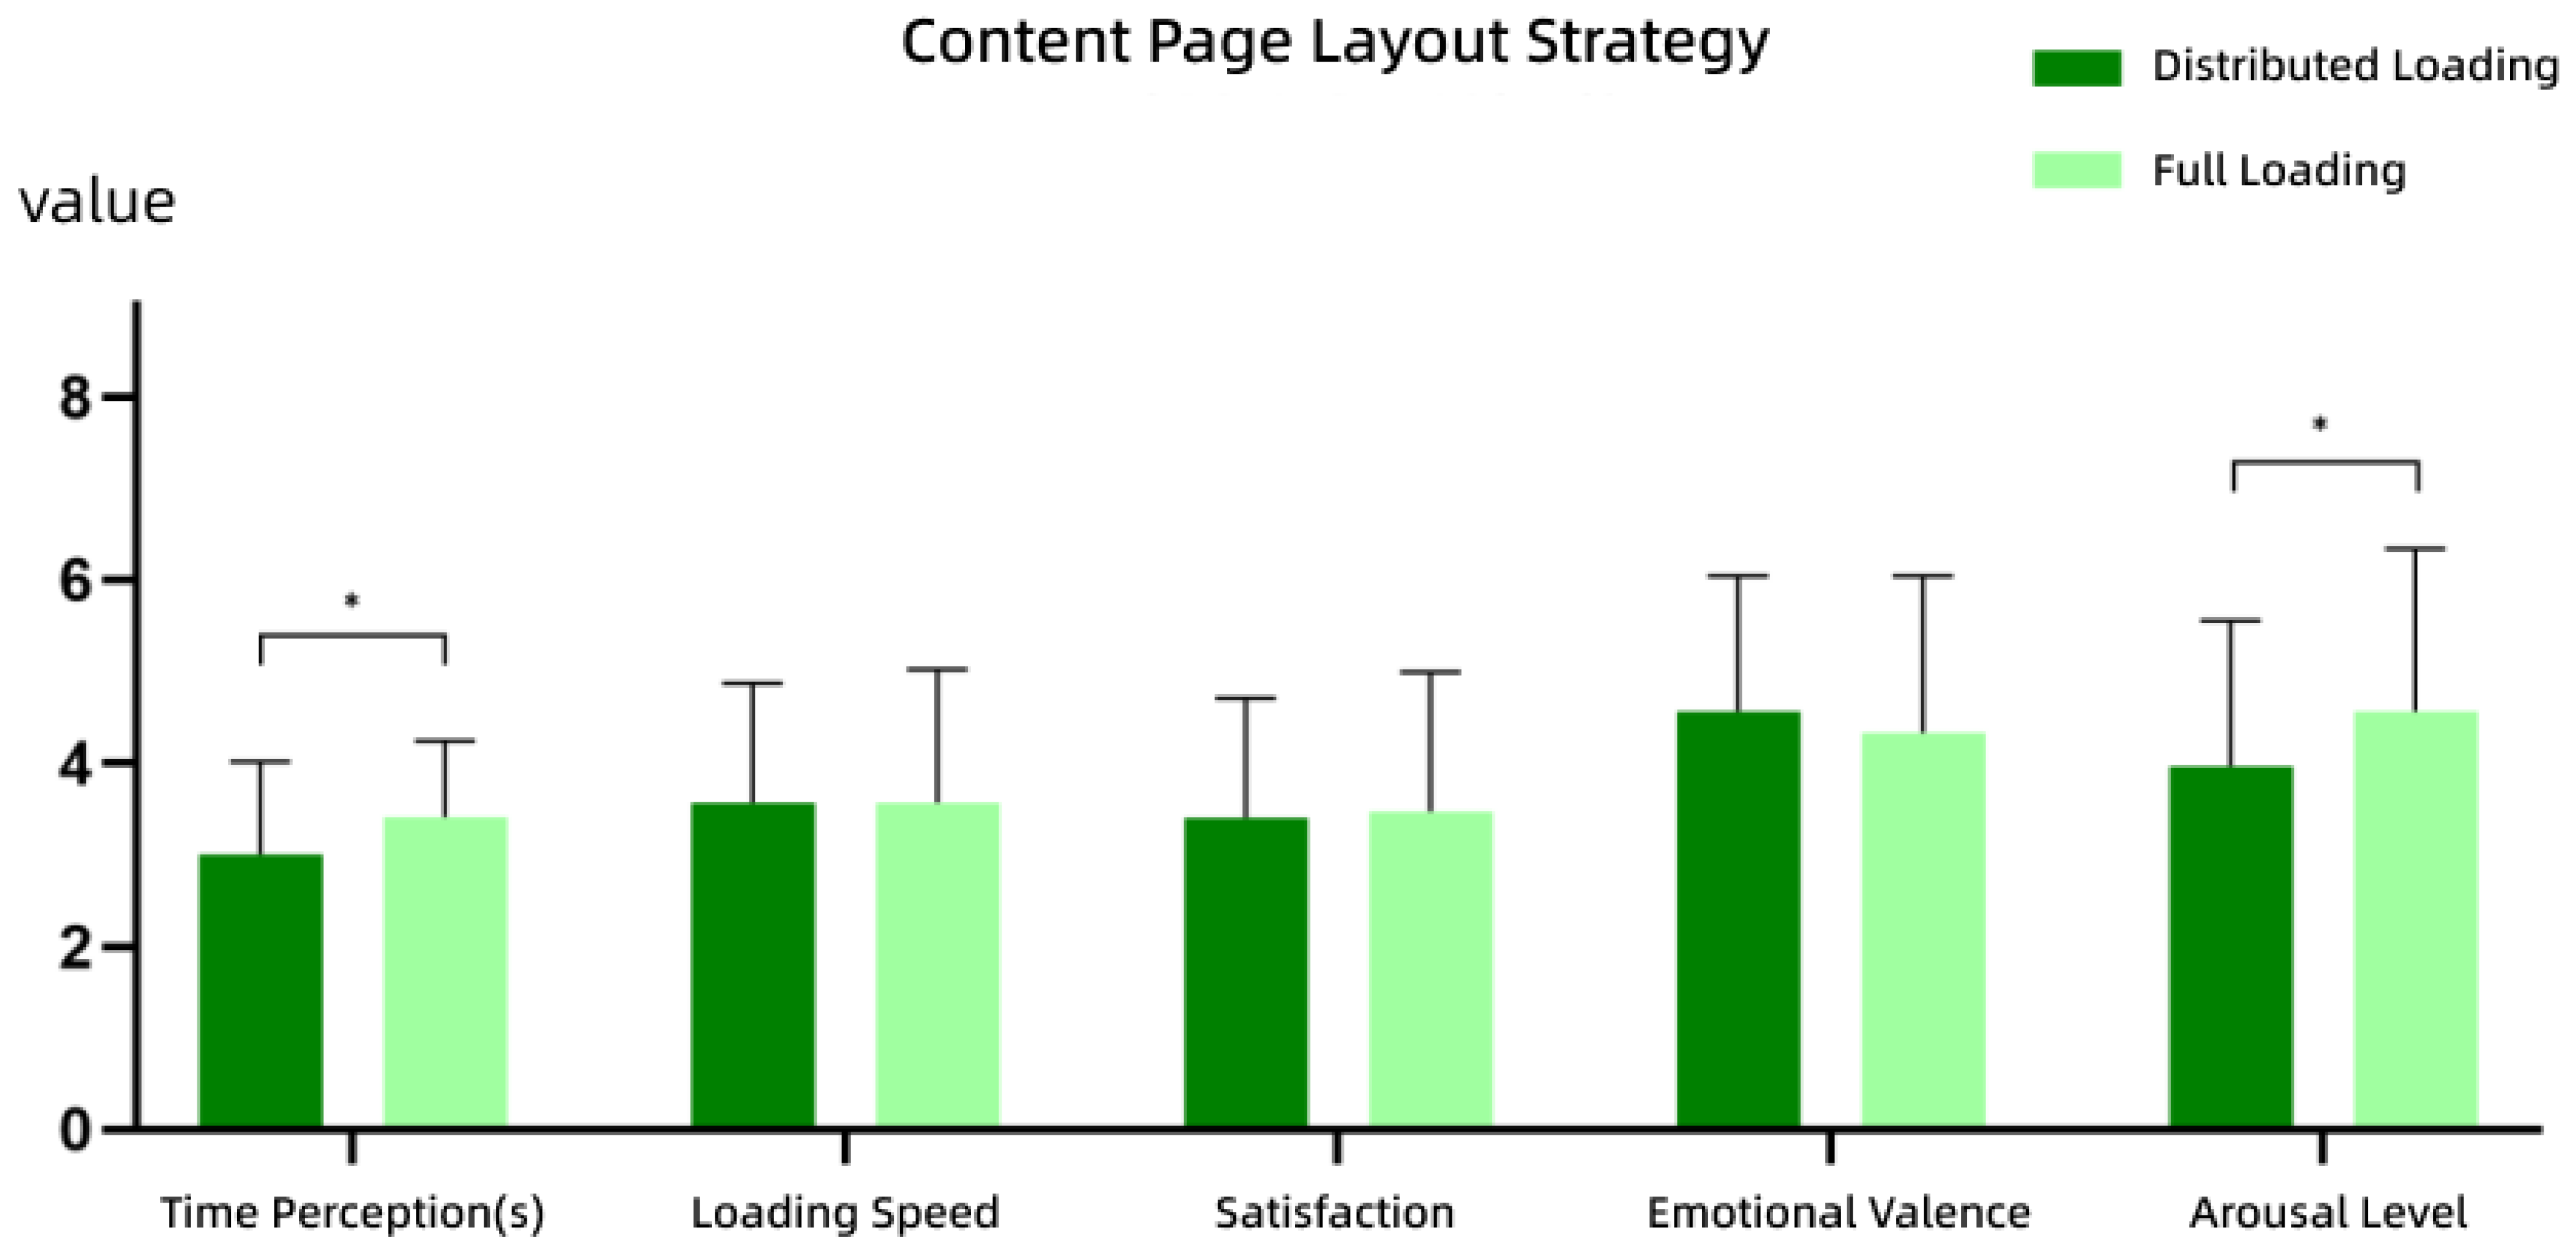
4.3.2. Content Page Scenario
- Time Perception: Participants reported significantly shorter reproduced durations under the stepwise loading strategy compared to the full-loading strategy, indicating that stepwise layouts can effectively reduce perceived waiting times.
- Arousal Level: Participants reported significantly higher arousal levels under the full-loading strategy, suggesting that full loading may induce stronger emotional intensity.
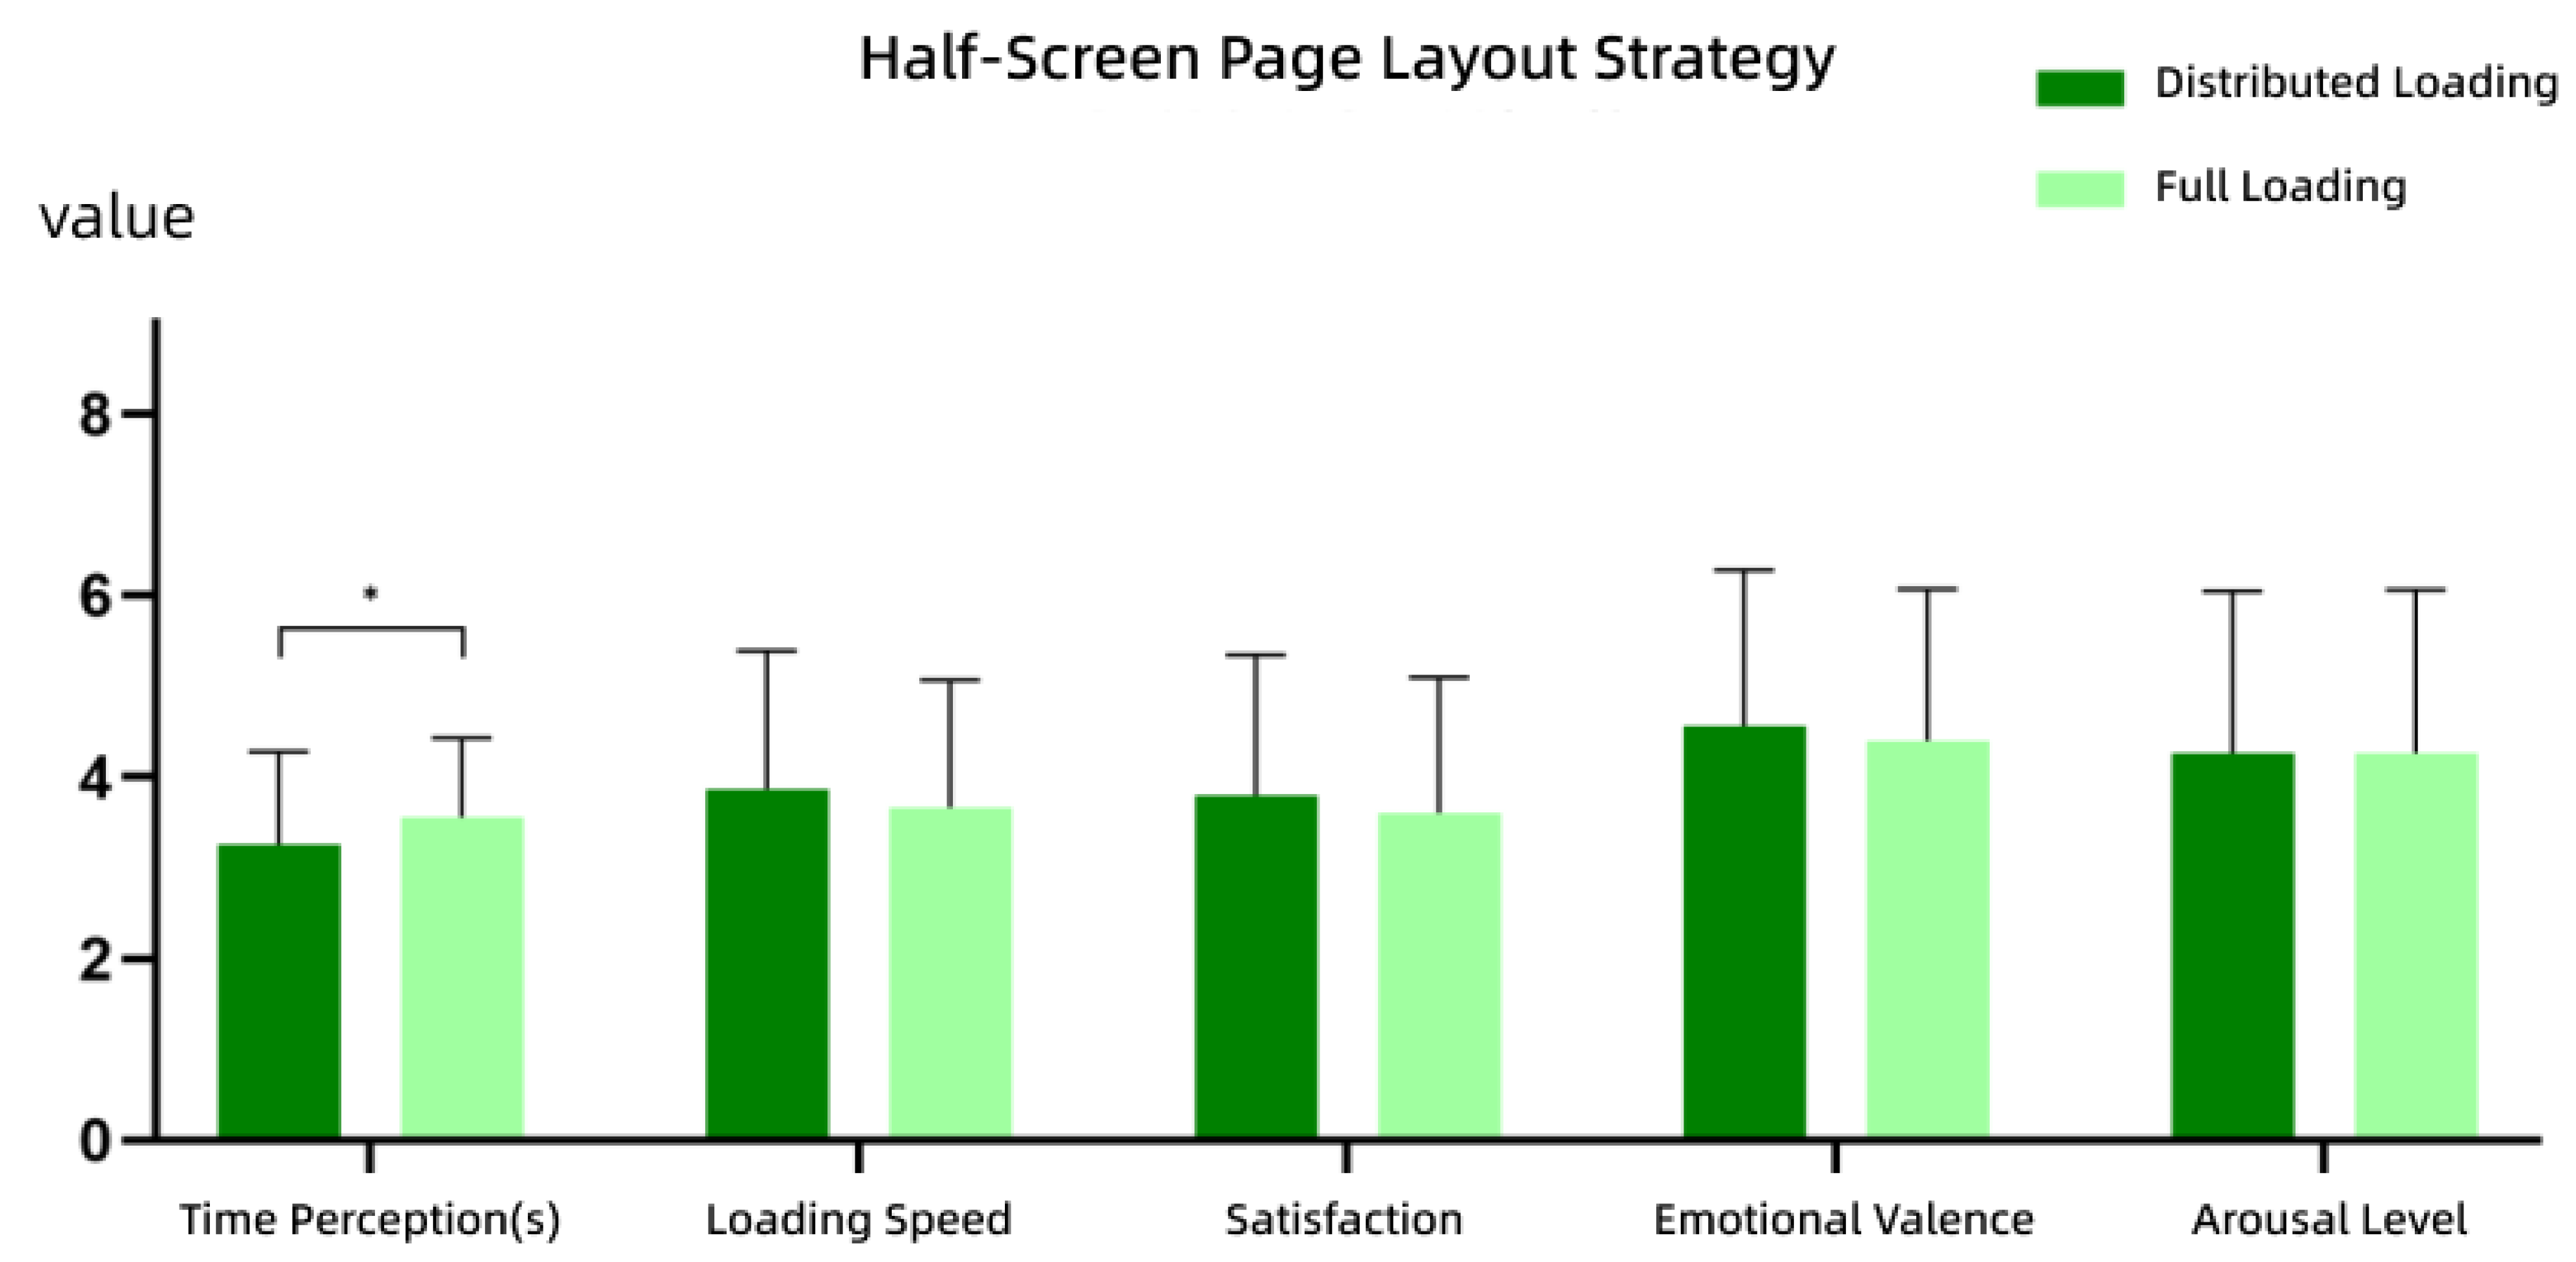
4.3.3. Half-Screen Page Scenario
5. Discussion
5.1. Waiting Interface Strategies in Page Hierarchy Transitions
5.2. Interface Strategies While Waiting with Page Hierarchy Transitions
5.3. Layout Strategies in Page Hierarchy Transitions
6. Conclusions
- Interface Strategy: Replacing blank areas with placeholder images significantly improves satisfaction, reduces perceived wait time, and enhances emotional responses. This effect is attributed to visual engagement and anticipatory cues, which alleviate the uncertainty of “empty waiting”.
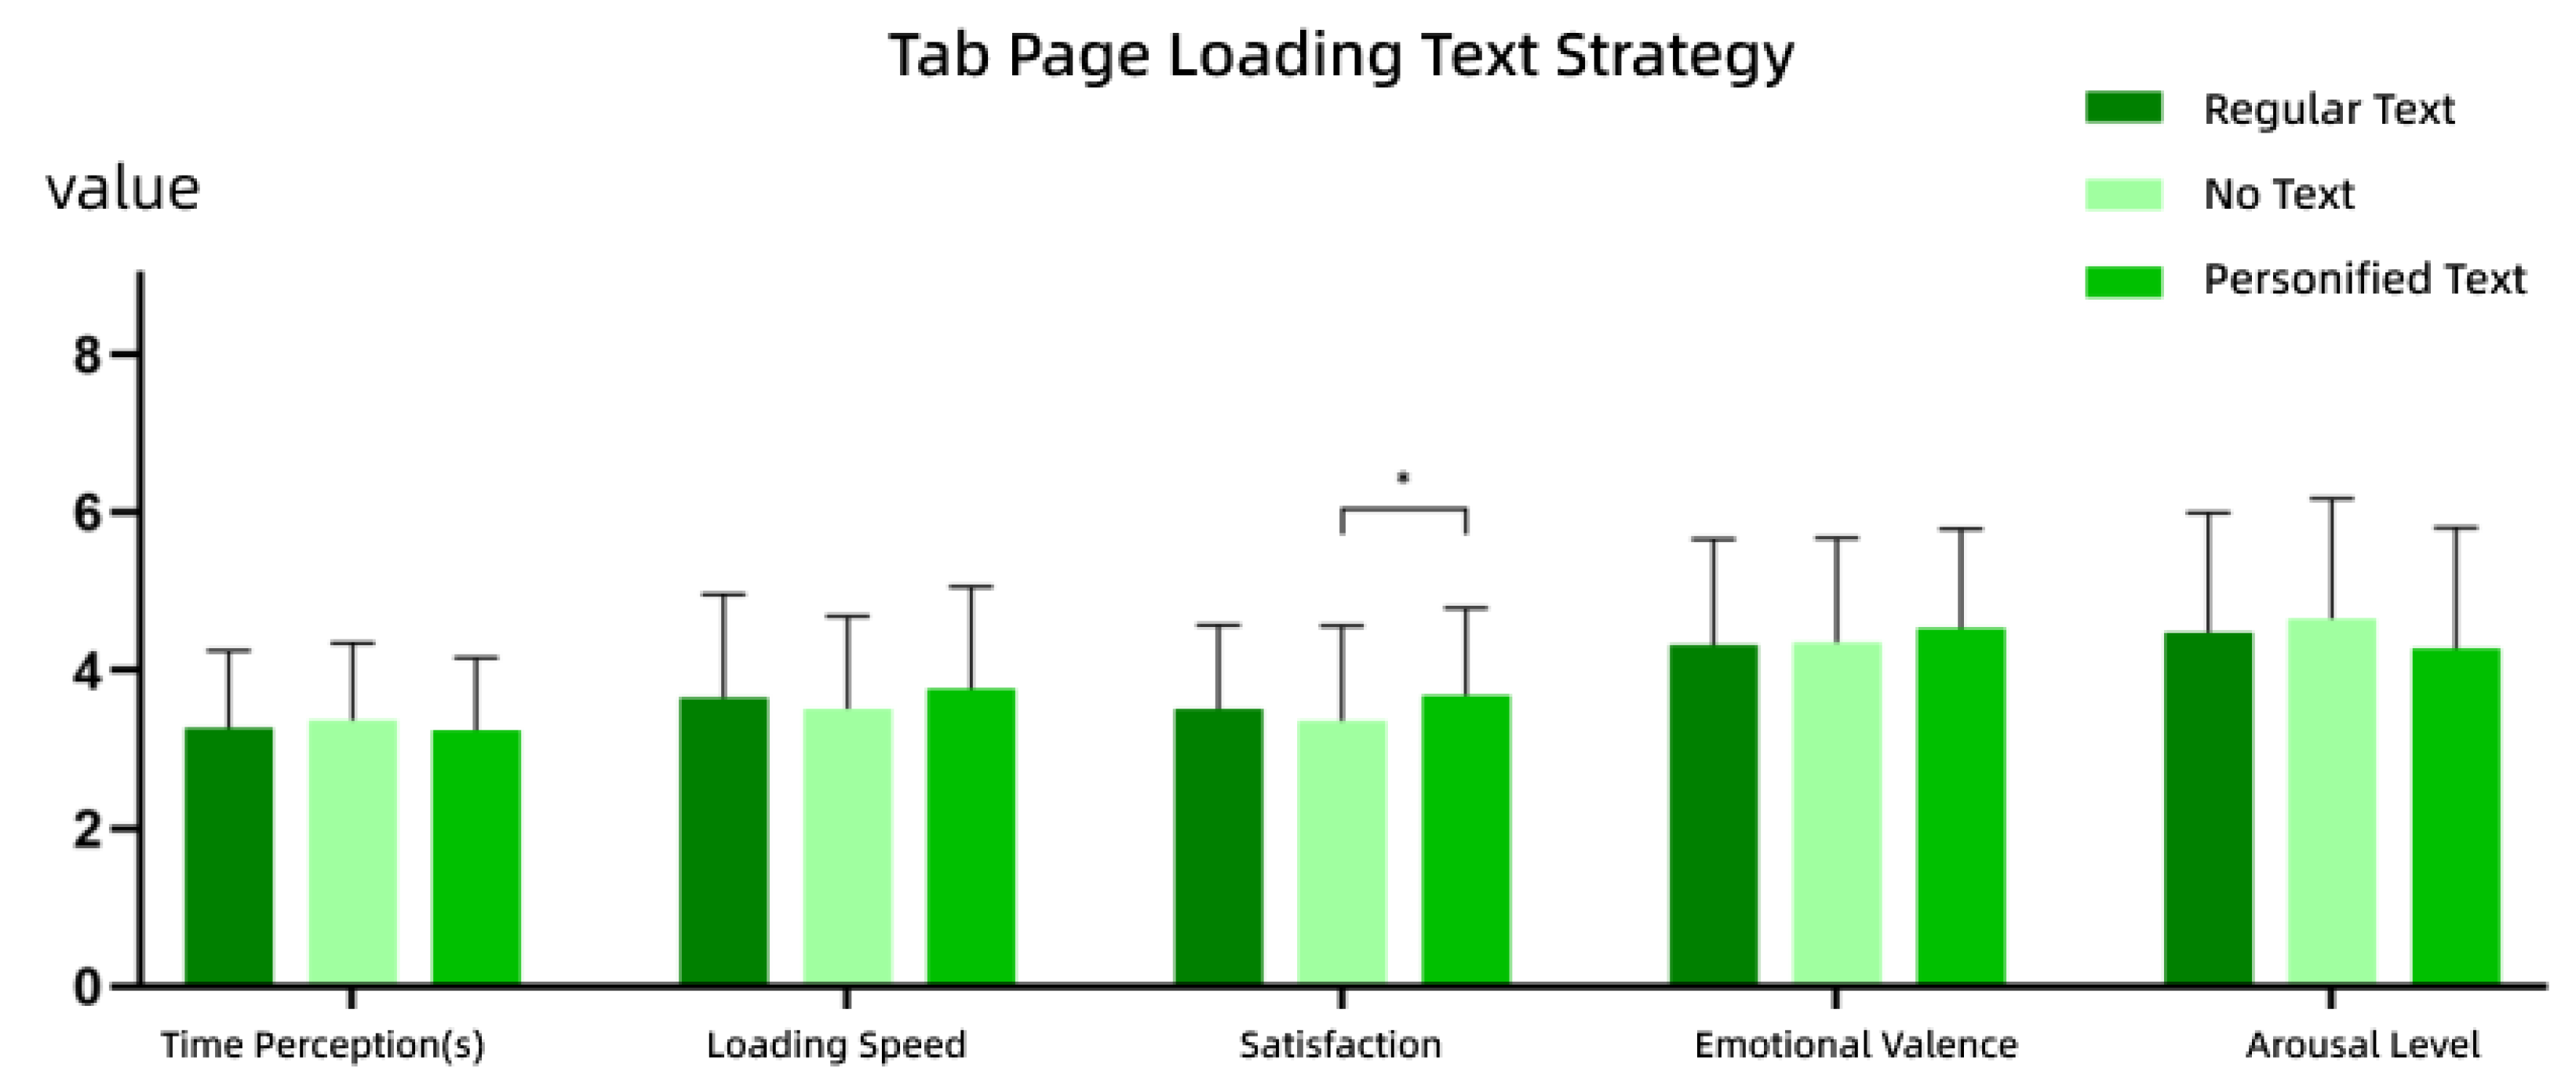
- Loading Icon Strategy: Hedonic-style icons function as effective emotional interventions, significantly improving satisfaction and mood. Although personified text showed no significant statistical advantage, it outperformed standard text in subjective ratings, indicating its potential. The absence of icons, while sometimes reducing time perception, generally decreased satisfaction, highlighting its design risk.
- Layout Strategy: Step-by-step loading (e.g., displaying text before images) effectively reduces perceived waiting times and increases satisfaction, particularly in half-screen layouts. This approach improves cognitive ease and emotional comfort through gradual information disclosure.
- Strategy Adaptability: The effectiveness of waiting strategies varies by hierarchy type. Users are more responsive to text on half-screen pages, while in tab and content pages, feedback from icons plays a more prominent role. These findings underscore the need for context-sensitive designs rather than a universal strategy.
Author Contributions
Funding
Institutional Review Board Statement
Informed Consent Statement
Data Availability Statement
Acknowledgments
Conflicts of Interest
References
- Chen, A.N.; Lee, Y.; Hwang, Y. Managing Online Wait: Designing Effective Waiting Screens across Cultures. Inf. Manag. 2018, 55, 558–575. [Google Scholar] [CrossRef]
- Liu, X.; Ma, Y.; Wang, X.; Liu, Y.; Xie, T.; Huang, G. SWAROVsky: Optimizing Resource Loading for Mobile Web Browsing. IEEE Trans. Mob. Comput. 2017, 16, 2941–2954. [Google Scholar] [CrossRef]
- Miller, R.B. Response Time in Man-Computer Conversational Transactions. In AFIPS ’68 (Fall, Part I), Proceedings of the Fall Joint Computer Conference, Part I, San Francisco, CA, USA, 9–11 December 1968; Association for Computing Machinery: New York, NY, USA, 1968; pp. 267–277. [Google Scholar] [CrossRef]
- Krishnan, S.S.; Sitaraman, R.K. Video Stream Quality Impacts Viewer Behavior: Inferring Causality Using Quasi-Experimental Designs. In IMC ’12, Proceedings of the 2012 Internet Measurement Conference, Boston, MA, USA, 14–16 November 2012; Association for Computing Machinery: New York, NY, USA, 2012; pp. 211–224. [Google Scholar] [CrossRef]
- Nah, F.F.-H. A Study on Tolerable Waiting Time: How Long Are Web Users Willing to Wait? Behav. Inf. Technol. 2004, 23, 153–163. [Google Scholar] [CrossRef]
- Galletta, D.F.; Henry, R.; McCoy, S.; Polak, P. Web Site Delays: How Tolerant Are Users? J. Assoc. Inf. Syst. 2004, 5, 1–28. [Google Scholar] [CrossRef]
- Pfister, H.-R.; Wollstädter, S.; Peter, C. Affective Responses to System Messages in Human–Computer-Interac-tion: Effects of Modality and Message Type. Interact. Comput. 2011, 23, 372–383. [Google Scholar] [CrossRef]
- Kim, W.; Xiong, S.; Liang, Z. Effect of Loading Symbol of Online Video on Perception of Waitin-g Time. Int. J. Hum. Comput. Interact. 2017, 33, 1001–1009. [Google Scholar] [CrossRef]
- Lallemand, C.; Gronier, G. Enhancing User experience during Waiting Time in HCI: Contributions of Cognitive Psychology. In DIS ’12, Proceedings of the Designing Interactive Systems Conference, Newcastle Upon Tyne, UK, 11–15 June 2012; Association for Computing Machinery: New York, NY, USA, 2012; pp. 751–760. [Google Scholar] [CrossRef]
- Branaghan, R.J.; Sanchez, C.A. Feedback Preferences and Impressions of Waiting. Hum. Factors 2009, 51, 528–538. [Google Scholar] [CrossRef]
- Ohtsubo, M.; Yoshida, K. How Does Shape of Progress Bar Effect on Time Evaluation. In Proceedings of the 2014 International Conference on Intelligent Networking and Collaborative Systems, Salerno, Italy, 10–12 September 2014; pp. 316–319. [Google Scholar] [CrossRef]
- Yuzhen, W.; Yanqun, H.; Jutao, L.; Jie, Z. The Effect of Mobile Applications’ Initial Loading Pages on Users’ Mental State and Behavior. Displays 2021, 68, 102007. [Google Scholar] [CrossRef]
- Conn, A.P. Time Affordances: The Time Factor in Diagnostic Usability Heuristics. In CHI ’95, Proceedings of the SIGCHI Conference on Human Factors in Computing Systems, Denver, CO, USA, 7–11 May 1995; ACM Press: Denver, CO, USA, 1995; pp. 186–193. [Google Scholar] [CrossRef]
- Ghafurian, M.; Reitter, D.; Ritter, F.E. Countdown Timer Speed: A Trade-off between Delay Duration Perception and Recall. ACM Trans. Comput. Hum. Interact. 2020, 27, 11. [Google Scholar] [CrossRef]
- Ghafurian, M.; Reitter, D. Impatience Induced by Waiting: An Effect Moderated by the Speed of Countdowns. In DIS ’16, Proceedings of the 2016 ACM Conference on Designing Interactive Systems, Brisbane, QLD, Australia, 4–8 June 2016; Association for Computing Machinery: New York, NY, USA, 2016; pp. 556–564. [Google Scholar] [CrossRef]
- Harrison, C.; Amento, B.; Kuznetsov, S.; Bell, R. Rethinking the Progress Bar. In UIST ’07, Proceedings of the 20th Annual ACM Symposium on User Interface Software and Technology, Newport, RI, USA, 7–10 October 2007; Association for Computing Machinery: New York, NY, USA, 2007; pp. 115–118. [Google Scholar] [CrossRef]
- Amer, T.S.; Johnson, T.L. IT Progress Indicators: Sense of Progress, Subjective Sense of Time, User Preference and the Perception of Process Duration. Int. J. Technol. Hum. Interact. 2014, 10, 58–71. [Google Scholar] [CrossRef]
- Chien-Hsiung, C.; Shasha, L. The Effect of Visual Feedback Types on the Wait Indicator Interface of a Mobile Application. Displays 2020, 61, 101928. [Google Scholar] [CrossRef]
- Harrison, C.; Yeo, Z.; Hudson, S.E. Faster Progress Bars: Manipulating Perceived Duration with Visual Augmentations. In CHI ’10, Proceedings of the SIGCHI Conference on Human Factors in Computing Systems, Atlanta, GA, USA, 10–15 April 2010; Association for Computing Machinery: New York, NY, USA, 2010; pp. 1545–1548. [Google Scholar] [CrossRef]
- Kurusathianpong, P.; Tangmanee, C. Comparison of Perceived Waiting Time Between Two Lengths of Progress Indicator and Two Styles of Graphics Animation with Perceived Uncertainty as a Covariate. In Proceedings of the 2018 Seventh ICT International Student Project Conference (ICT-ISPC), Nakhon Pathom, Thailand, 11–13 July 2018; pp. 1–6. [Google Scholar] [CrossRef]
- Söderström, U.; Bååth, M.; Mejtoft, T. The Users’ Time Perception: The Effect of Various Animation Speeds on Loading Screens. In ECCE ’18, Proceedings of the 36th European Conference on Cognitive Ergonomics, Utrecht, The Netherlands, 5–7 September 2018; Association for Computing Machinery: New York, NY, USA, 2018; pp. 1–4. [Google Scholar] [CrossRef]
- Wenguo, Z.; Yan, G.; Weina, Q.; Kan, Z.; Xianghong, S. The Duration Perception of Loading Applications in Smartphone: Effects of Different Loading Types. Appl. Ergon. 2017, 65, 223–232. [Google Scholar] [CrossRef]
- Hohenstein, J.; Khan, H.; Canfield, K.; Tung, S.; Perez Cano, R. Shorter Wait Times: The Effects of Various Loading Screens on Perceived Performance. In CHI EA ’16, Proceedings of the 2016 CHI Conference Extended Abstracts on Human Factors in Computing Systems, San Jose, CA, USA, 7–12 May 2016; Association for Computing Machinery: New York, NY, USA, 2016; pp. 3084–3090. [Google Scholar] [CrossRef]
- Mejtoft, T.; Långström, A.; Söderström, U. The Effect of Skeleton Screens: Users’ Perception of Speed and Ease of Navigation. In ECCE ’18, Proceedings of the 36th European Conference on Cognitive Ergonomics, Utrecht, The Netherlands, 5–7 September 2018; Association for Computing Machinery: New York, NY, USA, 2018; pp. 1–4. [Google Scholar] [CrossRef]
- Pang, S.; Carl, G.; Andy, C. The Influence of Audio Effects and Attention on the Perceived Duration of Interaction. Int. J. Hum. Comput. Stud. 2022, 159, 102756. [Google Scholar] [CrossRef]
- Shirai, K.; Futami, K.; Murao, K. Exploring Tactile Stimuli from a Wrist-Worn Device to Manipulate Subjective Time Based on the Filled-Duration Illusion. Sensors 2022, 22, 7194. [Google Scholar] [CrossRef]
- Van Nimwegen, C.; Van Rijn, E. Time Swipes When You’re Having Fun: Reducing Perceived Waiting Time While Making It More Enjoyable. Behav. Inf. Technol. 2023, 42, 307–315. [Google Scholar] [CrossRef]
- Hou, D.; Yao, K. User Experience of Loading Design: The Influence of Different Presentation Duration and Type on Time Perception. J. Phys. Conf. Ser. 2021, 1955, 012076. [Google Scholar] [CrossRef]
- Cao, H.; Hu, X. A Research on Motion Design for APP’s Loading Pages Based on Time Perception. AIP Conf. Proc. 2018, 1955, 040075. [Google Scholar] [CrossRef]
- Hsu, C.-F.; Propp, L.; Panetta, L.; Martin, S.; Dentakos, S.; Toplak, M.E.; Eastwood, J.D. Mental Effort and Discomfort: Testing the Peak-End Effect during a Cognitively Demanding Task. PLoS ONE 2018, 13, e0191479. [Google Scholar] [CrossRef]
- Zhang, C.; Lv, M.; Zhang, W.; Chen, J.; Yang, L.; Lv, B.; Wu, T. Evaluating Scenario-Specific Loading Processes on Mobile Phones. Technologies 2019, 7, 27. [Google Scholar] [CrossRef]
- Cheng, A.; Ma, D.; Qian, H.; Pan, Y. The Effects of Mobile Applications’ Passive and Interactive Loading Sc-reen Types on Waiting Experience. Behav. Inf. Technol. 2024, 43, 1652–1663. [Google Scholar] [CrossRef]
- Macar, F.; Grondin, S.; Casini, L. Controlled Attention Sharing Influences Time Estimation. Mem. Cogn. 1994, 22, 673–686. [Google Scholar] [CrossRef] [PubMed]
- Li, A.; Zhao, D.; Xiong, G.; Tan, F.; Wang, X.; Ling, W. Is Waiting a Kind of Torture? Perceived Waiting Time and the Resulting Irrational Decision Making. Adv. Psychol. Sci. 2014, 22, 1679. [Google Scholar] [CrossRef]
- Ryan, G.; Valverde, M. Waiting Online: A Review and Research Agenda. Internet Res. 2003, 13, 195–205. [Google Scholar] [CrossRef]
- Oktarina, F.; Handoyo, E.R.; Rahayu, F.S. User Experience Analysis of ShopeeFood Service Using Google’s HEART Framework. Teknika 2025, 14, 47–56. [Google Scholar] [CrossRef]
- Rodden, K.; Hutchinson, H.; Fu, X. Measuring the User Experience on a Large Scale: User-Centered Metrics for Web Applications. In CHI ’10, Proceedings of the SIGCHI Conference on Human Factors in Computing Systems, Atlanta, GA, USA 10–15 April 2010; Association for Computing Machinery: New York, NY, USA, 2010; pp. 2395–2398. [Google Scholar] [CrossRef]
- Cardozo, R.N. An Experimental Study of Customer Effort, Expectation, and Satisfaction. J. Mark. Res. 1965, 2, 244. [Google Scholar] [CrossRef]
- Block, R.A.; Zakay, D. Prospective and Retrospective Duration Judgments: A Meta-Analytic Review. Psychon. Bull. Rev. 1997, 4, 184–197. [Google Scholar] [CrossRef]
- Watson, D.; Clark, L.A.; Tellegen, A. Development and Validation of Brief Measures of Positive and Negative Affect: The PANAS Scales. J. Personal. Soc. Psychol. 1988, 54, 1063–1070. [Google Scholar] [CrossRef]
- Lovibond, S.H.; Lovibond, P.F. Manual for the Depression Anxiety Stress Scales, 2nd ed.; Psychology Foundation monograph; Psychology Foundation of Australia: Sydney, NSW, Australia, 1995. [Google Scholar]
- Bradley, M.M.; Lang, P.J. Measuring Emotion: The Self-Assessment Manikin and the Semantic Differential. J. Behav. Ther. Exp. Psychiatry 1994, 25, 49–59. [Google Scholar] [CrossRef]
- Hou, G.; Wang, X. Emotional Valence and Arousal: The Impact of AI-Generated Image Stimuli on Design Creativity. Int. J. Technol. Des. Educ. 2024. [Google Scholar] [CrossRef]
- Ma, A.C.; Cameron, A.D.; Wiener, M. Memorability Shapes Perceived Time (and Vice Versa). Nat. Hum. Behav. 2024, 8, 1296–1308. [Google Scholar] [CrossRef]
- Zargham, N.; Avanesi, V.; Reicherts, L.; Scott, A.E.; Rogers, Y.; Malaka, R. “Funny How?” A Serious Look at Humor in Conversational Agents. In CUI ’23, Proceedings of the 5th International Conference on Conversational User Interfaces, Eindhoven, The Netherlands, 19–21 July 2023; Association for Computing Machinery: New York, NY, USA, 2023; pp. 1–7. [Google Scholar] [CrossRef]
- Xu, Y.; Zhang, H. A Bibliometric-Based Study of Virtual Reality User Interface Design. In Virtual, Augmented and Mixed Reality; Chen, J.Y.C., Fragomeni, G., Eds.; Springer Nature: Cham, Switzerland, 2023; pp. 114–129. [Google Scholar] [CrossRef]

| Experiment No. | Research Item | Sub-Item | Sub-Item Description | Research Variable Description | |
|---|---|---|---|---|---|
| 1 | Jump Type | Tab Page | Defined as horizontal transitions between pages, commonly seen in app homepage tabs and navigation bars. | Time Perception: Participants’ subjective experience of how time passed. Loading Speed: Participants’ subjective evaluation of the loading speed. Satisfaction: Participants’ satisfaction with the waiting interface. Emotional Valence: The positivity or negativity of the participant’s mood (qualitative). Arousal Level: The intensity of the participant’s emotional state (quantitative). | |
| Content Page | Defined as vertical transitions between hierarchical pages, commonly seen when clicking to view specific content. | ||||
| Half-Screen Page | Defined as pop-up windows that partially cover the original content, commonly seen in video comment sections. | ||||
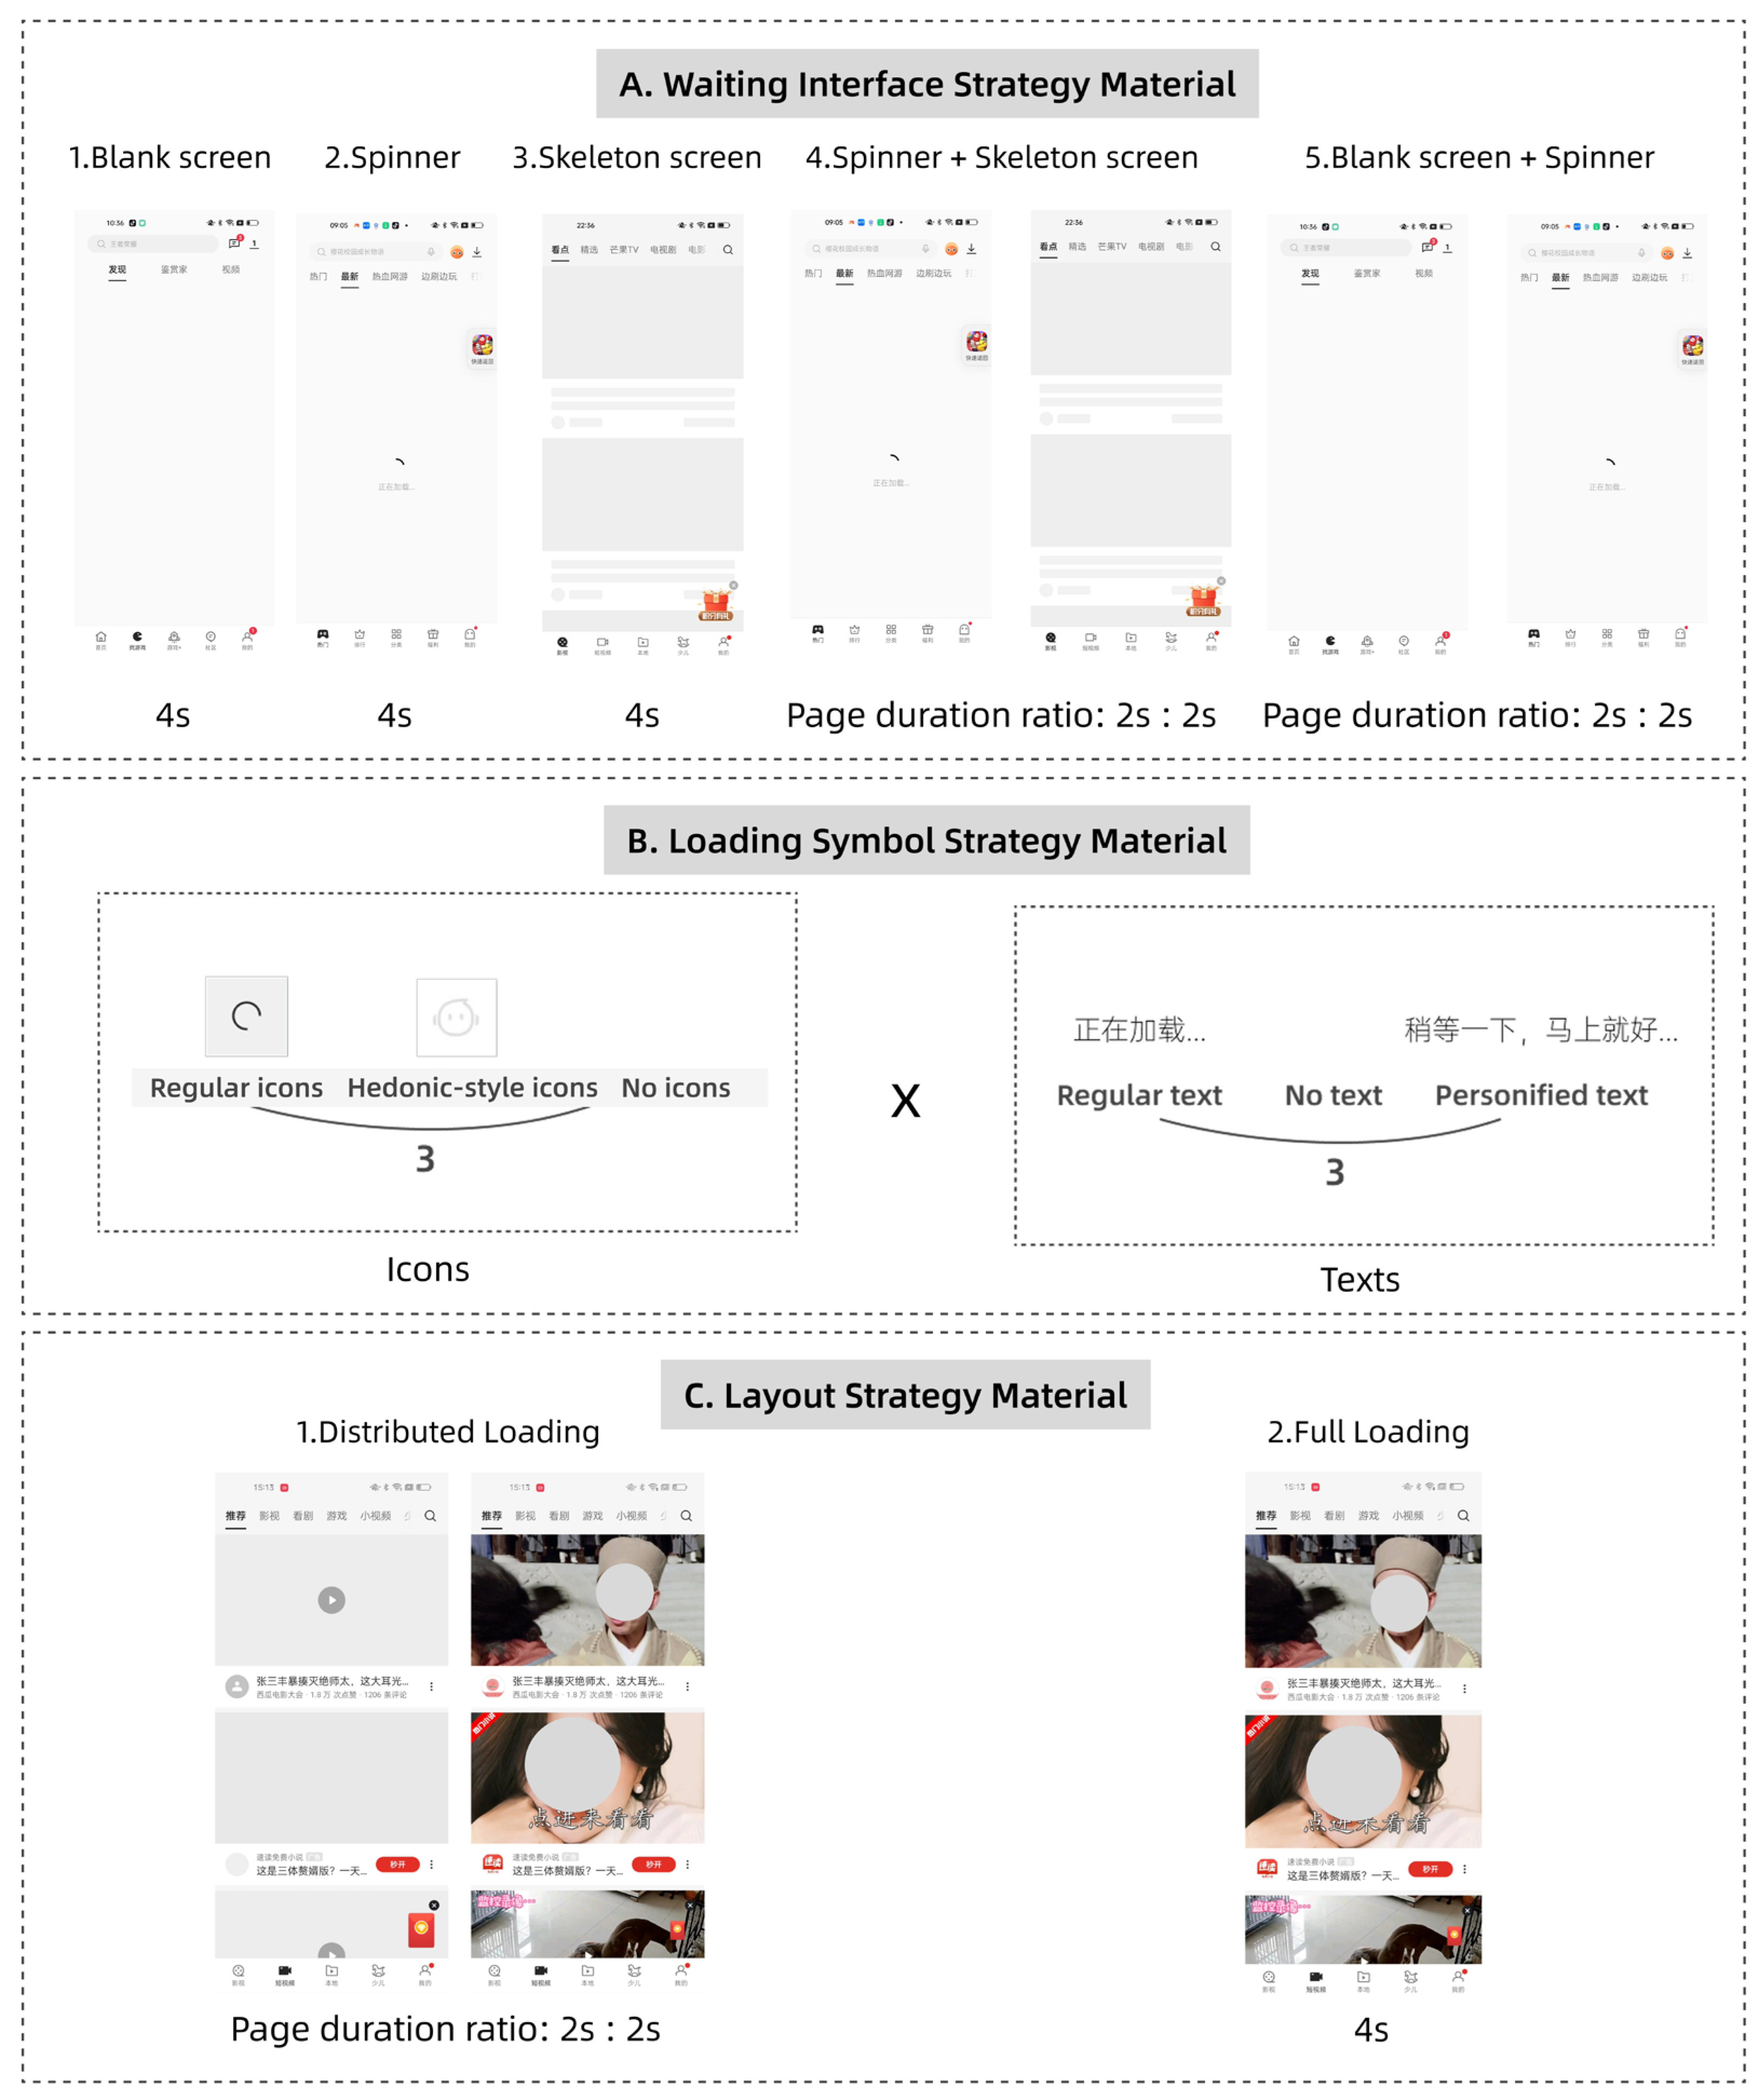
| Waiting Interface | Blank Screen | A waiting interface that is completely blank, with no visual cues. | |||
| Spinner | A loading interface displaying a loading symbol. | ||||
| Skeleton Screen | A loading interface showing a placeholder layout for the page. | ||||
| Combo 1 (Spinner + Skeleton Screen) | The spinner appears first, followed by the skeleton screen. | ||||
| Combo 2 (Blank Screen + Spinner) | The blank screen appears first, followed by the spinner. | ||||
| 2 | Jump Type | Tab Page | Defined as horizontal transitions between pages, commonly seen in app homepage tabs and navigation bars. | Time Perception: Participants’ subjective experience of how time passed. Loading Speed: Participants’ subjective evaluation of the loading speed. Satisfaction: Participants’ satisfaction with the waiting interface. Emotional Valence: The positivity or negativity of the participant’s mood (qualitative). Arousal Level: The intensity of the participant’s emotional state (quantitative). | |
| Content Page | Defined as vertical transitions between hierarchical pages, commonly seen when clicking to view specific content. | ||||
| Half-Screen Page | Defined as pop-up windows that partially cover the original content, commonly seen in video comment sections. | ||||
| Loading Symbol | Icons | Regular Icons | Circular animated loading icons. | ||
| Hedonic-style icons | Cartoon-style animated icons. | ||||
| No Icons | No icon displayed during loading. | ||||
| Text | Regular Text | Descriptive loading text like “Loading…”. | |||
| No Text | No text shown during loading. | ||||
| Personified Text | Humanized phrases like “Hang on, almost there!” | ||||
| 3 | Jump Type | Tab Page | Defined as horizontal transitions between pages, commonly seen in app homepage tabs and navigation bars. | Time Perception: Participants’ subjective experience of how time passed. Loading Speed: Participants’ subjective evaluation of the loading speed. Satisfaction: Participants’ satisfaction with the waiting interface. Emotional Valence: The positivity or negativity of the participant’s mood (qualitative). Arousal Level: The intensity of the participant’s emotional state (quantitative). | |
| Content Page | Defined as vertical transitions between hierarchical pages, commonly seen when clicking to view specific content. | ||||
| Half-Screen Page | Defined as pop-up windows that partially cover the original content, commonly seen in video comment sections. | ||||
| Layout Strategy | Distributed Loading | Text and image placeholders load first, followed by the images. | |||
| Full Loading | Full Loading: All page content loads simultaneously. | ||||
| Gender | Statistic | Age | Number of Participants |
|---|---|---|---|
| Male | Mean (SD) | 23.67 (2.36) | 51 |
| Female | Mean (SD) | 22.77 (1.18) | 39 |
| Total | Mean (SD) | 23.29 (1.99) | 90 |
| System Prototype | Phone Brand | Operating System | Number of Participants |
|---|---|---|---|
| iOS | iPhone | iOS | 27 |
| HarmonyOS | Huawei | HarmonyOS | 22 |
| Android | Honor | EMUI | 6 |
| Android | OPPO | ColorOS | 4 |
| Android | realme | Realme UI | 3 |
| Android | vivo | FuntouchOS or OriginOS | 6 |
| Android | iQOO | FuntouchOS or OriginOS | 6 |
| Android | OnePlus | HydrogenOS | 2 |
| Android | Xiaomi | MIUI | 4 |
| Android | Redmi | MIUI | 7 |
| Android | Samsung | One UI | 3 |
Disclaimer/Publisher’s Note: The statements, opinions and data contained in all publications are solely those of the individual author(s) and contributor(s) and not of MDPI and/or the editor(s). MDPI and/or the editor(s) disclaim responsibility for any injury to people or property resulting from any ideas, methods, instructions or products referred to in the content. |
© 2025 by the authors. Licensee MDPI, Basel, Switzerland. This article is an open access article distributed under the terms and conditions of the Creative Commons Attribution (CC BY) license (https://creativecommons.org/licenses/by/4.0/).
Share and Cite
Yin, Y.; Chen, Y.; Wang, C.; Chiang, Y.; Wang, P.; Wei, H.; Lei, H.; Chai, C.; Fan, H. Design Strategies for Mobile Click-and-Load Waiting Scenarios. Appl. Sci. 2025, 15, 6717. https://doi.org/10.3390/app15126717
Yin Y, Chen Y, Wang C, Chiang Y, Wang P, Wei H, Lei H, Chai C, Fan H. Design Strategies for Mobile Click-and-Load Waiting Scenarios. Applied Sciences. 2025; 15(12):6717. https://doi.org/10.3390/app15126717
Chicago/Turabian StyleYin, Yang, Yingpin Chen, Chenan Wang, Yuching Chiang, Pinhao Wang, Haoran Wei, Haibo Lei, Chunlei Chai, and Hao Fan. 2025. "Design Strategies for Mobile Click-and-Load Waiting Scenarios" Applied Sciences 15, no. 12: 6717. https://doi.org/10.3390/app15126717
APA StyleYin, Y., Chen, Y., Wang, C., Chiang, Y., Wang, P., Wei, H., Lei, H., Chai, C., & Fan, H. (2025). Design Strategies for Mobile Click-and-Load Waiting Scenarios. Applied Sciences, 15(12), 6717. https://doi.org/10.3390/app15126717