Article

A Practical Quantitative Tool Based on the EXCASS System for the Use of Hoek-Brown’s Disturbance Factor in Slope Excavations

Department of Geological Engineering, Faculty of Engineering, Hacettepe University, Beytepe, 06800 Ankara, Türkiye
*
Author to whom correspondence should be addressed.
Appl. Sci. 2025, 15(12), 6714; https://doi.org/10.3390/app15126714
Submission received: 30 April 2025 / Revised: 9 June 2025 / Accepted: 12 June 2025 / Published: 15 June 2025
(This article belongs to the Section Earth Sciences)

Abstract

The disturbance factor (D) in the Hoek–Brown criterion quantifies excavation-induced rock mass disturbance. Although D is conceptually defined as a continuous parameter ranging from 0 to 1, the most recent Hoek–Brown guidelines provide descriptions only for boundary conditions related to slopes and tunnels. In slope excavations, the degree of disturbance is governed not only by the excavation method but also by the thickness of the removed overburden, with its influence becoming particularly significant in deep excavations. In recent years, the concept of a transitional disturbance factor, varying with depth from the excavation surface, has gained increasing attention. To address this need, the EXCASS system, an empirical method for selecting appropriate excavation techniques based on the Geological Strength Index (GSI) and point load strength (Is50) values, was integrated into the transitional disturbance factor framework in this study. EXCASS allows for the selection of stronger or weaker excavation methods, offering flexibility to control the degree of disturbance induced in the rock mass. Moreover, the disturbance factor at the excavation surface was determined by incorporating both the operational excavation power index and the thickness of the removed overburden. This integrated approach enables a more realistic evaluation of excavation-induced damage in slope stability analyses.

1. Introduction

From the perspectives of engineering geology and rock mechanics, rock masses are regarded as geological materials composed of intact rock blocks, separated by discontinuities. Due to the inherent challenges in obtaining large volume samples from rock masses that accurately reflect in-situ conditions, including both the intact rock material and its joint patterns, significant efforts have been made to develop empirical tools for characterizing rock masses. While the historical development of methods for determining rock mass strength is not the primary focus of this study, particular attention is given to the excavatability of rock masses and its relationship to the degree of disturbance, which plays a fundamental role in the overall strength and stability of rock masses.
The Hoek–Brown empirical failure criterion, introduced in 1980 by Hoek and Brown, has become a widely accepted framework within the rock mechanics community. Its broad adoption can be attributed to its simplicity and the availability of easily accessible input parameters. Over time, the criterion has undergone several revisions [1,2,3], reflecting the growing body of case studies and the expanding range of geological conditions to which it can be applied. Despite its widespread use, the Hoek–Brown criterion remains an empirical tool, and ongoing revisions aim to improve its applicability to increasingly complex rock mass behaviors encountered in various excavation scenarios.
The concept of disturbance, originally introduced by Hoek and Brown [4] through two discrete equations representing disturbed and undisturbed conditions, was subsequently refined by Sonmez and Ulusay [5]. Their modification transformed the relationship into a continuous function, thereby accommodating varying levels of disturbance between fully disturbed and undisturbed rock mass states. This modification by Sonmez and Ulusay [5] marked the first effort to account for different degrees of disturbance, ranging from basic mechanical excavation to uncontrolled blasting, based on the extent of disturbance induced by excavation activities.
A similar approach was later incorporated into the Hoek–Brown criterion by Hoek et al. [3], wherein a new parameter, the disturbance factor (D), was introduced. This factor spans a range from 0, which represents an undisturbed rock mass, to 1, corresponding to a completely disturbed rock mass condition. The updated formulation of the Hoek–Brown empirical failure criterion, incorporating the disturbance factor, is presented in Equations (1)–(4).
σ 1 = σ 3 + σ c i m b σ 3 σ c i + s a
m b = m i e x p G S I 100 28 14 D
s = e x p G S I 100 9 3 D
a = 1 2 + 1 6 e G S I 15 e 20 3
where GSI is the geological strength index, σci is the uniaxial strength of the rock material, s and m are Hoek–Brown’s dimensionless constants, and mi and mb are mi parameters of the rock material and rock mass, respectively.
Although the disturbance factor was transformed into a continuous form in the equations presented above, there is no widely accepted practical approach for selecting the disturbance factor. On the other hand, Hoek et al. [3] proposed a guideline for selecting the disturbance factor for tunnel and slope cases. Despite the addition of the disturbance factor as a continuous parameter ranging from a completely disturbed rock mass (D = 1) to an undisturbed rock mass (D = 0), in order to maintain its practical relevance with the experience of using the probable criterion, Hoek et al. [3] included explanations and definitions regarding the lower and upper limits in the guideline for determining the disturbance factor, rather than relying solely on a continuous definition.
In the latest version of the criterion, known as the 2018 version, Hoek and Brown [6] updated the guideline for selecting the disturbance factor, including revisions primarily to the lowest disturbance factor values, while maintaining their concerns regarding the uncertainty associated with the use of empirical tools. Although the updated Hoek and Brown’s guideline provides the lowest and highest values for the disturbance factor to be used at the design stage of slopes and tunnels, it lacks a clear definition for the continuous range of this factor between the boundary values. In this respect, the quantitative guidance remains quite subjective.
Recent studies, such as those by Feng et al. [7] and Xia et al. [8], have attempted to address this limitation by deriving continuous relationships for the disturbance factor. However, both studies—despite their valuable contributions—are based on similar approaches involving the wave velocity (Vp) and acoustic wave velocity (Cp) of the rock mass, respectively, and present notable practical limitations. For instance, changes in Vp or Cp before and after disturbance can only be observed after excavation begins. Therefore, the continuous disturbance relationships proposed in these studies are not applicable during the initial design phase of slope excavations.
The following section presents a detailed discussion of the limitations of these two key studies, supported by various empirical relationships used in conjunction.
A practical and empirically based approach is still needed to continuously define the disturbance factor based on rock mass properties while considering the method of excavation and its productivity, without compromising the practical value of the Hoek-Brown failure criterion. The EXCASS system, proposed by Dagdelenler et al. [9], is designed to select the optimum excavation method based on the excavation power index (EPIopt) in conjunction with the Excavation Performance Rating (EPR) to adjust the power of excavation either positively or negatively. With its flexible structure and practical applicability in excavation method selection, the EXCASS system is capable of predicting the degree of disturbance on the excavation surface even at the preliminary design stage. In this study, a practical quantitative tool is proposed for selecting the disturbance factor on an excavated slope face for design purposes by utilizing the EXCASS system.

2. Materials and Methods

2.1. Key Studies on Rock Mass Disturbance

A simple definition of a rock mass is an engineering volume composed of rock material and the discontinuity planes that bound it. In engineering applications such as dams, tunnels, and slopes, it is inevitable that the virgin stress state of the rock mass will change. Excavation of rock masses is required in many rock mechanics applications, such as dam construction, mining activities, and highway construction. For such technical initiatives, from an engineering perspective, excavation costs should be minimized as much as possible by using optimum excavation methods (e.g., blasting, digging, ripping, drilling) based on the mechanical properties of the rock masses. Depending on the excavation method applied in slope excavations, new cracks develop, with their abundance decreasing from the excavation surface to the depth. As discussed by Hoek and Brown [6], another disturbance effect that increases in significance with increasing slope excavation depth is the removal of the rock mass, resulting in stress relief. This causes the surrounding rock mass to relax and dilate.
The guidelines for estimating the disturbance factor (D) proposed by Hoek et al. [3] were revised by Hoek and Brown [6], considering both stress relaxation and blasting damage. However, the updated guideline, which includes stress relaxation and blasting damage, provides descriptions of rock masses that define only two classes based on the scale of slopes. The first description, based on the disturbance viewpoint, refers to relatively small-sized slopes typically encountered in civil engineering applications. For this category of relatively small slopes, D = 0.5 is recommended for controlled presplit or smooth-wall blasting with moderate rock mass damage.
The second description, based on the disturbance viewpoint, pertains to relatively large open-pit mine slopes. According to the rock mass disturbance description for large-scale slopes provided by Hoek and Brown [6], stress reduction damage primarily due to stress relief occurs, even when mechanical excavation methods are applied to excavate slopes in some weak rock masses. In this case, the use of D = 0.7 as the minimum disturbance factor is recommended. On the other hand, D = 1.0 is recommended for production blasting, regardless of the slope scale.
Although the most recent version of the Hoek–Brown failure criterion incorporates continuous relations for the disturbance factor, no accepted relationship exists between the lower (D = 0.5 or D = 0.7, depending on the rock mass disturbance description) and upper (D = 1.0) limits of D values. In other words, the selection of intermediate D values at the design stage is entirely left to the practitioner’s experience.
Feng et al. [7] derived a continuous relation of D by considering the ratio of disturbed to undisturbed rock from existing empirical relations in a deformation modulus (Equations (5) and (6)).
E m = 1 D 2 σ c 100 10 G S I 10 40 ( σ c 100 MPa ) 1 D 2 10 G S I 10 40 σ c > 100 MPa
E u d E d = 1 1 D 2
where σ c is the uniaxial strength of rock material, D is the disturbance factor of the rock mass, Em is the deformation modulus of the rock mass, Eud and Ed are the deformation modulus of undisturbed and disturbed rock masses, respectively.
Moreover, in addition to the empirical relation between Em and RMR proposed by Read et al. [10], the empirical relation between the Basic Quality Index (BQ) and RMR was also considered by Feng et al. [7] in the derivation of a continuous type relation between D and BQ (Equations (7) and (8)).
E m = 0.1 R M R 10 3
B Q = 80.786 + 6.0943 R M R
where Em is the deformation modulus of the rock mass. The BQ is defined by Equations (9) and (10):
B Q = 100 + 3 R c + 250 K ν
K ν = ν m p ν r p 2
where Kv is the rock mass integrity index (ranging from 0 to 1), vmp is the wave velocity of the rock mass, vrp is the wave velocity of the rock block, and Rc is the saturated uniaxial compressive strength.
In the last stage, Feng et al. [7] derived the following relation between D and BQ by using the three empirical Equations (6)–(8) within each other.
D = 2 1 B Q d 80.786 B Q u d 80.786 3
where BQd and BQud are the disturbed and undisturbed basic quality index, respectively.
Since the relation derived by Feng et al. [7] is based on three empirical equations, due to the nature of empirical equations, there is a potential for the errors from each of them to combine and increase in the derived D relation. Moreover, as is well known, stress relief due to the removal of overburden—particularly in deep excavations—causes disturbance in the rock mass. In deep slope excavations, application of the derived continuous relation for D requires determination of BQd by accounting for changes in Kv, which vary depending on the progress of the excavation phase. For disturbed rock mass conditions, determining Kv by measuring wave velocity with depth is only feasible once the excavation has reached the relevant depth. This represents a major limitation in the derived relation proposed by Feng et al. [7], potentially reducing its practical applicability, especially for deep slope excavations. Furthermore, considering that each empirical criterion should be applied in line with its original recommendations, the compatibility of this relation with the lower limit values of D = 0.5 and D = 0.7—suggested by the developers of the Hoek–Brown failure criterion for small- and large-scale slopes, respectively—is open to debate [6]. Therefore, despite its theoretical contribution, the study appears to fall short as a practical tool for estimating the disturbance factor (D) from surface to depth during the initial stages of deep slope design analysis.
A recent study performed by Xia et al. [8] was another attempt to define a continuous relationship of D. As in the study performed by Feng et al. [7], Xia et al. [8] used Equation (6) as the starting point for the derivation of the continuous form relation of D. However, the following empirical relation (Equation (12)) between Em and RMR proposed by Jose et al. [11] was preferred by Xia et al. [8].
E m = E i e x p R M R 89 100 36
where Ei is the elastic modulus of intact rock, and RMR89 is the 1989 version of Bieniawski’s RMR.
In addition, as available in manuscript by Xia et al. [8], to transform Equations (12) and (13), in which the acoustic wave velocity (Cp) is an independent parameter, some empirical relations were considered by Xia et al. [8], including Barton’s Q, P wave velocity (Vp), the 1979 version of Bieniawski’s RMR (RMR79), and Cp.
E m = E i e x p 13.64 C p 96.4 36
The following relation (Equation (14)) between D and Cp was derived by Xia et al. [7].
D = 2 1 e x p 13.64 C p 36
However, it can be concluded that all the limitations in Feng et al.’s [7] Equation (11) are valid for Equation (14) proposed by Xia et al. [8], in which Cp was used instead of Vp.

2.2. The Flexible Excavation Assessment (EXCASS) System

In rock engineering projects such as slopes, dams, and tunnels, the excavation of rock masses is a fundamental requirement. The excavatability of rock masses is primarily governed by the structure of the rock mass, including its discontinuities, as well as the mechanical properties of the rock material. Various excavation methods, including diggers, rippers, hammers, and blasting, are employed depending on these characteristics. Since selecting the appropriate excavation method during the design phase is crucial for cost efficiency, numerous valuable studies on rock mass excavatability can be found in the literature [12,13,14,15].
The EXCASS system, developed by Dagdelenler et al. [9], utilizes an artificial neural network (ANN) learning algorithm, making it highly adaptable. This flexibility is attributed to the incorporation of two key parameters: the excavation power index (EPI) and the excavation performance rating (
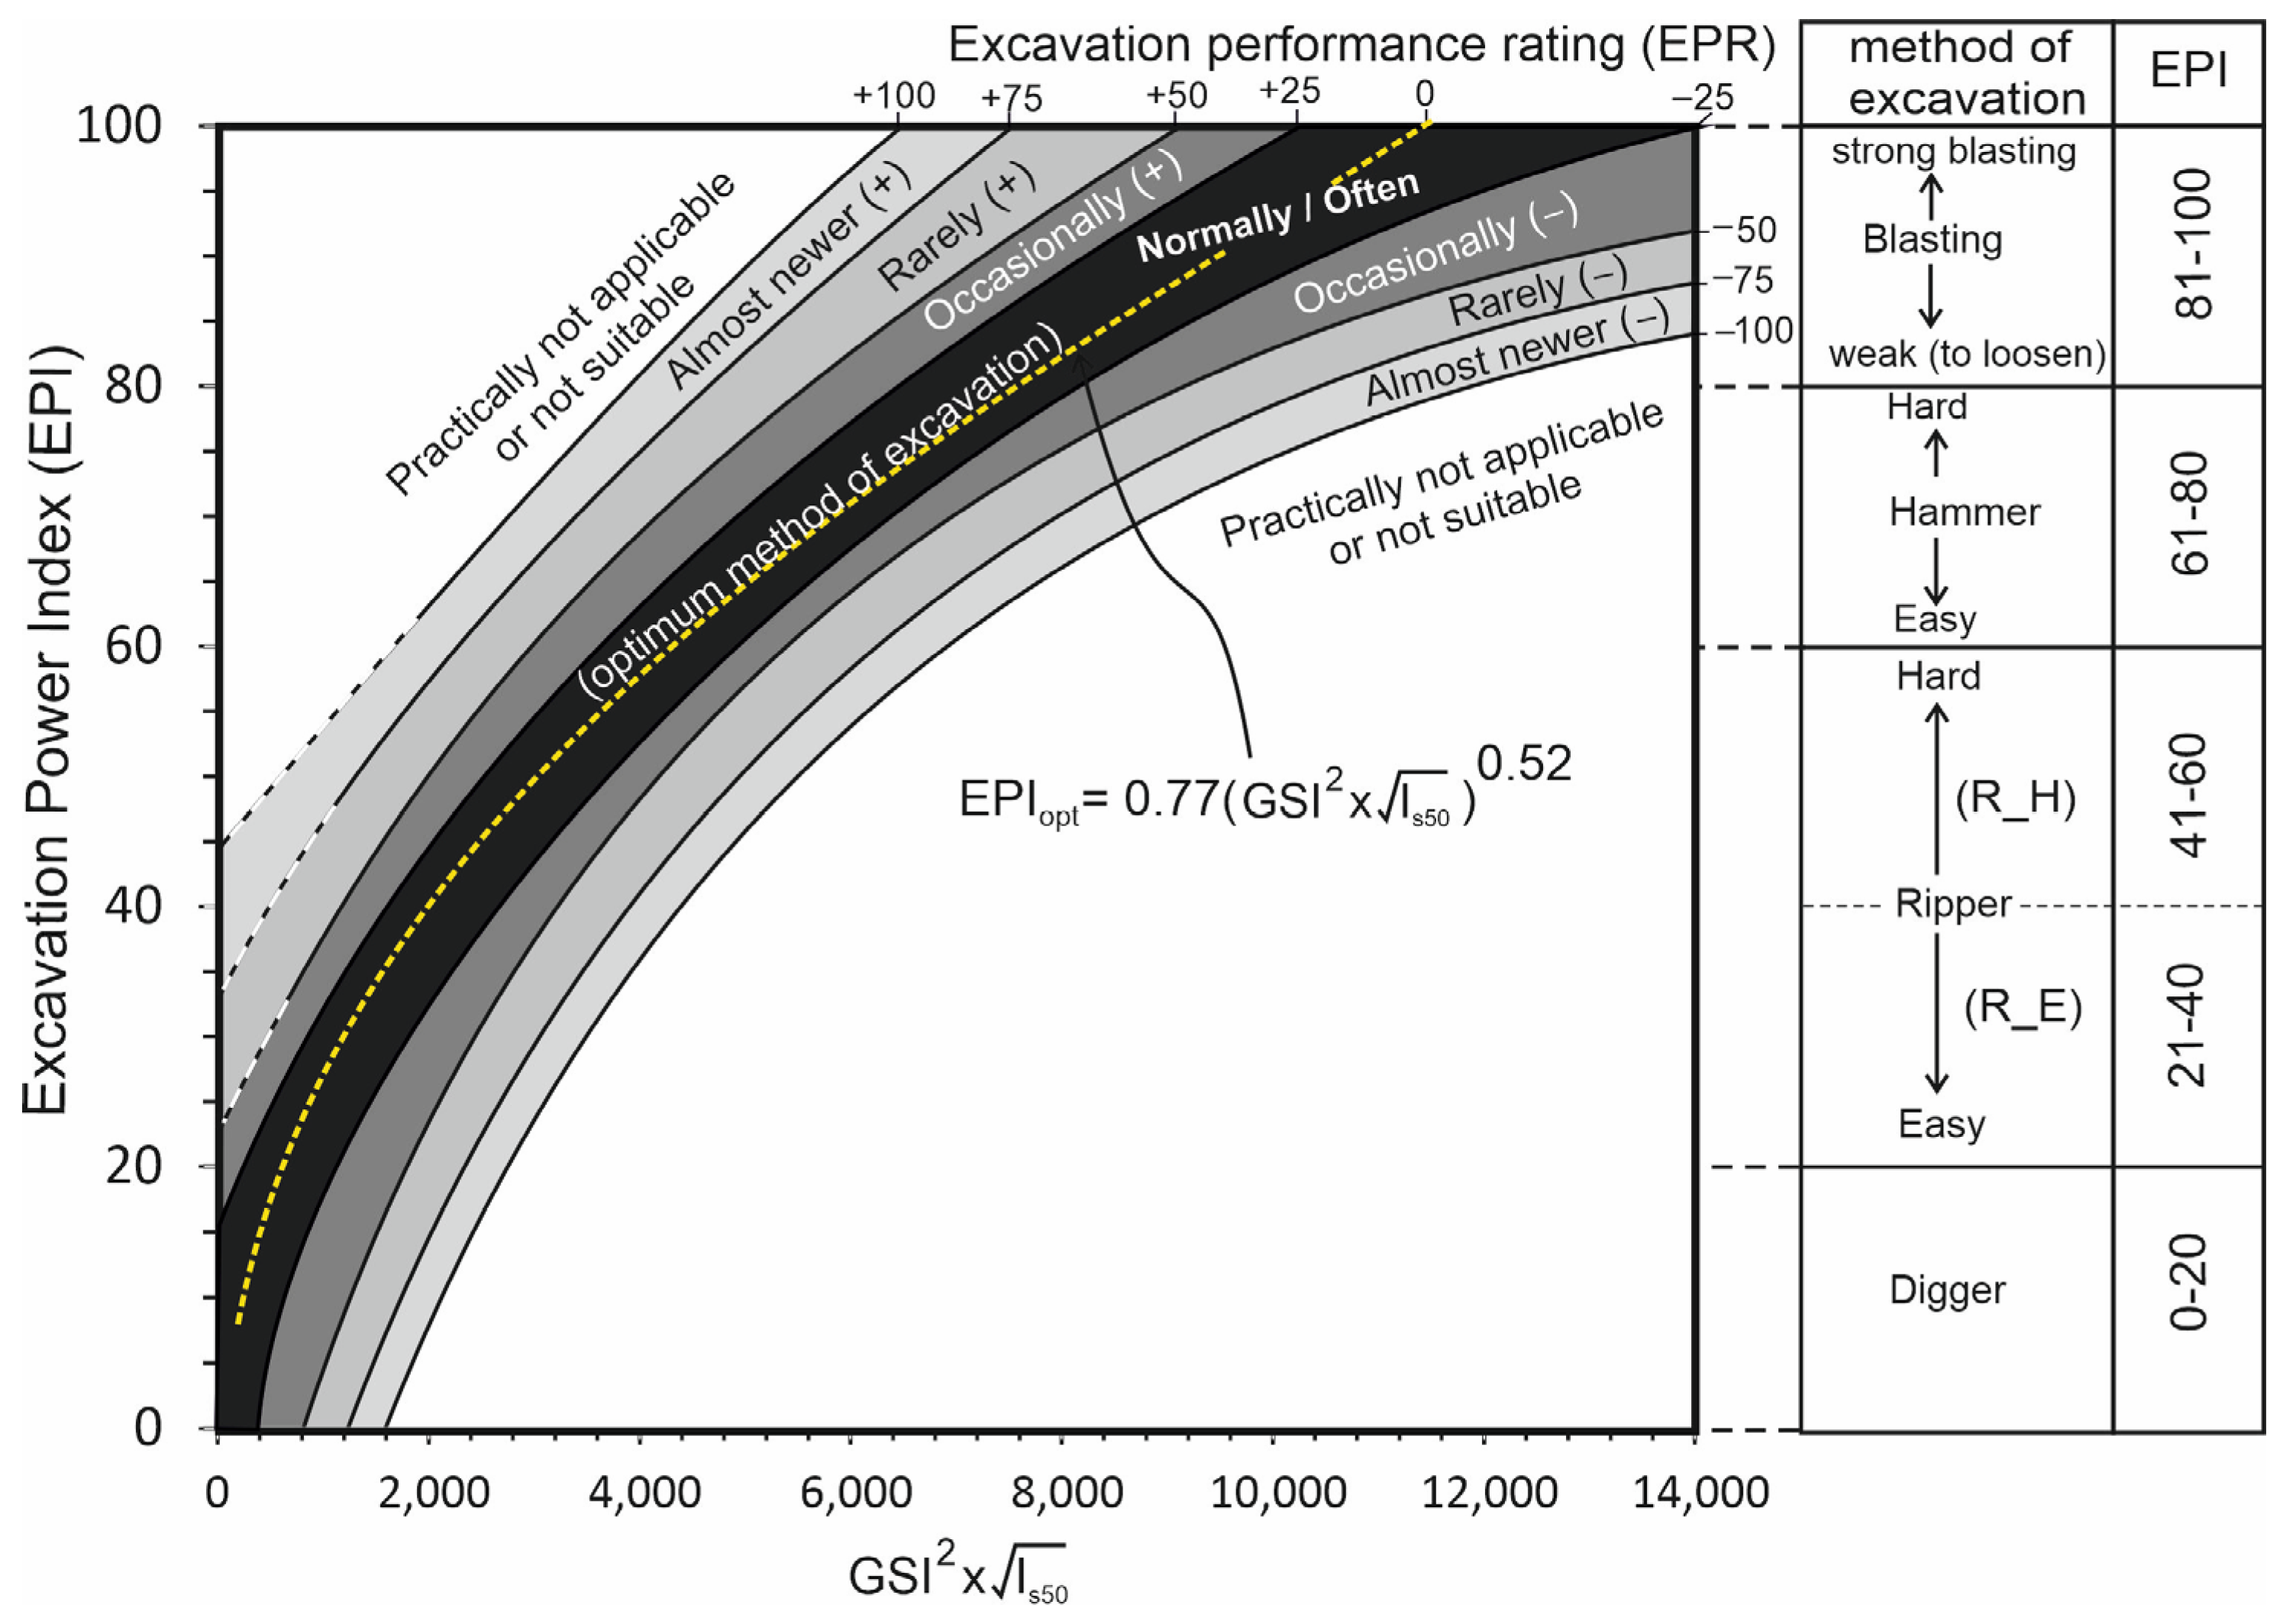
EPR). As illustrated in Figure 1, the optimum excavation method can be determined by evaluating the optimum excavation power index (EPIopt), which ranges from zero to 100 (Equation (15)).
E P I o p t = 0.77 G S I 2 x I s 50 0.52
where GSI is the geological strength index of the rock mass and Is50 is the point load index of the rock material.
Dagdelenler et al. [9] stated that EPR was incorporated into the EXCASS system to account for deviations from EPIopt, either in the positive or negative direction. When EPR takes positive values, the selected excavation method will be more powerful than the optimum method determined by EPIopt. Positive EPR values are particularly relevant when a very large volume of rock mass needs to be excavated within a given operational time frame.
As explained in detail by Dagdelenler et al. [9], a positive EPR indicates that the excavation method is stronger than the optimal choice, which is necessary when handling substantial rock mass volumes within a specific time constraint. In such cases, the degree of disturbance in the rock mass will inevitably increase due to the selection of a more intensive excavation method. Conversely, when a negative EPR value is used, a weaker excavation method is preferred, resulting in minimal disturbance to the rock mass. However, this also means that the volume of excavated rock per unit of time will be lower. The incorporation of the EPR enhances the practical applicability of the EXCASS system, adding flexibility by allowing adjustments based on excavation volume and operational requirements.

2.3. Development of a Quantitative Method for Disturbance Factor on the Excavated Slope Face

As is well known, disturbances in the rock mass during slope excavation operations in a slope come from two primary effects:
i.
The generation of new fractures and an increase in the aperture of discontinuities in rock mass near the excavated slope face.
ii.
Stress relief due to the removal of the excavation cover, especially in deep slope excavations, which leads to transitional disturbances in the rock mass.
The first effect that can be observed on the excavated slope face can be quantified by using the EXCASS system, as it is part of the selection of the excavation method that controls the disturbance on the slope surface.
The EPIopt is calculated using Equation (15) based on the inputs GSI and Is50. As discussed in the previous section, the EPI value can be adjusted by applying either a positive or negative EPR (see Figure 1). However, to eliminate the reliance on the EXCASS system chart and enhance the practical usability of EPR, the variation in EPI due to 
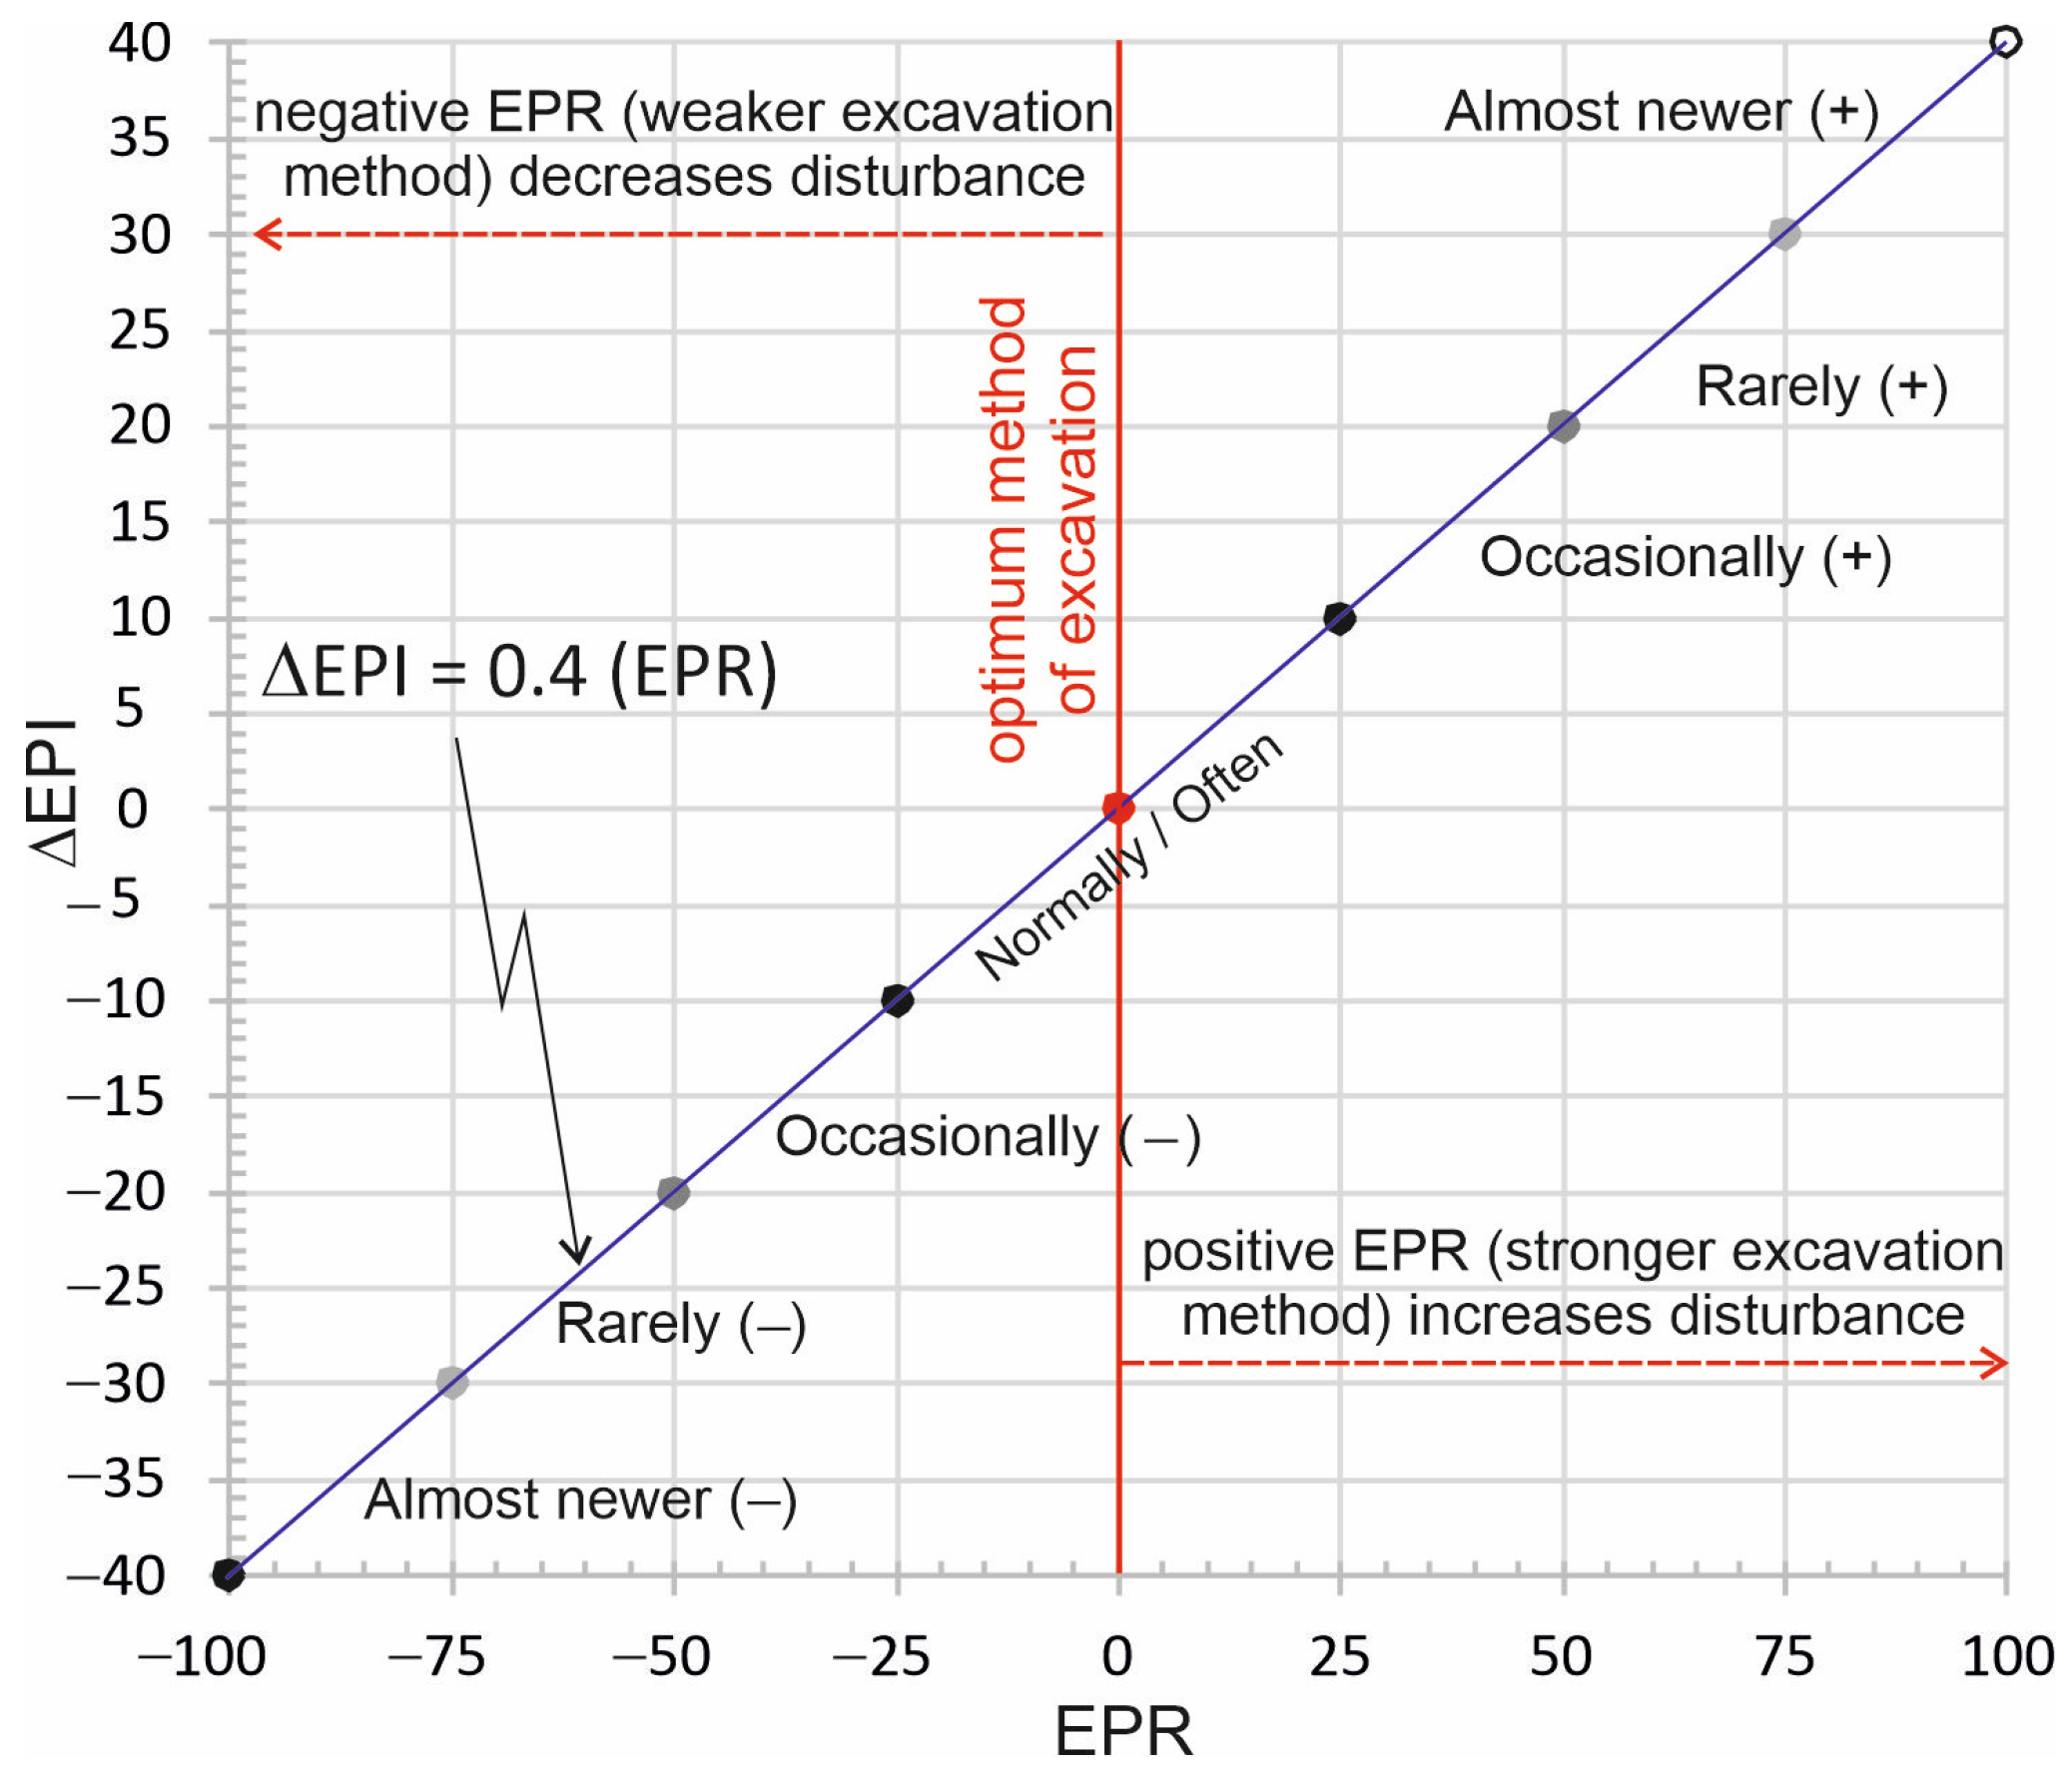
EPR can be defined as ΔEPI. When examining the classification transitions from normal to inapplicable above and below the EPIopt curve in the EXCASS chart (see Figure 1), it is observed that EPI typically changes by approximately 5 to 10 units per class transition. To simplify the relationship between EPR and ΔEPI, a value of 10 units per class transition was adopted in this study (Figure 2). As illustrated in Figure 2, the EPIopt value determined for an EPR of zero can fluctuate by ±30 (ΔEPI), depending on the EPR value, which ranges between −100 and +100. The operational excavation power index (EPIo) can be determined by summing EPIopt and ΔEPI, which is considered sufficient for practical applications (Equations (16) and (17)).
E P I o = E P I o p t + E P I
E P I = 0.4 x E P R
As a cost–benefit recommendation for practitioners, EPR can preferably be used within the range of occasionally (−) to occasionally (+). For large-scale slope excavations, such as in open-pit mining, EPR may be increased to enhance excavation efficiency. Conversely, for sensitive slope excavations where minimizing rock mass disturbance is a priority, EPR can be reduced to ensure lower disturbance degrees. However, since a negative EPR value will decrease the EPIo, the use of a negative EPR value should be approached with caution for large slope excavations that involve significant uncertainties.
Figure 2. The relation between EPR and ΔEPI.
Applsci 15 06714 g002
The limit values of disturbance factors for slope cases, as outlined in the guidelines for estimating the disturbance factor (D) due to stress relaxation and blasting damage, were used in the development of the relationship between EPIo and Df. As noted by Dagdelenler [16], the notation of D was replaced with Df to emphasize that the disturbance pertains only to the slope face. Two descriptions of the rock mass, along with the recommended disturbance factors proposed by Hoek and Brown [6], were considered in this analysis, as follows:
i.
Small-scale blasting in civil engineering slopes typically leads to minimal rock mass damage when controlled blasting techniques, such as controlled presplit or smooth wall blasting, are employed (Df = 0.5). In contrast, uncontrolled production blasting can cause considerable damage to the rock face (Df = 1.0).
ii.
In certain weak rock masses, excavation can be performed using ripping and dozing methods. The damage to the slopes in such cases is primarily attributed to stress relief, with the mechanical excavation effects of stress reduction resulting in a disturbance factor of Df = 0.7. Large-scale open-pit mine slopes, however, experience significant disturbance due to intensive production blasting and stress relief from overburden removal (Df = 1.0).
The first description of rock mass refers to small-scale excavation in civil engineering slopes, while the second pertains to large, multi-benched excavation slopes exposed to stress relief from overburden removal, such as those found in open-pit mines. The disturbance in the rock mass due to the excavation method is most pronounced at the initial stage of excavation, when the excavation surface is still close to the original topographic surface. As excavation depth increases, the effects of stress relief on the slope face become more dominant. It can be more clearly understood that the disturbance in the rock mass, resulting from stress relief, is directly related to the vertical overburden load from the original topography on the excavation surface.
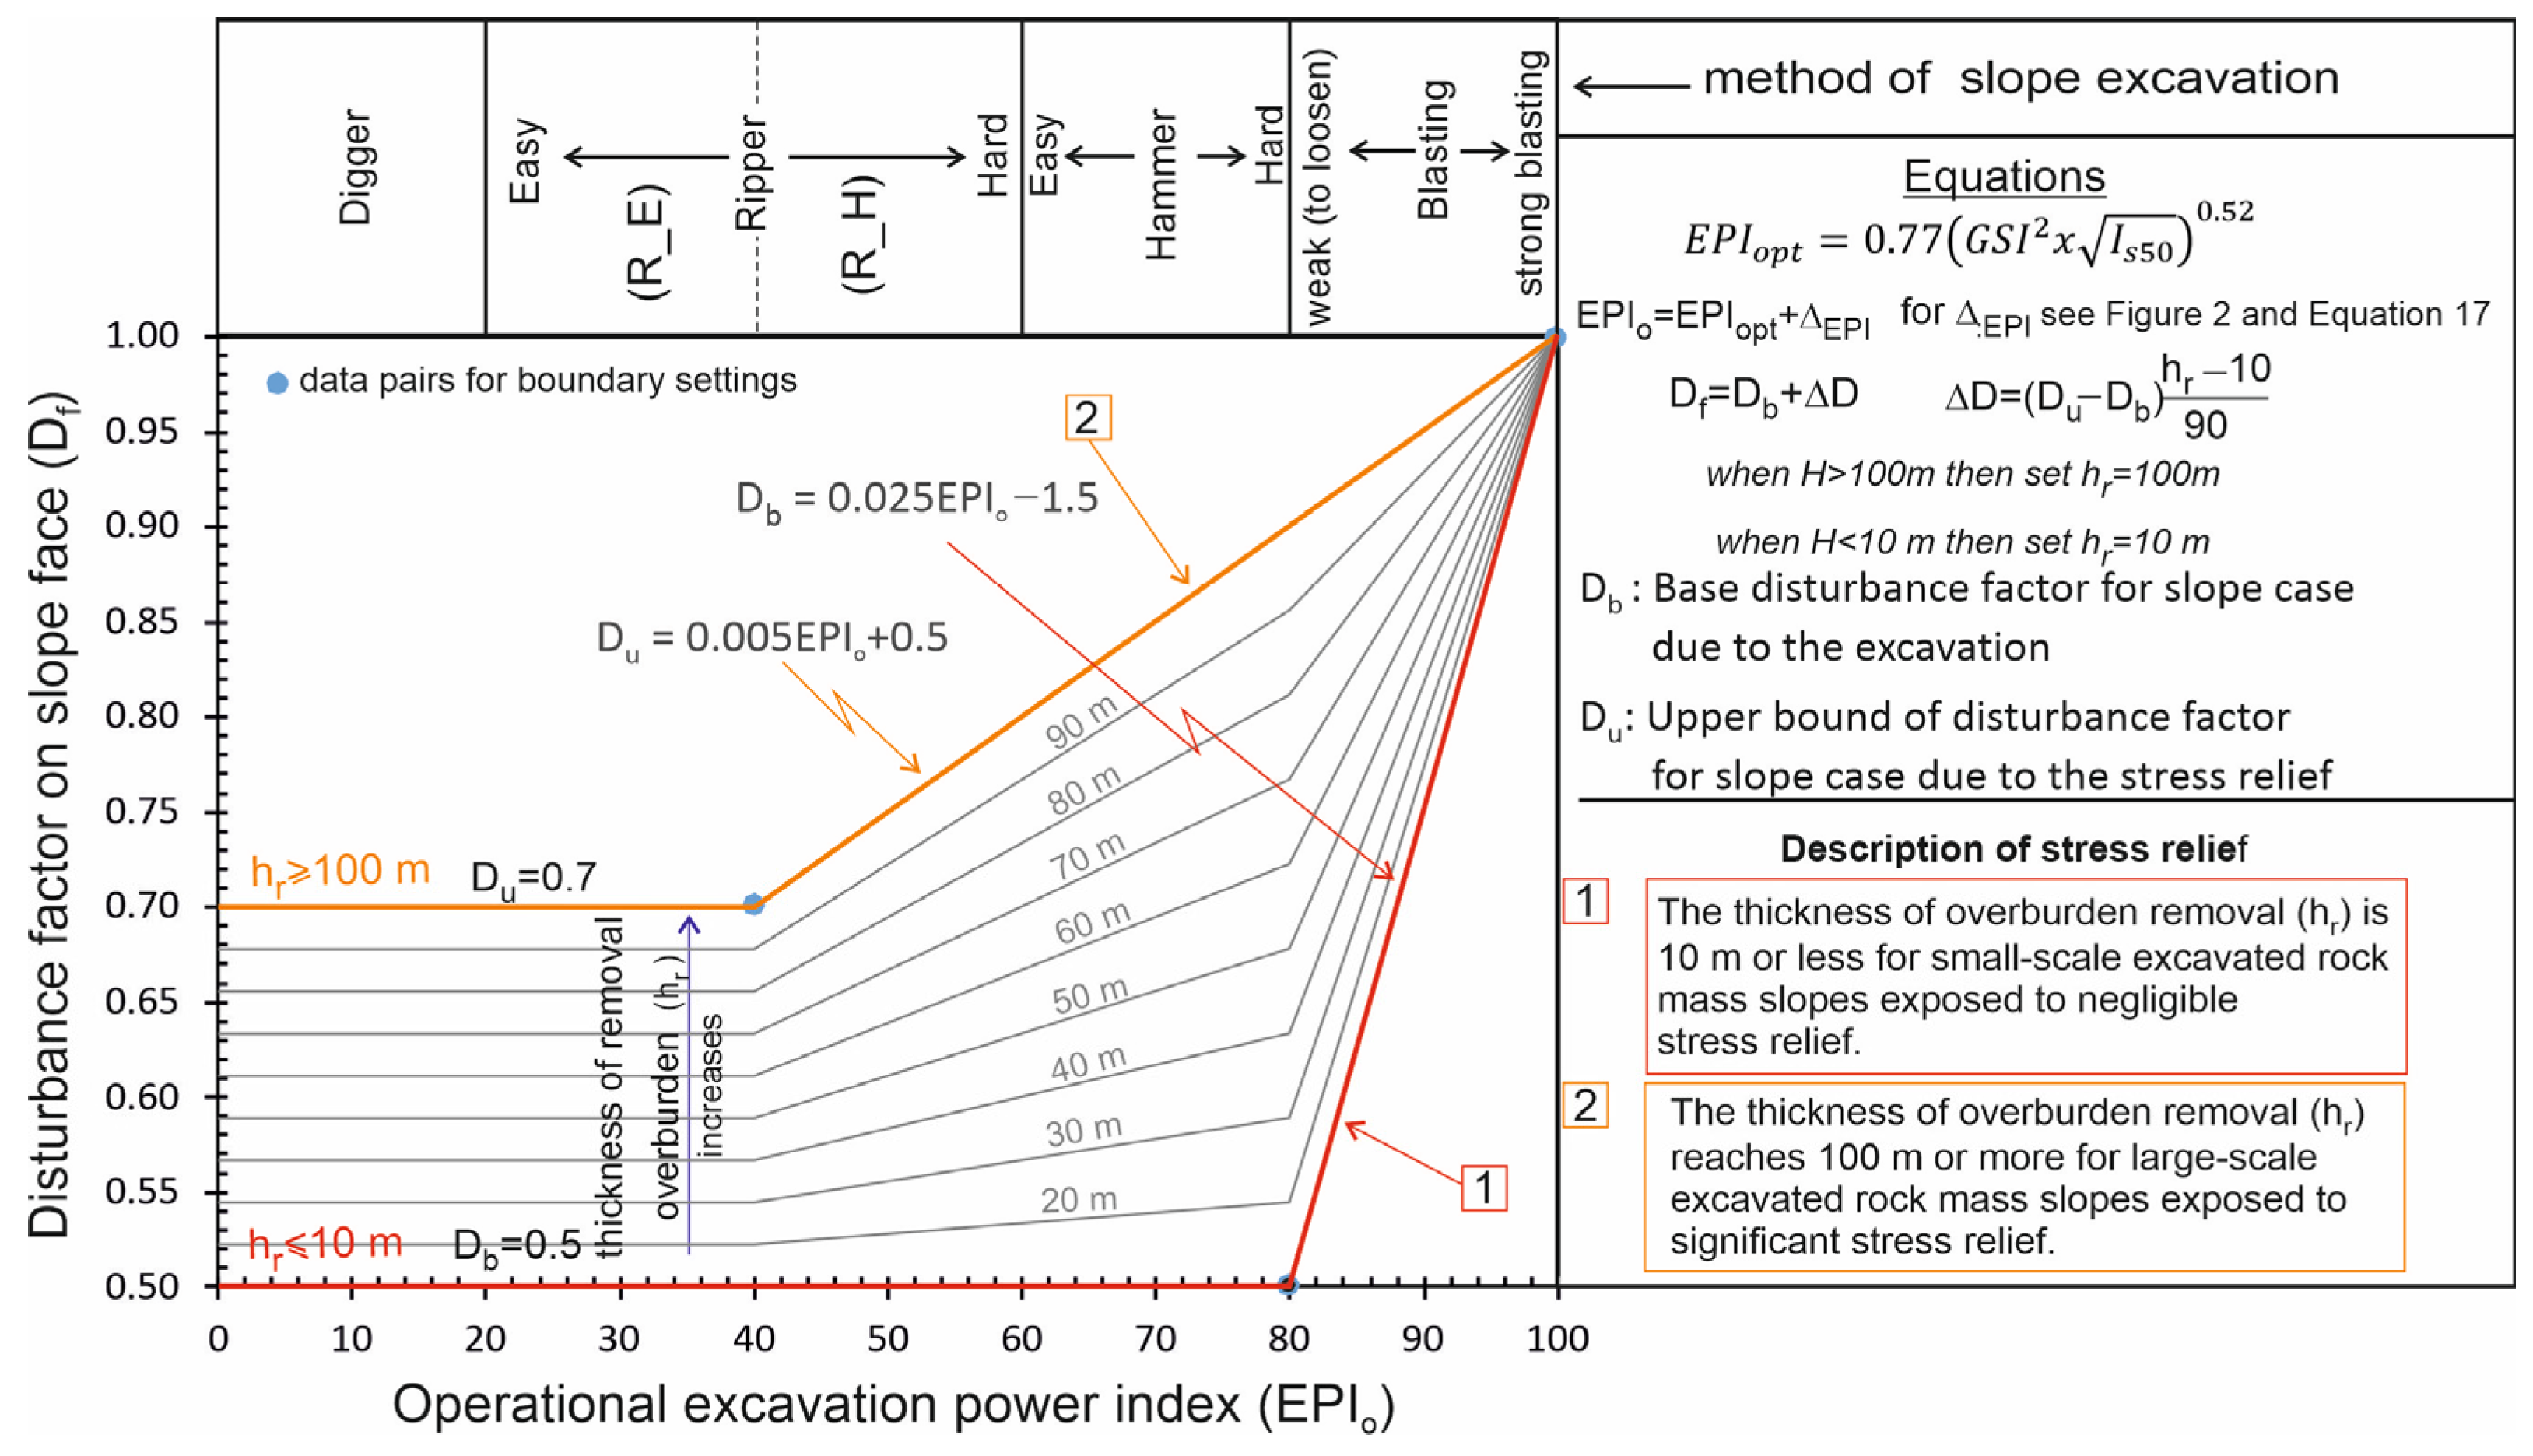
Considering the first description of the rock mass with disturbance factors on the slope face, the lowest disturbance factor on the slope face (Df) of 0.5 for small-scale slope excavations corresponds to an EPIo value of 80, which defines the lower boundary of blasting. A disturbance factor of Df = 1 was used for the highest EPIo value of 100. To connect these two data points between EPIo and Df, a linear relationship was used, as shown in Figure 3. For the excavation operation, which is expected to cause minimal damage to the rock mass, Df = 0.5 is accepted when EPIo is less than 80. The relation between EPIo and the disturbance factor, especially for small-scale civil engineering slopes or for benches close to the top elevation of very large multi-benched excavation slopes where stress relief is negligible, was named the base disturbance factor relation and denoted by Db. The thickness of the overburden removal (hr) was assumed to be 10 m or less for small-scale excavated rock mass slopes exposed to negligible stress relief.
A similar procedure was followed for deriving the power–type relationship between EPIo and Df for slopes exposed to stress relief, depending on the thickness of the overburden removal, particularly in the excavation of very large slopes. This relation was denoted by Du. For this purpose, the lowest Df value of 0.7 was taken instead of 0.5, corresponding to an EPIo of 40, which defines the boundary between weak and hard ripper. To reflect stress relief with depth for large-scale excavated rock mass slopes on disturbance, the disturbance factor of the rock mass was increased proportionally above Db until the overburden removal thickness reaches 100 m or more. In other words, hr varies between 10 m and 100 m, with proportional interpolation between the Db and Du relations. The graphical representation of the developed procedure, including Equations (18)–(21), is shown in Figure 3.
D b = 0.025 E P I o 0.5
D u = 0.005 E P I o + 1.5
D f = D b + D
D = D s D b h r 10 90
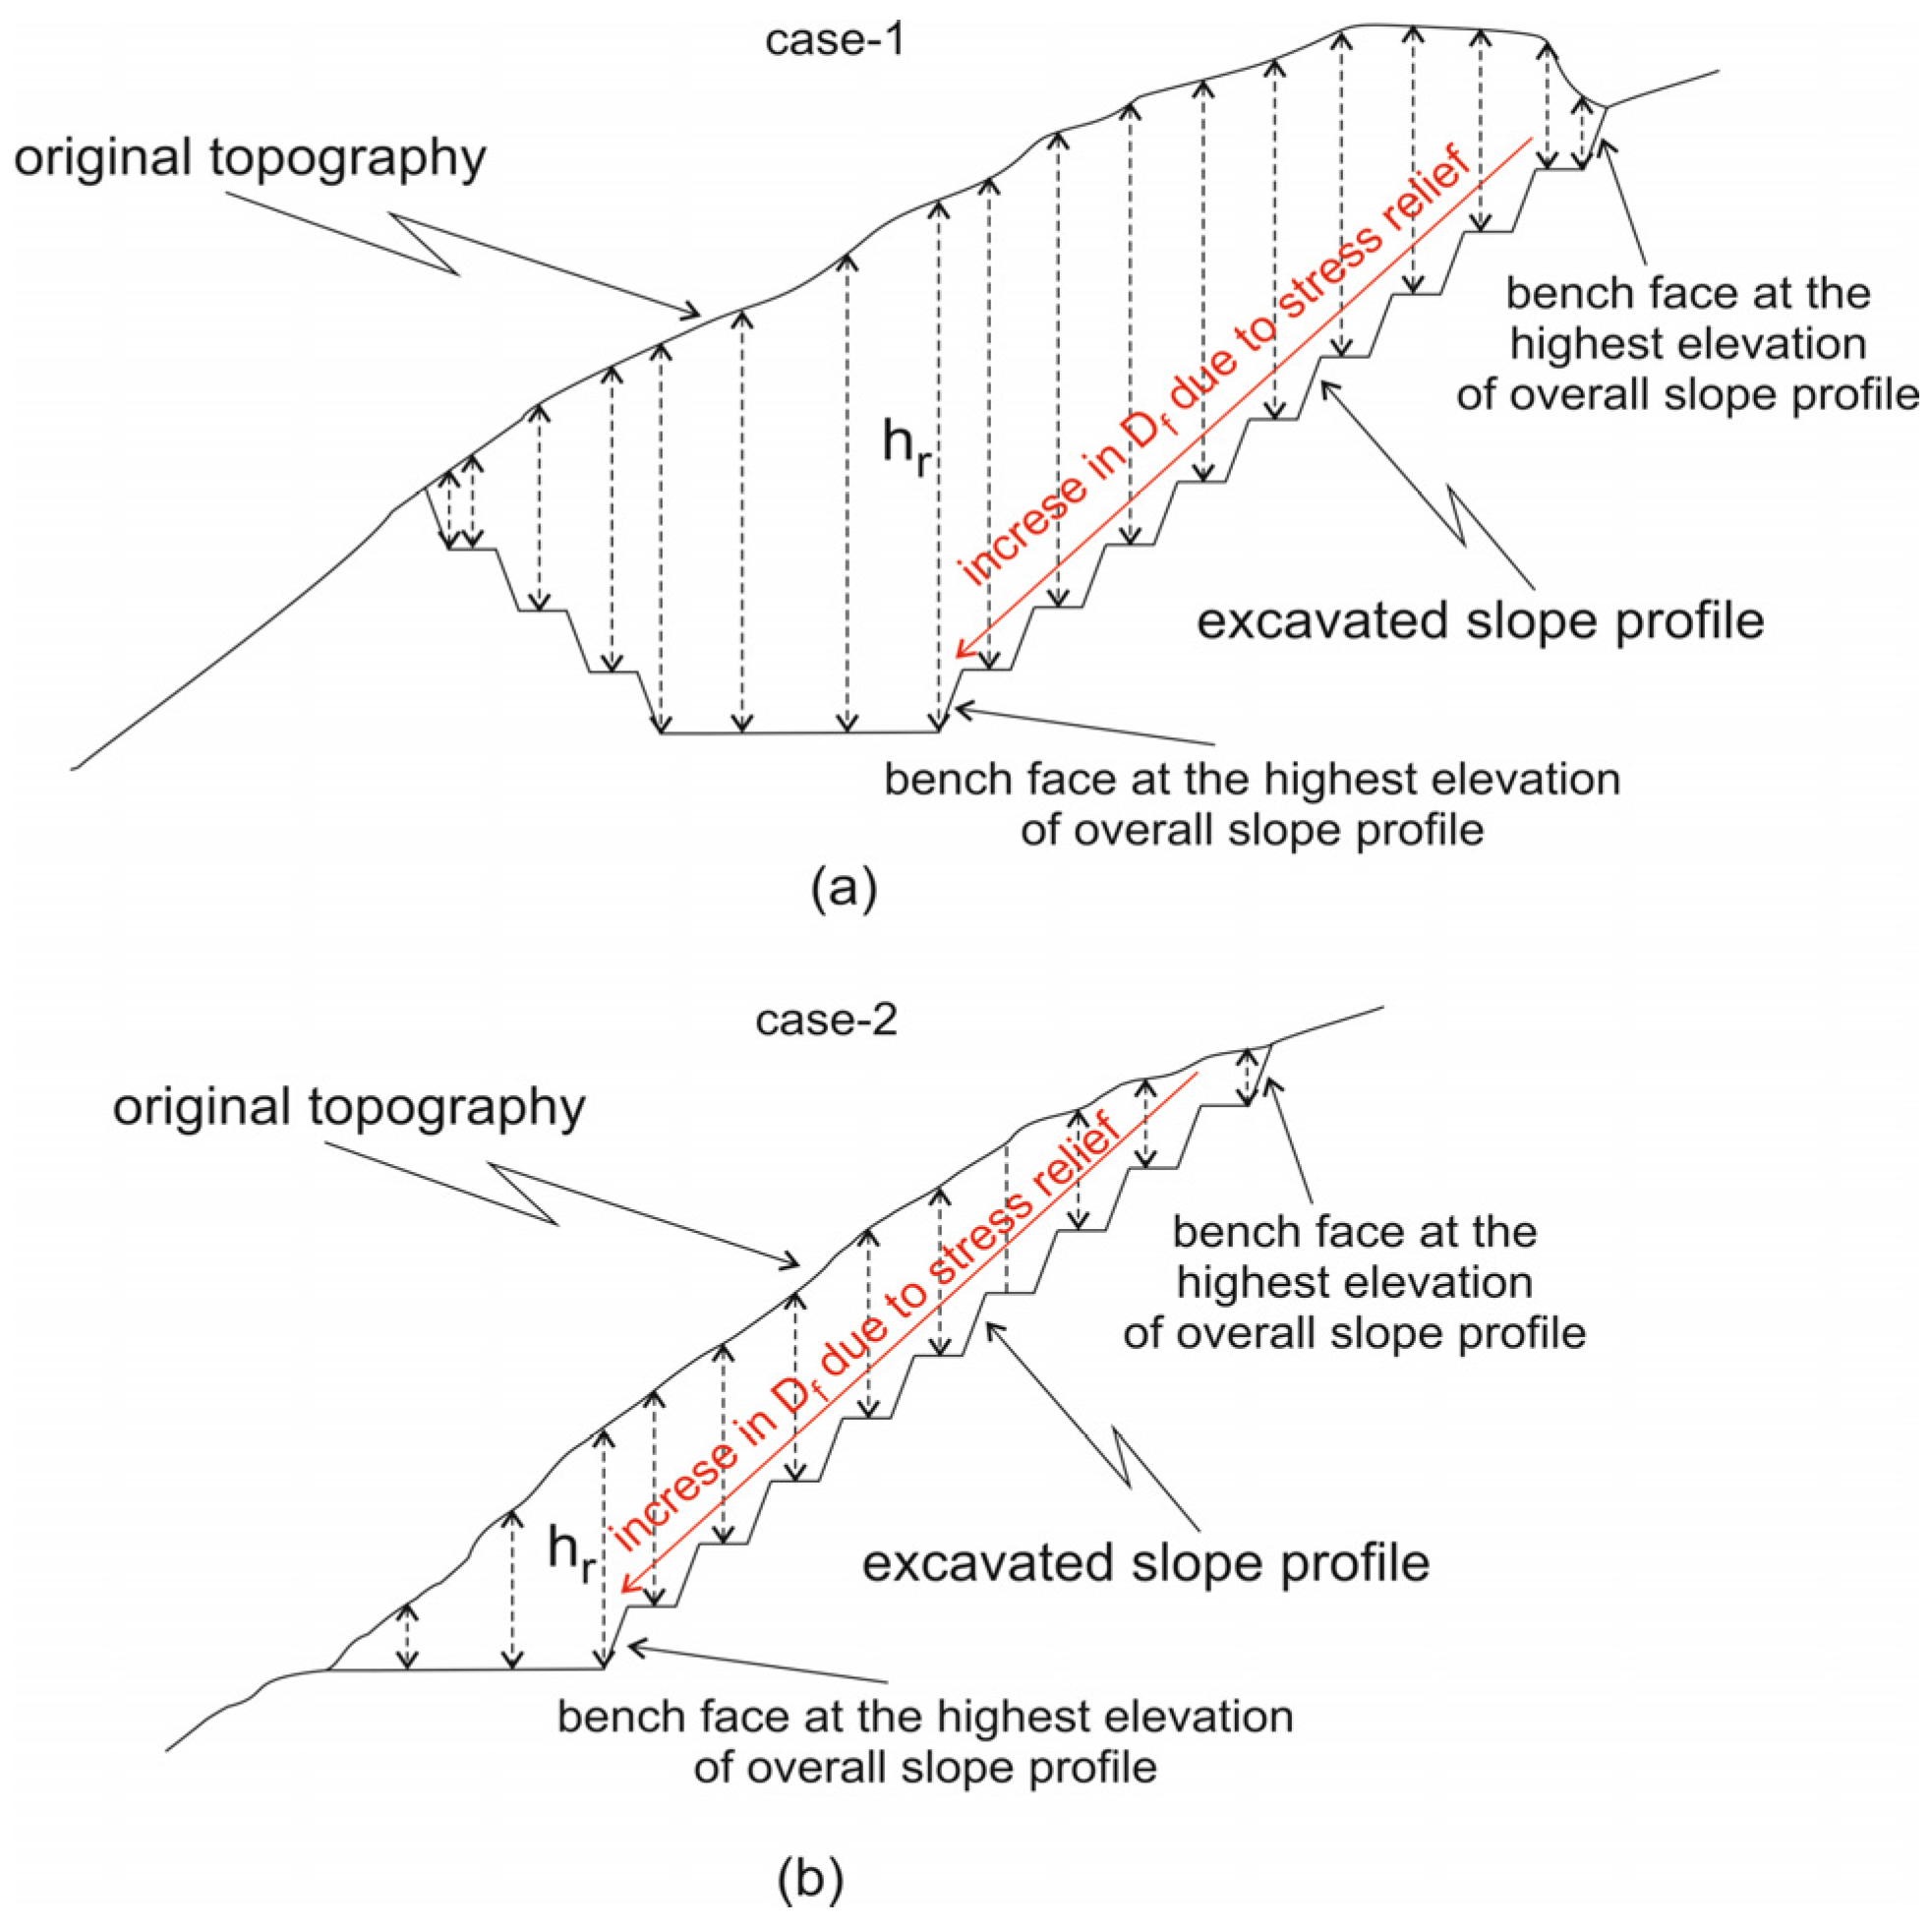
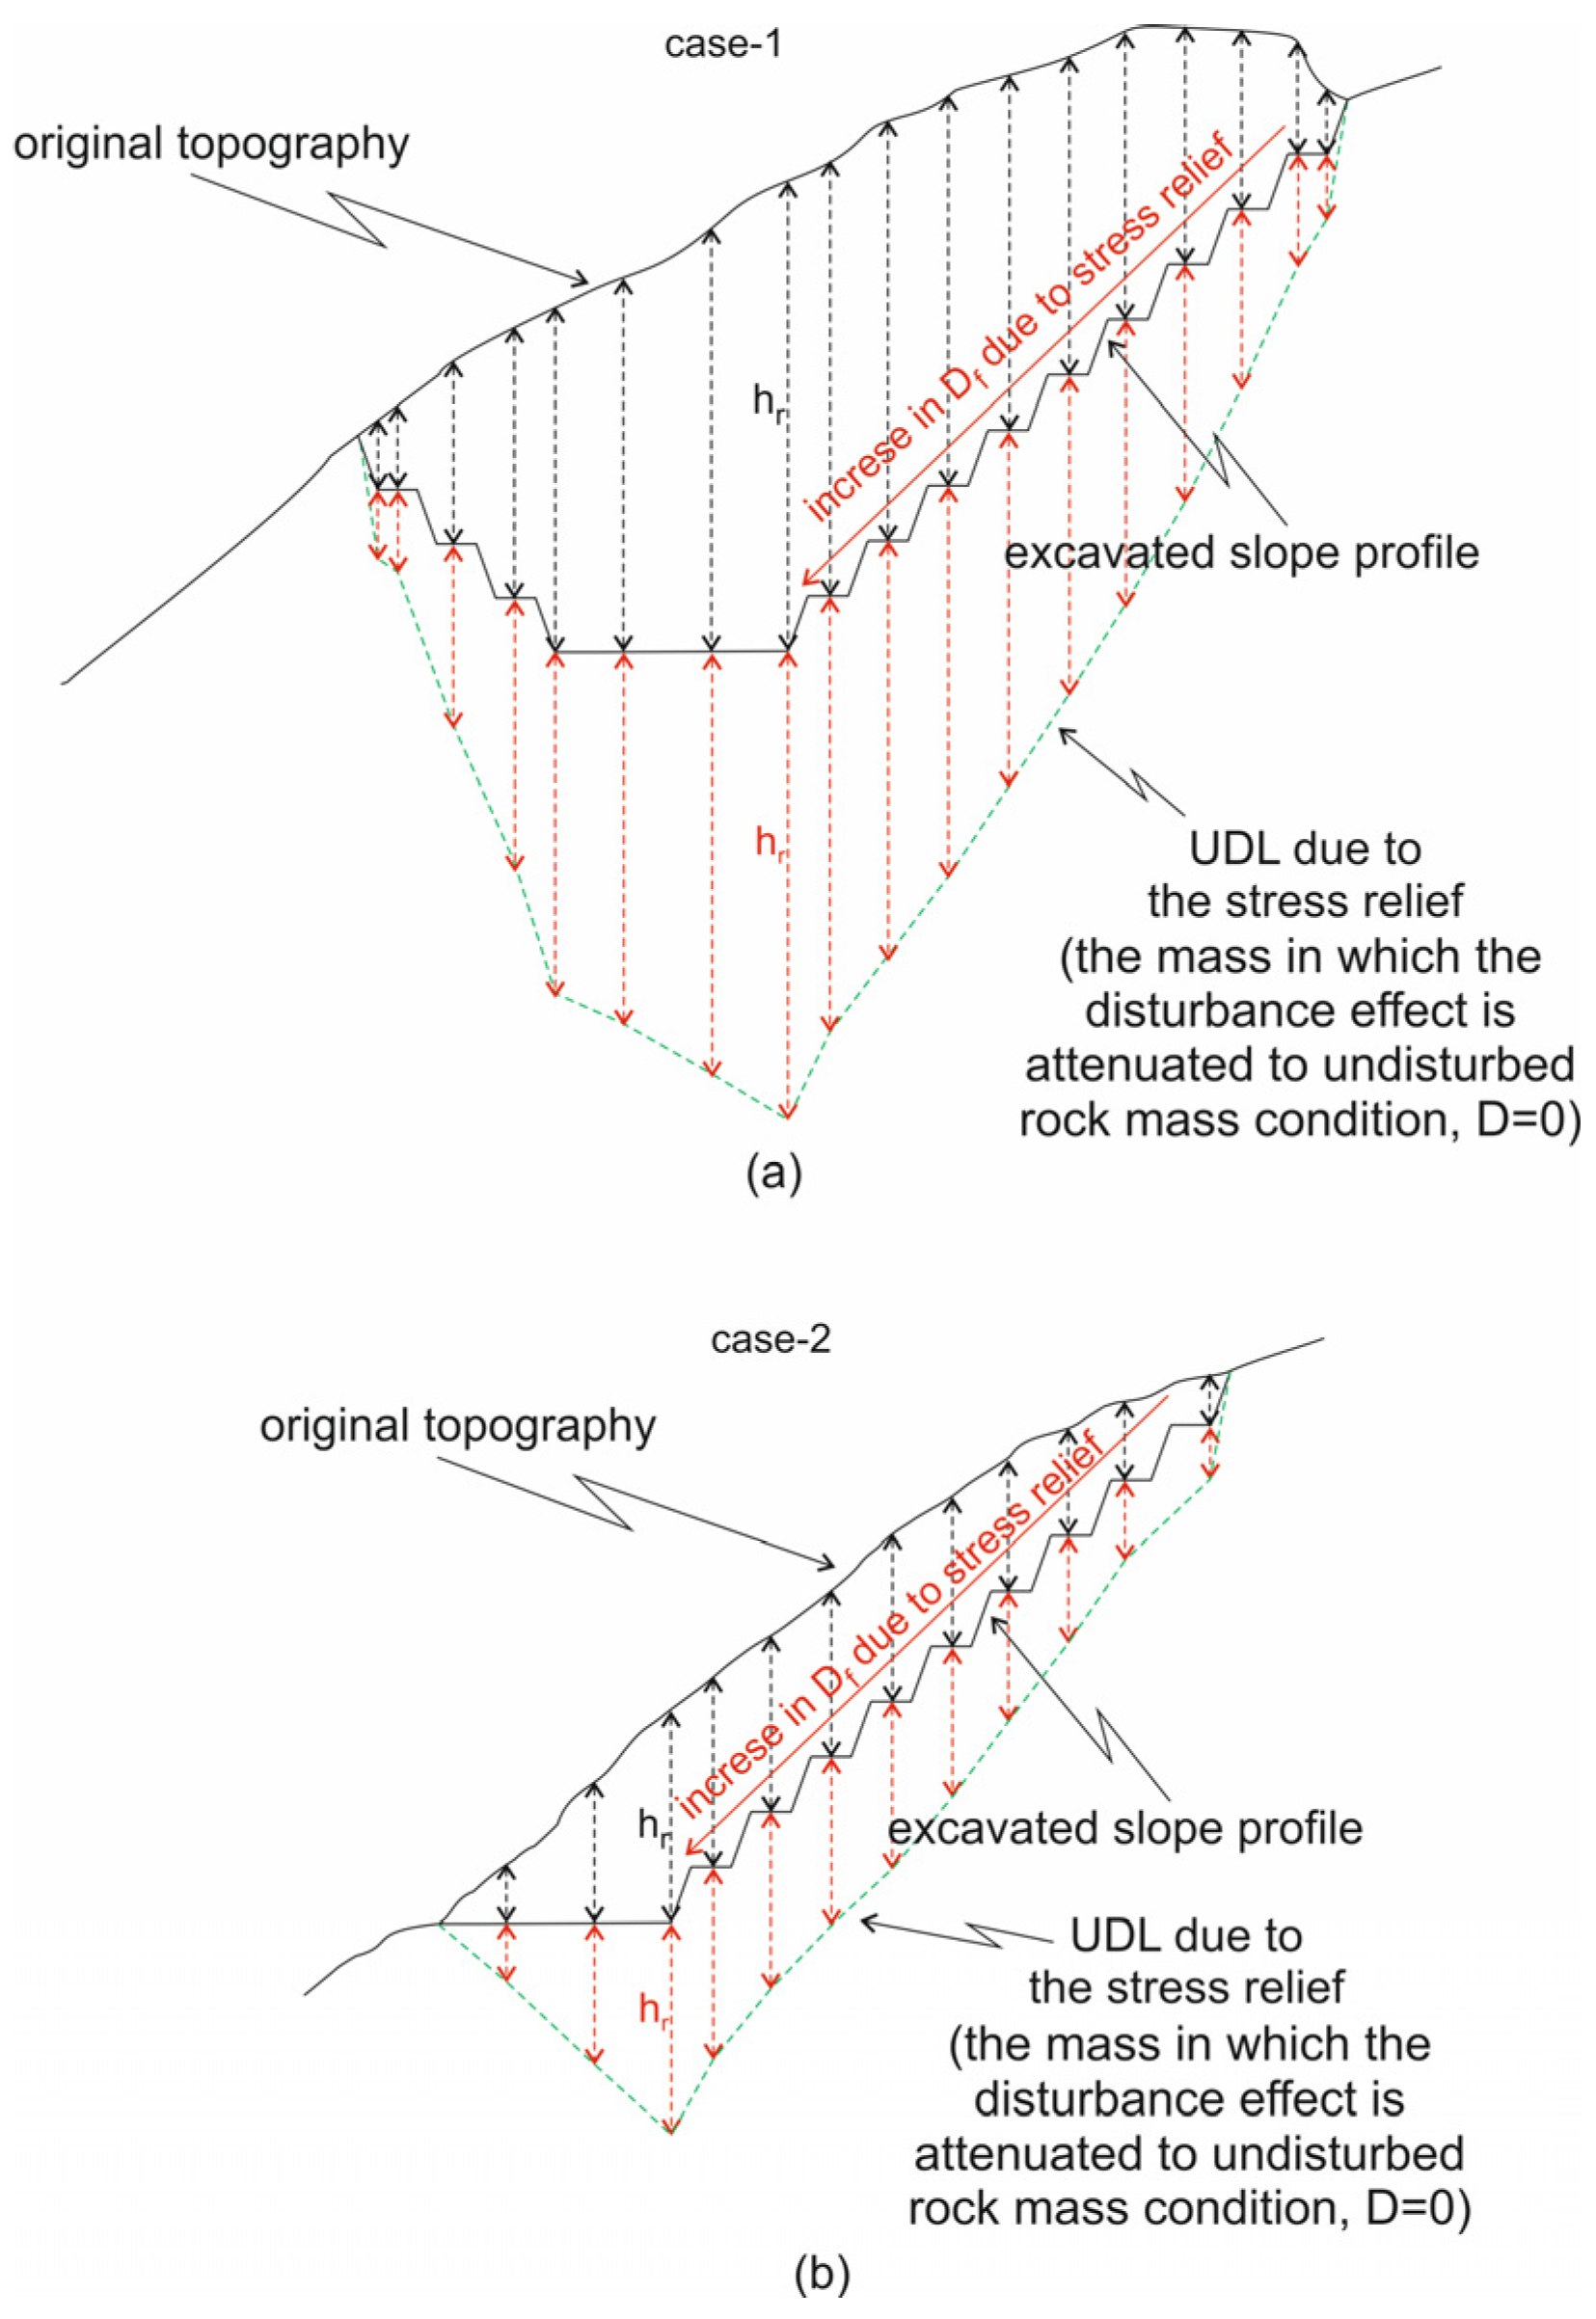
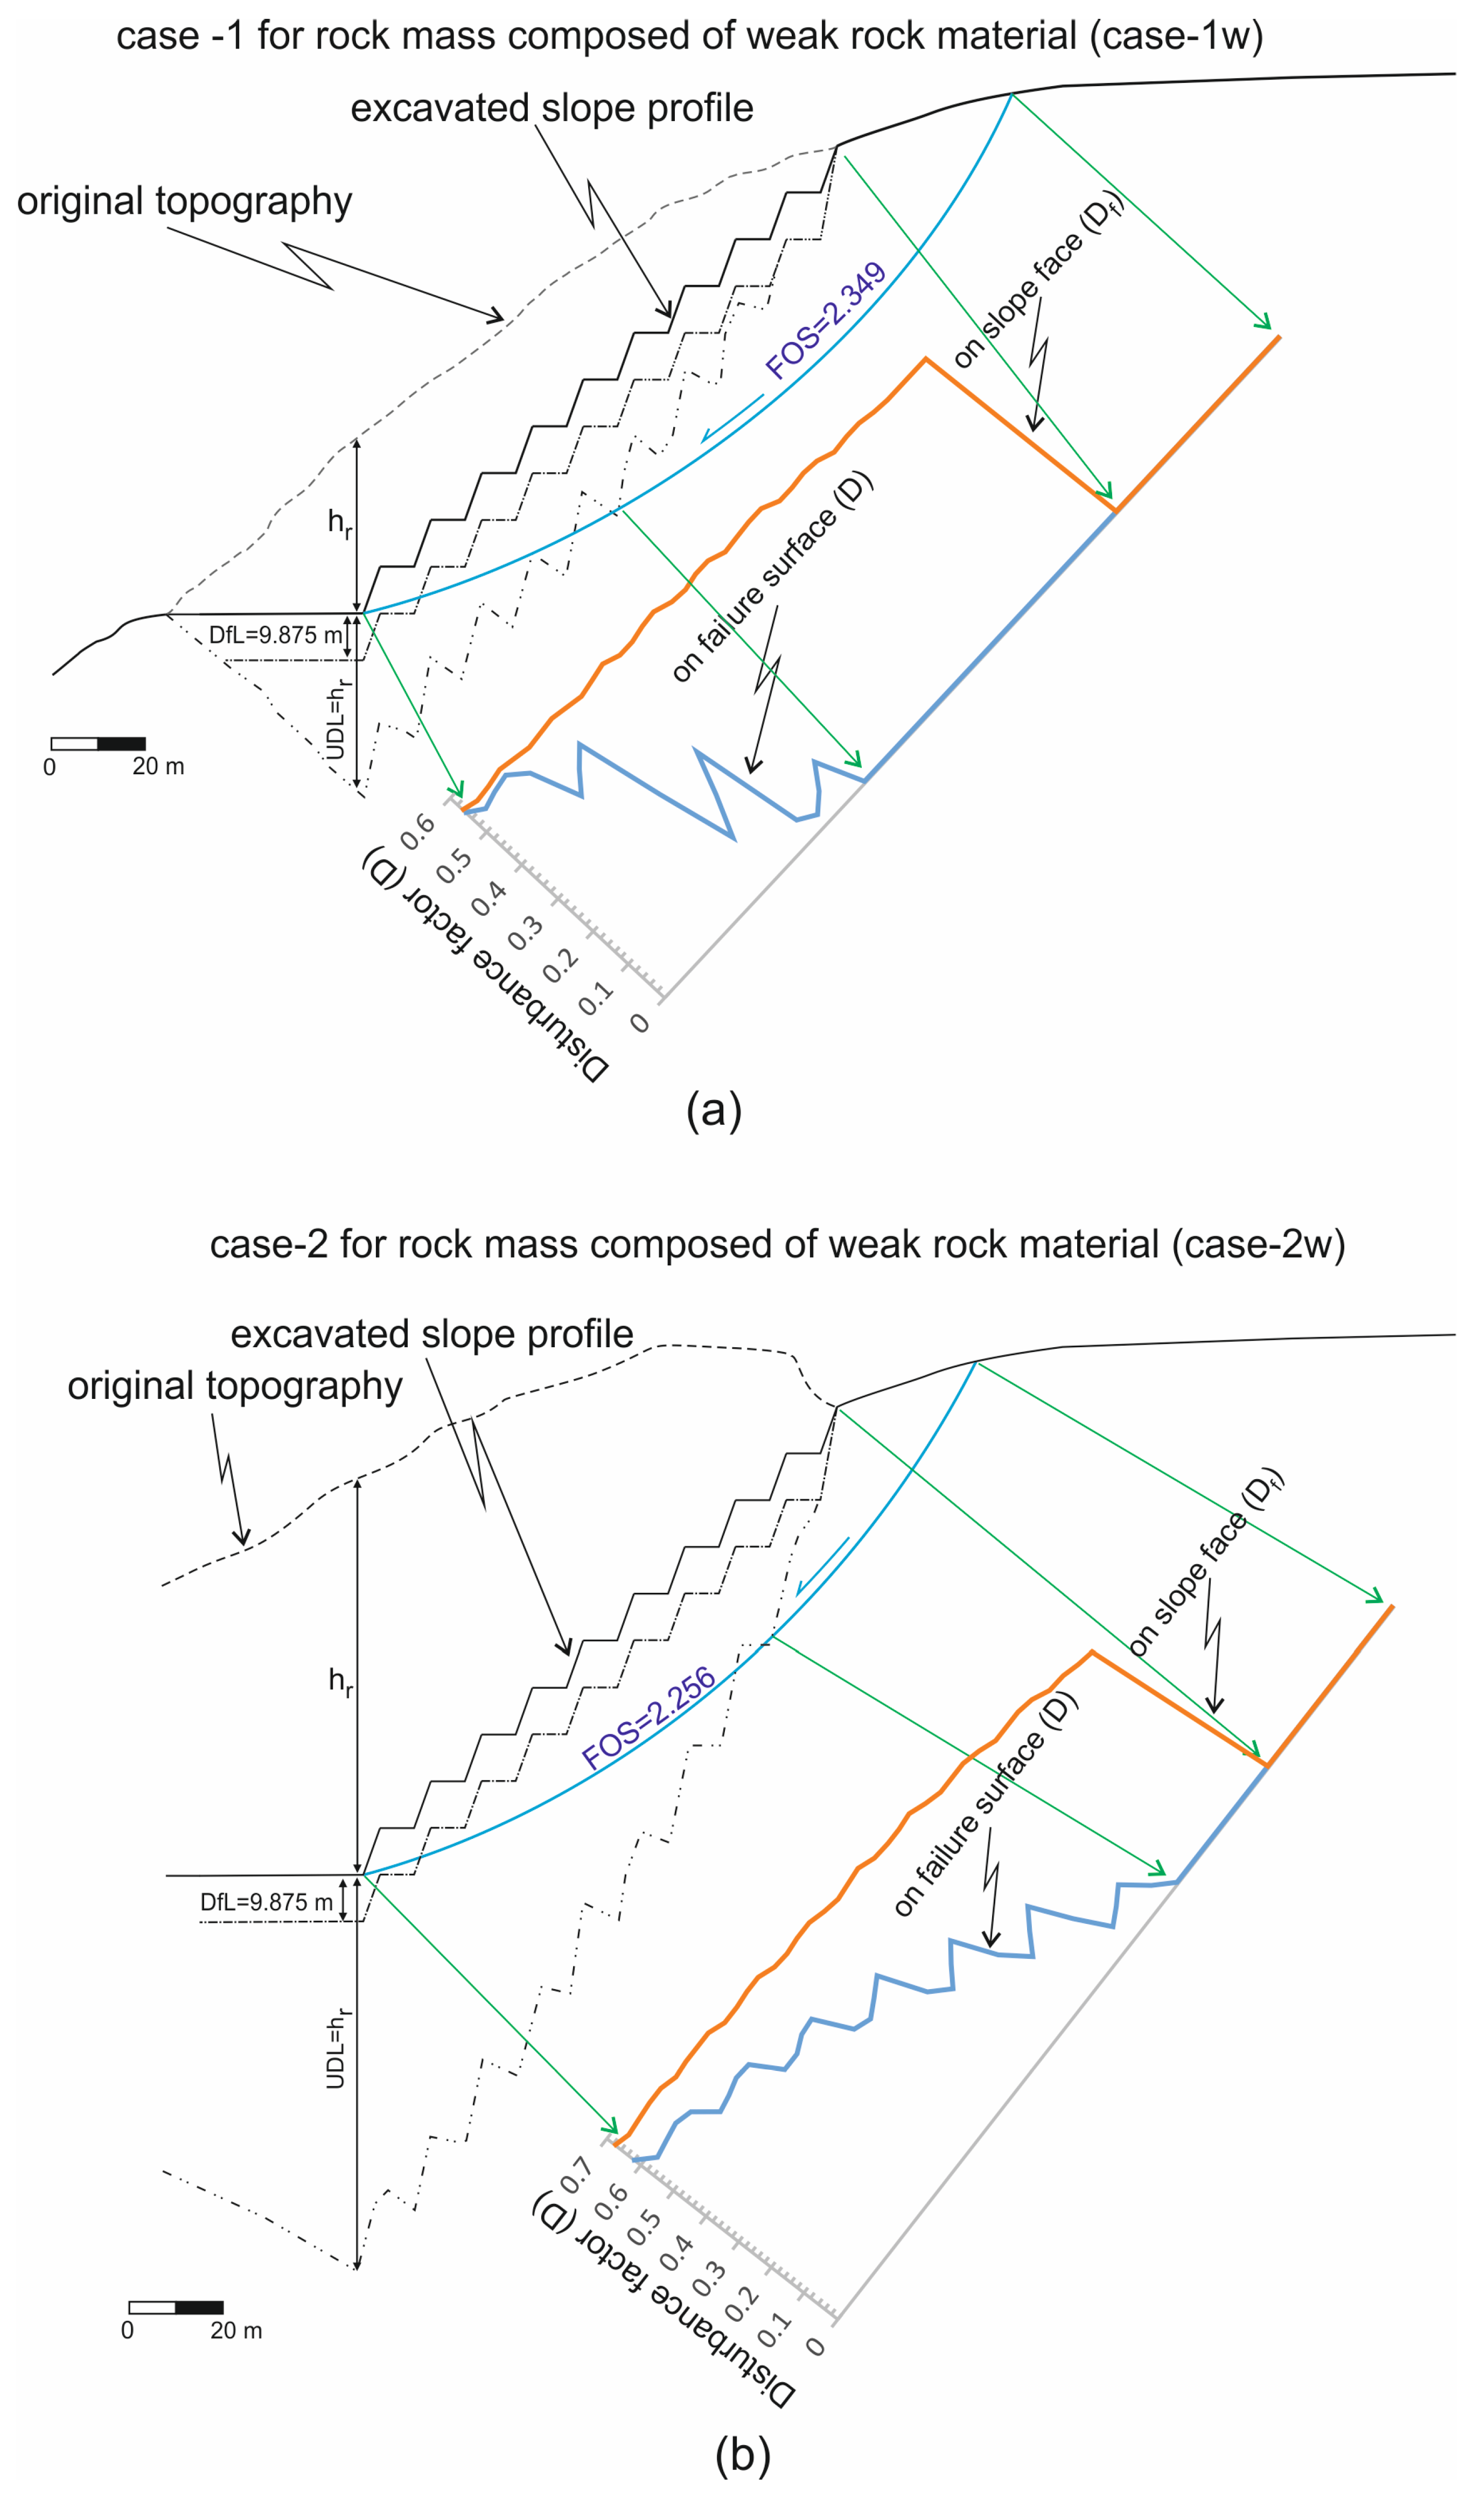
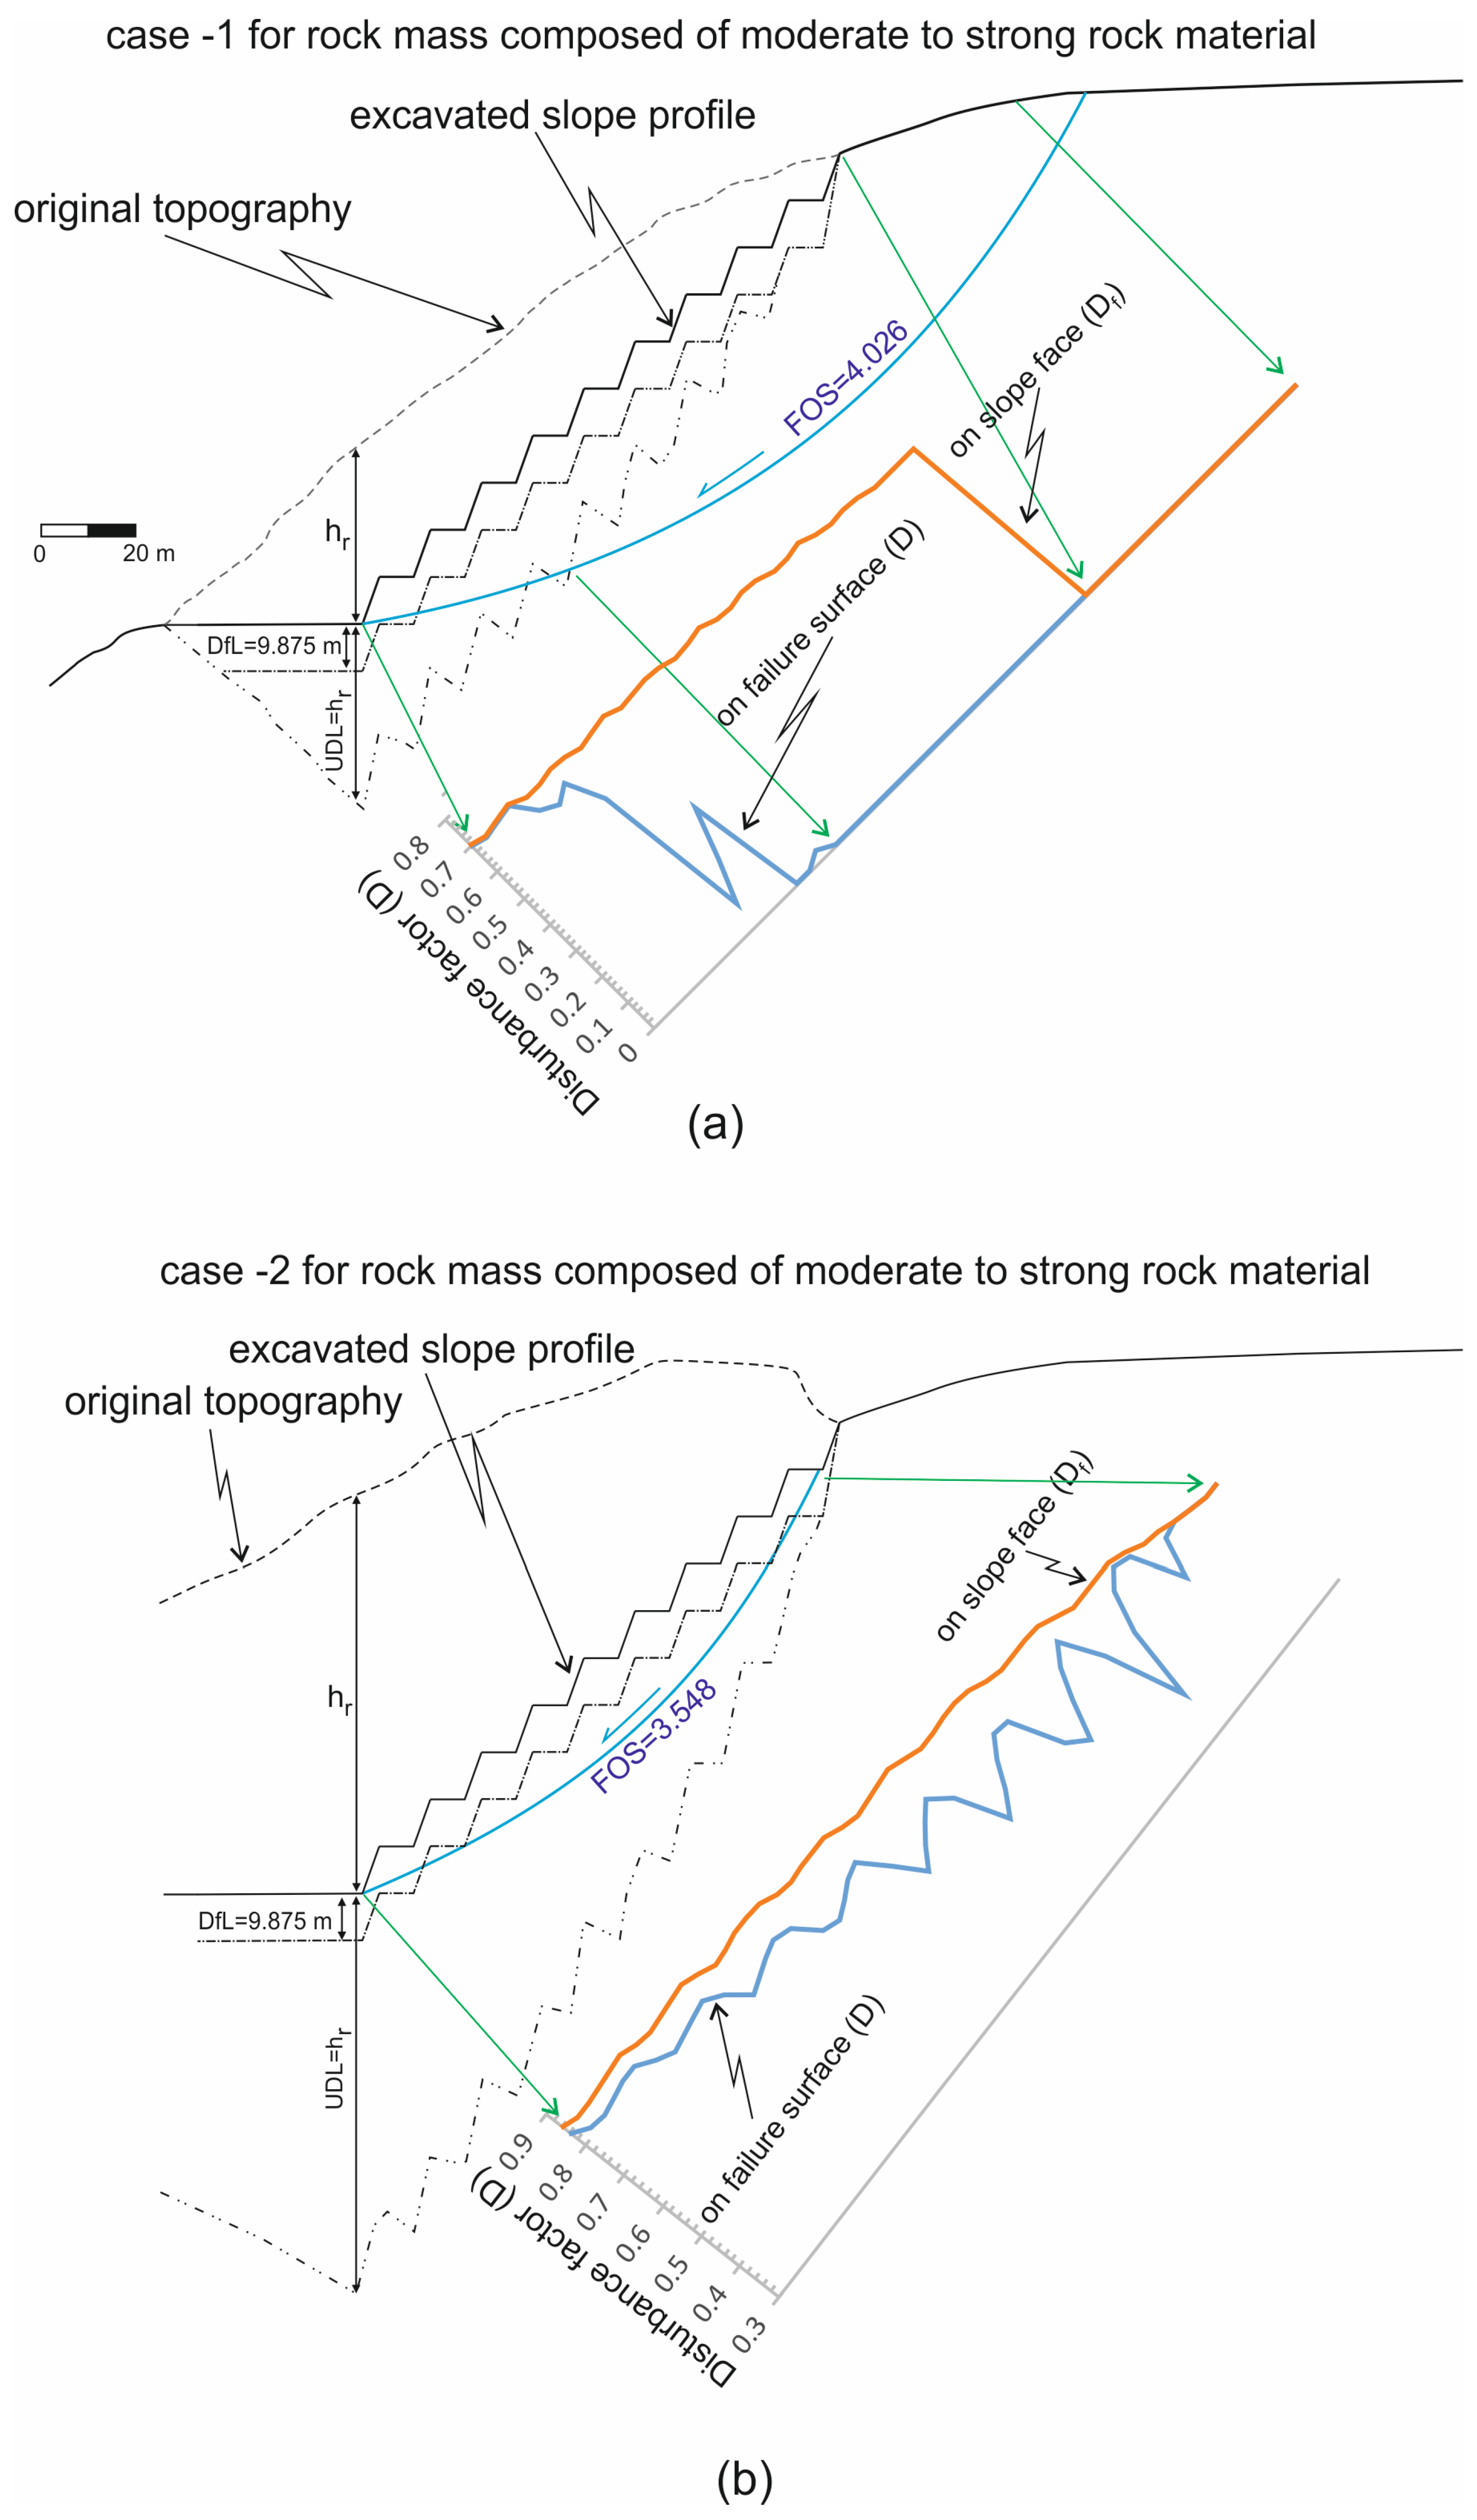
Two slope excavation cases presented in Figure 4 were compared to each other, considering the overburden thickness on multi-step deep excavation slopes with identical geometry, in order to better understand the disturbance of the rock mass due to stress relief from the overburden removal. Let us assume the same excavation method is used for both cases. As shown in Figure 4, the disturbance of the rock mass due to stress relief is expected to be nearly identical for the bench face at the highest elevation of the overall slope profile, as the thicknesses of the overburden removal in both cases are almost the same. However, the overburden removal thickness in case 1 is greater than in case 2, with an increase in excavation depth. Therefore, the disturbance of the rock mass due to stress relief is anticipated to be higher in case 1 than in case 2. In conclusion, it can be inferred that the safety factor for the overall stability of the right slope profile in case 1 is expected to be lower than in case 2, despite both cases having the same overall slope profile after excavation.

2.4. Rock Mass Disturbance of Deep Slope Excavation Due to the Stress Relief

As mentioned above, the second effect of rock mass disturbance in deep slope excavations is related to stress relief caused by the removal of the excavation cover. After selecting the disturbance factor on the excavated slope face using the EXCASS system, the transitional disturbance factor based on the relation proposed by Dagdelenler [16] was considered to reflect the change in disturbance from the depth of the excavation surface.
Hoek and Brown [6] recommend the use of a transitional disturbance relationship from the depth of the excavation surface, incorporating the effects of stress relaxation. For this purpose, Hoek and Brown [6] referred to the study performed by Rose et al. [17]. Following their recommendation, some recent studies on the transitional disturbance concept have been conducted [16,18]. Dagdelenler [
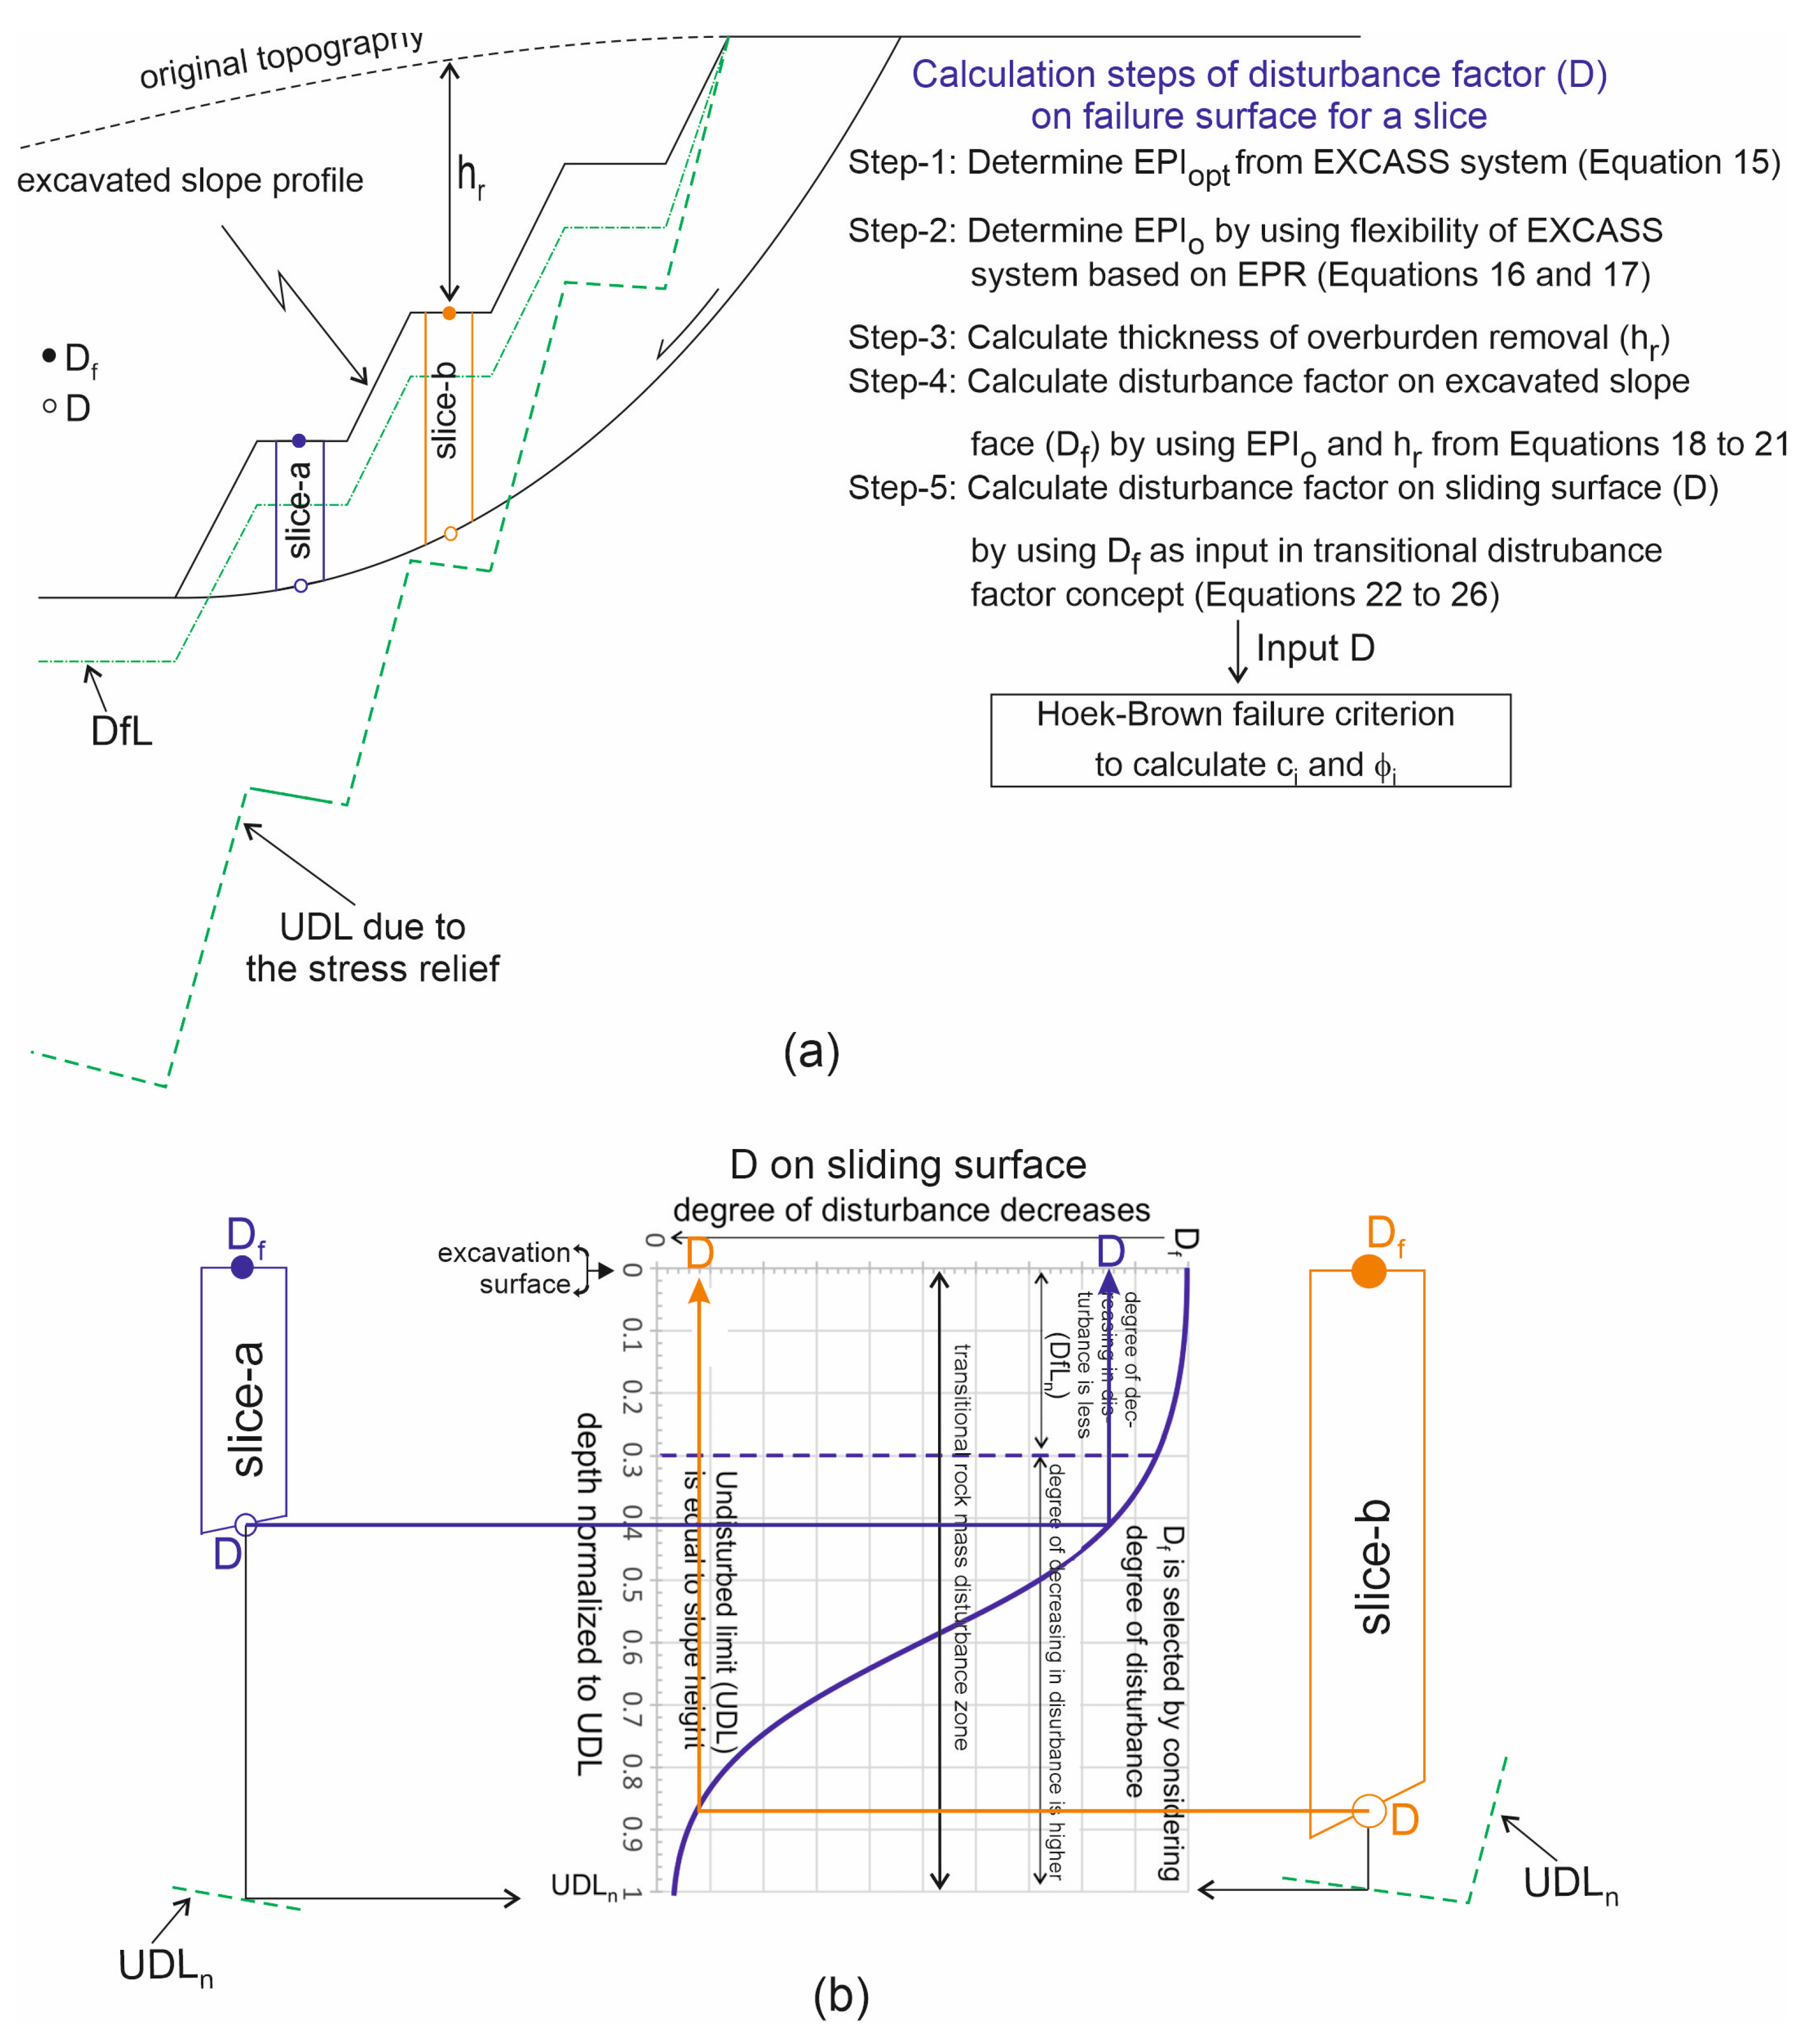
16] proposed an inverse “S”-shaped equation to define a continuous transitional disturbance relationship from the excavation surface to the undisturbed limit with depth. In the developed inverse “S”-shaped equation (Equations (22)–(24)) by Dagdelenler [16], the degree of decrease in the depth of the rock mass disturbance is slower until the depth of DfL; after this depth, the decreasing trend of the transitional rock mass disturbance follows an exponential trend (Figure 5).
D z n = D f 1 50 50 + k 100 100 z n / 15 100 z n 100 z n + 1
k = 1.8254 e 2.8249 D f L n
z n = z U D L
where Df is the maximum disturbance factor on the face of the excavation, DfLn is the DfL normalized to UDL (undisturbed limit), z is the depth from the excavation surface, zn is the normalized depth (z) to UDL, and the k value determined with DfL is related to the extremum point of the developed equation.
In the transitional disturbance equation introduced by Dagdelenler [16], DfL represents an extremum point between a region of lower disturbance reduction and a region with a more pronounced decrease (see Figure 5b). Up to the depth corresponding to DfL, the excavation method plays a dominant role in disturbance, whereas UDL is primarily influenced by stress reduction resulting from stress relief.
As highlighted by Sonmez et al. [19] and Dagdelenler [16], the blasted rock, which constitutes a completely disturbed rock mass accumulating in front of the blast-damaged zone, is readily excavated. To provide a framework for estimating the thickness of the disturbed zone (the blast-damaged rock, T), Hoek and Karzulovic [20] proposed the following methodology by considering bench height (Hbench).
i.
Large production blast, confined and with little or no control: T = 2 to 2.5 Hbench
ii.
Production blast with no control but blasting to a free face: T = 1 to 1.5 Hbench
iii.
Production blast, confined but with some control, e.g., one or more buffer rows: T = 1 to 1.2 Hbench
iv.
Production blast with some control, e.g., one or more buffer rows, and blasting to a free face: T = 0.5 to 1 Hbench
v.
Carefully controlled production blast with a free face: T = 0.3 to 0.5 Hbench
While the definitions proposed by Hoek and Karzulovic [20], based on their observations and experiences, were adopted in this study, practitioners have the flexibility to apply alternative approaches for the same objective. By replacing T with DfL, the definitions provided above were considered in formulating a basic relationship between DfL and EPIo. Two extreme data pairs, EPIo and the multiplier (G) of Hbench, namely (20, 0.3) and (100, 2.5), were used as initial assumptions to define the basic relation between G and EPIo (Equations (25) and (26)).
D f L = G x H b e n c h
G = 0.0275 E P I o 0.25
Dagdelenler [16] extends UDL downwards parallel to the slope profile equal to the height of the overall slope profile. Logically, it is not possible for UDL to extend as deep as equal to H, particularly where the excavation surface intersects the topography, hence its effect on the factor of safety (FOS) will be conservative. In this study, UDL was extended downwards equal to the thickness of the removed overburden at any point on the excavation face (Figure 5a and Figure 6). Therefore, as the depth of the excavation increases on the excavated slope profile, the UDL also increases, which seems logically more acceptable.

2.5. The Use of the Proposed Practical Quantitative Tool in the Slope Stability Calculation

The excavation of multi-benched slope profiles, with heights exceeding one hundred meters, is frequently carried out in highways, open pits, or dam abutments. A practical procedure is proposed for applying the disturbance factor of the rock mass from the depth of the excavation surface, considering the excavation methods, the thickness of the overburden removal above the excavation slope profile, and the depth of excavation from the slope profile. The calculation steps for a slice used in the slope analysis of the quantitative practical tool developed in this study, which enables continuous use of Hoek-Brown’s disturbance factor in the range of 0 to 1, are presented in Figure 7a. An illustration of the use of the transitional disturbance factor on a sliding surface (Step 5) for slice a and slice b is given in Figure 7b.

3. Application of the Proposed Practical Quantitative Tool to the Slope Excavation Case

3.1. Definition of the Slope Excavation Cases

In this part of the study, two rock mass descriptions were used in stability evaluations for a multi-benched slope excavation profile with high (case 1) and low (case 2) overburden removal, as presented in Figure 4 and Figure 6. To observe the effect of rock strength on the disturbance factor, stability analyses were performed for weak and strong rock masses. The values of Is50 were selected as 1 MPa and 4 MPa for the two rock masses, and the values of UCS were determined using Equation (27) proposed by Sonmez and Osman [21].
U C S = 3.3 m i 0.665 I s 50
The Hoek and Brown parameters of the two rock masses used in the stability analyses are summarized in Table 1. The values of EPIopt were obtained from Equation (15) as 45 and 64.6 for the weak and strong rock masses, respectively. EPR was considered equal to zero (ΔEPI = 0) due to the relatively easy excavation operation required for the weak rock mass. Therefore, EPIo was taken as 45 for the weak rock mass, considering ΔEPI = 0. On the other hand, for the excavation of rock masses composed of moderate to strong rock material, both hard and weak blasting may be needed. As a result, EPIo was calculated as 84.6 by considering EPR = +50 (ΔEPI = 20) for the moderate to strong rock mass. The values of DfL were determined by using the EPIo values for both weak and moderate to strong rock material and Hbench = 10 m as inputs in Equation (24). The calculated values of DfL were 9.875 m and 14.942 m for the weak and moderate to strong rock masses, respectively.
The stability of the cases was analyzed by considering potential failure circles that pass through only the toe of the excavated slope profile. While the simplified Bishop slice method was used in the circular type analyses, the overall strength of the rock masses was determined according to Hoek et al. [3]. To minimize the influences of the variables, while the slope profiles were assumed to be in drained conditions, no seismic event was taken into consideration.

3.2. Results of Stability Analyses of the Cases

The lowest factor of safety for the excavated slope profile under a higher overburden (case 1) was found to be lower than that of the same slope profile under shallow excavation (case 2), as logically expected from a mechanical perspective. Consistent with this, when considering rock masses composed of both weak and moderate to high-strength materials, the lowest safety factors for case 2 were higher than those for case 1 (Figure 8 and Figure 9). For the rock mass composed of medium to high-strength materials, the effect of the thickness of overburden removal was more pronounced. While the lowest factor of safety was determined to be FOS = 4.026 for case 1, it reduced to FOS = 3.548 for case 2 (Figure 9).

4. Discussion and Conclusions

This study addresses the long-standing challenge in the literature concerning the selection of the disturbance factor, a critical parameter in slope stability analyses, particularly as excavation depth increases. For over two decades, the disturbance factor, defined as a continuous value between 0 and 1, has largely been determined based on user experience since its introduction in the Hoek-Brown failure criterion. The definition proposed by Hoek and Brown [6] serves as the primary guideline, offering boundary values for disturbance factors for slopes and tunnels, rather than a continuous functional relationship. However, the use of the disturbance factor between the lower limits (D = 0.5 and D = 0.7 for small-scale and large-scale slopes, respectively) and the upper limit (D = 1) is completely left to the user’s discretion.
Two notable key studies by Feng et al. [7] and Xai et al. [8] aimed to overcome the subjectivity in applying this experience-based guide. However, the relations derived by Feng et al. [7] and Xai et al. [8] are based on empirical equations that incorporate other empirical relationships. Due to the nature of such equations, there is a potential for errors from each component to compound in the final derived D relationship. While these two studies provide a continuous variation for the disturbance factor between 0 and 1, both rely on wave velocity measurements (Vp and Cp), which must be taken before and after the disturbance. In other words, in a disturbed rock mass condition, measuring both wave velocities with depth is only possible once the slope excavation has reached that depth of the excavation stage. In addition, the compatibility of this relation with the lower limit values of D = 0.5 and D = 0.7 for small and large-scale slopes, respectively, as suggested by the developers of the Hoek-Brown failure criterion for slope excavations, is also open to discussion. However, the two mentioned seismic-based studies have the potential to be considered in field verification and potential improvement efforts of the practical quantitative tool proposed in this study.
Rock mass disturbance due to the excavation operations in a slope mainly occurs due to two effects. The first is the generation of new fractures and the widening of discontinuity apertures in the rock mass close to the excavated slope face. The second is stress relief caused by the removal of the overburden, especially in deep slope excavations, which results in a transitional disturbance within the rock mass.
The first effect is mainly related to the excavation method, such as diggers, rippers, hammers, and blasting. Therefore, the first effect, which can be observed on the excavated slope surface, can be quantified using the EXCASS system developed by Dagdelenler et al. [9], which aids in the selection of appropriate excavation methods. Based on this concept, the EXCASS system has been incorporated into Hoek and Brown’s [6] qualitative guideline for determining the disturbance factor of an excavated slope face. Moreover, the compatibility of this relationship with the lower limit values of D = 0.5 and D = 0.7 for small and large-scale slopes, respectively, is satisfied.
It is very important in successful engineering designs such as slopes, tunnels, and dam construction to minimize disturbance to the rock mass during the excavation process. However, a stronger excavation method, which may increase the degree of rock mass disturbance, might be preferred to reduce the completion time for deep slope excavations. Conversely, in critical slope excavations, a weaker excavation method may be chosen to minimize rock mass disturbance. For this purpose, ΔEPI, which is determined as positive (stronger) or negative (weaker) depending on the EPR, provides flexibility to the proposed tool. It allows the user to determine the level of disturbance based on the user’s experience, while also considering the importance of the degree of excavation. However, the negative values of EPR should be used with caution because it will decrease in Df compared with the optimal excavation method. Negative values of EPR may be more important in excavations conducted by blasting. Therefore, negative values of EPR are not recommended for slope excavations in weak rock masses where blasting is not required. For this purpose, the early stages of the slope excavation can be a guide for the expert decision.
The second effect on rock mass disturbance related to stress relief is the transitional reduction of the degree of rock mass disturbance from the depth of the excavation surface. For the calculation of the transitional disturbance factor, the relationship proposed by Dagdelenler [16] was preferred.
The proposed practical tool offers a more systematic and accurate approach for quantifying rock mass disturbance during slope excavation, providing a clearer and more reliable methodology compared to previous practices. However, as with all new empirical based tools, the practical quantitative tool for determining the disturbance factor is open to improvement by new slope excavation cases.

Author Contributions

Conceptualization, G.D.; methodology, G.D. and H.S.; software, H.S. and G.D.; validation, G.D. and H.S.; formal analysis, H.S.; investigation, G.D.; resources, H.S.; data curation, G.D. and H.S.; writing—original draft preparation, G.D. and H.S.; writing—review and editing, G.D.; visualization, H.S. All authors have read and agreed to the published version of the manuscript.

Funding

This research received no external funding.

Institutional Review Board Statement

Not applicable.

Informed Consent Statement

Not applicable.

Data Availability Statement

The data presented in this study are available on request from the corresponding author.

Acknowledgments

We would like to thank the anonymous reviewers for their valuable contributions to the manuscript during the review process.

Conflicts of Interest

The authors declare no conflicts of interest.

References

  1. Hoek, E.; Wood, D.; Shah, S.A. Modified Hoek-Brown criterion for jointed rock masses. In Proc. Rock Characterization, Symp. International Society of Rock Mechanic Eurock; Hudson, J.A., Ed.; Thomas Telford Publishing: London, UK, 1992; pp. 209–214. [Google Scholar]
  2. Hoek, E.; Kaiser, P.K.; Bawden, W.F. Support of Underground Excavation in Hard Rock; Balkema: Rotterdam, The Netherlands, 1995. [Google Scholar]
  3. Hoek, E.; Carranza-Torres, C.T.; Corkum, B. Hoek-Brown Failure Criterion—2002 Edition. In Proceedings of the 5th North American Rock Mechanics Symposium, Toronto, ON, Canada, 7–10 July 2002; pp. 267–273. [Google Scholar]
  4. Hoek, E.; Brown, E.T. The Hoek-Brown Failure Criterion a 1988 Update. In Proceedings of the 15th Canadian Rock Mechanics Symposium, Toronto, ON, Canada, 3–4 October 1988; pp. 31–38. [Google Scholar]
  5. Sonmez, H.; Ulusay, R. Modifications to the geological strength index (GSI) and their applicability to stability of slopes. Int. J. Rock Mech. Min. Sci. 1999, 36, 743–760. [Google Scholar] [CrossRef]
  6. Hoek, E.; Brown, E.T. The Hoek-Brown Failure Criterion and GSI—2018 Edition. J. Rock Mech. Geotech. Eng. 2019, 11, 445–463. [Google Scholar] [CrossRef]
  7. Feng, W.; Dong, S.; Wang, Q.; Yi, X.; Liu, Z.; Bai, H. Improving the Hoek–Brown criterion based on the disturbance factor and geological strength index quantification. Int. J. Rock Mech. Min. Sci. 2018, 108, 96–104. [Google Scholar] [CrossRef]
  8. Xia, K.; Chen, C.; Wang, T.; Zheng, Y.; Wang, Y. Estimating the geological strength index and disturbance factor in the Hoek–Brown criterion using the acoustic wave velocity in the rock mass. Eng. Geol. 2022, 306, 106745. [Google Scholar] [CrossRef]
  9. Dagdelenler, G.; Sonmez, H.; Saroglou, C. A flexible system for selection of rock mass excavation method. Bull. Eng. Geol. Environ. 2020, 79, 5355–5369. [Google Scholar] [CrossRef]
  10. Read, S.A.L.; Richards, L.R.; Perrin, N.D. Applicability of the Hoek-Brown Failure Criterion to New Zealand Greywacke Rocks. In Proceedings of the 9th International Congress on Rock Mechanics, Paris, France, 25–28 August 1999; pp. 655–660. [Google Scholar]
  11. José, M.; Galera, M.; Alvarez, Z.; Bieniawski, T. Evaluation of the deformation modulus of rock masses: Comparison of pressuremeter and dilatometer tests with RMR prediction. In Proceedings of the ISP5-PRESSIO 2005 International Symposium; Organization: Geocontrol, S.A.-UPM, Madrid, Spain, 22–24 August 2005. [Google Scholar]
  12. Hoek, E.; Bray, J.W. Rock Slope Engineering. In Institute of Mining and Metallurgy, 3rd ed.; Stephen Austin and Sons: London, UK, 1981. [Google Scholar]
  13. Bieniawski, Z.T. Engineering Rock Mass Classification; Wiley: New York, NY, USA, 1989; p. 215. [Google Scholar]
  14. Hammah, R.E.; Yacoub, T.E.; Corkum, B.C.; Curran, J.H. The Shear Strength Reduction Method for the Generalized Hoek-Brown Criterion. Proceedings of 40th U.S. Symposium on Rock Mechanics (ARMA/USRMS 05-810), Anchorage, Alaska, 25–29 June 2005; Curran Associates, Inc.: Anchorage, Alaska, 2005. [Google Scholar]
  15. Singh, B.; Goel, R.K. Engineering Rock Mass Classification; Elsevier Inc. Publication: Amsterdam, The Netherlands, 2011; 364p. [Google Scholar]
  16. Dagdelenler, G. Impact of Rock Mass Strength Anisotropy with Depth on Slope Stability Under Excavation Disturbance. Appl. Sci. 2025, 15, 164. [Google Scholar] [CrossRef]
  17. Rose, N.D.; Scholz, M.; Burden, J.; King, M.; Maggs, C.; Havaej, M. Quantifying transitional rock mass disturbance in open pit slopes related to mining excavation. In Proceedings of the 14th International Congress on Energy and Mineral Resources, Seville, Spain, 10–13 April 2018; pp. 1273–1288. [Google Scholar]
  18. Park, D.; Michalowski, R.L. Impact of spatially varying rock disturbance on rock slope stability. J. Rock Mech. Geotech. Eng. 2024, 16, 3907–3923. [Google Scholar] [CrossRef]
  19. Sonmez, H.; Dagdelenler, G.; Ozcelik, Y.; Ercanoglu, M. A complementary approach to quantify the basic GSI chart considering scale effect on rock structure. J. Rock Mech. Geotech. Eng. 2025, 17, 154–167. [Google Scholar] [CrossRef]
  20. Hoek, E.; Karzulovic, A. Rock Mass Properties for Surface Mines. In Slope Stability in Surface Mining; Hustralid, W.A., McCarter, M.K., van Zyl, D.J.A., Eds.; Society for Mining, Metallurgical and Exploration (SME): Littleton, CO, USA, 2000. [Google Scholar]
  21. Sonmez, H.; Osman, B. The Limitations of Point Load Index for Predicting of Strength of Rock Material and a New. In Proceedings of the 61st Geological Congress of Turkey, Ankara, Turkey, 24–28 March 2008. [Google Scholar]
Figure 1. Excavation assessment (EXCASS) system chart developed by Dagdelenler et al. [9].
Applsci 15 06714 g001
Figure 3. Developed procedure for determining Df related to excavation damage and stress relief from overburden removal using EPIo.
Applsci 15 06714 g003
Figure 4. Schematic illustration of (a) case 1 and (b) case 2 to explain the different degrees of increase in Df due to the difference in overburden removal thickness, even though the excavation slope profiles are the same.
Applsci 15 06714 g004
Figure 5. In the transitional rock mass disturbance equation proposed by Dagdelenler [16]: (a) schematic representation of input parameters, (b) representative graphical presentation using normalized depth by dividing UDL (adapted from Dagdelenler [16]).
Applsci 15 06714 g005
Figure 6. Schematic illustration of transitional disturbance factor with depth by considering for a multi-benched slope excavation profile of (a) high (case 1) and (b) less (case 2) overburden removal.
Applsci 15 06714 g006
Figure 7. (a) Calculation steps for a slice in slope analysis using the quantitative practical tool developed in this study, (b) Illustration of the use of transitional disturbance factor on sliding surface (Step-5) for slice-a and slice-b.
Applsci 15 06714 g007
Figure 8. The lowest factor of safety (FOS) of (a) case 1 and (b) case 2 for a rock mass composed of weak rock materials, specifically emphasizing the effect of overburden removal, and graphical presentation for the change of disturbance factor on both the failure surface and on the slope face.
Applsci 15 06714 g008
Figure 9. The lowest factor of safety (FOS) of (a) case 1 and (b) case 2 for a rock mass composed of moderate to strong rock materials, specifically emphasizing the effect of overburden removal, and graphical presentation for the change of disturbance factor on both the failure surface and on the slope face.
Applsci 15 06714 g009
Table 1. The geomechanical properties of two rock masses used in stability analyses.
Rock MassIs50 (MPa)* UCS (MPa)GSI** miγ (kN/m3)
RM-1
Weak strength rock material
115.3501025
RM-2:
Moderate to strong strength rock material
461.0501025
*: determined by using Equation (27). **: selected from Hoek’s recommendations based on type of rock material.
Disclaimer/Publisher’s Note: The statements, opinions and data contained in all publications are solely those of the individual author(s) and contributor(s) and not of MDPI and/or the editor(s). MDPI and/or the editor(s) disclaim responsibility for any injury to people or property resulting from any ideas, methods, instructions or products referred to in the content.

