Abstract
Background: Optical coherence tomography (OCT) is limited by inherent speckle noise, degrading retinal microarchitecture visualization and pathological analysis. Existing denoising methods inadequately balance noise suppression and structural preservation, necessitating advanced solutions for clinical OCT reconstruction. Methods: We propose MFFA-GAN, a generative adversarial network integrating multilevel feature fusion and an efficient local attention (ELA) mechanism. It optimizes cross-feature interactions and channel-wise information flow. Evaluations on three public OCT datasets compared traditional methods and deep learning models using PSNR, SSIM, CNR, and ENL metrics. Results: MFFA-GAN achieved good performance (PSNR:30.107 dB, SSIM:0.727, CNR:3.927, ENL:529.161) on smaller datasets, outperforming benchmarks and further enhanced interpretability through pixel error maps. It preserved retinal layers and textures while suppressing noise. Ablation studies confirmed the synergy of multilevel features and ELA, improving PSNR by 1.8 dB and SSIM by 0.12 versus baselines. Conclusions: MFFA-GAN offers a reliable OCT denoising solution by harmonizing noise reduction and structural fidelity. Its hybrid attention mechanism enhances clinical image quality, aiding retinal analysis and diagnosis.
1. Introduction
Optical coherence tomography (OCT) is a non-invasive, high-resolution imaging technology [1] that provides real-time imaging without using radiation. It has demonstrated significant potential in various medical fields, including tumor detection, cardiovascular disease, and ophthalmology [2], and has become an indispensable tool for both clinical diagnosis and scientific research. The technology operates based on the principle of low-coherence interference, generating micron-level cross-sectional images that allow for the precise capture of microstructural alterations in ocular tissues. However, the scattering effect of light in biological tissues, particularly when reflected from rough surfaces or internal inhomogeneous media, produces randomly distributed interference patterns, known as speckle noise. This noise inevitably superimposes on OCT images, leading to the blurring of fine structures and key details of the retina [3]. This presents a significant challenge for the clinical observation and accurate diagnosis of retinal lesions. Therefore, ensuring the generation of high-quality image outputs is critical for OCT applications to accurately identify and assess subtle lesion areas.
The current approaches for processing speckle noise in OCT images primarily includes hardware-based and software-based methods. Hardware-based denoising methods encompass multi-fiber design [4], multi-frequency synthesis [5], multi-channel optical range difference synthesis [6], and polarization diversity detection [7], etc. However, these methods often require complex design and manufacturing processes, which block their widespread adoption in clinical applications. Software-based denoising methods primarily include traditional denoising methods and deep learning methods. Traditional denoising methods encompass methods such as generalized Bayes [8], non-local mean denoising [9], and 3D block matching [10]. Compared to hardware-based methods, traditional software denoising methods offer the advantage of adaptability to various OCT systems and imaging requirements through targeted algorithm optimization. However, their effectiveness is often limited by their ability to retain image details. As a result, the denoised images exhibit suboptimal quality, with significant structural information being lost, which hampers the achievement of high-quality OCT images required for clinical applications.
In recent years, deep learning-based methods, particularly convolutional neural networks (CNNs) [11], have exhibited excellent performance in medical image denoising, offering novel and effective solutions for generating high-quality, efficient images. Deep learning-based methods are broadly categorized into unsupervised, semi-supervised, and supervised modes [12], depending on the extent of labeling in the training data. For instance, Gisbert et al. applied the N2N strategy to retinal OCT image denoising, which requires only noisy datasets, using U-Net as the denoising network to achieve significant noise reduction [13]. Huang et al. employed a super-resolution architecture based on residual networks combined with the N2N strategy to enable real-time noise reduction in OCT images across multiple samples [14]. Wu et al. proposed denoising diffusion probabilistic models (DDPMs), which realized the automatic generation of photorealistic OCT images of the retina by inputting an initial retinal layer [15]. Li et al. proposed a one-step enhancer (OSE) for simultaneous OCT denoising and deblurring via unsupervised learning [16]. However, unsupervised methods face limitations in improving performance metrics such as PSNR and SSIM, especially in handling complex noises or preserving fine structures, and they often perform worse than supervised methods.
To generate superior-quality retinal OCT images, Zhang et al. proposed a method that constructs a feed-forward denoising convolutional neural network (DnCNN) integrating a deep architecture designed for image denoising [17]. Huang et al. introduced a simultaneous denoising and super-resolution OCT image processing method based on generative adversarial networks (SDSR-OCT), aimed at reconstructing OCT images at varying resolutions [18]. Tian et al. proposed a dual denoising network (DudeNet), which employs a dual network architecture to extract diverse features, enhancing features representation [19]. Yu et al. introduced a multi-scale denoising generative adversarial network (MDGAN), based on a cascaded multiscale module and incorporated a spatial attention mechanism to further optimize the denoised image [20]. The next year, the same group proposed MDR-GAN, a generative adversarial network combining multi-scale convolutional and null convolutional residual networks. This innovation significantly reduced computational load while improving the network’s learning ability [21]. To address real-world complex noise more effectively, Zhang et al. introduced a novel dual-branch residual attention network (DRANet), which captures complementary features to enhance the model’s learning ability [22]. Wu et al. proposed a network integrating dual-CNN with an attention mechanism (DCANet), comprising a noise estimation network, a spatial and channel attention module (SCAM), and a dual-CNN with a two-branch structure, which effectively suppresses both synthetic and real-world noise [23]. Chintada et al. proposed a cGAN-based 3D scatter suppression framework, DL-TNode-3D, to achieve efficient denoising by combining partial volume inputs with standard data generated by TNode [24]. Yang et al. proposed a physics-based PSN framework for OCT denoising, integrating dual-module noise synthesis with physical priors to generate paired data, achieving denoising while preserving structural details [25].
Compared to unsupervised denoising algorithms, supervised deep learning algorithms have been shown to achieve superior denoising effects with fewer data points. However, retinal images utilized for clinical diagnosis require not only the elimination and smoothing of granular speckle noise but also the retention of rich structural features and clear textures in the denoised images. Existing methods typically face challenges in balancing noise suppression and detail preservation.
Existing methods have demonstrated that U-Net-based approaches combined with GANs can effectively suppress speckle noise but typically introduce excessive smoothing that compromises key organizational structures. The effect of this over-smoothing stems from the limited ability of the architecture to retain structural details while removing noise. To address these limitations, we propose an adversarial generative network (MFFA-GAN) with multilevel feature extraction and an attention mechanism for OCT image noise reduction. The model innovatively integrates a multilevel feature interaction mechanism and a dynamic attention guidance strategy. The multilevel feature fusion module is proposed to be embedded at each level of the U-Net encoding path. The module establishes cross-layer feature interactions through residual connectivity and dense feature concatenation, enabling the network to preserve low-level texture details and high-level semantic information. It also combines the ELA attention mechanism with the multilevel feature fusion module for the first time, which effectively suppresses non-significant feature responses and enhances the efficiency of key information transfer through a dynamic feature channel weighting strategy. The specific approach is to prioritize large-area structural regions in the global context-aware attention map generated from the encoder output and locally enhance feature selection by optimizing spatial details through adaptive thresholding, reducing redundant feature learning while preserving key morphological features. The synergy of the two modules significantly reduces the redundant feature learning of the network while constructing cross-layer feature enhancement channels and ultimately realizes the overall optimization of the network representation capability.
2. Methods
2.1. Generative Adversarial Networks
Generative adversarial networks (GANs) [26] are a class of deep learning models proposed by Ian Goodfellow. They have been employed in a variety of applications, including image noise reduction [27], image segmentation [28], image classification [29], super-resolution research [30] and other image processing fields. The fundamental framework of GANs comprises two primary components: a generator and a discriminator. The generator’s objective is to generate realistic data samples from noisy samples, while the discriminator’s task is to differentiate between real and generated inputs. The workflow diagram illustrating the operation of GANs is presented in Figure 1.
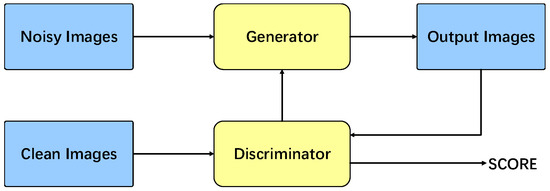
Figure 1.
The architecture of generating adversarial networks.
In the context of denoising GANs, the sample set predominantly comprises noisy images (x) and their corresponding clean real images (y). The generator is designed to learn the mapping between these two types of images. The discriminator’s function is to differentiate between the generated image and the real image to the greatest extent possible, with lower output values corresponding to more effective discriminator training. The principle of the GAN model can be expressed as a min-max optimization problem:
where is the predicted value of the discriminator for the real data, is the sample generated by the generator, is the distribution of the real data, and is the distribution of the noisy data.
2.2. Total Model
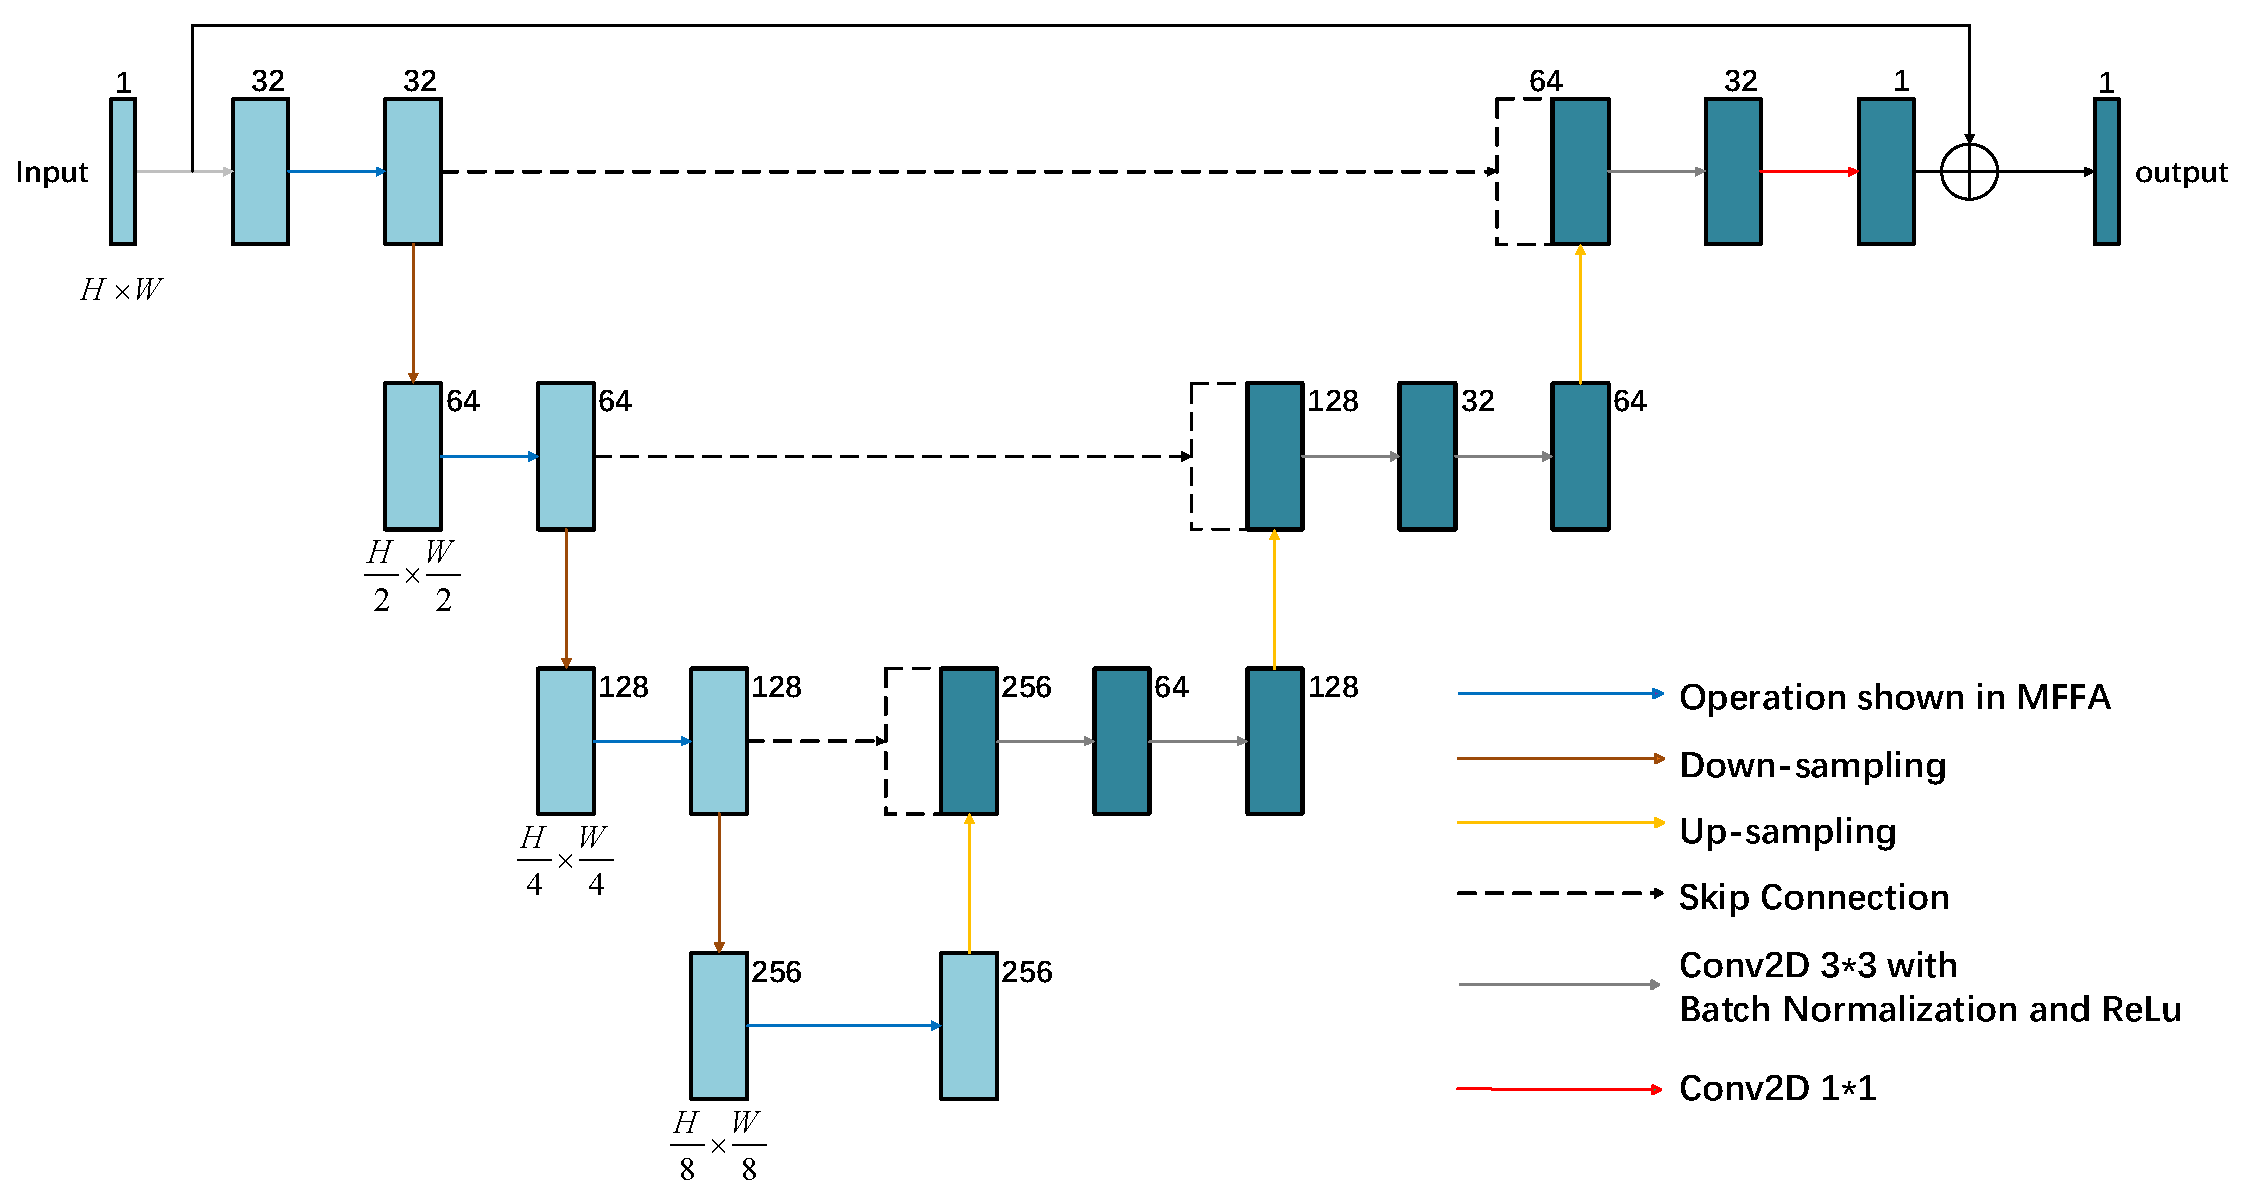
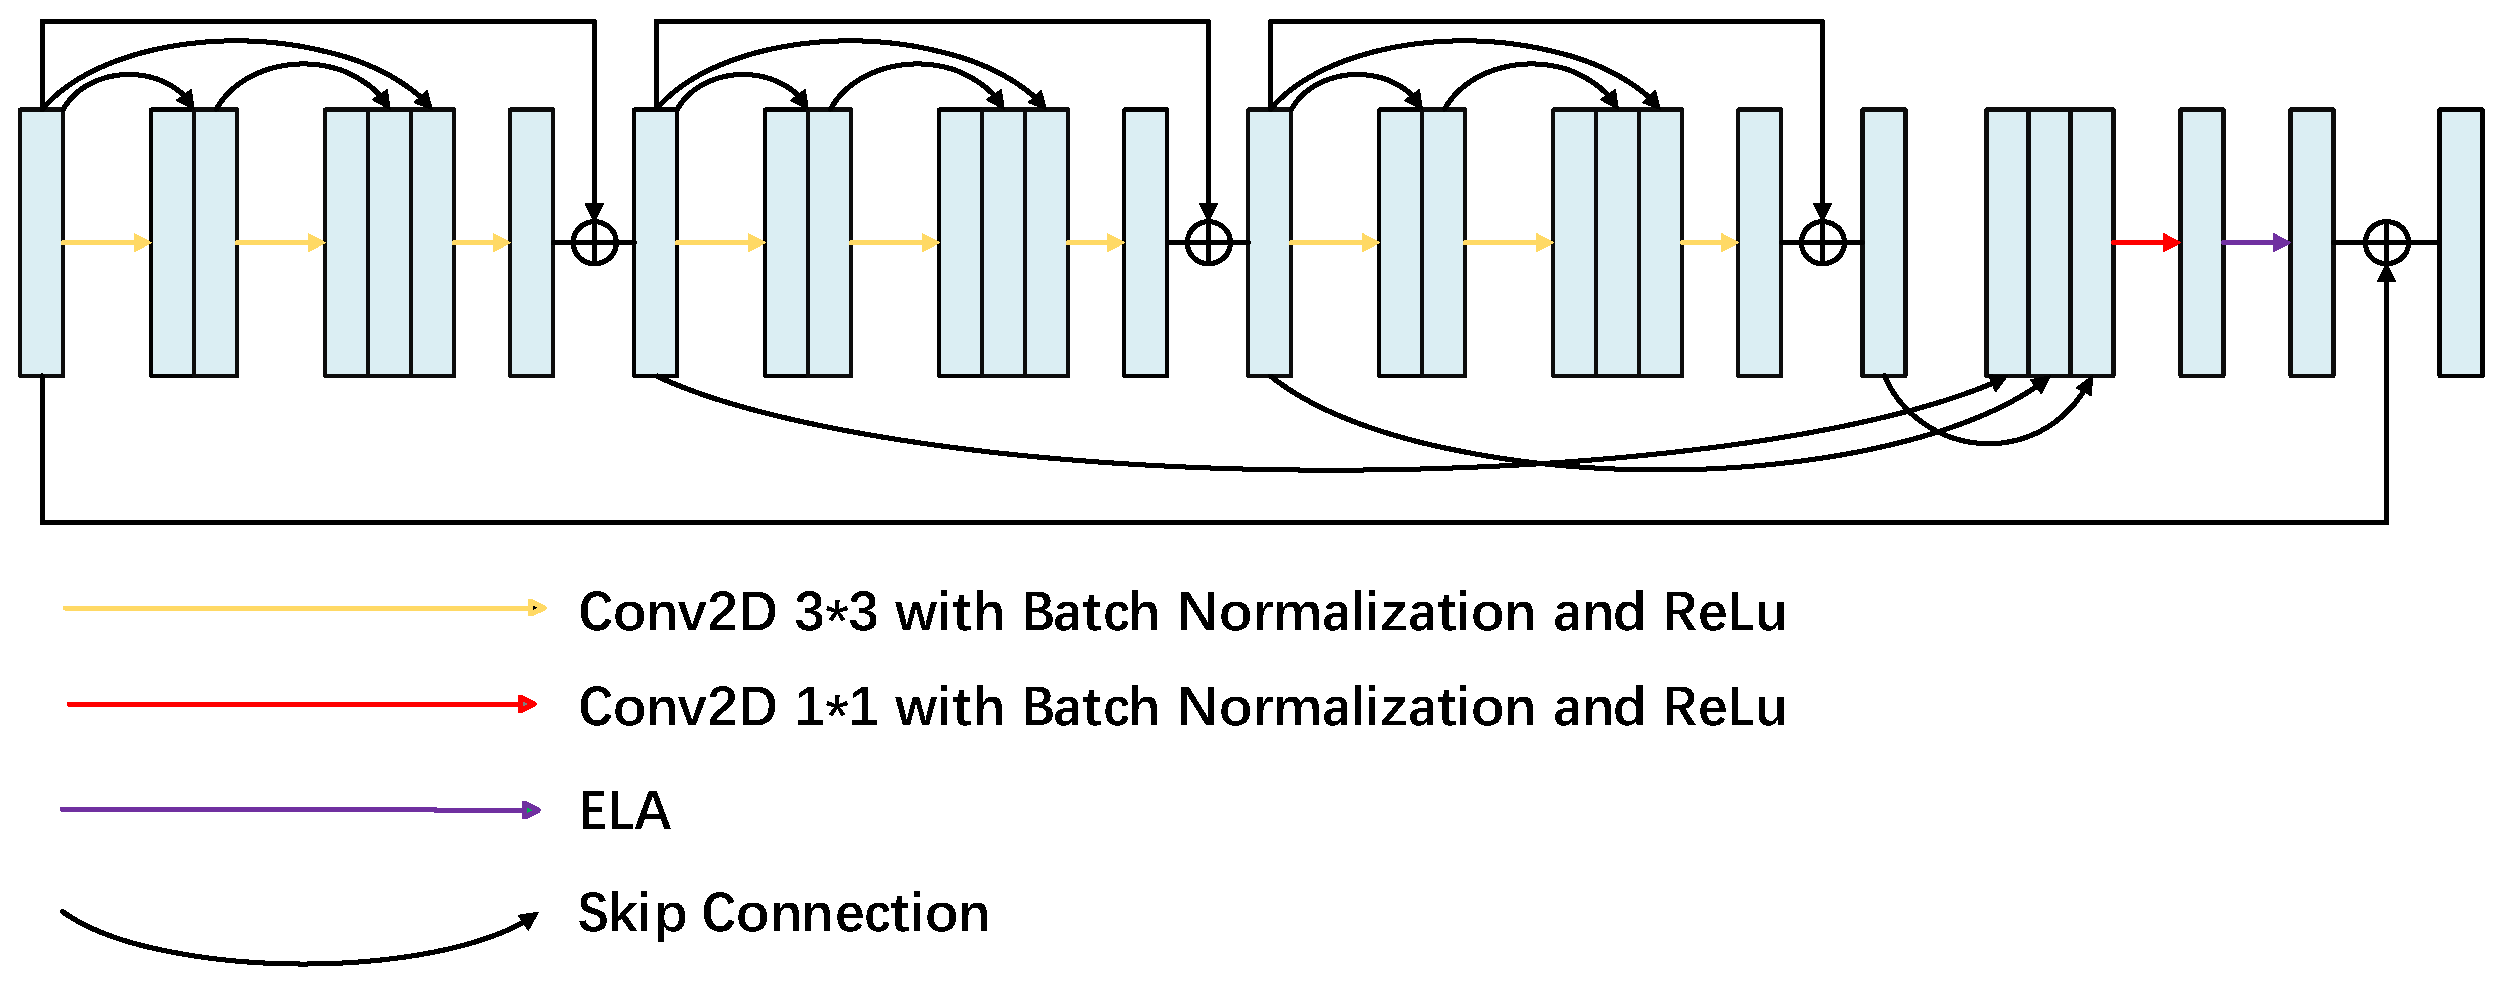
We designed a new generative adversarial network architecture called MFFA-GAN. The generator architecture was constructed based on the U-Net model [31] and is schematically shown in Figure 2. U-Net relies on simple convolutional operations only and often struggles to capture the deep information in the image, especially in the detailed region of the image. Although skip connections in U-Net enhance the propagation of low-level features and spatial information recovery, in scenarios involving complex noise or intricate textures, these low-level features often fail to integrate effectively with high-level semantic representations. To address these issues, we propose a multi-level feature fusion attention module, which aims to enhance the feature capture ability at different resolutions. Specifically, within the encoding path, the module captures multi-level detailed features, while in the decoding path, effective fusion of features at different scales is facilitated by skipping connections, enabling the network to understand the image context more comprehensively. This improves the denoising effect and preserves key structural information. The subsequent sections will provide a comprehensive description of the generator’s architecture and the roles of its constituent modules.
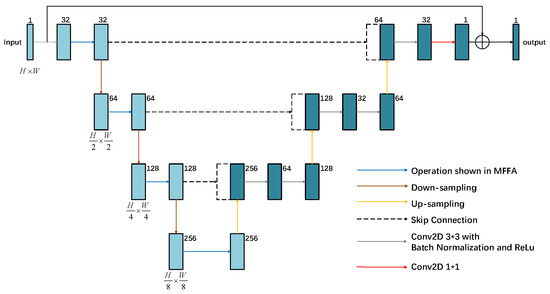
Figure 2.
The generator architecture of the proposed MFFA-GAN.
In the discriminator part of the network, the PatchGAN [32] structure is adopted, as illustrated in Figure 3. In contrast to the conventional discriminator, PatchGAN does not directly evaluate the authenticity of the entire image, but rather partitions the image into multiple N × N regions, discriminates each region individually, and ultimately derives an aggregate judgment by averaging the results of the discriminations across all regions. This approach facilitates the discriminator in evaluating the authenticity of the image with greater precision, thereby guiding the generator to produce a denoised image that is more realistic. In this study, a 70 × 70 PatchGAN was selected for this local judgment to effectively distinguish between a clean image and a denoised image.
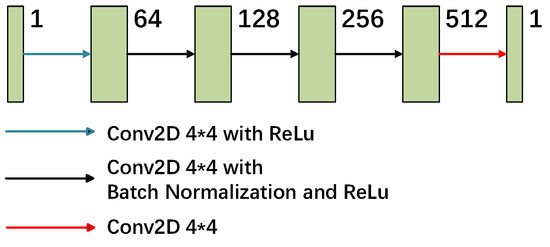
Figure 3.
The discriminator architecture of the proposed MFFA-GAN.
2.2.1. Multi-Level Feature Fusion Attention Module
The multi-level feature fusion attention (MFFA) module is the core part of the generator encoding path proposed in this work, which is shown in Figure 4 and consists of three dense blocks [33] and an ELA attention module. The design goal of this module is to extract features of the input noisy image from different levels and refine these features to enhance the image noise reduction. The dense residual block [34] increases the depth of the network by introducing multiple levels of residual connectivity, while being able to mitigate the problem of vanishing or exploding gradients while extracting deep features. This structure makes the network more stable during training. In our experiments, we optimized the dense residual block to improve the training efficiency and performance of the model by reducing the number of convolutional layers in it and adding a bulk normalization layer [35] before each activation layer [36]. By stacking the convolution operations layer by layer, the multilevel feature fusion module is able to gradually extract higher-level feature information and perform feature fusion at the layer level after the dense block of residuals. This process enables different levels of features to be effectively combined to obtain richer image information. Subsequently, a 1 × 1 convolutional layer is used to restore the feature channels to the number of channels of the original input. Finally, the ELA attention module is used to enhance important features and suppress irrelevant features.
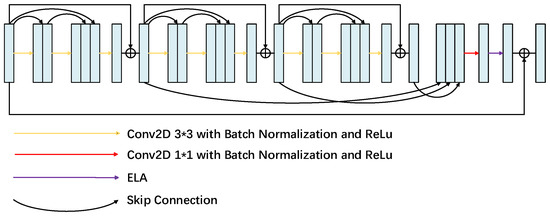
Figure 4.
Structure of the multi-level feature fusion attention.
2.2.2. ELA Attention Module
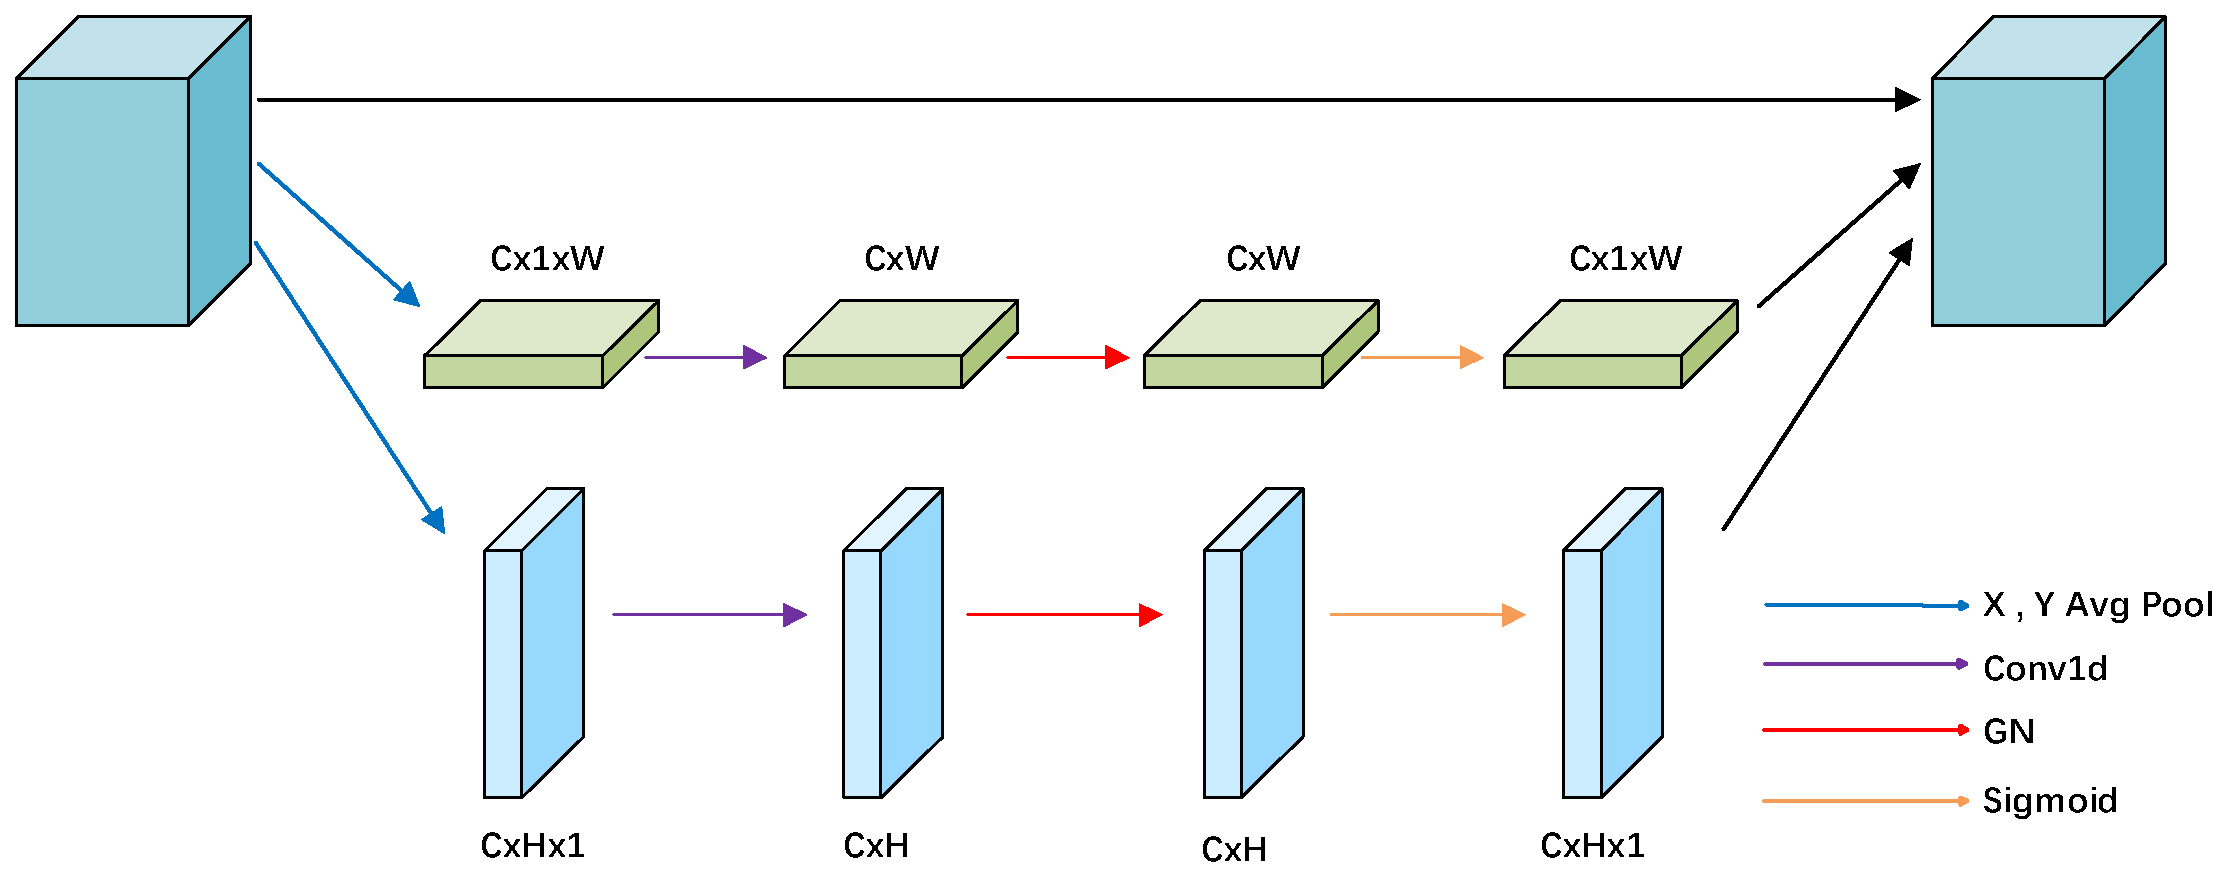
Efficient local attention [37] is a lightweight module designed to improve model performance by enhancing the feature representation of local regions. Special emphasis is placed on the efficient use of spatial location information and the avoidance of channel dimension reduction, thus preserving the integrity of the input feature map. As shown in Figure 5, ELA is mainly realized in two steps: location information embedding and location attention generation.
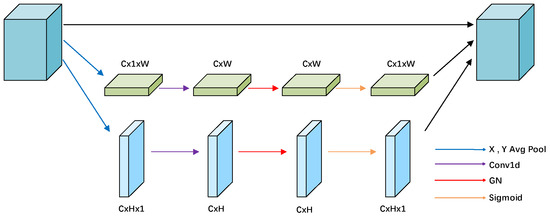
Figure 5.
Structure of the efficient local attention.
In the first step, in order to capture the spatial dependencies over long distances, an average pooling operation is performed for each channel C in the horizontal (1, W) and vertical (H, 1) directions, respectively, to generate location information and .
In the subsequent stage, the position information is transformed through 1D convolutional layers and , respectively, and GN normalization and nonlinear activation function are applied to generate positional attention weights:
Finally, the positional attention weights of these two directions are multiplied together to obtain the final positional attention map , and the original input feature map X is multiplied element by element to obtain the output feature map Y:
2.3. Loss Function
This experiment aimed to reduce the mode collapse problem and provide a more stable training process by using the mean squared error loss instead of the traditional cross-entropy loss, with the objective functions of the discriminator D and generator G as follows:
where denotes the mean square error between the discriminator’s output of the real image and 1. denotes the mean square error between the discriminator’s output of the generated image and 0.
To achieve OCT high-quality image reconstruction, we added different loss functions to co-train the MFFA-GAN generator network: the L1 loss constrains the pixel-by-pixel absolute error between the denoised image and the original image, guaranteeing high-precision alignment of the global structure; the edge consistency loss [38] strengthens the similarity measure of the image’s edge features by quantifying the absolute value of the differences between neighboring pixels; the perceptual feature loss [39], based on the pre-trained VGG-16 network, improves the visual effect of the reconstructed image through contrast optimization in the high-level semantic feature space. The total loss of the generator can be attributed to the following components:
where , , , and are the coefficients of each loss term.
3. Experiment
3.1. Data Used in the Experiment
To assess the validity and robustness of the model, we evaluated it in three publicly available datasets containing retinal data from 61 independent subjects with normal and diseased conditions obtained from different OCT instruments and provided by different clinical center institutions.
These datasets were from the A2A SD-OCT program registered with the U.S. Clinical Trails Registry (https://clinicaltrials.gov/) and provided by the AREDS2 Collaborating Institutions. The first dataset, named Data-1 [40], contains 17 noisy retinal images. The noisy images were acquired by an 840 nm wavelength Biopitgen SDOCT imaging system, which is from Biopitzen Inc. (Research Triangle Park, NC, USA) and had an axial resolution of ~4.5 μm per pixel in tissue. The clean images were obtained by capturing multiple B-scans from the same location, aligning these B-scans using an image alignment technique, and then averaging them. First, 6 image pairs with limited quality were removed from this dataset due to excessive smoothing of some images during registration and averaging, and details were lost, affecting the authenticity of the clean images. The structural features and details were not clearly displayed, which had a significant impact on the training process. The remaining 11 pairs of images were used to conduct the experiments. We randomly selected 8 pairs of images as the training set and 3 pairs of images as the test set. Since the GAN model requires a large amount of data for training and each pair of images did not have the same size, all the images in the training set were slid through each training sample with a resolution of 500 × 950 (height × width), a window size of 256 × 256, and a stride of 30, generating 3888 blocks of images for training. In the preprocessing stage, the input image was converted into a single-channel grayscale map adapted to the single-channel nature of the retinal OCT image, while the image was normalized to the [0, 1] range. The remaining 3 pairs of images were fed into the trained generator for comparison with other methods used for OCT denoising.
To further evaluate the generalization ability of the model, the second dataset, named Data-2 [41], contains 24 pairs of retinal images of the same size, normal eyes, and retinas with non-neovascular age-related macular degeneration. The noisy images were acquired by the same Biopitgen SDOCT imaging system. The third dataset, Data-3 [42], contains 20 noisy images of size 1000 × 512, with no corresponding clean images. The noisy images were from real low-quality clinical scan images without any artificial noise synthesis. To assess the generalization ability of the model, the trained model of dataset Data-1 was used in this experiment to process the images in datasets Data-2 and Data-3. The denoised images and performance metrics of all the methods will be shown in the results.
3.2. Experimental Parameter Settings
In this experiment, several key factors of the MFFA-GAN model were carefully set and optimized. Regarding the optimizer, both the generator and discriminator used the Adam optimizer, which exhibits good convergence performance when handling sparse gradients and non-convex optimization problems. The momentum parameters were set to 0.5 and 0.999. During training, the initial learning rate was set to 0.01, with a learning rate decay of 0.1 every 50 epochs. The batch size was set to 1, and the coefficients for the generator’s loss function were set to α = 0.001, β = 1, γ = 0.0005, and λ = 0.006. Training continued until both the generator loss and discriminator loss converged. Additionally, to ensure experimental fairness, all comparison methods were retrained and evaluated under identical conditions. The experiments were implemented using PyTorch 2.2.0 on a workstation running the Windows operating system, equipped with a 13th Gen Intel (R) Core (TM) i5-13490F processor, 16 GB of RAM, and an NVIDIA GeForce RTX 4060 Ti.
3.3. Result Descriptions of Performance Indicators
3.3.1. PSNR
PSNR is the most commonly used and widely recognized metric for measuring the similarity between a denoised image and a reference image. It is based on the error between corresponding pixel points, making it an error-sensitive image quality evaluation. Its calculation is as follows:
where MSE represents the mean squared error between the current image X and the reference image Y.
3.3.2. SSIM
SSIM is a commonly used metric for evaluating the global similarity between two images. It considers luminance, contrast, and structural information. The SSIM between image x and image y is calculated as follows:
where and are the mean values of image x and image y, and are the variances of image x and image y, is the covariance between image x and image y, and are constants that stabilize the division with weak denominator values.
3.3.3. CNR
The contrast-to-noise ratio (CNR) is used for the comparison and analysis of the region of interest (ROI). It evaluates the contrast between the selected signal region and the background region and is calculated as follows:
where m is the total number of selected ROIs, and represent the mean and standard deviation of the signal region, while and represent the mean and standard deviation of the background region. We manually selected four signal regions and one background region, with the selected signal regions and background region indicated by red and blue boxes, respectively.
3.3.4. ENL
ENL is a commonly used evaluation metric for speckle noise reduction in OCT images, and it quantifies the smoothness of the homogeneous regions in denoised images. ENL is calculated in the background region of the denoised image as follows:
where represents the mean value of the selected background region of the image, and represents the standard deviation of the selected background region of the image.
4. Results
4.1. Experiment with Data-1
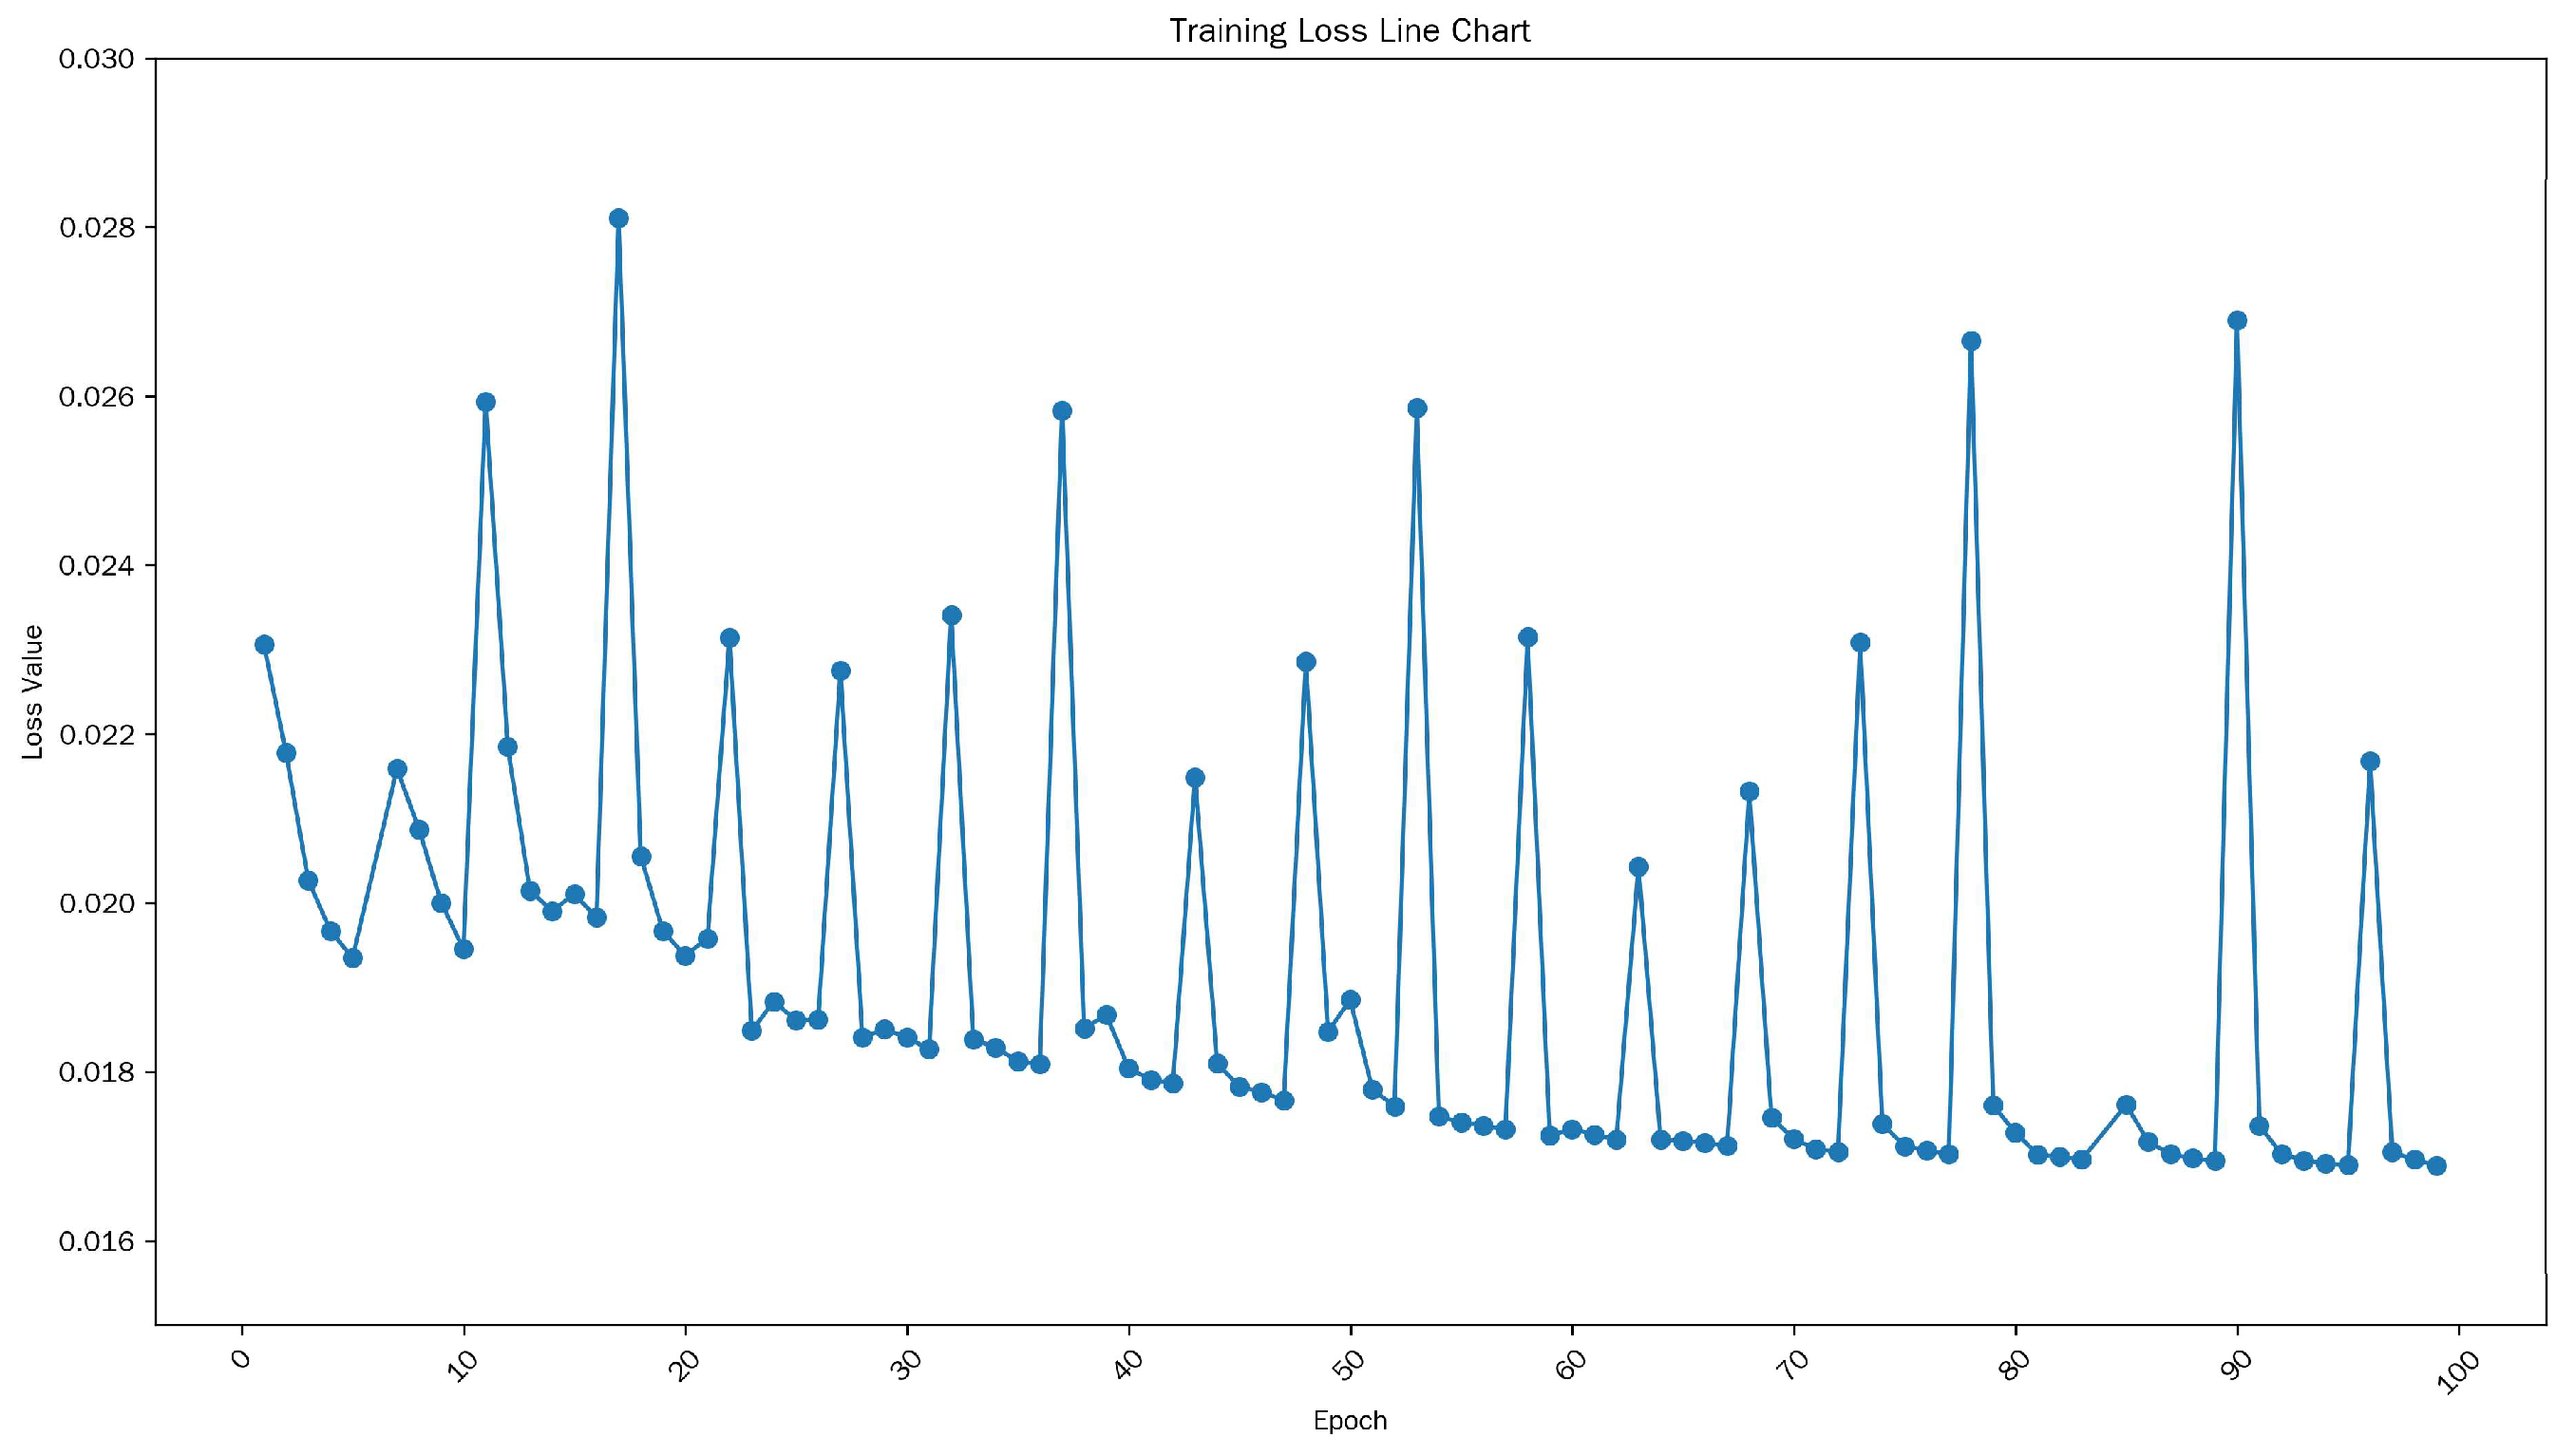
To ascertain the efficiency of the proposed methodology, a comprehensive experimental and training study was conducted using the Data-1 dataset. As shown in Figure 6, the training loss curve of the generator reflects the dynamic trajectory of the stability of the adversarial training process. In the first 30 periods, there were significant fluctuations in losses. Subsequently, the generator quickly adapted to complex data distributions, and the fluctuations gradually decreased between 30 and 80 periods, indicating that as the generator improved its feature mapping ability, the average loss steadily decreased. After 80 epochs, the loss stabilized around 0.017 with minimal oscillation, indicating convergence. The transient fluctuations that occur during the training process are inherent to GAN training, stemming from the mutual constraint objectives of the generator and discriminator. Despite these oscillations, the gradual downward trend and attenuation amplitude demonstrate the stability of convergence, with no signs of mode collapse.
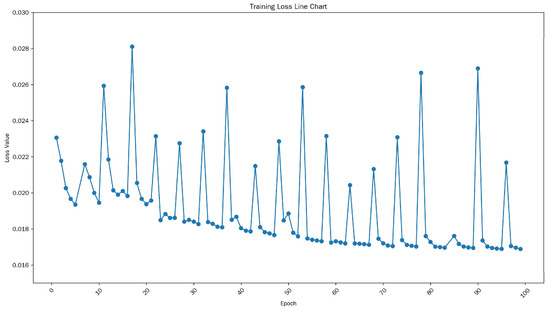
Figure 6.
Generator loss curve graph.
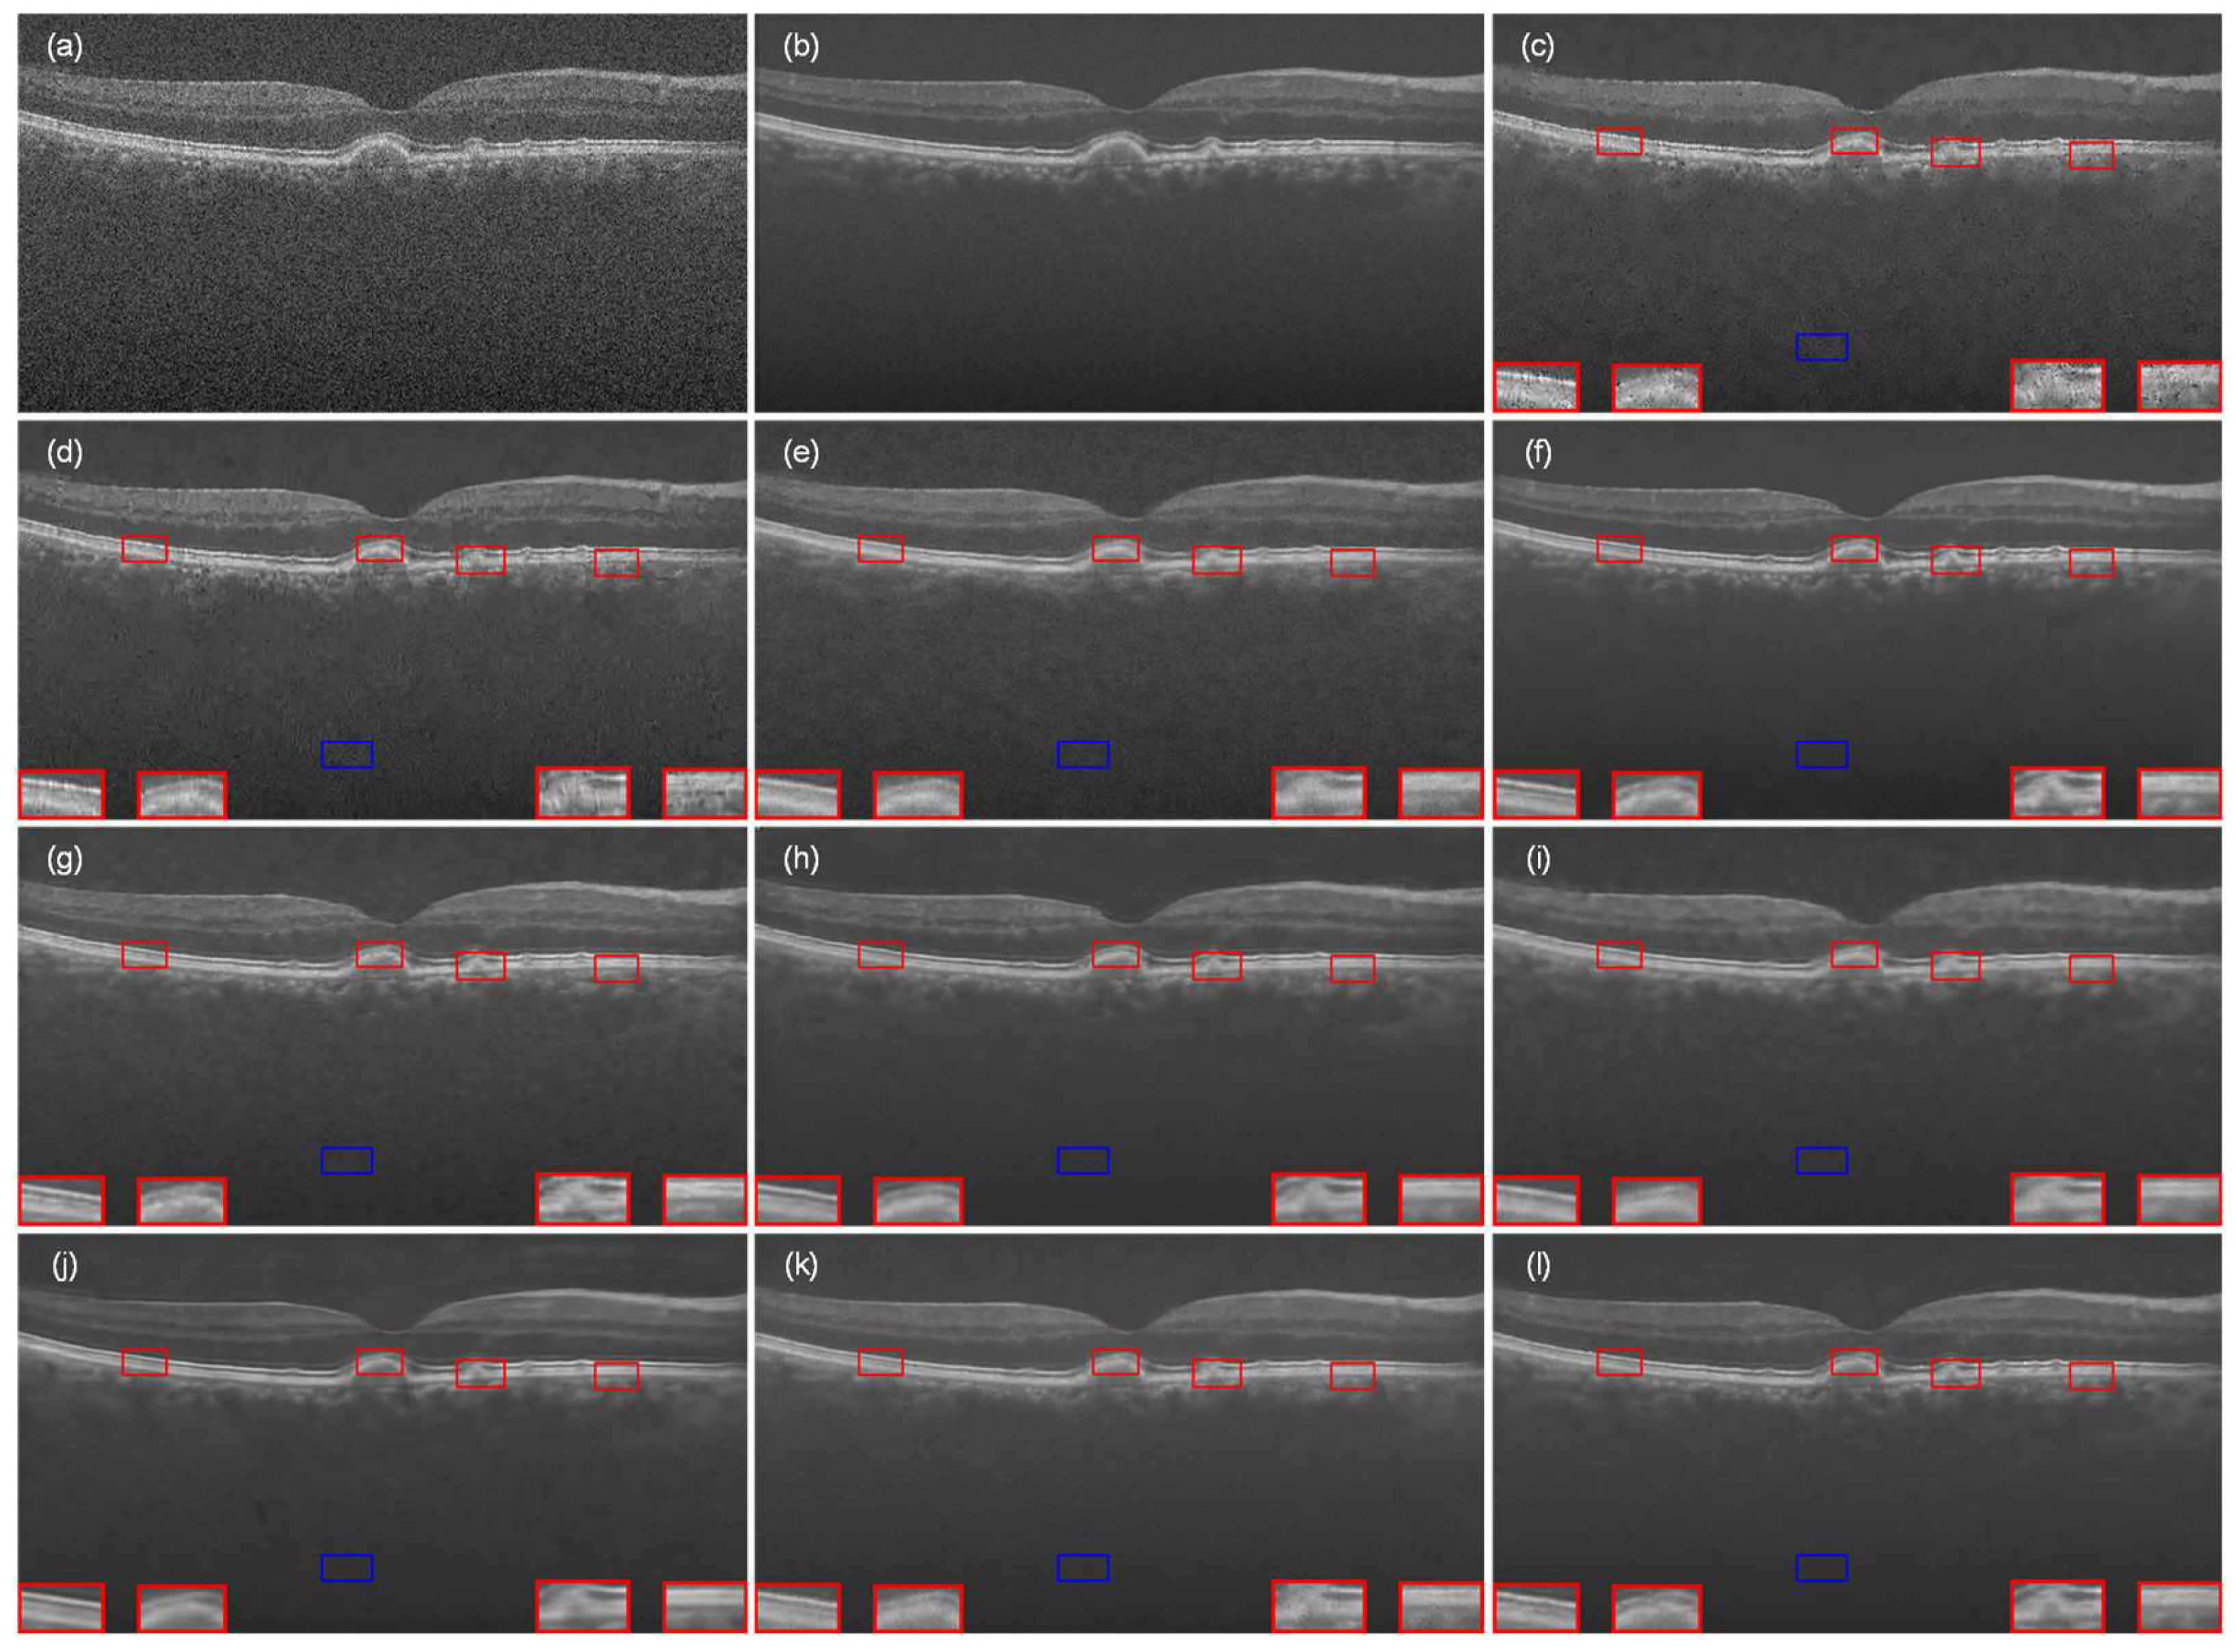
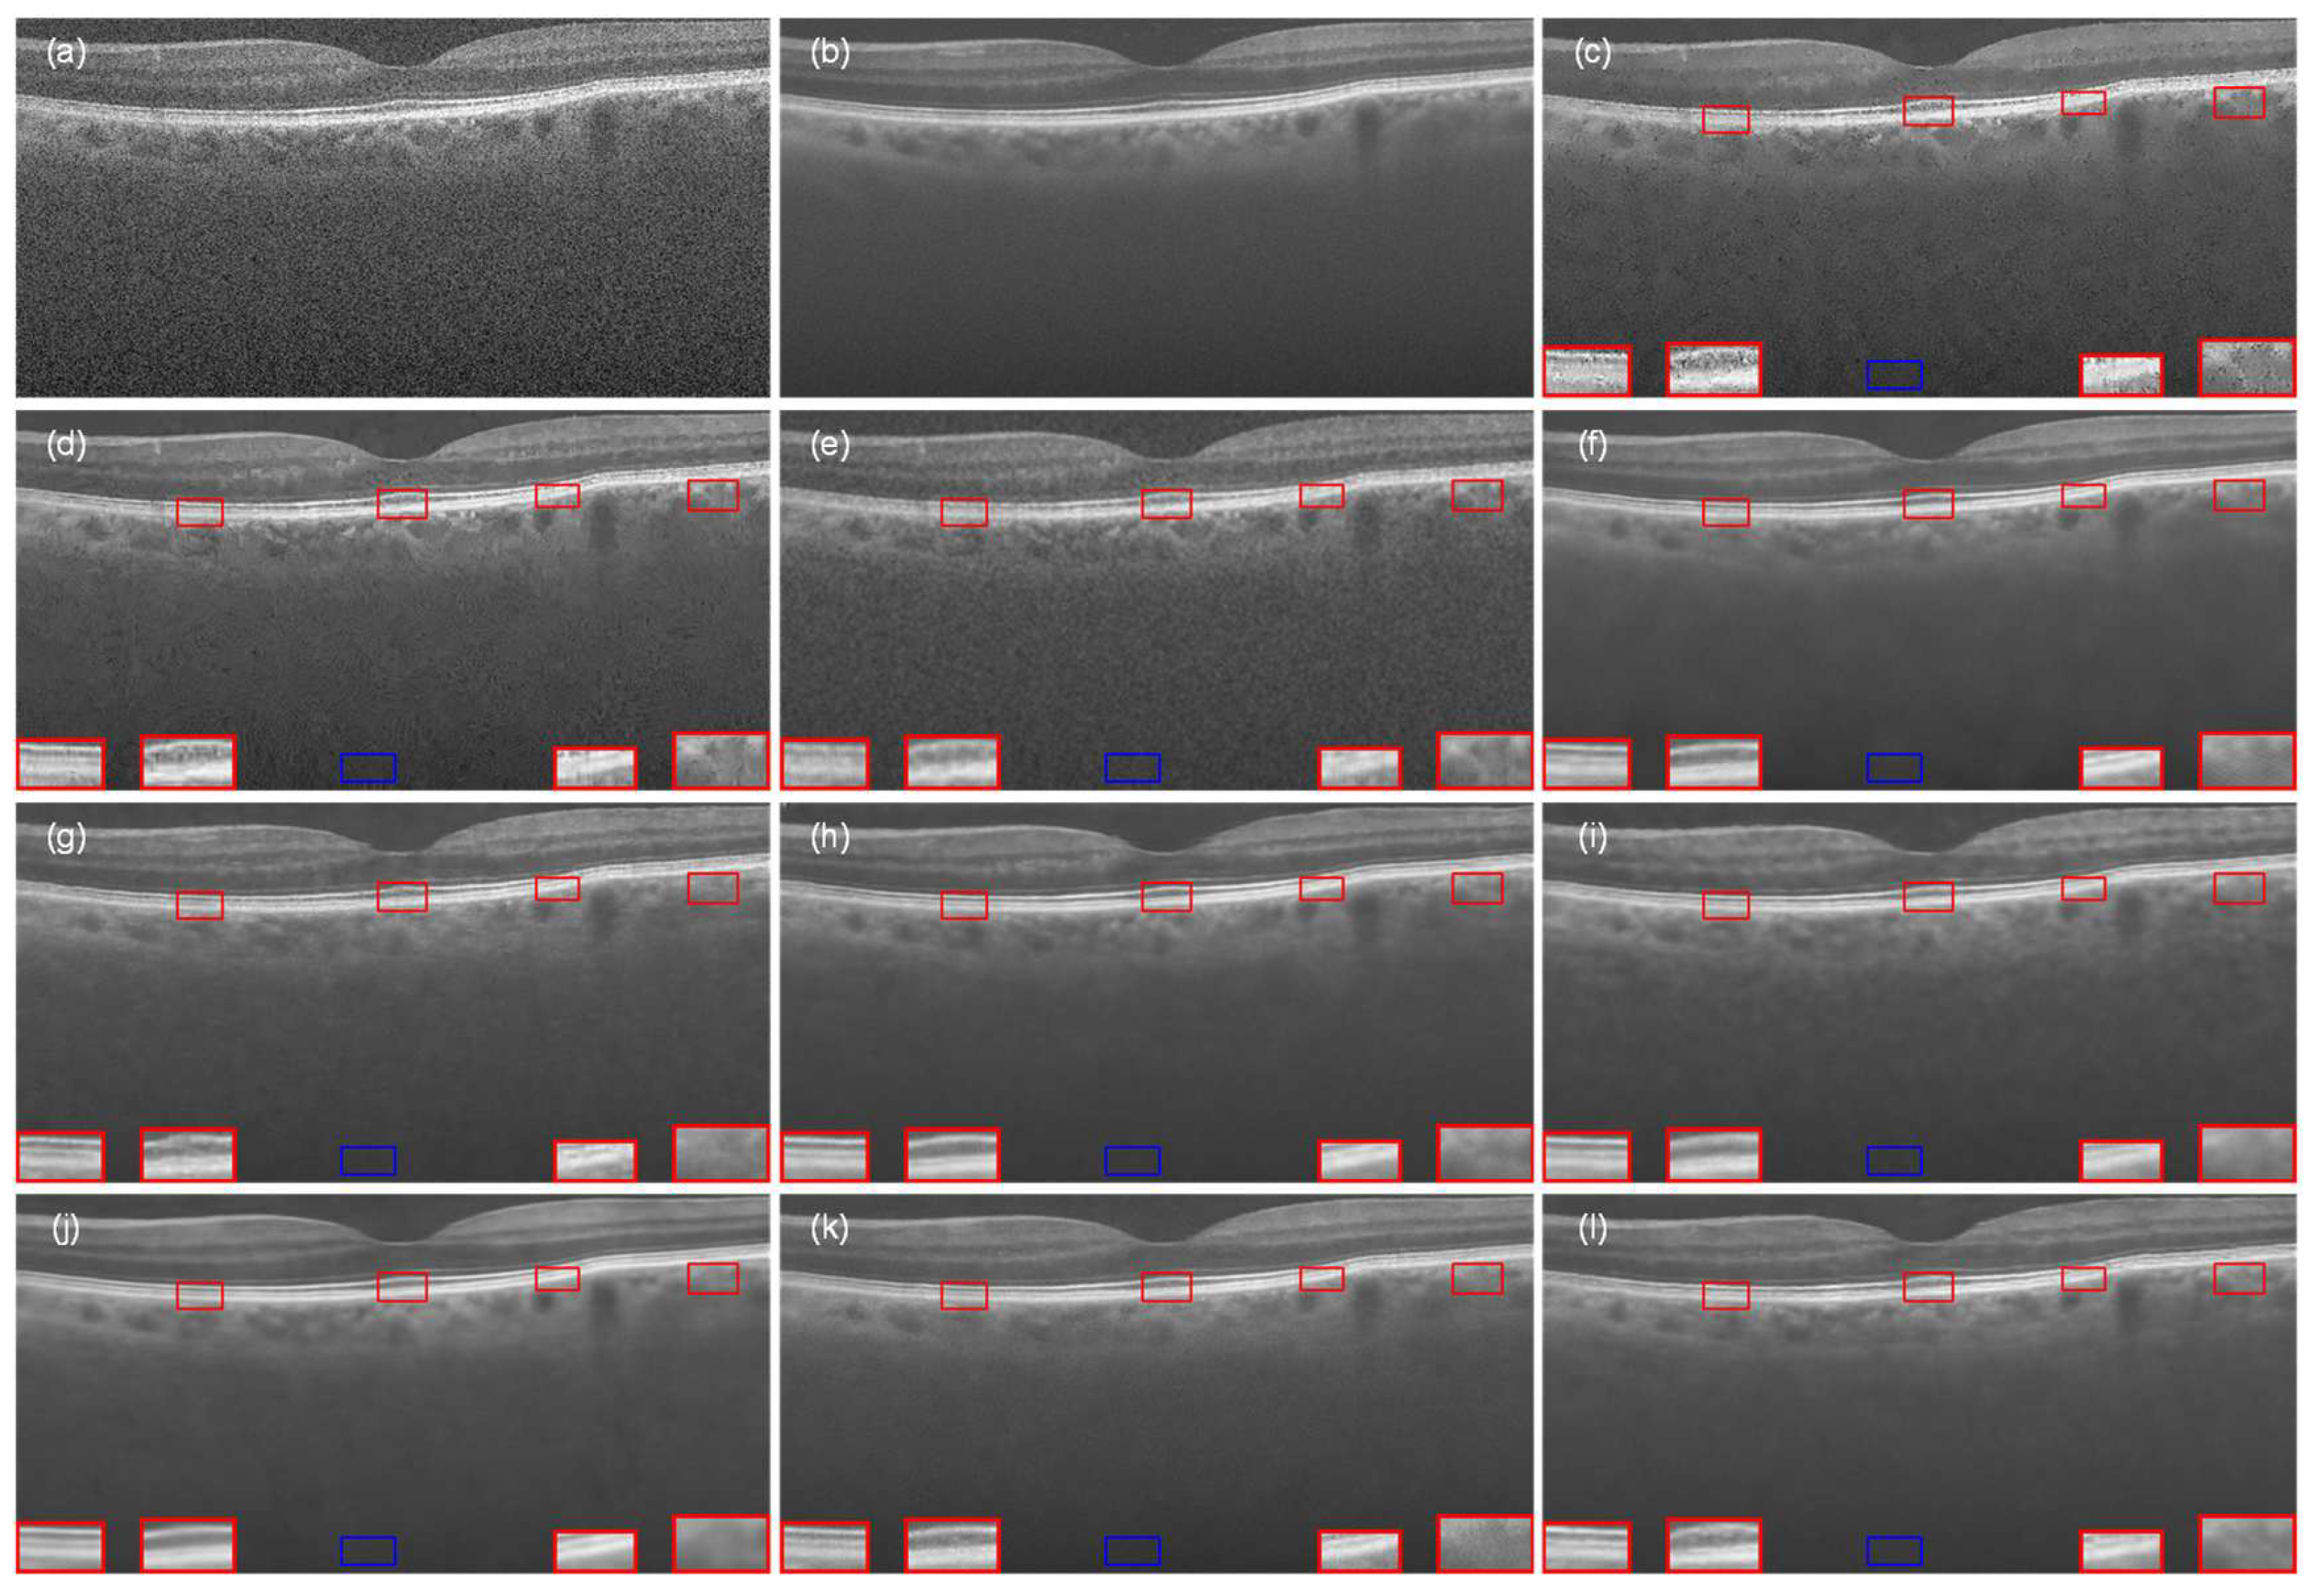
As shown in Figure 7, the results of the images processed by the proposed algorithm with several comparison methods are demonstrated. Specifically, Figure 7a,b represent the original noisy image and its corresponding real image (ground truth), respectively, whereas from Figure 7c–l demonstrate different denoising methods, such as NLM, BM3D, DnCNN, SDSR-OCT, DudeNet, MDGAN, MDRGAN, DCANet, and DRANet. To quantitatively assess the quality of these images, we manually selected four signal regions and one background region in each image, and accordingly calculated the contrast-to-noise ratio (CNR) and equivalent number of views (ENL) for each region. In order to observe the retinal structural information more clearly for a more convenient quality assessment, we performed local magnification of the four signal regions. In the figure, it can be observed that the traditional NLM (Figure 7c) and BM3D (Figure 7d) denoising methods performed poorly in terms of effectiveness, especially in the inner and border regions of the retina, where the image was more severely corrupted. Compared with NLM and BM3D, DnCNN (Figure 7e) improved in scatter removal, but the scatter suppression effect was still not significant enough. SDSR-OCT (Figure 7f) and MDRGAN (Figure 7i) effectively removed scatter noise, but blocky and striped artifacts appeared in the image, which reduced the overall quality and perception of the image. MDGAN (Figure 7h) and DCANet (Figure 7j), on the other hand, excessively smoothed the denoised image, which resulted in the complicated textures becoming blurred, features becoming difficult to distinguish from the background, and insufficient enhancement of retinal structures, which in turn affected the overall readability of the image. In contrast, although DudeNET (Figure 7g) and DRANet (Figure 7k) could better preserve the edge details and texture information of the image, there were still obvious scattering particles in the denoised image, which influenced the observation of the fine structures in the image. In contrast, our proposed method not only effectively suppressed the speckle noise but also preserved the edge details and texture features in the image. At the same time, the method resulted in a high contrast between the signal region and the background region, which effectively maintained the clarity and resolution of the image.
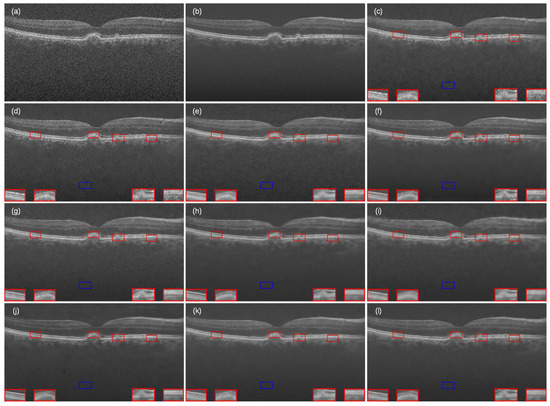
Figure 7.
The OCT retinal image from Data-1 that was processed by different denoising methods: (a) noisy image, (b) ground-truth image, (c) NLM, (d) BM3D, (e) DnCNN, (f) SDSR-OCT, (g) DudeNet, (h) MDGAN, (i) MDRGAN, (j) DCANet, (k) DRANet, and (l) MFFA-GAN. The blue square represents the background area, and the red square represents the signal area.
As demonstrated in Table 1, there were significant differences in the performances of the different image denoising models in terms of key performance indicators. Traditional methods, such as NLM and BM3D, due to low performance in four performance aspect metrics, had limited effectiveness in processing complex images. Although BM3D showed some advantages in ENL, this stemmed from a certain degree of blurring image details rather than a true noise removal capability and does not represent an overall improvement in image quality. In contrast, deep learning-based methods, such as DnCNN, achieved some improvement in PSNR, but their performance in SSIM, ENL, and CNR was not satisfactory, which may imply that while noise was removed, the details and contrast of the image were lost to a certain extent. SDSR-OCT also performed well in PSNR and SSIM, but its ENL values were abnormally high, which may imply an oversmoothing effect during image edge processing, resulting in a loss of edge detail.

Table 1.
Performance comparison of different methods on Data-1.
It can be seen that the deep learning models, such as DudeNet, MDGAN, MDRGAN, DCANet, and DRANet had good performance in terms of PSNR and SSIM, which indicates that they had an advantage in reducing the difference between the reconstructed image and the original image and preserving the structural information of the image. However, the performance of these models varied widely in terms of ENL and CNR, reflecting their different abilities in dealing with image edge details. In contrast, MFFA-GAN achieved excellent performance in all key performance metrics, especially with high values in PSNR and CNR, which fully verifies its ability to retain image details and contrast well while effectively removing noise. In addition, the moderate ENL values also indicate that our model can maintain good detail retention ability when processing image edges and can solve the problem of blurring structural information due to excessive smoothing. In summary, the performance metrics of the above results prove the effectiveness of our model in denoising.
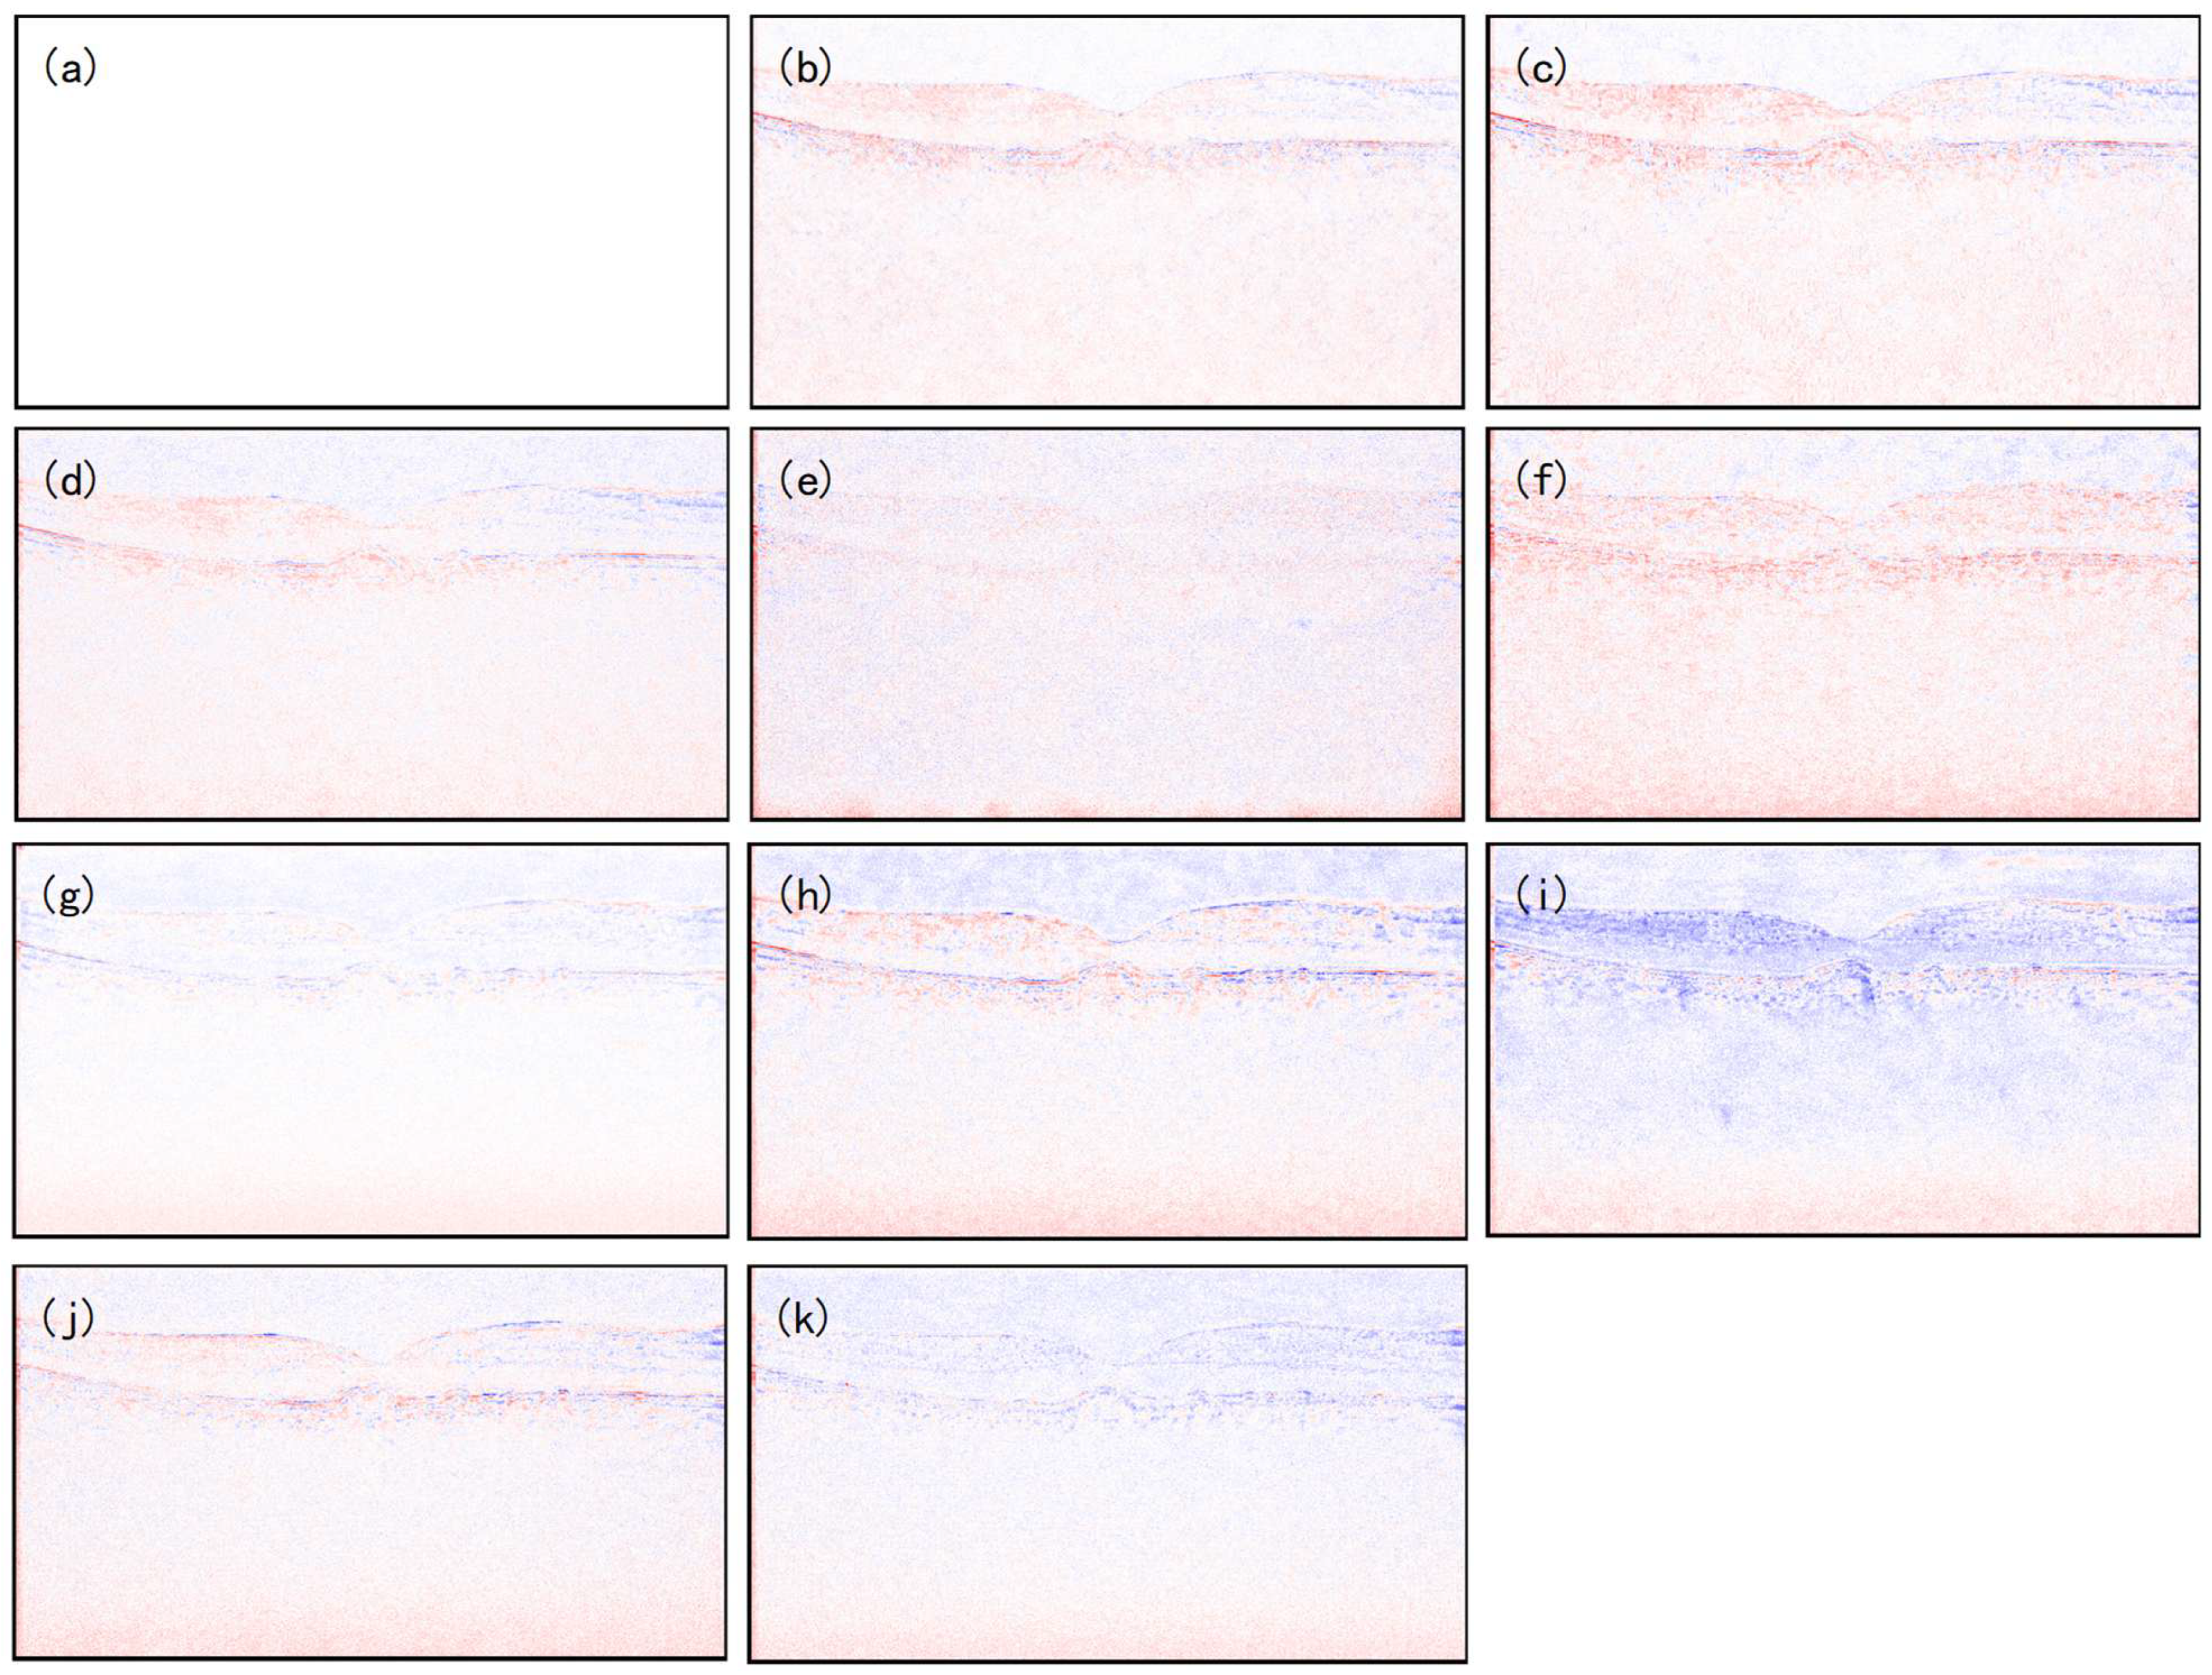
In order to further enhance the interpretability of the model, we made a visual pixel error map for Data-1, where the absolute error is visually presented by color coding. Red represents the negative error between the denoised image and the real image, blue represents the positive error between the denoised image and the real image, and white represents the absence of error. The darker the color, the larger the error. As shown in Figure 8, compared with the error maps of other methods, the MFFA-GAN error map only shows a tiny blue color at the edges, with lower pixel error, and it retained the brightness and structure of the retinal layers more completely. It further shows that the image quality after MFFA-GAN noise reduction was higher and the absolute error was smaller.
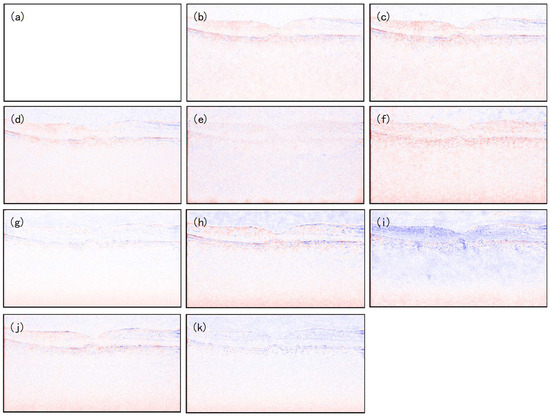
Figure 8.
Pixel error map between denoised image and real image: (a) reference, (b) NLM, (c) BM3D, (d) DnCNN, (e) SDSR-OCT, (f) DudeNet, (g) MDGAN, (h) MDRGAN, (i) DCANet, (j) DRANet, and (k) MFFA-GAN.
4.2. Experiment with Data-2
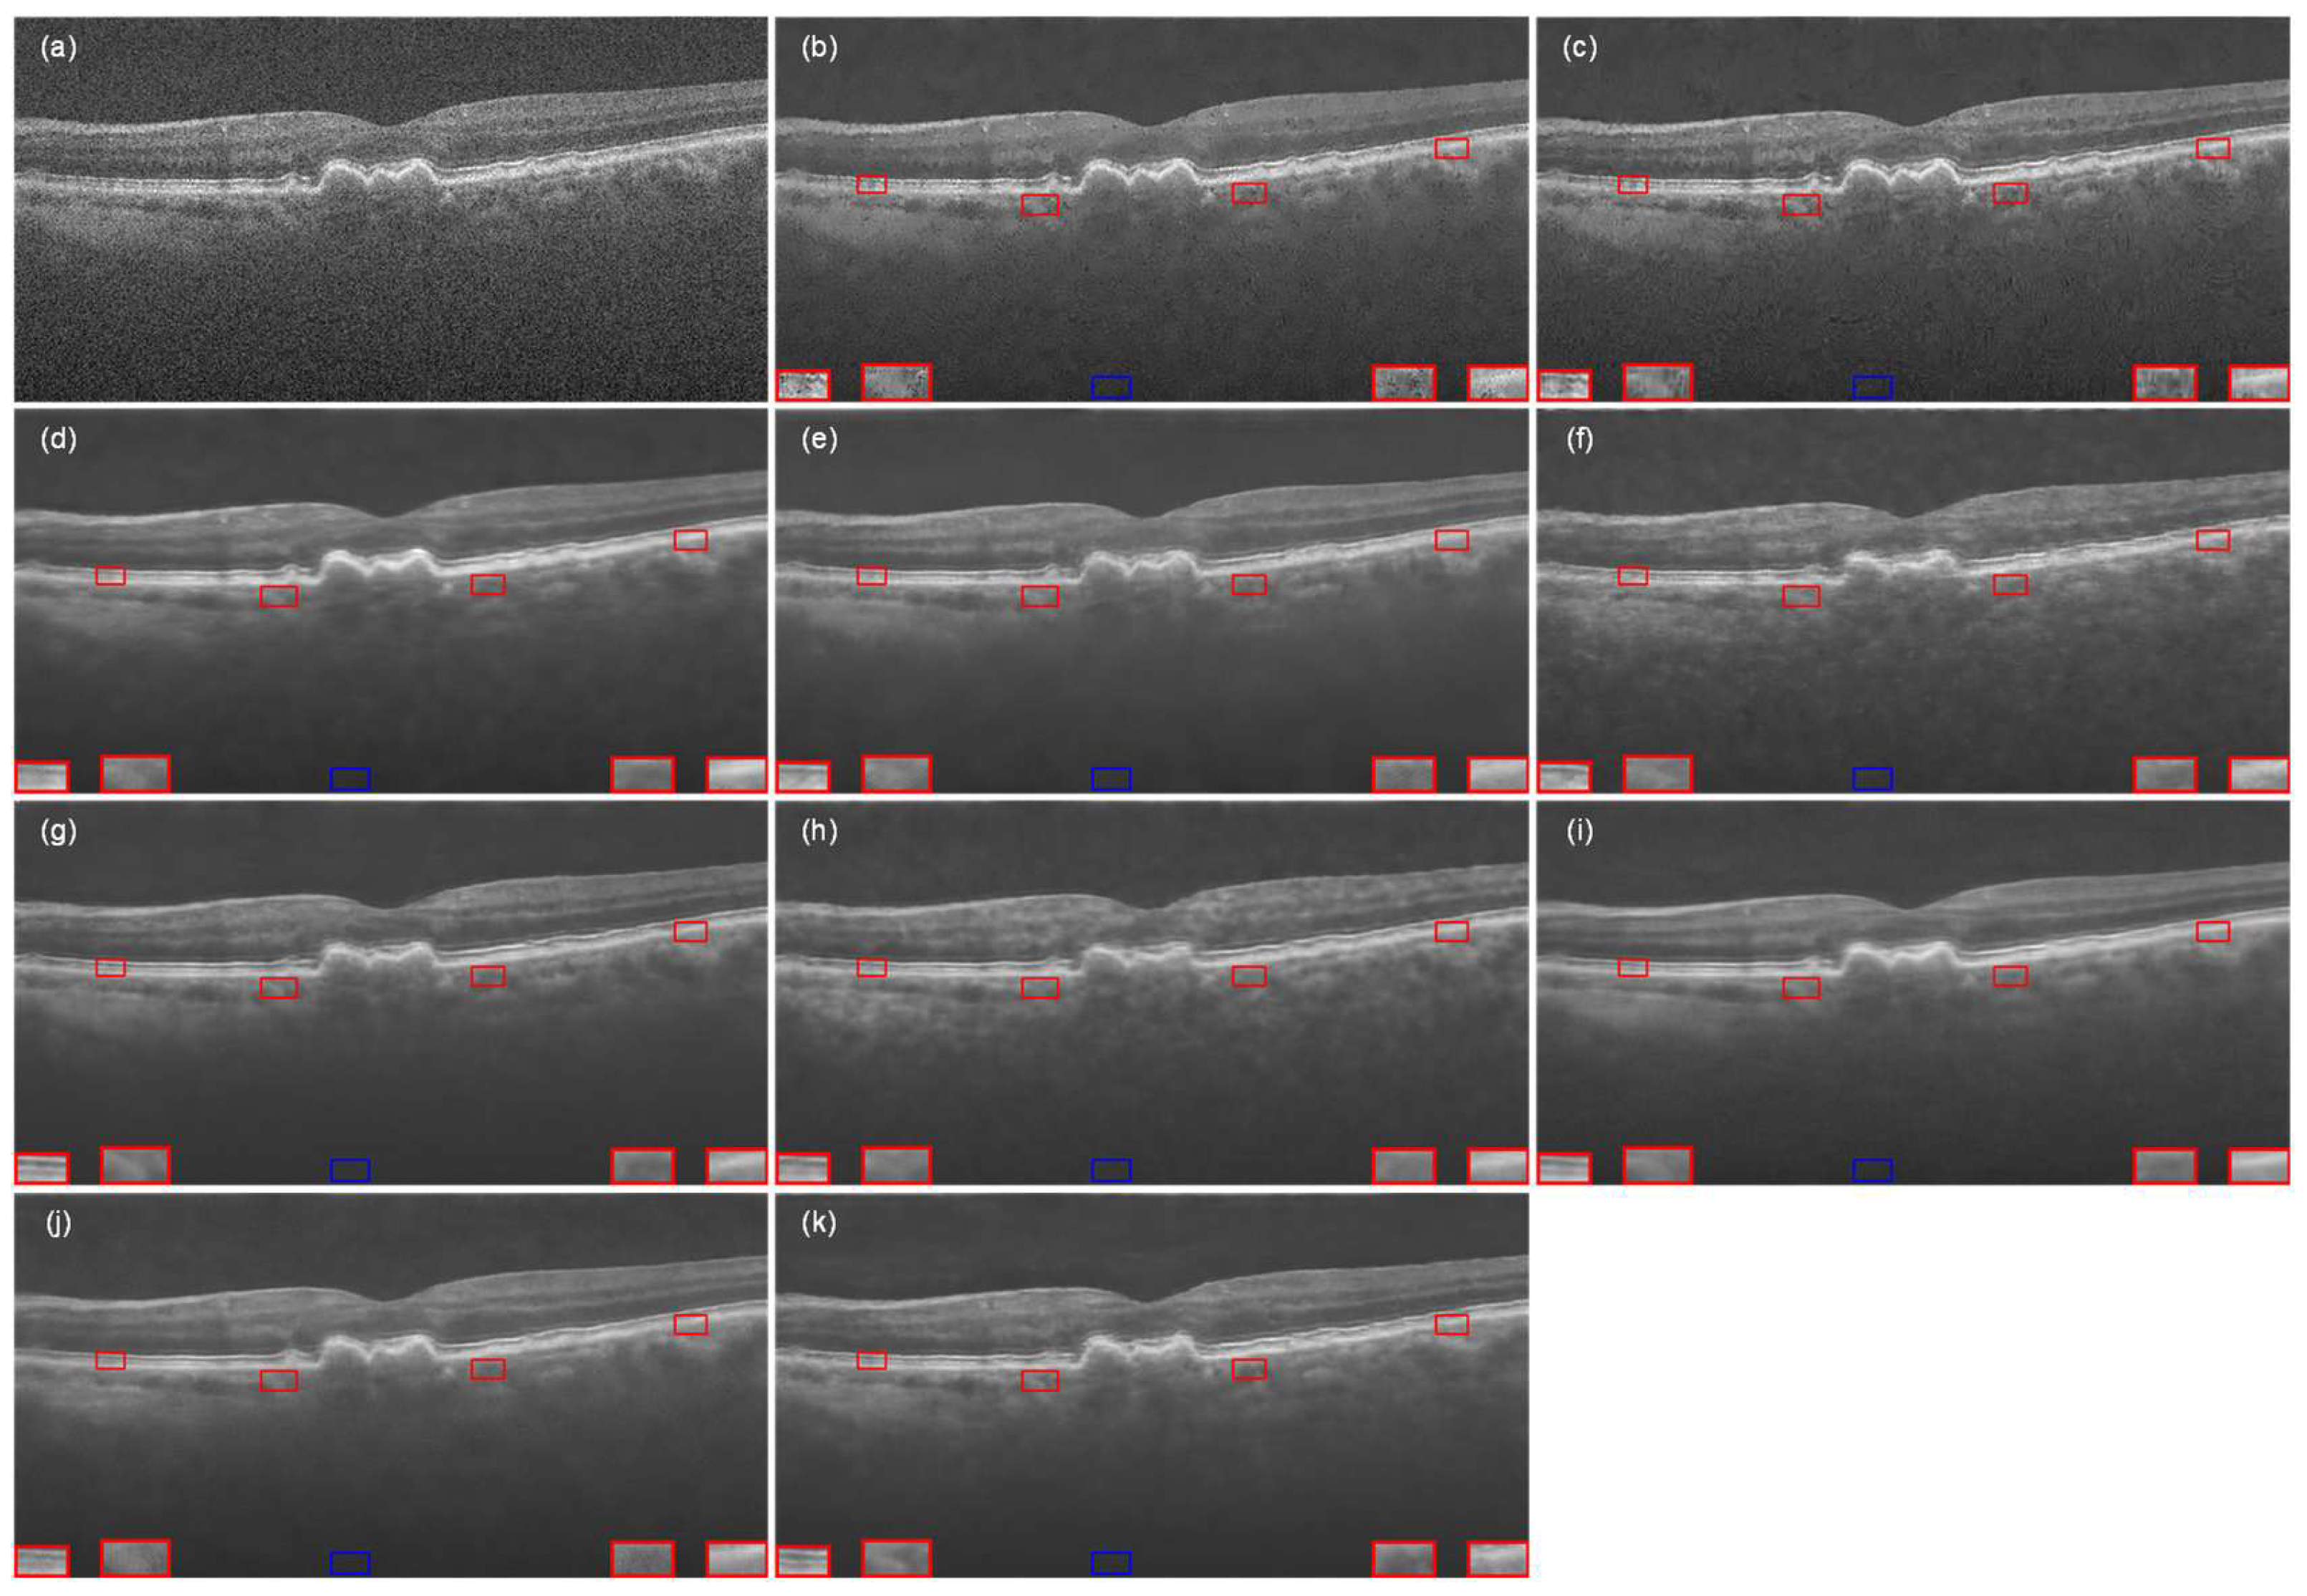
To further evaluate the generalizability of our model, we performed the same series of experiments on Data-2. Figure 9 shows the experimental results for the comparison of the visual effects after denoising, which are basically in line with the previous performance on Data-1. It is obvious from the images that NLM (Figure 9c) and BM3D (Figure 9d) still performed poorly in denoising, and the deep learning-based denoising methods provided good visual improvement but still had some problems in retaining the structural information and removing the scatter noise well. MFFA-GAN (Figure 9l) performed well in reducing the scatter noise, and at the same time, it succeeded in retaining the rich and fine features of the retinal structure. The laminar structure of the retina was clearly visible throughout the ROI examination.

Figure 9.
The OCT retinal image from Data-2 that was processed by different denoising methods: (a) noisy image, (b) ground-truth image, (c) NLM, (d) BM3D, (e) DnCNN, (f) SDSR-OCT, (g) DudeNet, (h) MDGAN, (i) MDRGAN, (j) DCANet, (k) DRANet, and (l) MFFA-GAN. The blue square represents the background area, and the red square represents the signal area.
The performance of MFFA-GAN in Data-2, which included normal eyes and early non-neovascular age-related macular degeneration (AMD) retinas, is demonstrated by the quantitative evaluation results of ten different denoising techniques on 24 OCT images, as shown in Table 2. Compared with the traditional BM3D method, MFFA-GAN achieved a significant improvement of about 1.6 dB in PSNR and also performed well in the SSIM metric, which is a measure of image structural similarity. Specifically, the model achieved 4.137 and 629.303 in CNR (contrast-to-noise ratio) and ENL (equivalent number of visual lines), respectively, which are the key diagnostic indicators of subtle vitreous warts and retinal pigment epithelium (RPE) irregularities in the early stage of AMD. A high CNR effectively enhances the visibility of hypo-reflective vitreous warts in the context of the RPE, and the feature of CNR in the NLM (CNR) is also well recognized in the NLM (NLM). This feature is often masked by noise interference in conventional methods, such as NLM (CNR = 2.413) and BM3D (CNR = 2.926). In addition, the model avoided excessive smoothing of the retinal layers by balancing the ENL values, allowing for the retention of key microstructural details, which are important diagnostic features in the pre-AMD stage. It can be seen that MFFA-GAN effectively removed the speckle noise from OCT images while retaining the edge details and overall structural information of the images. The overall performance of MFFA-GAN was better than that of other schemes in the processing of OCT images in Data-2.
Table 2.
Performance comparison of different methods on Data-2.
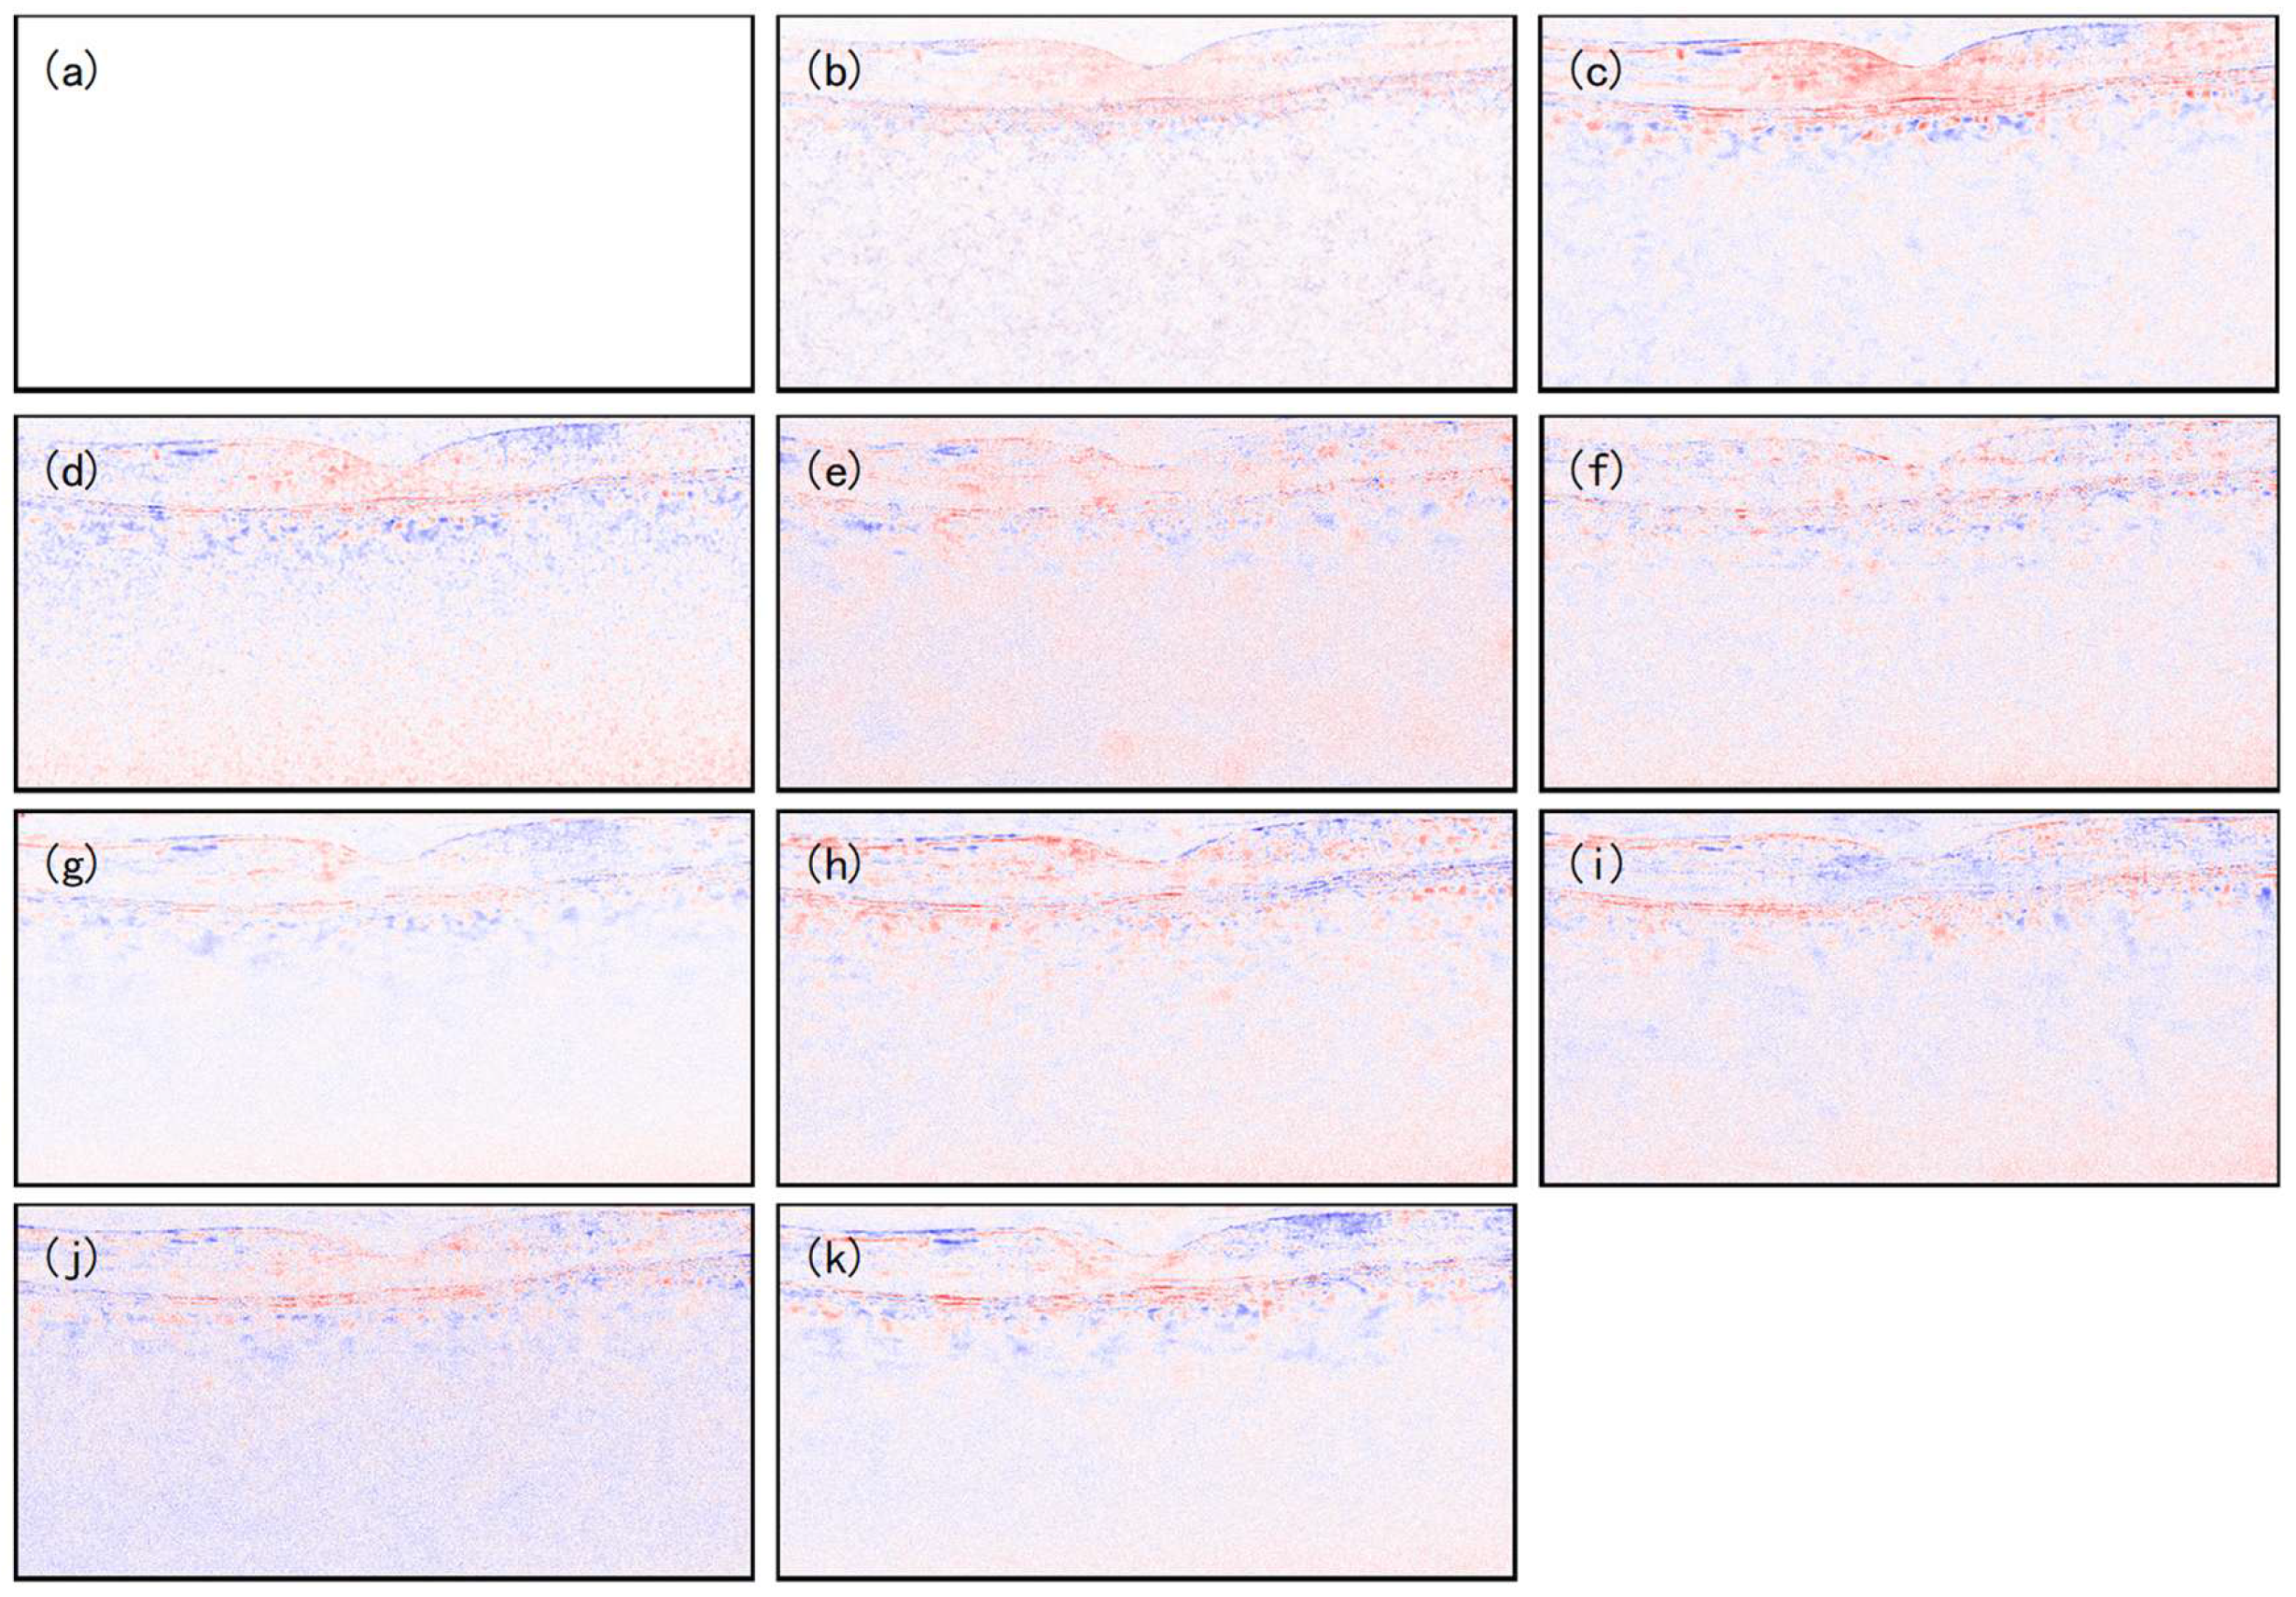
As shown in Figure 10, in the error heatmap of Data-2, the MFFA-GAN (Figure 10k) presents more white color in core intermediate diagnostic regions, such as the retinal layer, which corresponds to the quantitative dominance of CNR and ENL. However, there were some errors at the boundary of k, reflecting the results of the model’s trade-off between global noise suppression and local structural fidelity. Overall, MFFA-GAN effectively improved the diagnostic accuracy of retinopathy by focusing on the high-fidelity denoising of the core diagnostic region, enhancing the interpretability of the results and providing a direction for subsequent optimization.
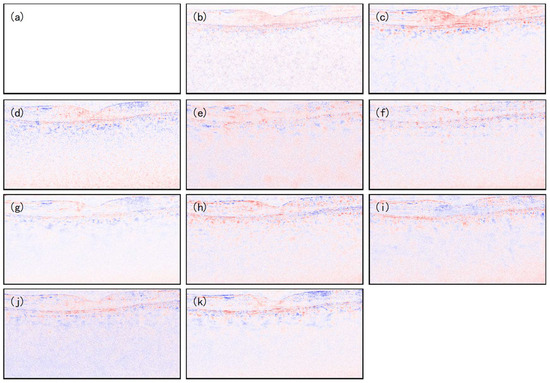
Figure 10.
Pixel error map of denoised images and real image: (a) reference, (b) NLM, (c) BM3D, (d) DnCNN, (e) SDSR-OCT, (f) DudeNet, (g) MDGAN, (h) MDRGAN, (i) DCANet, (j) DRANet, and (k) MFFA-GAN.
4.3. Experiment with the Data-3
For the Data-3 dataset without real reference images, visually, MFFA-GAN retained the ability for retinal layered structures and the choroidal system (Figure 10k), which is crucial for diagnosing cases such as initial centralized plasma choroidal retinopathy or subtle choroidal neovascularization. Conventional methods, such as NLM, left residual speckle noise (Figure 11b,c), while deep learning models, such as DCANet, introduced local blurring. In contrast, the multilevel feature fusion of MFFA-GAN preserved fine details, which is crucial for distinguishing normal changes from early pathological changes.
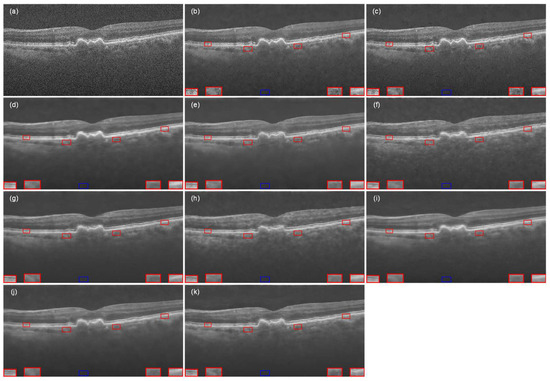
Figure 11.
The OCT retinal image from Data-3 processed by different denoising methods: (a) ground-truth image, (b) NLM, (c) BM3D, (d) DnCNN, (e) SDSR-OCT, (f) DudeNet, (g)MDGAN, (h) MDRGAN, (i) DCANet, (j) DRANet, and (k) MFFA-GAN. The blue square represents the background area, and the red square represents the signal area.
The visual analysis conclusions are further supported by the ENL and CNR metrics in Table 3. MFFA-GAN achieved a balanced optimization of noise suppression and structure preservation with the highest ENL value (674.836) and better CNR value (5.208). The lower ENL and CNR values (ENL: 26.389–54.281; CNR: 2.762–3.401) of the traditional methods verify their limitations in complex noise scenarios. Among the deep learning models, DCANet had the highest CNR value (5.526), but its ENL (595.731) was 11.7% lower than that of MFFA-GAN, reflecting that it introduced localized noise residuals in contrast enhancement; however, although DRANet had a higher CNR value (5.141), its ENL (222.046) was only 32.9%, indicating that its noise suppression ability was insufficient. The performance of MFFA-GAN confirms that this method demonstrates reliable generalization ability in clinical scenarios without reference images, providing a high-quality image basis for OCT diagnosis.
Table 3.
Performance comparison with different methods on Data-3.
4.4. Ablation Study
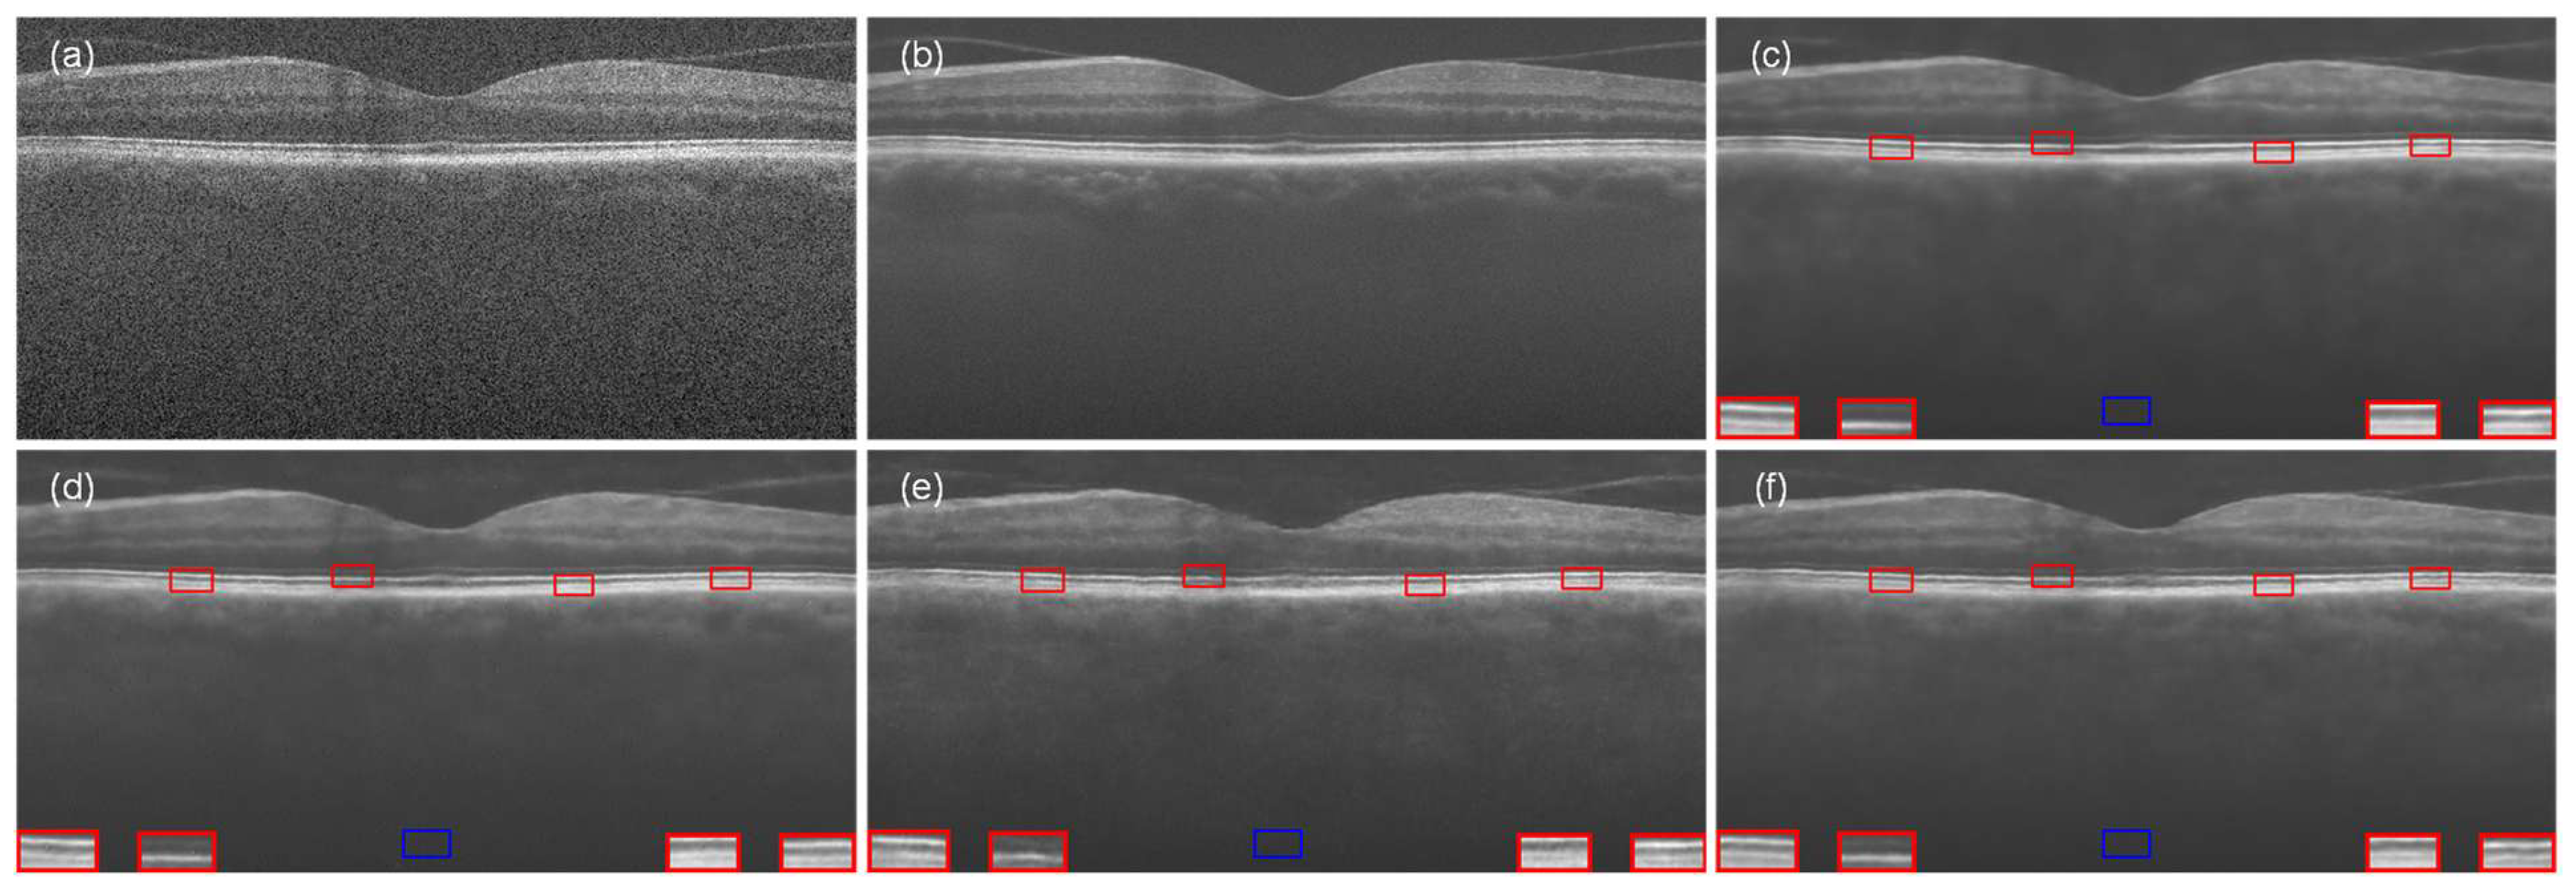
To verify the effects of multi-level feature fusion module and attention mechanism on the performance of MFFA-GAN, this study constructed a comparative analysis framework based on structural variants. Three sets of controlled experiments were designed through an incremental component stacking strategy: the first phase of experiments used the general U-net module (Without ELA + DRB); the second phase improved the model performance by targeting the encoder network improvement and using only the ELA attention mechanism to enhance the feature representations of the local regions (Without DRB); and in the third phase, three dense residual blocks were added to the encoding paths to validate the effectiveness of deep-level feature extraction (Without ELA). Other network parameters were unchanged in each experimental stage, and the effectiveness of each component in improving the quality of OCT image denoising was systematically evaluated through qualitative visual comparisons and quantitative metrics. The visual effect of the ablation experiment is presented in Figure 12.
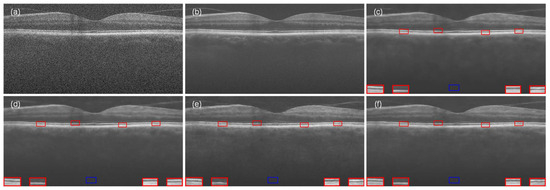
Figure 12.
MFFA-GAN ablation study. (a) Noisy image, (b) ground-truth image, (c) Without ELA + DRB, (d) Without DRB, (e) Without ELA, and (f) MFFA-GAN. The blue square represents the background area, and the red square represents the signal area.
The quantitative results of the ablation experiments are shown in Table 4, where MFFA-GAN demonstrates comprehensive advantages in OCT retinal image noise reduction. Compared with other ablation configurations, the full model showed improvements in PSNR (29.117) over the “Without ELA + DRB” (28.741), “Without DRB” (28.508), and “Without ELA” (28.752) by 1.3%, 2.1%, and 1.2%, respectively. It also showed improvements in SSIM (0.679) by 1.5%, 8.1%, and 3.8% over the comparison group (0.669, 0.628, and 0.654). It especially performed well in the key noise suppression metric ENL. The ENL value of MFFA-GAN reached 1234.055, which was 64.1%, 452.2%, and 61.6% higher than that of “Without ELA + DRB” (751.870), “Without DRB” (223.460), and “Without ELA” (763.653), which fully verifies the synergistic effect of the joint optimization on image uniformity. In addition, the CNR was increased to 4.425, which was higher than the other configurations (4.112, 3.9236, and 4.269), indicating that this method can effectively retain the peripapillary structure of the retina images while suppressing the speckle noise, which provides a higher-fidelity image base for clinical diagnosis.
Table 4.
Performance comparison of different methods on ablation experiment.
5. Discussion
5.1. Limitations
To address the potential data leakage of the patch-based training strategy during training, in this paper, although the training and test images were separated, the small step size (30 pixels) of patch extraction may have resulted in a large amount of pixel information being shared by neighboring patches of the same training image. This spatial correlation may have caused the model to learn local patch-specific features rather than generalized structures, thus requiring future exploration of non-overlapping or 3D patch sampling strategies.
It should be noted that while MFFA-GAN achieved balanced ENL and CNR metrics, there was still a fundamental trade-off between noise suppression (quantified by ENL) and detail retention (quantified by CNR). For example, in homogeneous retinal regions, higher ENL values indicate excellent noise reduction, but tend to slightly blur fine textures; while higher CNR values also leave speckles in low-contrast regions. This trade-off is inherent to OCT denoising, and adaptive weighting strategies that prioritize region-specific diagnostic needs of different OCT devices need to be prioritized in future models.
In this paper, a two-way splitting strategy of eight images (cut into 3888 patches of 256 × 256 pixels) as the training set and three complete images as the test set was adopted in data processing, which was mainly limited by the constraints of the smaller dataset size. To mitigate the risk associated with the missing validation set, this paper strengthens the illustration of generalization ability through two approaches: the training phase used dense sliding window slicing to expose the model to diverse local features, and the testing phase was evaluated with complete images to ensure that the inputs did not overlap with the training data. Meanwhile, a weight-screening approach was introduced, where generator weights were saved every 10 epochs, and the optimal model was selected based on the performance metrics of the test set and the visualization effect. To address this limitation, future research will adopt different optimization strategies, including expanding the training dataset and implementing standard three-way splitting to ensure the strict separation of hyper-parameter tuning and final evaluation; and for small-dataset research scenarios, adopting 5-fold cross-validation to improve the reliability of parameter optimization through cyclic validation. Although the current scheme was limited by the data size, the overfitting risk was maximally controlled under the existing conditions through the slicing enhancement and multi-dimensional result validation, and the conclusions of the study still have credibility. The follow-up work will prioritize the improvement of the data validation process and enhance the reliability of the OCT denoising method through more rigorous experimental design.
5.2. Ethical Considerations in Clinical Imaging
This paper used three open-source OCT datasets whose raw data were reviewed by an institutional review board (IRB) and all images were de-identified. The data are shared on open-source websites while avoiding the leakage of sensitive patient information. We validated the model generalization ability on three independent datasets, and in addition to comparing the PSNR and SSIM metrics, we added ENL and CNR metrics to demonstrate the effectiveness of the model in complex noise scenarios. Meanwhile, noise suppression may have masked the risk of early lesions, leading to the smoothing of some structural details. In the future, we will consider introducing clinical expert review, establishing ROC curves to quantify the misdiagnosis risk thresholds, and updating the model regularly to adapt to new noise patterns.
6. Conclusions
In this work, we propose a generative adversarial network (MFFA-GAN) that integrates multilevel features with attentional mechanisms to effectively suppress speckle noise in OCT images while preserving retinal microstructures by designing cross-layer feature enhancement modules with dynamic channel weighting strategies. Experiments on three public datasets show that MFFA-GAN outperformed existing methods in objective metrics such as PSNR, SSIM, CNR, and ENL, and especially exhibited good generalization ability in complex noise environment. The ablation experiments confirm the key role of multilevel feature fusion and the attention mechanism for performance improvement. The model provides a better solution for high-fidelity OCT denoising by preserving microstructural details and suppressing speckle noise, enhancing the visibility of key diagnostic features in early and junctional retinopathy that are often missed by other methods, which is valuable in clinical scenarios where early intervention can change the progression of the disease. Although further validation on larger multicenter datasets is needed, its performance demonstrates that MFFA-GAN has the potential to be a tool to enhance OCT-based diagnostic workflows, and its applicability to larger datasets and computational efficiency will be explored in the future to meet real-time clinical needs.
Author Contributions
Conception and design of the study, Y.Q. and Y.M.; software, Y.Q.; original draft, Y.Q.; review and editing, Y.Q. and Y.M.; grammar editing, Y.Q. and Y.M.; supervision, Y.M. All authors have read and agreed to the published version of the manuscript.
Funding
This research received no external funding.
Institutional Review Board Statement
Not applicable.
Informed Consent Statement
Informed consent was obtained from all subjects involved in the study.
Data Availability Statement
The datasets analyzed in this study can be obtained from References [40,41,42]. The code used in this paper is not currently publicly available, but can be obtained from the authors upon reasonable request.
Acknowledgments
We thank the Key Laboratory of Specialty Fiber Optics and Optical Access Networks at the Joint International Research Laboratory of Specialty Fiber Optics and Advanced Communication for its support.
Conflicts of Interest
The authors declare no conflicts of interest.
References
- Huang, D.; Swanson, E.A.; Lin, C.P.; Schuman, J.S.; Stinson, W.G.; Chang, W.; Hee, M.R.; Flotte, T.; Gregory, K.; Puliafito, C.A.; et al. Optical coherence tomography. Science 1991, 254, 1178–1181. [Google Scholar] [CrossRef] [PubMed]
- Sakata, L.M.; Sakata, V.; DeLeon-Ortega, J.; A Girkin, C. Optical coherence tomography of the retina and optic nerve—A review. Clin. Exp. Ophthalmol. 2009, 37, 90–99. [Google Scholar] [CrossRef] [PubMed]
- Hepburn, M.S.; Foo, K.Y.; Wijesinghe, P.; Munro, P.R.T.; Chin, L.; Kennedy, B.F. Speckle-dependent accuracy in phase-sensitive optical coherence tomography. Opt. Express 2021, 29, 16950–16968. [Google Scholar] [CrossRef]
- Zhao, J.; Winetraub, Y.; Yuan, E.; Chan, W.H.; Aasi, S.Z.; Sarin, K.Y.; de la Zerda, A. Angular compounding for speckle reduction in optical coherence tomography using geometric image registration algorithm and digital focusing. Sci. Rep. 2020, 10, 1893. [Google Scholar] [CrossRef]
- Pircher, M.; Götzinger, E.; Leitgeb, R.A.; Fercher, A.F.; Hitzenberger, C.K. Speckle reduction in optical coherence tomography by frequency compounding. J. Biomed. Opt. 2003, 8, 565–569. [Google Scholar] [CrossRef]
- Wang, H.; Rollins, A.M. Speckle reduction in optical coherence tomography using angular compounding by B-scan Doppler-shift encoding. J. Biomed. Opt. 2009, 14, 030512. [Google Scholar] [CrossRef]
- Pircher, M.; Goetzinger, E.; Leitgeb, R.; Hitzenberger, C.K. Three dimensional polarization sensitive OCT of human skin in vivo. Opt. Express 2004, 12, 3236–3244. [Google Scholar] [CrossRef]
- Wong, A.; Mishra, A.; Bizheva, K.; Clausi, D.A. General Bayesian estimation for speckle noise reduction in optical coherence tomography retinal imagery. Opt. Express 2010, 18, 8338–8352. [Google Scholar] [CrossRef] [PubMed]
- Aum, J.; Kim, J.-H.; Jeong, J. Effective speckle noise suppression in optical coherence tomography images using nonlocal means denoising filter with double Gaussian anisotropic kernels. Appl. Opt. 2015, 54, D43–D50. [Google Scholar] [CrossRef]
- Chong, B.; Zhu, Y.-K. Speckle reduction in optical coherence tomography images of human finger skin by wavelet modified BM3D filter. Opt. Commun. 2013, 291, 461–469. [Google Scholar] [CrossRef]
- Li, Z.; Liu, F.; Yang, W.; Peng, S.; Zhou, J. A survey of convolutional neural networks: Analysis, applications, and prospects. IEEE Trans. Neural Netw. Learn. Syst. 2021, 33, 6999–7019. [Google Scholar] [CrossRef] [PubMed]
- Chen, Y.; Mancini, M.; Zhu, X.; Akata, Z. Semi-supervised and unsupervised deep visual learning: A survey. IEEE Trans. Pattern Anal. Mach. Intell. 2022, 46, 1327–1347. [Google Scholar] [CrossRef] [PubMed]
- Gisbert, G.; Dey, N.; Ishikawa, H.; Schuman, J.; Fishbaugh, J.; Gerig, G. Improved denoising of optical coherence tomography via repeated acquisitions and unsupervised deep learning. Investig. Ophthalmol. Vis. Sci. 2020, 61, PB0035. [Google Scholar]
- Huang, Y.; Zhang, N.; Hao, Q. Real-time noise reduction based on ground truth free deep learning for optical coherence tomography. Biomed. Opt. Express 2021, 12, 2027–2040. [Google Scholar] [CrossRef]
- Wu, Y.; He, W.; Eschweiler, D.; Dou, N.; Fan, Z.; Mi, S.; Walter, P.; Stegmaier, J. Retinal OCT Synthesis with Denoising Diffusion Probabilistic Models for Layer Segmentation. In Proceedings of the 2024 IEEE International Symposium on Biomedical Imaging (ISBI), Athens, Greece, 27–30 May 2024; pp. 1–5. [Google Scholar]
- Li, S.; Azam, M.A.; Gunalan, A.; Mattos, L.S. One-Step Enhancer: Deblurring and Denoising of OCT Images. Appl. Sci. 2022, 12, 10092. [Google Scholar] [CrossRef]
- Zhang, K.; Zuo, W.; Chen, Y.; Meng, D.; Zhang, L. Beyond a Gaussian Denoiser: Residual Learning of Deep CNN for Image Denoising. IEEE Trans. Image Process. 2017, 26, 3142–3155. [Google Scholar] [CrossRef]
- Huang, Y.; Lu, Z.; Shao, Z.; Ran, M.; Zhou, J.; Fang, L.; Zhang, Y. Simultaneous denoising and super-resolution of optical coherence tomography images based on generative adversarial network. Opt. Express 2019, 27, 12289–12307. [Google Scholar] [CrossRef]
- Tian, C.; Xu, Y.; Zuo, W.; Du, B.; Lin, C.-W.; Zhang, D. Designing and training of a dual CNN for image denoising. Knowledge-Based Syst. 2021, 226, 106949. [Google Scholar] [CrossRef]
- Yu, X.; Ge, C.; Li, M.; Aziz, M.Z.; Mo, J.; Fan, Z. Multiscale denoising generative adversarial network for speckle reduction in optical coherence tomography images. J. Med. Imaging 2023, 10, 024006. [Google Scholar] [CrossRef]
- Yu, X.; Li, M.; Ge, C.; Shum, P.P.; Chen, J.; Liu, L. A generative adversarial network with multi-scale convolution and dilated convolution res-network for OCT retinal image despeckling. Biomed. Signal Process. Control 2023, 80, 104231. [Google Scholar] [CrossRef]
- Wu, W.; Liu, S.; Xia, Y.; Zhang, Y. Dual residual attention network for image denoising. Pattern Recognit. 2024, 149, 110291. [Google Scholar] [CrossRef]
- Wu, W.; Lv, G.; Duan, Y.; Liang, P.; Zhang, Y. Dual convolutional neural network with attention for image blind denoising. Multimedia Syst. 2024, 30, 263. [Google Scholar] [CrossRef]
- Chintada, B.R.; Ruiz-Lopera, S.; Restrepo, R.; Bouma, B.E.; Villiger, M.; Uribe-Patarroyo, N. Probabilistic volumetric speckle suppression in OCT using deep learning. Biomed. Opt. Express 2024, 15, 4453–4469. [Google Scholar] [CrossRef] [PubMed]
- Yang, L.; Wu, D.; Gao, W.; Xu, R.X.; Sun, M. Physics-Based Practical Speckle Noise Modeling for Optical Coherence Tomography Image Denoising. Photonics 2024, 11, 569. [Google Scholar] [CrossRef]
- Goodfellow, I.; Pouget-Abadie, J.; Mirza, M.; Xu, B.; Warde-Farley, D.; Ozair, S.; Courville, A.; Bengio, Y. Generative adversarial networks. Commun. ACM 2020, 63, 139–144. [Google Scholar] [CrossRef]
- Chen, J.; Chen, J.; Chao, H.; Yang, M. Image Blind Denoising with Generative Adversarial Network Based Noise Modeling. In Proceedings of the 2018 IEEE/CVF Conference on Computer Vision and Pattern Recognition (CVPR), Salt Lake City, UT, USA, 18–23 June 2018; pp. 3155–3164. [Google Scholar]
- Xun, S.; Li, D.; Zhu, H.; Chen, M.; Wang, J.; Li, J.; Chen, M.; Wu, B.; Zhang, H.; Chai, X.; et al. Generative adversarial networks in medical image segmentation: A review. Comput. Biol. Med. 2022, 140, 105063. [Google Scholar] [CrossRef]
- He, X.; Fang, L.; Rabbani, H.; Chen, X.; Liu, Z. Retinal optical coherence tomography image classification with label smoothing generative adversarial network. Neurocomputing 2020, 405, 37–47. [Google Scholar] [CrossRef]
- Ledig, C.; Theis, L.; Huszár, F.; Caballero, J.; Cunningham, A.; Acosta, A.; Aitken, A.P.; Tejani, A.; Totz, J.; Wang, Z.; et al. Photo-Realistic Single Image Super-Resolution Using a Generative Adversarial Network. In Proceedings of the 2017 IEEE Conference on Computer Vision and Pattern Recognition (CVPR), Honolulu, HI, USA, 21–26 July 2017. [Google Scholar]
- Ronneberger, O.; Fischer, P.; Brox, T. U-net: Convolutional networks for biomedical image segmentation. In Medical Image Computing and Computer-Assisted Intervention–MICCAI 2015: 18th International Conference, Munich, Germany, 5–9 October 2015; Proceedings, Part III 18; Springer: Berlin/Heidelberg, Germany, 2015. [Google Scholar]
- Isola, P.; Zhu, J.-Y.; Zhou, T.; Efros, A.A. Image-to-image translation with conditional adversarial networks. arXiv 2017, arXiv:1611.07004. [Google Scholar]
- Zhang, Y.; Tian, Y.; Kong, Y.; Zhong, B.; Fu, Y. Residual dense network for image super-resolution. arXiv 2018, arXiv:1802.08797. [Google Scholar]
- Musunuri, Y.R.; Kwon, O.-S. Deep Residual Dense Network for Single Image Super-Resolution. Electronics 2021, 10, 555. [Google Scholar] [CrossRef]
- Garbin, C.; Zhu, X.; Marques, O. Dropout vs. batch normalization: An empirical study of their impact to deep learning. Multimed. Tools Appl. 2020, 79, 12777–12815. [Google Scholar] [CrossRef]
- Daubechies, I.; DeVore, R.; Foucart, S.; Hanin, B.; Petrova, G. Nonlinear approximation and (deep) ReLU networks. Constr. Approx. 2022, 55, 127–172. [Google Scholar] [CrossRef]
- Xu, W.; Yi, W. ELA: Efficient local attention for deep convolutional neural networks. arXiv 2024, arXiv:2403.01123. [Google Scholar]
- Shahdoosti, H.R.; Rahemi, Z. Edge-preserving image denoising using a deep convolutional neural network. Signal Process. 2019, 159, 20–32. [Google Scholar] [CrossRef]
- Simonyan, K.; Zisserman, A. Very deep convolutional networks for large-scale image recognition. arXiv 2014, arXiv:1409.1556. [Google Scholar]
- Fang, L.; Li, S.; Nie, Q.; Izatt, J.A.; Toth, C.A.; Farsiu, S. Sparsity based denoising of spectral domain optical coherence tomography images. Biomed. Opt. Express 2012, 3, 927–942. [Google Scholar] [CrossRef]
- Fang, L.; Li, S.; McNabb, R.P.; Nie, Q.; Kuo, A.N.; Toth, C.A.; Izatt, J.A.; Farsiu, S. Fast Acquisition and Reconstruction of Optical Coherence Tomography Images via Sparse Representation. IEEE Trans. Med. Imaging 2013, 32, 2034–2049. [Google Scholar] [CrossRef]
- Chiu, S.J.; Izatt, J.A.; O’Connell, R.V.; Winter, K.P.; Toth, C.A.; Farsiu, S. Validated Automatic Segmentation of AMD Pathology Including Drusen and Geographic Atrophy in SD-OCT Images. Investig. Opthalmol. Vis. Sci. 2012, 53, 53–61. [Google Scholar] [CrossRef]


Disclaimer/Publisher’s Note: The statements, opinions and data contained in all publications are solely those of the individual author(s) and contributor(s) and not of MDPI and/or the editor(s). MDPI and/or the editor(s) disclaim responsibility for any injury to people or property resulting from any ideas, methods, instructions or products referred to in the content. |
© 2025 by the authors. Licensee MDPI, Basel, Switzerland. This article is an open access article distributed under the terms and conditions of the Creative Commons Attribution (CC BY) license (https://creativecommons.org/licenses/by/4.0/).