Abstract
In order to study the effect of random pitting defects on the bearing capacity of steel structures in underground engineering, four kinds of samples containing random pitting defects were made and simulated damage tests were carried out. The effects of pitting damage on the failure mode, bearing capacity and deformation capacity of the components were analyzed by compression testing and three-point bending testing of the complete samples and four kinds of prefabricated pitting damage samples. The results show that the existence of pitting damage will change the bending failure mode of the samples, and the four types of pitting damage will reduce the compressive bearing capacity and bending bearing capacity of the members to varying degrees, among which the inclined pitting damage specimens have the highest reduction in compressive and bending bearing capacity. The four types of pitting damage also reduce the compressive deformation ability of the specimen, but the influence of different damage distribution types on the bending deformation ability is very different.
1. Introduction
Steel structures are widely used in building engineering, bridge engineering and underground engineering. The support structures of most tunnels in the world are mainly composed of concrete and steel arch frames. However, with the increase in service time, micro-cracks, micro-holes, shear bands, and other mesoscopic damage in the steel structures of underground engineering will emerge, converge, and expand under the cyclic action of loads, thus causing the dynamic evolution of damage and further affecting the performance of steel structures. For underground steel structures that have been in service for a long time, surface corrosion is one of the prominent damage phenomena [1]. Corrosion will form pits of different depths, widths and densities on structure surfaces; the distribution formats of the damage are also different [1]. Therefore, it is an urgent task to conduct the reliable safety assessment of corroded underground steel structures and master the degradation law of mechanical properties after material corrosion damage.
The pitting damage of steel structures has been studied by many scholars. Kong et al. [2] conducted a comparative analysis of the changes in mechanical properties of two types of steel, Q235 and Q355, under salt spray-accelerated corrosion conditions, and established a prediction model for the mechanical properties of Q235 affected by corrosion. Keguo Sun et al. [3,4] studied the mechanical behaviors of steel structures of different sizes and shapes based on numerical simulation methods, and verified them through model tests and BP neural networks. Nie et al. [5] conducted a corrosion study on C-shaped steel short columns and found that corrosion reduced the thickness of the short columns, and the reduction coefficient of the yield strength and ultimate strength also decreased, showing a linear relationship. Hao Zheng et al. [6] conducted a systematic study on the impact of the acid rain environment on the seismic performance of reinforced concrete columns. They analyzed the seismic performance of column specimens from multiple perspectives, including visual damage, failure mode, hysteretic performance, bearing capacity, deformation capacity, stiffness degradation, and energy dissipation performance. The experimental results indicated that for specimens with the same stirrup ratio, as the corrosion degree increased, the bearing capacity, deformation capacity, stiffness, and energy dissipation capacity gradually decreased. Roman Vorobel et al. [7] developed a parameterized Retinex for image preprocessing. By means of adaptive segmentation, they were able to detect rust on the image, thereby enhancing the reliability of corrosion area segmentation. Meanwhile, they [8] also proposed a method for quantitatively evaluating the fracture characteristics resulting from the delamination of inclusions from the matrix. This method was based on the analysis and computer processing of scanning electron microscope images and could be employed to assess the degree of damage to weld metal at the microscopic level of operational damage. Tatsuro et al. [9] investigated the influence of pitting corrosion on the tensile strength of plate members. The results indicated that the loss of thickness due to pitting corrosion weakened the tensile strength and total elongation of the plate. Wang et al. [10] found through their research that the randomness of pitting corrosion was the main factor causing the reduction and variation in the tensile strength of specimens. If this randomness was not taken into account, the yield strength and ultimate strength of corroded steel were overestimated by 13.8% and 29.9%, respectively. Zhao et al. [11,12] revealed the impact of random pitting corrosion on the local bearing capacity of H-shaped steel beam webs and analyzed the influence of specific corrosion locations and random corrosion locations on the local bearing capacity of the webs. Zhang et al. [13] proposed a relationship model between the extreme value of pitting depth and time based on experimental data. Woloszyk et al. [14,15] demonstrated by using the random field method that among various types of corrosion, single-sided corrosion is the most harmful, and the surface irregularity of the corroded plate is the main reason for the decline in its mechanical properties. Tohidi et al. [16] conducted an in-depth study on the residual load-bearing capacity of H-shaped steel after corrosion. Through parametric simulation and calculation analysis, they found that the nonlinear finite element method can provide highly accurate predictions when dealing with such corrosion problems. Belachew et al. [17] explored the influence of the depth of corrosion defects, as well as the circumferential and longitudinal extents of corrosion, on the failure pressure of pipelines using the nonlinear finite element method. Kuppusamy et al. [18] investigated the effect of interacting corrosion defects of the same depth on the local buckling strength of X46 pipelines. The analysis revealed that the interaction of corrosion defects led to a reduction in the overall buckling strength of the pipeline.
At present, studies on the corrosion of steel structures are mainly concentrated on the field of materials, and the effects of random pitting on components and structures are less frequently studied [19]. In order to study the influence of random pitting on the bearing performance of underground steel structures, samples with random pitting damage defects were designed and made in this paper, and compression and three-point bending tests were carried out to analyze the influence of pitting damage on the failure mode, bearing capacity and deformation capacity of the steel structure. By examining the influence of different corrosion damage types on the bearing capacity of the I-beam members under compression and three-point bending, the law of the influence of pitting corrosion damage on the bearing capacity of steel structure is explored in order to provide theoretical support for evaluating the durability and reliability of the underground steel structure.
2. Random Pitting Damage Model
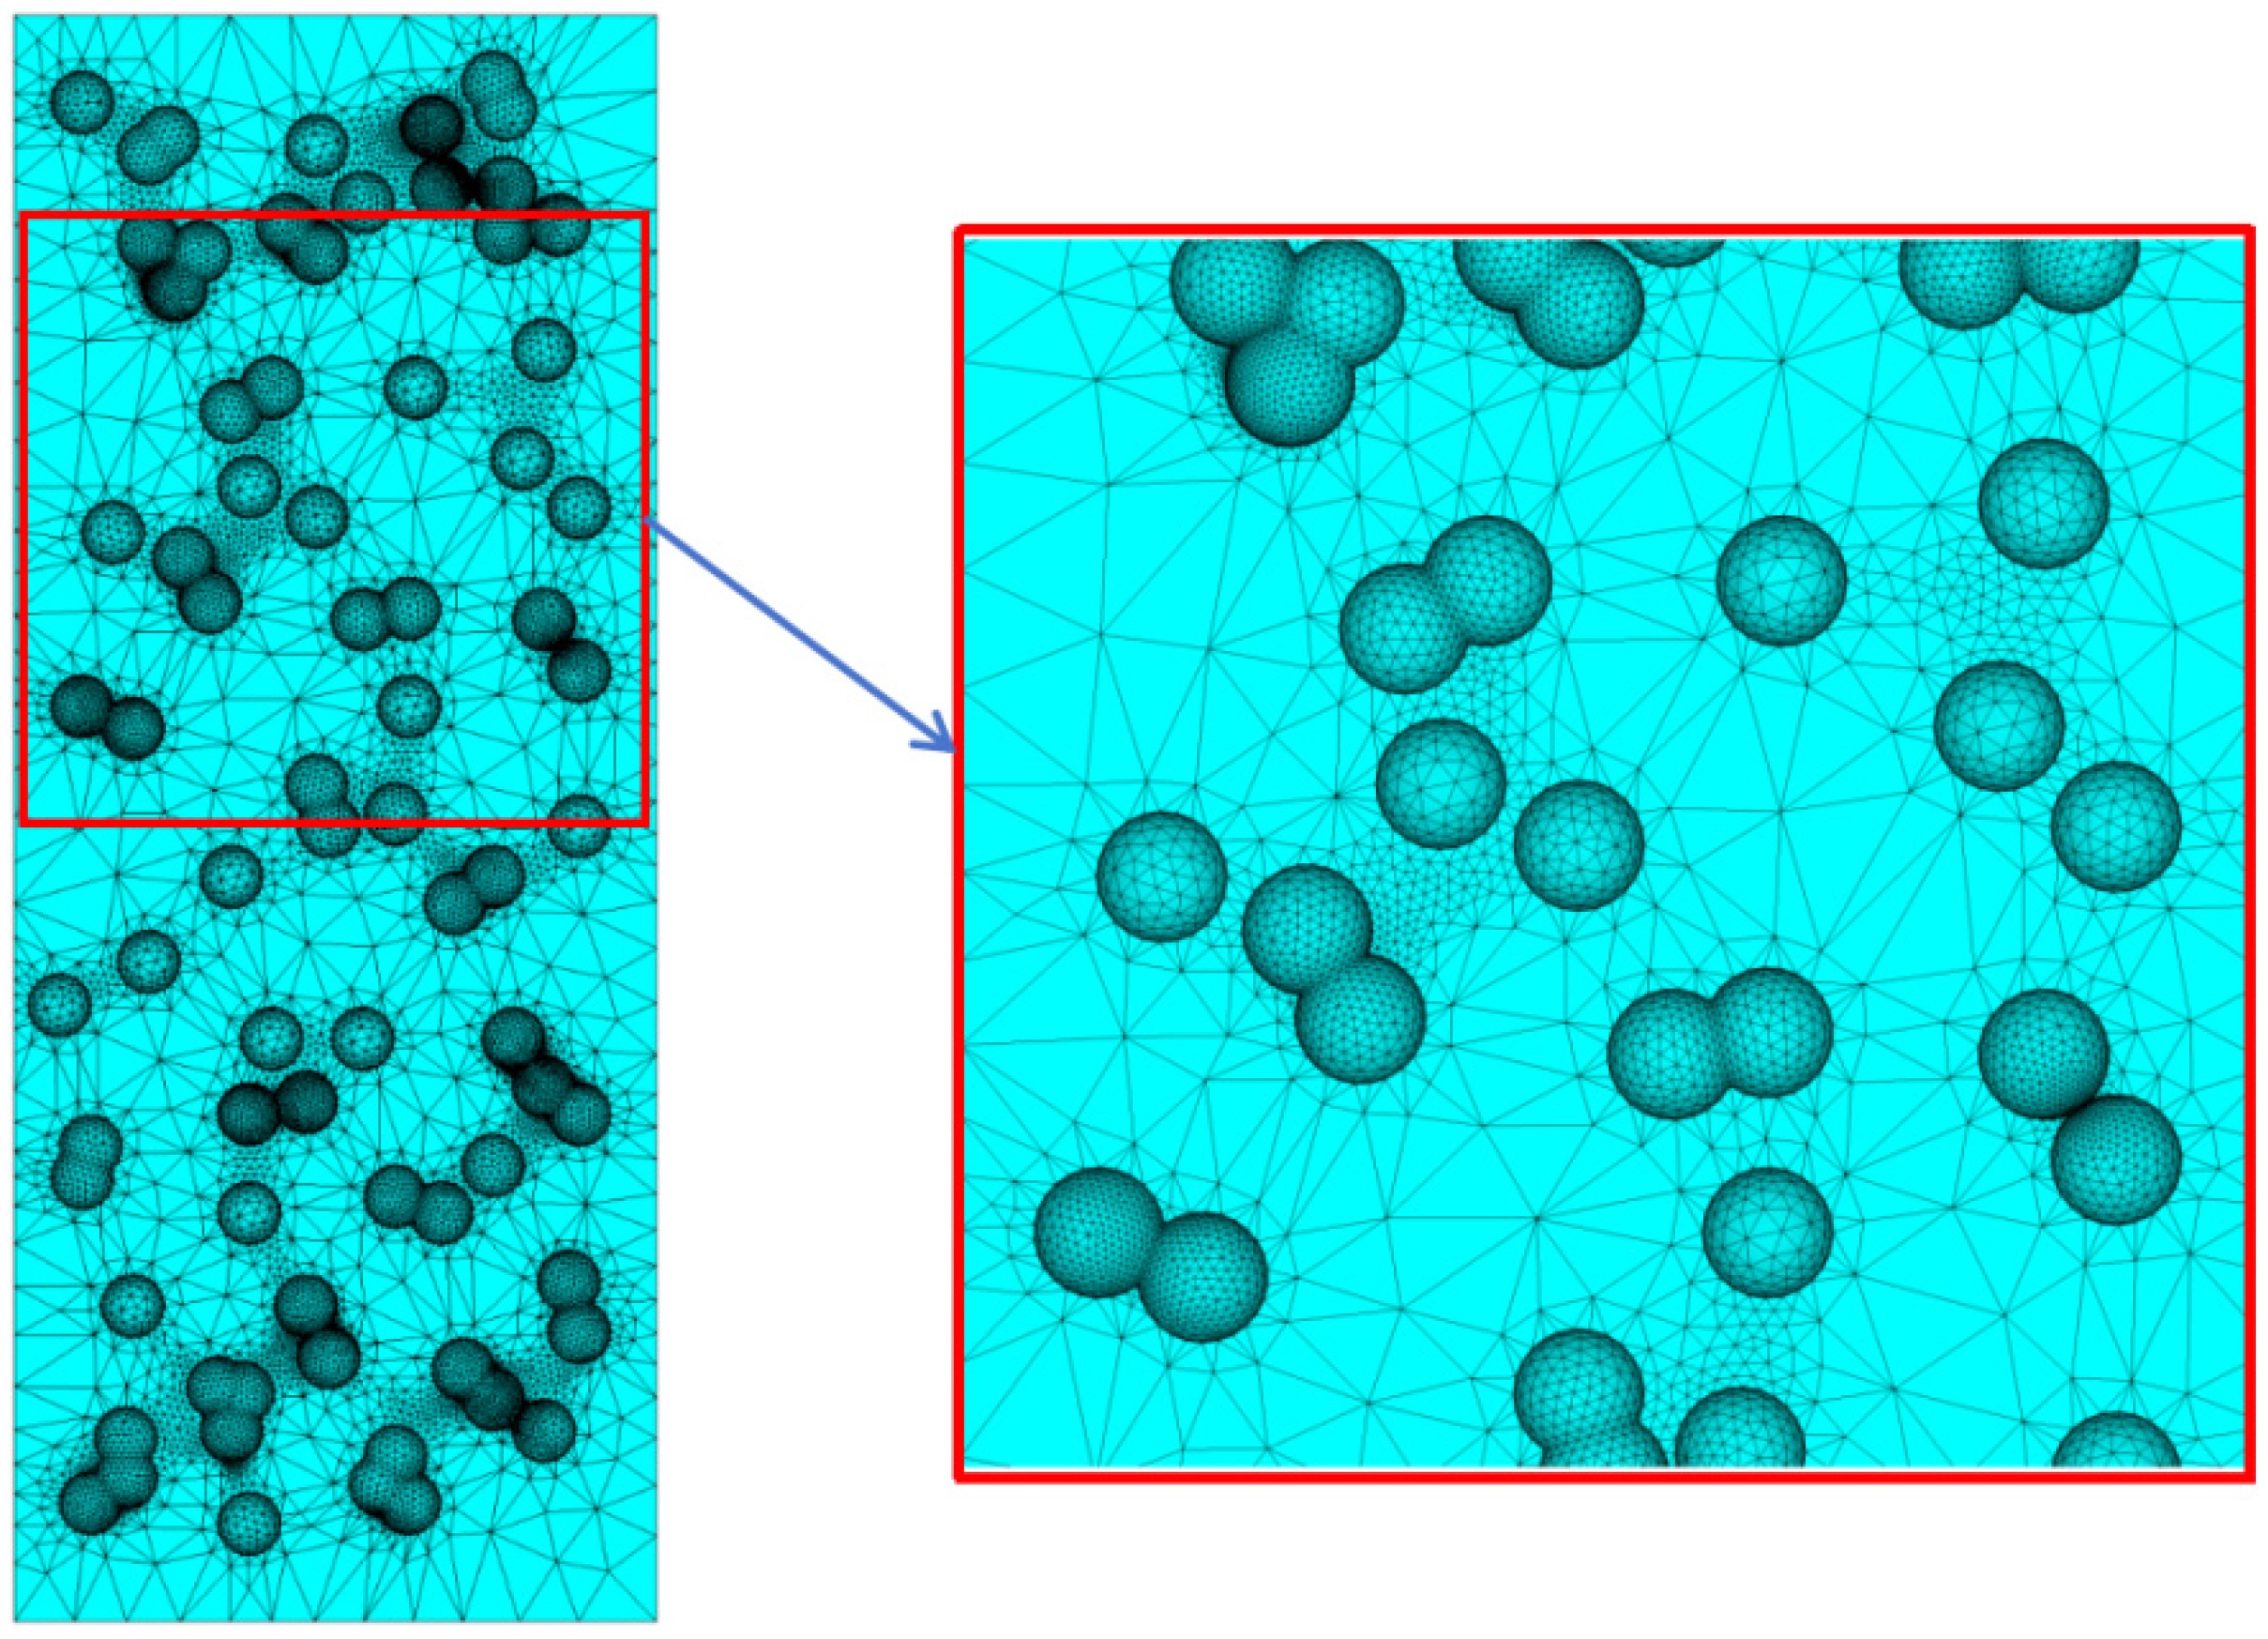
The structures of steel structures that have been in service for a long time in harsh underground environments are complex, and the causes and forms of damage are also diverse. Due to the random nature of corrosion in the actual underground environment, the size, depth, and location of the corroded area are all random. Some scholars have studied the growth shape of corrosion pits of metals in salt solutions and found that the pits are mostly hemispherical and gradually become semi-ellipsoidal in the later stage of development [20,21]. Moreover, hemispherical pits themselves have the characteristic of being shallow near the edge and deep at the center. In addition, when two or more pits intersect, a large pit is naturally formed. Therefore, based on the hemispherical pit model with a radius of 4 mm, a pitting corrosion model with random position is generated in this paper, allowing pitting pits to intersect. The randomly distributed pitting corrosion model established is shown in Figure 1. This figure utilized simulation methods to model the impact of natural corrosion pits on the load-bearing performance of steel structures. It presented the intricate characteristics of randomly distributed pitting corrosion and interwoven local areas, accurately replicating the corrosion morphology under actual working conditions.
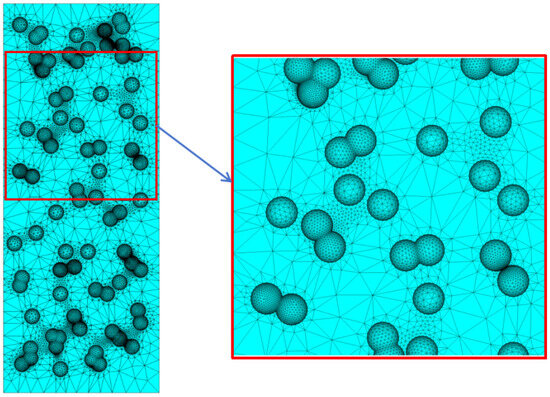
Figure 1.
Random distribution pitting model.
The main effect of pitting damage on the steel structure is that stress concentrations form easily near pits, resulting in sharp increase in stress. Under certain large or even conventional working loads, the material near the pit may enter a state of yield prematurely. Under the action of cyclic load, plastic accumulation will occur. Plastic accumulation to a certain extent will reduce the bearing capacity of the steel component.
3. Design of Simulated Pitting Damage Tests
3.1. Specimens with Prefabricated Pitting
In order to study the influence of pitting corrosion on the bearing performance of steel structures, the I-steel samples with prefabricated pitting corrosion are taken as the research object in this paper. To enhance experimental operability and ensure result reproducibility, the research emphasis is placed on four representative patterns of pitting corrosion distribution. At present, the intersection of pitting corrosion pits has not been incorporated into the research scope. Considering that each member in the steel structure mainly bears tension, compression, and bending deformation, axial compression and three-point bending tests are carried out on the I-steel samples with prefabricated pitting damage of different distribution types. The effects of pitting defect types on the failure mode, bearing capacity, and deformation capacity of I-steel members are analyzed. Under realistic working conditions, the natural corrosion process typically requires a span of 10 years or even longer to form a hemispherical pitting defect with a diameter of 4 mm. Conventional corrosion methods pose challenges in obtaining an ideal test sample within a short time frame. Consequently, in this paper, a precision mechanical processing approach is employed. A 4 mm drill bit is utilized on a CNC horizontal boring machine to fabricate pitting defects. By accurately setting the cutting time to 0.4 s, the sizes of the machined pits can be guaranteed to exhibit a high degree of consistency. During the drilling operation, low cutting parameters (a spindle speed of 100 r/min and a feed rate of 0.05 mm/r) are adopted. This effectively maintains the temperature in the processing area within a relatively low range of 200 °C–300 °C, thereby avoiding the occurrence of work hardening. Moreover, the microstructure of the steel remains relatively unchanged, minimizing the interference of the processing method on the mechanical properties of the steel and providing reliable defect samples for subsequent research on load-bearing performance.
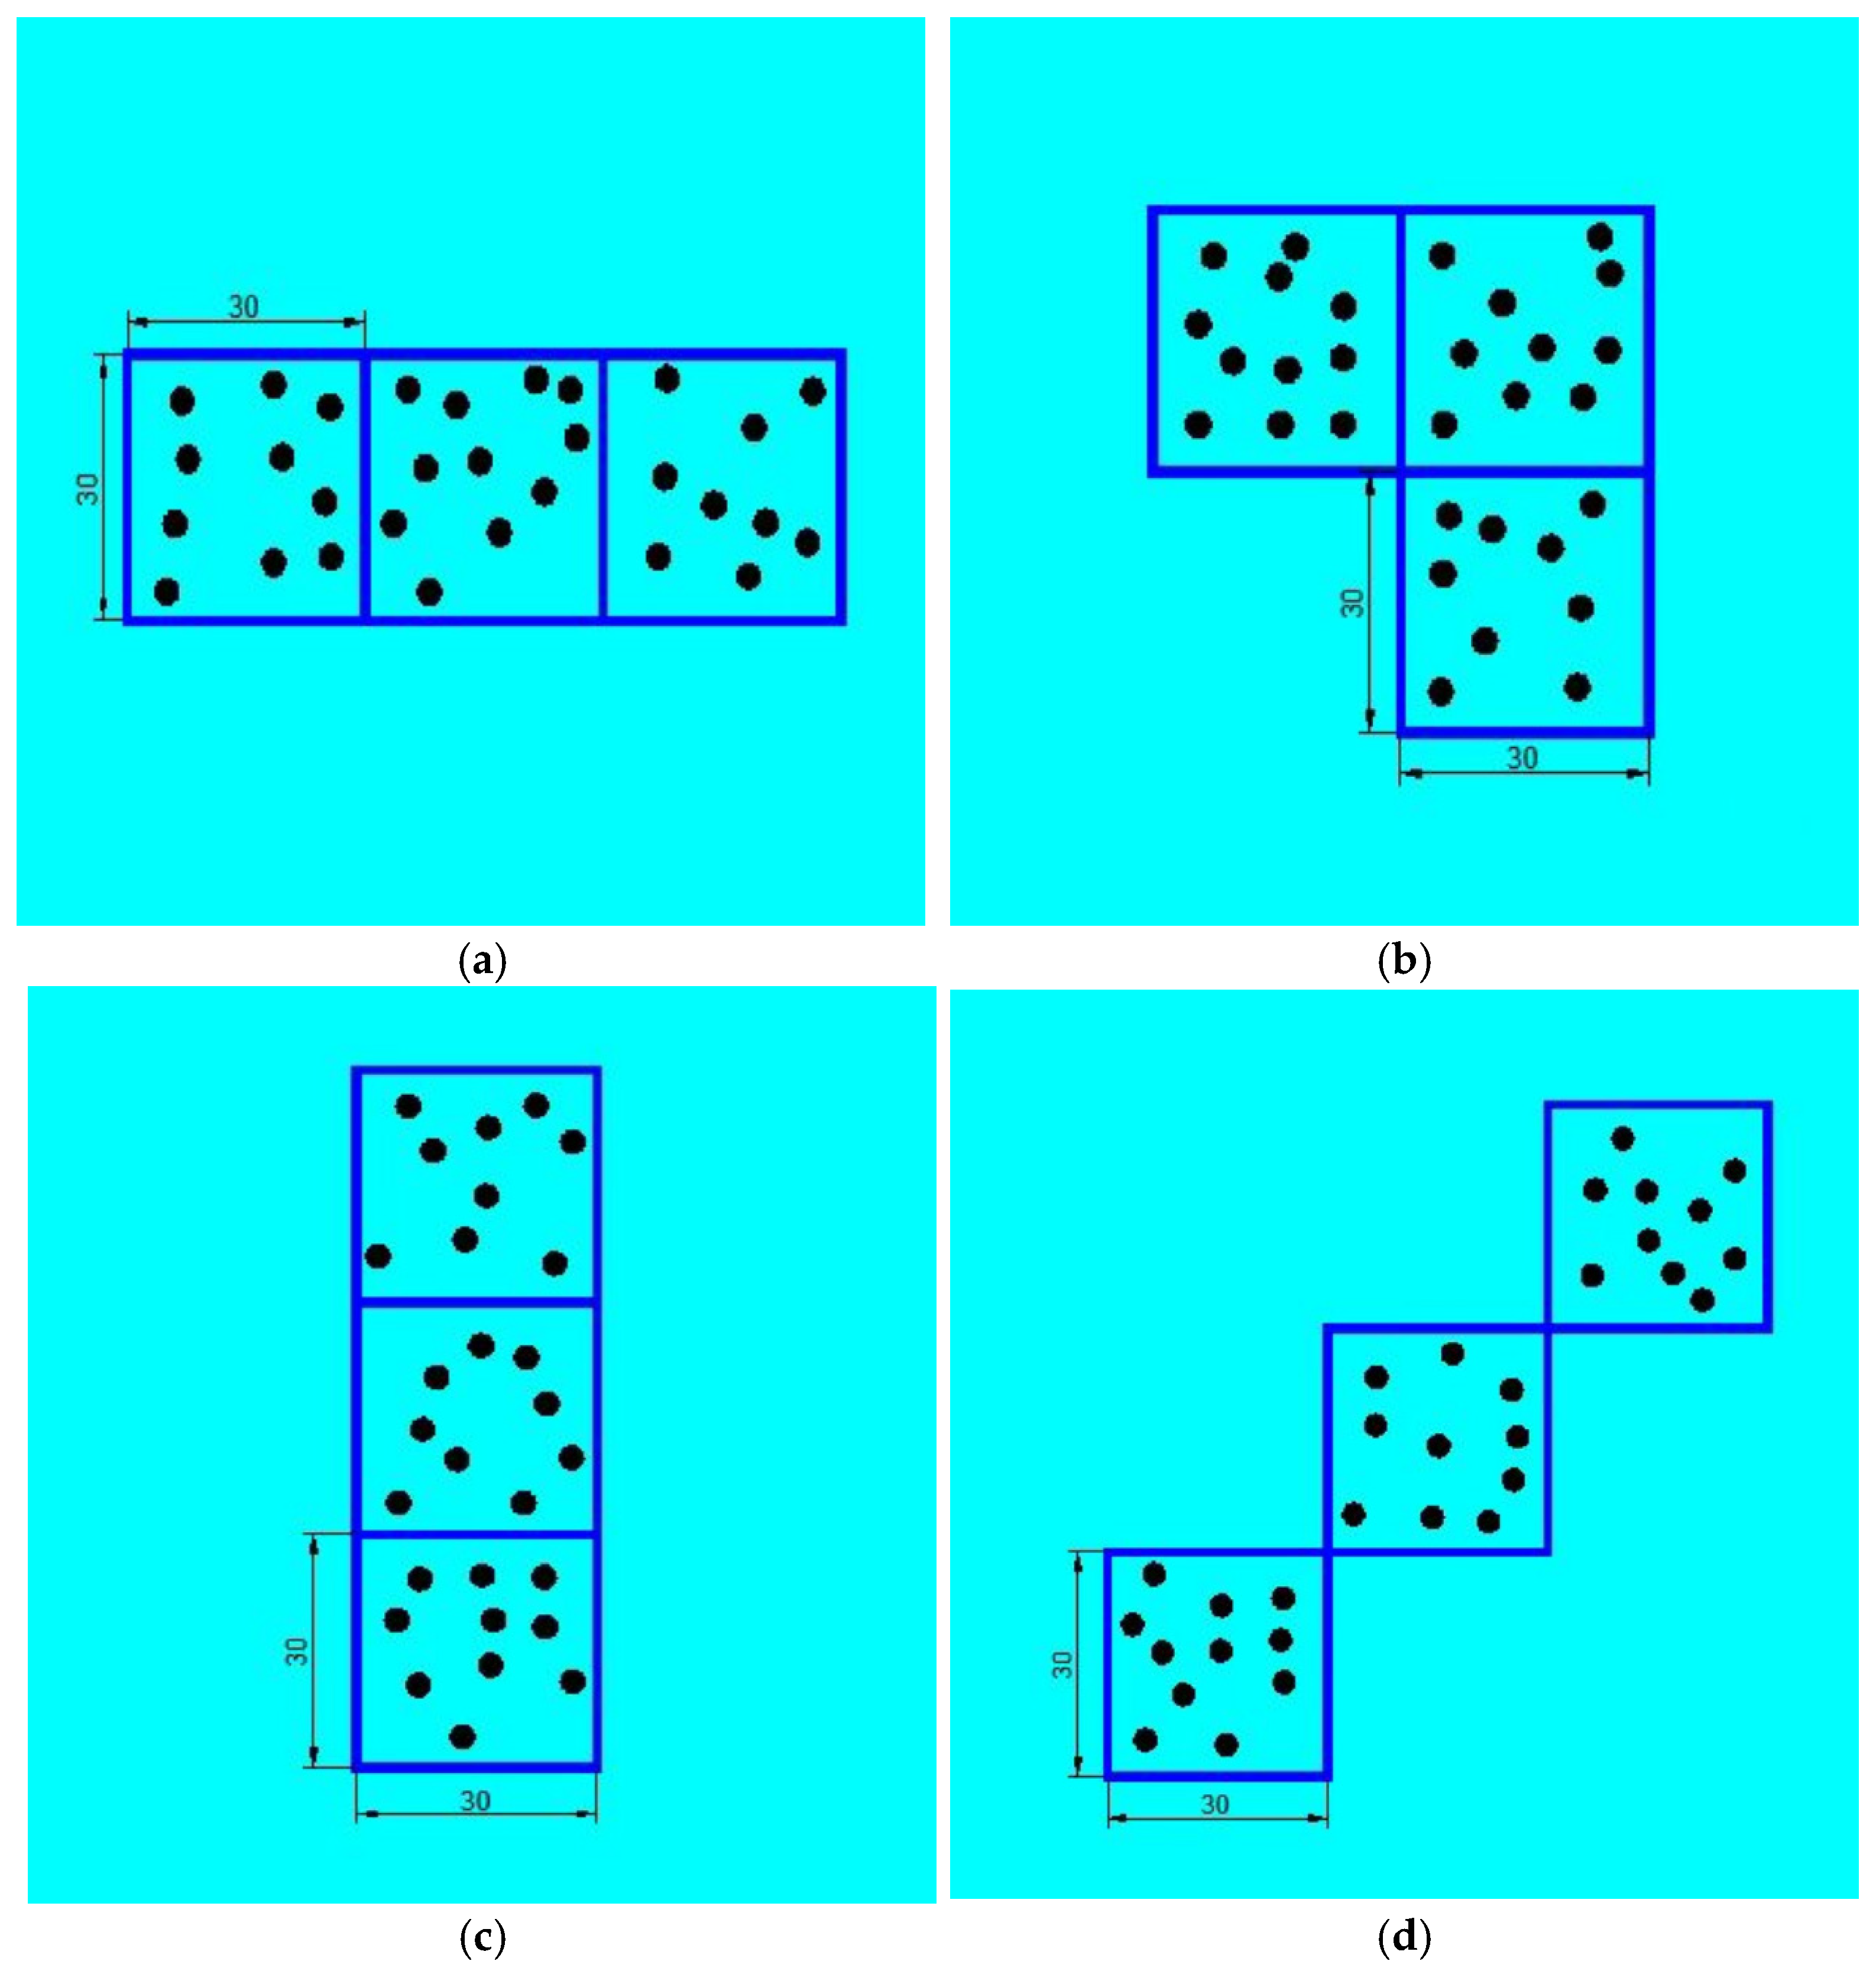
Due to the obvious aggregation phenomenon of pitting in actual service steel structures [22], when establishing the random pitting model in this paper, the pitting area was first evenly divided into several small square areas, and three specific square areas were selected to randomly generate pitting pits in the square area. In this paper, the influence of pitting corrosion of four distribution modes on the bearing capacity of the steel structure, as shown in Figure 2 (The black dots represent prefabricated pitting damage), will be analyzed. In this paper, the prefabricated pitting sample in the simulated pitting damage test is based on the hemispherical pitting model with a radius of 4 mm, and a random position pitting model is generated. The specific distribution mode is shown in Figure 2, which is divided into four defect types: a horizontal row, vertical row, triangular row, and inclined row.
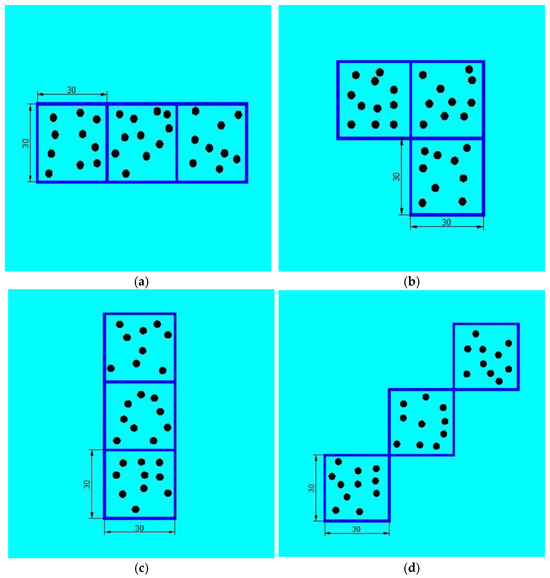
Figure 2.
Four different distribution types of prefabricated pitting damage. (a) Horizontal arrangement; (b) triangular arrangement; (c) vertical arrangement; (d) inclination arrangement.
3.2. Simulated Damage Test Condition
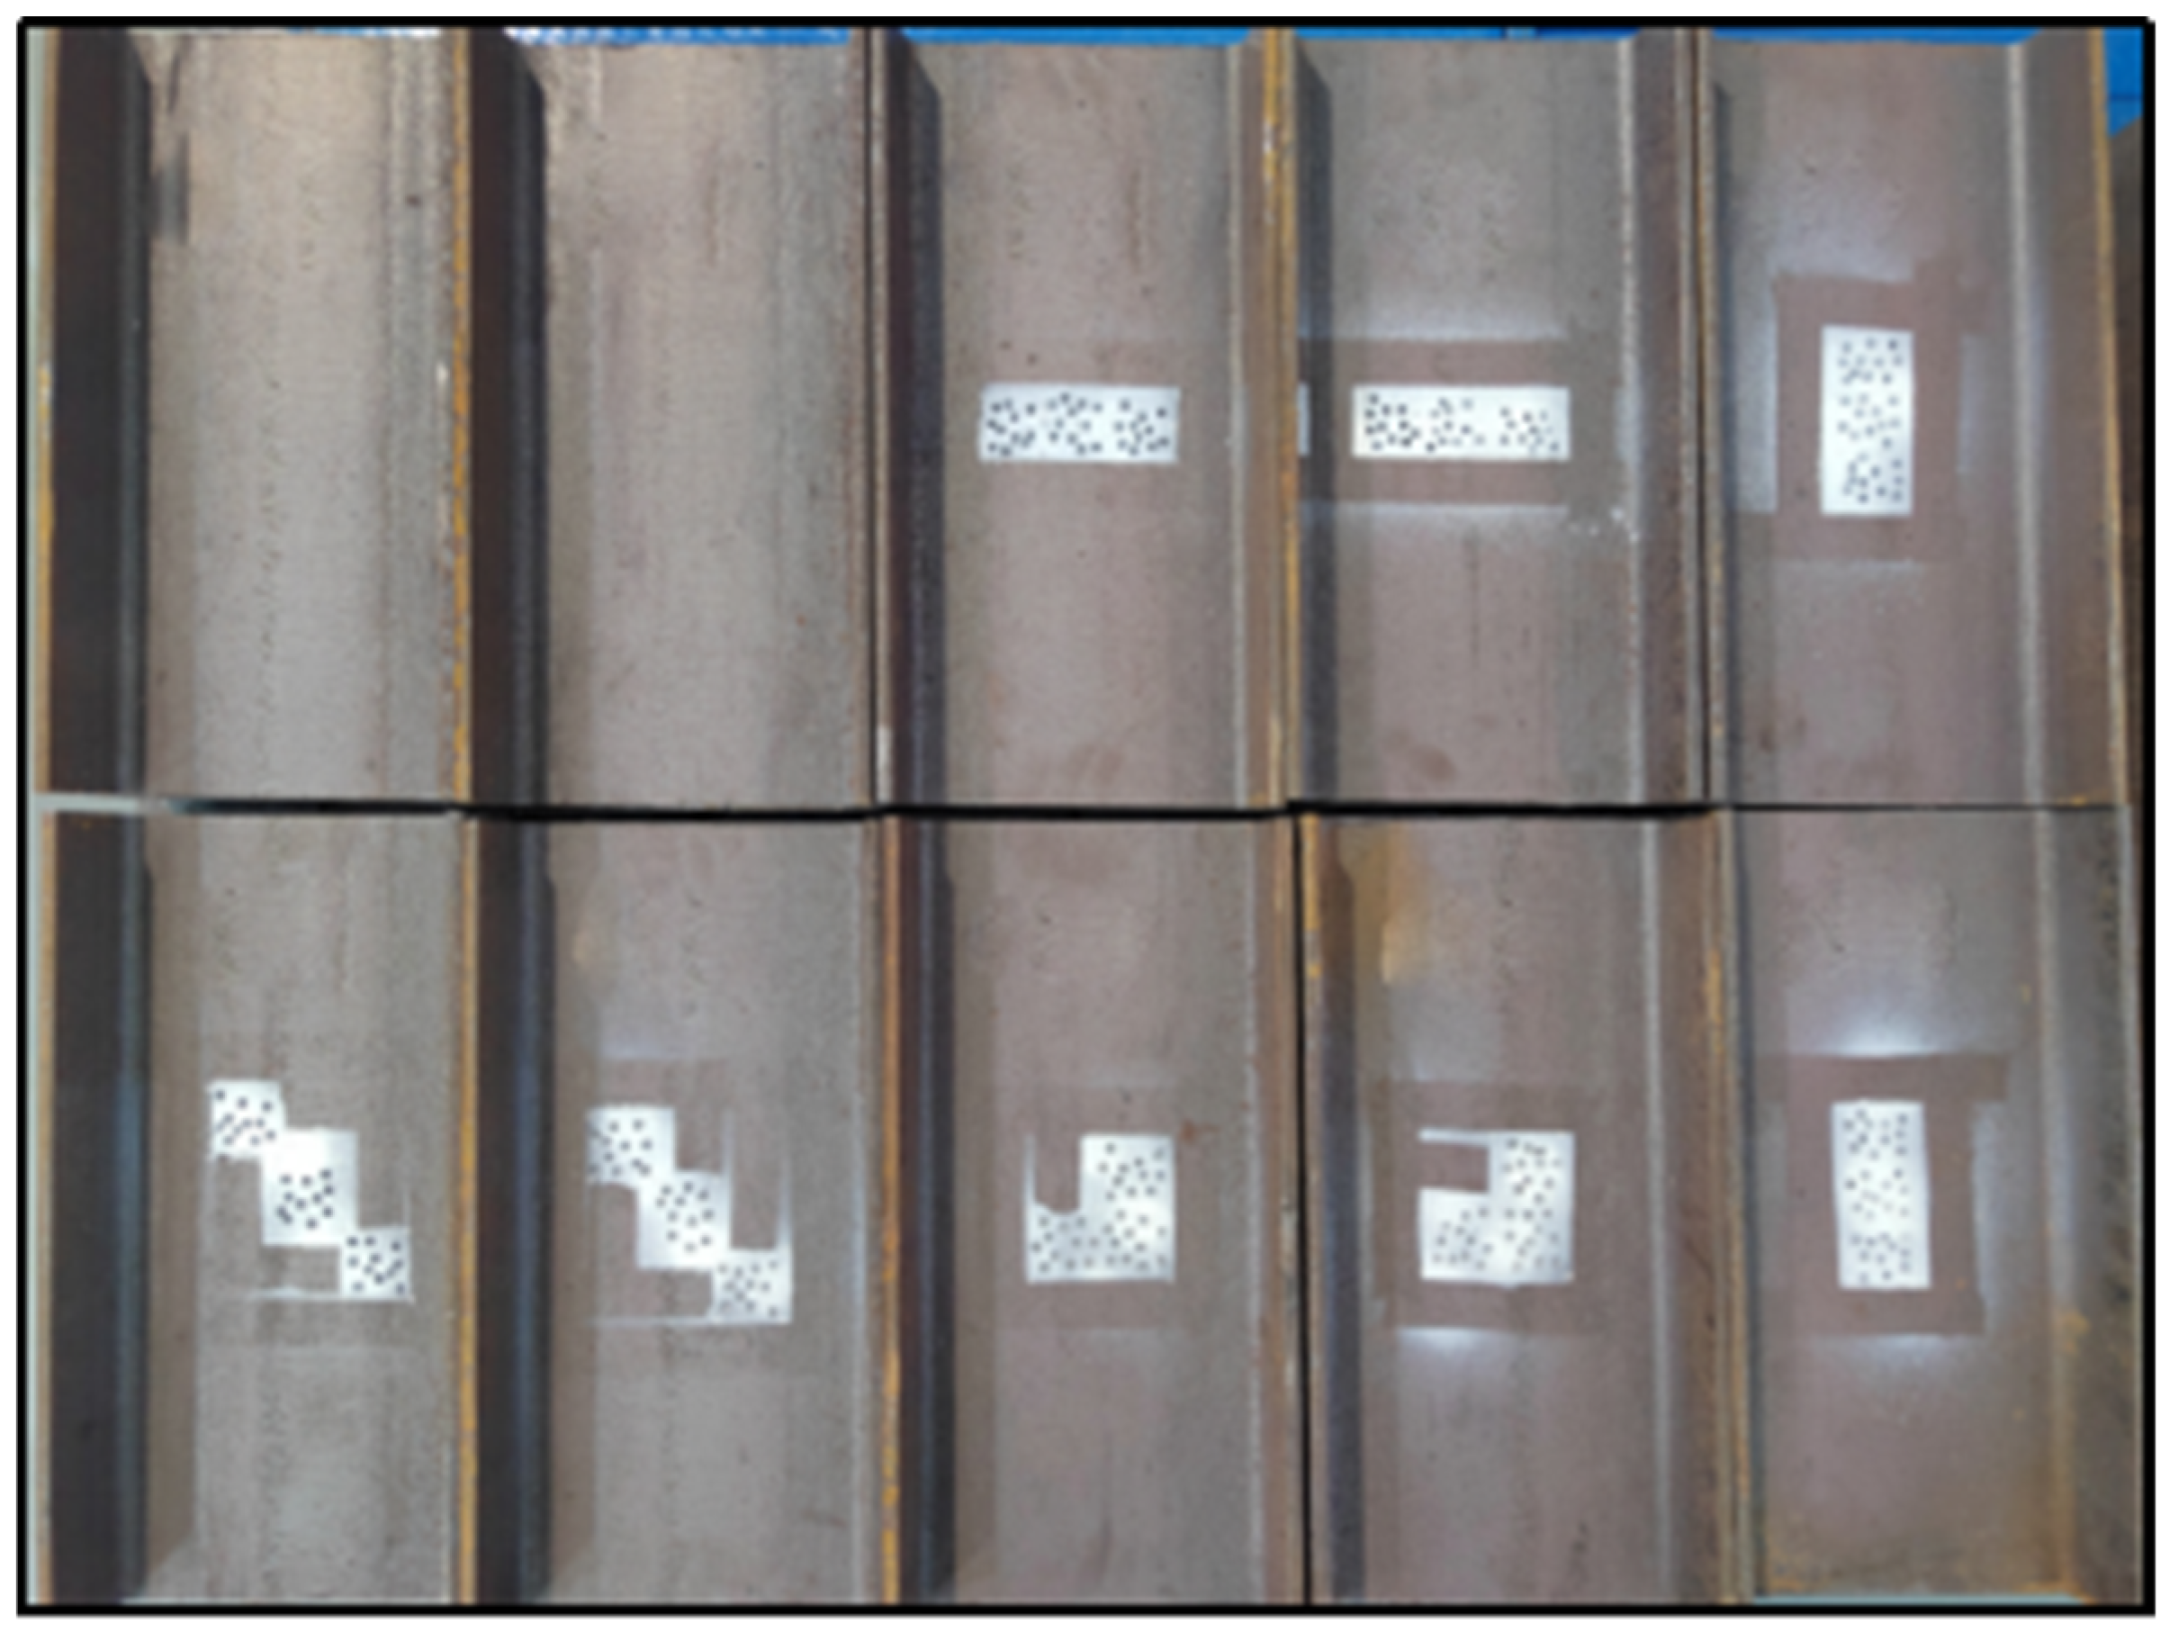
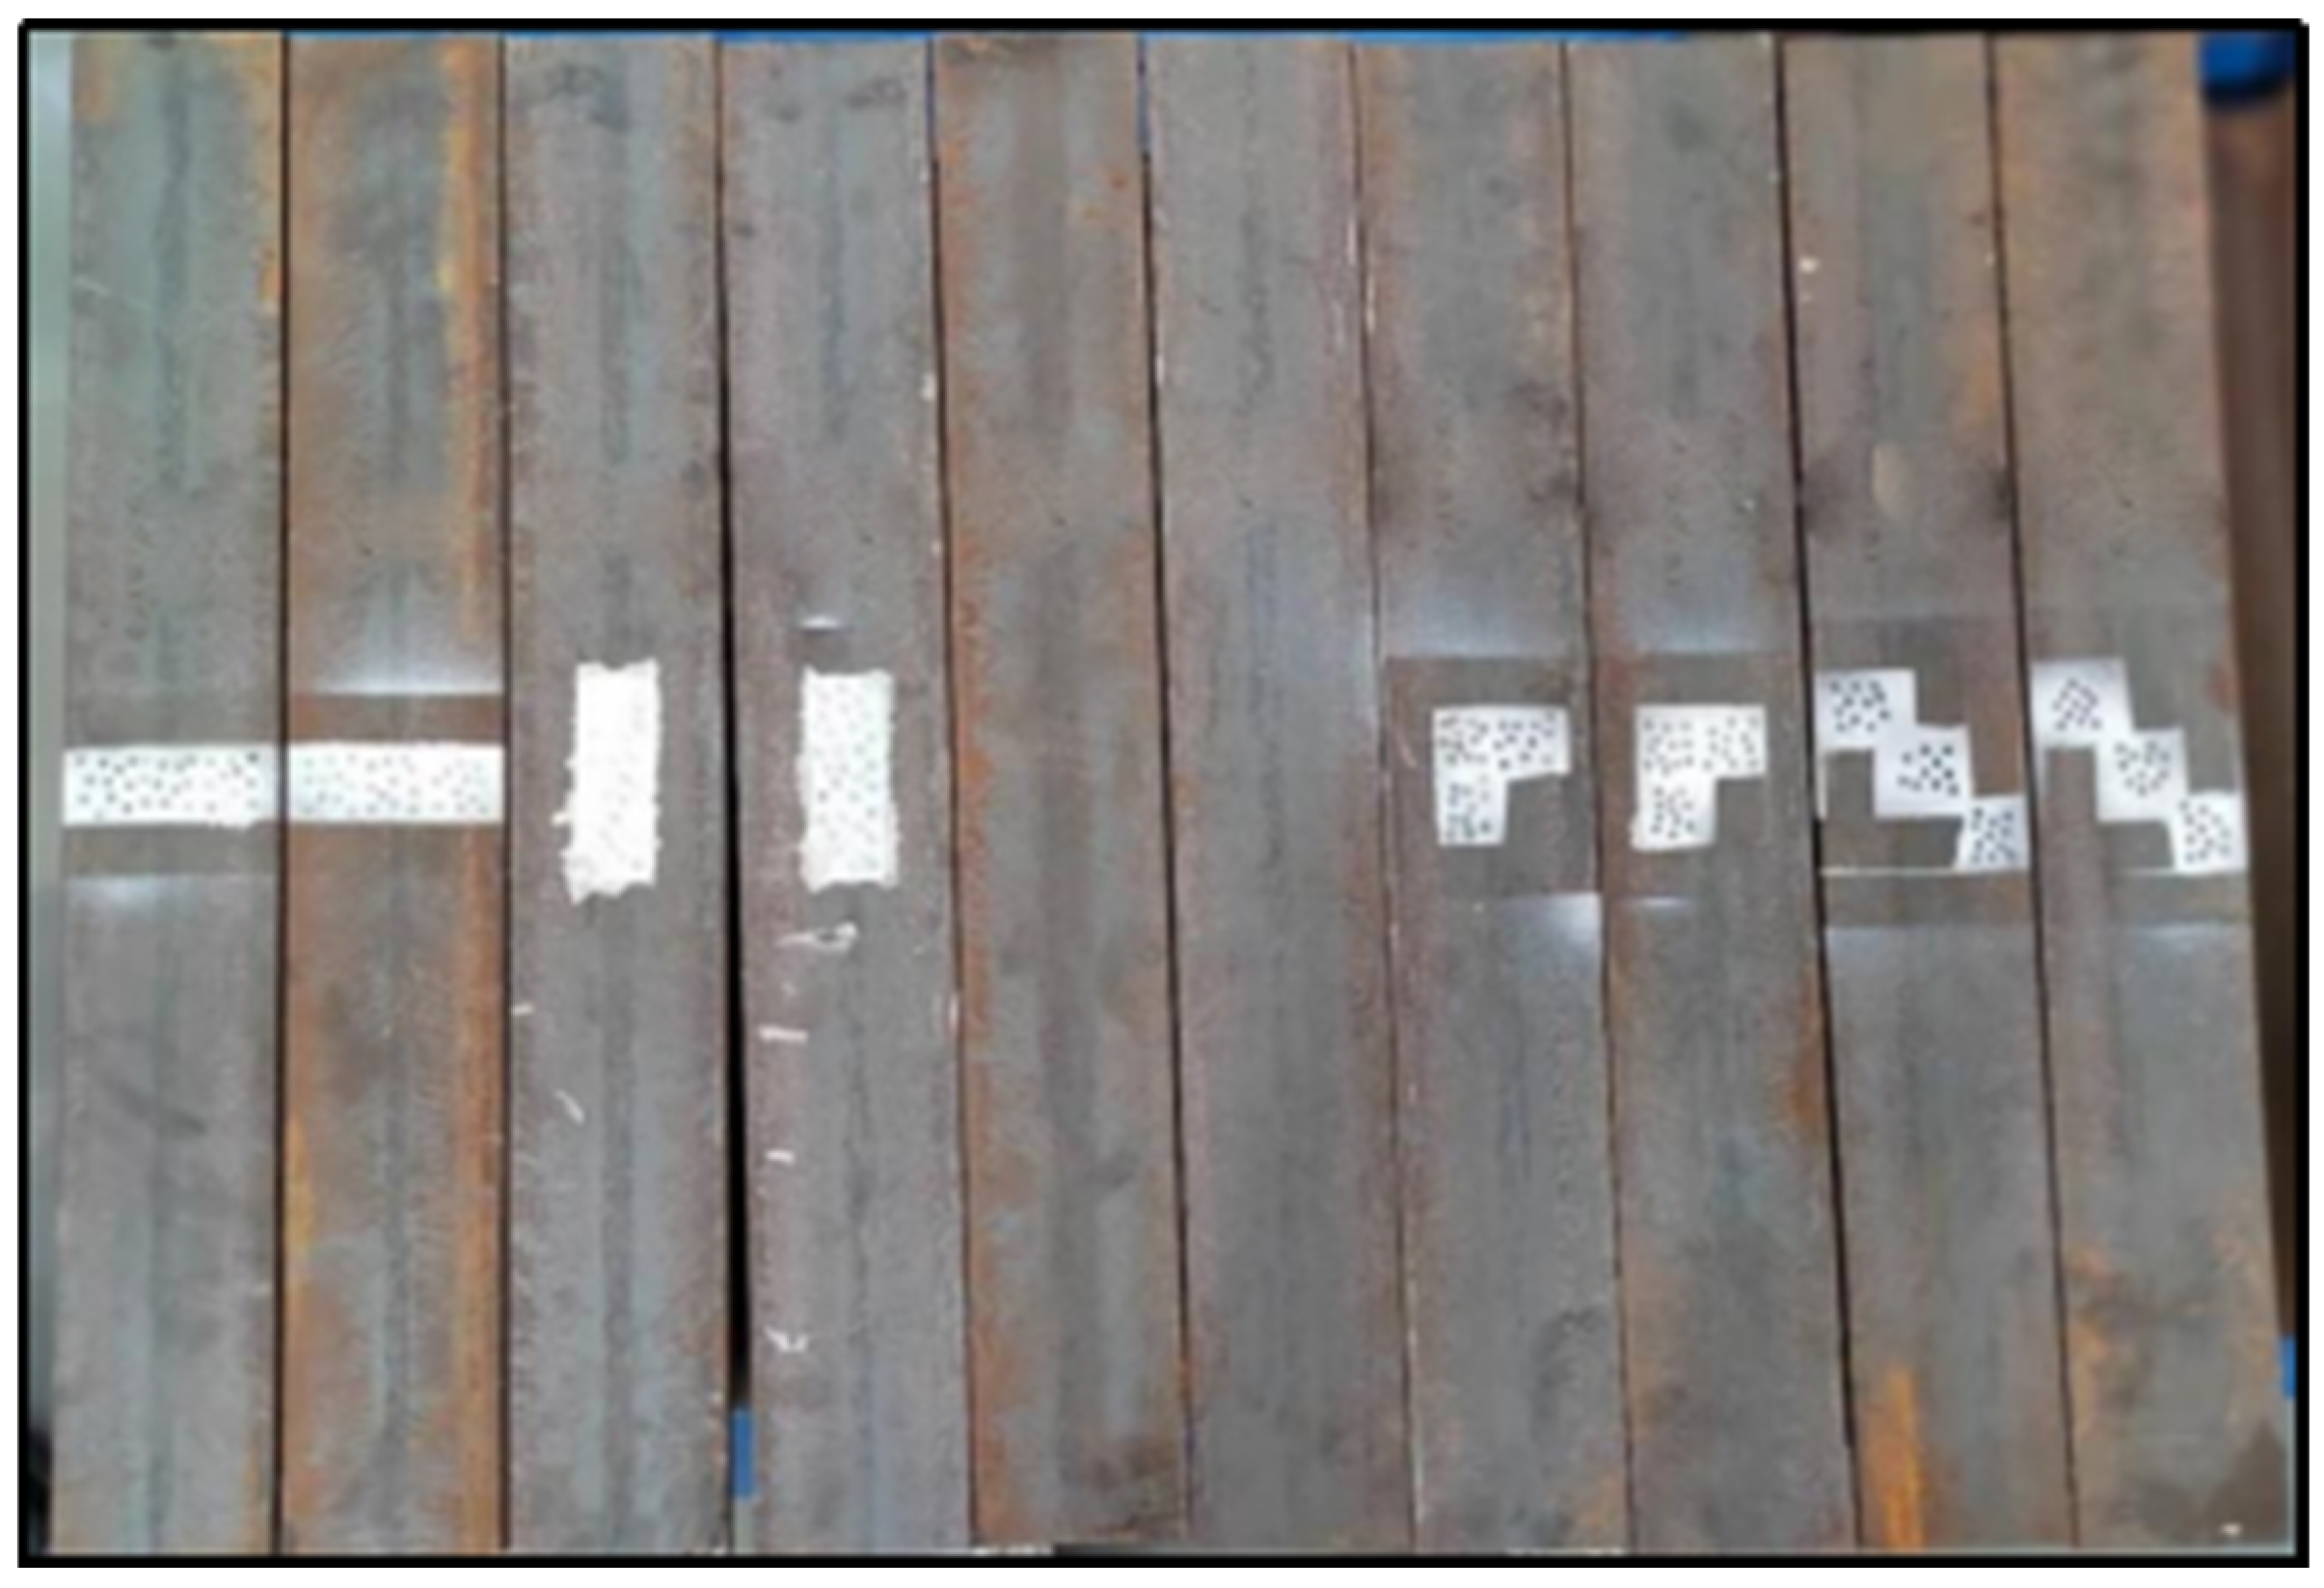
The raw materials for the experiment were selected, employing No. 20b I-beams commonly used in underground engineering with a material grade of Q345. The designed experiments included uniaxial compression tests on intact specimens, uniaxial compression tests on specimens with preformed pitting damage, three-point bending tests on intact specimens, and three-point bending tests on specimens with preformed pitting damage. The height of the uniaxial compression specimens was 600 mm, and the specimens with preformed pitting damage are shown in Figure 3. The length of the three-point bending specimens was 1200 mm, and the specimens with preformed pitting damage are shown in Figure 4. In the uniaxial compression tests, the pitting damage was prefabricated at the center of the web of the I-beam, while in the three-point bending tests, the pitting damage was prefabricated at the center of the tensile flange at the mid-span point of the I-beam. The specific information of the tested specimens is shown in Table 1.
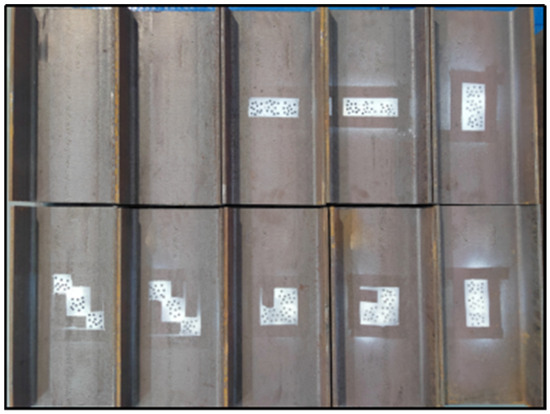
Figure 3.
Compression specimen with prefabricated pitting damage.
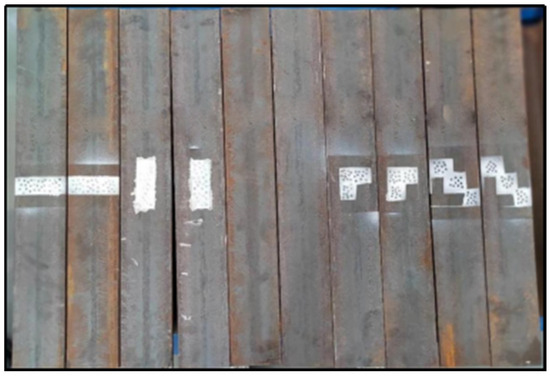
Figure 4.
Three-point bending specimen with prefabricated pitting damage.

Table 1.
Loading information of specimens.
In the experimental design phase, to guarantee the high repeatability of the results, three parallel samples were prepared for each operating condition in this study, and corresponding experiments were comprehensively conducted. There was no obvious crack propagation in each pit, and there was no merger or other morphological evolution between pits. In statistical analysis of the experimental outcomes, the experimental data of each parallel group exhibited a high level of consistency, which thoroughly verified the reliability and stability of the experimental approach. Furthermore, to visually compare the impacts of five distinct defect distribution patterns on the load-bearing capacity of the steel structure within the same chart and avoid visual interference caused by data superposition, in this paper, only the most representative sample data from each group of experiments were selected for analysis. This not only ensured the validity of the conclusion but also enhanced the readability and presentation effectiveness of the research findings.
4. Results of Simulated Pitting Damage Compression Test
4.1. Test Phenomena and Failure Modes of Compression Test
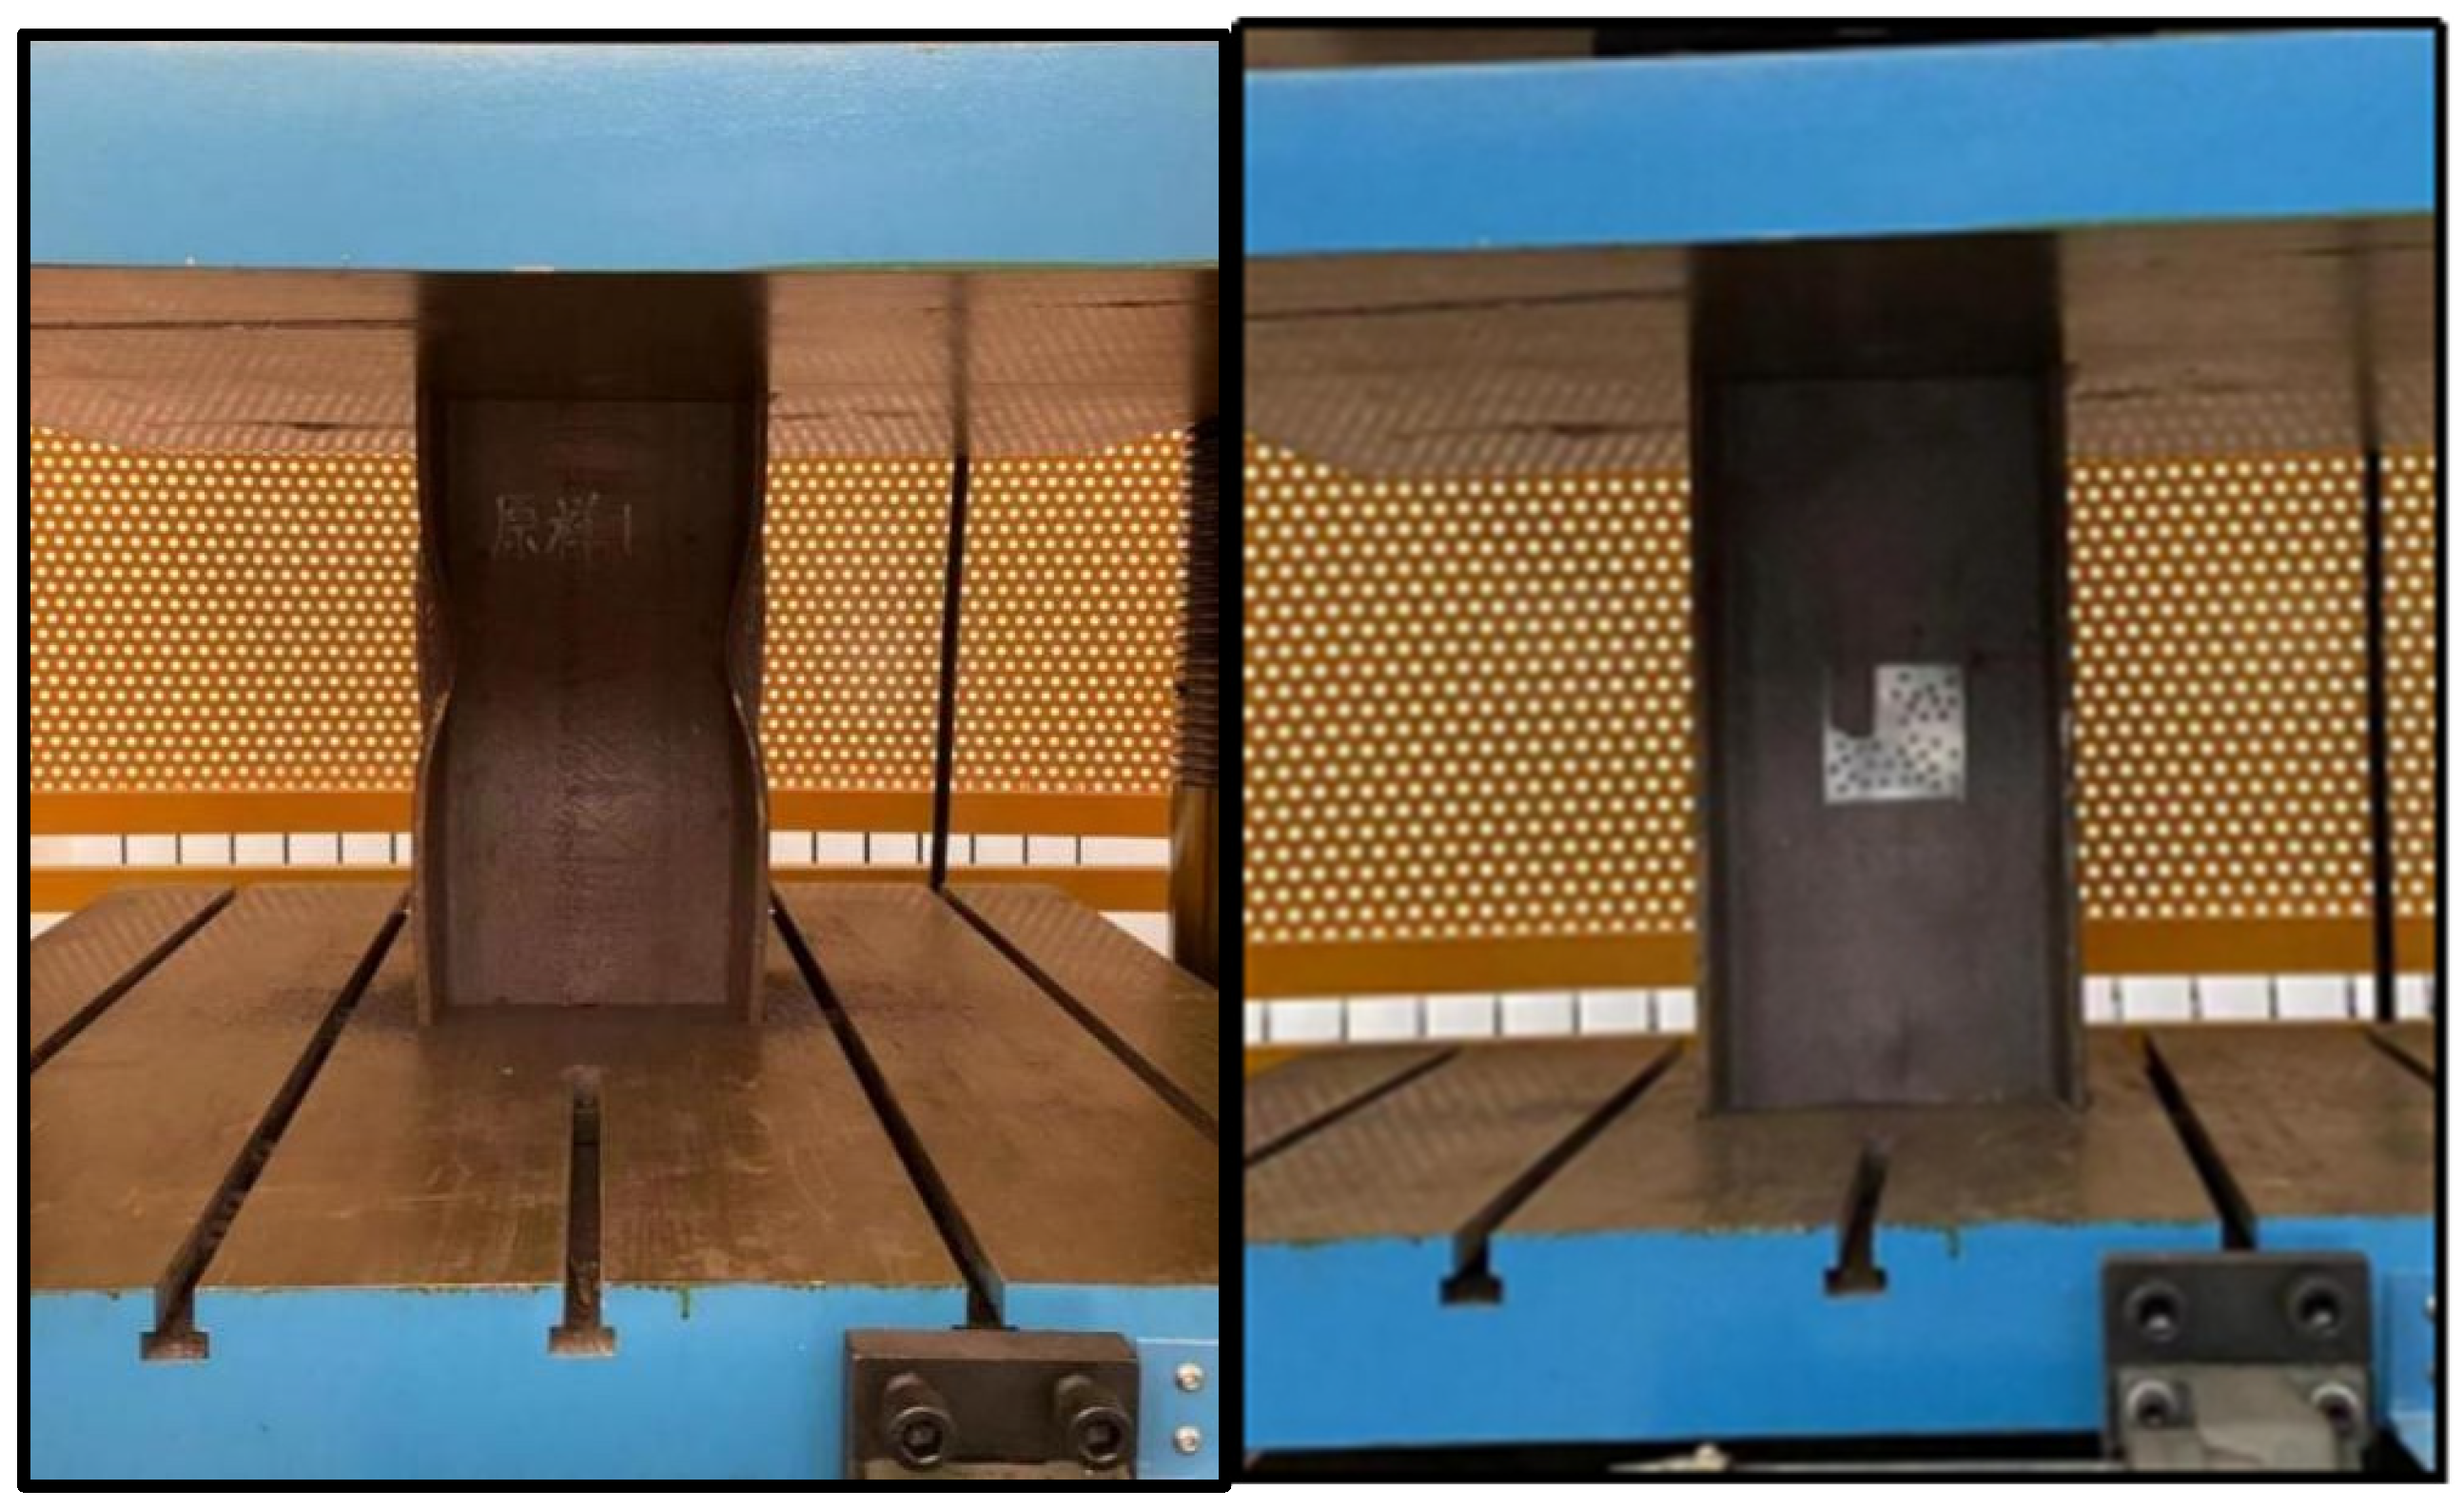
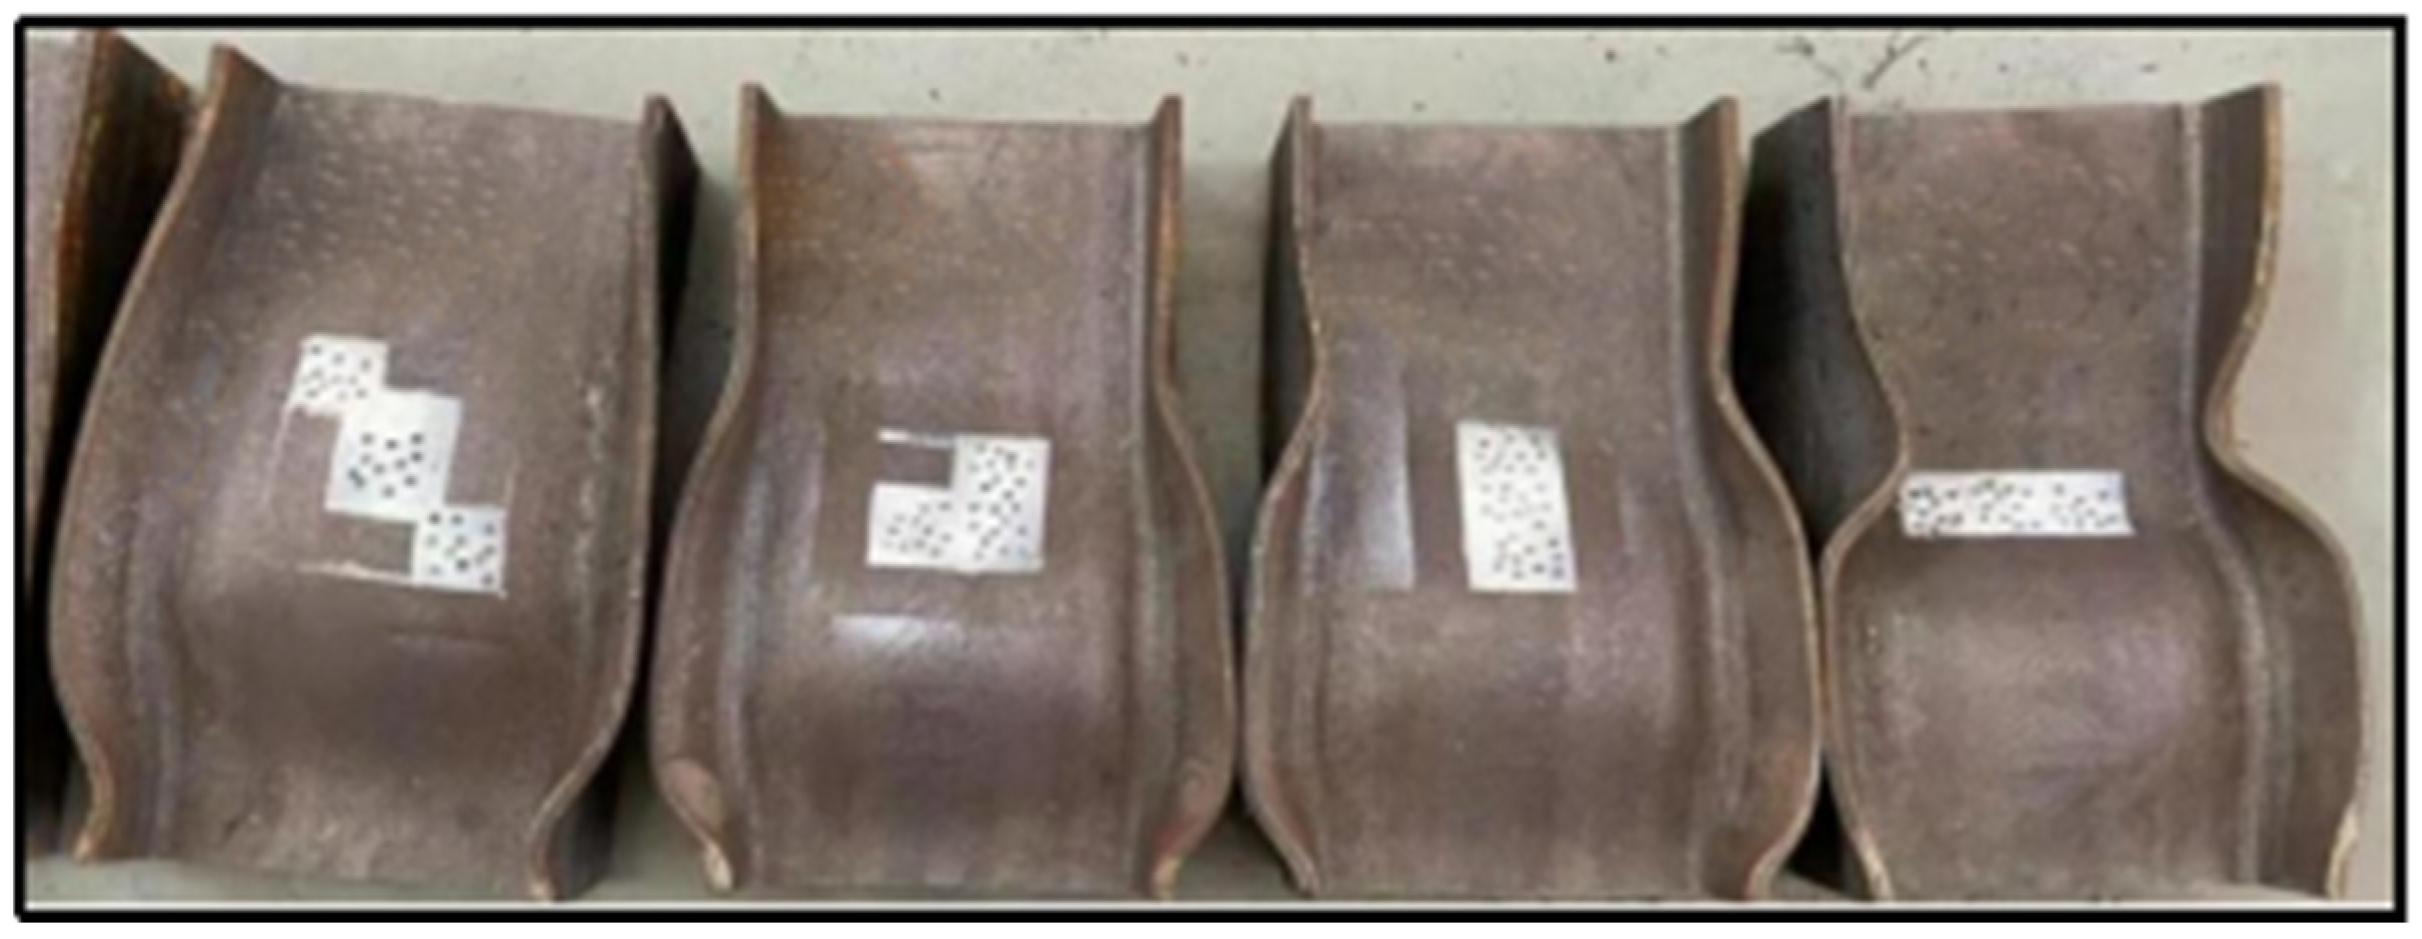
Figure 5 shows the actual layout of the uniaxial compression test, where the pitting damage is located at the center of the web. Figure 6 presents the compression failure modes of four different types of specimens with pre-existing pitting damage. At the initial stage of loading, neither the specimens with pitting damage nor those without it show obvious deformation in the flange plates and webs, and the load–displacement curves maintain linear growth. As the load increases to the yield load, local buckling occurs in the webs of all specimens, which slightly bulge outward. When the load continues to increase to the ultimate load, the webs buckle and the flanges start to dent. At this point, the load begins to drop, and the final failure mode is characterized by web buckling. Macroscopically, there is no significant difference in the failure modes between the specimens with pitting damage and those without.
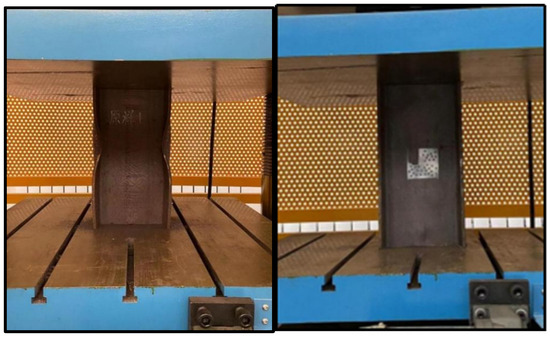
Figure 5.
Loading arrangements in uniaxial compression test.
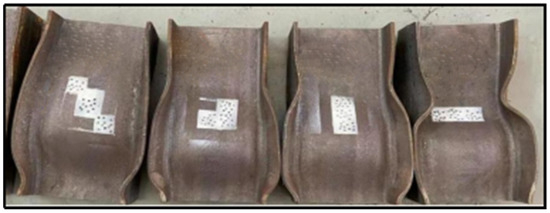
Figure 6.
Compression failure modes of samples with four types of pitting damage.
4.2. Analysis of Bearing Capacity and Deformation Capacity of Compression Test
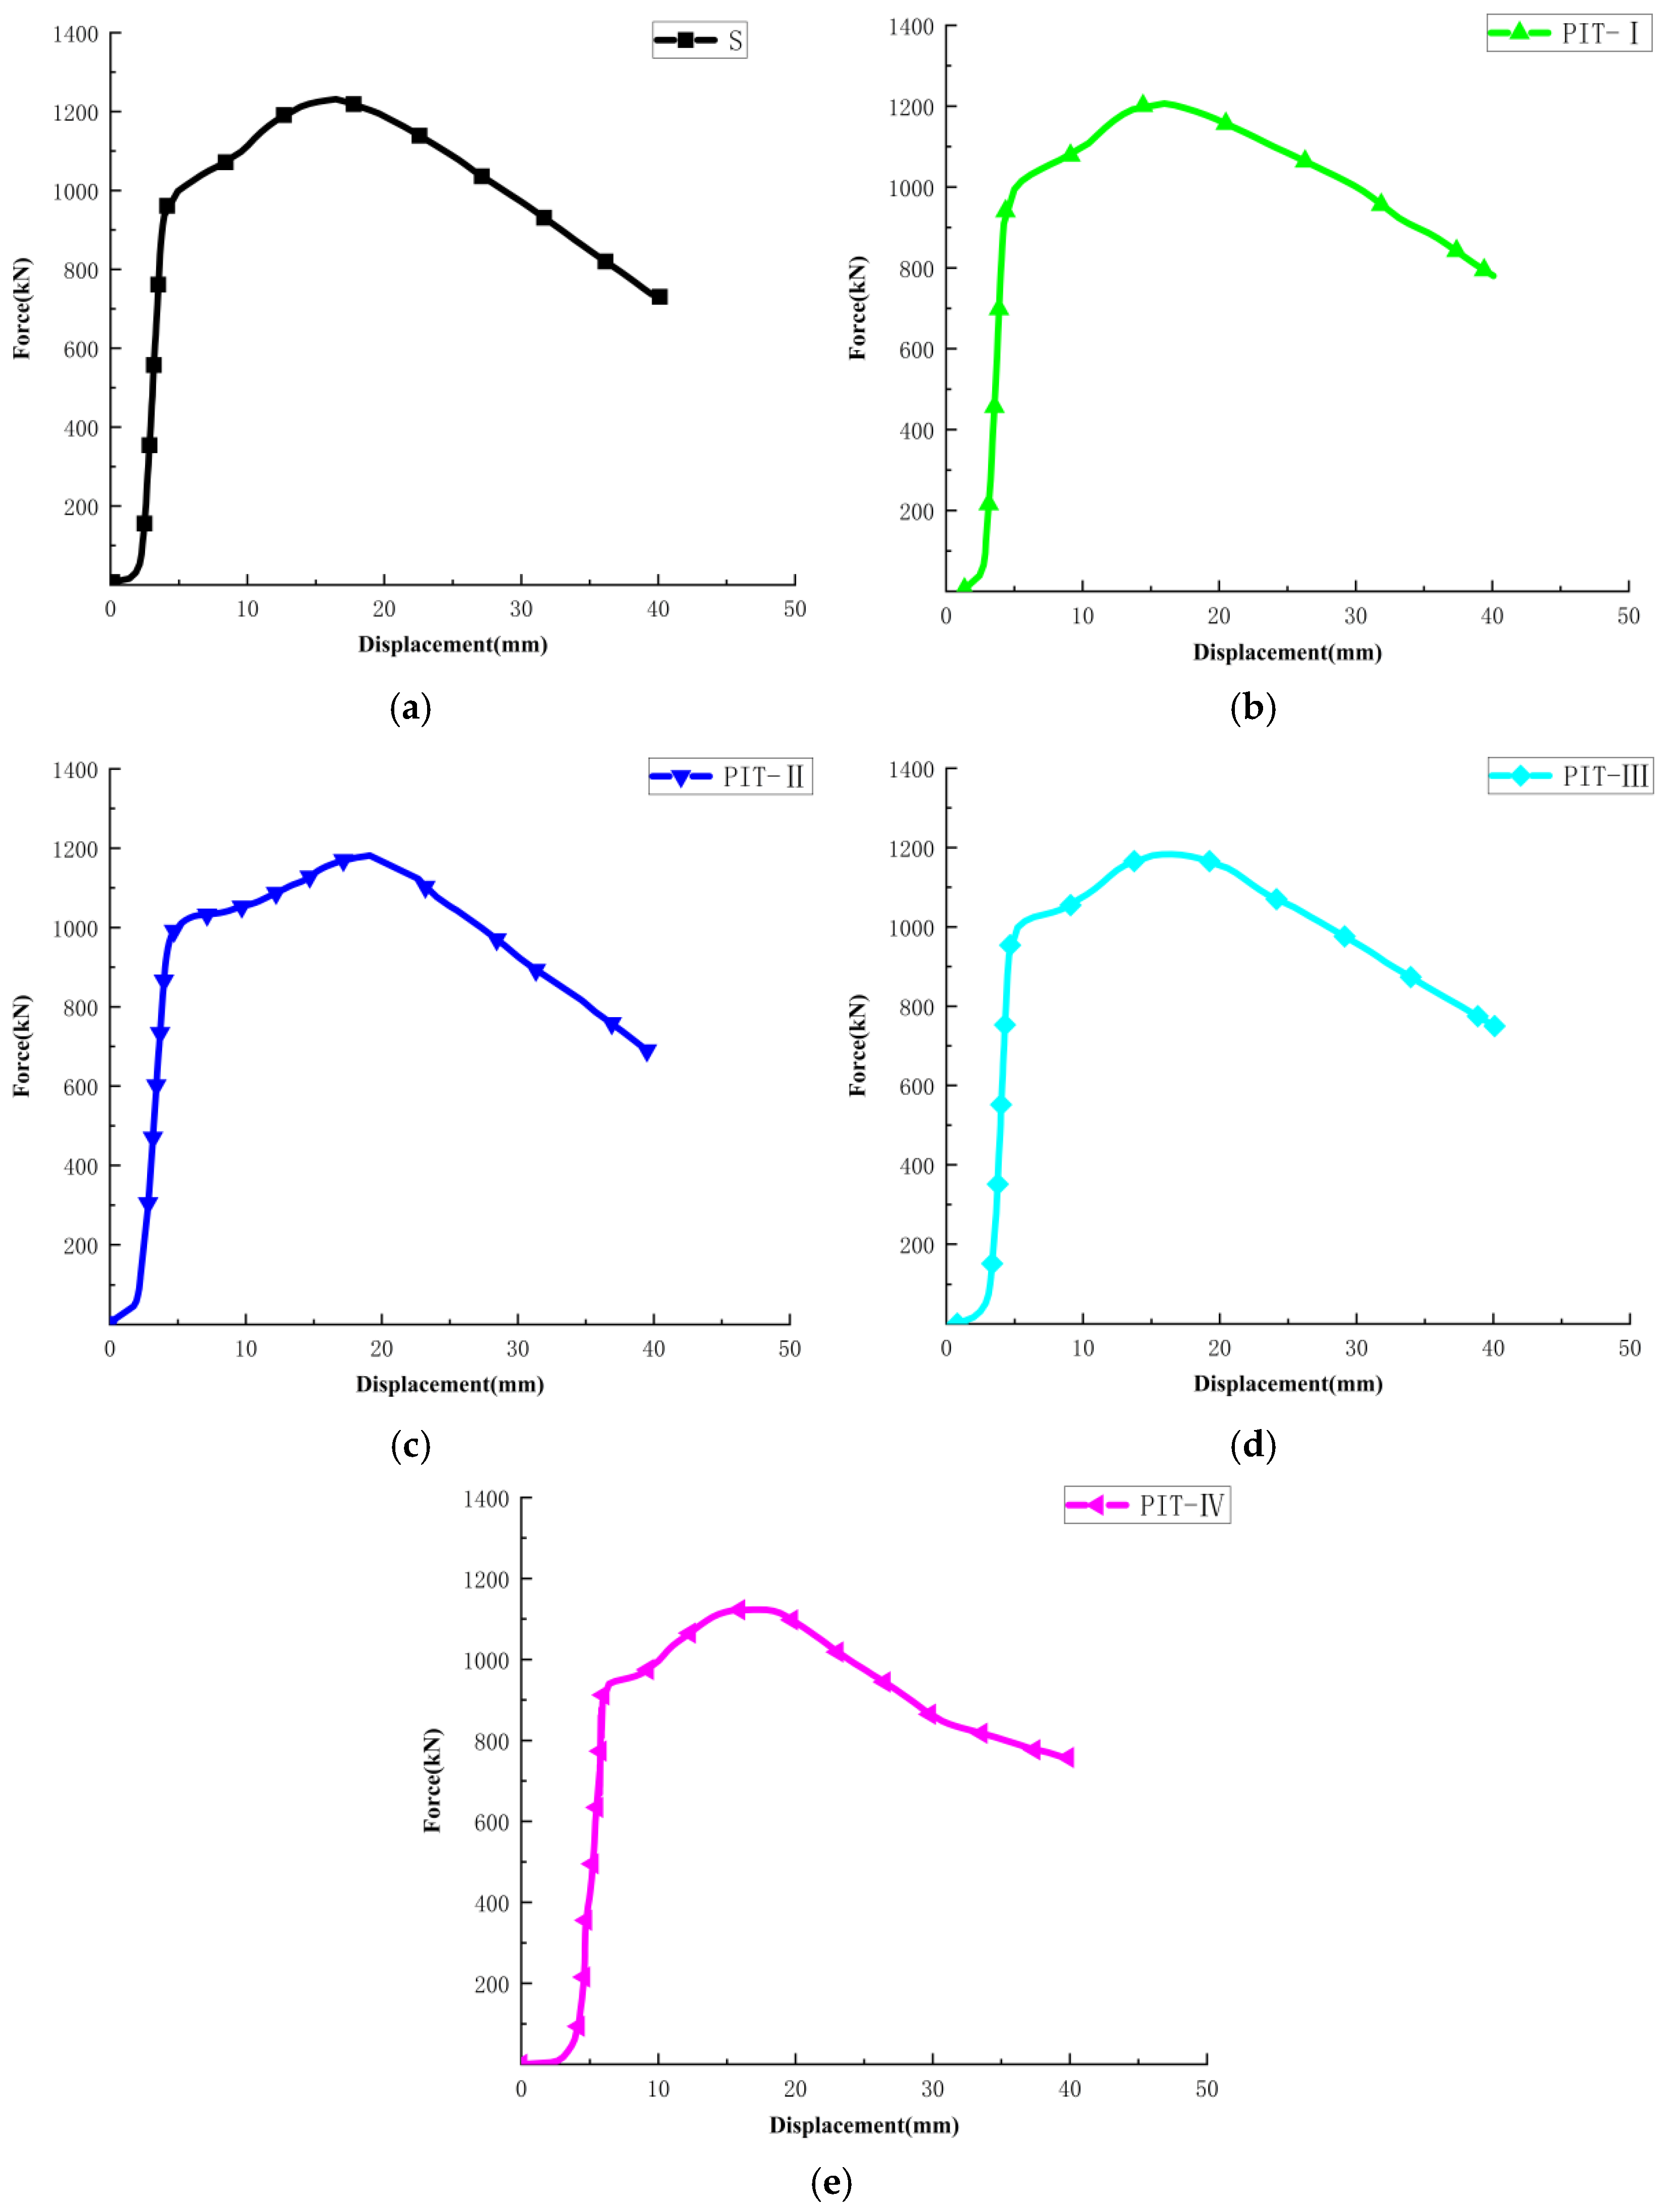
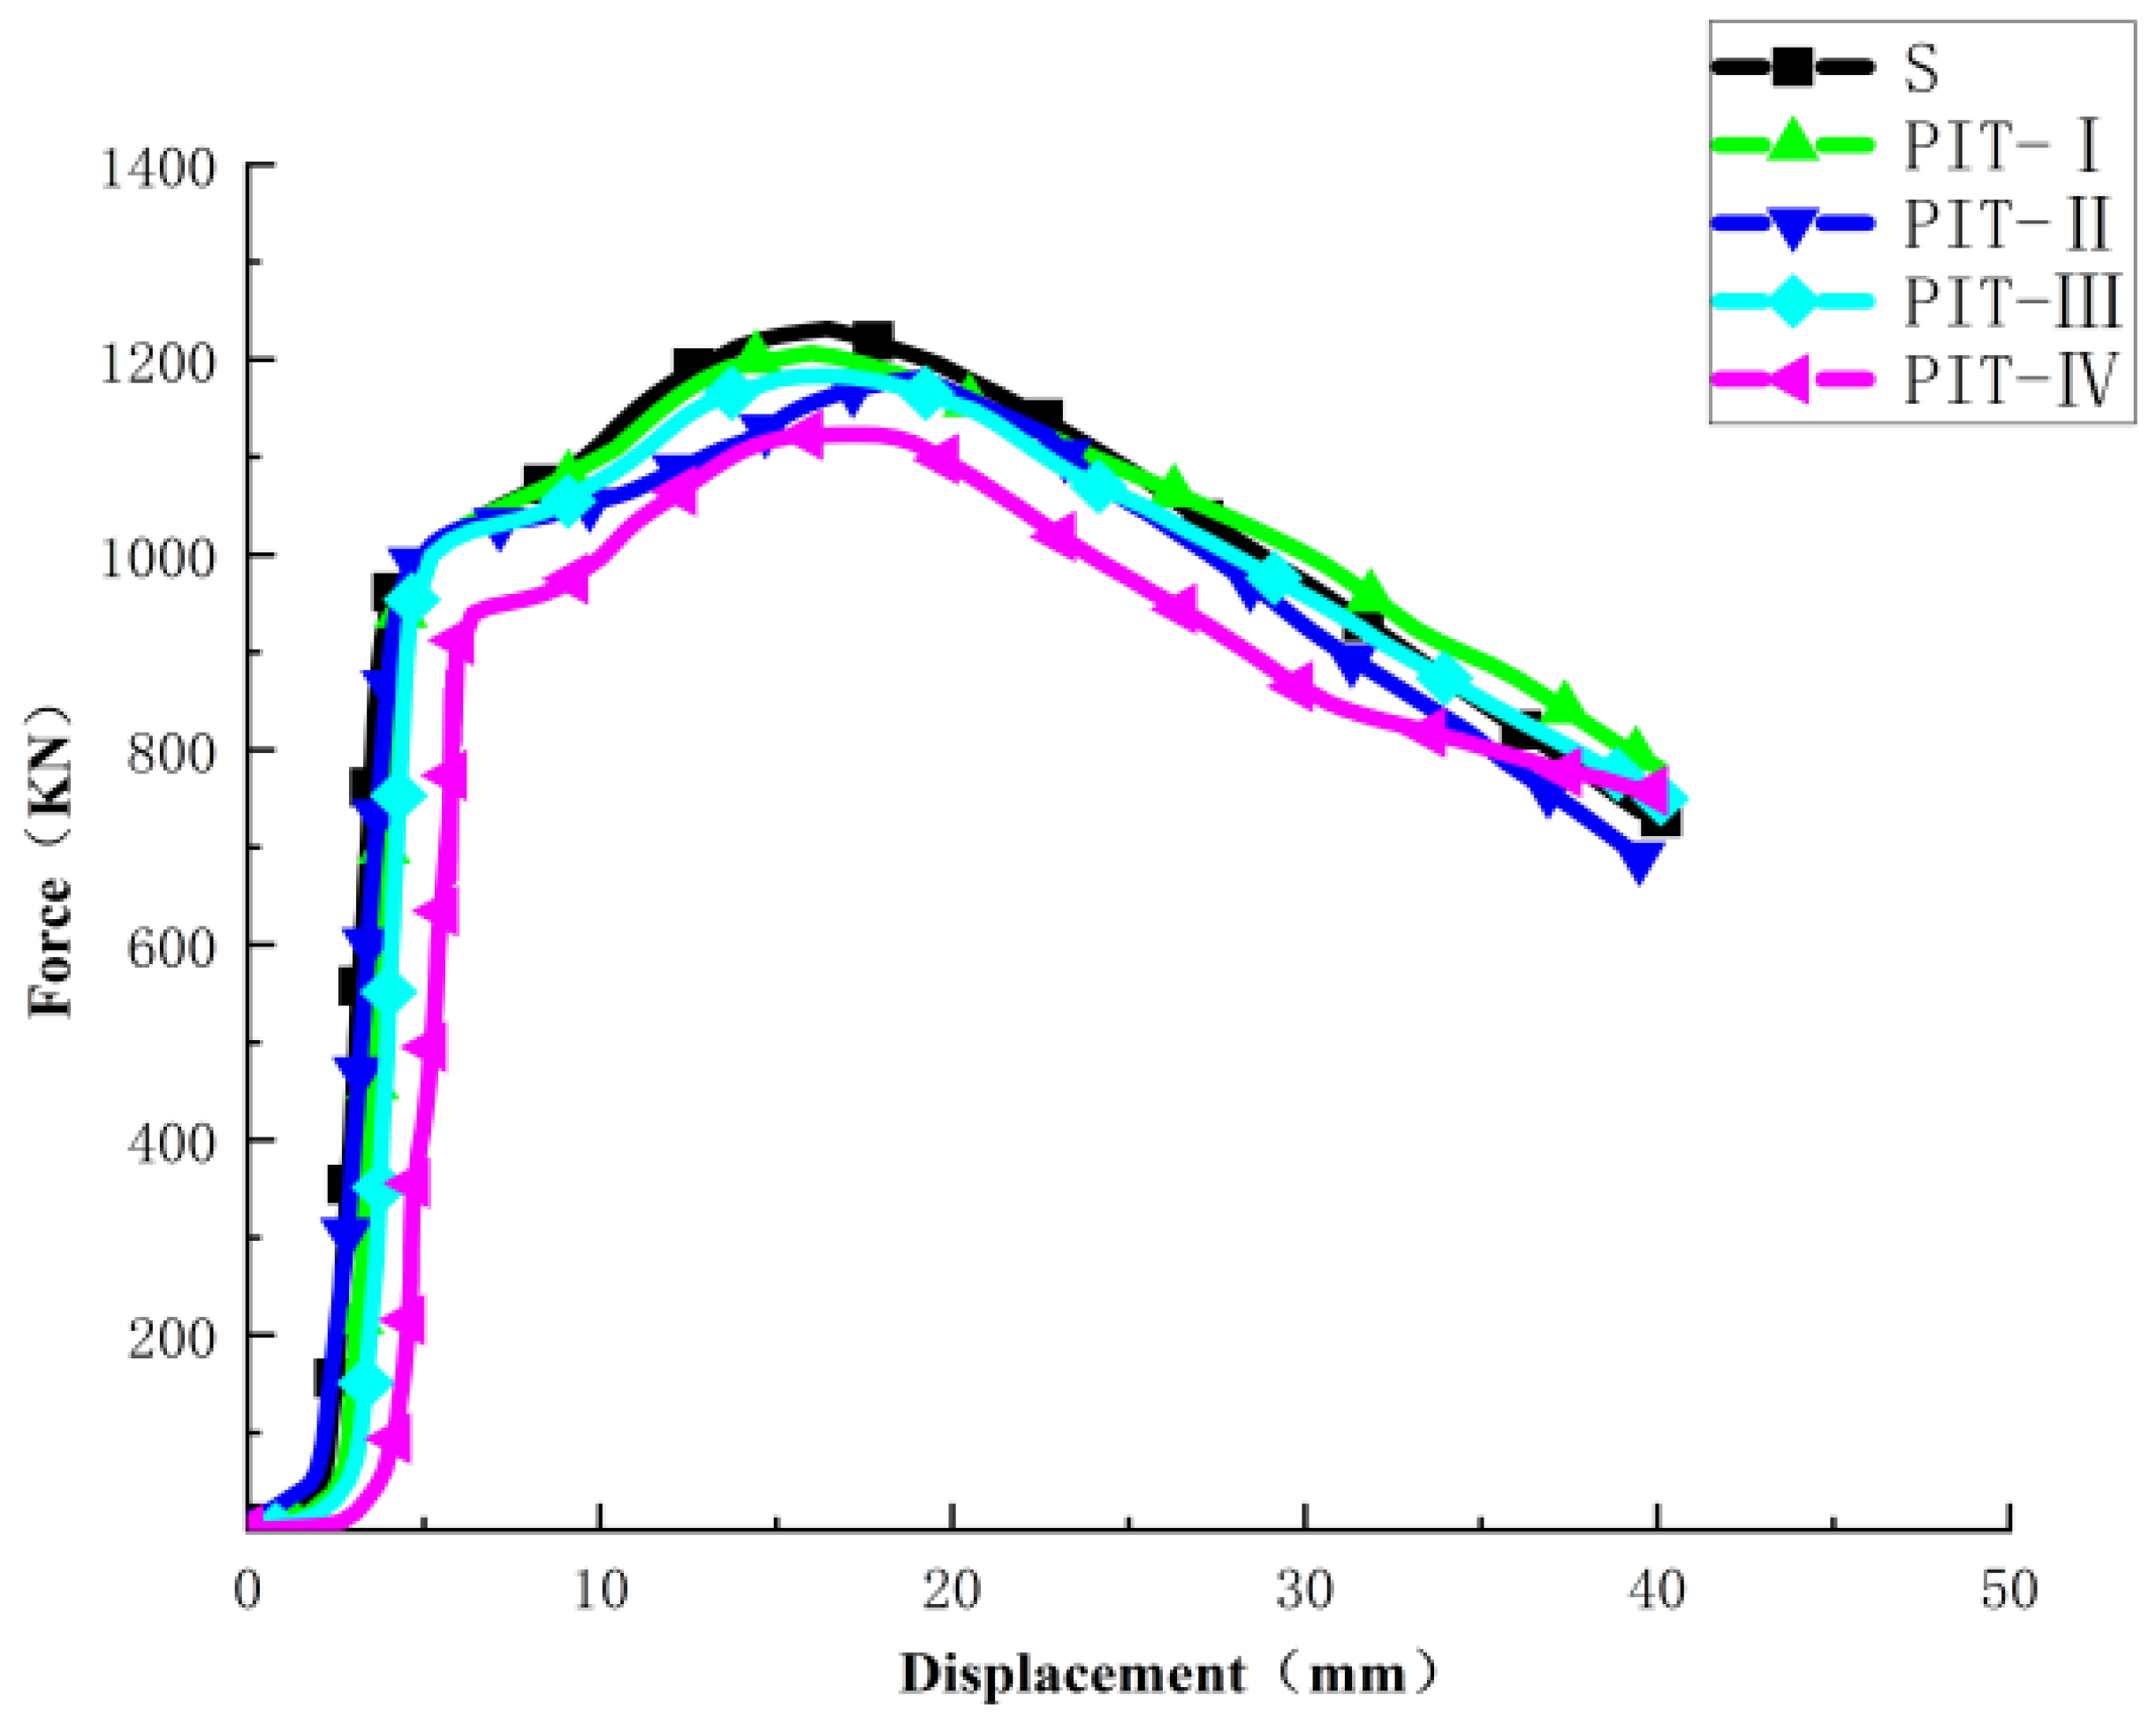
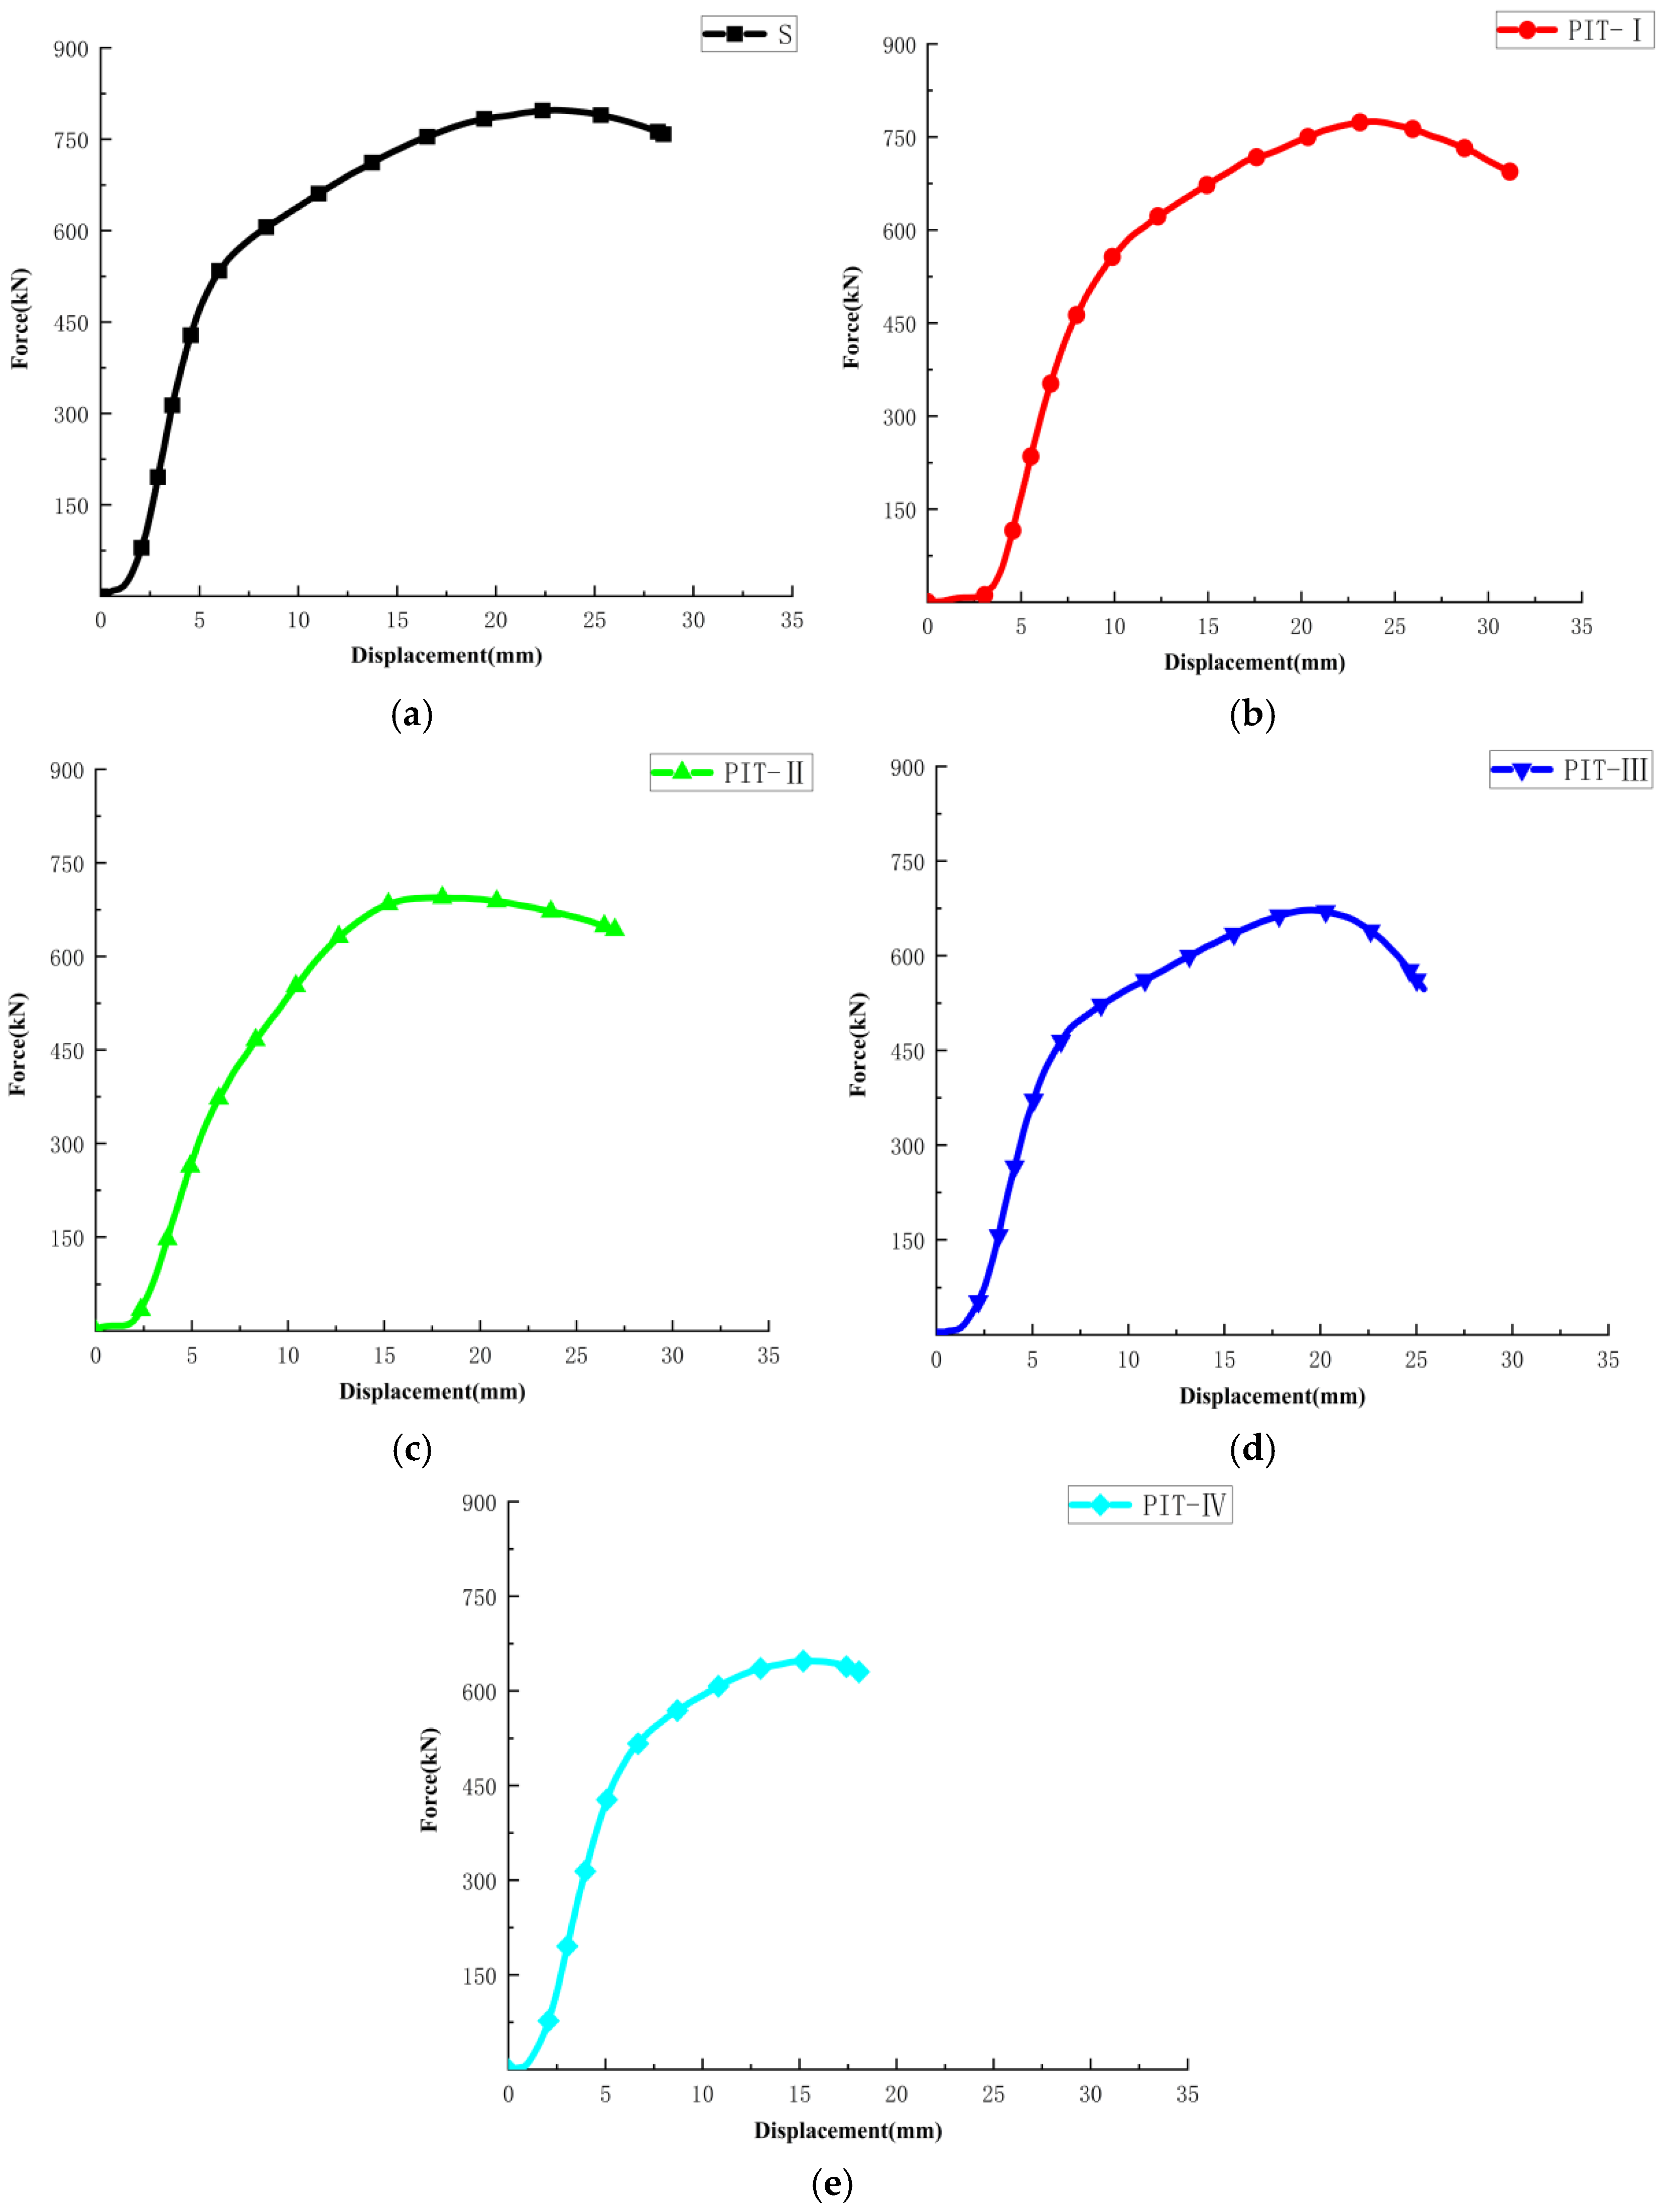
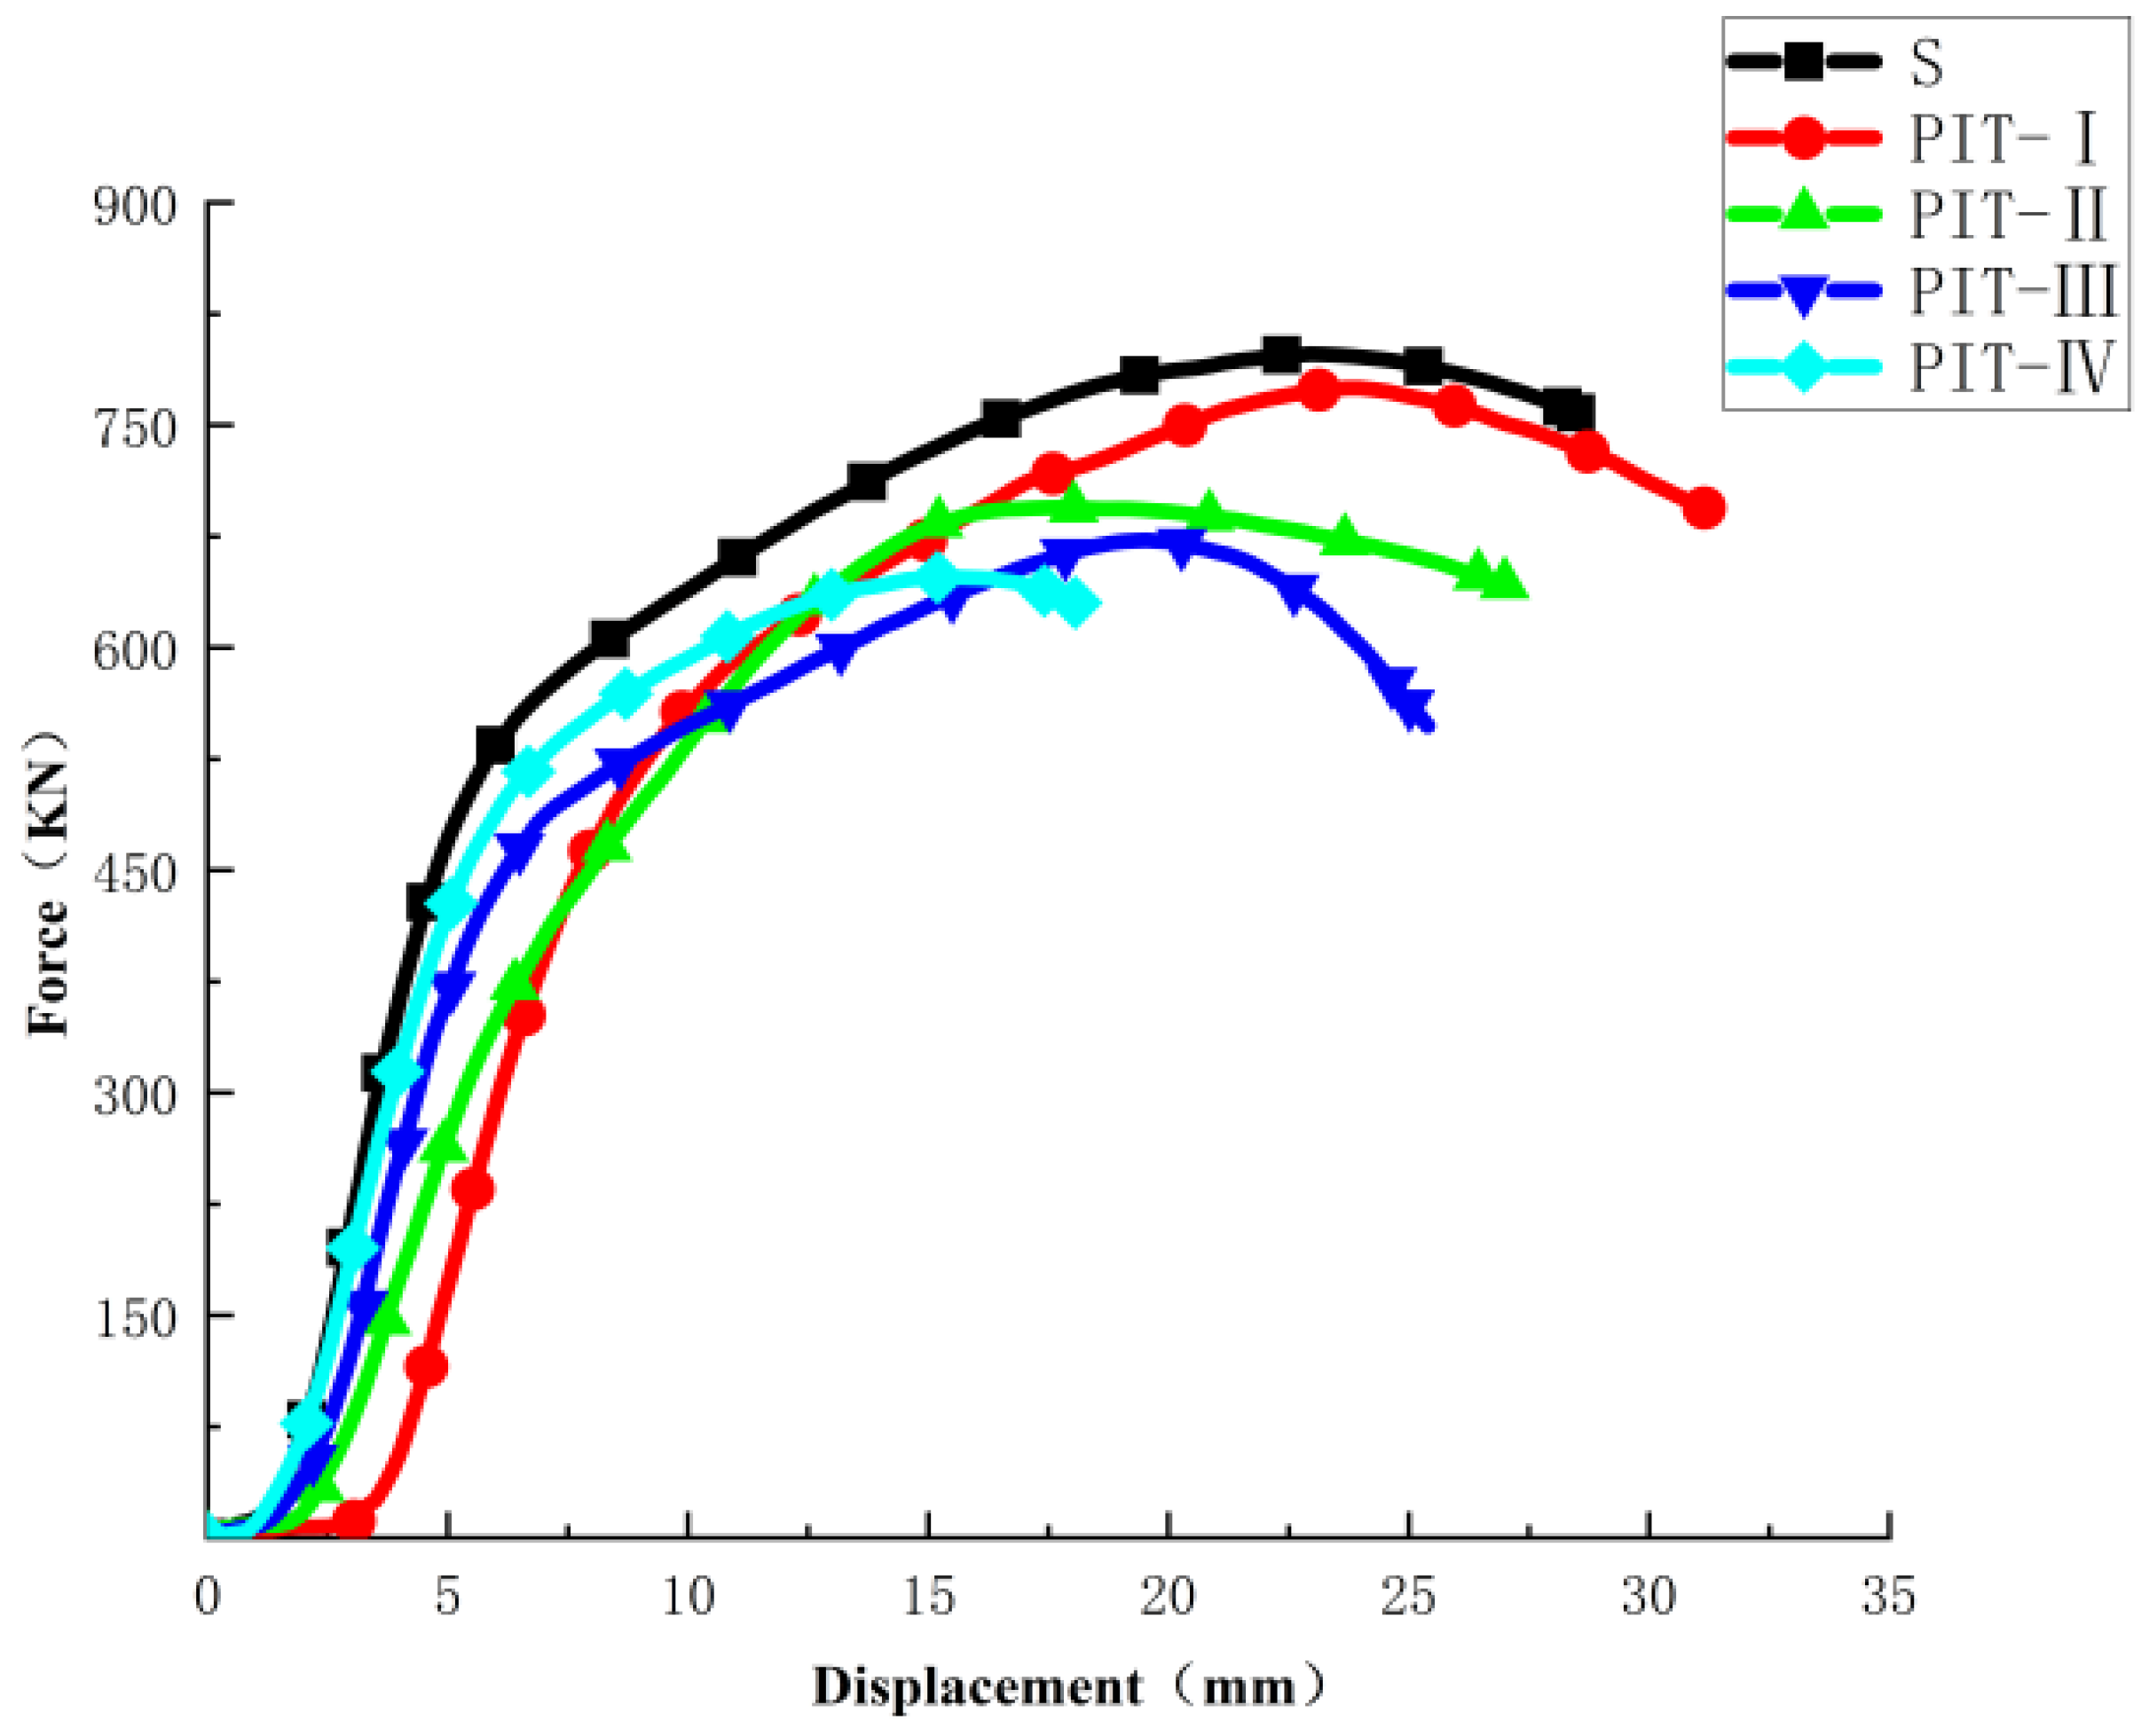
Under axial compression loads, it can be seen from the load–displacement curves characteristics in Figure 7 that compressive specimens C-S, C-PIT-I, C-PIT-II, C-PIT-III, and C-PIT-IV all undergo elastic, plastic, and failure stages, and Figure 8 shows compares the load–displacement curves of five compression specimens. At the beginning of loading, the curve is linear, and the slope of the load displacement curve indicates the initial stiffness of the specimen. The initial stiffness of the four groups of specimens (C-S, C-PIT-I, C-PIT-II and C-PIT-III) is similar, and the stiffness is significantly higher than that of C-PIT-IV, indicating that the inclined preform pitting damage will significantly reduce the stiffness of the specimen in the elastic stage. The horizontal row, vertical row, and triangular distribution of prefabricated pitting damage have little influence on the compressive stiffness of the sample at the elastic stage. When the load continues to increase, the load and displacement curve of the specimen is nonlinear, and the specimen is in the elastoplastic stage. The load continues to increase, and the specimen reaches the yield stage until the ultimate load of the specimen is loaded. Comparing the ultimate load of the five groups of specimens, it is found that the ultimate loads of C-PIT-I, C-PIT-II, C-PIT-III and C-PIT-IV are significantly lower than that of C-S.
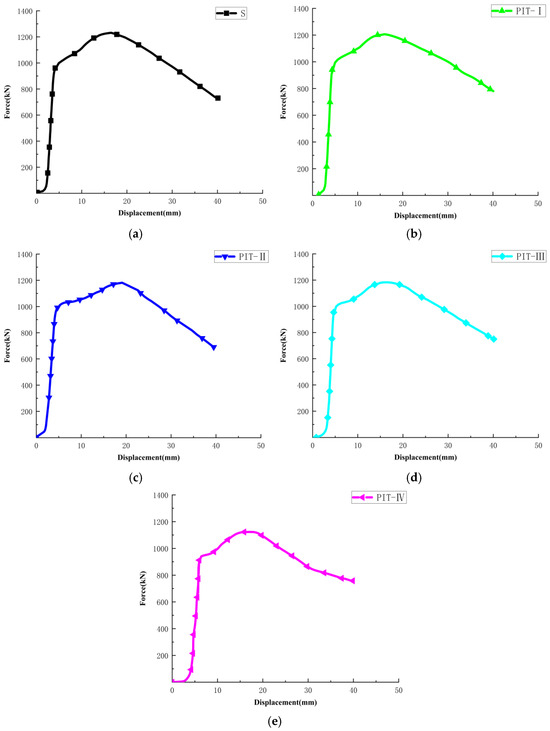
Figure 7.
Load–displacement curves of five compression specimens: (a) specimen C-S; (b) specimen C-PIT-I; (c) specimen C-PIT-II; (d) specimen C-PIT-III; (e) specimen C-PIT-IV.
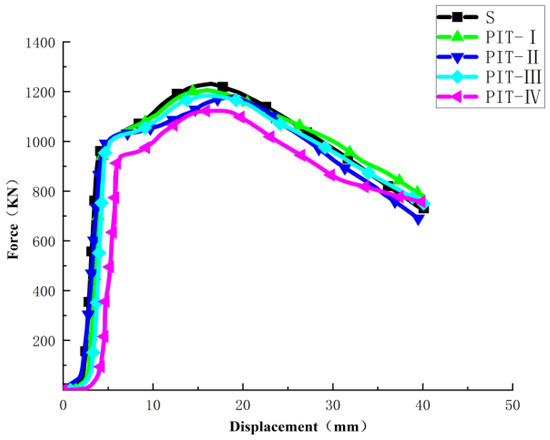
Figure 8.
Comparison of five groups of load–displacement curves in compression test.
Table 2 shows the statistical results of the bearing performance of all types of compressed samples in this compression test. According to the test results in Table 2, comparing specimen C-PIT-I with complete specimen C-S without pitting damage under the same working condition, it can be found that the ultimate load Pu and ultimate displacement ∆u decrease by 1.8% and 10.2%, respectively, and the yield load Py and yield displacement ∆y decrease by 1.78% and 33.3%, respectively. Comparing specimens C-PIT-II, C-PIT-III, and C-PIT-IV with complete specimen C-S without pitting damage under the same working condition, it can be found that the ultimate load Pu and ultimate displacement ∆u of specimen C-PIT-II decrease by 2.04% and 4.7%, respectively, and the yield load Py and yield displacement ∆y decrease by 1.8% and 36.95%, respectively. The ultimate load Pu and ultimate displacement ∆u of specimen C-PIT-III decrease by 3.55% and 7.35%, respectively, and the yield load Py and yield displacement ∆y decrease by 2.67% and 34.40%, respectively. The ultimate load Pu and ultimate displacement ∆u of specimen C-PIT-IV decrease by 8.82% and 3.18%, respectively, and the yield load Py and yield displacement ∆y decrease by 7.19% and 14.46%, respectively.

Table 2.
Load-bearing performance of compression specimens.
5. Results of Simulated Pitting Damage Three-Point Bending Test
5.1. Test Phenomena and Failure Modes of Three-Point Bending Test
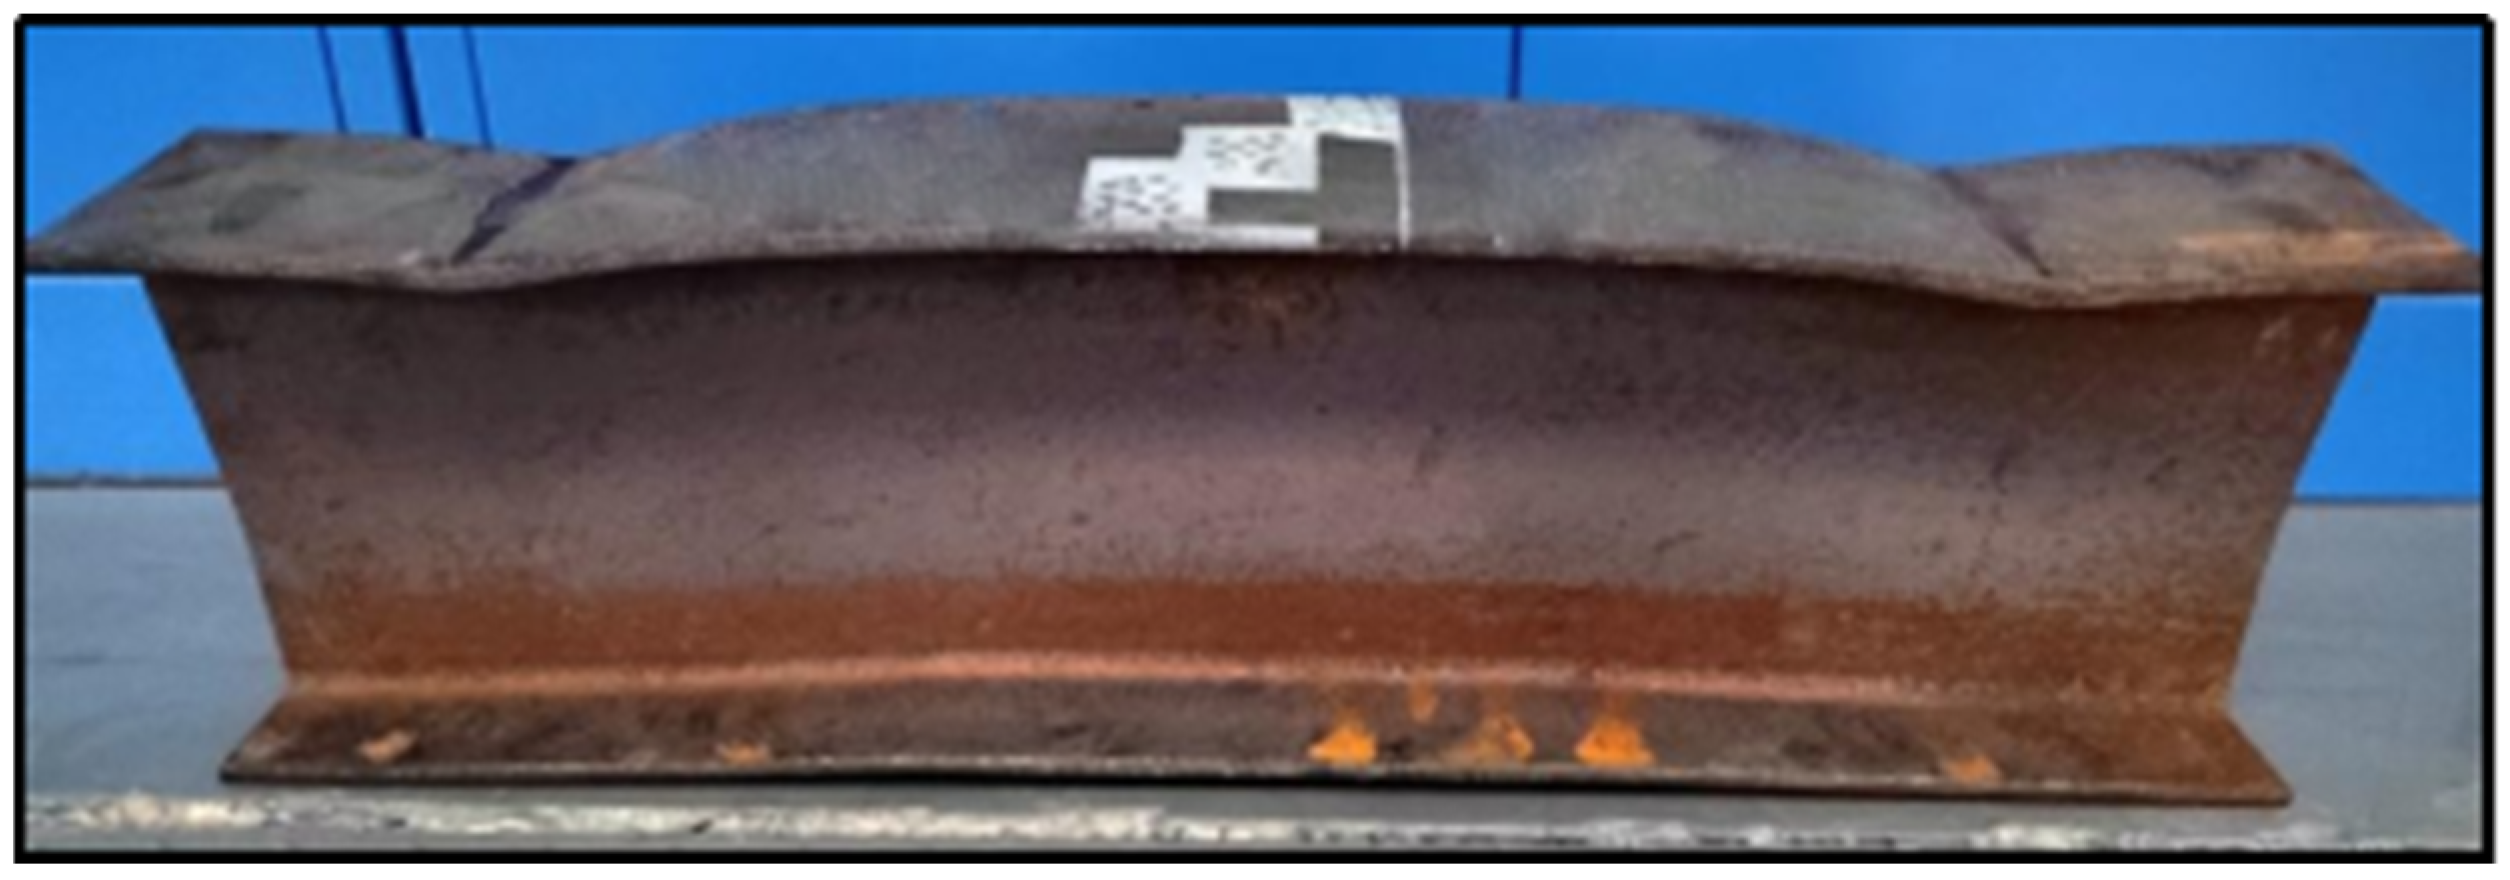
The pitting damage in the three-point bending test of I-beam was located at the center of the lower flange in the tension zone. During the loading process, when the load was relatively small, there was no obvious deformation in the flange plates and web plates of both the components with pitting damage and those without. As the load continuously increased, the deformation patterns of the components with and without pitting damage showed significant differences. For the components without pitting damage, slight local buckling first occurred in the compressed flange near the loading point, the shear deformation of the web plate continuously increased, and the web plate slightly bulged outward. The tension flange had no obvious deformation in the early stage of the test. As the load increased, local buckling occurred in the compressed flange near the mid-span point, the web plate bulged outward, and the final failure mode was the local buckling of the compressed flange near the loading point and the local buckling of the web plate (Figure 9). For the components with pitting damage, as the load continuously increased, slight local buckling first occurred in the compressed flange near the loading point, the shear deformation and buckling of the web plate were not obvious, and the tension flange plate of the pure bending section of the component had obvious deformation. Until the component reached the ultimate bearing capacity, the final failure mode was the local buckling of the compressed flange and the bending failure of the tension flange. Figure 10, Figure 11 and Figure 12, respectively, show the failure modes of components with a triangular distribution, inclined distribution, and vertical row distribution of pitting damage.

Figure 9.
Failure mode of three-point bending specimen without pitting damage.

Figure 10.
Failure mode of three-point bending specimen with pitting damage (BEND-PIT-III).
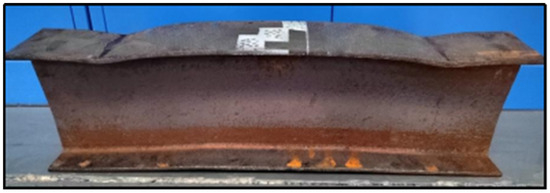
Figure 11.
Failure mode of three-point bending specimen with pitting damage (BEND-PIT-IV).

Figure 12.
Failure mode of three-point bending specimen with pitting damage (BEND-PIT-I).
This phenomenon indicates that pitting damage can affect the failure mode of steel components. In this three-point bending test, the pitting damage was prefabricated on the tensile flange plate, and due to the limitations of the test conditions, the span-to-depth ratio of the three-point bending sample was relatively small, which led to the failure mode of the steel component changing from the local buckling of the compressed flange and the local buckling of the web to the local buckling of the compressed flange and the bending failure of the tensile flange. Based on the test results, it can be inferred that if the pitting damage is prefabricated on the web, more severe pitting damage may also cause the original bending failure to experience shear brittle failure.
5.2. Analysis of Bearing Capacity and Deformation Capacity of Three-Point Bending Test
Figure 13 shows the load mid-span displacement relationship curves of three-point bending tests; Figure 14 shows the comparison of load–mid-span deflection curves of three-point bending specimens. It can be seen that with the addition of pitting damage, the ultimate bearing capacity of the steel beam gradually decreases. In addition, the slope of the linear elastic stage and the final vertical displacement at the mid-span of the specimens all show varying degrees of reduction, among which the sample with the inclined pitting damage shows the most significant decrease. For the undamaged intact components, after the full-section yields, a distinct strengthening phenomenon occurs, during which the load increase rate slows down while the deformation continues to increase until the final failure. For the components with pre-existing damage, the ultimate bearing capacity is reached shortly after the full-section yields, and the strengthening stage becomes shorter or even almost disappears, leading to the final failure of the component. Meanwhile, based on the data from these five groups of curves, the relevant mechanical performance index of the beams with and without pitting damage can be determined. The yield load (Py) is taken as the load value corresponding to the lowest point of the load–mid-span displacement curve at the yield stage, and the yield displacement (∆y) is taken as the mid-span vertical displacement when the member reaches the yield load. The ultimate load (Pu) is taken as the load value corresponding to the failure of the beam in the test, and the ultimate displacement (∆u) is taken as the mid-span vertical displacement when the component reaches the ultimate load. Table 3 presents the statistical results of the bearing performance of all components in these tests.
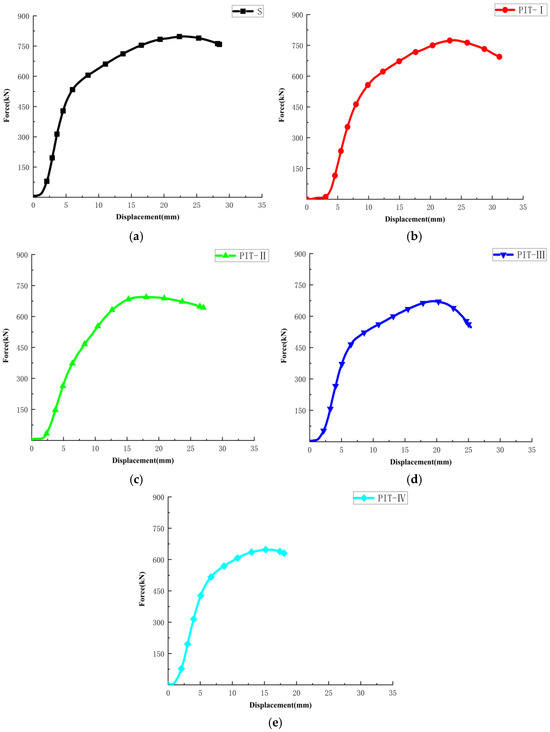
Figure 13.
Load–mid-span deflection curves of five specimens in three-point bending: (a) intact specimen BEND-S; (b) specimen BEND-PIT-I; (c) specimen BEND-PIT-II; (d) specimen BEND-PIT-III; (e) specimen BEND-PIT-IV.
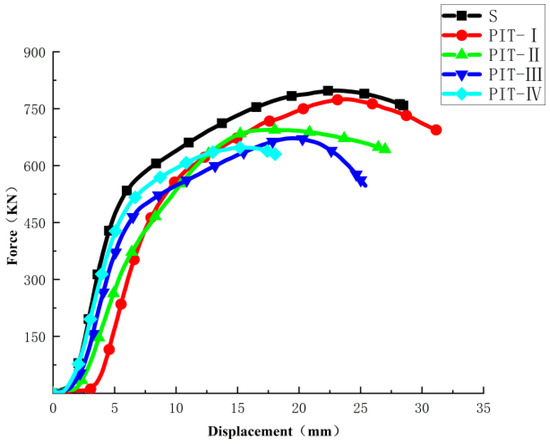
Figure 14.
Comparison of five groups of load–mid-span deflection curves in three-point bending test.

Table 3.
Characteristic points in the test results of the three-point bending specimen.
From the test results in Table 3, when comparing specimen BEND-PIT-I with the intact specimen BEND-S under the same working conditions, it is found that its yield displacement ∆y and ultimate displacement ∆u hardly decrease, while the yield load Py and ultimate load Pu decrease by 0.47% and 2.41%, respectively. Similarly, when comparing specimen BEND-PIT-II with the intact specimen BEND-S under the same working conditions, it can be found that its yield displacement ∆y does not decrease, but the ultimate displacement ∆u decreases by 22.7%, and the ultimate load Pu and yield load Py decrease by 12.8% and 2.72%, respectively. For specimen BEND-PIT-III, the ultimate load Pu and ultimate displacement ∆u decreased by 15.54% and 14.86%, respectively, and the yield load Py and yield displacement ∆y decrease by 14.0% and 10.35%, respectively. For specimen BEND-PIT-IV, the ultimate load Pu and ultimate displacement ∆u decrease by 12.31% and 32.41%, respectively, and the yield load Py and yield displacement ∆y decrease by 19.74% and 30.01%, respectively.
6. Comparative Analysis of Simulated Pitting Damage Compression and Three-Point Bending Test Results
By analyzing the influence of pitting damage on the failure mode, bearing capacity, and deformation capacity of I-steel members under compression and three-point bending loading, it is found that the same pitting damage distribution type has a great influence on the compression and three-point bending test results, and the different pitting damage distribution type has a great influence on the test results under the same loading condition.
From the perspective of failure modes, in the simulated pitting damage compression test, both the components with pitting damage and those without pitting damage experienced web-buckling failure modes, indicating that pitting damage did not alter the failure mode of the compression test. In the simulated pitting damage three-point bending test, the components without pitting damage ultimately exhibited failure modes related to the local buckling of the compressed flange and local buckling of the web near the loading point. For the components with pitting damage, the final failure mode was characterized by local buckling of the compressed flange and bending failure of the tensile flange. Pitting damage significantly changed the bending failure mode.
From the perspective of bearing capacity, in the simulated pitting damage compression test, under the same failure mode, the yield load and ultimate load of the four types of pitting damage specimens all decreased to varying degrees, among which the yield load and ultimate load of the inclined pitting damage decreased the most. In the simulated pitting damage three-point bending test, the failure mode changed, and the yield load and ultimate load of the four types of pitting damage specimens also decreased to varying degrees, while the yield load and ultimate load of the inclined pitting damage decreased the most.
From the perspective of deformation capacity, in the simulated pitting damage compression test, under the same failure mode, the yield displacement and ultimate displacement of the four types of pitting damage specimens all decreased to varying degrees. Among them, the yield displacement of the horizontally arranged pitting damage decreased and the ultimate displacement of the vertically arranged pitting damage decreased the most. In the simulated pitting damage three-point bending test, the failure mode changed. The yield displacement and ultimate displacement of the horizontally and vertically arranged pitting damage specimens did not show a significant decrease, while the specimens with triangular and inclined pitting damage showed a significant decrease. Moreover, the inclined pitting damage specimens had the highest decrease in both yield displacement and ultimate displacement.
7. Comparative Analysis of Simulation Results and Damage Tests
7.1. Simulation of Compression Test with Pitting Damage
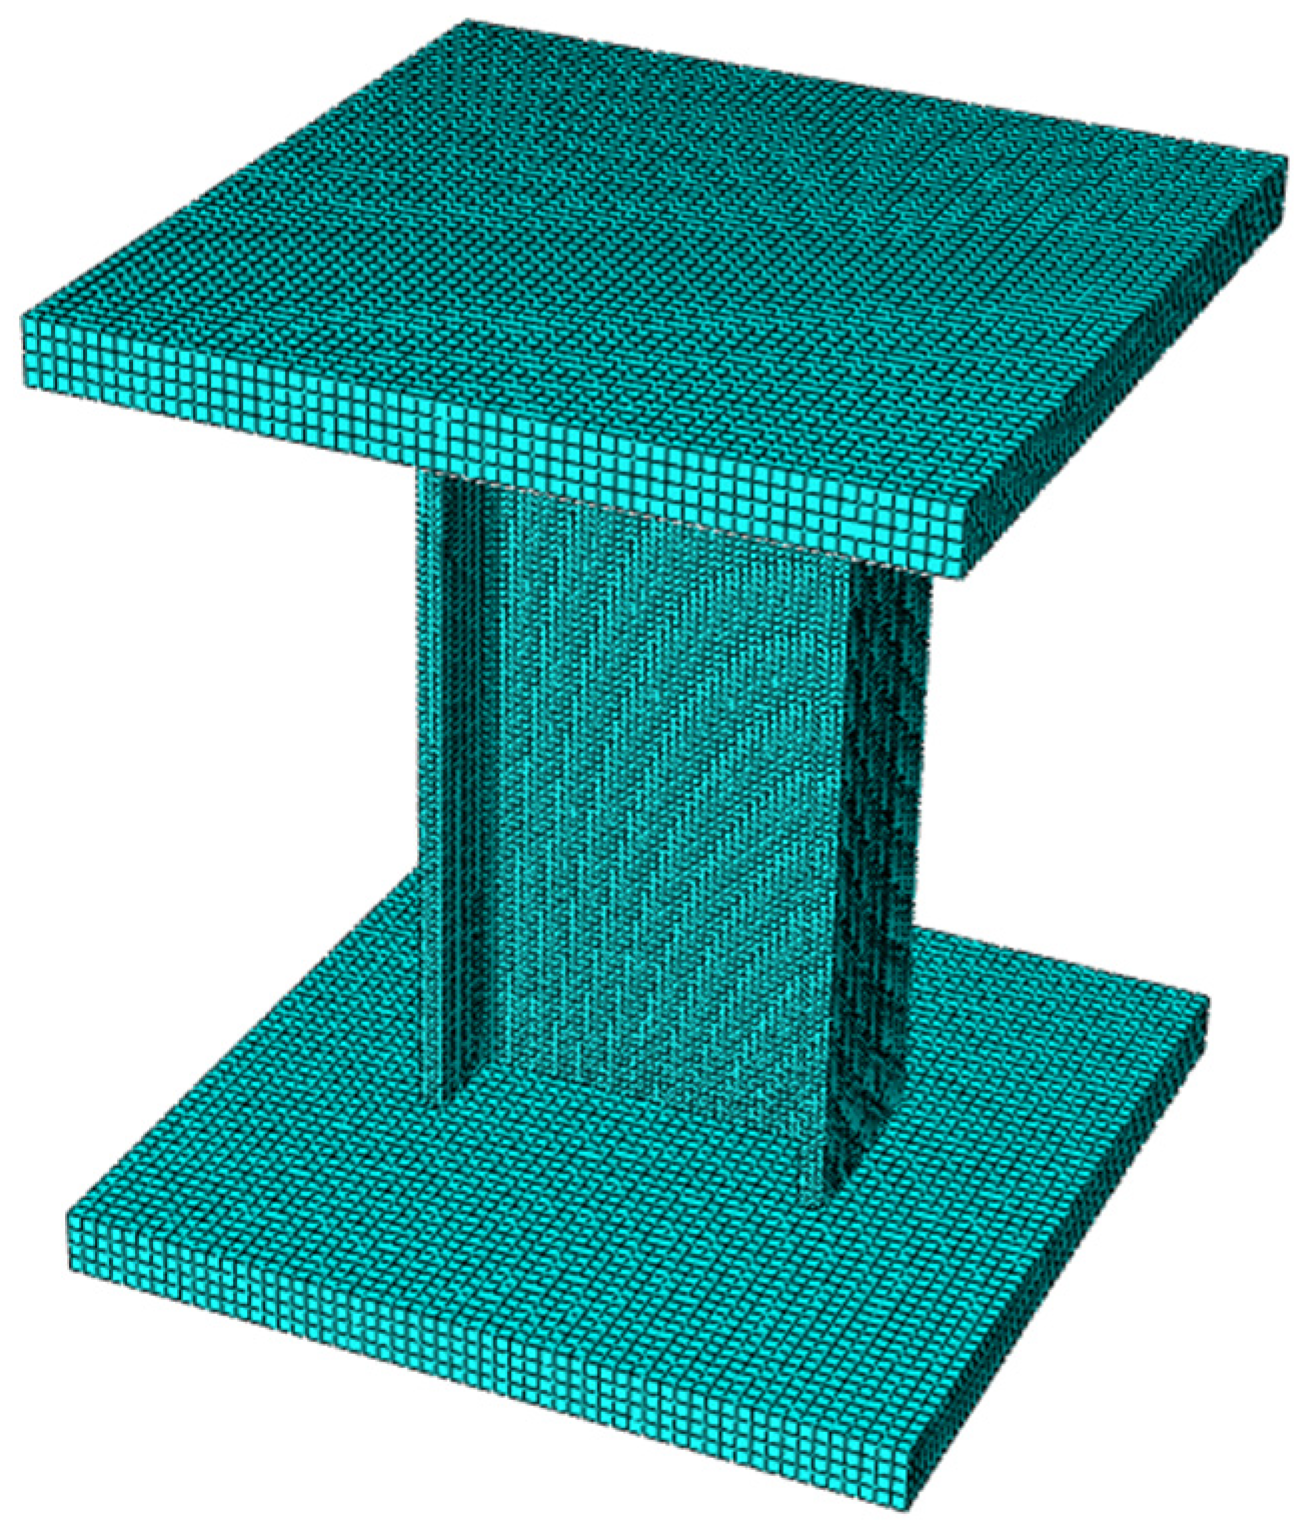
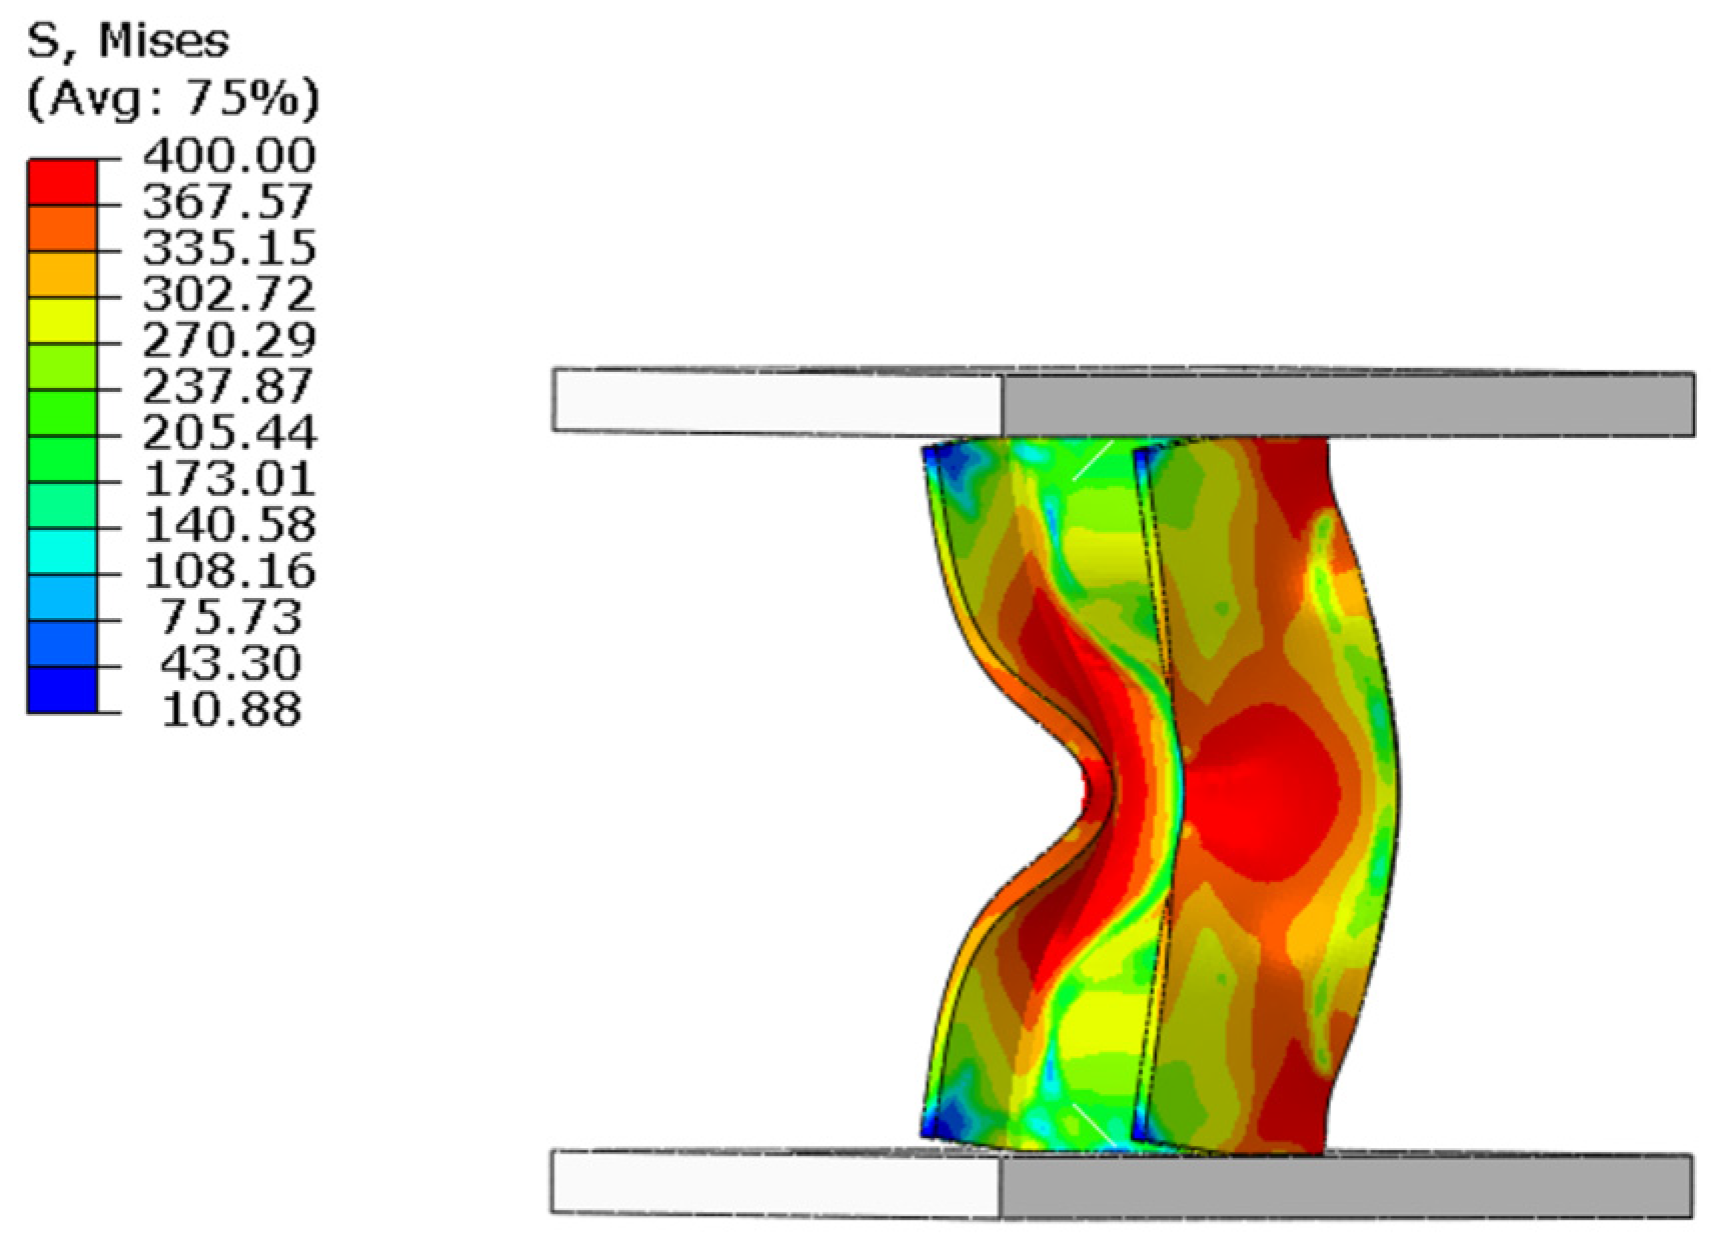
In this section, the ABAQUS2022 software is used to conduct a detailed finite element simulation of the compression and three-point bending test processes. Firstly, the three-dimensional solid modeling of the I-beam compression is completed using the SolidWorks2022 software, along with meshing and the compression test results (as shown in Figure 15 and Figure 16). These are then fully imported into the ABAQUS simulation environment. Based on tension and compression test data of Q345 steel, the true stress–strain constitutive curve is constructed to precisely characterize the material’s mechanical behavior. The measured displacement data during the test is used as boundary conditions to be applied to the model, ensuring that the simulation conditions are consistent with the actual test conditions.
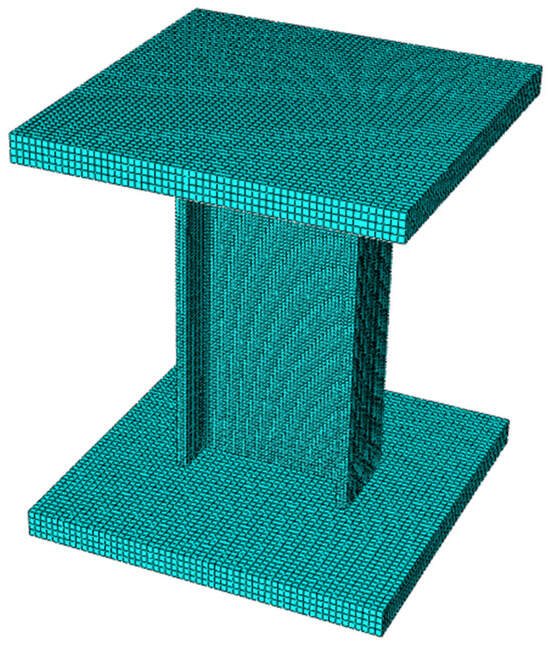
Figure 15.
Grid division of compression experiment.
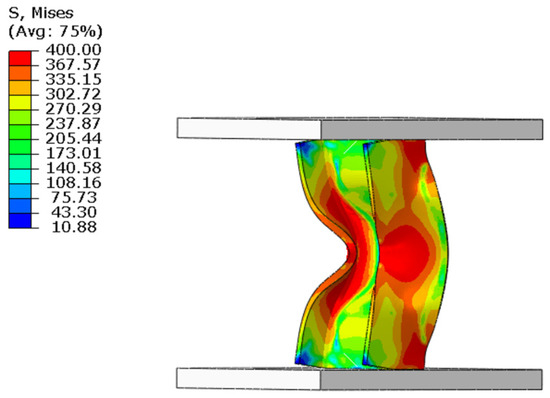
Figure 16.
Simulation results of I-beam compression.
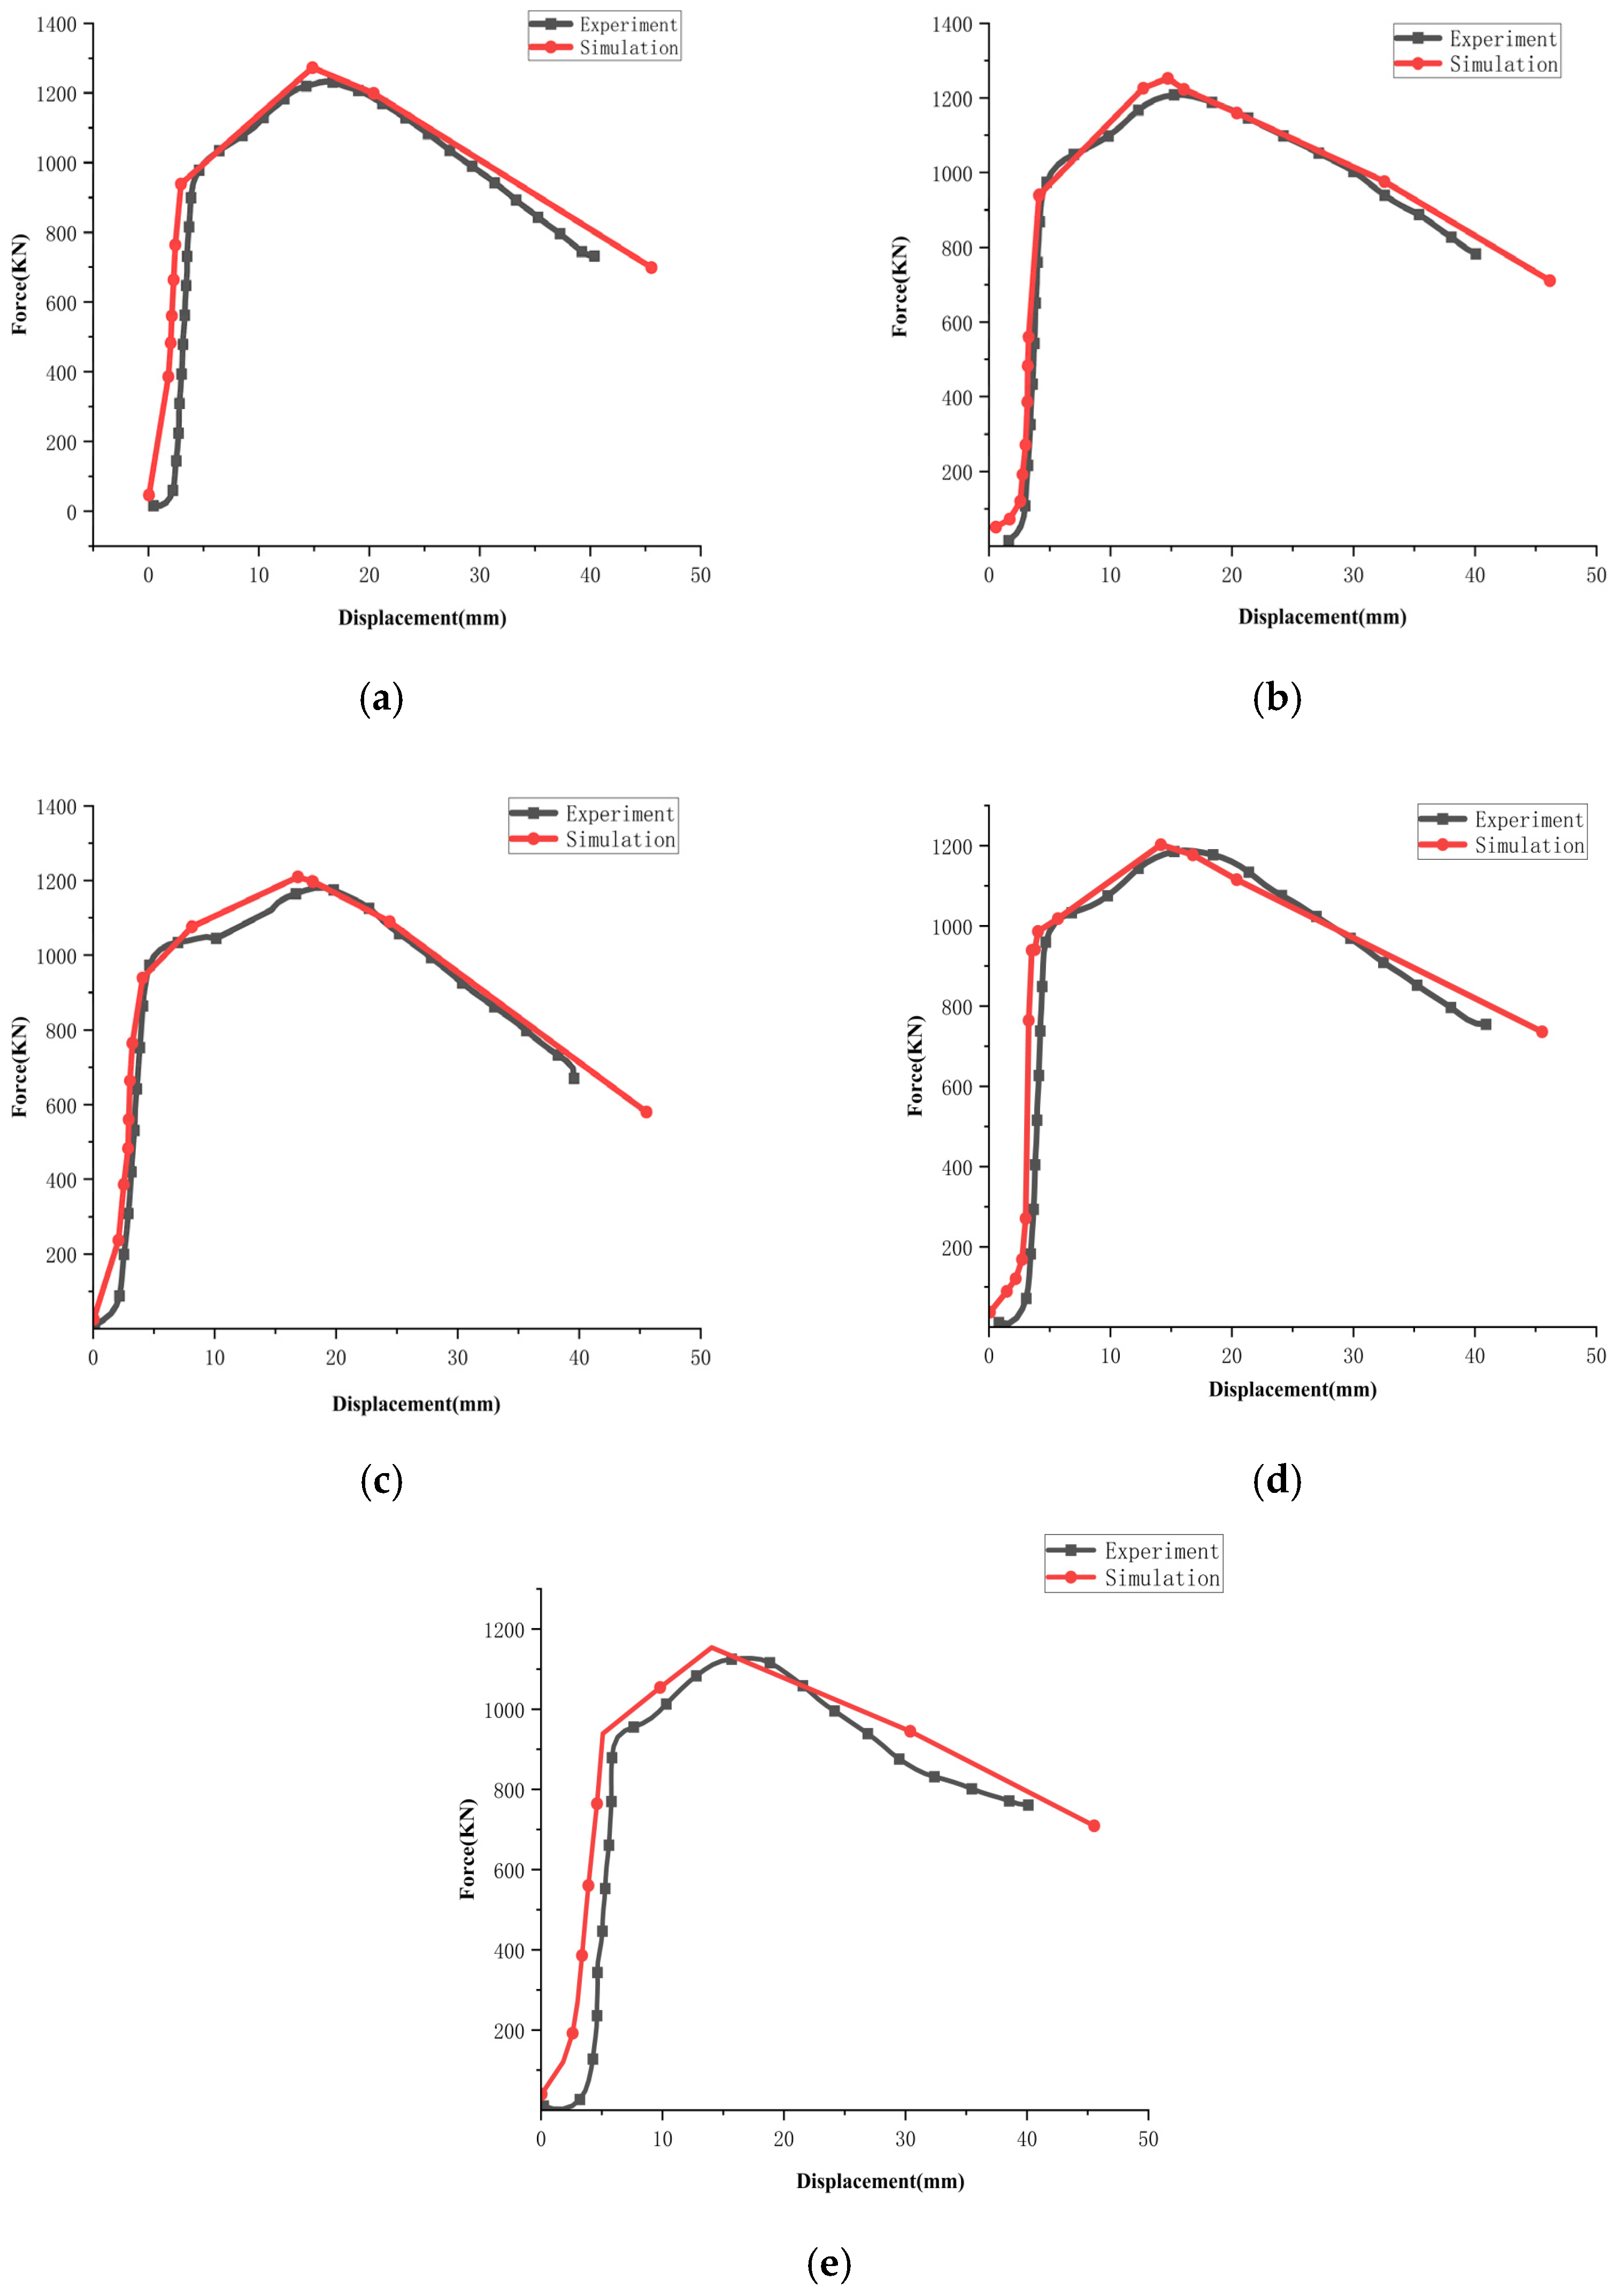
During the simulation compression test, the upper and lower pressure heads are set as rigid bodies, and the contact between the pressure head and the specimen is set as face-to-face contact. To simulate the real situation during the test, a friction coefficient is set at the contact area. The loading method is as follows: the lower-end platform is fixed and the upper-end platform is loaded and moves downward. Based on the simulation results, the load–displacement curves can be obtained. By comparing the simulation results with the experimental results, as shown in Figure 17a–e, it can be seen that the finite element fitting results are highly consistent with the actual load–displacement curve obtained from the experiment.
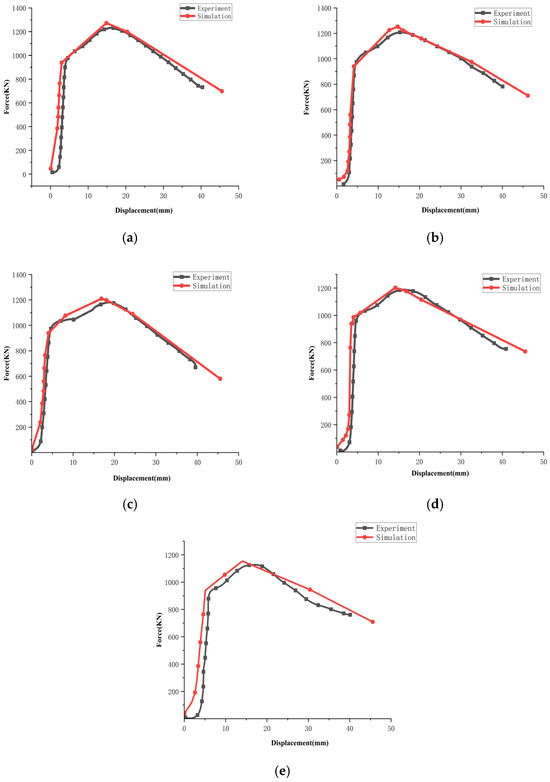
Figure 17.
Comparison between simulation and experimental results: (a) compression C-S; (b) compression C-PIT-I; (c) compression C-PIT-II; (d) compression C-PIT-III; (e) compression C-PIT-IV.
7.2. Simulation of Three-Point Bending Test
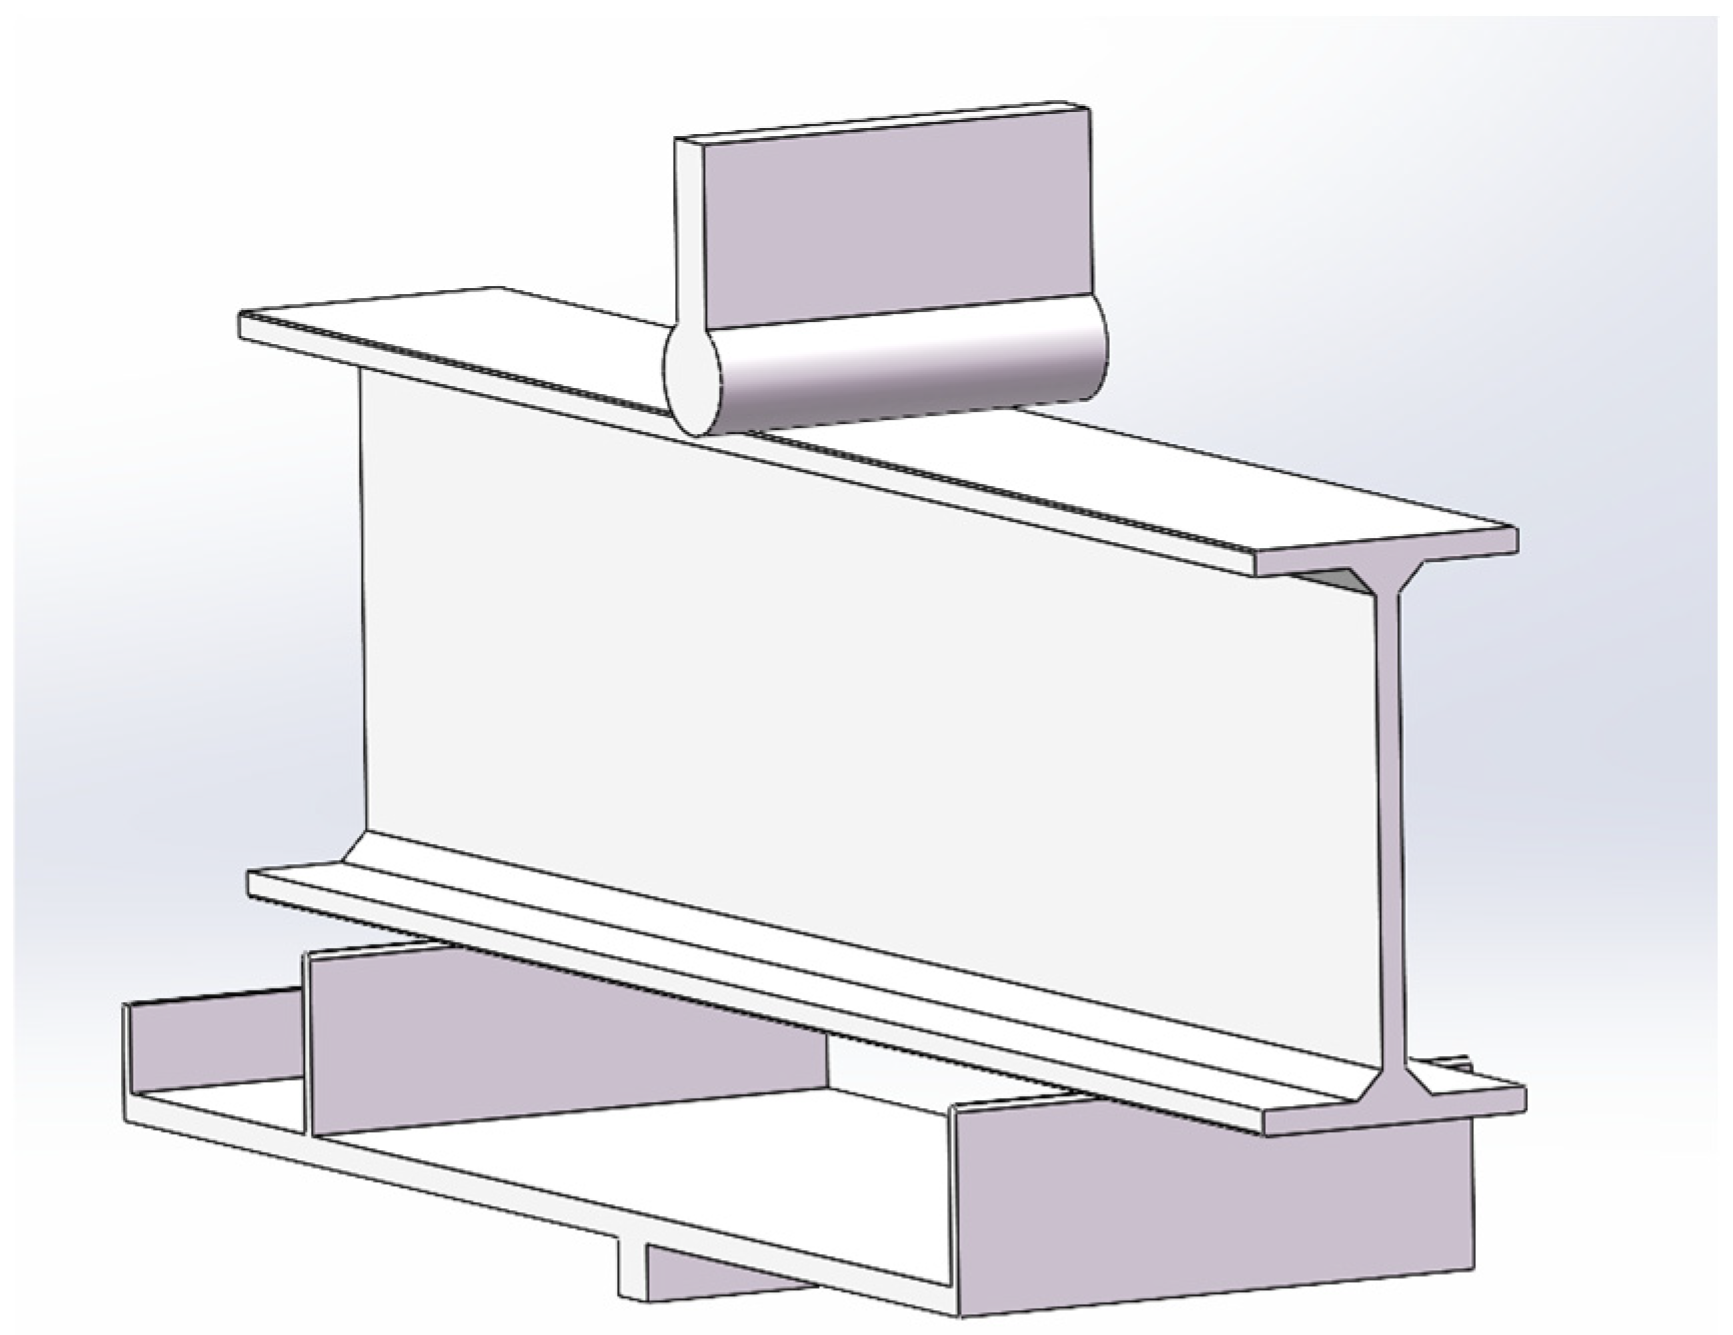
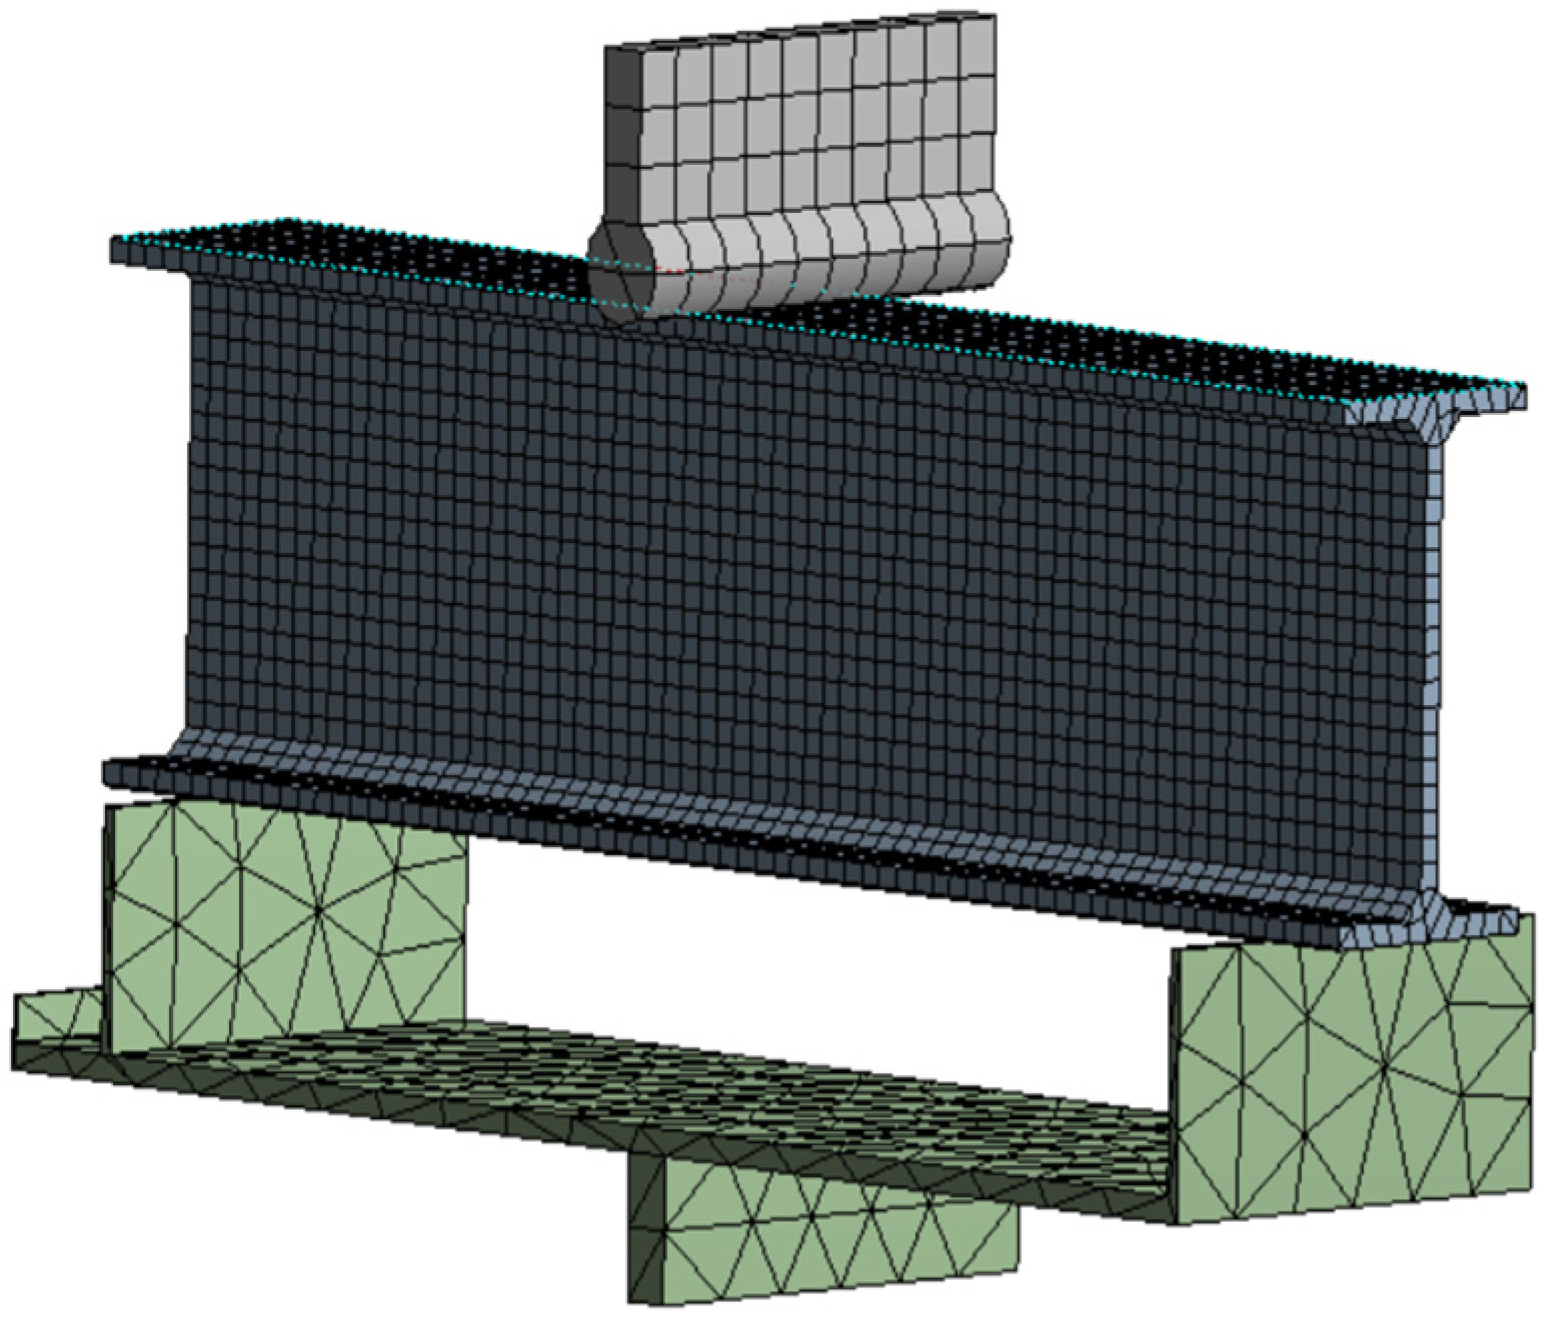
During the simulation of the three-point bending test, a three-dimensional solid model was used. The model and mesh division are shown in Figure 18 and Figure 19. The upper pressing head and the three-point bending fixture are set as rigid bodies. The contact areas between the pressing head and the specimen and between the specimen and the fixture are all arranged to display line–plane contact. The loading method involves fixing the lower end of the fixture and moving the upper pressing head downward.
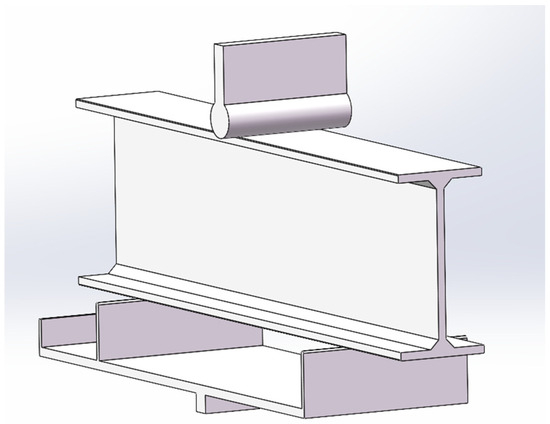
Figure 18.
Solid model of three-point bending test.
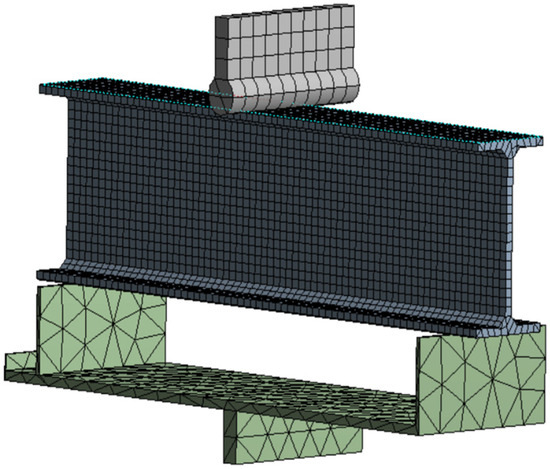
Figure 19.
Three-point bending test meshing.
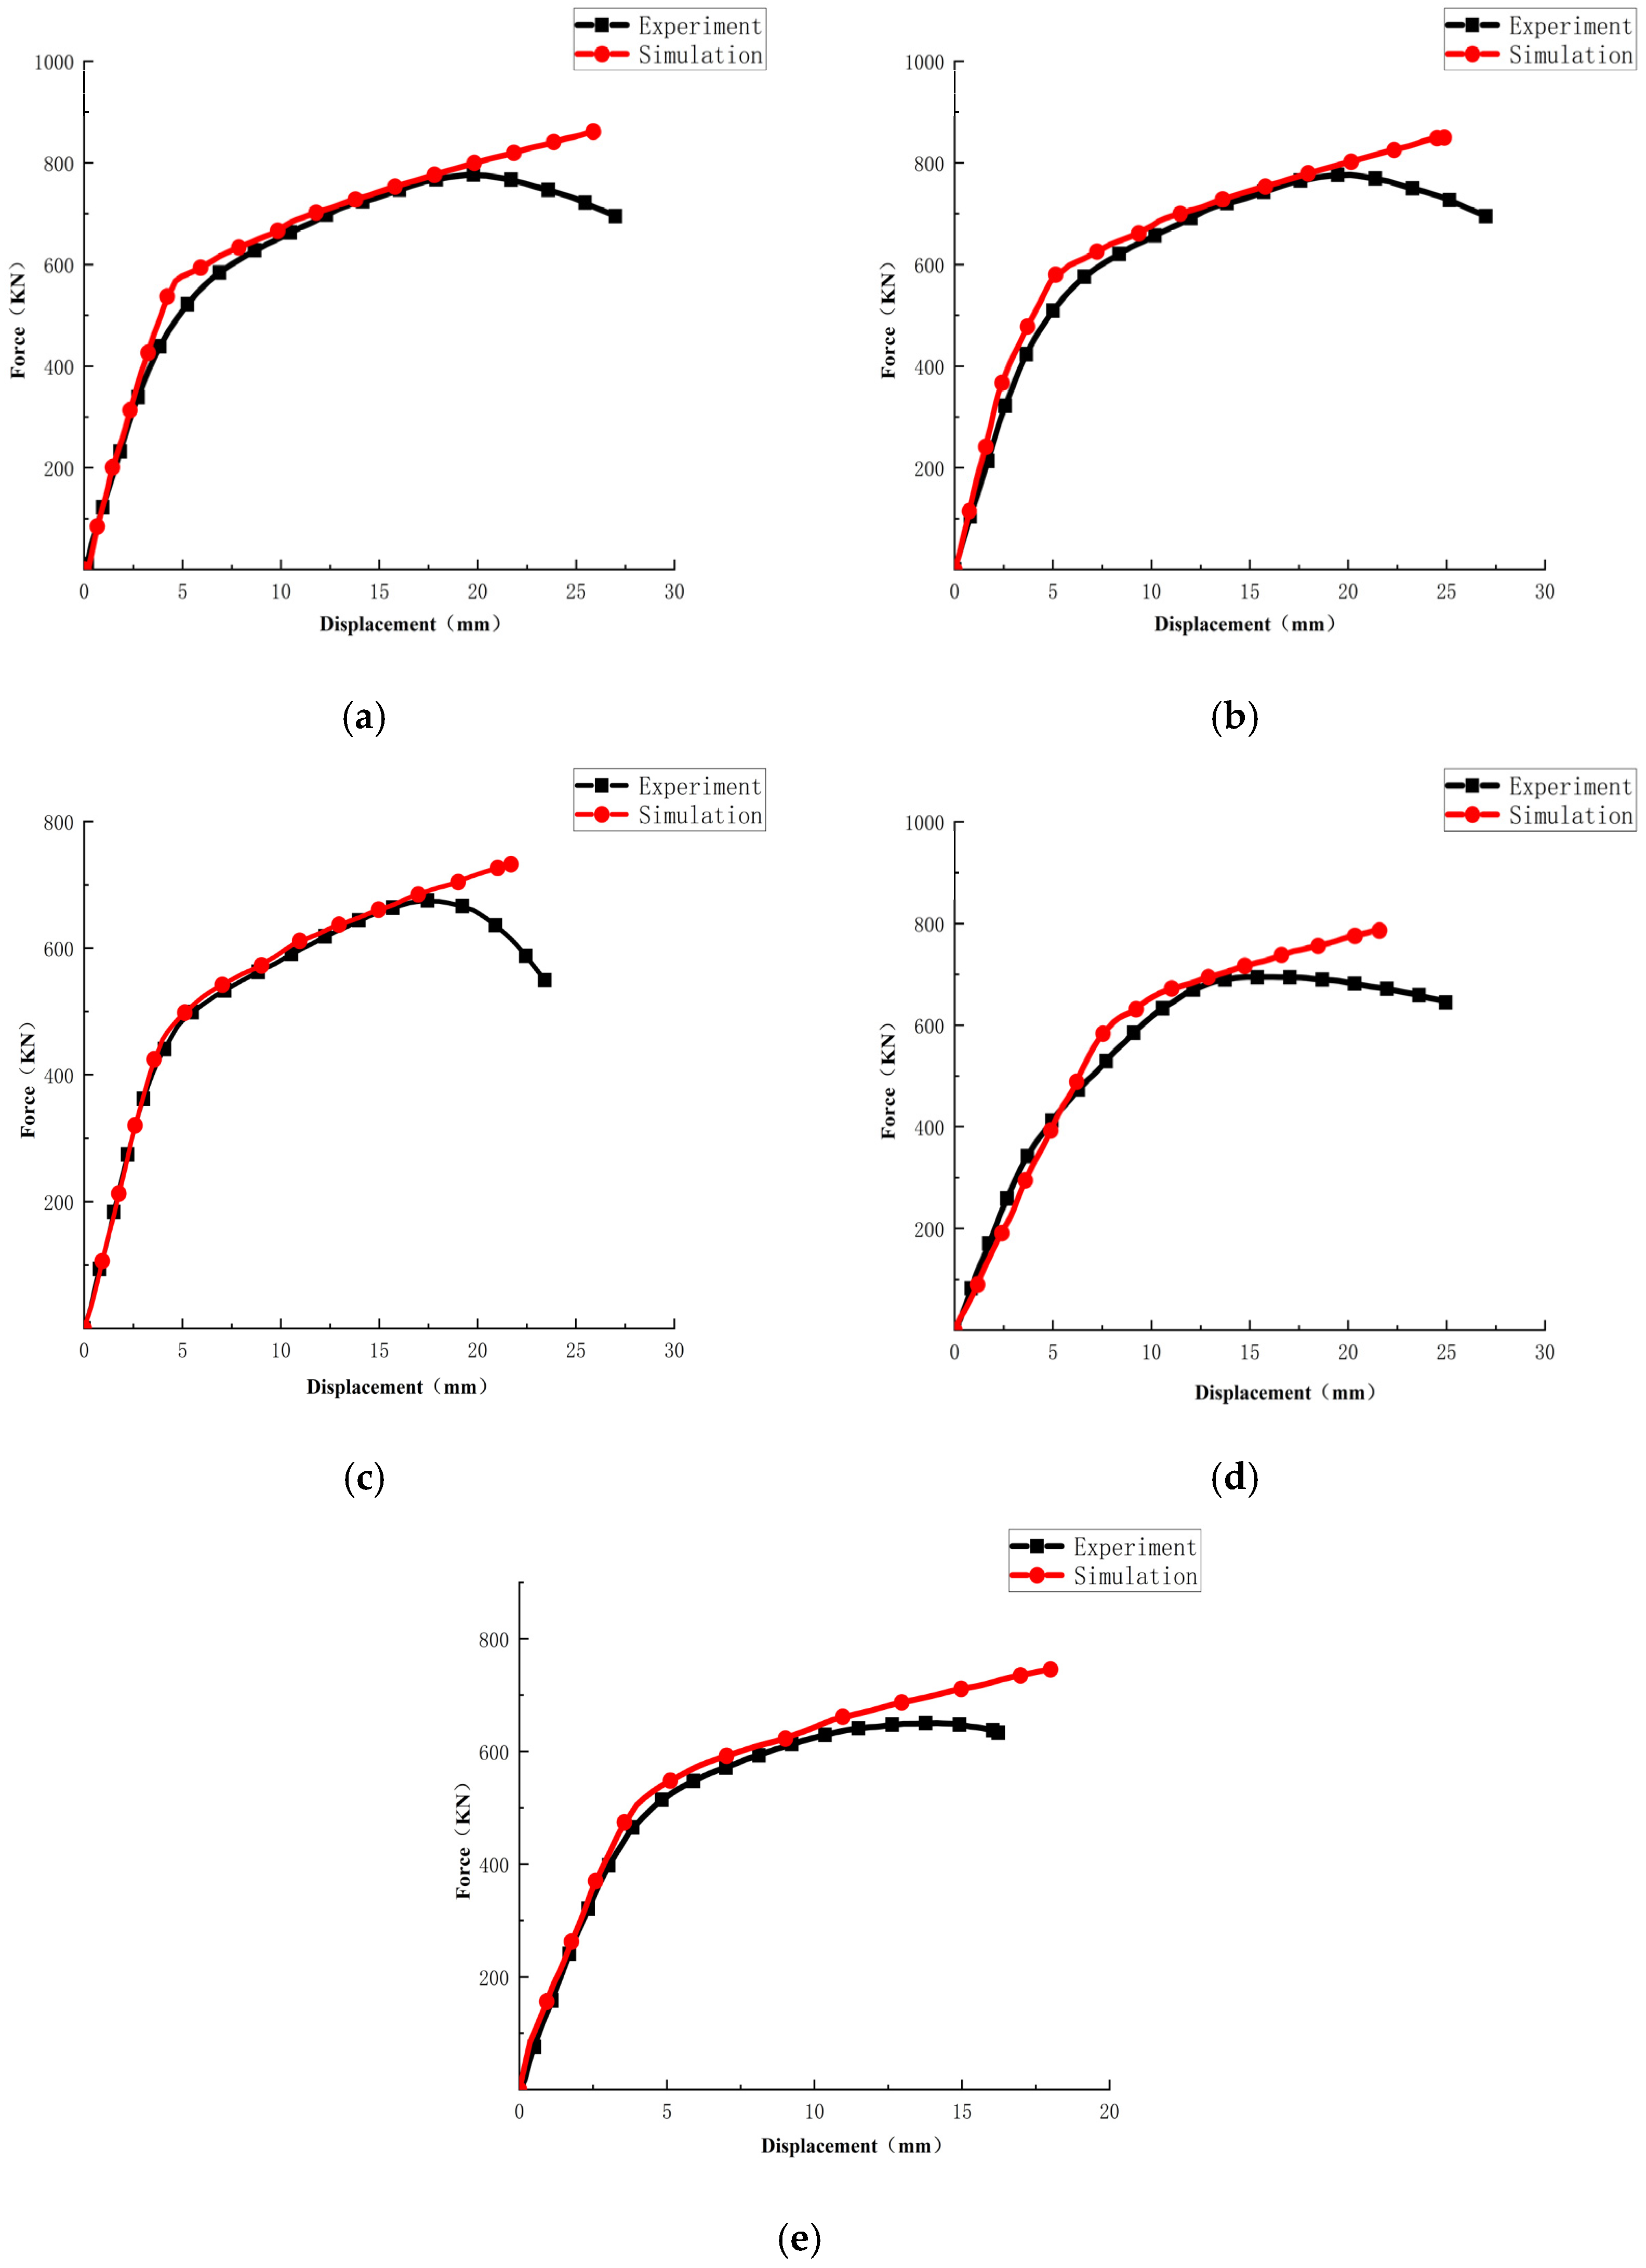
Figure 20a–e, respectively, show the comparison between the load–span deflection curves obtained from the finite element simulation and the actual load–span deflection curves measured in the experiment for the three-point bending process. From Figure 20a–e, it can be seen that the fitting results of the finite element simulation and the actual load–span deflection curves obtained from the experiment are highly consistent, indicating that the finite element simulation can reflect the actual test situation.
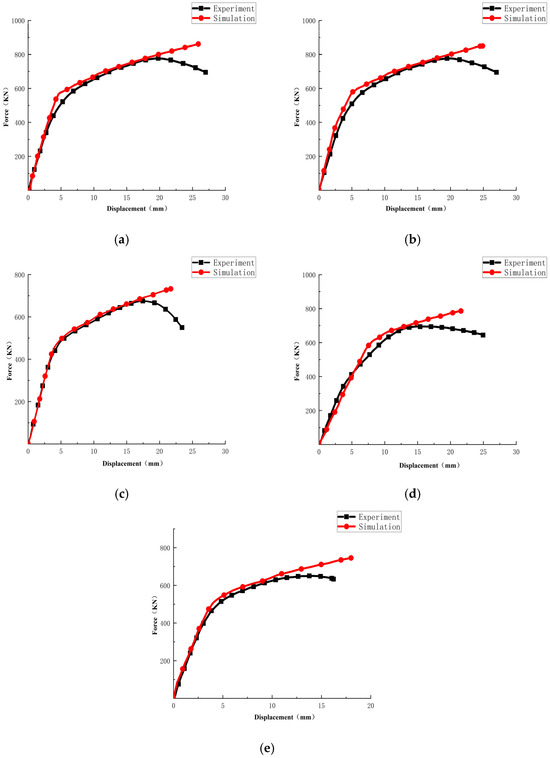
Figure 20.
Comparison of load–mid-span deflection curves of five specimens in three-point bending between simulation and experiment: (a) intact specimen BEND-S; (b) specimen BEND-PIT-I; (c) specimen BEND-PIT-II; (d) specimen BEND-PIT-III; (e) specimen BEND -PIT-IV.
8. Conclusions
In this paper, via compression tests and three-point bending tests on complete specimens and four types of specimens with prefabricated pitting damage and by then comparing them with the simulation results of each test condition, the influence of pitting damage on the failure mode, load-bearing capacity, and deformation capacity of I-beam components was analyzed, and the following conclusions were obtained:
- (1)
- The existence of pitting damage will change the failure mode of I-beam components. For example, in the three-point bending test, the failure mode of the steel component changes from the local buckling of the compressed flange and the local buckling of the web to the local buckling of the compressed flange and the bending failure of the tensile flange.
- (2)
- All four types of pitting damage will reduce the compression and bending load-bearing capacity of the component to varying degrees. In the compression test and the three-point bending test, the specimens with inclined pitting damage display the highest reduction in load-bearing capacity.
- (3)
- All four types of pitting damage reduce the compression deformation capacity of the component to varying degrees. Due to the change in failure mode, the influence of different damage distribution types on the bending deformation capacity varies greatly. The specimens with horizontal and vertical pitting damage do not show a significant decrease in deformation capacity, while the specimens with triangular and inclined pitting damage show a significant decrease, and the specimens with inclined pitting damage have the highest reduction in deformation capacity.
Author Contributions
Data curation: W.W. Research methods and paper framework: W.W. and J.S. Software: W.W. Writing-original draft: W.W. All authors have read and agreed to the published version of the manuscript.
Funding
This research received no external funding.
Institutional Review Board Statement
Not applicable.
Informed Consent Statement
Not applicable.
Data Availability Statement
The data presented in this study are available on request from the corresponding author.
Acknowledgments
We would like to express our gratitude to Bao Qiao Group for the strong support and assistance provided during this experiment.
Conflicts of Interest
The authors declare no conflict of interest.
References
- Hua, J.M.; Wang, F.; Huang, L.P. Experimental study on mechanical properties of corroded stainless-clad bimetallic steel bars. Constr. Build. Mater. 2021, 287, 123019. [Google Scholar] [CrossRef]
- Kong, Z.; Jin, Y.; Hossen, G.M.S.; Hong, S.; Wang, Y.; Vu, Q.-V.; Truong, V.-H.; Tao, Q.; Kim, S.-E. Experimental and theoretical study on mechanical properties of mild steel after corrosion. Ocean Eng. 2022, 246, 110652. [Google Scholar] [CrossRef]
- Sun, K.; Hong, Y.; Xu, W.; Liu, H.; Zhen, Y.; Qin, J. Analysis and prediction of the mechanical behavior of corrugated plate as primary support in tunnels with elastoplastic constitution. Tunn. Undergr. Space Technol. 2022, 124, 104451. [Google Scholar] [CrossRef]
- Sun, K.; Hong, Y.; Xu, W.; Hou, Z.; Liu, X.; Yu, M.; Yuan, Z. Analysis and prediction of mechanical characteristics of corrugated plate as primary support in tunnels. Tunn. Undergr. Space Technol. 2021, 111, 103845. [Google Scholar] [CrossRef]
- Nie, B.; Xu, S.; Wang, Y. Local buckling of corroded cold-formed steel stub columns. Structures 2021, 29, 1837–1846. [Google Scholar] [CrossRef]
- Zheng, H.; Zheng, S.; Zhang, Y.; Cai, Y.; Ming, M.; Zhou, J.; Hu, X. Experimental investigation on seismic behaviours of reinforced concrete columns under simulated acid rain environment. Adv. Civ. Eng. 2020, 1, 3826062. [Google Scholar] [CrossRef]
- Vorobel, R.; Ivasenko, I.; Berehulyak, O.; Mandzii, T. Segmentation of rust defects on painted steel surfaces by intelligent image analysis. Autom. Constr. 2021, 123, 103515. [Google Scholar] [CrossRef]
- Vorobel, R.; Student, O.; Ivasenko, I.; Maruschak, P.; Krechkovska, H.; Zvirko, O.; Berehulyak, O.; Mandziy, T.; Tsybailo, I.; Solovei, P. Development of a method for computer processing of fractographic images to assess the cohesion of inclusions to the matrix in the weld metal after its operational degradation and hydrogenation. Materialia 2024, 34, 102074. [Google Scholar] [CrossRef]
- Nakai, T.; Matsushita, H.; Yamamoto, N.; Arai, H. Effect of Pitting Corrosion on Local Strength of Hold Frames of Bulk Carriers. Mar. Struct. 2004, 17, 403–432. [Google Scholar] [CrossRef]
- Wang, R.; Lin, S.; Dou, P. Statistical constitutive model of steel in randomly pitted structures. Ocean Eng. 2022, 243, 110211. [Google Scholar] [CrossRef]
- Zhao, Z.; Gao, T.; Liu, J. Local bearing capacity of steel beam webs with random pit corrosion. Structures 2023, 48, 1259–1270. [Google Scholar] [CrossRef]
- Zhao, Z.; Mo, S.; Xiong, Q. Moment capacity of H-section steel beam with randomly located pitting corrosion. Probabilistic Eng. Mech. 2021, 66, 103161. [Google Scholar] [CrossRef]
- Zhang, X.Z.; Liu, R.; Chen, K.Y.; Yao, M.X. Pitting Corrosion characterization of wrought stellite alloys in green death solution with immersion test and extreme value analysis model. J. Mater. Eng. Perform. 2014, 23, 1718–1725. [Google Scholar] [CrossRef]
- Woloszyk, K.; Garbatov, Y. An enhanced method in predicting tensile behaviour of corroded thick steel plate specimens by using random field approach. Ocean Eng. 2020, 213, 107803. [Google Scholar] [CrossRef]
- Woloszyk, K.; Garbatov, Y. Random field modelling of mechanical behaviour of corroded thin steel plate specimens. Eng. Struct. 2020, 212, 110544. [Google Scholar] [CrossRef]
- Tohidi, S.; Sharifi, Y. Load-carrying capacity of locally corroded steel plate girder ends using artificial neural network. Thin-Walled Struct. 2016, 100, 48–61. [Google Scholar] [CrossRef]
- Belachew, C.T.; Ismail, M.C.; Karuppanan, S. Burst strength analysis of corroded pipelines by finite element method. J. Appl. Sci. 2011, 11, 1845–1850. [Google Scholar] [CrossRef][Green Version]
- Kuppusamy, C.S.; Karuppanan, S.; Patil, S.S. Buckling strength of corroded pipelines with interacting corrosion defects: Numerical analysis. Int. J. Struct. Stab. Dyn. 2016, 16, 1550063. [Google Scholar] [CrossRef]
- Wang, Y.; Shi, T.; Ma, R.; Xu, S. Experimental study on seismic performance of H-section beam-column welded connections corroded in general atmosphere. J. Build. Struct. 2022, 43, 184–193. (In Chinese) [Google Scholar]
- Zou, L.; Chi, L.; Guo, F. Dynamic Identification of Derrick Structural Damage. J. Da Qing Pet. Inst. 2006, 30, 47–50. (In Chinese) [Google Scholar]
- Shang, Z.; Zheng, S.; Zheng, H.; Jang, Y.; He, J.; Dong, J. Seismic Behavior and Restoring Force Model of RC Beam-Column Joints Affected by Acid Rain Corrosion. J. Tianjin Univ. (Sci. Technol.) 2022, 55, 571–583. (In Chinese) [Google Scholar]
- Chen, Y.; Zhang, Z.; Zhang, Y.; Bian, G.; Huang, H.; Li, J.; Zhang, Y.; Wu, S. Numerical Simulation Study on the Effect of Pitting Damage on Stress Concentration of 30Cr Mn Si Ni2A Steel Under Impact Load. J. Chongqing Univ. Technol. (Nat. Sci.) 2020, 34, 69–78. (In Chinese) [Google Scholar]
Disclaimer/Publisher’s Note: The statements, opinions and data contained in all publications are solely those of the individual author(s) and contributor(s) and not of MDPI and/or the editor(s). MDPI and/or the editor(s) disclaim responsibility for any injury to people or property resulting from any ideas, methods, instructions or products referred to in the content. |
© 2025 by the authors. Licensee MDPI, Basel, Switzerland. This article is an open access article distributed under the terms and conditions of the Creative Commons Attribution (CC BY) license (https://creativecommons.org/licenses/by/4.0/).

