Article

Geant4 Simulations of a Scintillator Cosmic-Ray Detector

by
Jerzy Pryga
1,*,
Krzysztof Wiesław Woźniak
2,
Łukasz Bibrzycki
3,
Piotr Homola
2,
Sławomir Stuglik
2,
Kévin Almeida Cheminant
4,5,
Ophir Ruimi
6 and
Olaf Bar
7,*
1
Doctoral School, University of National Education Commission, Podchorażych 2, 30-084 Cracow, Poland
2
The Henryk Niewodniczański Institute of Nuclear Physics Polish Academy of Sciences, Radzikowskiego 152, 31-342 Cracow, Poland
3
Faculty of Physics and Applied Computer Science, AGH University of Krakow, al. Adama Mickiewicza 30, 30-059 Cracow, Poland
4
Nationaal Instituut voor Kernfysica en Hoge Energie Fysica (NIKHEF), 1098 XG Amsterdam, The Netherlands
5
Institute for Mathematics, Astrophysics and Particle Physics (IMAPP), Radboud University Nijmegen, 6525 EX Nijmegen, The Netherlands
6
Racah Institute of Physics, Hebrew University of Jerusalem, Jerusalem IL-91904, Israel
7
Faculty of Computer Science and Telecommunications, Cracow University of Technology, Warszawska 24, 31-155 Cracow, Poland
*
Authors to whom correspondence should be addressed.
Appl. Sci. 2025, 15(12), 6652; https://doi.org/10.3390/app15126652
Submission received: 12 May 2025 / Revised: 8 June 2025 / Accepted: 10 June 2025 / Published: 13 June 2025
(This article belongs to the Section Applied Physics General)

Abstract

Reliable cosmic-ray measurements require a thorough understanding of the detector used. It is especially important when detectors are very simple like the scintillator detectors considered in this work, which provide only information about the amplitude of the signal generated by a detected particle. Arrays of these devices can work in coincidental setups to detect Extensive Air Showers caused by high-energy primary cosmic rays. Due to their low cost and simple design, they can be used as elements of large detector networks needed for the search for global correlations in the cosmic rays. To be able to interpret data collected by those arrays, extensive simulations of such detectors are necessary to determine their efficiency of detection of different types of particles. This work presents the results of analysis of such simulations performed using the Geant4 software (v1.1.2). The analysis results lead to the conclusion that detectors feature almost maximal (close to 100%) efficiency for the detection of cosmic-ray muons and electrons with momenta greater than 0.03 GeV/c. Their sensitivity to low-energy electrons and photons is lower but not negligible and has to be properly taken into account during the interpretation of collected data.

1. Introduction

The study presented in this article aims to estimate usefulness of simple flat scintillator detectors for measurements of cosmic rays (CRs) by registering secondary charged particles and photons created in the atmosphere in a phenomenon called an Extensive Air Shower (EAS). EASs are results of interactions of primary CRs coming from space into the atmosphere. While single EAS events have been studied for years by numerous large observatories around the globe [1,2,3], little is known about large-scale correlations of cosmic rays [4,5]. The detection of such correlations in the form of Cosmic-Ray Ensembles (CREs) is the goal of the Cosmic Ray Extremely Distributed Observatory (CREDO) [6]. Such studies require a large network of detectors collecting cosmic-ray data. For this purpose, devices that are possibly inexpensive and easy to build in large numbers are needed [7,8]. A good candidate is a small plastic scintillator detector based on the Cosmic Watch design [9]. However, as such a device provides limited information, it is necessary to study its capability and efficiency in the detection of single EAS. This work aims to provide quantitative and practical knowledge about the potential performance of a class of cosmic-ray detectors based on plastic scintillators. The methods of analysis used in this analysis are similar to those commonly used in this field [10,11], but the properties of such simple detectors have not been sufficiently studied yet. This study aims to estimate the sensitivity of detection for several types of particles from EASs with various momenta and to determine how it depends on the inclination angle of cosmic-ray particles, the parameters of the device, and different shields. To achieve this goal, computer simulations of particles hitting detectors of specific designs were performed. Details of the simulations are discussed in Section 2; the Geant4 software and the simulated detector are presented in Section 3. Then methods of estimation of the electronic signal produced by the detector are described. At the end, final results and conclusions from this analysis are presented.

2. Geant4 Software

To simulate interactions of secondary cosmic-ray particles with elements of the detector, dedicated software called Geant4 was used [12,13,14]. It allows users to track particles through different media simulating all possible physical processes like scattering, hadronic interactions, scintillation, decays, etc. The user is able to define the geometry of an experiment and fully control values of many parameters of materials. However, like every tool, Geant4 has some limitations, as it is not designed to simulate signals in the electronics of sensors. Therefore, the electronic response is calculated according to the documentation of the elements used. In this work, version 11.1.2 of Geant4 was used as it can produce output files in the very convenient ROOT format [15].

2.1. Detector Geometry and Composition

The considered detector is based on the Cosmic Watch design which comprises a plastic scintillator with the dimensions 5 cm × 5 cm × 1 cm and a Silicon Photomultiplier (SiPM) attached in the middle of the largest side of the scintillator. Such a device is sufficient to detect most muons and the majority of electrons from cascades initiated by cosmic-ray particles. The geometrical description of the detector in the simulation also includes reflective coating, light isolation, and shielding, as presented in Figure 1. The idea of adding shielding is to reduce the background of low-energy particles that do not originate from EASs. Those can be single cosmic-ray particles reaching the ground without producing an extensive cascade or particles from radioactive decays in the air.
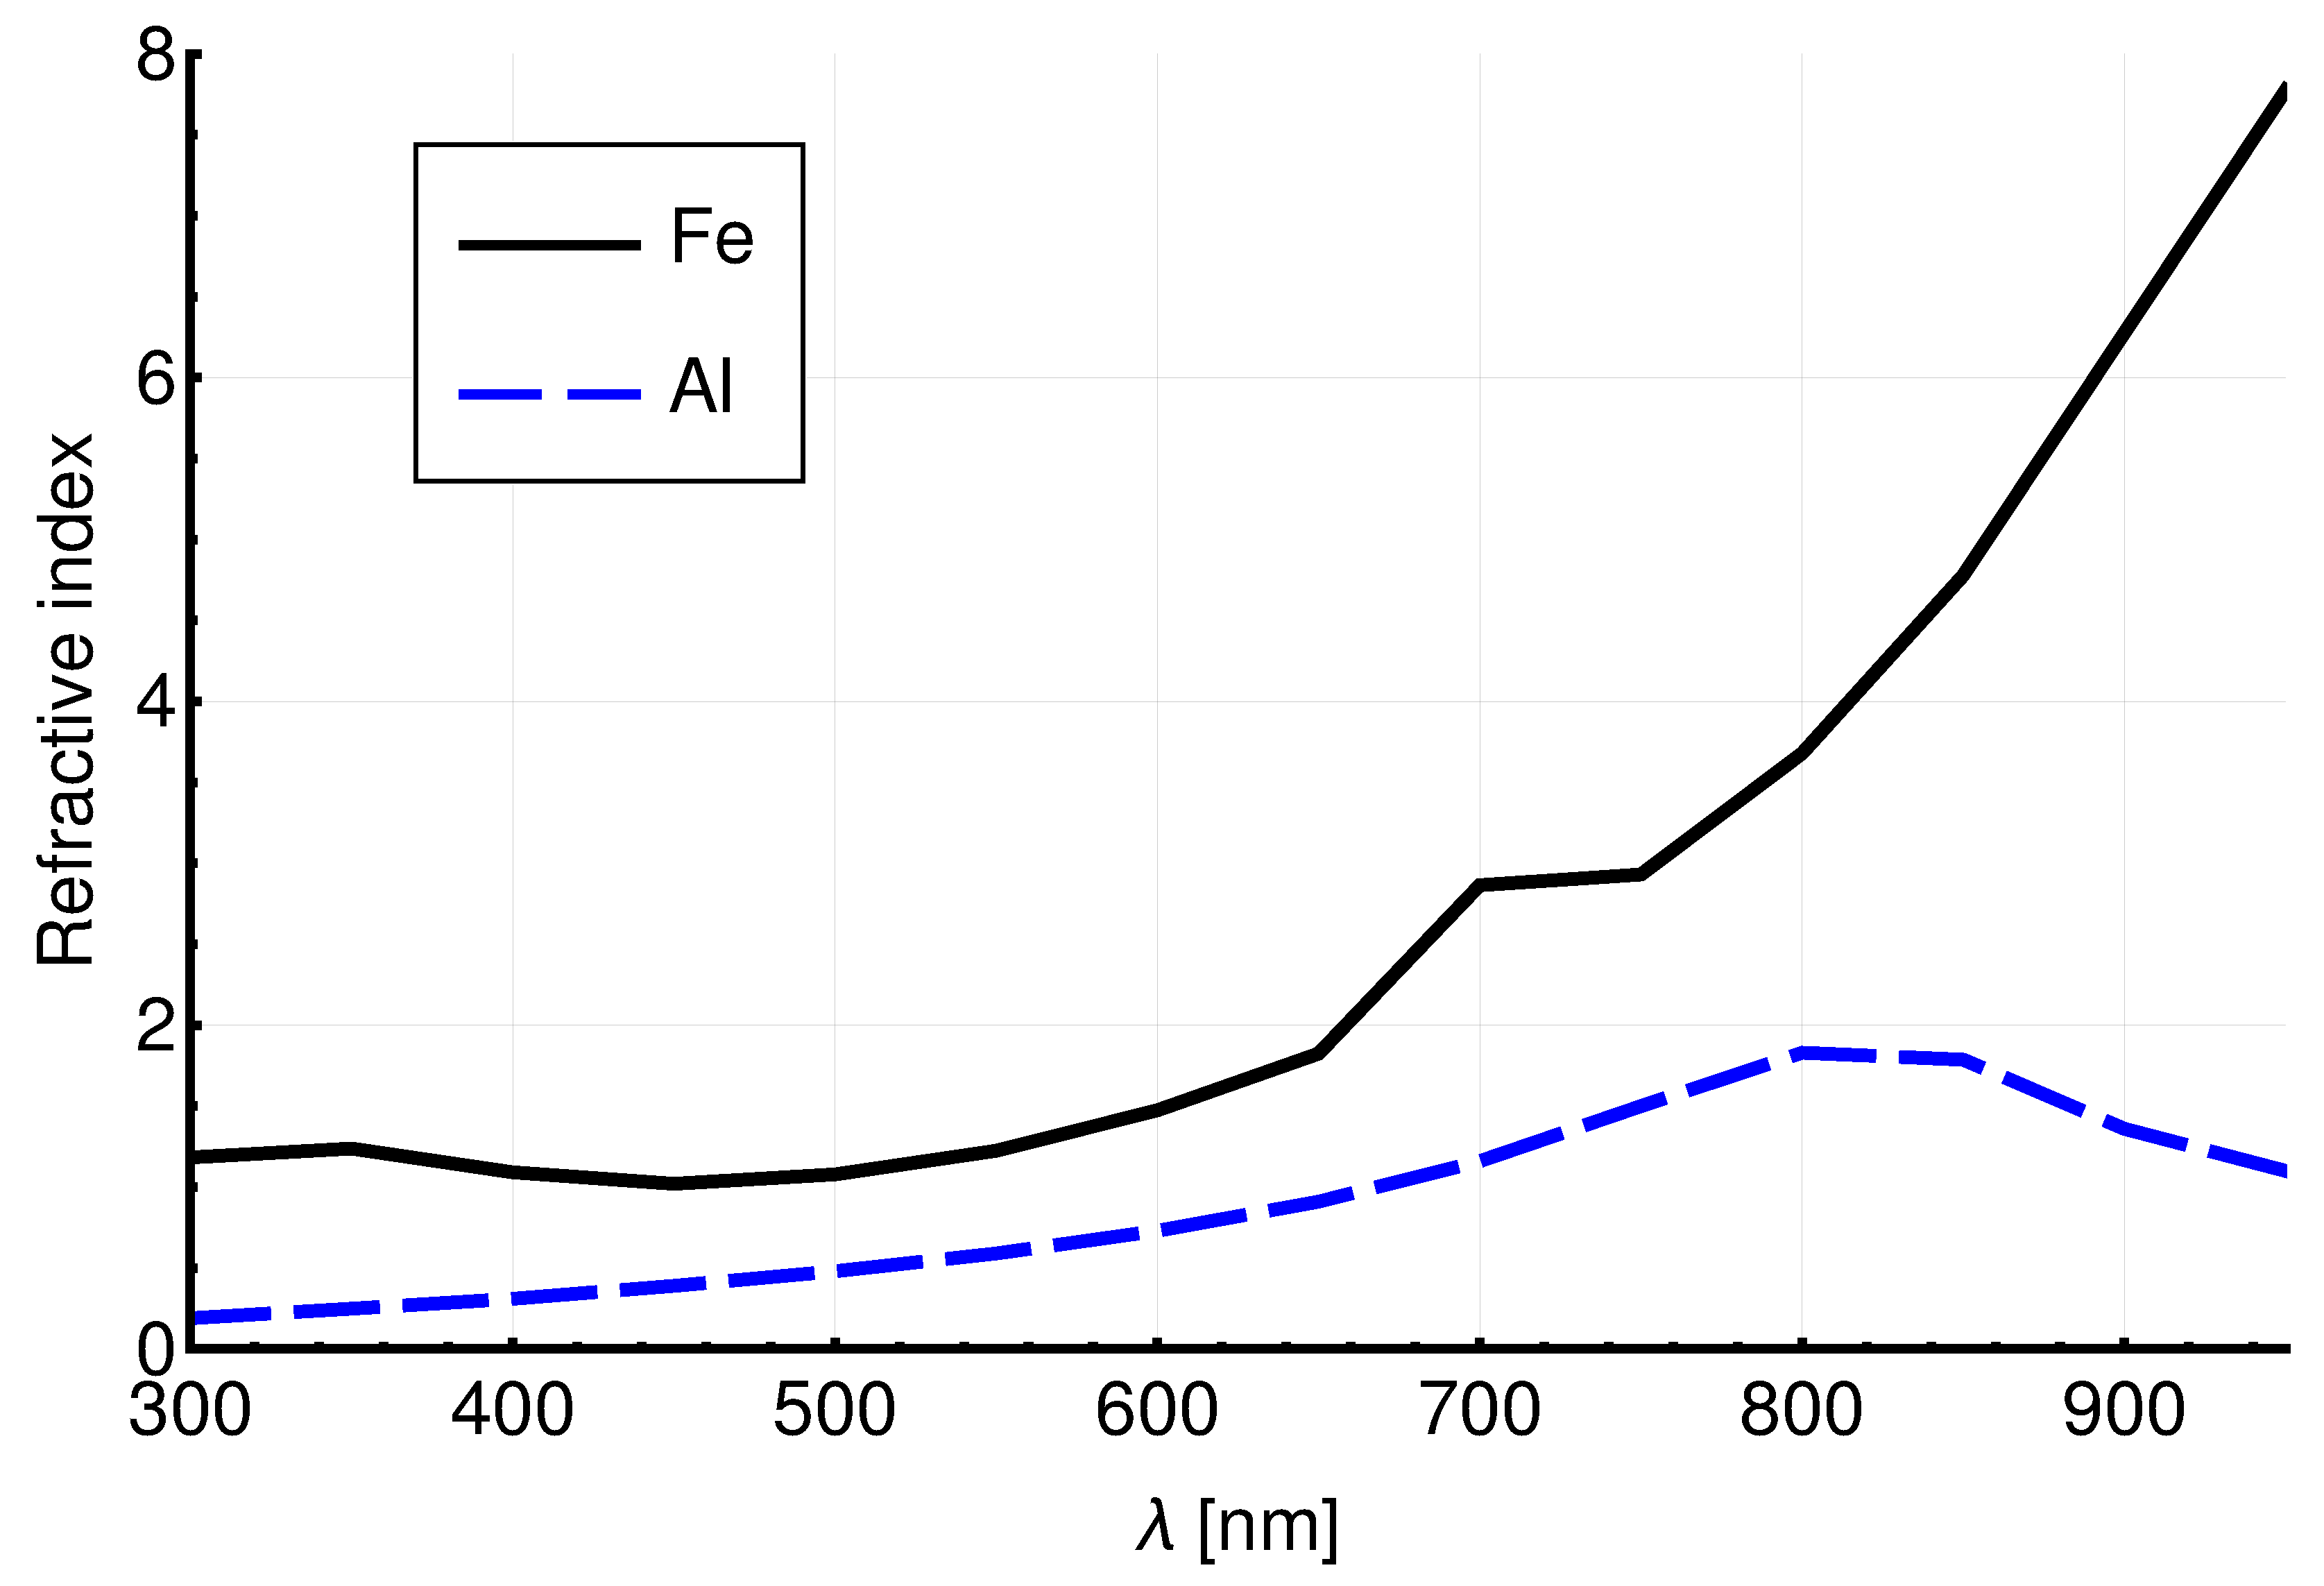
Everything was simulated in a standard air environment and all elements had sizes, shapes, and compositions similar to those in the Cosmic Watch design [9]. The main component of the detector is a plastic scintillator of the BC408 type, with a wavelength of maximum emission around 425 nm. On the bottom side, in its centre, a 6 mm × 6 mm × 1 mm SiPM (C-series, MICROFC-60035, Onsemi, Scottsdale, AZ, USA) is mounted. This model has the largest surface among single SiPMs in this price range and it is the most sensitive to light in the emission range of BC408. The scintillator is wrapped in aluminium foil with reflectivity equal to 88% serving as a mirror that keeps photons inside. Then it is covered by a layer of a black tape for additional isolation from external light. Scintillation photons are emitted in all directions along the path of particle that passes through it and then they scatter from the reflective coating, filling more or less the whole volume of the scintillator. There is also some Cherenkov light emitted in a cone around the passage of charged particles but in the case of plastic, it is negligible in comparison to that from scintillation [16]. The photomultiplier is separated from the scintillator by a layer of Vaseline (petroleum jelly) which serves as a medium helping photons to reach the SiPM. Without petroleum jelly, a layer of air with a significantly different refractive index would make the internal scattering of those photons more probable and that would reduce the detector’s sensitivity. Vaseline, on the other hand, has a refractive index similar both to that of the scintillator and that of the material of the SiPM. The photomultiplier registers only photons within certain range of wavelengths: from 300 nm to 950 nm. For most elements of the detector, the value of the refractive index is approximately constant in this wavelength range. Only aluminium and iron have refractive indexes that vary significantly within this regime (Figure 2).
The values of all important parameters used to characterise detector elements in the simulations are listed in Table 1.
The sensitivity of the results to variations in these parameters is discussed in Section 4. Several different configurations of shields were also tested. The following materials that can be used in a realistic design were considered: aluminium, iron, glass, and steel. In the simulations, shielding material of the thickness z was placed between the detector and the source of particles at the distance d from the scintillator. Dependence on the thickness of those shields as well as the distance between them and the scintillator were also studied to find an optimal setup. The values of the studied parameters are presented in Table 2.

3. Estimation of Sensitivity

The performance of detectors is characterised by their sensitivity, η , which is the probability that when a particle of certain type and momentum, p, reaches the detector, the resulting electric signal generated by the SiPM is strong enough to be registered by the electronics. To estimate sensitivity, not only results from simulations but also properties of the hardware, namely the photomultiplier and further electronics, have to be taken into account.

3.1. Calculation of Signal’s Amplitude

Photomultipliers produce signals when they are hit by photons of relevant wavelengths. They have their own internal sensitivity to photons of different wavelengths, called Photon Detection Efficiency (PDE). It is a function of overvoltage which is the difference between the applied voltage, V S i P M , and the minimum voltage required for an SiPM to work as a light sensor. It is called breakdown voltage, V b r ( T ) , which is device-specific and slightly depends on temperature, T. The PDE ( λ ) for the SiPM analysed in this work is presented in Figure 3.
Geant4 simulations provide the number of scintillation photons of certain wavelengths that reach the SiPM, N p h . The effective number of photons registered by the photomultiplier, N r e g , is a convolution of PDE and the spectrum N p h :
N r e g = 300 950 P D E ( λ ) N p h ( λ ) d λ ,
where λ is photons’ wavelength in nanometers. Integration was performed between 300 and 950 nm as the BC408 plastic scintillator produced photons only in this range.
The SiPM is a matrix of many small microcells which are basically Geiger-mode photodiodes in series with an integrated quench resistor. In a cell hit by a photon appears an output voltage, Δ V , that can be calculated as
Δ V = G ( V S i P M , V b r , T ) · q C ,
where G ( V S i P M , V b r , T ) is called gain which is also a function of overvoltage and temperature, q is the elemental charge of the electron, and C is the capacitance of such a microcell [19].
Knowing the effective number of photons that are registered by the SiPM, one can calculate how many microcells are activated and thus estimate the total amplitude of the produced signal. There are two more quantities to be taken into account, the number of cells, M, and the percentage of the surface that they cover, c p . The values of these parameters, along with the gain, G, and the capacitance, C, are available from the documentation of the photomultiplier but are also listed in Table 3.
  • In the end, the amplitude of the produced signal is calculated using the following formula [19]:
V S = Δ V · c p · M 1 exp N r e g M .
To estimate the sensitivity of the detector, a large number of events had to be simulated and the percentage of those events that produced signals with sufficiently high amplitude had to be counted. The threshold for this amplitude is determined by an electronic circuit that further processes this signal [20]. The average amplitude of signals from an SiPM is of the order of a few tens of mV and in a real detector it has to be amplified first. In this work it was assumed that such amplification was linear and could be described by a single factor, k A M P . The electronics required some minimal amplitude of input signals, V t h . For the currently developed prototype, V t h 1 V and k A M P 45 and these values were used to obtain results presented in the next section. Noise in the electronics was much lower, about 10 mV. Even if such noise signal occurred before the amplifier and was processed by it, it should not have passed the threshold. The considered SiPM in this mode produced a signal that had a rising time around 10 ns and its length was of the order of hundreds of ns. In this analysis it was assumed that the signal shape was not affected by the amplifying circuit and the only quantity important for the detection of the signal was its amplitude at the peak. The statistical approach gives the formula to calculate the sensitivity of the detector:
η = n ( k A M P · V S > V t h ) n a l l ,
Its uncertainty is
Δ η = n ( k A M P · V S > V t h ) n a l l ,
where n ( k A M P · V S > V t h ) is the number of particles that caused a signal with sufficiently high amplitude and n a l l is the total number of simulated particles.

3.2. Mapping Detector

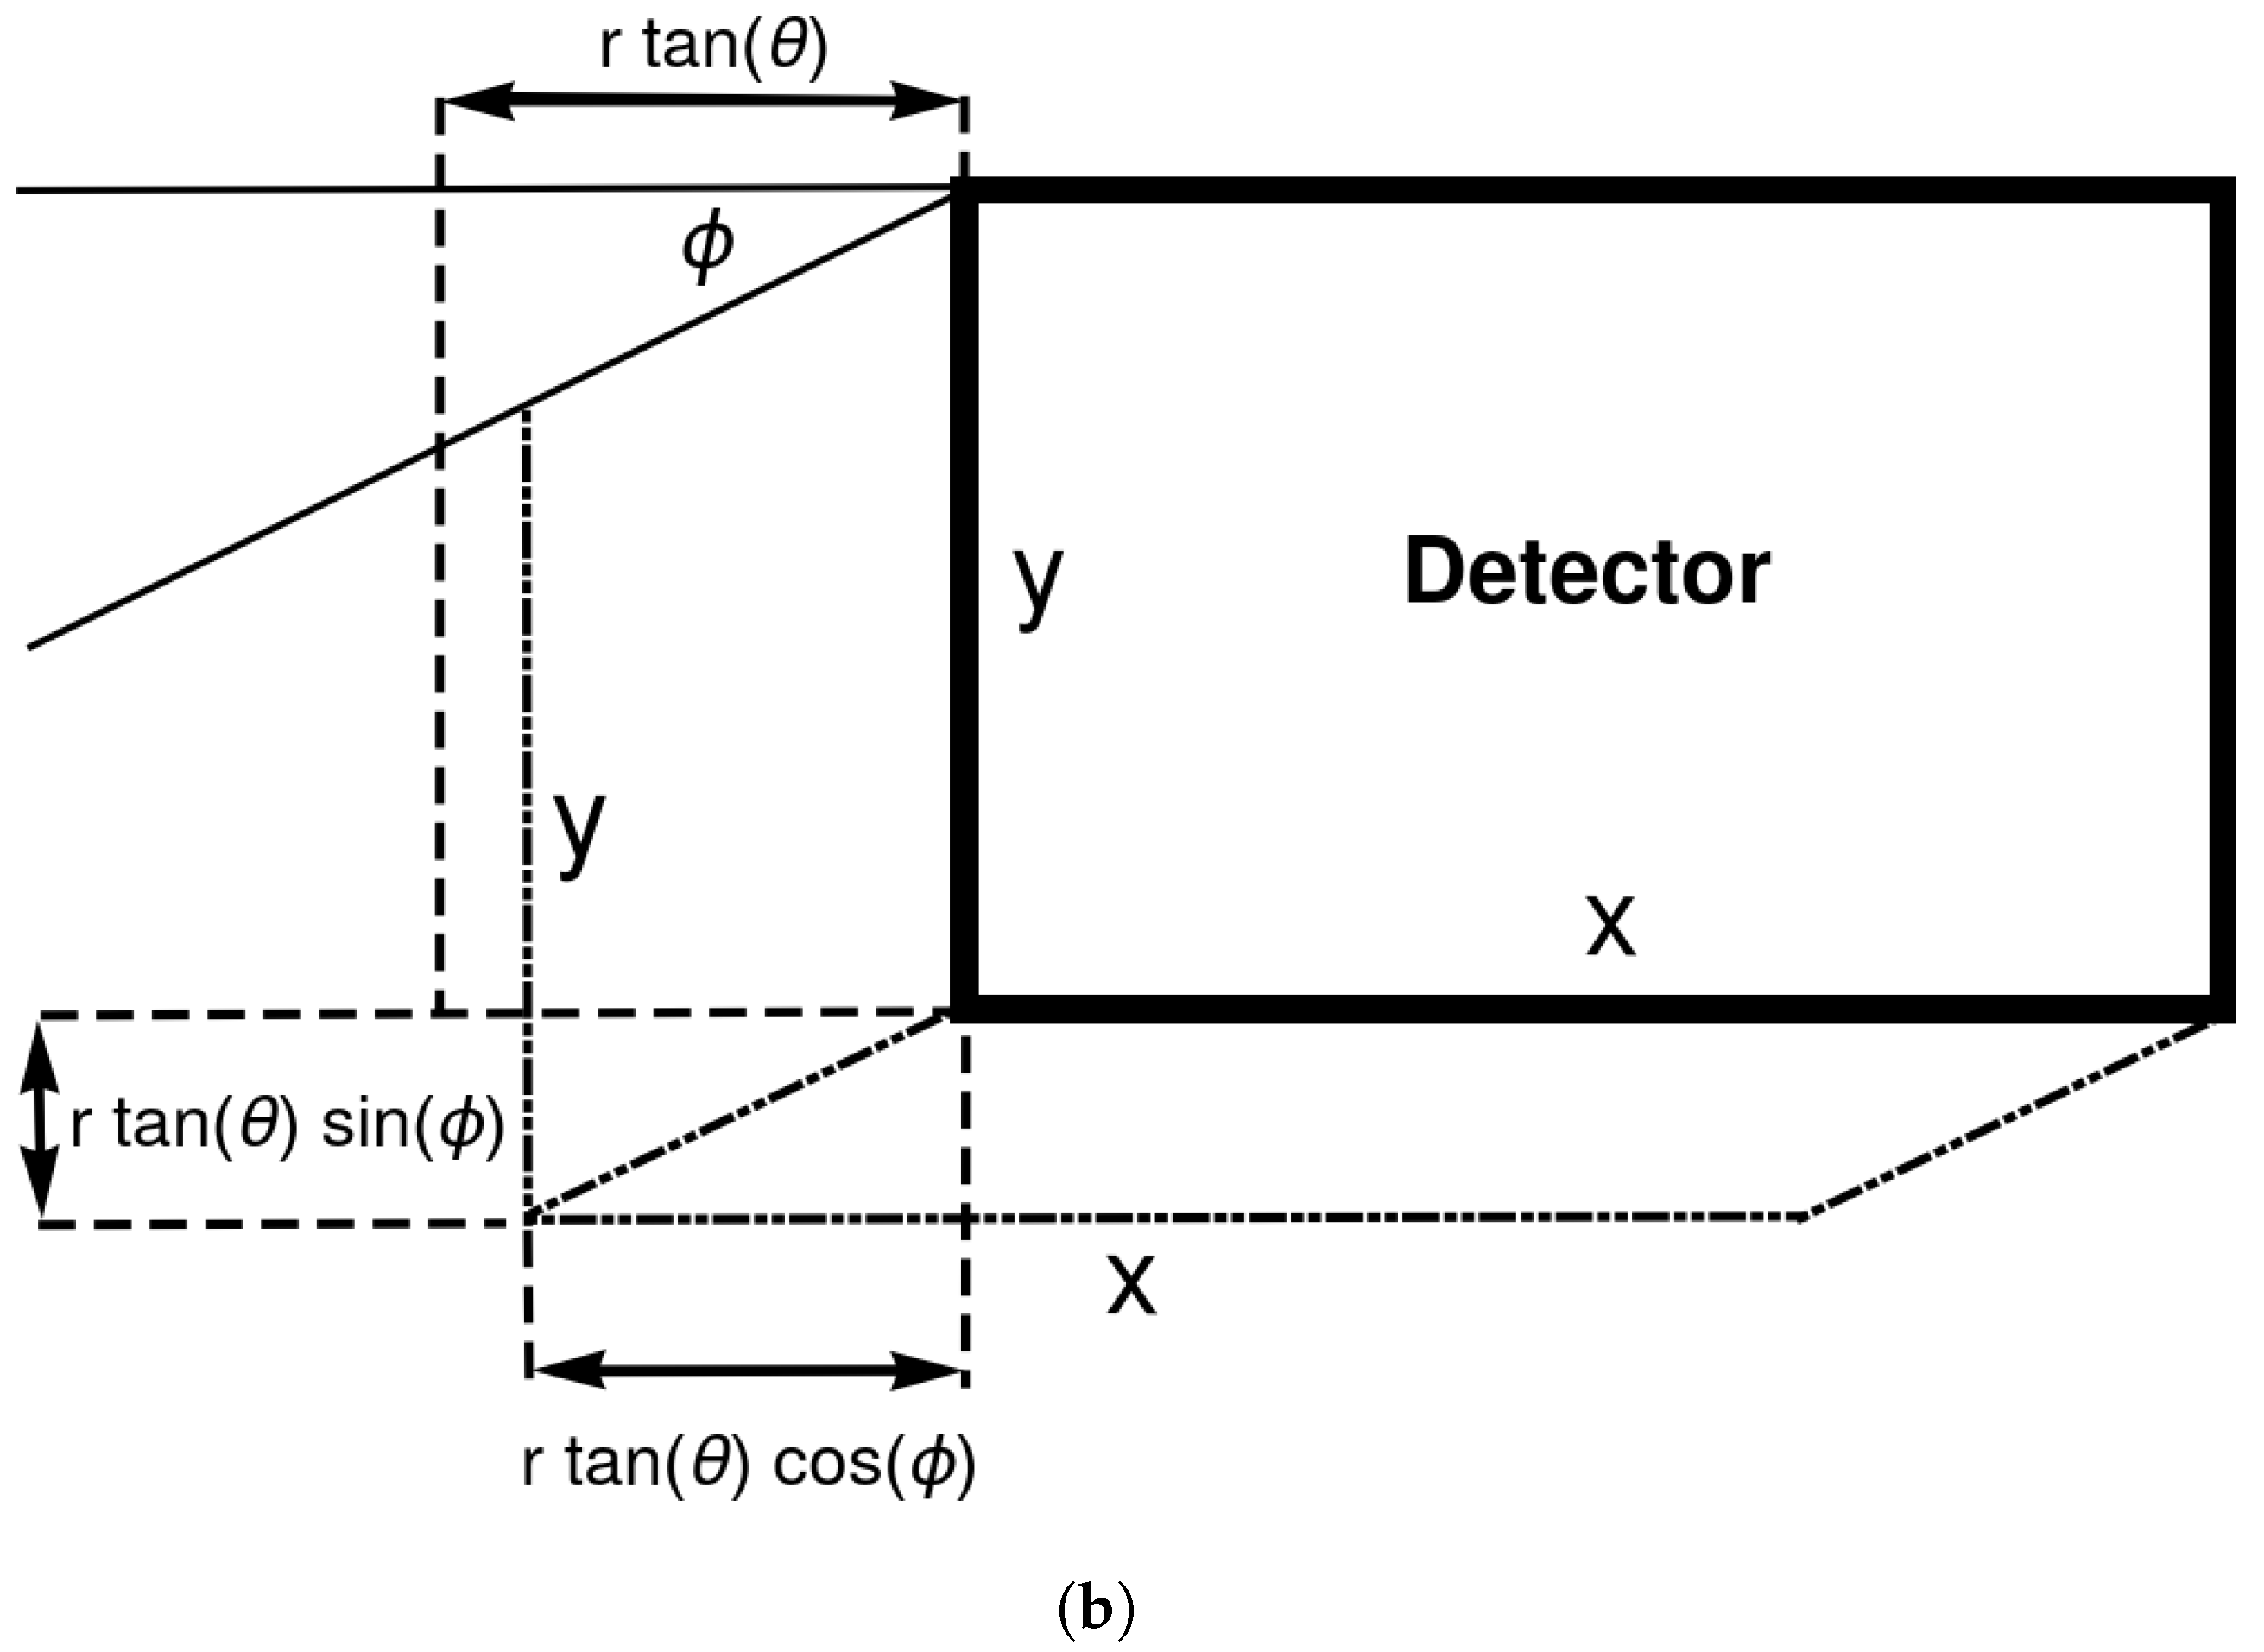
Particles can hit different regions of a detector and this has a significant impact on the number of scintillation photons that reach the SiPM [21]. It is important to keep in mind that scintillators have some thickness, which means that particles may also hit their sides when they do not come directly from above. In those cases the distance they traverse within the scintillator is shorter but some of them can still produce detectable signals. The impact of this effect depends on inclination angles, θ and ϕ , from which particles arrive and on the shape of the device. Thus, one has to consider in simulations not only particles that hit the top surface of the scintillator but also those that are distant from it. For a flat wavefront of particles coming from the same direction, this causes an effective increase in the area of the detector’s surface, A e f f , as presented in Figure 4.
A common way to characterise cosmic rays is by the local number of particles per flat unit of area. Therefore, it is useful to know the surface of the projection of the shape of the scintillator into a plane parallel to the top of the detector. In the case of a cuboid detector of the dimensions x × y × r , this increase can be described using the following formula:
A e f f ( θ , ϕ ) = A 0 + ( | sin ϕ | x + | cos ϕ | y ) · r · tan θ ,
where A 0 is the area of the surface of the simulated scintillator at θ = ϕ = 0 ° . This formula is valid for θ < 90 ° .
Another important effect is that particles can scatter and even produce secondary ones through interaction with material above the scintillator, especially with the shield. This means that some of the particles that miss the detector if there is nothing above it can produce a signal because they change their trajectory or the detector is hit by products of their interactions. Due to this and the previously described geometrical effect, it was necessary to simulate particle beams in an area that not only covered the top surface of the detector but also its surroundings. To study this, beams of 100 particles on a grid were simulated, to create maps of the detector’s geometry projection on a plane placed on the top of the scintillator. Exemplary maps for the setup with a 1.5 mm steel plate placed 3 cm above the detector are presented in Figure 5 and Figure 6.
From these maps, the effective sensitivity for the whole detector was calculated, η e f f . This value was estimated using the following formula:
η e f f = 1 A 0 S η ( x , y ) d s ,
where A 0 = 25 cm2, S is the whole simulated area, and η ( x , y ) is local sensitivity for particles that are aimed at a small fragment, d s , of the area S. In the performed simulations, d s was a 0.25 cm × 0.25 cm square. In the presented parametrisation, where integrated efficiency was divided by the constant A 0 without including an additional effective area from the sides of the non-flat scintillator, the effects described above may have resulted in an effective sensitivity, η e f f , larger than 100%, especially for large theta.

4. Results

The final results are presented in the form of the relationship between sensitivity and the momentum of the studied particle, η e f f ( p ) . In appropriate figures distributions of particles in a vertical EAS according to CORSIKA (Version 7.71, EPOS LHC-R model of high-energy interactions and URQMD 1.3cr model of low-energy interactions) simulations are also shown [22].
For the best performance, a detector should have high signal-to-background ratio, and in the case of the detection of cosmic rays, background consists of all terrestrial sources of radiation that can produce signals in such device. In this work, only muons, electrons, and photons were studied. Along with anti-muons and positrons which behave identically in such detectors, they account for 98% of all particles from EASs that reach the ground. Since there are no common terrestrial sources of muons, the background consists only of electromagnetic particles. The intensity of environmental gamma and beta radiation becomes negligible above p t h = 3 MeV [23,24]. This value is also highlighted in appropriate figures as the terrestrial background limit. Therefore, the detector should have the highest possible sensitivity for p > p t h and very low for p < p t h to obtain the best signal-to-background ratio.
The main results presented here focus on the case with a 1.5 mm steel plate placed 3 cm above the detector because such a setup is planned for the prototype in construction.

4.1. Muons

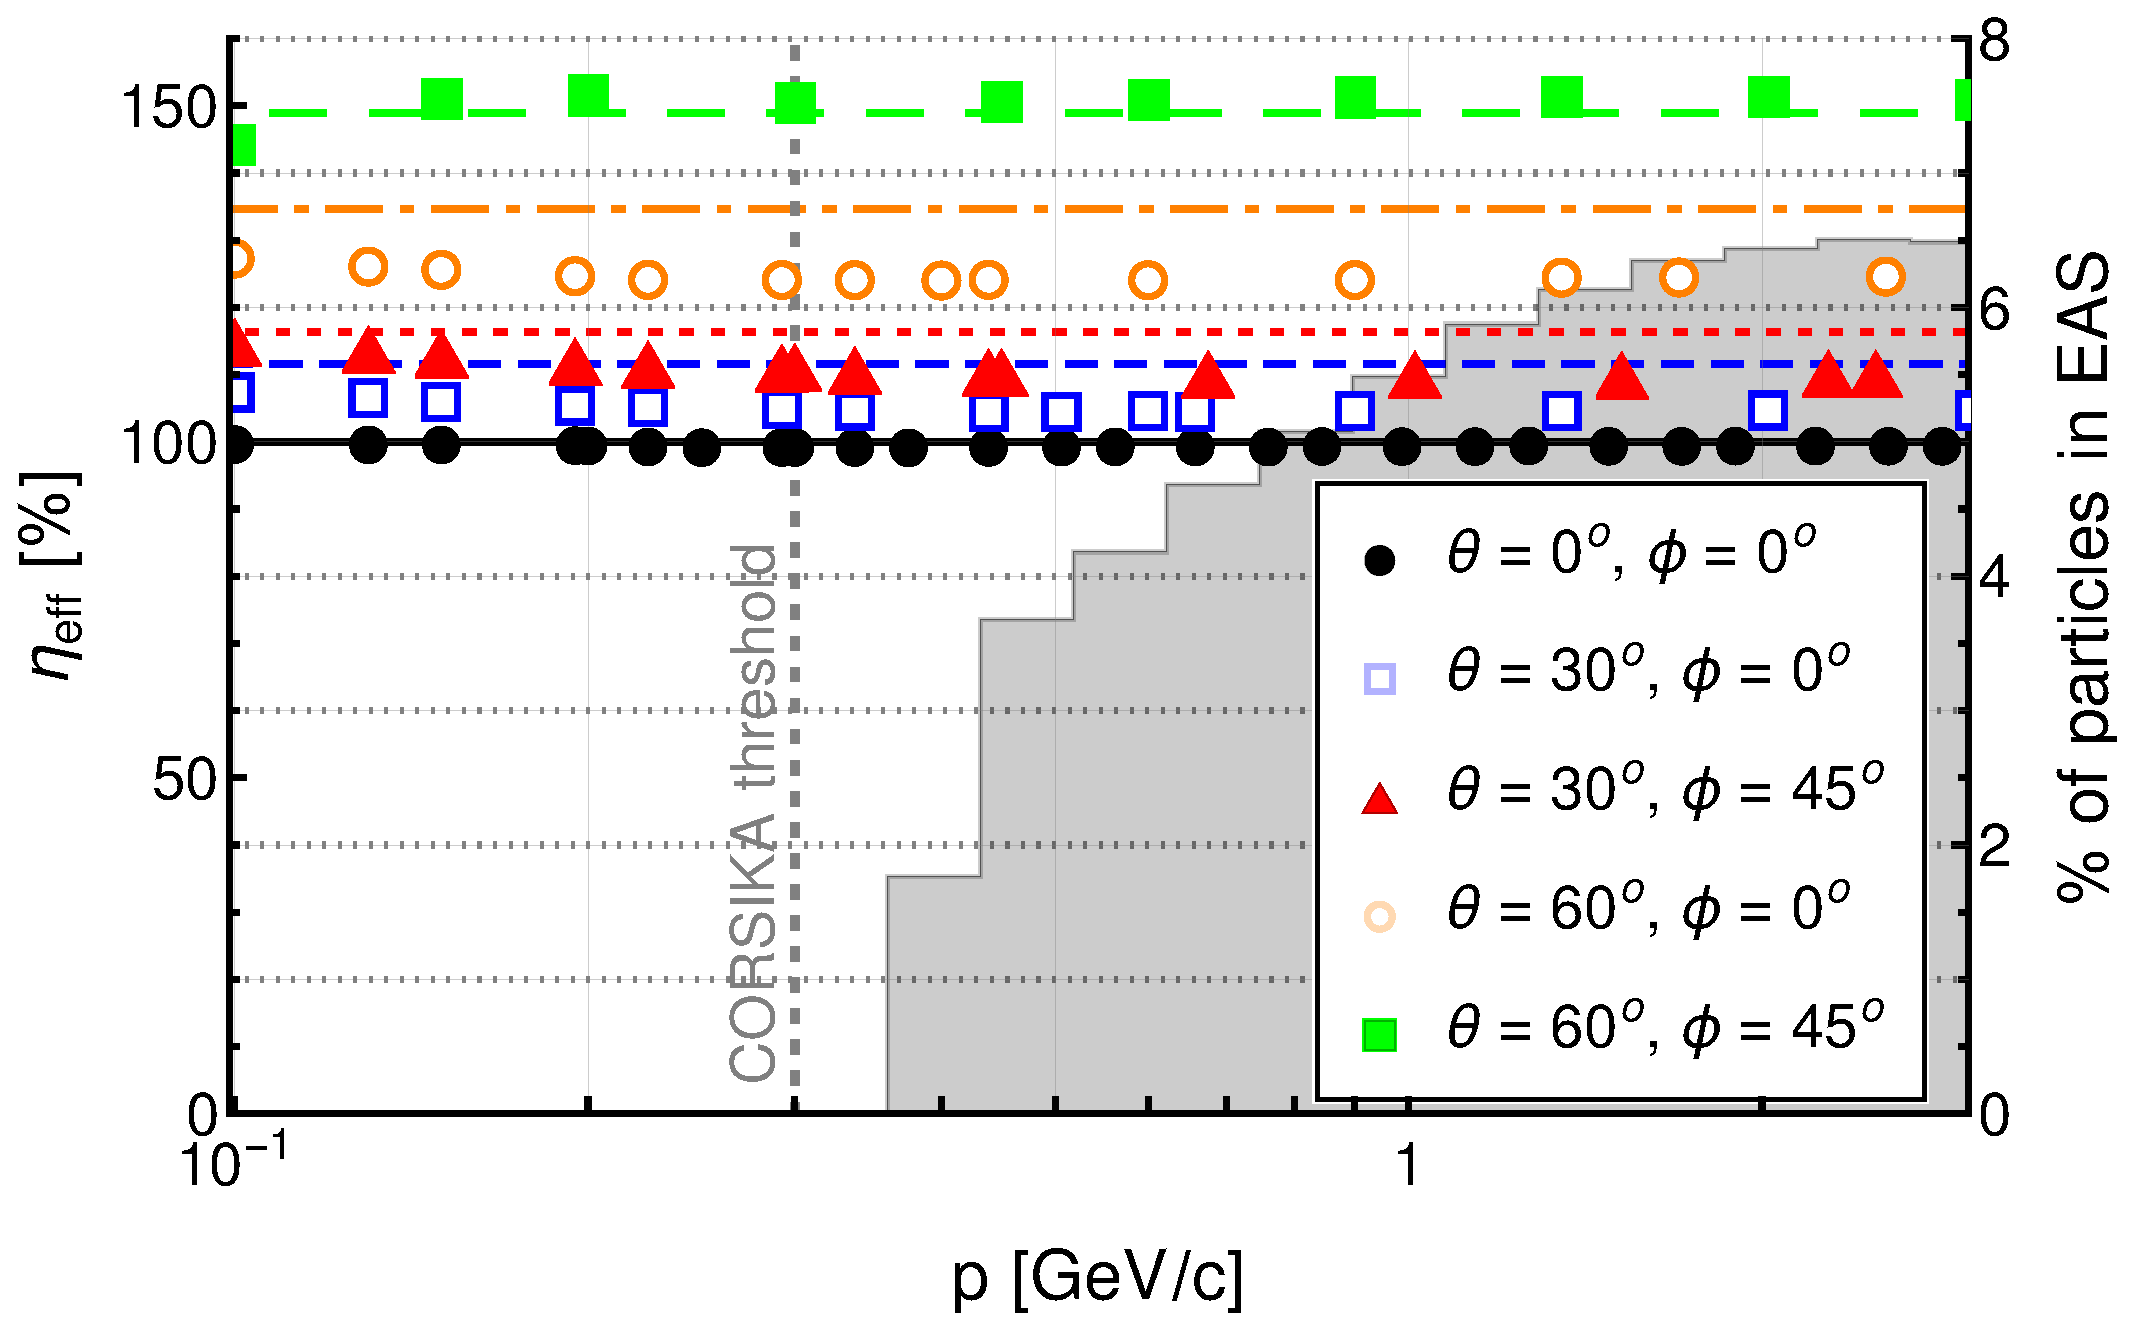
In the case of muons, the results are unsurprising. The scintillator detects them easily, even if they traverse a short path through it which happens frequently when the muon enter at a large zenith angle. Sensitivity is fairly constant, at 100% for muons with θ = 0 ° , and increases to around 150% for muons with θ = 60 ° due to the registration of additional muons which enter the scintillator not from top but from the side (Figure 7).
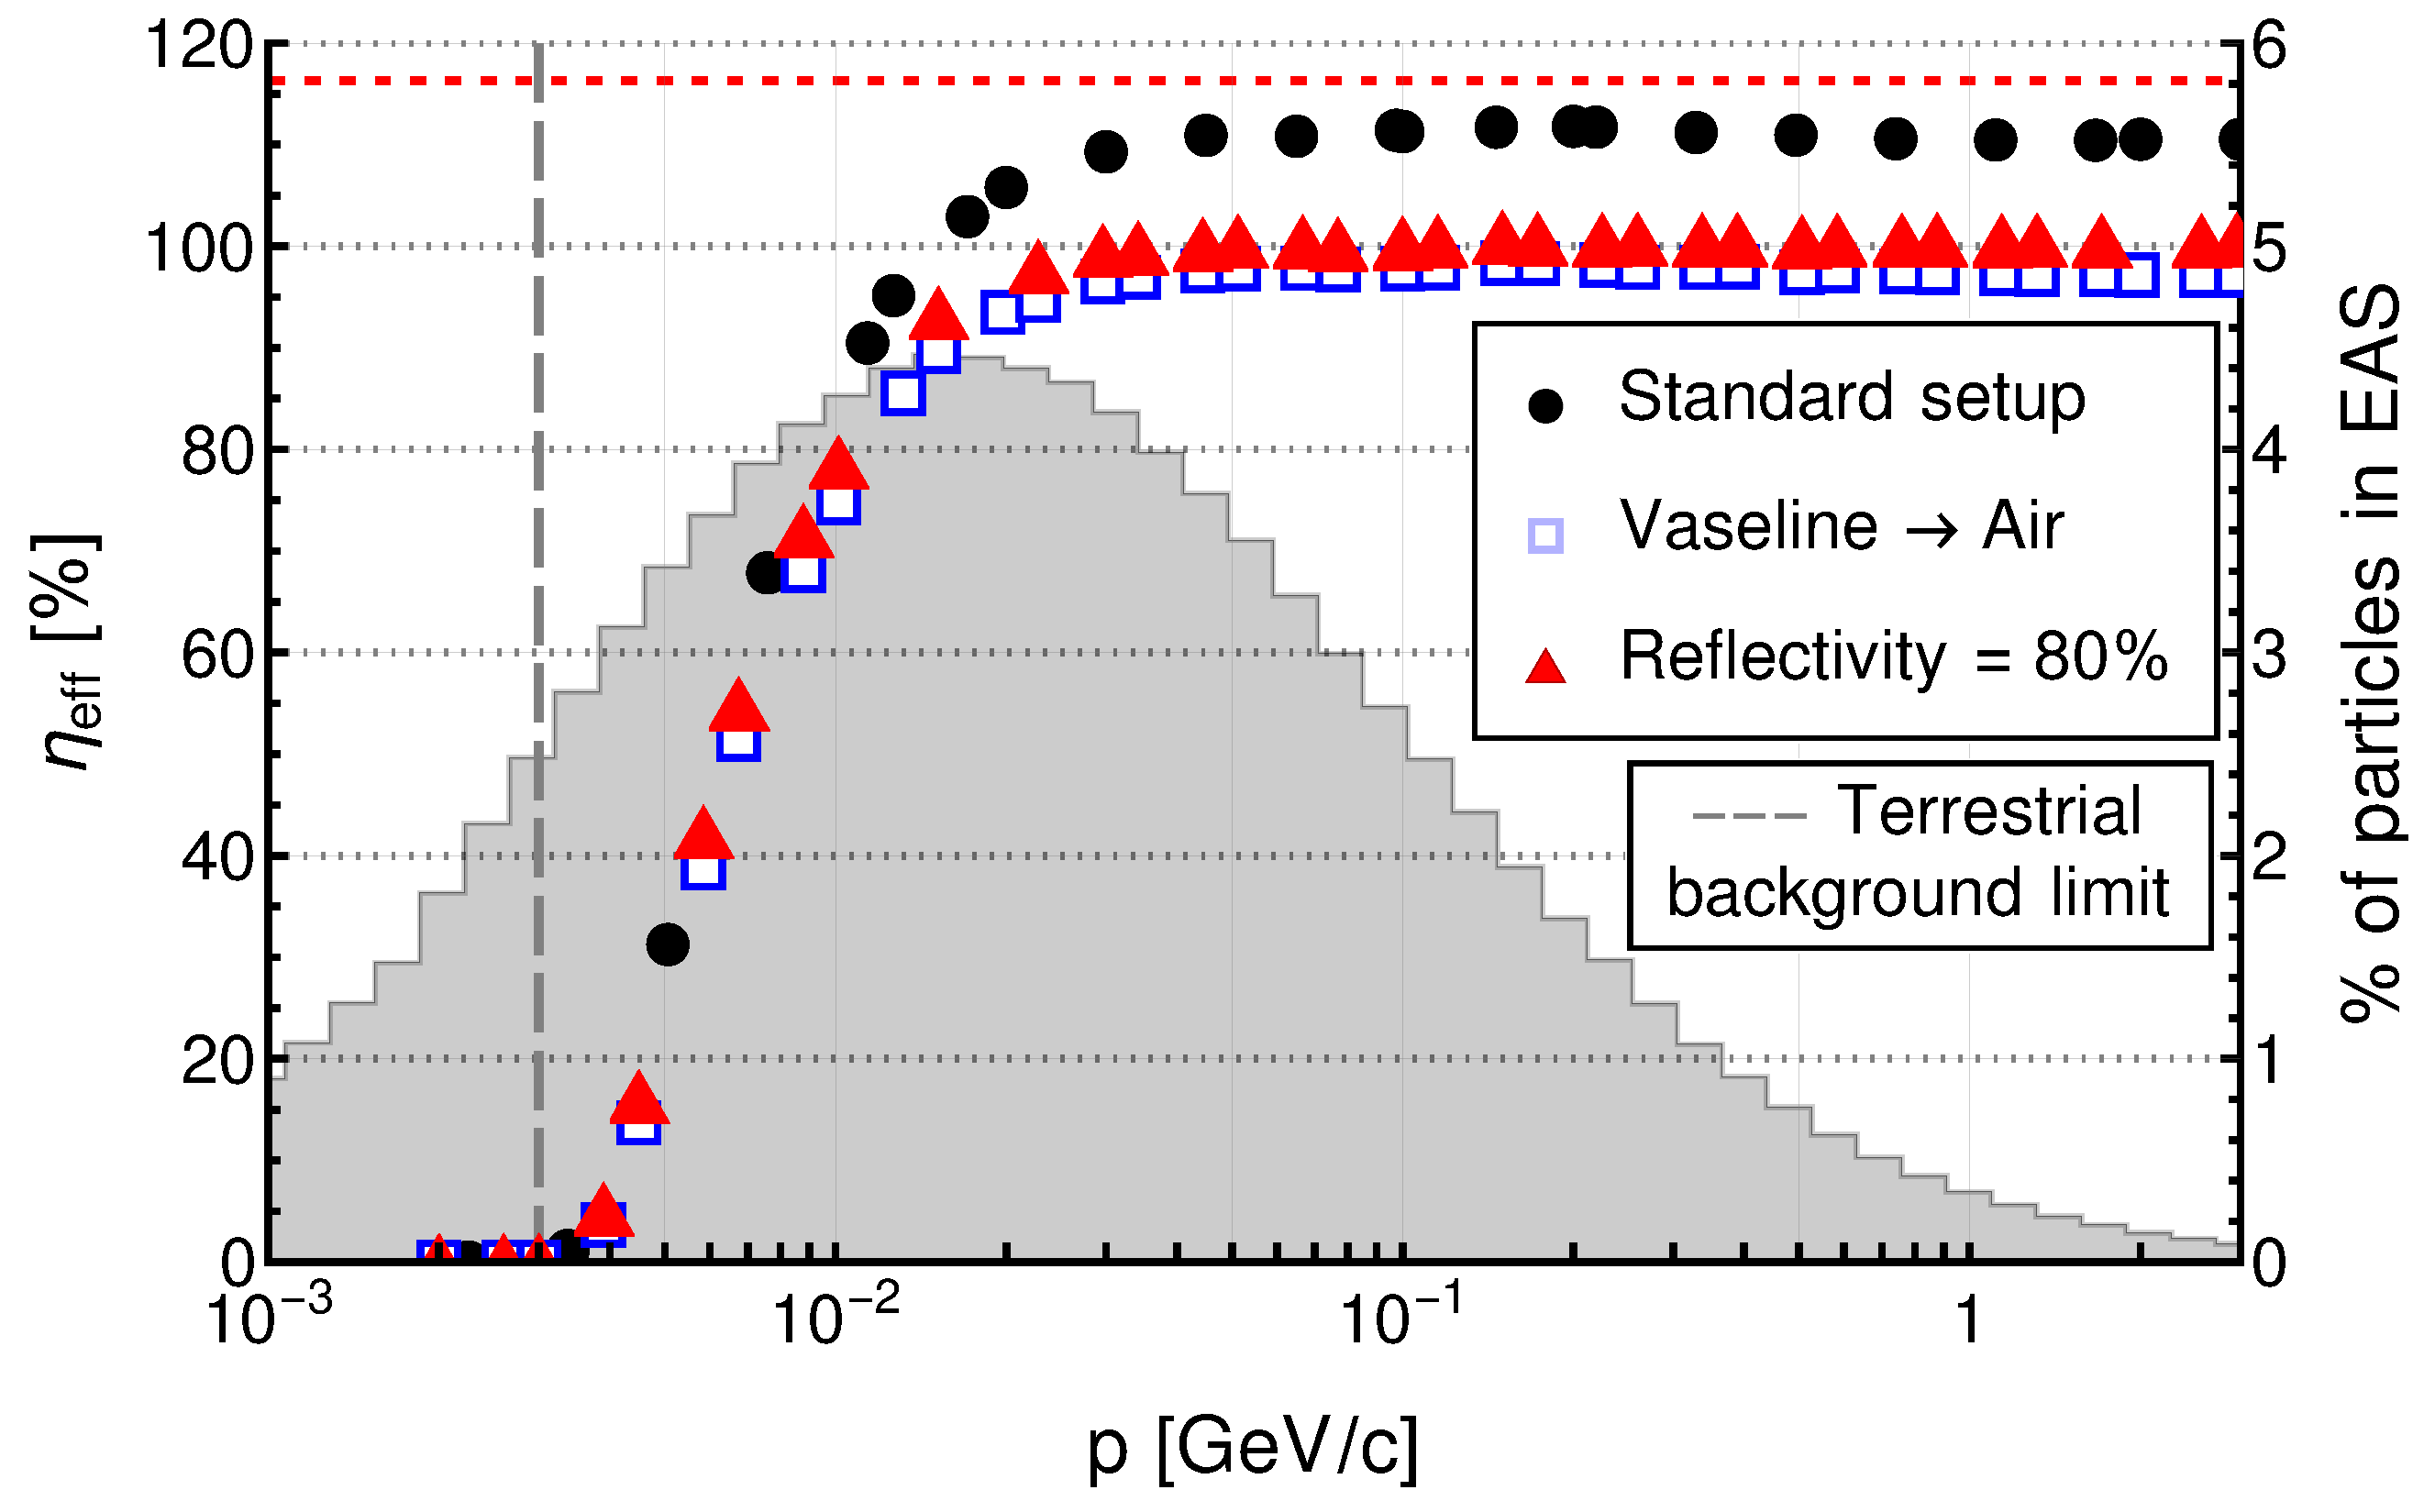
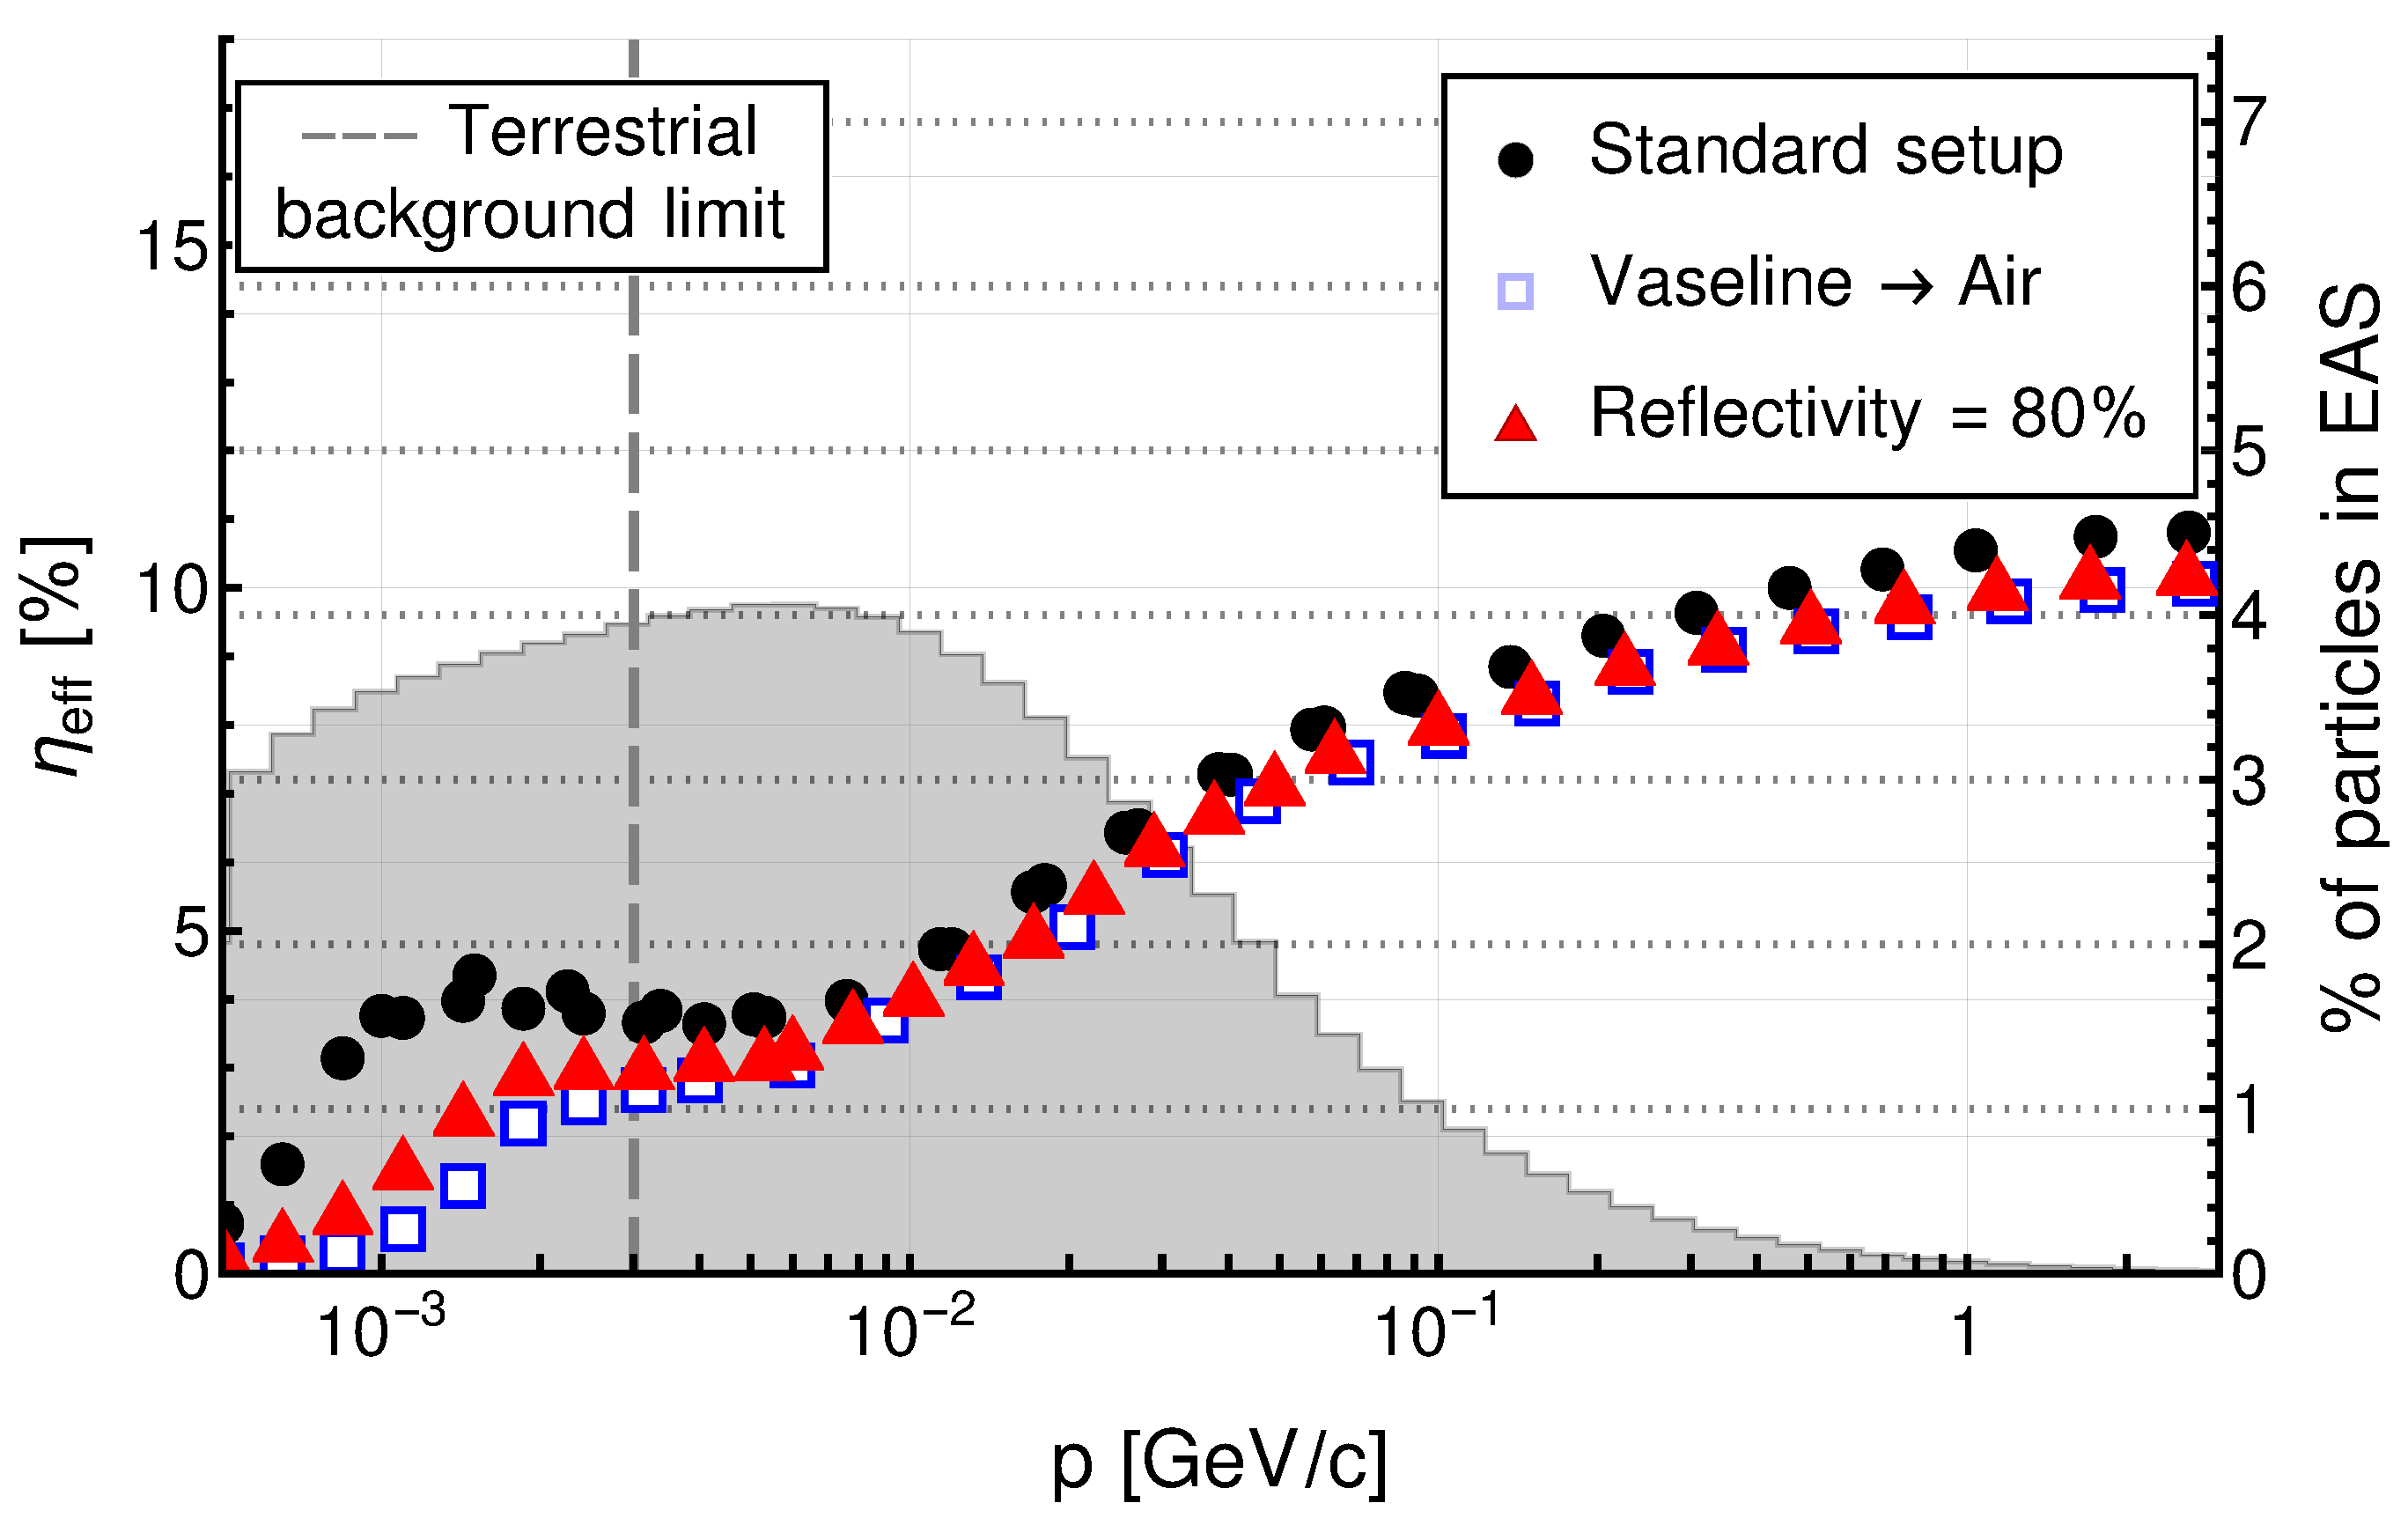
It is worth noting that the distribution of muon momenta ends above the CORSIKA simulation threshold at 0.3 GeV since most of those with lower momenta decay before reaching the Earth’s surface. For muons, neither the type of shielding nor the distance from it to the scintillator affect η e f f ( p ) so results with different values of those parameters are not presented here. However, the sensitivity changes if other modifications of the standard setup, described in Table 1 and Section 2.1, are considered: doubling the thickness of Vaseline, Vaseline replaced by air of the same thickness, the reflectivity of the aluminium foil reduced to 80%, refractive indexes increased by 10%, scintillation parameters increased by 10%, and doubling the thickness of the aluminium foil and the black tape.
The type of medium between the SiPM and the scintillator has the most significant impact, which confirms that the gap between the scintillator and the SiPM has to be filled with an appropriate medium, not just air. Another important parameter is the reflectivity of the aluminium foil that envelopes the scintillator. The impact of those changes to the standard setup on the sensitivity is presented in Figure 8. Effects of changes in the rest of studied parameters are negligible; therefore they are not presented.

4.2. Electrons

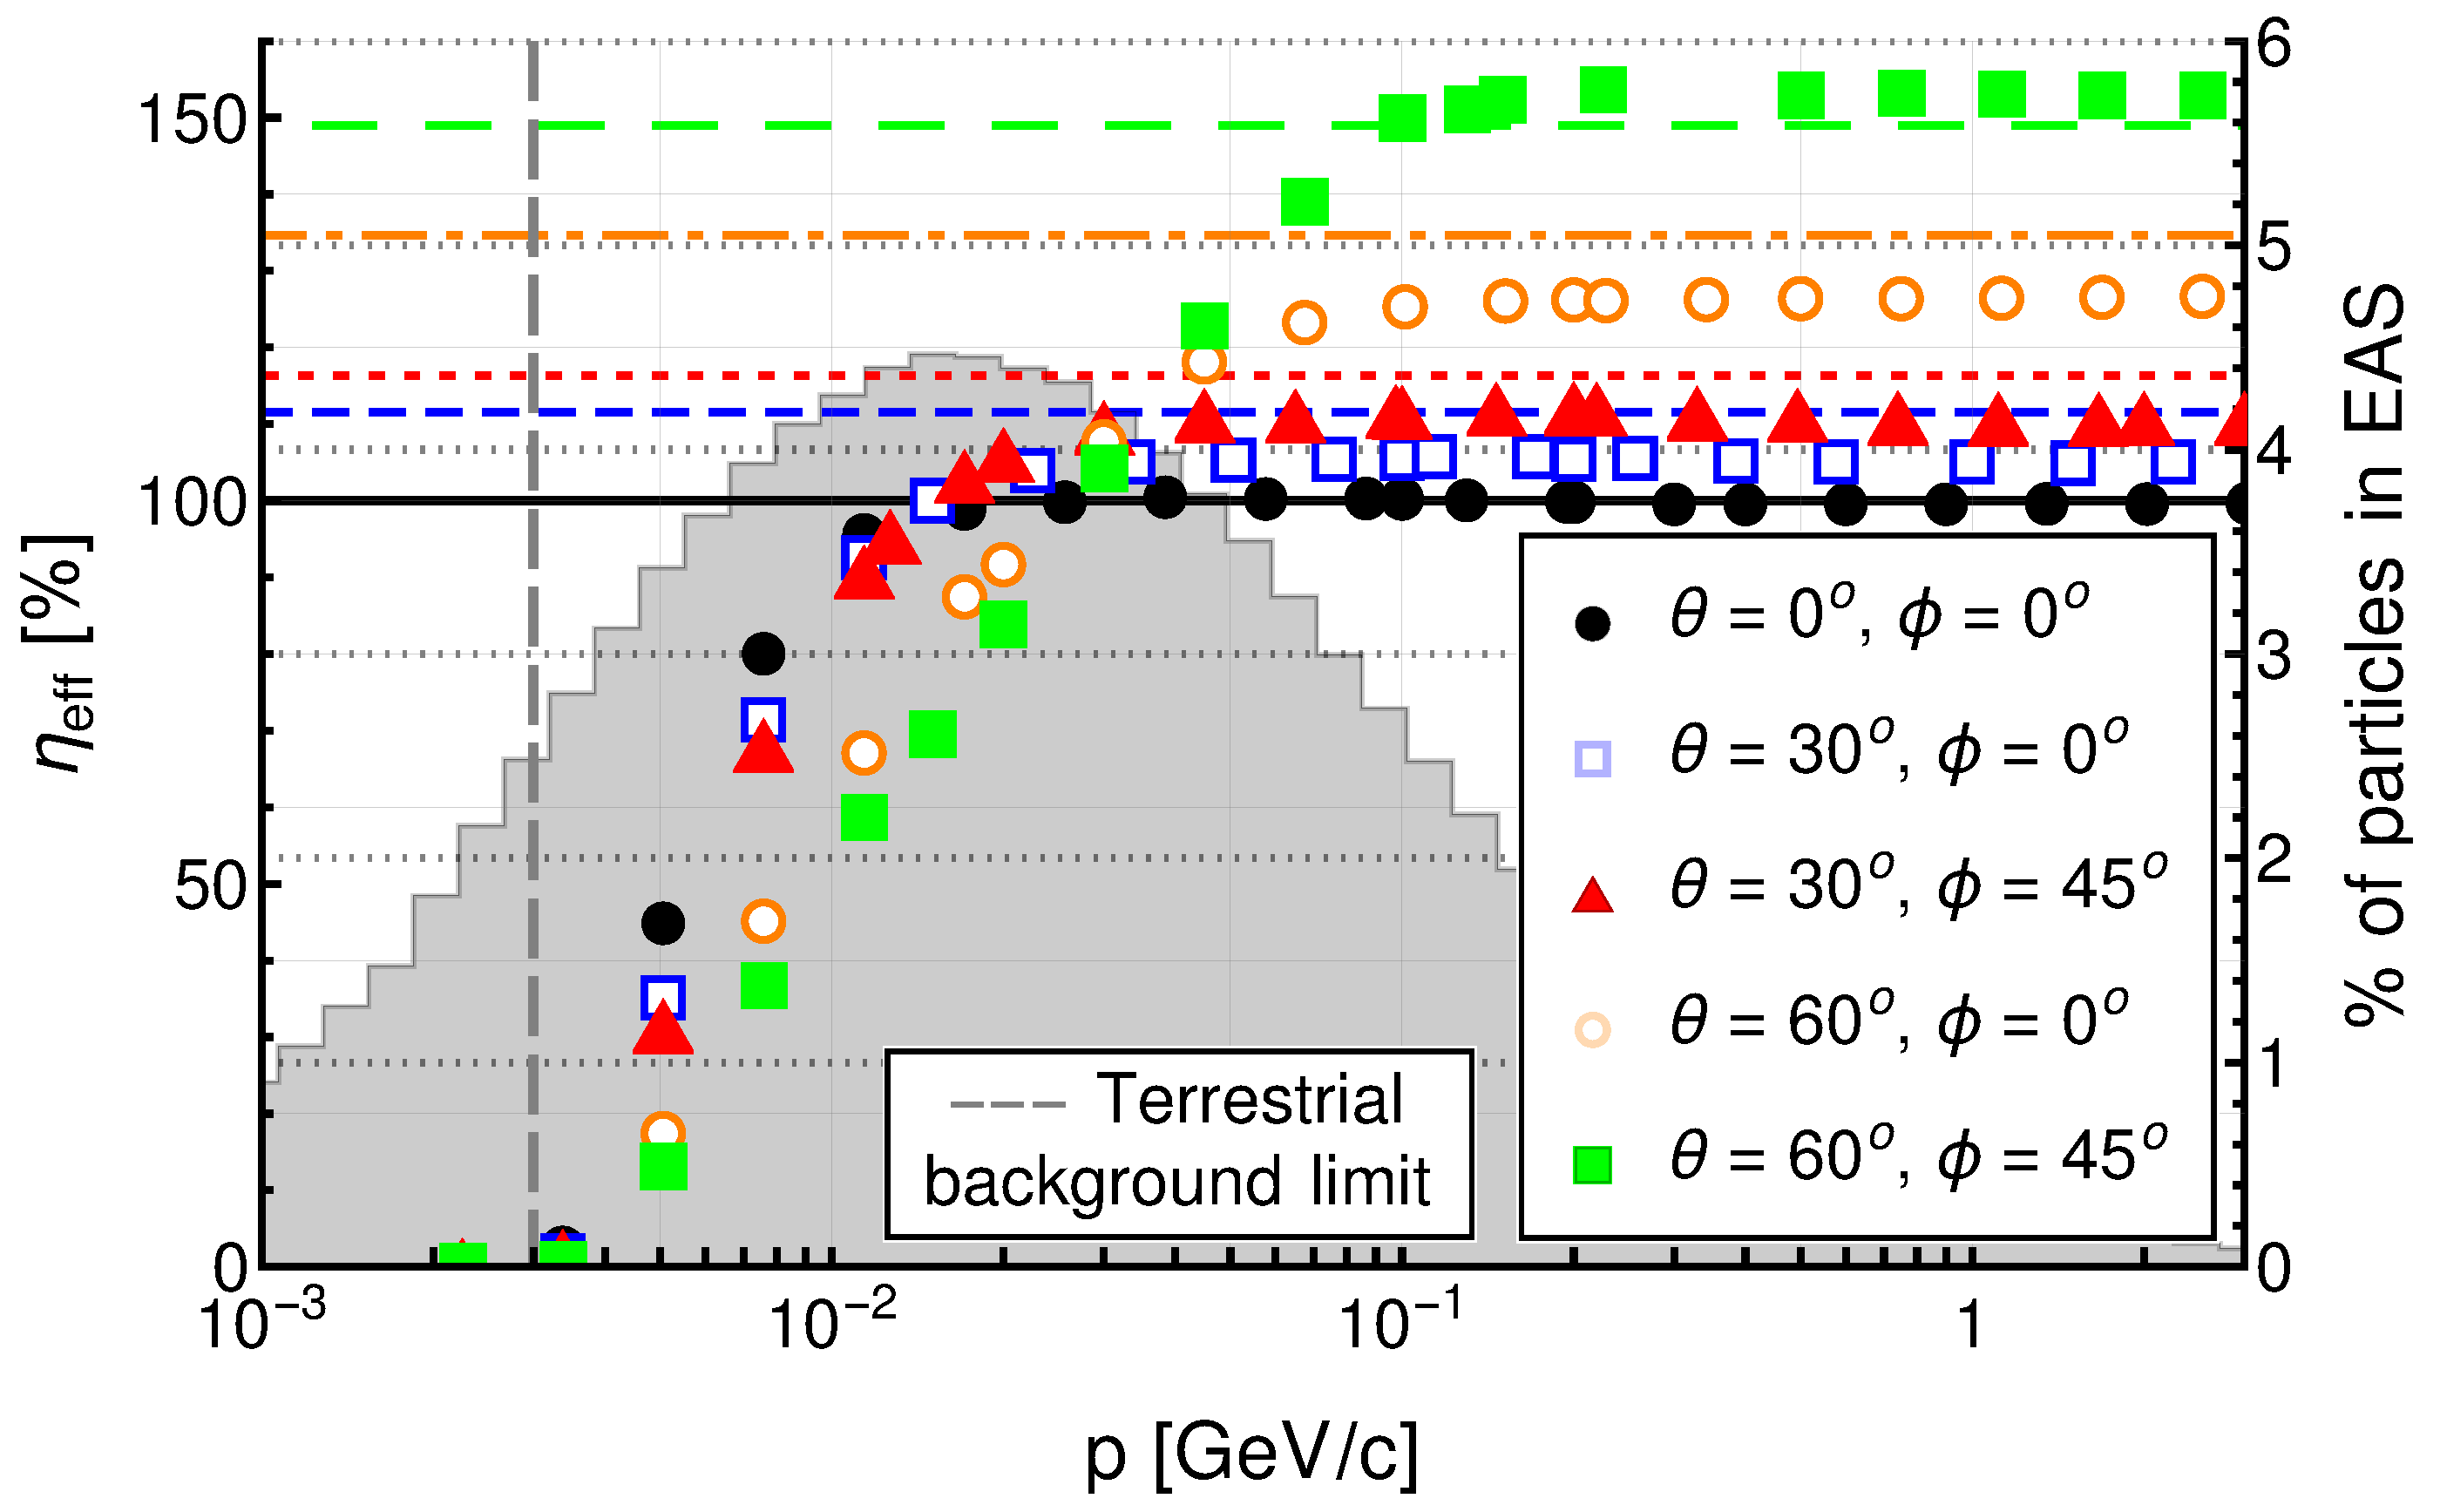
Sensitivity to electrons, as expected, is also very high at large momenta, but for the standard setup it drops to 0 for p less than the limit of terrestrial background equal to 0.03 GeV as the low-momentum electrons are stopped in the shield (Figure 9).
The value of momentum at which this decrease in the sensitivity starts depends on the zenith angle of electrons. At greater angles the effective thickness of the shield is larger; thus, electrons with higher momenta are also stopped in it. The presence of the shield leads also to another effect. The electrons passing through it undergo multiple scattering which is most significant at low momenta and, in addition, may interact by knocking other electrons or emit photons.
The scattering means that some electrons may miss the scintillator, but on the other hand some of those that are not expected to be detected are registered. The net effect is a decrease in sensitivity. On the other hand, the additional particles created in the shield may reach the scintillator and produce a signal even if an electron passes so far that it has no chance to be directly registered, as can be seen in Figure 10.
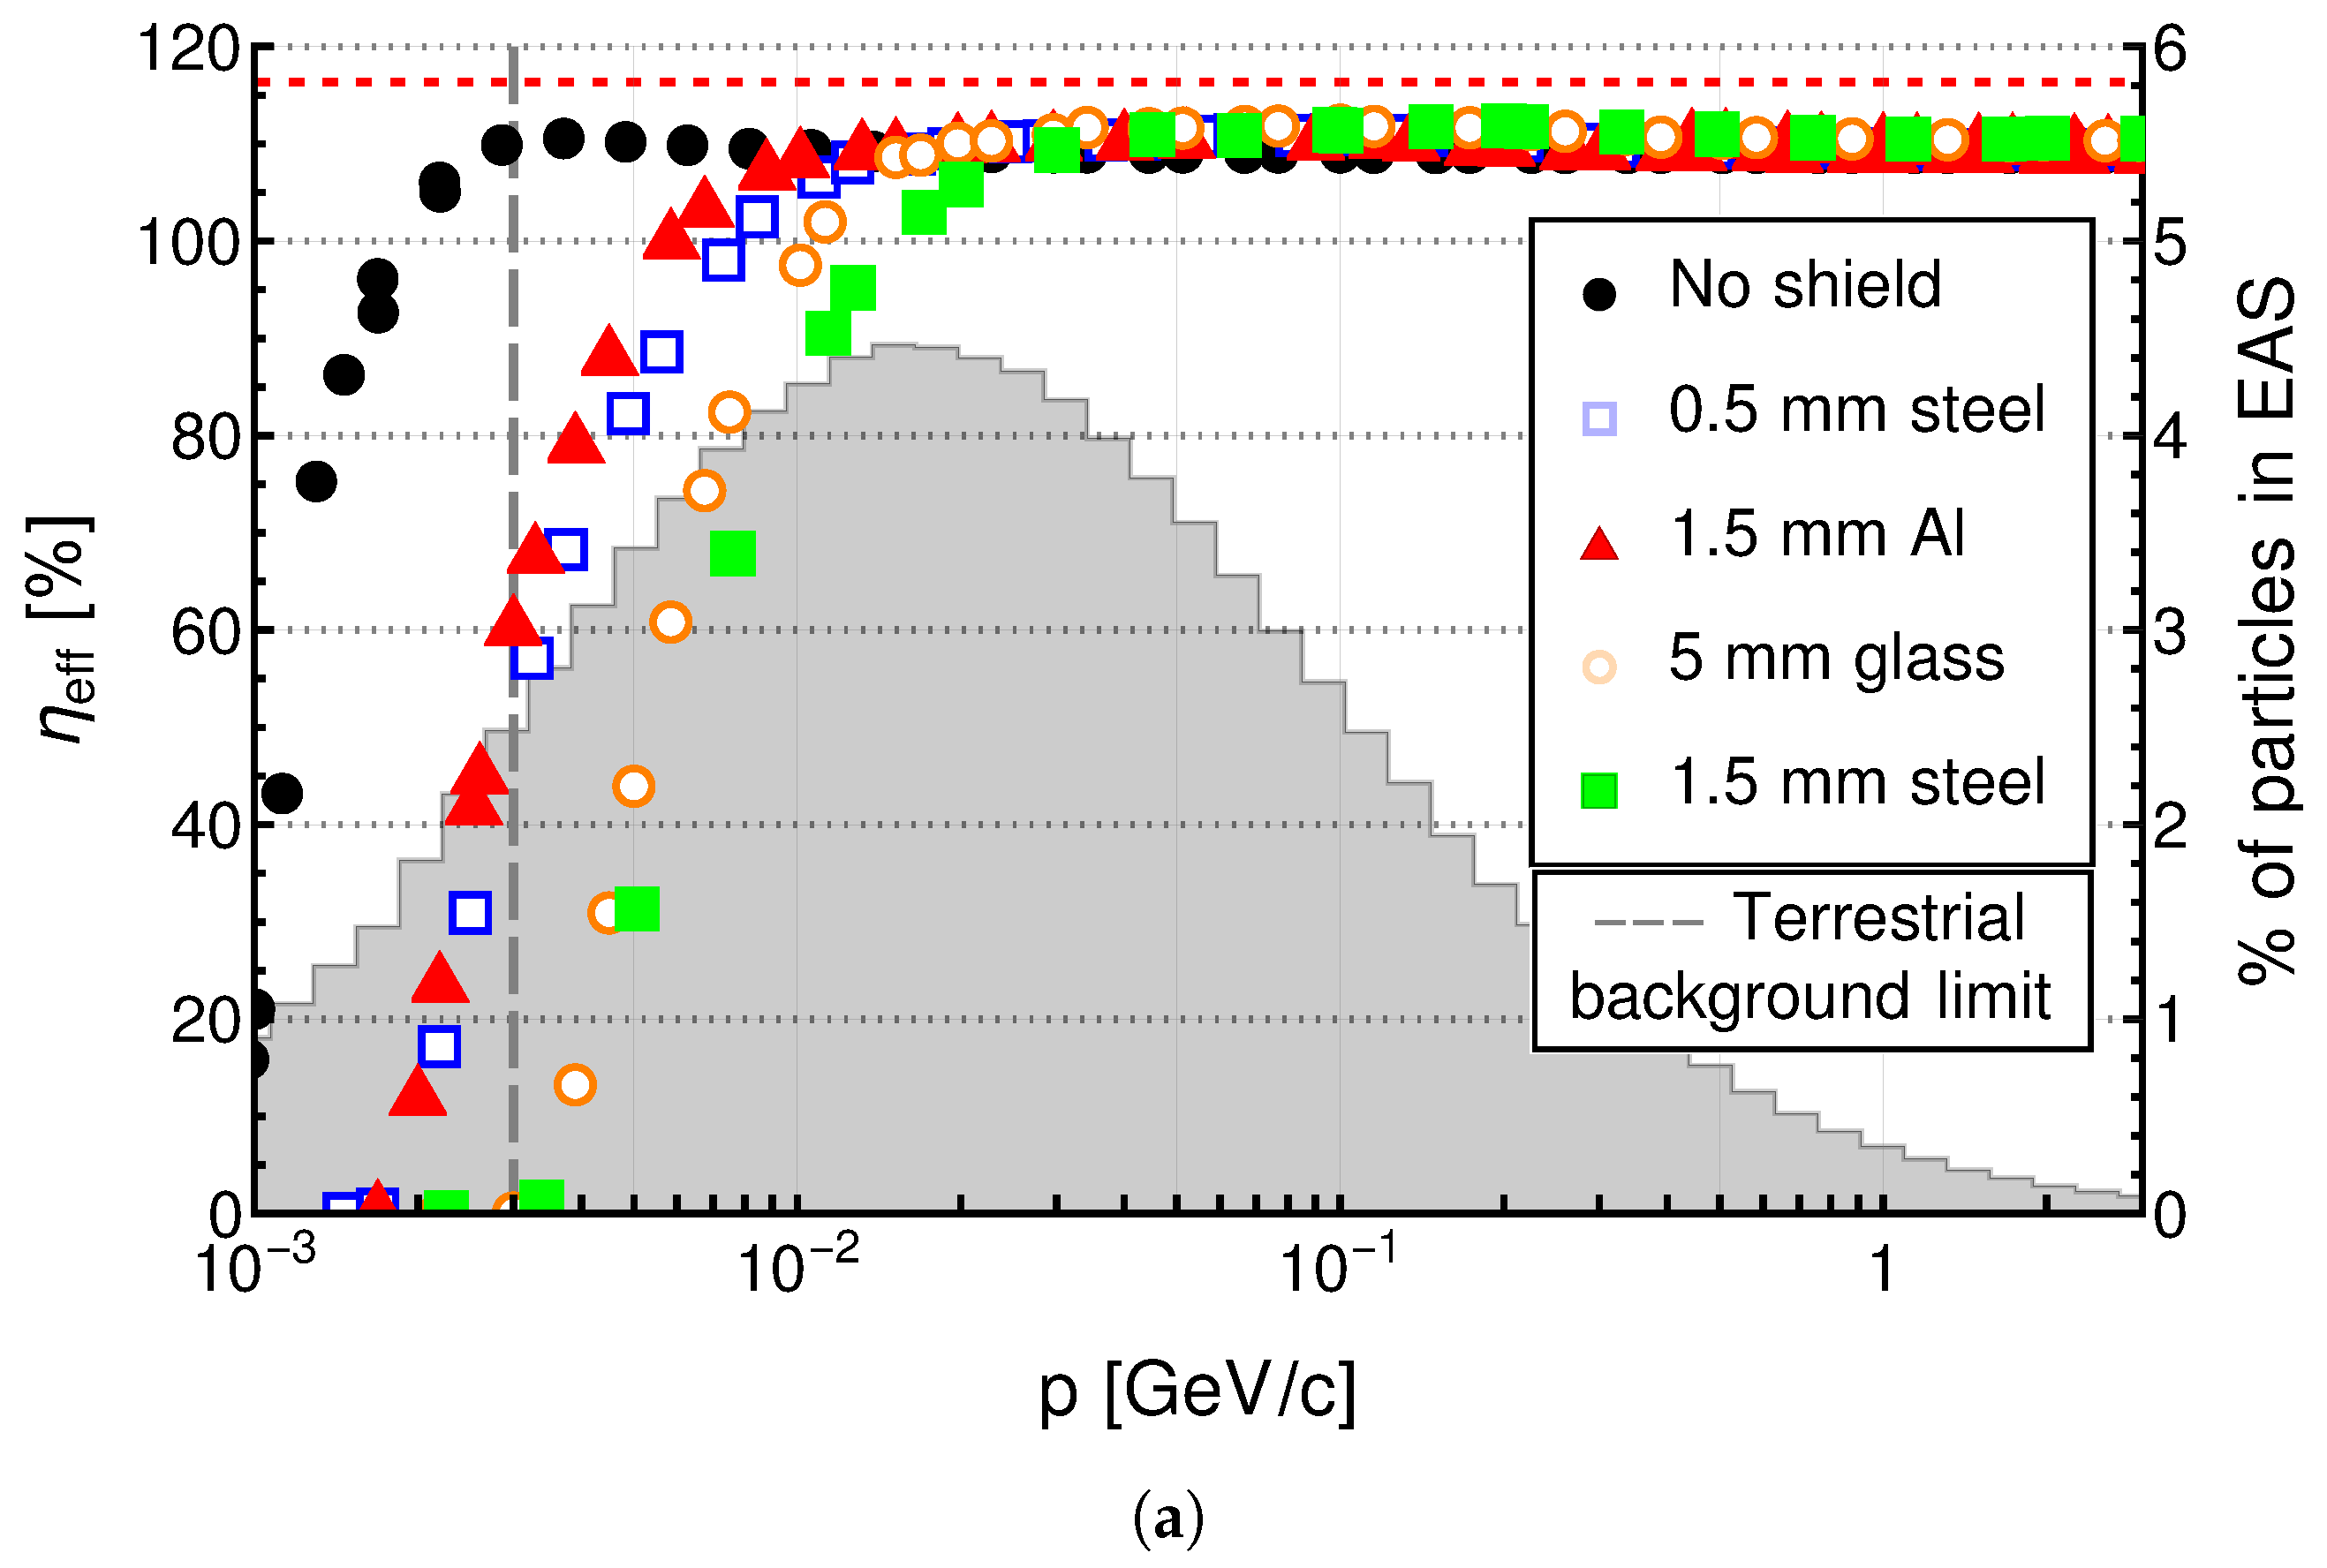
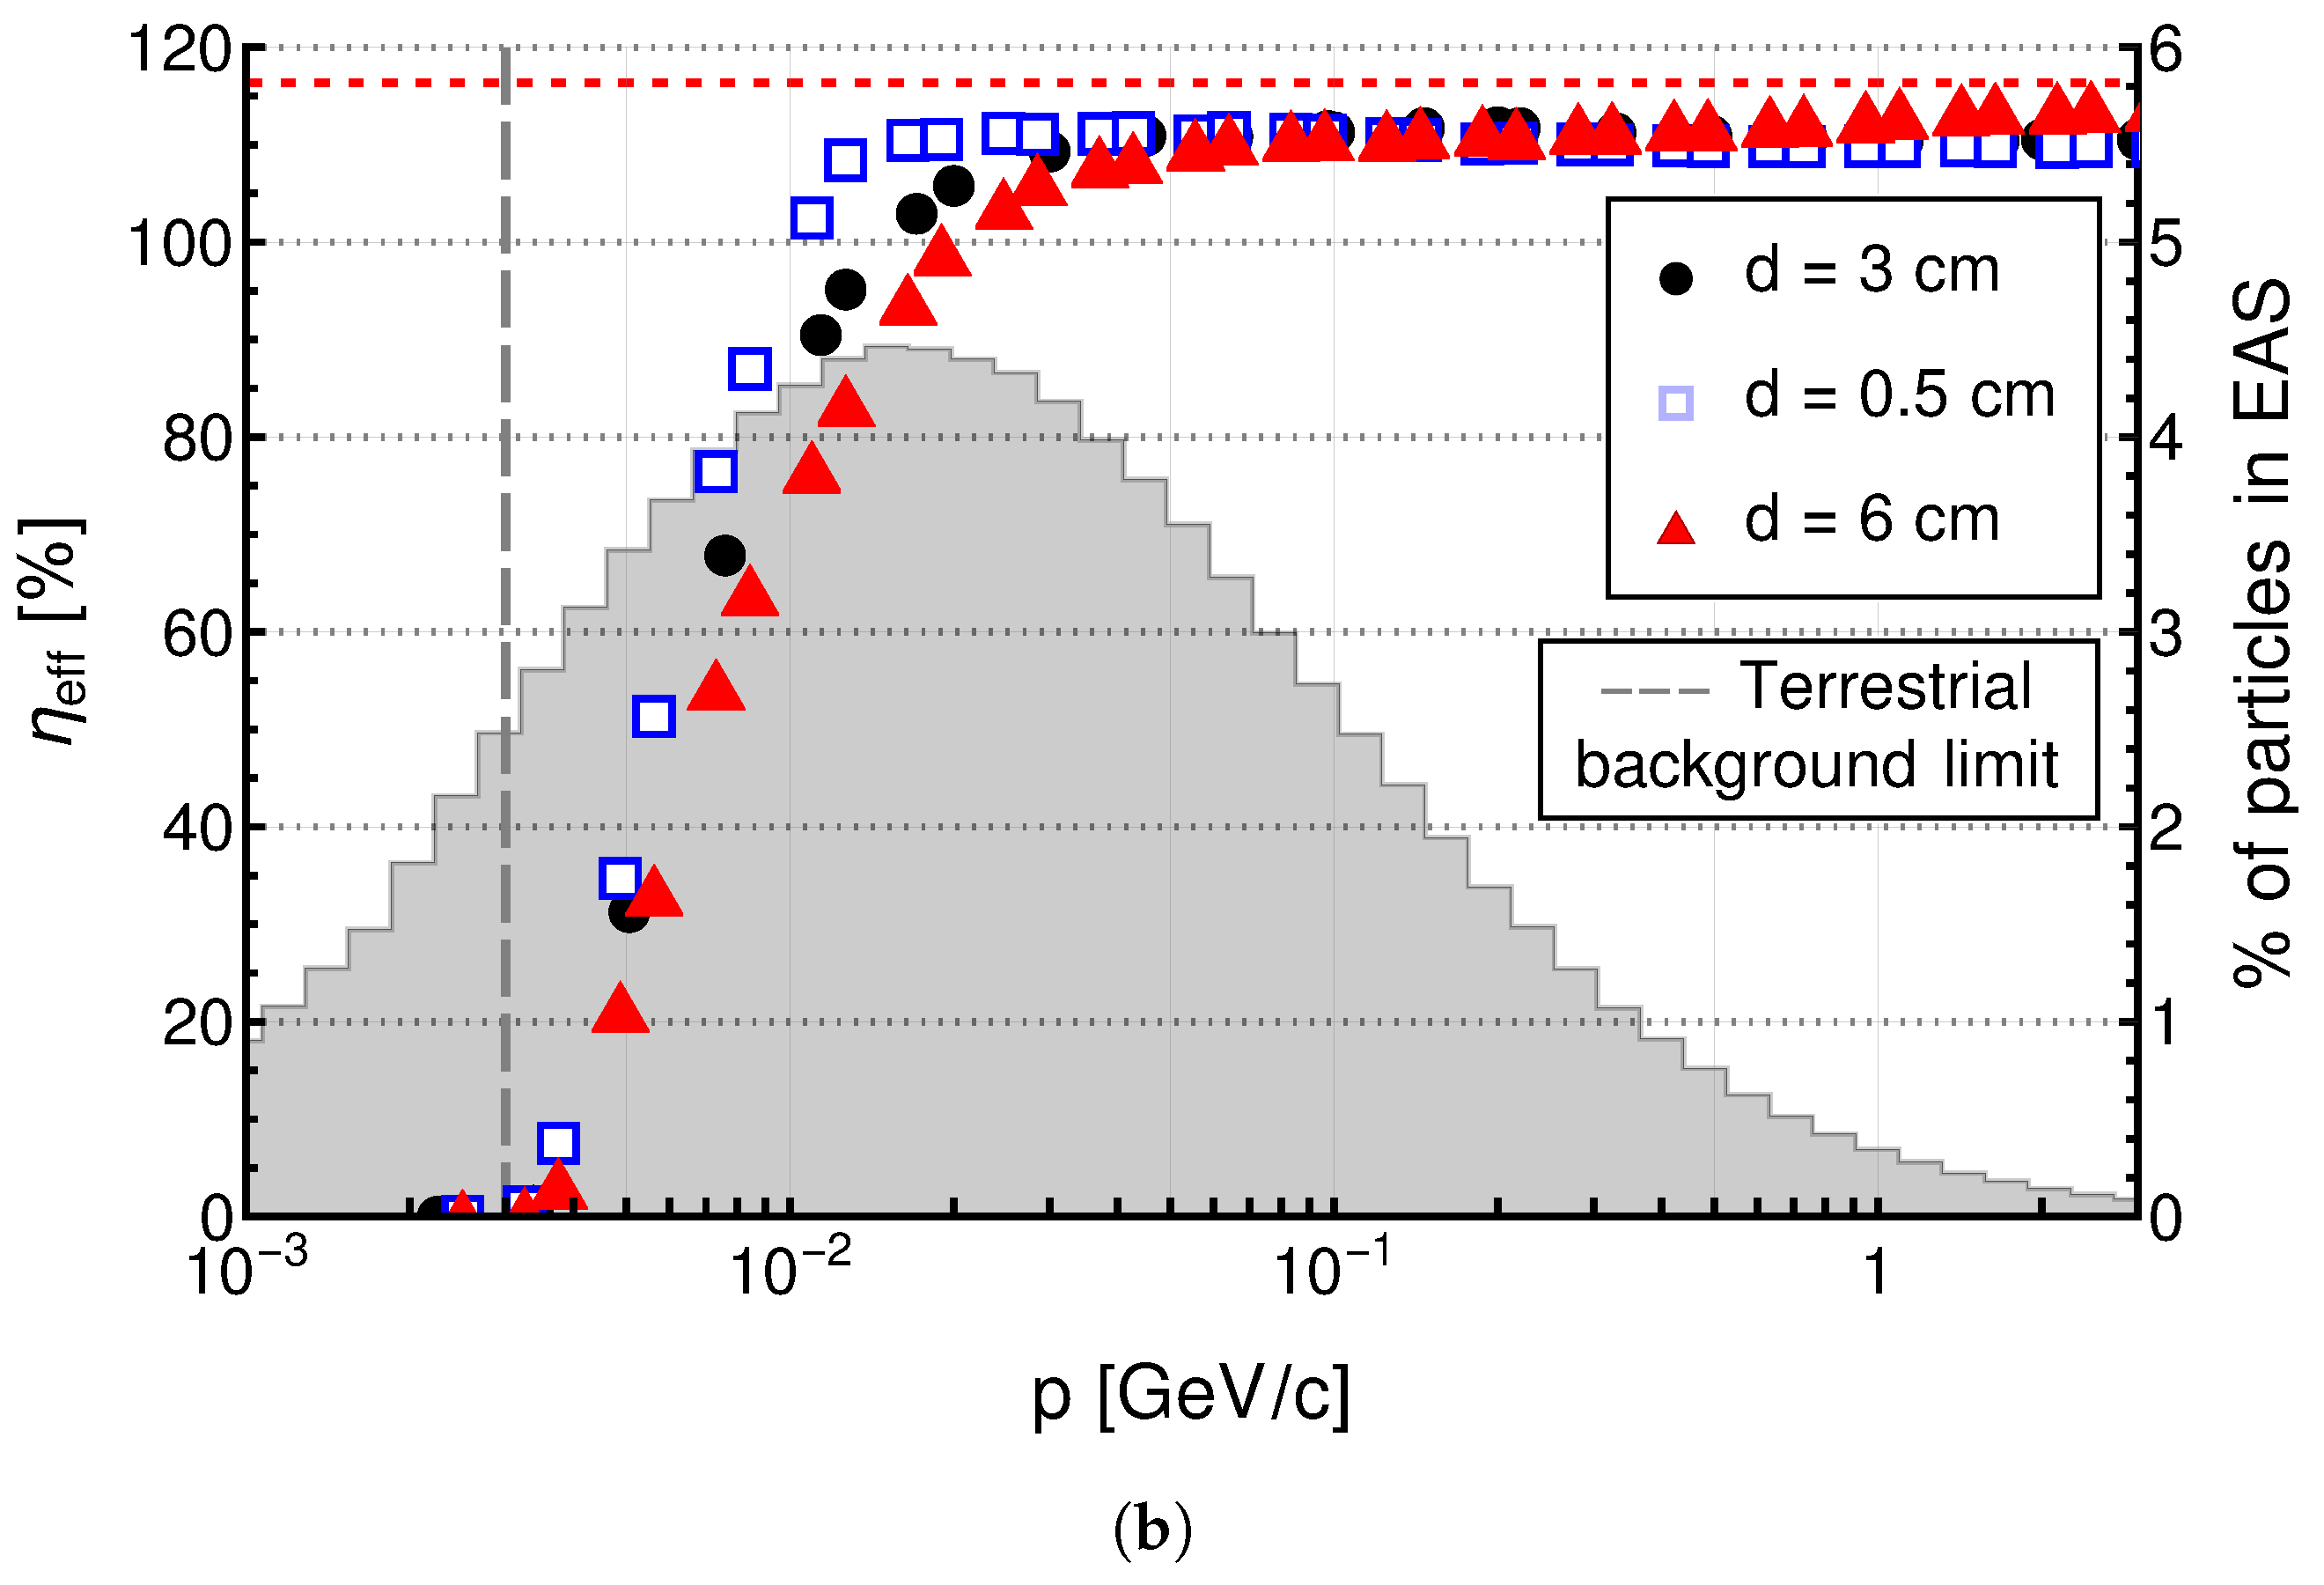
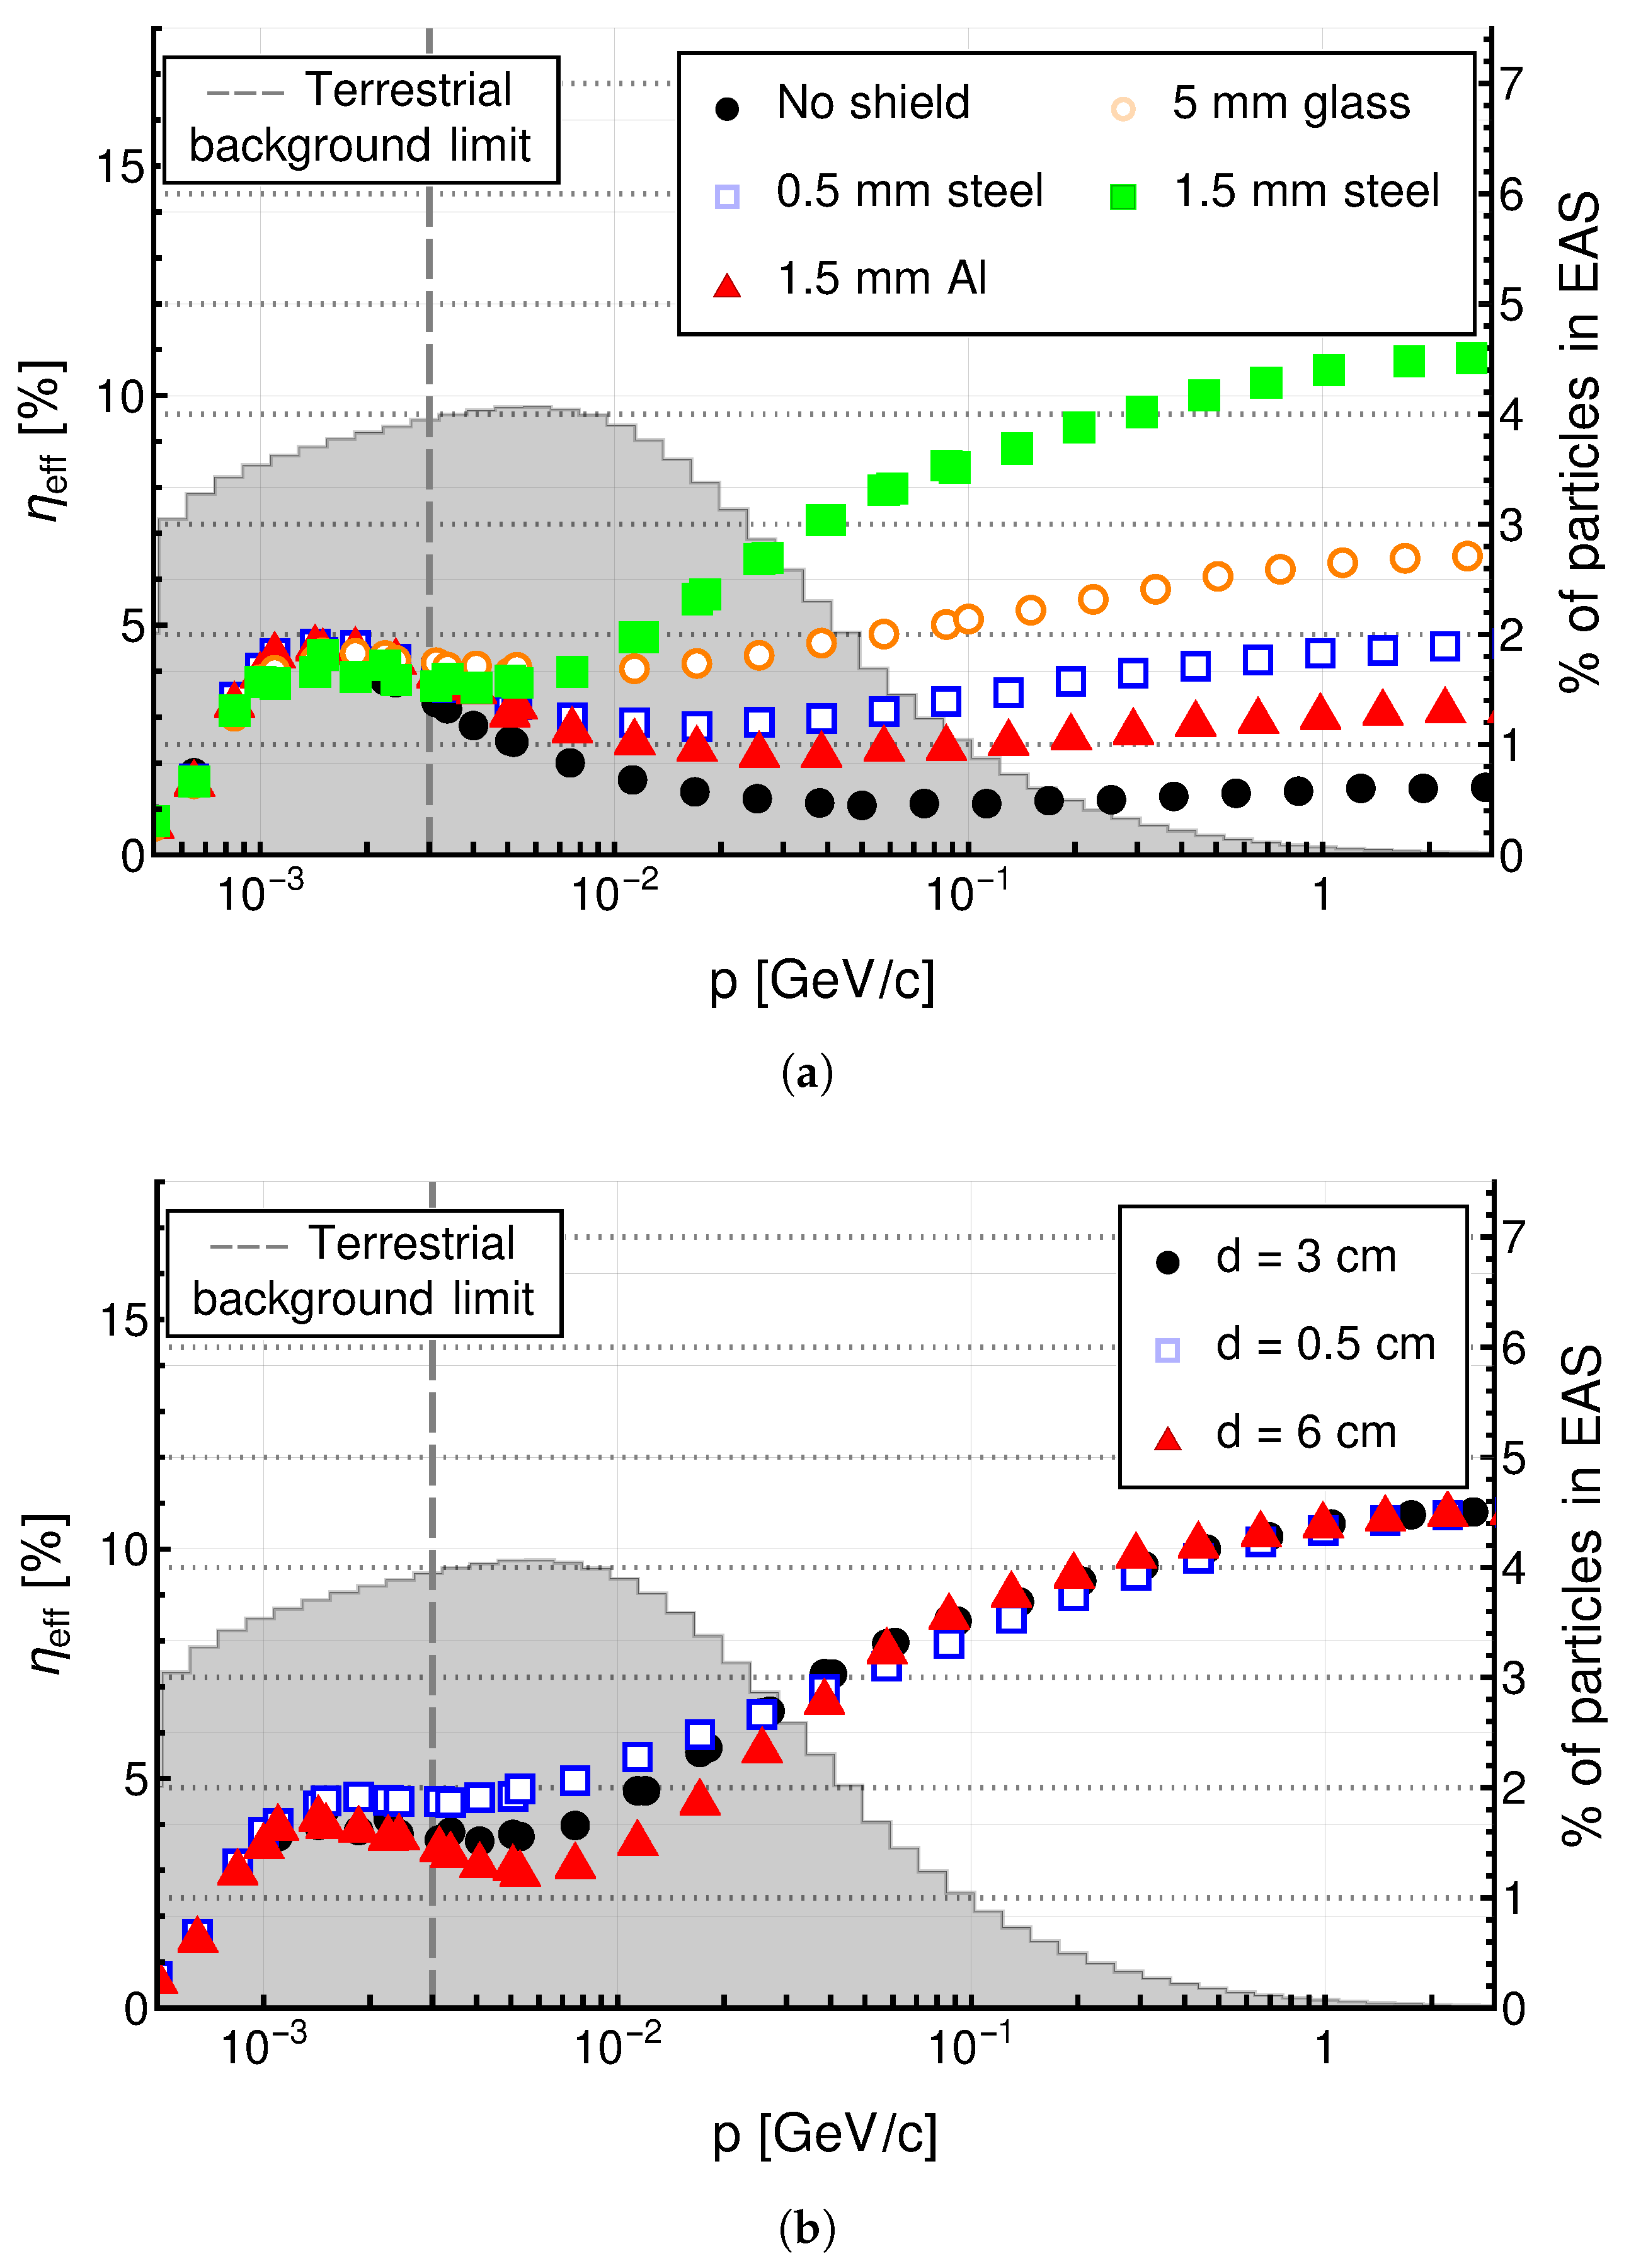
The larger is the distance of the shield from the scintillator is, the more distant electrons have a chance to be indirectly detected. This, in the case of detector array with sensors placed very close, may cause false double-signal events from a single electron. To reduce this effect the shielding should be placed as close as possible to the scintillators. The results presented in Figure 11 suggest that shielding to provide the best signal-to-noise ratio for electrons should be a dense metal plate thicker than 1 mm.
As for muons, the only internal parameters of the device that have a significant impact on effective sensitivity are the reflectivity of the aluminium coating and the type of medium between the scintillator and the SiPM (Figure 12).

4.3. Photons

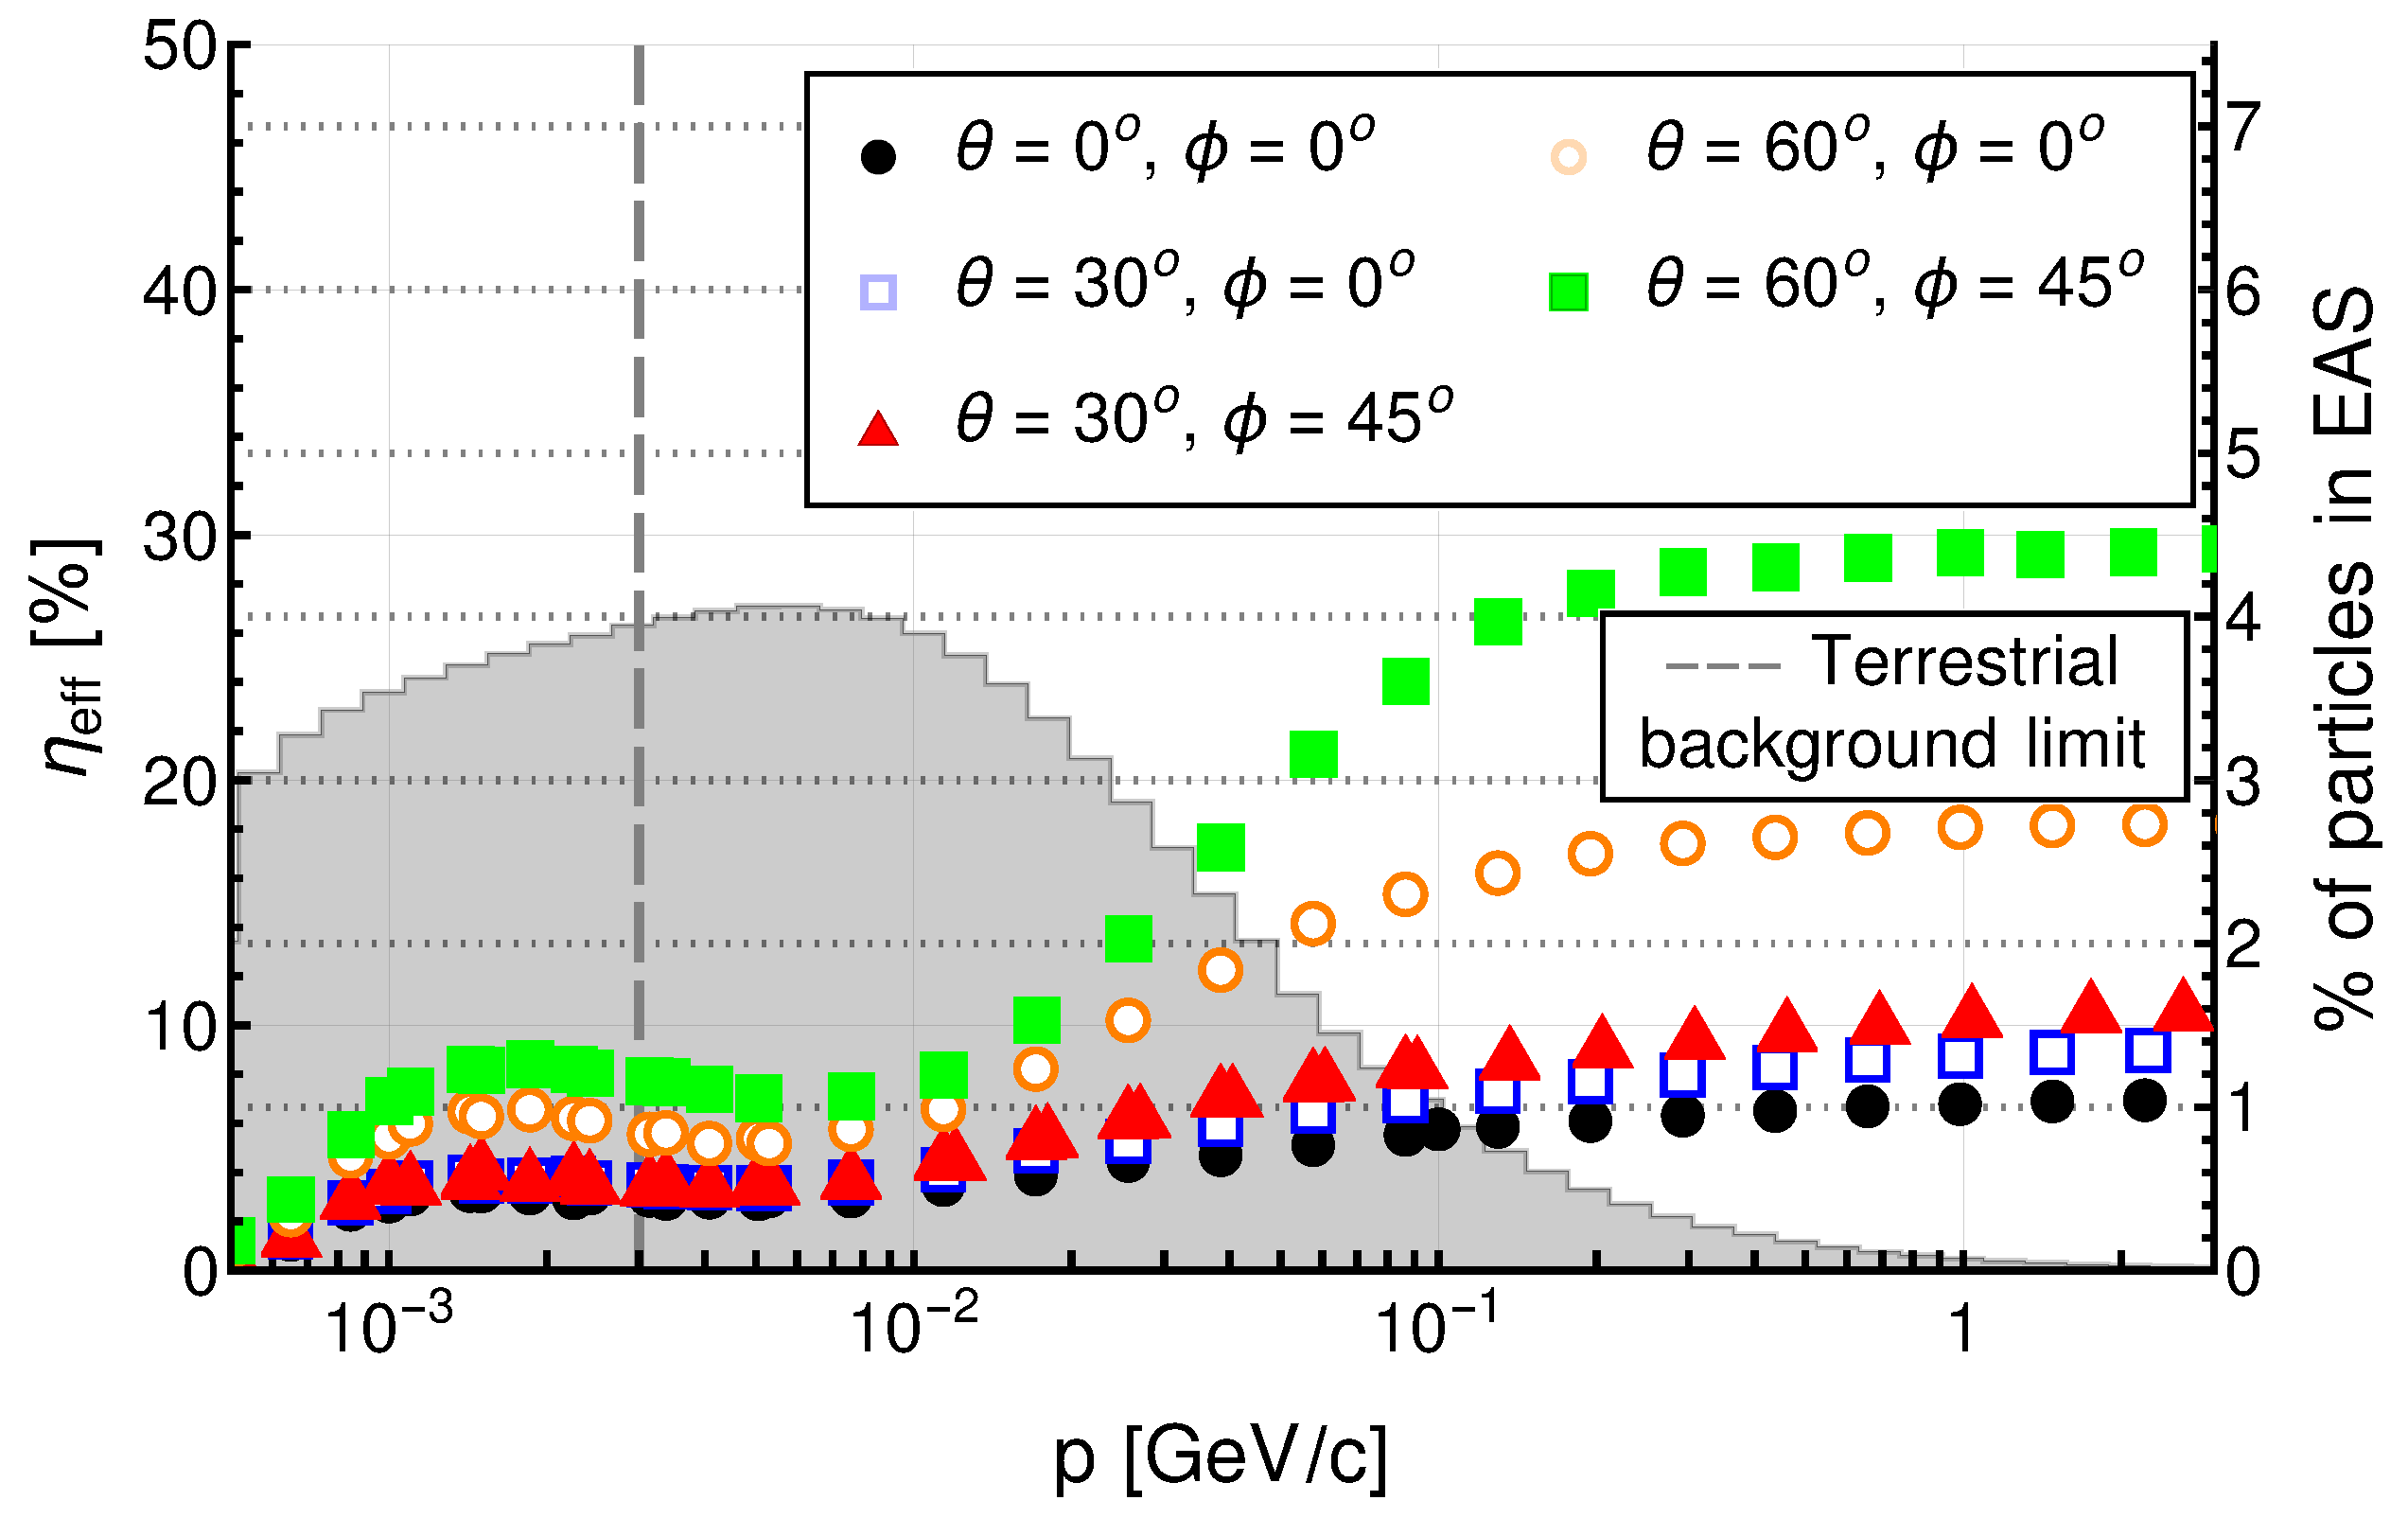
The behaviour of photons is more complicated. First of all, the detector is much less sensitive to gamma particles than to muons or electrons. The sensitivity is on a level between 5% to 30% depending on the inclination angles θ and ϕ . Following the geometrical acceptance of the scintillator, the sensitivity increases with the zenith angle (Figure 13).
Simulations with different types of shields proved that the sensitivity can be increased by using a thicker and denser shield. A larger distance from the shield to the scintillator or variation in the material between the scintillator and the SiPM has a smaller impact than that in the case of electrons. This is confirmed by the visualisation of the performed simulations in Figure 14 where the spread of the positions of photons is smaller than that for electrons in Figure 10.
As in the case of electrons, the conclusion is that the best option is to use sufficiently thick shielding right above the detector (Figure 15).
Again, the only internal parameters of the device that have a significant impact on effective sensitivity are the reflectivity of the aluminium coating and the type of medium between the scintillator and the SiPM (Figure 16).

4.4. External Factors

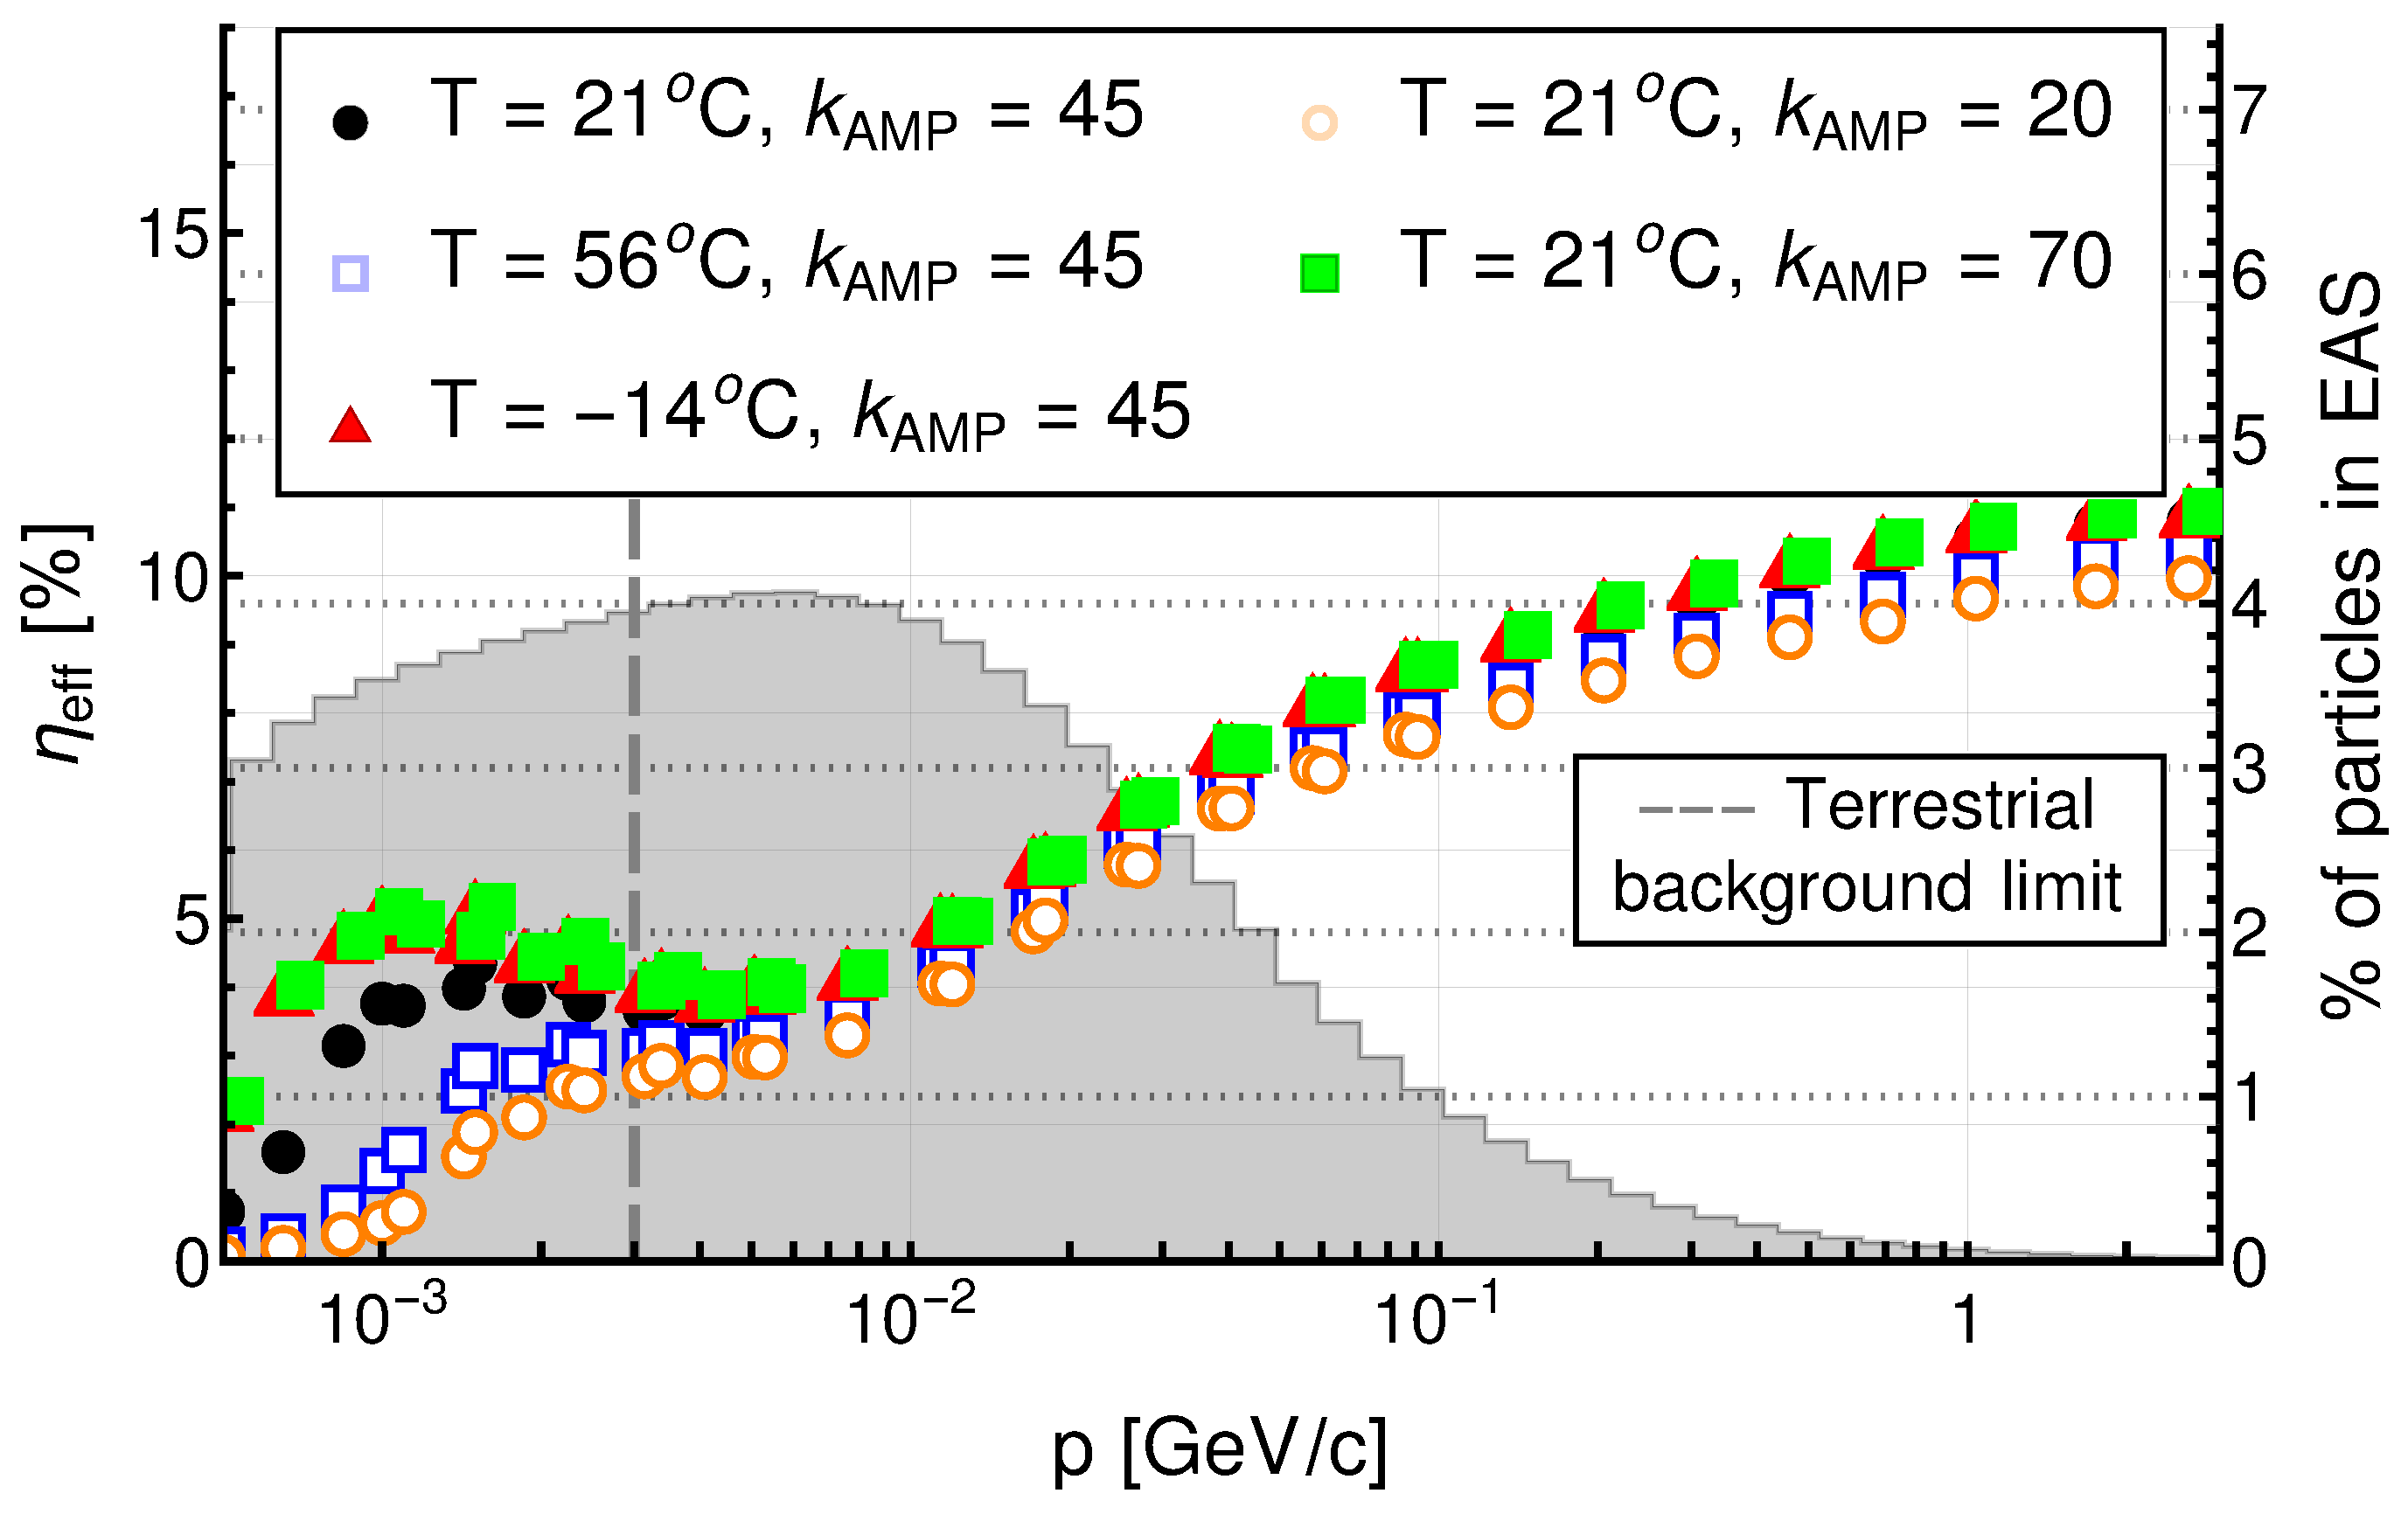
The relationship between sensitivity and some external factors of detector construction are also studied in this work. The first one is the temperature, T, of the SiPM [25]. It is estimated according to information in the documentation of the considered photomultiplier model. The dependences found are similar for each considered particle type so only results obtained for photons are presented in Figure 17. Unsurprisingly, cooler detectors works better than the overheated ones, especially for photons with the lowest energies. This highlights how important proper cooling during measurements is.
Another factor to be considered is the value of the amplification, k A M P . It can be easily adjusted with the use of a potentiometer in the amplifier circuit. The results of some exemplary values for photons are also presented in Figure 17. Even if the threshold for the acceptance of signals is fixed in the electronics, it can be adjusted through the modification of the amplification of the primary signal.

5. Conclusions

The simulations of the proposed scintillator detector indicate that it is sensitive to almost all muons from EASs and for electrons with momenta greater than 0.03 GeV/c. Sensitivity to photons is much lower; it is ∼5% for vertical X-rays and rises up to 30% for highly inclined gamma photons with energy of 1 GeV or greater. These efficiencies were obtained for properties of the SiPM as provided by the manufacturer and under assumptions of perfect reflective coating and optical gel. The performance of real devices may be worsened by imperfections on the surface of the scintillator, the lower reflectivity of the aluminium foil, or worse transparency in optical gel. It is also not obvious if the electronics will properly process the smallest signals from the SiPM. The testing of a prototype should thus include various measurements. Efficiency for low-energy electrons and photons may be tested using radioactive sources. Measurements of cosmic-ray flux as a function of zenith angle will allow the estimation of efficiency for muons. The validity of the simulation results can be verified using measurements of secondary cosmic rays for various shieldings. Tests with beams from accelerators would also be strongly beneficial. Further simulation studies should also consider a top–bottom coincidental setup of two scintillator detectors where signals in both of them are required.

Author Contributions

Conceptualisation, J.P., K.W.W., Ł.B., K.A.C. and P.H.; methodology, J.P.; software, J.P.; validation, K.W.W. and Ł.B.; formal analysis, J.P.; investigation, J.P.; data curation, J.P.; writing—original draft preparation, J.P.; writing—review and editing, K.W.W., Ł.B., P.H., K.A.C., S.S., O.R. and O.B.; visualisation, J.P.; supervision, K.W.W. and Ł.B.; project administration, P.H. All authors have read and agreed to the published version of the manuscript.

Funding

This research received no external funding.

Institutional Review Board Statement

Not applicable.

Informed Consent Statement

Not applicable.

Data Availability Statement

The data presented in this study is available on request from the corresponding author. Due to its volume it is stored on a private server with limited access.

Acknowledgments

We gratefully acknowledge Poland’s high-performance Infrastructure PLGrid ACK Cyfronet AGH for providing computer facilities and support within the computational grant no PLG/2024/016954. Our sincere thanks to Jerzy Niedźwiedzki for his consultation and advice regarding detector’s electronics.

Conflicts of Interest

The authors declare no conflicts of interest.

Abbreviations

The following abbreviations are used in this manuscript:
CREDOCosmic Ray Extremely Distributed Observatory
CRCosmic ray
EASExtensive Air Shower
SiPMSilicon Photomultiplier

References

  1. Allekotte, I.; Barbosa, A.; Bauleo, P.; Bonifazi, C.; Civit, B.; Escobar, C.; García, B.; Guedes, G.; Berisso, M.; Harton, J.; et al. The surface detector system of the Pierre Auger Observatory. Nucl. Instrum. Methods Phys. Res. Sect. Accel. Spectrometers Detect. Assoc. Equip. 2008, 2008586, 409–420. [Google Scholar] [CrossRef]
  2. Abu-Zayyad, T.; Aida, R.; Allen, M.; Anderson, R.; Azuma, R.; Barcikowski, E.; Belz, J.; Bergman, D.; Blake, S.; Cady, R.; et al. The cosmic-ray energy spectrum observed with the surface detector of the telescope array experiment. Astrophys. J. Lett. 2013, 768, L1. [Google Scholar] [CrossRef]
  3. Zhen, C.; Ming-Jun, C.; Song-Zhan, C.; Hong-Bo, H.; Cheng, L.; Ye, L.; Ling-Ling, M.; Xin-Hua, M.; Xiang-Dong, S.; Han-Rong, W.; et al. Introduction to large high altitude air shower observatory (LHAASO). Chin. Astron. Astrophys. 2019, 43, 457–478. [Google Scholar] [CrossRef]
  4. Dhital, N.; Homola, P.; Alvarez-Castillo, D.; Góra, D.; Wilczyński, H.; Cheminant, K.; Poncyljusz, B.; Mędrala, J.; Opiła, G.; Bhatt, A.; et al. Cosmic ray ensembles as signatures of ultra-high energy photons interacting with the solar magnetic field. J. Cosmol. Astropart. Phys. 2022, 2022, 038. [Google Scholar] [CrossRef]
  5. Fegan, D.; McBreen, B.; O’Sullivan, C. Observation of a burst of cosmic rays at energies above 7 × 10¹³ eV. Phys. Rev. Lett. 1983, 51, 2341. [Google Scholar] [CrossRef]
  6. Homola, P.; Beznosko, D.; Bhatta, G.; Bibrzycki, Ł.; Borczyńska, M.; Bratek, Ł.; Budnev, N.; Burakowski, D.; Alvarez-Castillo, D.E.; Cheminant, K.A.; et al. Cosmic-ray extremely distributed observatory. Symmetry 2020, 12, 1835. [Google Scholar] [CrossRef]
  7. Karbowiak, M.; Wibig, T.; Alvarez-Castillo, D.; Beznosko, D.; Duffy, A.R.; Góra, D.; Homola, P.; Kasztelan, M.; Niedźwiecki, M. The first credo registration of extensive air shower. Phys. Educ. 2020, 55, 055021. [Google Scholar] [CrossRef]
  8. Clay, R.; Singh, J.; Homola, P.; Bar, O.; Beznosko, D.; Bhatt, A.; Bhatta, G.; Bibrzycki, Ł.; Budnev, N.; Alvarez-Castillo, D.E.; et al. A search for cosmic ray bursts at 0.1 pev with a small air shower array. Symmetry 2022, 14, 501. [Google Scholar] [CrossRef]
  9. Axani, S.; Frankiewicz, K.; Conrad, J. Cosmicwatch: The desktop muon detector. J. Instrum. 2018, 13, 03. [Google Scholar] [CrossRef]
  10. Ros, G.; Sáez-Cano, G.; Medina-Tanco, G.; Supanitsky, A. On the design of experiments based on plastic scintillators using GEANT4 simulations. Radiat. Phys. Chem. 2018, 153, 140–151. [Google Scholar] [CrossRef]
  11. Min, S.; Kim, Y.; Ko, K.; Seo, B.; Cheong, J.; Roh, C.; Hong, S. Optimization of plastic scintillator for detection of gamma-rays: Simulation and experimental study. Chemosensors 2021, 9, 239. [Google Scholar] [CrossRef]
  12. Allison, J.; Amako, K.; Apostolakis, J.; Araujo, H.; Dubois, P.A.; Asai, M.; Barrand, G.; Capra, R.; Chauvie, S.; Chytracek, R.; et al. Geant4 developments and applications. IEEE Trans. Nucl. Sci. 2006, 53, 270–278. [Google Scholar] [CrossRef]
  13. Agostinelli, S.; Allison, J.; Amako, K.a.; Apostolakis, J.; Araujo, H.; Arce, P.; Asai, M.; Axen, D.; Banerjee, S.; Barrand, G.; et al. Geant4—a simulation toolkit. Nucl. Instrum. Methods Phys. Res. Sect. Accel. Spectrometers Detect. Assoc. Equip. 2003, 506, 250–303. [Google Scholar] [CrossRef]
  14. Allison, J.; Amako, K.; Apostolakis, J.; Arce, P.; Asai, M.; Aso, T.; Bagli, E.; Bagulya, A.; Banerjee, S.; Barrand, G.; et al. Recent developments in geant4. Nucl. Instrum. Methods Phys. Res. Sect. Accel. Spectrometers Detect. Assoc. Equip. 2016, 835, 186–225. [Google Scholar] [CrossRef]
  15. Brun, R.; Rademakers, F. Root—an object oriented data analysis framework. Nucl. Instrum. Methods Phys. Res. Sect. Accel. Spectrometers Detect. Assoc. Equip. 1997, 389, 81–86. [Google Scholar] [CrossRef]
  16. Caravaca, J.; Descamps, F.; Land, B.J.; Wallig, J.; Yeh, M.; Orebi Gann, G. Experiment to demonstrate separation of Cherenkov and scintillation signals. Phys. Rev. C 2017, 95, 055801. [Google Scholar] [CrossRef]
  17. Polyanskiy, M.N. Refractiveindex.info database of optical constants. Sci. Data 2024, 11, 94. [Google Scholar] [CrossRef] [PubMed]
  18. Riggi, S.; Rocca, P.L.; Leonora, E.; Presti, D.L.; Pappalardo, G.; Riggi, F.; Russo, G. Geant4 simulation of plastic scintillator strips with embedded optical fibers for a prototype of tomographic system. Nucl. Instrum. Methods Phys. Res. Sect. Accel. Spectrometers Detect. Assoc. Equip. 2010, 624, 583–590. [Google Scholar] [CrossRef]
  19. Introduction to the Silicon Photomultiplier (SiPM), AND9770/D Rev. 9, ON Semiconductor Corporation (Onsemi), July 2023. Available online: https://www.onsemi.com/download/application-notes/pdf/and9770-d.pdf (accessed on 10 May 2025).
  20. Rogalski, A.; Bielecki, Z.; Mikolajczyk, J. Detection of optical radiation. Bull. Pol. Acad. Sci. Tech. Sci. 2004, 52, 65–124. Available online: https://journals.pan.pl/Content/111805/PDF/%2852-1%2943.pdf (accessed on 10 May 2025).
  21. Simhony, Y.; Segal, A.; Orlov, Y.; Amrani, O.; Etzion, E. Scintillator-sipm detector for tracking and energy deposition measurements. Nucl. Instrum. Methods Phys. Res. Sect. Accel. Spectrometers Detect. Assoc. Equip. 2024, 1069, 169955. [Google Scholar] [CrossRef]
  22. Heck, D.; Knapp, J.; Capdevielle, J.N.; Schatz, G.; Thouw, T. CORSIKA: A Monte Carlo code to simulate extensive air showers. FZKA 6019 1998, 6019, 11. [Google Scholar]
  23. Radomir, B.; Dimitrije, M.; Dejan, J.; Nikola, V.; Aleksandar, D.; Vladimir, U.; Ivan, A. On the omnipresent background gamma radiation of the continuous spectrum. Nucl. Instrum. Methods Phys. Res. Sect. Accel. Spectrometers Detect. Assoc. Equip. 2014, 749, 7–11. [Google Scholar] [CrossRef]
  24. Fallu-Labruyere, A.; Geryes, T.; Ravera, C.; Jeanjacquot, N. Sparta: A comprehensive alpha, beta and gamma particulate radiation measurement system for environment monitoring. In Proceedings of the 2011 IEEE Nuclear Science Symposium Conference Record, Valencia, Spain, 23–29 October 2011; pp. 350–351. [Google Scholar] [CrossRef]
  25. Baszczyk, M.; Dorosz, P.; Głąb, S.; Kucewicz, W.; Mik, L.U.; Sapor, M. Silicon photomultiplier gain compensation algorithm in multidetector measurements. Metrol. Meas. Syst. 2013, 4, 655–666. [Google Scholar] [CrossRef]
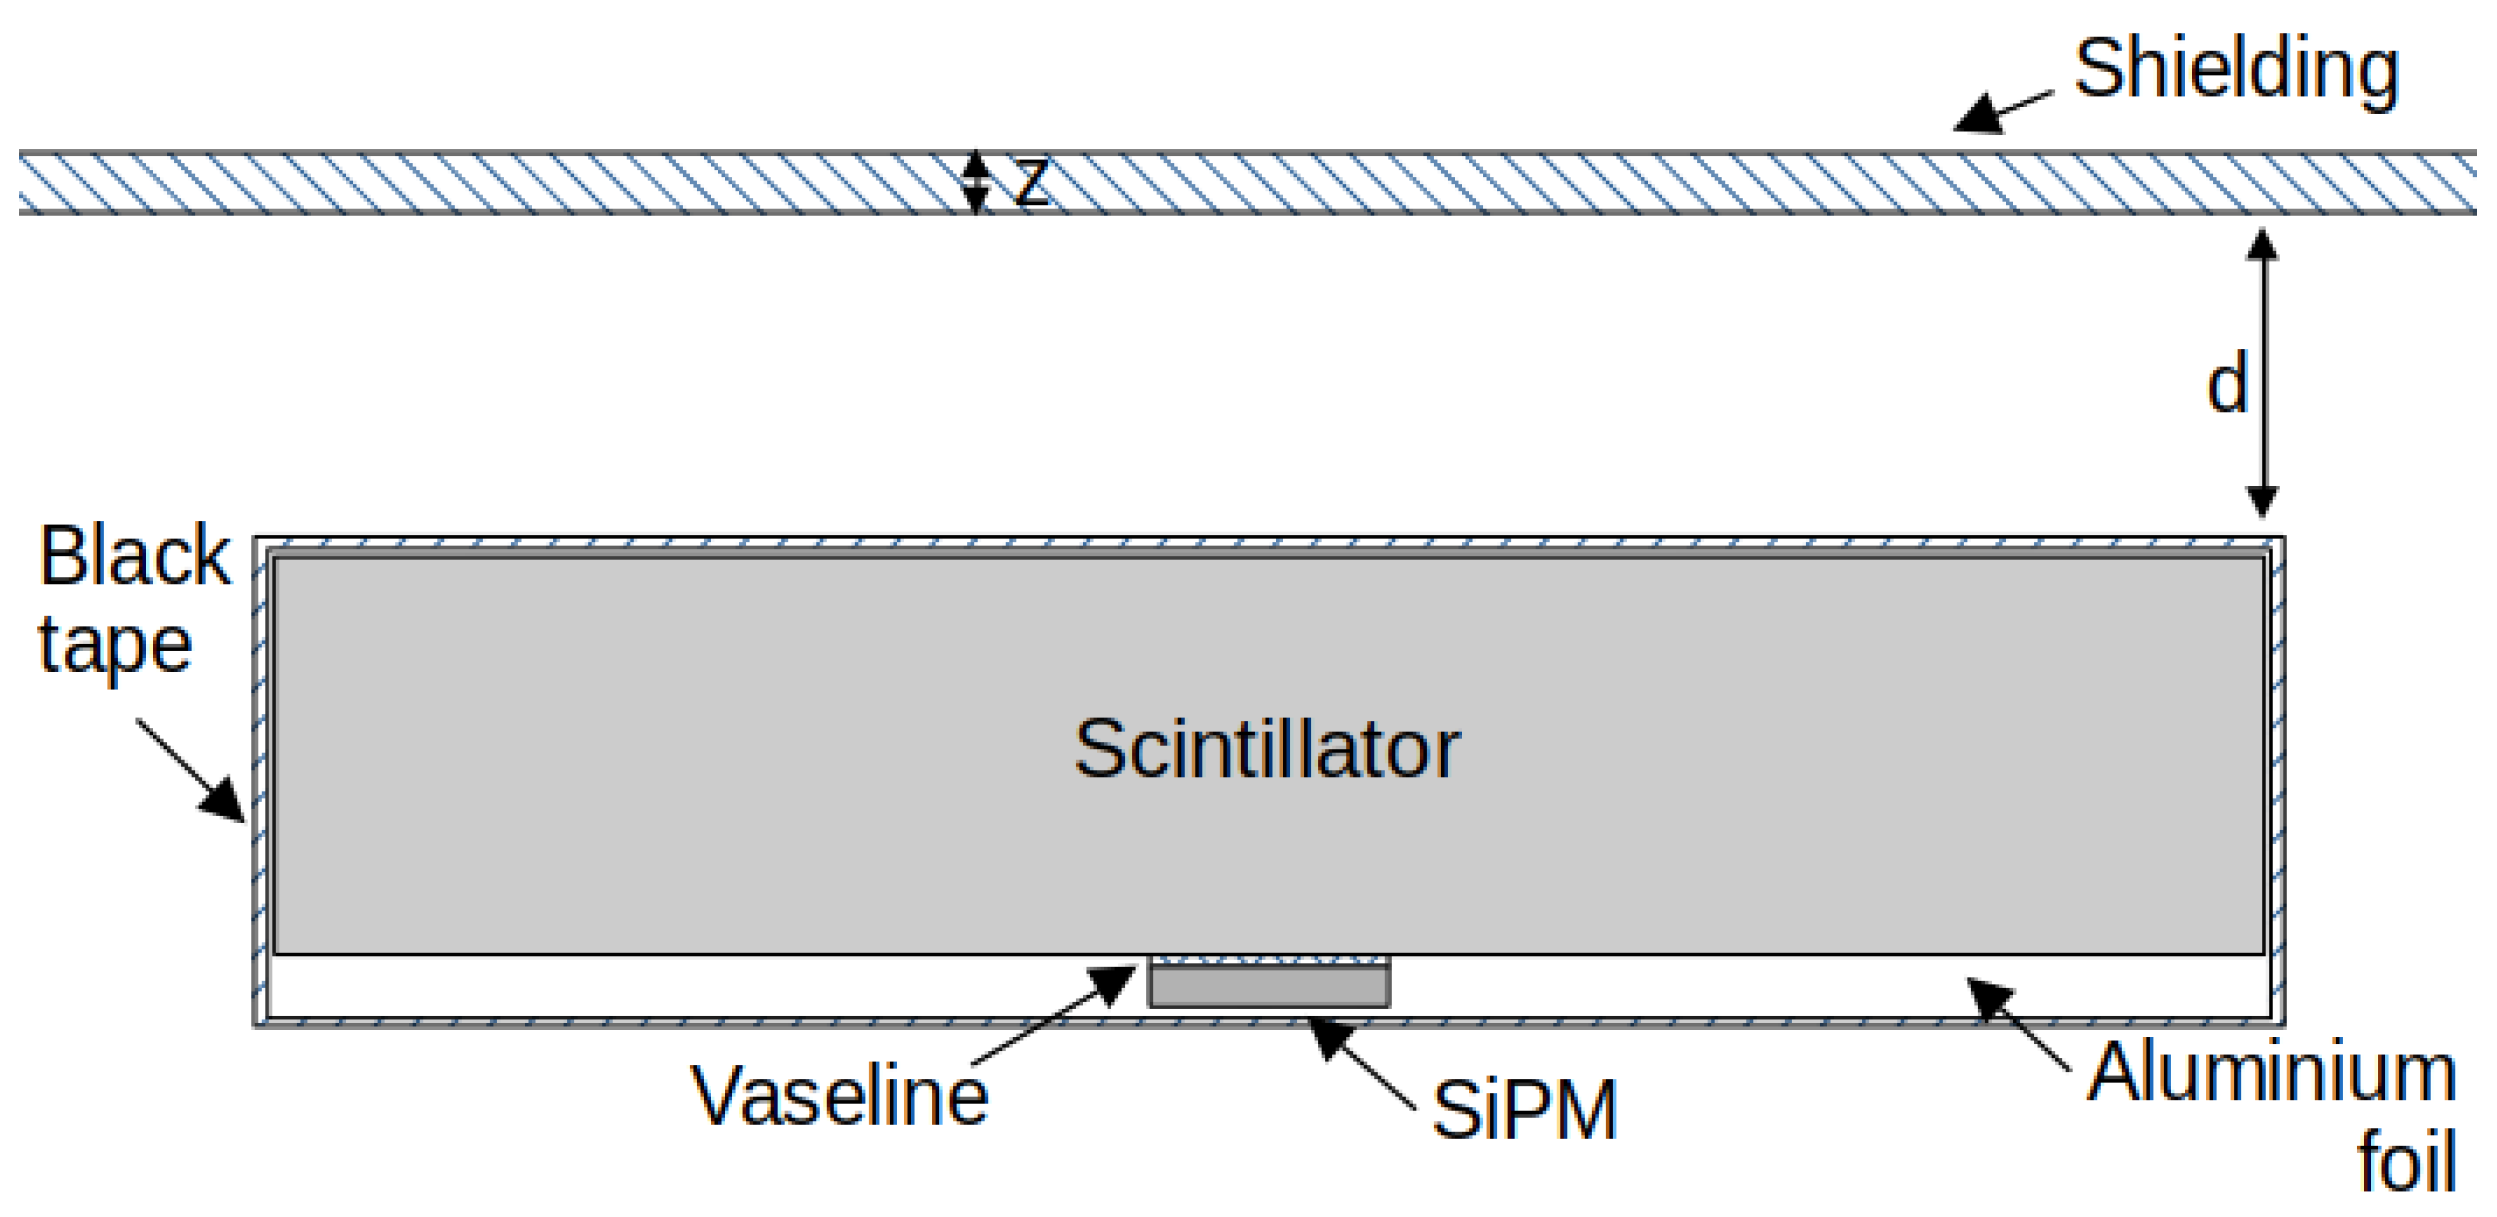
Figure 1. A schematic presenting the detector’s geometry. Shielding of the thickness z is placed at a distance d above the scintillator.
Applsci 15 06652 g001
Figure 2. Values of refractive index of iron and aluminium as function of photons’ wavelength λ [17]. Refractive index of iron is applied to stainless steel as it is its main component.
Applsci 15 06652 g002
Figure 3. Photon Detection Efficiency, PDE, as a function of photons’ wavelength, λ , for V b r = 24.5 V and three different values of V S i P M .
Applsci 15 06652 g003
Figure 4. Effect of increasing of detector’s effective area with greater inclination angle of particle wavefronts: (a) side view; (b) top view.
Applsci 15 06652 g004aApplsci 15 06652 g004b
Figure 5. Maps of the sensitivity to muons (left), electrons (middle), and photons (right) of p = 0.1 GeV at θ = ϕ = 0 ° for a detector placed at d = 3 cm behind a 1.5 mm steel plate. The value of each point was calculated from a beam of 100 particles aiming at the x and y coordinates of a plane placed on the top of the scintillator. Dotted lines represent the border of the scintillator while the solid square indicates the position of the SiPM.
Applsci 15 06652 g005
Figure 6. Maps of the sensitivity to electrons of different momenta at θ = ϕ = 0 ° for a detector placed at d = 3 cm behind a 1.5 mm steel plate: p = 0.003375 GeV (left); p = 0.011391 GeV (middle); and p = 0.025629 GeV (right). The value of each point was calculated from a beam of 100 particles aiming at the x and y coordinates of a plane placed on the top of the scintillator. Dotted lines represent the border of the scintillator while the solid square indicates the position of the SiPM.
Applsci 15 06652 g006
Figure 7. Sensitivity to muons as a function of their momentum for different inclination angles and 1.5 mm steel shielding 3 cm above the detector. The gray histogram shows the distribution of muons in a vertical EAS initiated by 1000 TeV CR protons simulated with CORSIKA. Different horizontal lines represent η e f f = 100 % · A e f f ( θ , ϕ ) / A 0 .
Applsci 15 06652 g007
Figure 8. Sensitivity to muons as a function of their momentum for different values of internal parameters of the device at θ = 30 ° and ϕ = 45 ° . The gray histogram shows the distribution of muons in a vertical EAS initiated by 1000 TeV CR protons simulated with CORSIKA. The red dashed horizontal line represents η e f f = 100 % · A e f f ( 30 ° , 45 ° ) / A 0 .
Applsci 15 06652 g008
Figure 9. Sensitivity to electrons as function of their momentum for different inclination angles and 1.5 mm steel shielding 3 cm above detector. Gray histogram shows distribution of electrons in vertical EAS initiated by 1000 TeV CR protons simulated with CORSIKA. Different horizontal lines represent η e f f = 100 % · A e f f ( θ , ϕ ) / A 0 .
Applsci 15 06652 g009
Figure 10. A presentation of sensitivity to electrons for the shield placed at different distances, d, above the scintillator: 0.5 cm (left), 3 cm (middle), and 6 cm (right). Sensitivity was estimated for electrons with p = 0.012656 GeV/c2 for θ = 30 ° and ϕ = 45 ° . Value of each point was calculated from a beam of 100 particles aiming at the x and y coordinates of a plane placed on the top of the scintillator. Dotted lines represent the border of the scintillator while the solid square indicates position of the SiPM. The black arrow shows the direction of the primary cosmic-ray particle.
Applsci 15 06652 g010
Figure 11. Sensitivity to electrons as a function of their momentum for different shielding configurations at θ = 30 ° and ϕ = 45 ° : (a) different shields’ materials and thickness, z; (b) different distances, d, between the device and 1.5 mm steel shielding. The gray histogram shows the distribution of electrons in a vertical EAS initiated by 1000 TeV CR protons simulated with CORSIKA. The red dashed horizontal line represents η e f f = 100 % · A e f f ( 30 ° , 45 ° ) / A 0 .
Applsci 15 06652 g011aApplsci 15 06652 g011b
Figure 12. Sensitivity to electrons as a function of their momentum for different values of internal parameters of the device at θ = 30 ° and ϕ = 45 ° . The gray histogram shows the distribution of electrons in a vertical EAS initiated by 1000 TeV CR protons simulated with CORSIKA. The red dashed horizontal line represents η e f f = 100 % · A e f f ( 30 ° , 45 ° ) / A 0 .
Applsci 15 06652 g012
Figure 13. Sensitivity to photons as a function of their momentum for different inclination angles and 1.5 mm steel shielding 3 cm above the detector. The gray histogram shows the distribution of photons in a vertical EAS initiated by 1000 TeV CR protons simulated with CORSIKA.
Applsci 15 06652 g013
Figure 14. Maps of sensitivity to photons for the shield placed at distances, d, above the scintillator: 0.5 cm (left), 3 cm (middle), and 6 cm (right), respectively. Sensitivity was estimated for photons with p = 0.012656 GeV/c2 for θ = 30 ° and ϕ = 45 ° . The value of each point was calculated from a beam of 100 particles aiming at the x and y coordinates of a plane placed on the top of the scintillator. Dotted lines represent the border of the scintillator while the solid square indicates position of the SiPM. The black arrow shows the direction of the primary cosmic-ray particle.
Applsci 15 06652 g014
Figure 15. Sensitivity to photons as a function of their momentum for different shielding configurations at θ = 30 ° and ϕ = 45 ° : (a) different shields’ materials and thickness, z; (b) different distance, d, between the device and 1.5 mm steel shielding. The gray histogram shows distribution of photons in a vertical EAS initiated by 1000 TeV CR protons simulated with CORSIKA.
Applsci 15 06652 g015
Figure 16. Sensitivity to photons as a function of their momentum for different values of internal parameters of the device at θ = 30 ° and ϕ = 45 ° . The gray histogram shows distribution of photons in a vertical EAS initiated by 1000 TeV CR protons simulated with CORSIKA.
Applsci 15 06652 g016
Figure 17. Sensitivity to photons as a function of their momentum for different temperatures, T, and different values of k A M P at θ = 30 ° and ϕ = 45 ° . The gray histogram shows the distribution of photons in a vertical EAS initiated by 1000 TeV CR protons simulated with CORSIKA.
Applsci 15 06652 g017
Table 1. Values of parameters used in simulation of standard setup of scintillator detector [17,18]. Parameters of scintillation are named as in Geant4 version 11.1.2.
ParameterScintillatorAl FoilBlack TapeSiPMVaseline
Density [g cm−3] 1.0322.71.282.3290.82
Thickness [mm]100.140.3610.6
CompositionH, CAlH, C, ClSiH, C, N
Ratio of elements11:1013:2:1115:15:1
Refractive index1.58Figure 21.541.591.467
Absorption coefficient [cm−1]0.001966,8500.069339-0.0173
Attenuation length [cm]210----
Scintillation yield [MeV−1]11,136----
Scintillation yield 10.27----
Scintillation constant 1 [ns]2.1----
Scintillation constant 2 [ns]14.2----
Resolution scale1.0----
Table 2. Values of parameters used in the simulations for considered types of shields [18].
ParameterStainless SteelAluminiumIronGlass
Density [g cm−3]1.0322.71.282.329
Thickness [mm]0.5, 1.51.51.55
CompositionFe, Cr, Ni, CAlFeO, Na, Si, Ca
Percent of elements [%]70.67, 20, 9.25, 0.0810010045.98, 9.64411, 33.6553, 10.7205
Refractive indexFigure 2Figure 2Figure 21.51
Absorption coefficient [cm−1]1,643,500966,8501,643,5000.0021033
Distance from scintillator, d [cm]0.5, 3, 6333
Table 3. Values of parameters used to calculate amplitude of signal produced in detector at V S i P M = 29.4 V and T = 21 °C.
V b r [V]GC [pF] Δ V [V]M c p [%]
24.5 3 · 10 6 34000.0001418,98064
Disclaimer/Publisher’s Note: The statements, opinions and data contained in all publications are solely those of the individual author(s) and contributor(s) and not of MDPI and/or the editor(s). MDPI and/or the editor(s) disclaim responsibility for any injury to people or property resulting from any ideas, methods, instructions or products referred to in the content.