Article

Comparative Measurement of Mercury Release Values from Amalgam Restorations with Different Surface Numbers: An In Vitro Study

1
Department of Restorative Dentistry, Faculty of Dentistry, Istanbul University, Istanbul 34116, Türkiye
2
Department of Restorative Dentistry, Faculty of Hamidiye Dentistry, Health Sciences University, Istanbul 34668, Türkiye
3
Department of Environmental Engineering, Faculty of Engineering, Istanbul University-Cerrahpasa, Istanbul 34320, Türkiye
*
Author to whom correspondence should be addressed.
Appl. Sci. 2025, 15(12), 6646; https://doi.org/10.3390/app15126646
Submission received: 12 May 2025 / Revised: 4 June 2025 / Accepted: 6 June 2025 / Published: 13 June 2025
(This article belongs to the Section Applied Dentistry and Oral Sciences)

Abstract

Purpose: This research examines the release of mercury from dental amalgam restorations over time, analyzing the relationship between the number of restored surfaces and mercury levels in artificial saliva. Materials and Methods: An in vitro study was performed utilizing 224 plastic model teeth restored with dental amalgam. The teeth were categorized based on the number of surfaces restored, which ranged from Group 1 (1 surface) to Group 6 (48 surfaces). These were then immersed in artificial saliva, and the mercury levels were measured at intervals up to 30 days using atomic absorption spectrophotometry. Results: The release of mercury increased in correlation with both the number of restored surfaces and the passage of time. Significant differences were noted among the groups, with the highest release occurring in the group with the greatest number of surfaces. Mercury levels exhibited a consistent rise from baseline to day 30. Conclusions: The amount of mercury released from amalgam restorations increases in relation to both the number of restored surfaces and the duration of exposure.

1. Introduction

Although composite materials retain their top spot in the dental filling category, the former champion was amalgam fillings [1]. In recent years, the use of dental amalgam has markedly declined worldwide due to growing concerns over its safety, primarily associated with its mercury content [2,3]. Moreover, patients favor tooth-colored restorations over the metallic hue of amalgam due to their superior aesthetic appeal [4]. Dental amalgam has been used routinely to restore teeth, especially for restorations in premolars and molars for nearly 200 years. Previously, the primary factors contributing to its preference were its long-term excellent performance, resistance to mastication, relatively low cost, and ease of manipulation and placement [1,5,6].
Since the 1970s, dental amalgam has provided exemplary service to patients and dentists alike. However, advancements in sensitive analytical chemistry techniques during the same period revealed that mercury is continuously released from dental amalgams and is absorbed into the body [3,7,8]. This revelation sparked ongoing debate about the safety of dental amalgams for both patients and dental personnel [9,10]. Previous studies have demonstrated that mercury vapor can be released from amalgam restorations during various procedures, including insertion, trituration, condensation, carving, polishing, and removal [11,12,13]. Additionally, elements such as silver, copper, and zinc can be released into saliva from amalgam restorations [14]. These heavy metals have often been implicated in symptoms and diseases of unknown etiology [15]. Mercury, in particular, is a heavy metal known for its toxicity and has been associated with significant public health disasters, such as those in Iraq [16] and Minamata Bay, Japan [17].
The prevalence of amalgam as a direct restorative material has diminished over time, largely due to the increasing preference for tooth-colored composite resin restorations, which necessitate more conservative cavity preparations. Concerns persist that the structural integrity of teeth may be compromised by the extensive removal of sound tissue required to fulfill amalgam’s mechanical strength and retention criteria. Furthermore, the waning reliance on amalgam is also fueled by apprehensions—both individual and environmental—regarding the potential risks associated with the elemental mercury content in these restorations [18].
In the 1830s, amalgam restorations were crafted by amalgamating silver coins with mercury prior to their placement within the cavity [19,20]. To ensure the retention of this metallic mixture, the tooth structure was meticulously prepared before the silver-hued compound was inserted and compacted into the prepared space. The final morphology was sculpted using manual instruments before the material underwent hardening [20]. Current dental amalgam contains approximately 40–50% elemental metallic mercury by weight. The alloy powder consists of 50–60% of a blend of tin, copper, silver, zinc, palladium, and indium [18,21,22,23,24].
Although dental amalgam has been extensively utilized as a restorative material, its mercury content continues to be a subject of debate [25]. Clarkson et al. have identified dental amalgam as one of the “three contemporary manifestations of mercury,” alongside methylmercury, which accumulates in fish, and ethylmercury, commonly used as a preservative in vaccines [26]. The total amount of mercury contained in dental amalgam restorations placed in individuals’ mouths is estimated to range between 75 and 100 tons [27]. It is well established that amalgam fillings emit low levels of mercury vapor, with the release rate being influenced by multiple factors, including the dimensions of the filling, bruxism, tooth brushing, food consistency, the location of the restoration, and mastication. Moreover, the age, composition, and surface area of the amalgam are additional factors influencing mercury release. Mercury can be released from dental amalgams through three principal mechanisms: mechanical wear, the dissolution or volatilization of elemental mercury, and electrochemical degradation [28,29]. During the placement or removal of amalgam restorations, patients may be exposed to minute amounts of mercury vapors and particulates. The extent of elemental mercury emission into the oral cavity has been reported to be directly proportional to the number of amalgam-covered surfaces [29]. Moreover, mercury and other constituents of amalgam restorations can be absorbed into the body, potentially triggering allergic reactions in susceptible individuals. For the vast majority of patients, routine exposure to amalgam does not adversely affect systemic or oral health. However, certain symptoms—such as discoloration of the oral mucosa, amalgam tattoos, lichen planus, mood disturbances including irritability and depression, paresthesia of the extremities, nocturia, persistent fatigue, cold intolerance, bloating, cognitive impairment, anger, and constipation—have been sporadically documented [30]. Additionally, research has identified a significant association between urinary mercury concentrations in children and both the quantity and duration of their amalgam restorations [25].
The World Health Organization estimates that the typical daily mercury absorption from amalgams ranges between 1 and 22 µg, with the majority of individuals being exposed to doses under 5 µg per day. However, there is substantial variability, with the upper end reaching as much as 100 µg per day, particularly in association with gum chewing. Factors influencing exposure include the total surface area of the amalgam, its physical and chemical composition, mechanical stresses from chewing and bruxism, proximity to other metals, and oral conditions such as temperature, pH, and negative air pressure. The FDA’s current regulations regarding amalgam assume an exposure range of 1 to 5 µg per day [31]. Recent estimates, based on pharmacokinetic parameters applied to steady-state plasma levels in individuals with amalgam, report an average intake between 5 and 9 µg per day [32]. In a study conducted by Kingman et al., which examined the relationship between urinary mercury excretion and the number of amalgam surfaces, it was estimated that 10 amalgam surfaces would result in a 1 µg Hg/L increase in urinary mercury levels [33]. Dental amalgam is a primary source of elemental mercury in the general population. Numerous studies have demonstrated a correlation between urinary mercury levels and the number of dental amalgam fillings in children [25,34,35]. In accordance with in vivo studies, it has been determined that mercury released from dental amalgam restorations ranges between 0.014 and 0.016 µg/mm2 [36]. According to the World Health Organization, the recommended maximum daily intake of mercury is 40 µg per kilogram of body weight, while the provisional tolerable weekly intake limit is estimated at 300 µg of total mercury and 200 µg of methylmercury for an individual weighing 60 kg [37]. Extensive efforts have been made to quantify mercury release into body fluids, particularly saliva, with estimates suggesting a daily release of between 0.2 and 3.2 mg from dental amalgam [38,39]. In another study, unstimulated saliva collected from five subjects over 40 min revealed total mercury levels ranging from 1.8 to 13.8 ng Hg/min [40]. Furthermore, the mercury vapor exposure limit set by the Occupational Safety and Health Administration in the United States is 100 times higher than the exposure level encountered by an individual with nine dental amalgam restorations [41].
The loss of metal ions and atoms from dental amalgams is a significant issue that has been extensively discussed in numerous previous investigations [20,21,31]. Mercury vapor can be dissolved in saliva, swallowed, and absorbed through the mucous membrane and the gastrointestinal system. The number of amalgam restorations, along with the extent of surface involvement, has been shown to significantly correlate with mercury concentrations in saliva. In a previous study, subjects with amalgam restorations showed significantly higher mercury concentrations in saliva than subjects without amalgam filling [11]. However, the correlation between the amount of mercury in the saliva and the amalgam fillings is not known. The aim of this study is to compare the amount of mercury released by different numbers of amalgam restorations at different time intervals. The hypothesis of this study is that an increasing number of teeth restored with amalgam will result in a progressively higher amount of mercury release over time.

2. Materials and Methods

2.1. Study Design

The in vitro study evaluating the release of mercury from dental amalgam was conducted by the Department of Restorative Dentistry at the Faculty of Dentistry, Istanbul University, Istanbul, Turkey. All cavity restorations were conducted on a total of 224 plastic model teeth (Kavo Dental, Biberach, Germany) to authentically replicate clinical settings, encompassing 56 premolars and 168 molars. To prevent any potential overflow of amalgam, the innovative Universal Matrix system Supermat Kerr (Kerr UK, Peterborough, UK) was meticulously applied to Class II cavities in conjunction with dental wedges. Subsequently, the amalgam restorations underwent immersion in a specially formulated artificial saliva solution for different specified durations. This solution is distinguished by its striking similarity to human saliva, particularly with respect to its anionic profile. Specifically, the artificial saliva consists of an aqueous medium with the following defined composition: lactic acid; pH = 6.7; 5.3 × 10⁻³ mol · dm−3 KSCN; 1.5 × 10⁻² mol · dm−3 NaHCO3; 2 × 10⁻² mol · dm−3 KCl; 1.4 × 10⁻³ mol · dm−3 NaH2PO4; 1 × 10⁻² mol · dm−3 [42].

2.2. Sample Size Calculation

The statistical power of this study was determined to be 80% through a priori power analysis conducted using software (PS: Power and Sample Size Calculation. Version 3.0. Nashville, TN: Vanderbilt University; USA, Dupont WD, Plummer WD Jr.), ensuring an adequate sample size for detecting meaningful differences. The mean variance between the groups was determined to be 0.055 mg/L, with a standard deviation of 0.018. Based on these parameters, the sample size was calculated to be at least 7 each per group. The groups were formed as follows: Group 1—1 tooth 36# with class I occlusal cavity (1 surface); Group 2—1 tooth 36# with Class II MOD cavity (3 surfaces); Group 3—2 teeth 36#, 46# with Class II MOD cavity (6 surfaces); Group 4—4 teeth 16#, 26#, 36#, 46# with Class II MOD cavity (12 surfaces); Group 5—8 teeth 16#, 17#, 26#, 27#, 36#, 37#, 46#, 47# with Class II MOD cavity (24 surfaces); and Group 6: 16 teeth 14#, 15#, 16#, 17#, 24#, 25#, 26#, 27#, 34#, 35#, 36#, 37#, 44#, 45#, 46#, 47# with Class II MOD cavity (48 surfaces).

2.3. Application of Amalgam Restorations Following Cavity Preparation

Each tooth was prepared using a micro motor with a Tungsten Carbide 245 bur under water cooling. All occlusal cavities were standardized with dimensions of 2.5 (bucco–lingual) × 2.5 (occluso–pulpal) × 3.0 mm (mesio–distal). The proximal walls of the cavities were standardized to 3.0 (bucco–lingual) × 4.0 (occluso–gingival) × 2.0 mm (mesio–distal). The pulpal and the axial walls of the cavity were flattened using an inverted cone bur. To ensure consistency in cavity design and dimensions throughout this study, the prepared teeth were verified using a digital caliper. The Universal Matrix system Supermat Kerr (Kerr UK, Peterborough, UK) was applied to each tooth for easy and standardized application of the amalgam. Tytin (Kerr UK, Peterborough, UK) was selected for the preparation of the dental amalgam. This product is a unicompositional, spherical alloy material that is a high copper typical restorative material. According to the manufacturer, the pre-mixed alloy powder consists of 59% silver, 28% tin, and 13% copper by weight. Upon trituration with mercury, the final amalgam contains approximately 42.5% mercury by weight. An amalgam mixer (Optimix, Kerr, Middleton, WI, USA) ensured proper mixing through a 5 s vibration. After mixing, the amalgam was placed using an amalgam carrier and condensed with a condenser. A ball burnisher was used to remove the superficial mercury-rich layer. The material was then carved to replicate the natural anatomy of the teeth using a carver. The prepared specimens were stored in plastic bottles containing 50 mL of artificial saliva at a temperature of 37 °C. Data were collected at predetermined time points: 2 h and 1, 2, 7, and 30 days. At the specified time intervals, samples were carefully drawn from the plastic containers to measure the concentration of the released mercury in the artificial saliva. Since the concentration is independent of the total volume, only a portion (1 mL) of the solution was required for accurate analysis. The saliva samples were not renewed between the time intervals. The mercury levels in the artificial saliva were measured using an atomic absorption spectrophotometer (GB 932 + atomic absorption spectrophotometer; Varian Techtron, SpectrAA 400; Varian Assoc., California, USA). The operating principle of the instrument is based on the measurement of the mercury signal. A blank, five calibration standards, three water samples, and two certified reference materials (Environmental Protection Agency [EPA] Trace Metals—AA Quality Control Sample, Lot TMA 989, and Environmental Resources Agency [ERA] Priority Pollution™/CLP Quality Control Standard) were subjected to digestion following the EPA mercury digestion protocol. The digestion protocol consisted of the following steps: (1) Add 5 mL of conc. H2SO4 and 2.5 mL of conc. HNO3. (2) Add 15 mL of 5% potassium permanganate. (3) Shake and add additional potassium permanganate until purple color persists. (4) Add 8 mL of potassium persulfate. (5) Heat for 2 h at 95 °C. (6) Cool and add 6 mL of sodium chloride/ hydroxylamine sulfate (or hydrochloride). Then, the sample was ready for analysis. The digestion process was carried out in sealed 250 mL Nalgene PMP containers using a Precision™ Model 25 shaking water bath. Subsequent analysis of the blank, standards, and samples was performed using the Mercury Concentration Accessory (MCA-90) instrument. The reductant channel of the Vapor Generation Accessory (VGA-76) contained 10% SnCl2 (wt/vol) in 20% HCl. The “acid” channel contained 1% hydroxylamine HCl. The spectrophotometer parameters were configured as follows: instrument mode set to absorbance, measurement mode to peak height, wavelength at 253.7 nm, and measurement time set to 30 s [43].

2.4. Statistical Analysis
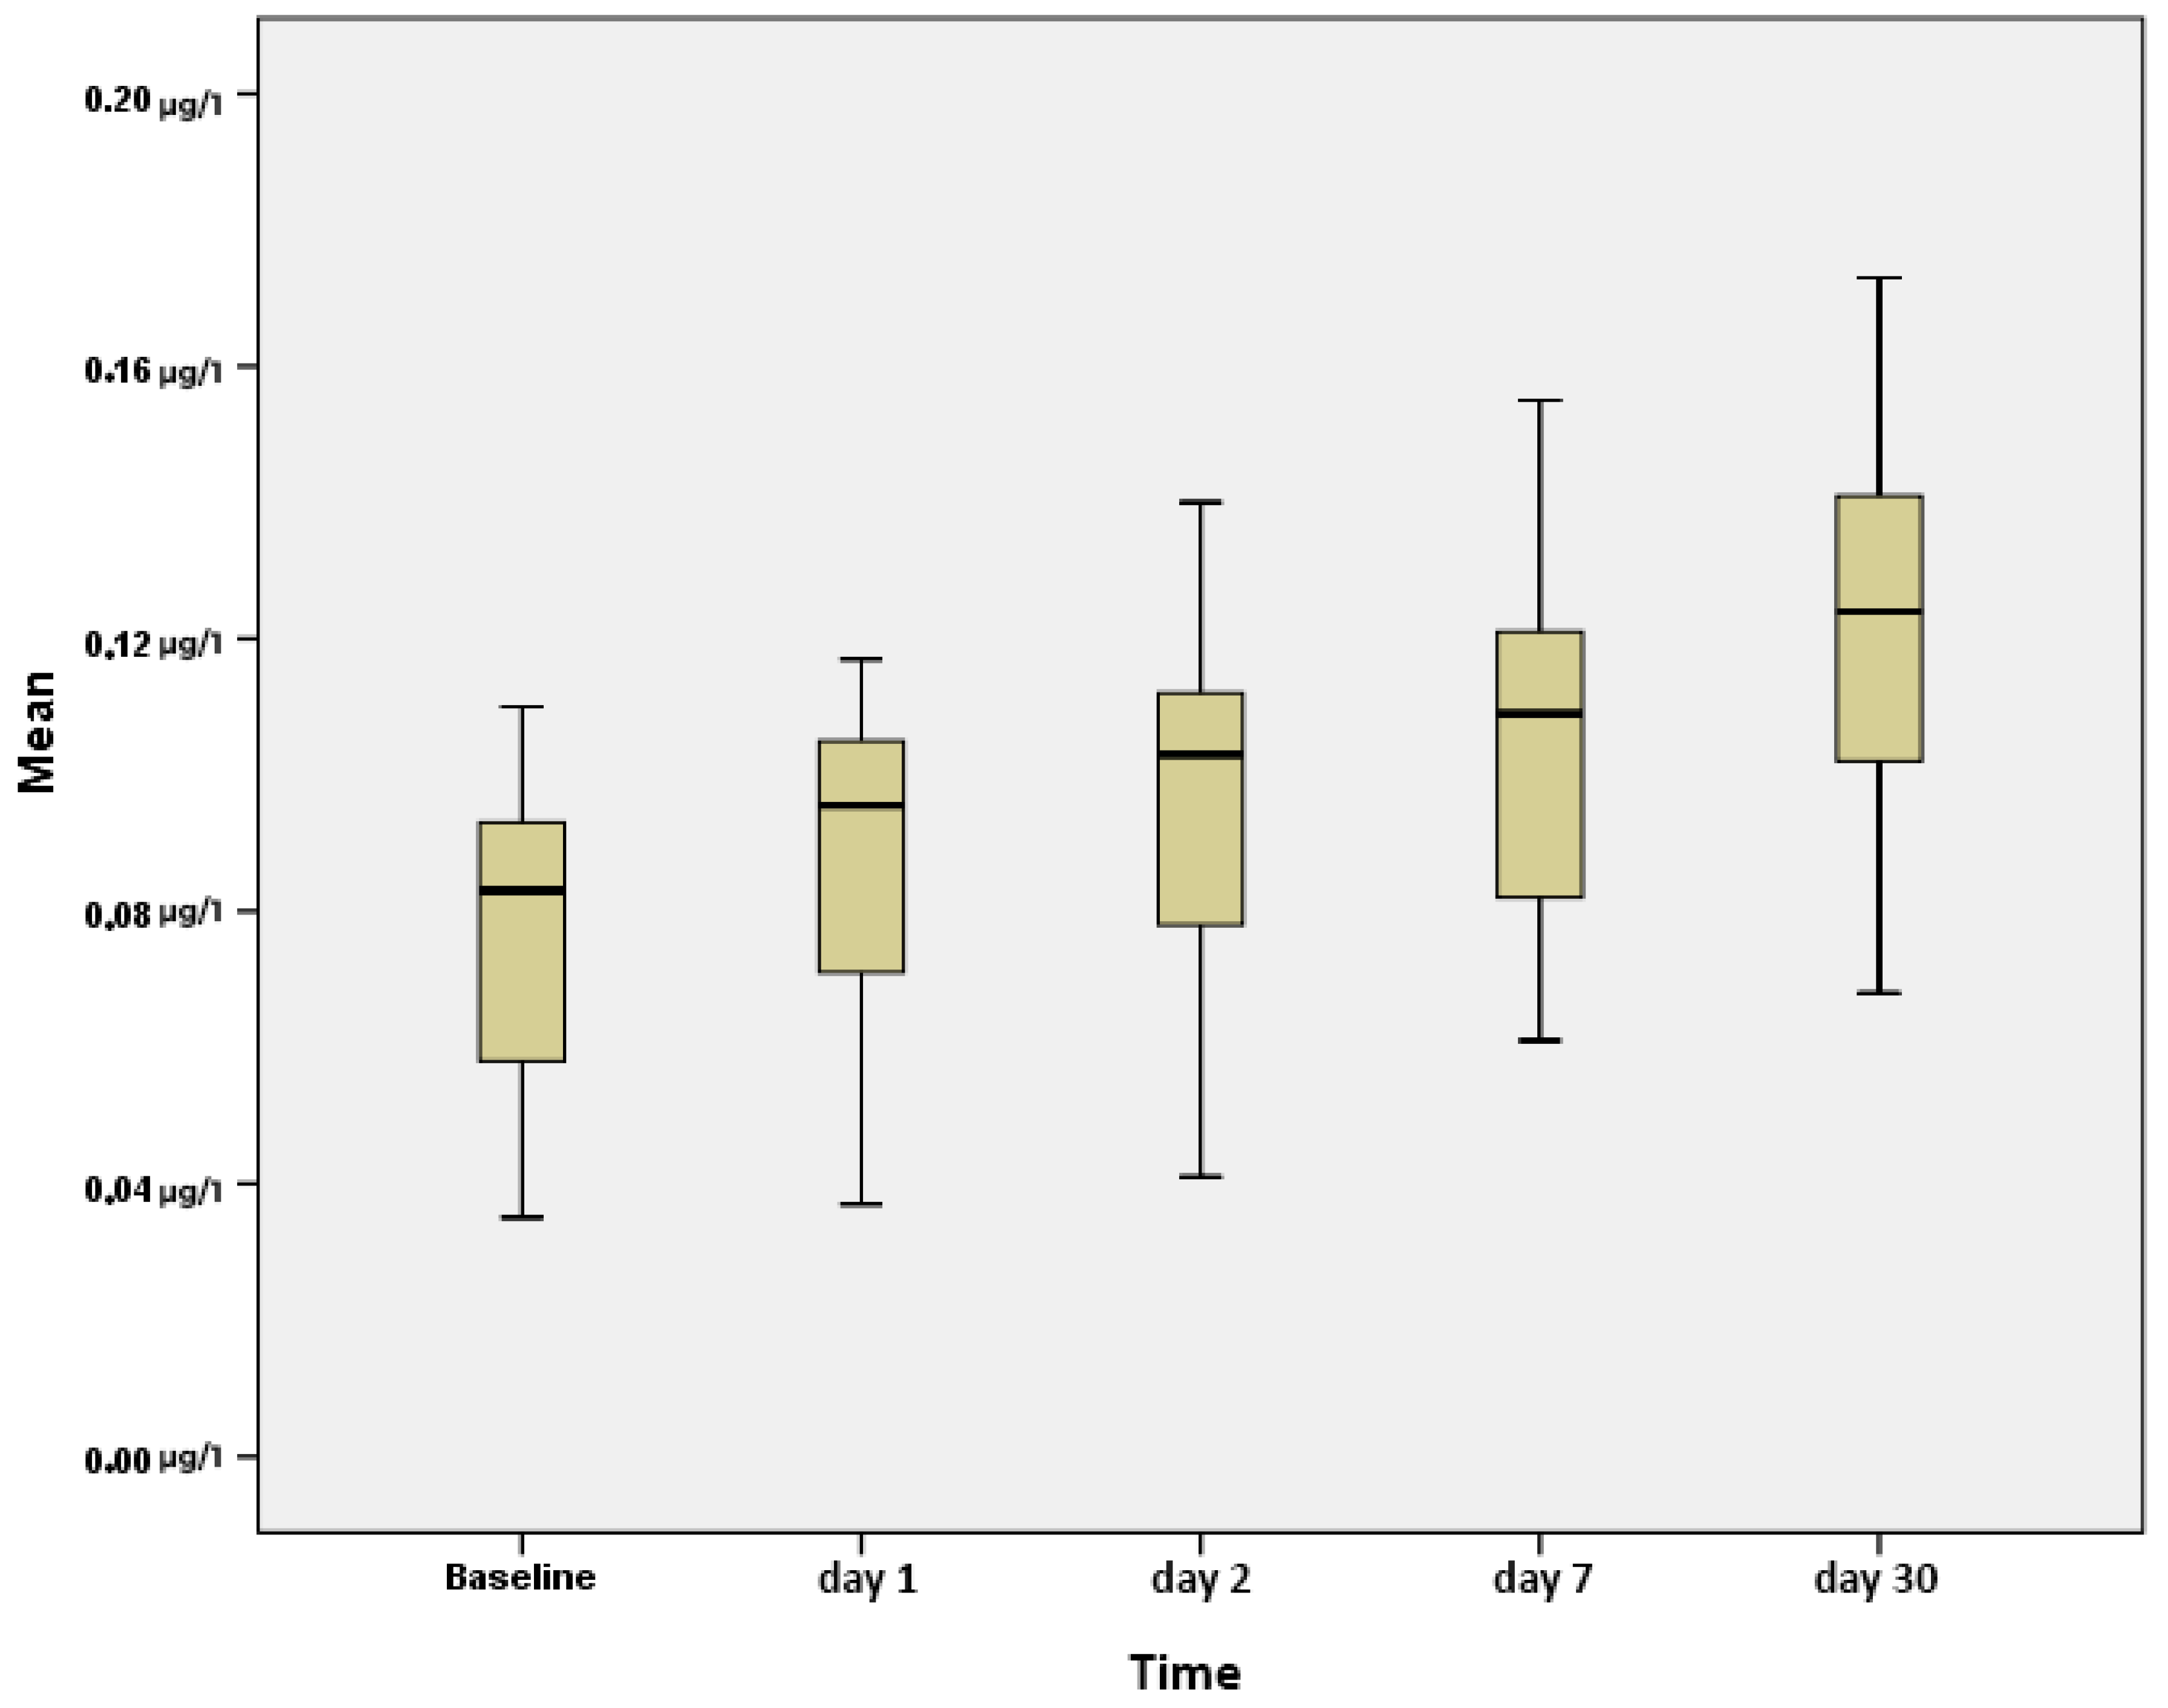
Statistical analyses were conducted using the NCSS (Number Cruncher Statistical System) 2007 software (Kaysville, UT, USA). Descriptive statistical methods, including the mean and standard deviation, were applied to evaluate the study data, while the normality of the quantitative variables was assessed using the Shapiro–Wilk test and graphical analyses. To examine the effects of time and group on the measured variables, a two-way repeated measures analysis of variance was performed. Comparisons between groups were conducted using one-way analysis of variance followed by Bonferroni-adjusted post hoc pairwise comparisons. Similarly, within-group comparisons were carried out through repeated measures ANOVA accompanied by Bonferroni-corrected post hoc tests. Confidence intervals were set at 80%, and the alpha level was established at 0.05, with p-values less than 0.05 considered statistically significant.

3. Results

The mercury level values for all subgroups are presented in Table 1. To examine the effects of time and group on mercury level values, a two-way repeated measures analysis of variance (ANOVA) was applied (Table 2). When all groups were considered together and each time point was examined individually, it was observed that mercury release increased from baseline to day 30. However, this increase was not linear, and the rate of increase gradually declined over time (p < 0.001) (Figure 1). Additionally, the time * group interaction was also found to be statistically significant (p < 0.001) (Figure 2). The lowest mercury release value in this study was observed in G1 at baseline (0.043 ± 0.009), while the highest value was recorded in G6 at day 30 (0.157 ± 0.009). A strong statistical difference in mercury release among the groups was detected when comparing the baseline to day 30 (p < 0.001). A similar pattern was also observed between the baseline and day 1. Other intervals showing statistically significant differences included baseline to day 2, day 1 to day 30, day 2 to day 7, and day 7 to day 30. The significance of this interaction suggests that the observed changes in mercury levels over time differ across groups. When examining between-group effects, it was determined that, independent of time, there were statistically significant differences in mercury level values among the groups (p < 0.001). In each group, the mercury release levels increased from baseline to day 30. The groups were compared pairwise within themselves at five different time points (Table 3). The lowest mercury release at baseline and at the end of day 30 was observed in G1, while the highest values were observed in G6. In pairwise comparisons, statistically significant differences over time were found between all groups except between G4 and G5. Additionally, the effect of changes over time on the pairwise comparisons between groups was also determined (Table 4). When G1 and G2 were compared to all other groups, they exhibited statistically significant differences at every interval, consistently demonstrating lower mercury release levels. Between G3 and G4, a statistically significant difference in mercury release was observed only at the end of day 30, with no significant differences at the remaining time points. In contrast, G4 and G5 showed no statistically significant differences at any interval. Although mercury release levels increased progressively from day 1 to day 30 across all groups, an analysis of the release rate revealed that the rate of mercury release on day 30 was lower than that observed on the first day. This indicates a non-linear, progressively decelerating pattern of mercury release over time. When examining mercury release in pairwise groups across two time intervals, a statistically significant difference was observed between G1 and G2 at baseline and day 1 (p = 0.032), while strong statistical differences were found at the end of days 2 and 7 (p < 0.001). When considering the baseline and day 30, statistically significant differences were detected between G2 and G6 (p = 0.017), and strong statistical significance was observed between G1 and G6, as well as between G3 and G6 (p < 0.001).

4. Discussion

Based on the results, this study’s hypothesis has been confirmed. It was observed that mercury release increases both over time and with a greater number of amalgam-restored teeth. The findings reveal a positive correlation between the concentration of mercury in artificial saliva and the duration of amalgam aging, persisting for up to 30 days. Our results substantiate a consistent upward trend in mercury levels within the artificial saliva over the 30-day period following amalgam placement. Prolonged exposure of amalgam surfaces to the artificial saliva medium leads to a marked elevation in the mercury concentration, highlighting the temporal dynamics of mercury release in such conditions.
In this study, cavity preparations were designed to replicate clinical conditions, and an in vitro setup was deliberately chosen to yield clinically relevant outcomes. Mercury release was comparatively evaluated at various time intervals from teeth with differing surface areas and quantities. Plastic model teeth were employed instead of natural human teeth to ensure standardization, as it is not feasible to determine the extent of mercury exposure a natural tooth may have undergone prior to extraction. The use of plastic teeth also served to eliminate potential variability between the experimental groups.
Mercury occurs in multiple forms: organic mercury, in which mercury is chemically bound to a carbon-containing structure (e.g., methylmercury, ethylmercury, phenylmercury, and others), and inorganic mercury, which encompasses metallic mercury and mercury vapor (Hg0), along with mercurous (Hg+) and mercuric (Hg2+) salts. The toxicity and absorption of mercury are dependent on its chemical form. Due to the instability of the mixing compound, mercury vapor (Hg0) is emitted from dental amalgam over time into the air of the oral cavity and is readily absorbed through the lungs [26]. All forms of mercury are neurotoxic depending on the dose, but even at low levels, Hg0 is known to be both neurotoxic and nephrotoxic [21,30]. Researchers agree that mercury is released from amalgam restorations into the oral cavity [4,22,30,44,45]. The chemical system formed by saliva and amalgam is particularly complex. The daily mercury absorption from amalgam fillings ranges from 9 to 17 µg, with an estimated uptake of 12 µg per day [26]. The lowest dose of mercury that can trigger a toxic reaction is reported to be between 3 and 7 μg per kilogram of body weight [46]. Mercury is omnipresent in the environment, present in various foods, air, paint, and certain pharmaceuticals. The contribution of dental amalgam to an individual’s total daily mercury exposure is regarded as relatively minor. Initial estimations of the average daily intake in individuals without occupational exposure ranged between 1.24 and 27 μg per day [47,48,49,50,51,52]. However, more recent research suggests that the daily mercury dose derived from amalgam is lower than previously reported [29,52,53,54]. Conversely, one study reported that individuals with more than 12 occlusal amalgam surfaces exhibit mercury concentrations in the pituitary gland and cerebral cortex that are tenfold higher than those observed in individuals with three or fewer occlusal amalgams [55]. The average discrepancy in hectogram urine (HgU) levels between the amalgam-free cohort and those with a substantial number of amalgam restorations was 24 nmol/L (4.8 µg/L). If this variation is exclusively ascribed to dental amalgam, and assuming that the HgU levels reflect 24 h mercury excretion with approximately 50% of the mercury being eliminated via the urine, the mean HgU suggests a daily exposure of roughly 10 µg. These findings imply that individuals with a considerable number of amalgam restorations—particularly those with more than 36 restored surfaces—are subjected to an additional mercury burden of 10–12 µg per day [56]. It is not recommended against using amalgam fillings during breastfeeding. The mercury concentration in human breast milk, obtained immediately after delivery, has shown a significant correlation with both the number of amalgam restorations and the frequency of dietary intake [57].
To estimate the absorbed dose of mercury, three primary approaches are generally used: (1) measuring the concentration of mercury vapor (Hg0) released into the intra-oral air; (2) assessing the increase in mercury levels in blood; and (3) evaluating mercury concentrations in the urine. However, these methods have limitations: measurements of Hg0 concentrations do not account for ionic mercury dissolved in saliva, while mercury levels in body fluids can be affected by dietary mercury intake [49,58]. The chemical interaction between saliva and amalgam is highly complex. Therefore, it is common practice among researchers in this field to utilize synthetic saliva models rather than natural human saliva [59,60,61]. Aqueous media, including saline, distilled water, and saliva, have been employed to assess mercury release from amalgam specimens into liquids. Previous studies have reported varying release rates into saliva, ranging from 0.14 to 16.0 ng/(min × cm2) [62]. In environments of natural or artificial saliva, where strong electrolytes such as KCl and NaCl serve as the primary and most concentrated components, various researchers have identified a mercury release ranging from 4 to 40 ng/(min × cm2) [63,64,65]. Additionally, a buffer system, such as HCO3/CO3 or H2PO4/HPO42, is included. Occasionally, a complexing anion, such as SCN—which is present in relatively high concentrations in human saliva—is also incorporated. The mercury concentration in saliva is influenced by the emission rate of water-soluble inorganic mercury and the flow rate, which varies among individuals and increases with chewing gum stimulation. Therefore, the emission rate may be useful for evaluating amalgam effects. Measuring the mercury concentration in natural saliva is challenging due to external factors such as food and drink, which complicate the precise determination of true concentration levels. Consequently, artificial saliva was used in the present study, as it is a usual practice among investigators in this field to utilize synthetic saliva models rather than human saliva [63,64,65].
A spherical amalgam alloy commonly used in public dental clinics was selected for this study. Although both amalgam types contained a small amount of zinc, attributing any distinct effect on mercury dissolution solely to the presence of zinc is not considered feasible [66]. The quantity of mercury released from amalgam restorations substantially surpasses the total mercury exposure from other sources, such as water, air, and food [21,67]. The emission of metal ions from restorations has been shown to be time-dependent and proportional to the surface area of the restoration [50]. The exposure to these metal ions, particularly mercury, presents a potential risk and could lead to harmful effects. In the experimental design of this study, the utilization of silver amalgam alloy capsules with a high copper concentration enabled the standardization of mercury levels across all test specimens. The elevated copper content of the alloy contributed to the enhancement of the mechanical and physical characteristics, such as a reduction in the formation of the gamma-2 phase, diminished corrosion, and increased strength [68].
To establish baseline values, the specimens were immersed in artificial saliva immediately following the completion of the restoration procedures. The initial measurements were subsequently obtained after a 2 h incubation period. Although the complete setting of amalgam restorations typically occurs within 24 h post-operatively, patients are generally advised to abstain from eating for at least 2 h to avoid potential disturbances in the integrity or flow characteristics of the restoration. This protocol was adopted to simulate clinical conditions as closely as possible. The unstimulated salivary flow rate in the human oral cavity is reported to exceed 0.25 mL/min, which equates to approximately 15–20 mL per hour [69]. Accordingly, in this experimental setup, the specimens were incubated in 50 mL of artificial saliva—an amount that approximates the average salivary volume present over a 2 to 3 h period. In the initial measurement phase, the mercury concentration released from a single-surface amalgam restoration on one tooth was determined to be 0.043 ± 0.009 µg/mL. In contrast, a three-surface restoration on a single tooth released a significantly higher concentration of 0.060 ± 0.004 µg/mL. Statistical analysis confirmed a significant difference between Group 1 and Group 2, with Group 2 exhibiting higher mercury levels. In Group 3, which comprised two teeth restored with a total of six amalgam surfaces, the measured mercury release was 0.083 ± 0.005 µg/mL—higher than that observed in Group 2. Overall, the data demonstrated a clear, positive correlation between the quantity of mercury released and the increase in both the number of restored teeth and the total surface area of amalgam present. In each group, statistically significant differences in mercury release were observed between baseline and Day 2, baseline and Day 7, and baseline and Day 30. However, the progression of mercury release did not follow a linear trajectory. It was noted that the rate of release did not remain consistent over time when compared to the initial baseline levels. This trend may be attributed to the formation of a corrosion-like layer on the surface of the amalgam over time, likely resulting from a passivation effect. Such a layer may serve as a barrier, thereby limiting further mercury emission as the material ages [70,71,72]. It is presumed that the mercury dissolution rate decreases over time due to the progressive growth and thickening of the tin oxide film in aqueous environments. In all types of dental amalgam, the primary source of mercury release is the gamma-one phase, which forms the matrix of the structure and is rich in mercury. In low-copper amalgams, the gamma-two phase can form a thicker tin oxide layer, thereby effectively limiting mercury release. At this point, the use of a single type of amalgam material in our study presents a limitation, as it precludes a comparative evaluation of this phenomenon across different amalgam compositions [64,73].
It is now established that dental amalgam continuously releases elemental mercury (Hg0), leading to exposure in individuals with fillings made from this material. Although the amount of Hg0 released from amalgams is often described as minute, their safety is not determined solely by the quantity of the dose. Instead, it is the comparison of this dose to established ‘safe’ levels or thresholds for anticipated harm that determines their significance concerning health risks. Regardless of the magnitude, even a minute dose can pose a risk if the substance is sufficiently toxic and the exposure exceeds a reference level deemed “safe” [31]. The primary limitation of this study was the inability to use extracted human teeth. Due to the high number of required teeth, challenges in standardizing the cavity preparations, and certain ethical constraints, the use of artificial teeth was deemed necessary. Consequently, employing a single type of amalgam material introduced a further limitation, as it precluded the comparative assessment of mercury release among different amalgam types (e.g., low-copper versus high-copper alloys).

5. Conclusions

Mercury release presents significant implications for public health. Considering the widespread use of dental amalgam restorations globally, understanding the temporal dynamics of mercury emission is crucial for assessing potential systemic exposure risks in patients. The absence of an effective passivation layer under the tested conditions indicates that mercury release may persist over extended periods, underscoring the necessity for continuous monitoring and mitigation of exposure. Furthermore, it is imperative to inform dental professionals about the kinetics of mercury release to optimize restorative techniques and follow-up protocols, as well as to implement strategies aimed at minimizing mercury exposure post-restoration. This in vitro study assessed mercury release in three distinct groups at various time intervals. Based on this study’s limitations, the following conclusions were drawn: (1) There is variation in the amount of mercury released—as the number of teeth restored with amalgam increases, the amount of mercury released into the oral cavity correspondingly rises. (2) Mercury release from amalgam restorations was observed at the highest level on the first day they were made. The construction phase of the restoration creates toxicity for both patients and physicians. When assessing the exposure and dosage of both organic and inorganic mercury, it is crucial to acknowledge that the release of mercury from amalgam restorations is influenced by time. Exposure to elemental mercury occurs exclusively from tooth surfaces restored with amalgam. Therefore, considering alternative restorative materials such as composite resins, ceramics, glass ionomers, or gold alloys over amalgam is a more prudent and health-conscious choice.

Author Contributions

Conceptualization, O.Y. and M.K.U.; methodology, O.Y.; software, M.K.U.; validation, O.Y., M.K.U. and S.A.; formal analysis, S.A.; investigation, O.Y.; resources, M.K.U.; data curation, S.A.; writing—original draft preparation, O.Y.; writing—review and editing, O.Y.; visualization, M.K.U.; supervision, O.Y.; project administration, O.Y.; funding acquisition, O.Y. All authors have read and agreed to the published version of the manuscript.

Funding

This research received no external funding.

Institutional Review Board Statement

Not applicable.

Informed Consent Statement

Not applicable.

Data Availability Statement

The data presented in this study are available on request from the corresponding author (the data are not publicly available due to privacy restrictions).

Conflicts of Interest

The authors declare no conflicts of interest.

References

  1. Geurtsen, W.; Schoeler, U. A 4-Year Retrospective Clinical Study of Class I and Class II Composite Restorations. J. Dent. 1997, 25, 229–232. [Google Scholar] [CrossRef] [PubMed]
  2. Bailer, J.; Rist, F.; Rudolf, A.; Staehle, H.J.; Eickholz, P.; Triebig, G.; Bader, M.; Pfeifer, U. Adverse Health Effects Related to Mercury Exposure from Dental Amalgam Fillings: Toxicological or Psychological Causes? Psychol. Med. 2001, 31, 255–263. [Google Scholar] [CrossRef] [PubMed]
  3. Gay, D.; Cox, R.; Reinhardt, J. Chewing Releases Mercury from Fillings. Lancet 1979, 313, 985–986. [Google Scholar] [CrossRef]
  4. Rathore, M.; Singh, A.; Pant, V.A. The Dental Amalgam Toxicity Fear: A Myth or Actuality. Toxicol. Int. 2012, 19, 81. [Google Scholar]
  5. Newman, S.M. Amalgam Alternatives: What Can Compete? J. Am. Dent. Assoc. 1991, 122, 67–71. [Google Scholar] [CrossRef]
  6. SB, C. The Benefits and Risks of Dental Amalgam. J. Am. Dent. Assoc. 1994, 125, 381–388. [Google Scholar]
  7. Bates, M.N. Mercury Amalgam Dental Fillings: An Epidemiologic Assessment. Int. J. Hyg. Environ. Health 2006, 209, 309–316. [Google Scholar] [CrossRef]
  8. Eley, B.M. The Future of Dental Amalgam: A Review of the Literature. Part 6: Possible Harmful Effects of Mercury from Dental Amalgam. Br. Dent. J. 1997, 182, 455–459. [Google Scholar] [CrossRef]
  9. Makhija, S.K.; Gordan, V.V.; Gilbert, G.H.; Litaker, M.S.; Rindal, D.B.; Pihlstrom, D.J.; Qvist, V.; Dental Practice-Based Research Network Collaborative Group. Practitioner, Patient and Carious Lesion Characteristics Associated with Type of Restorative Material: Findings from The Dental Practice-Based Research Network. J. Am. Dent. Assoc. 2011, 142, 622–632. [Google Scholar] [CrossRef]
  10. Berdouses, E.; Vaidyanathan, T.K.; Dastane, A.; Weisel, C.; Houpt, M.; Shey, Z. Mercury Release from Dental Amalgams: An in Vitro Study under Controlled Chewing and Brushing in an Artificial Mouth. J. Dent. Res. 1995, 74, 1185–1193. [Google Scholar] [CrossRef]
  11. Björkman, L.; Sandborgh-Englund, G.; Ekstrand, J. Mercury in Saliva and Feces after Removal of Amalgam Fillings. Toxicol. Appl. Pharmacol. 1997, 144, 156–162. [Google Scholar] [CrossRef] [PubMed]
  12. Richards, J.M.; Warren, P.J. Mercury Vapour Released during the Removal of Old Amalgam Restorations. Br. Dent. J. 1985, 159, 231–232. [Google Scholar] [CrossRef] [PubMed]
  13. Haikel, Y.; Gasser, P.; Salek, P.; Voegel, J.C. Exposure to Mercury Vapor during Setting, Removing, and Polishing Amalgam Restorations. J. Biomed. Mater. Res. 1990, 24, 1551–1558. [Google Scholar] [CrossRef]
  14. Vimy, M.J.; Takahashi, Y.; Lorscheider, F.L. Maternal-Fetal Distribution of Mercury (203Hg) Released from Dental Amalgam Fillings. Am. J. Physiol.-Regul. Integr. Comp. Physiol. 1990, 258, R939–R945. [Google Scholar] [CrossRef] [PubMed]
  15. Roberts, H.W.; Charlton, D.G. The Release of Mercury from Amalgam Restorations and Its Health Effects: A Review. Oper. Dent. 2009, 34, 605–614. [Google Scholar] [CrossRef]
  16. Clarkson, T.W.; Magos, L.; Cox, C.; Greenwood, M.R.; Amin-Zaki, L.; Majeed, M.A.; Al-Damluji, S.F. Tests of Efficacy of Antidotes for Removal of Methylmercury in Human Poisoning during the Iraq Outbreak. J. Pharmacol. Exp. Ther. 1981, 218, 74–83. [Google Scholar] [CrossRef]
  17. Murata, K.; Karita, K. Minamata Disease. In Overcoming Environmental Risks to Achieve Sustainable Development Goals: Lessons from the Japanese Experience; Springer: Singapore, 2022; pp. 9–19. [Google Scholar]
  18. Berry, T.G.; Summitt, J.B.; Chung, A.K.H.; Osborne, J.W. Amalgam at the New Millennium. J. Am. Dent. Assoc. 1998, 129, 1547–1556. [Google Scholar] [CrossRef]
  19. Lauterbach, M.; Martins, I.P.; Castro-Caldas, A.; Bernardo, M.; Luis, H.; Amaral, H.; Leitão, J.; Martin, M.D.; Townes, B.; Rosenbaum, G. Neurological Outcomes in Children with and without Amalgam-Related Mercury Exposure: Seven Years of Longitudinal Observations in a Randomized Trial. J. Am. Dent. Assoc. 2008, 139, 138–145. [Google Scholar] [CrossRef]
  20. ADA Council on Scientific Affairs. Dental Amalgam: Update on Safety Concerns. J. Am. Dent. Assoc. 1998, 129, 494–503. [Google Scholar] [CrossRef]
  21. Mercury, W.H.O.I. Environmental Health Criteria 118; World Health Organization: Geneva, Switzerland, 1991; Volume 107, Available online: https://apps.who.int/iris/bitstream/handle/10665/40626/IPCS_EHC_118.pdf (accessed on 5 June 2025).
  22. Fredin, B. Mercury Release from Dental Amalgam Fillings. Int. J. Risk Saf. Med. 1994, 4, 197–208. [Google Scholar] [CrossRef]
  23. Shenoy, A. Is It the End of the Road for Dental Amalgam? A Critical Review. J. Conserv. Dent. 2008, 11, 99–107. [Google Scholar] [CrossRef] [PubMed]
  24. Osborne, J.W.; Swift Jr, E.J. Safety of Dental Amalgam. J. Esthet. Restor. Dent. 2004, 16, 377–388. [Google Scholar] [CrossRef] [PubMed]
  25. Woods, J.S.; Martin, M.D.; Leroux, B.G.; DeRouen, T.A.; Leitão, J.G.; Bernardo, M.F.; Luis, H.S.; Simmonds, P.L.; Kushleika, J.V.; Huang, Y. The Contribution of Dental Amalgam to Urinary Mercury Excretion in Children. Environ. Health Perspect. 2007, 115, 1527–1531. [Google Scholar] [CrossRef]
  26. TW, C. The Three Modern Faces of Mercury. Environ. Health Perspect. 2002, 110, 11–23. [Google Scholar]
  27. Eneström, S.; Hultman, P. Does Amalgam Affect the Immune System? A Controversial Issue (Part 2 of 2). Int. Arch. Allergy Immunol. 1995, 106, 192–203. [Google Scholar] [CrossRef]
  28. Fathi, M.; Mortazavi, V. A Review on Dental Amalgam Corrosion and Its Consequences. J. Res. Med. Sci. 2004, 1, 42–51. [Google Scholar]
  29. Skare, I.; Engqvist, A. Human Exposure to Mercury and Silver Released from Dental Amalgam Restorations. Arch. Environ. Health Int. J. 1994, 49, 384–394. [Google Scholar] [CrossRef] [PubMed]
  30. Clarkson, T.W.; Magos, L.; Myers, G.J. The Toxicology of Mercury—Current Exposures and Clinical Manifestations. N. Engl. J. Med. 2003, 349, 1731–1737. [Google Scholar] [CrossRef]
  31. US Food and Drug Administration. White Paper: FDA Update/Review of Potential Adverse Health Risks Associated with Exposure to Mercury in Dental Amalgam; National Center for Toxicological Research: Jefferson, AR, USA, 2010. [Google Scholar]
  32. Sandborgh-Englund, G.; Elinder, C.-G.; Johanson, G.; Lind, B.; Skare, I.; Ekstrand, J. The Absorption, Blood Levels, and Excretion of Mercury after a Single Dose of Mercury Vapor in Humans. Toxicol. Appl. Pharmacol. 1998, 150, 146–153. [Google Scholar] [CrossRef]
  33. Kingman, A.; Albertini, T.; Brown, L.J. Mercury Concentrations in Urine and Whole Blood Associated with Amalgam Exposure in a US Military Population. J. Dent. Res. 1998, 77, 461–471. [Google Scholar] [CrossRef]
  34. Maserejian, N.N.; Trachtenberg, F.L.; Assmann, S.F.; Barregard, L. Dental Amalgam Exposure and Urinary Mercury Levels in Children: The New England Children’s Amalgam Trial. Environ. Health Perspect. 2008, 116, 256–262. [Google Scholar] [CrossRef] [PubMed]
  35. Dunn, J.E.; Trachtenberg, F.L.; Barregard, L.; Bellinger, D.; McKinlay, S. Scalp Hair and Urine Mercury Content of Children in the Northeast United States: The New England Children’s Amalgam Trial. Environ. Res. 2008, 107, 79–88. [Google Scholar] [CrossRef] [PubMed]
  36. Mackert, J.R.; Berglund, A. Mercury Exposure From Dental Amalgam Fillings: Absorbed Dose and the Potential for Adverse Health Effects. Crit. Rev. Oral Biol. Med. 1997, 8, 410–436. [Google Scholar] [CrossRef]
  37. Salomone, P.; Bueno, R.P.R.; Trinidade, R.F.; Nascimento, P.C.; Pozzobon, R.T. Assessment of the Release of Mercury from Silver Amalgam Alloys Exposed to Different 10% Carbamide Peroxide Bleaching Agents. Gen. Dent. 2013, 61, 33–35. [Google Scholar] [PubMed]
  38. Ekstrand, J.; Björkman, L.; Edlund, C.; Sandborgh-Englund, G. Toxicological Aspects on the Release and Systemic Uptake of Mercury from Dental Amalgam. Eur. J. Oral Sci. 1998, 106, 678–686. [Google Scholar] [CrossRef]
  39. Pizzichini, M.; Fonzi, M.; Sugherini, L.; Fonzi, L.; Comporti, M.; Gasparoni, A.; Pompella, A. Release of Mercury from Dental Amalgam and Its Influence on Salivary Antioxidant Activity. Bull. Group Int. Rech. Sci. Stomatol. Odontol. 2000, 42, 94–100. [Google Scholar] [CrossRef]
  40. Berglund, A. Estimation by a 24-Hour Study of the Daily Dose of Intra-Oral Mercury Vapor Inhaled after Release from Dental Amalgam. J. Dent. Res. 1990, 69, 1646–1651. [Google Scholar] [CrossRef]
  41. Sakaguchi, R.; Ferracane, J.; Powers, J. Testing of Dental Materials and Biomechanics. In Craig’s Restorative Dental Materials, 14th ed.; Elsevier: Amsterdam, The Netherlands, 2019. [Google Scholar]
  42. Campus, G.; Garcia-Godoy, F.; Gaspa, L.; Panzanelli, A.; Piu, P.C.; Micera, G.; Lugliè, P.; Sanna, G. Dependence of Kinetic Variables in the Short-Term Release of Hg2+, Cu2+ and Zn2+ Ions into Synthetic Saliva from an High-Copper Dental Amalgam. J. Mater. Sci. Mater. Med. 2007, 18, 1521–1527. [Google Scholar] [CrossRef]
  43. Beach, L.M. Evaluation of the Mercury Concentration Accessory for US EPA Methodology. Varian Instruments at Work. No. AA-108 1992, 1–5. Available online: https://www.perlan.com.pl/uploaded/AppBundleEntityProductApplication/fileKey/286/aa108.pdf (accessed on 5 June 2025).
  44. Bates, M.N.; Fawcett, J.; Garrett, N.; Cutress, T.; Kjellstrom, T. Health Effects of Dental Amalgam Exposure: A Retrospective Cohort Study. Int. J. Epidemiol. 2004, 33, 894–902. [Google Scholar] [CrossRef]
  45. Syversen, T.; Kaur, P. The Toxicology of Mercury and Its Compounds. J. Trace Elem. Med. Biol. 2012, 26, 215–226. [Google Scholar] [CrossRef]
  46. Craig, R.G. Restorative Dental Materials; Mosby: Maryland Heights, MO, USA, 2006; ISBN 0801638666. [Google Scholar]
  47. Vimy, M.J.; Lorscheider, F.L. Serial Measurements of Intra-Oral Air Mercury: Estimation of Daily Dose from Dental Amalgam. J. Dent. Res. 1985, 64, 1069–1075. [Google Scholar] [CrossRef] [PubMed]
  48. Patterson, J.E.; Weissberg, B.G.; Dennison, P.J. Mercury in Human Breath from Dental Amalgams. Bull. Environ. Contam. Toxicol. 1985, 34, 459–468. [Google Scholar] [CrossRef]
  49. Abraham, J.E.; Svare, C.W.; Frank, C.W. The Effect of Dental Amalgam Restorations on Blood Mercury Levels. J. Dent. Res. 1984, 63, 71–73. [Google Scholar] [CrossRef]
  50. Berglund, A.; Pohl, L.; Olsson, S.; Bergman, M. Determination of the Rate of Release of Intra-Oral Mercury Vapor from Amalgam. J. Dent. Res. 1988, 67, 1235–1242. [Google Scholar] [CrossRef] [PubMed]
  51. Langworth, S.; Kölbeck, K.G.; Akesson, A. Mercury Exposure from Dental Fillings. II. Release and Absorption. Swed. Dent. J. 1988, 12, 71–72. [Google Scholar]
  52. Mackert, J.R., Jr. Factors Affecting Estimation of Dental Amalgam Mercury Exposure from Measurements of Mercury Vapor Levels in Intra-Oral and Expired Air. J. Dent. Res. 1987, 66, 1775–1780. [Google Scholar] [CrossRef] [PubMed]
  53. Halbach, S. Amalgam Tooth Fillings and Man’s Mercury Burden. Hum. Exp. Toxicol. 1994, 13, 496–501. [Google Scholar] [CrossRef]
  54. Clarkson, T.W. Principles of Risk Assessment. Adv. Dent. Res. 1992, 6, 22–27. [Google Scholar] [CrossRef]
  55. Guzzi, G.; Grandi, M.; Cattaneo, C.; Calza, S.; Minoia, C.; Ronchi, A.; Gatti, A.; Severi, G. Dental Amalgam and Mercury Levels in Autopsy Tissues: Food for Thought. Am. J. Forensic Med. Pathol. 2006, 27, 42–45. [Google Scholar] [CrossRef]
  56. Jokstad, A.; Thomassen, Y.; Bye, E.; Clench-Aas, J.; Aaseth, J. Dental Amalgam and Mercury. Pharmacol. Toxicol. 1992, 70, 308–313. [Google Scholar] [CrossRef]
  57. Drexler, H.; Schaller, K.-H. The Mercury Concentration in Breast Milk Resulting from Amalgam Fillings and Dietary Habits. Environ. Res. 1998, 77, 124–129. [Google Scholar] [CrossRef] [PubMed]
  58. Ganss, C.; Gottwald, B.; Traenckner, I.; Kupfer, J.; Eis, D.; Mönch, J.; Gieler, U.; Klimek, J. Relation between Mercury Concentrations in Saliva, Blood, and Urine in Subjects with Amalgam Restorations. Clin. Oral Investig. 2000, 4, 206–211. [Google Scholar] [CrossRef] [PubMed]
  59. Marek, M. Dissolution of Mercury from Dental Amalgam at Different PH Values. J. Dent. Res. 1997, 76, 1308–1315. [Google Scholar] [CrossRef]
  60. Holland, R.I. Release of Mercury Vapor from Corroding Amalgam in Vitro. Dent. Mater. 1993, 9, 99–103. [Google Scholar] [CrossRef]
  61. Brune, D.; Gjerdet, N.; Paulsen, G. Gastrointestinal and in Vitro Release of Copper, Cadmium, Indium, Mercury and Zinc from Conventional and Copper-rich Amalgams. Eur. J. Oral Sci. 1983, 91, 66–71. [Google Scholar] [CrossRef]
  62. Okabe, T.; Ferracane, J.; Cooper, C.; Matsumoto, H.; Wagner, M. Dissolution of Mercury from Amalgam into Saline Solution. J. Dent. Res. 1987, 66, 33–37. [Google Scholar] [CrossRef] [PubMed]
  63. Fritz, U.; Zellmann, M. Mercury Release from Amalgam Specimens. Dtsch. Zahnarztl. Z. 1991, 46, 553–554. [Google Scholar]
  64. Marek, M. The Release of Mercury from Dental Amalgam: The Mechanism and in Vitro Testing. J. Dent. Res. 1990, 69, 1167–1174. [Google Scholar] [CrossRef]
  65. Brune, D.; Evje, D.M. Man’s Mercury Loading from a Dental Amalgam. Sci. Total Environ. 1985, 44, 51–63. [Google Scholar] [CrossRef]
  66. Davies, R.A.; Ardalan, S.; Mu, W.-H.; Tian, K.; Farsaikiya, F.; Darvell, B.W.; Chass, G.A. Geometric, Electronic and Elastic Properties of Dental Silver Amalgam γ-(Ag3Sn), Γ1-(Ag2Hg3), Γ2-(Sn8Hg) Phases, Comparison of Experiment and Theory. Intermetallics 2010, 18, 756–760. [Google Scholar] [CrossRef]
  67. Lorscheider, F.L.; Vimy, M.J.; Summers, A.O. Mercury Exposure from “Silver” Tooth Fillings: Emerging Evidence Questions a Traditional Dental Paradigm. FASEB J. 1995, 9, 504–508. [Google Scholar] [CrossRef] [PubMed]
  68. Kj, A. Phillips’ Science of Dental Materials; WB Saunders: St Louis, MO, USA, 2003; Volume 596. [Google Scholar]
  69. Brambilla, E.; García-Godoy, F.; Strohmenger, L. Principles of Diagnosis and Treatment of High-Caries-Risk Subjects. Dent. Clin. N. Am. 2000, 44, 507–540. [Google Scholar] [CrossRef] [PubMed]
  70. Marek, M. The Effect of Tin on the Corrosion Behavior of the Ag-Hg Phase of Dental Amalgam and Dissolution of Mercury. J. Dent. Res. 1990, 69, 1786–1790. [Google Scholar] [CrossRef]
  71. Mueller, H.J.; Greener, E.H.; Crimmins, D.S. The Electrochemical Properties of Dental Amalgam. J. Biomed. Mater. Res. 1968, 2, 95–119. [Google Scholar] [CrossRef]
  72. Fovet, Y.; Gal, J.-Y. Tin Passivation by Copper in Dental Amalgams. Comptes Rendus L’académie Des Sci.—Ser. IIC—Chem. 2000, 3, 379–385. [Google Scholar] [CrossRef]
  73. Okabe, T.; Elvebak, B.; Carrasco, L.; Ferracane, J.L.; Keanini, R.G.; Nakajima, H. Mercury Release from Dental Amalgams into Continuously Replenished Liquids. Dent. Mater. 2003, 19, 38–45. [Google Scholar] [CrossRef]
Figure 1. Box plot representation of mercury release over time, with all groups evaluated collectively.
Applsci 15 06646 g001
Figure 2. The line graph representation of mercury emission values for each group at each interval.
Applsci 15 06646 g002
Table 1. Evaluations by group and time.
Group 1Group 2Group 3Group 4Group 5Group 6a p
Mean ± sdMean ± sdMean ± sdMean ± sdMean ± sdMean ± sd
Baseline0.043 ± 0.0090.060 ± 0.0040.083 ± 0.0050.086 ± 0.0060.094 ± 0.0050.098 ± 0.006<0.001 **
1st day0.047 ± 0.0110.072 ± 0.0030.089 ± 0.0070.097 ± 0.0060.106 ± 0.0030.113 ± 0.004<0.001 **
2nd day0.053 ± 0.0130.080 ± 0.0060.095 ± 0.0070.105 ± 0.0050.113 ± 0.0040.125 ± 0.009<0.001 **
7th day0.069 ± 0.0060.084 ± 0.0050.103 ± 0.0060.115 ± 0.0070.120 ± 0.0040.131 ± 0.012<0.001 **
30th day0.079 ± 0.0060.103 ± 0.0080.117 ± 0.0040.129 ± 0.0030.139 ± 0.0060.157 ± 0.009<0.001 **
b p<0.001 **<0.001 **<0.001 **<0.001 **<0.001 **<0.001 **
Post hocMean ± sdMean ± sdMean ± sdMean ± sdMean ± sdMean ± sda p
Baseline–1st day0.004 ± 0.0030.012 ± 0.003 **0.007 ± 0.0050.011 ± 0.006 *0.012 ± 0.003 **0.016 ± 0.006 **<0.001 **
Baseline–2nd day0.011 ± 0.006 *0.020 ± 0.005 **0.012 ± 0.006 *0.019 ± 0.006 **0.019 ± 0.005 **0.027 ± 0.010 **0.001 **
Baseline–7th day0.026 ± 0.005 **0.024 ± 0.004 **0.021 ± 0.006 **0.029 ± 0.009 **0.026 ± 0.006 **0.033 ± 0.013 **0.094
Baseline–30th day0.037 ± 0.007 **0.043 ± 0.012 **0.035 ± 0.002 **0.043 ± 0.007 **0.045 ± 0.007 **0.059 ± 0.012 **<0.001 **
1st–2nd day0.007 ± 0.0060.008 ± 0.0060.006 ± 0.002 **0.007 ± 0.002 **0.007 ± 0.003 **0.011 ± 0.006 *0.345
1st–7th day0.022 ± 0.007 **0.012 ± 0.004 **0.014 ± 0.004 **0.018 ± 0.005 **0.015 ± 0.005 **0.018 ± 0.010 *0.051
1st–30th day0.032 ± 0.009 **0.031 ± 0.009 **0.028 ± 0.005 **0.032 ± 0.005 **0.033 ± 0.006 **0.044 ± 0.007 **0.004 **
2nd–7th day0.016 ± 0.009 *0.004 ± 0.0020.008 ± 0.002 **0.010 ± 0.004 **0.008 ± 0.003 *0.006 ± 0.0040.001 **
2nd–30th day0.026 ± 0.011 **0.023 ± 0.012 *0.022 ± 0.006 **0.024 ± 0.003 **0.026 ± 0.004 **0.032 ± 0.006 **0.182
7th–30th day0.010 ± 0.0060.019 ± 0.010 *0.014 ± 0.005 **0.014 ± 0.004 **0.018 ± 0.003 **0.026 ± 0.006 **0.001 **
a One-way ANOVA; b Repeated measures ANOVA. * p < 0.05, ** p < 0.01.
Table 2. Results of the two-way repeated measures ANOVA.
Tests for Within-Group Effects
Fp
Time546.254<0.001 **
Time × Group4.174<0.001 **
Tests for Between-Group Effects
Fp
Group140.326<0.001 **
** indicates p < 0.01.
Table 3. Pairwise comparisons between groups at five different time points.
Baseline1st Day2nd Day7th Day30th Day
G1—G2<0.001 **<0.001 **<0.001 **0.007 **<0.001 **
G1—G3<0.001 **<0.001 **<0.001 **<0.001 **<0.001 **
G1—G4<0.001 **<0.001 **<0.001 **<0.001 **<0.001 **
G1—G5<0.001 **<0.001 **<0.001 **<0.001 **<0.001 **
G1—G6<0.001 **<0.001 **<0.001 **<0.001 **<0.001 **
G2—G3<0.001 **<0.001 **0.017 *<0.001 **0.002 **
G2—G4<0.001 **<0.001 **<0.001 **<0.001 **<0.001 **
G2—G5<0.001 **<0.001 **<0.001 **<0.001 **<0.001 **
G2—G6<0.001 **<0.001 **<0.001 **<0.001 **<0.001 **
G3—G40.9990.3250.4150.0580.021 *
G3—G50.021 *<0.001 **0.003 **0.001 **<0.001 **
G3—G60.001 **<0.001 **<0.001 **<0.001 **<0.001 **
G4—G50.3100.2670.9990.9990.113
G4—G60.019 *0.001 **0.001 **0.003 **<0.001 **
G5—G60.9990.4790.1220.137<0.001 **
Post hoc evaluations with Bonferroni correction. * p < 0.05, ** p < 0.01.
Table 4. Pairwise comparison of changes over time between groups.
B-1B-2B-7B-301-21-71-302-72-307-30
G1—G20.032 *0.1280.9990.9990.9990.0510.9990.001 **0.9990.138
G1—G30.9990.9990.9990.9990.9990.2880.9990.1090.9990.999
G1—G40.0970.4260.9990.9990.9990.9990.9990.7810.9990.999
G1—G50.0610.4260.9990.9990.9990.3910.9990.0520.9990.288
G1—G60.001 **0.001 **0.999<0.001 **0.9990.9990.0600.013 *0.999<0.001 **
G2—G30.3570.3870.9990.9330.9990.9990.9990.9990.9990.999
G2—G40.9990.9990.9990.9990.9990.9990.9990.1900.9990.999
G2—G50.9990.9990.9990.9990.9990.9990.9990.9990.9990.999
G2—G60.9990.9610.5590.017 *0.9990.9990.026 *0.9990.3870.693
G3—G40.8910.9990.8070.9990.9990.9990.9990.9990.9990.999
G3—G50.6090.9990.9990.5410.9990.9990.9990.9990.9990.999
G3—G60.009 **0.002 **0.078<0.001 **0.5540.9990.003 **0.9990.2560.012 *
G4—G50.9990.9990.9990.9990.9990.9990.9990.9990.9990.999
G4—G60.9990.3190.9990.013 *0.9990.9990.040 *0.9990.7820.011 *
G5—G60.9990.3190.9990.034 *0.9990.9990.0890.9990.9990.352
Post hoc evaluations with Bonferroni correction. * p < 0.05, ** p < 0.01.
Disclaimer/Publisher’s Note: The statements, opinions and data contained in all publications are solely those of the individual author(s) and contributor(s) and not of MDPI and/or the editor(s). MDPI and/or the editor(s) disclaim responsibility for any injury to people or property resulting from any ideas, methods, instructions or products referred to in the content.

