Article

The Impact of Dextrin-Activated Expanded Perlite and Vermiculite Particles on the Performance of Thermal Insulating Rapeseed Oil-Based Polyurethane Foam Composites

Laboratory of Thermal Insulating Materials and Acoustics, Institute of Building Materials, Faculty of Civil Engineering, Vilnius Gediminas Technical University, Linkmenų st. 28, 08217 Vilnius, Lithuania
*
Author to whom correspondence should be addressed.
Appl. Sci. 2025, 15(12), 6604; https://doi.org/10.3390/app15126604
Submission received: 28 April 2025 / Revised: 6 June 2025 / Accepted: 10 June 2025 / Published: 12 June 2025

Abstract

:

Featured Application

The developed rapeseed oil-based polyurethane foam composites with dextrin-activated expanded vermiculite and perlite fillers could be used as efficient thermal insulating materials for walls, roofs, and floors, reducing heat transfer and energy consumption in buildings.

Abstract

To enhance the performance of polyurethane foams, fillers are often incorporated into the matrix. However, the interaction between the filler and the polyurethane matrix is crucial for achieving the desired property improvements. Therefore, surface modification of the fillers plays a vital role in optimizing this interaction. The current study aims to activate the surface of expanded vermiculite and perlite with dextrin to incorporate additional functional groups on the surface of the fillers via the ball-milling process, thereby improving the reaction with a polymer matrix. Applied surface activation with dextrin resulted in the formation of dextrin-Si-O-Si-dextrin linkages in the fillers, allowing for a maximum improvement of 11% and 9% in water absorption, as well as slightly positive changes in the water contact angle of polyurethane foam with dextrin-activated perlite and vermiculite, respectively, compared to non-activated fillers. It also resulted in noticeable differences in the foaming times and viscosity of the premixes, affecting the structure of rigid polyurethane foam composites. Compared to non-activated perlite and vermiculite filler polyurethane foam composites, the dynamic viscosity of polyurethane foam composites with dextrin-activated perlite and vermiculite reduced maximally 16 and 21 times, respectively. At the same time, the closed cell content increased, resulting in lower thermal conductivity values up to a 7.5 wt.% filler concentration. In addition, a rise in mechanical performance was also achieved. Compressive strength increased by a maximum of 61% and 71%, while tensile strength increased by a maximum of 36% and 20% for polyurethane foam composites with dextrin-activated perlite and vermiculite, respectively.

1. Introduction

Rigid polyurethane (PUR) foams are highly desirable materials, particularly for thermal insulation applications, due to their beneficial characteristics [1]. The formation of PUR foams involves several competing chemical reactions. During urethane formation, the polymer backbone forms. Hydroxyl groups (−OH) from polyol react with –NCO groups from isocyanate to form urethane linkages [2]. When water is used as a chemical blowing agent, it reacts with isocyanate groups to produce unstable carbamic acid, which immediately decomposes to form a urea linkage and release carbon dioxide, acting as a blowing agent and forming the cellular structure. Then, the amine formed during the water–isocyanate reaction can further react with another isocyanate group to form a urea linkage and subsequently with another isocyanate group to form a biuret linkage, which contributes to additional cross-linking and rigidity in the PUR foams [3]. Such materials have a low density, thermal conductivity, and water absorption, as well as sufficient dimensional stability and a relatively high mechanical performance. Currently, the demand for such products in various sectors, including building, automotive, food packaging, furniture, medical, and aviation, has increased [4]. PUR products have become irreplaceable in the modern industry. Its global production exceeds 21.3 million tons annually, making it the sixth-largest category of synthetic materials worldwide [5]. The estimated value of the PUR products market in 2021 was USD 77.9 billion. According to predictions, this value is expected to increase to USD 105.3 billion by 2026 [6].
The popularity of PUR products can be attributed to the increasing cost of energy and growing awareness of the importance of energy conservation. Along with the energy-related aspects, environmental awareness associated with petroleum-based polyurethane PUR foams is of great interest to the scientific and industrial communities. Significant effort has been invested in converting petroleum-based PUR foams into more environmentally friendly alternatives. For instance, polyol is dependent on petroleum-based feedstocks, and its synthesis using biomass such as oils is in high demand. The commonly incorporated vegetable oils for bio polyol synthesis are soybean [7,8], castor [9,10], palm [11,12], rapeseed [13,14], sunflower [15,16], and even waste cooking oils [17]. In addition, Olivito et al. [18] proposed a straightforward and efficient method for obtaining furfural from fructose. Furfural often serves as an intermediate or starting point in multi-step processes and can be utilized in the synthesis of furan-based diols, as indicated by Jang et al. [19]. The synthesis of polyurethane from furan-based diols is similar to the synthesis from conventional polyols, except that the furan-based ones have two primary hydroxyl groups and a furan ring, which enhance the rigidity, stiffness, and thermal stability of the resulting product [20]. Furthermore, studies by Torresi et al. [21] and Skoczinski et al. [22] have shown that furan-based compounds can increase surface water contact angles and reduce the flammability of the resulting products, demonstrating great potential for future use as a main compound in the synthesis of polyurethanes. However, few studies indicated that replacing petroleum-based polyols with bio-polyols can lead to the degradation of several properties. Kurańska et al. [23] determined that adding a rapeseed oil-based polyol slows the reaction time, reduces compressive strength and apparent density, and deteriorates the closed-cell structure. Moreover, the thermal insulating properties also showed an adverse effect with an increase in the amount of rapeseed oil-based polyol. In addition, Tan et al. [24] determined that the thermal conductivity of PUR foams made from biopolyols ages faster than that of conventional ones. It was also noted by Kurańska et al. [25] that water absorption and dimensional instability were increased for PUR foam made from a palm oil-based polyol. The structure was weakened due to the lower miscibility of the bio polyol with petroleum-based polyol and its slower reaction rate.
The properties of PUR foams can be varied, and some drawbacks can be mitigated by incorporating various fillers to develop novel composite PUR foam materials. The most interesting fillers for thermal insulating PUR foams are those capable of improving thermal conductivity, water absorption, and mechanical performance. For instance, Valipour et al. [26] investigated nanoclays as promising fillers for enhancing the microstructural features and thermal insulating properties of PUR foam composites. Authors have concluded that a 22–26% improvement in thermal insulation was achieved. Additionally, unmodified expanded vermiculite (Verm) and perlite (Per) were incorporated into the PUR foam matrix. Wang et al. [27] suggested that Verm did not react with the PUR matrix, thus causing the formation of an irregular structure and weakening the interfacial adhesion. Although Verm and Per are relatively similar, Ai et al. [28] demonstrated that it is possible to obtain thermal insulating PUR foam composites with reduced thermal conductivity while maintaining unchanged mechanical performance. However, none of these studies touched on the impact of water on the resulting foams.
In particular, vermiculite and perlite are lightweight, sound-absorbent materials with excellent thermal insulating properties. Due to their structure, these materials offer intensive volume growth after high-temperature impact, resulting in expansion. Thermal expansion occurs perpendicularly to Verm and Per sheets, thus obtaining a highly porous structure [29]. Thanks to their expansion ability, these materials can be applied to various purposes, such as structural, thermal insulation, acoustic, agricultural, and as a filler for polymer-based products [30,31]. Furthermore, numerous studies have shown that Verm and Per are promising for reducing flammability in various composites [32,33,34]. However, various fillers lacking proper functional groups on their surface can sometimes lead to the formation of an improper interface between the filler and the polymer matrix. Therefore, research on the functionalization of fillers is currently of great interest to the research community. For instance, Joseph et al. [35], Hu et al. [36], and Li et al. [37] applied silane coupling agents to modify the surface of metal and clay fillers. The results demonstrated outstanding compatibility with dispersing media, enabling the avoidance of particle agglomeration and imparting chemical reactivity to the particles. Miedzińska et al. [38] proposed a more environmentally friendly approach by modifying the ball-milling process to incorporate hydroxyl functional groups into casein, chitosan, and potato protein on the surface of vermiculite. It was determined that proteins and saccharides applied to vermiculite result in PUR foam composites with reduced average cell size, improved mechanical performance, and nearly unchanged resistance to water impact. However, the reaction of the prepared premixes was slowed down with all the surface modifiers used. In addition, the same surface modification method with casein was applied to natural fillers—apricot stones [39]. The same observation about reaction kinetics was noted. Moreover, structural parameters, such as closed cell content, deteriorated, leading to increased thermal conductivity values. Although the suggested surface modification method and materials used are more sustainable, the granted performance characteristics for PUR foam composites are not entirely satisfactory.
Given the bio-based origin and availability of dextrin (Dex), its application as a sole filler surface modifier is promising for producing PUR foam composites with improved microstructural parameters and thermal insulation properties. According to Wang et al. [40], the hydroxyl groups in Dex are more easily exposed and have higher reactivity, making it suitable as a surface modifier for Verm and Per fillers. Therefore, this study aims to develop PUR foam composites with Dex-activated Verm (VermDex) and Dex-activated Per (PerDex) fillers, which could find their application as promising thermal insulation materials with improved microstructure, thermal conductivity, mechanical performance, and resistance to water impact.

2. Materials and Methods

2.1. Raw Materials

Bio-based polyol BioPolyol RD, derived from rapeseed oil, and traditional polyether polyol ROKOPOL RF-152 V were incorporated as primary raw materials for synthesizing rigid polyurethane foam composites. BioPolyol RD was supplied by SIA PolyLabs, Riga, Latvia. It had a moisture content of <0.2 wt.% and a hydroxyl number of 360 KOH/g. ROKOPOL RF-152 V was purchased from PCC Rokita, Brzeg Dolny, Poland, with a moisture content of 0.07 wt.% and a hydroxyl number of 444 KOH/g. A polymeric 4,4-diphenylmethane diisocyanate, Lupranat M20S, was incorporated as a hardener and purchased from BASF, Ludwigshafen, Germany. Water was used as a chemical blowing agent. Polycat 9 from Air Products and Chemicals, Inc., Allentown, PA, USA, was incorporated for the blowing and gelling reactions. A silicone surfactant ST-52 was obtained from Shijiazhuang Chuanghong Technology Co., Ltd., Shijiazhuang, China. Expanded vermiculite (Verm) and perlite (Per) with an initial moisture content of 0.01% were used to reinforce the inorganic fillers. These fillers were purchased from JSC Biosprendimų laboratorija, Elektrėnai, Lithuania. Dextrin from JSC Suvena, Panevėžys, Lithuania, was used as a fillers’ surface activator.

2.2. Preparation of Dextrin Modified Fillers and Polyurethane Foam Composites

Verm and Per fillers were separately ball-milled with dextrin (Dex) (Verm:Dex and Per:Dex weight ratio of 1:1) using a ball-milling machine with 6 ceramic balls for 1 h at 2500 rpm. The resulting VermDex and PerDex fillers were dried for 48 h at 105 °C in a ventilated oven, and the moisture contents were determined to be 6.3 wt.% and 7.5 wt.%, respectively. The water amount in PUR foam compositions presented in Table 1 was recalculated based on the moisture contents of Verm, Per, VermDex, and PerDex fillers. Isocyanate index was calculated according to the methodology provided by Ivdre et al. [41].
Component A, consisting of the required polyols, water, catalyst, surfactant, and fillers, was thoroughly mixed for 60 s at 1800 rpm. Then, the calculated amount of Component B (isocyanate) was added, and the mixture was further mixed for 10 s at 1800 rpm and poured into 300 × 300 mm-sized molds. The resulting polyurethane foam composites were left to harden for 24 h at a temperature of 23 ± 5 °C and 50 ± 5% relative air humidity. After hardening, the demolded samples were further conditioned at a temperature of 23 ± 5 °C and 50 ± 5% relative air humidity before being cut into samples and tested.

2.3. Testing Methods

The moisture content of all particles was determined using a KERN DAB moisture analyzer (KERN & Sohn GmbH, Balingen, Germany).
The granulometry determination of all particles was conducted with a set of sieves consisting of the bottom (0 mm), 0.063 mm, 0.10 mm, 0.20 mm, 0.50 mm, 0.63 mm, and 1.25 mm sieves.
Fourier transform infrared (FTIR) spectroscopy was conducted for all particles using Lumos II (Bruker Optics GmbH, Ettlingen, Germany). Thirty scans at a 600–4000 cm−1 range with a scan interval of 4 cm−1 were taken for each particle type.
The dynamic viscosity test was conducted for polyol and filler premixes using an SV-10 viscometer (A&D Company Ltd., Tokyo, Japan) at a velocity of 6 rpm with an accuracy of 0.01 mPa·s.
The characteristic foaming times were determined using a stopwatch with an accuracy of 0.5 s according to the requirements of EN 14315-1 [42].
The structural analysis of the Verm, Per, VermDex, and PerDex particles, control PUR foam, and PUR foam composites was performed using an optical microscope Smart 5MP PRO (Delta Optical, Gdańsk, Poland) with a maximum magnification of up to 300 times. The average cell size of the resulting PUR foam composites was obtained using optical images using ImageJ software, v. 1.51j8.
The closed-cell content was determined using the EN ISO 4590 [43] method 2 requirements for samples with a size of 100 mm × 30 mm × 30 mm.
The thermal conductivity determination was performed at an average temperature of 10 °C on samples with a size of 300 mm × 300 mm × 50 mm, based on EN 12667 [44] requirements, using a heat flow meter FOX 304 (TA Instruments, Newcastle, DE, USA) with active edge insulation. The direction of the heat flow was upward during the test. The difference between cold and hot plates was 20 °C.
The short-term water absorption by partial immersion for control rigid polyurethane foam composites and rigid polyurethane foam composites filled with Verm, Per, VermDex, and PerDex particles was determined based on the ISO 29767 [45] method A requirements for samples measuring 200 mm × 200 mm × 50 mm. Excess water in the samples was drained for 10 min using a drainage stand at 45° after the test.
The surface hydrophobicity of control rigid polyurethane foam and rigid polyurethane foam composites filled with different particles was determined by the water contact angle method. The test was implemented using a goniometer with an optical system (Ossila Ltd., Sheffield, UK) to capture the angle of water drop on the tested surfaces. Water drops of 1 µL were deposited using a micrometer syringe. The results were taken 10 s after water droplet deposition. Measurements were done at least three times on each sample.
The tensile and compressive strengths were determined in accordance with EN 1607 [46] and ISO 29469 [47] requirements. The samples used for the tests were 50 mm × 50 mm × 50 mm in size. A Universal Testing Machine, H10KS Hounsfield (Tinius Olsen Ltd., Surrey, UK), will monitor the behavior of the samples during compression and tension.
Experimental data processing and reliability evaluations were performed using mathematical and statistical methods with the software STATISTICA v.8.

3. Results and Discussion

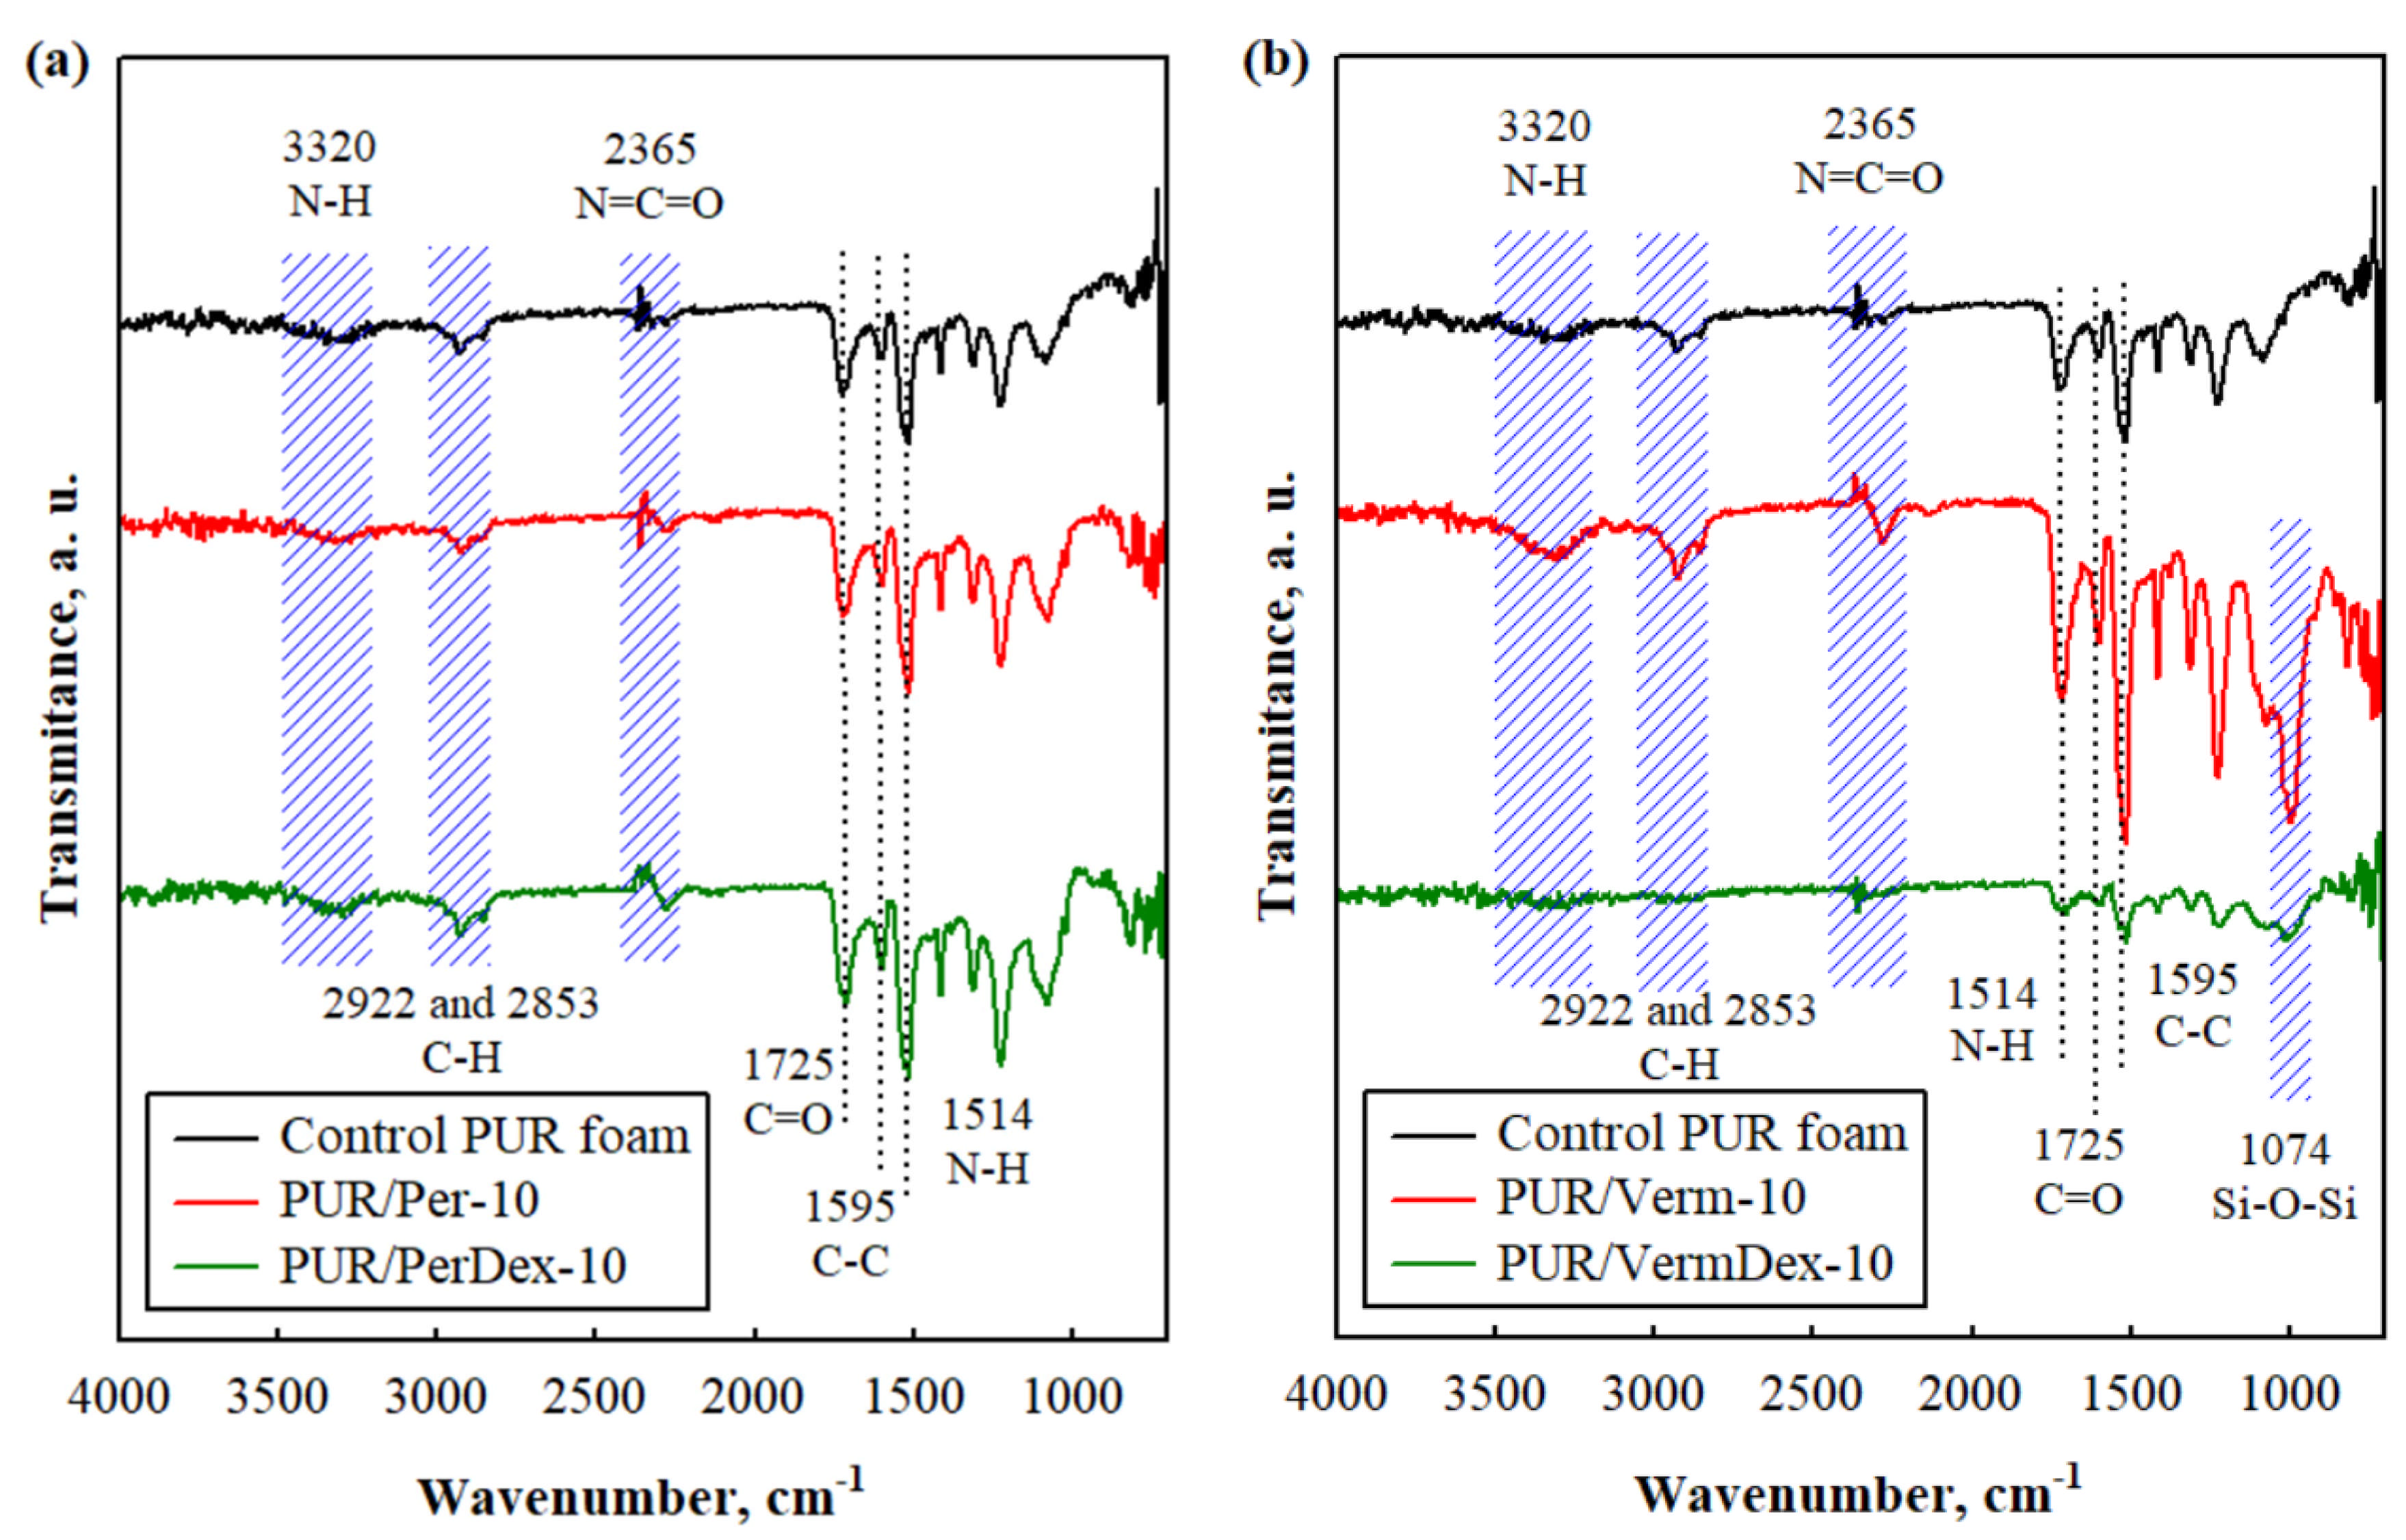
3.1. Characterization of Fillers

The results show that the size of the non-activated Per and Verm fillers (Figure 1b,d) was up to 1.25 mm. The highest percentage of particles was observed at 0.2 mm. Per filler consisted of snowflake-like particles (Figure 1a). In contrast, Verm particles were larger in size and non-homogeneous in shape (Figure 1c). In addition, Figure 1f,h demonstrate Dex-activated Per and Verm fillers (PerDex and VermDex, respectively). It can be seen that the fillers’ particle size distribution ranged up to 0.63 mm, with the highest accumulation of particles observed on the 0.1 mm sized sieve. The smaller particles in both PerDex and VermDex fillers were obtained through the ball-milling process, as confirmed by Sakr et al. [48], which alters their surface, size, and chemical reactivity. PerDex filler also has a snowflake-like structure with the addition of round-shaped particles (Figure 1e), while VermDex filler is more like sand-like particles with brownish inserts of Dex particles (Figure 1g). In order to check the efficacy of Dex adsorption on the surface of Per and Verm fillers, FTIR spectra of each of the filler types are obtained, and the results are presented in Figure 2.
FTIR analysis was employed to assess the presence of functional groups in the fillers before and after activation. Figure 2 presents FTIR spectra of the Per and PerDex, Verm, and VermDex fillers. For the Per filler (Figure 2a), the band located in the 1669–1577 cm−1 range, with a peak at 1629 cm−1, is assigned to the vibration of hydroxyl groups. A large band observed at 1038 cm−1, within the range of 1280–864 cm−1, corresponds to the stretching vibrations of Si-O-Si [49]. Further, the peak at 789 cm−1 is assigned to the Si-O stretching vibration of Si-O-Al [50].
After the activation of the Per with Dex, a new band is noticed at the range of 3359–3082 cm−1 with a peak intensity at 3349 cm−1, which is associated with the presence of water molecules in the material structure, while a less pronounced band at 2918 cm−1 due to the C-H stretching of the -CH2 group in the case of Dex absorbed Per. This indicates that hydroxyl groups of Dex only partially react with silanols in Per filler.
For Verm filler (Figure 2b), the broad band between 3726 cm−1 and 3016 cm−1 is related to interlayer water molecules’ −OH stretching vibration. The peak of 3416 cm−1 is attributed to the silanol groups in Verm and VermDex [51] and −OH vibrations. The spectrum of Verm and VermDex exhibited a weak band at 1648 cm−1, corresponding to Si-OH vibrations. In addition, a strong band in the range of 1210–827 cm−1, with a peak at 981 cm−1, is associated with the Si-O stretching vibration [52].
Contrary to the case of Per and PerDex fillers, after activation with Dex, a hydroxyl stretching frequency, which should be visible at ~2918 cm−1 in VermDex filler, has no intensity, thus indicating that the −OH groups of Dex are fully reacted with the silanol groups of Verm. In this case, the formation of a Dex–O–Si–O–Dex linkage could be assumed. Similar observations were made in the study of Salih et al. [53]. The authors researched the chitosan adsorption on vermiculite. However, they noticed only a partial reaction of chitosan with silanols in Verm filler.
The proposed Verm and Per particles activation with the Dex scheme is presented in Figure 3. The formation of O-H groups from Dex on the surface of the analyzed fillers will contribute to the reaction with N-C-O groups from isocyanate.
As hydroxyl groups are important for the synthesis of PUR foam, Dex-activated fillers will react with N-C-O groups with isocyanate, thus assumably improving the interfacial adhesion between VermDex, PerDex fillers, and the polymeric PUR foam composites matrix.

3.2. Reaction Kinetics of Premixes

It is known that adding various fillers generally increases the viscosity of the PUR foam mixtures, which can negatively affect the mixing of reactants, potentially slowing down the overall reaction rate [54]. The results of the main characteristic foaming times and dynamic viscosity are presented in Table 2.
Unsurprisingly, the premixes of PUR/Per and PUR/Verm foam composites negatively impacted cream, gel, and tack-free times—for instance, the addition of 2.5 wt.% Per and Verm increased cream time by 45% and 40% and gel time by 50% and 41%, respectively, compared to the control PUR foam premix. However, further addition of fillers improved the parameter, and at 10 wt.% Per and Verm concentration became almost the same as for the control premix. Similar observations can be made for PUR/PerDex and PUR/VermDex premixes, indicating that PerDex and VermDex fillers do not highly impact the cream and gel times, which are comparable to the premixes of PUR/Per and PUR/Verm foam composites. The obtained results are in excellent agreement with the ones obtained by Barczewski et al. [29], who indicated that fillers similar to Verm and Per do not typically accelerate the initial stages of foam formation. However, the same conclusion cannot be made for tack-free time. The maximum tack-free times were observed for all PUR foam composites at 10 wt.% fillers concentrations, i.e., by 61% for PUR/Per, 132% for PUR/Verm, 85% for PUR/PerDex, and 91% for PUR/VermDex compared to the premix of control PUR foam. It means that all fillers interfere with the nucleation and growth of the bubbles, potentially altering the foaming kinetics. Therefore, a slower or less efficient foaming process can indirectly lead to a longer time for the surface to become tack-free. Cetin et al. [30] and Sari et al. [55] showed that expanded Verm and Per can be used for oil absorption. Fillers with high oil absorption tend to increase viscosity more significantly, as can be seen from the results obtained in Table 2. In general, all premixes show the same behavior, i.e., a constant increase in viscosity with adding fillers. The parameters of PUR/Per and PUR/Verm foam composites were up to 97 and 113 times higher for 10 wt.% of Per and Verm addition compared to control PUR foam. It is unsurprising as few studies [56,57] indicate a deterioration in the rheological characteristics of highly filled mixtures. Interesting observations can be made for PUR/PerDex and PUR/VermDex foam composites. Compared to PUR/Per and PUR/Verm foam composites, the dynamic viscosity of PUR foam composite systems with Dex-activated Per and Verm fillers was reduced 16 and 21 times, respectively, at the highest concentration of fillers. It can be assumed that incorporating hydroxyl groups on the surface of fillers can interact with polar components in the premix surrounding more easily, thus creating a repulsive force between filler particles, preventing them from agglomeration.

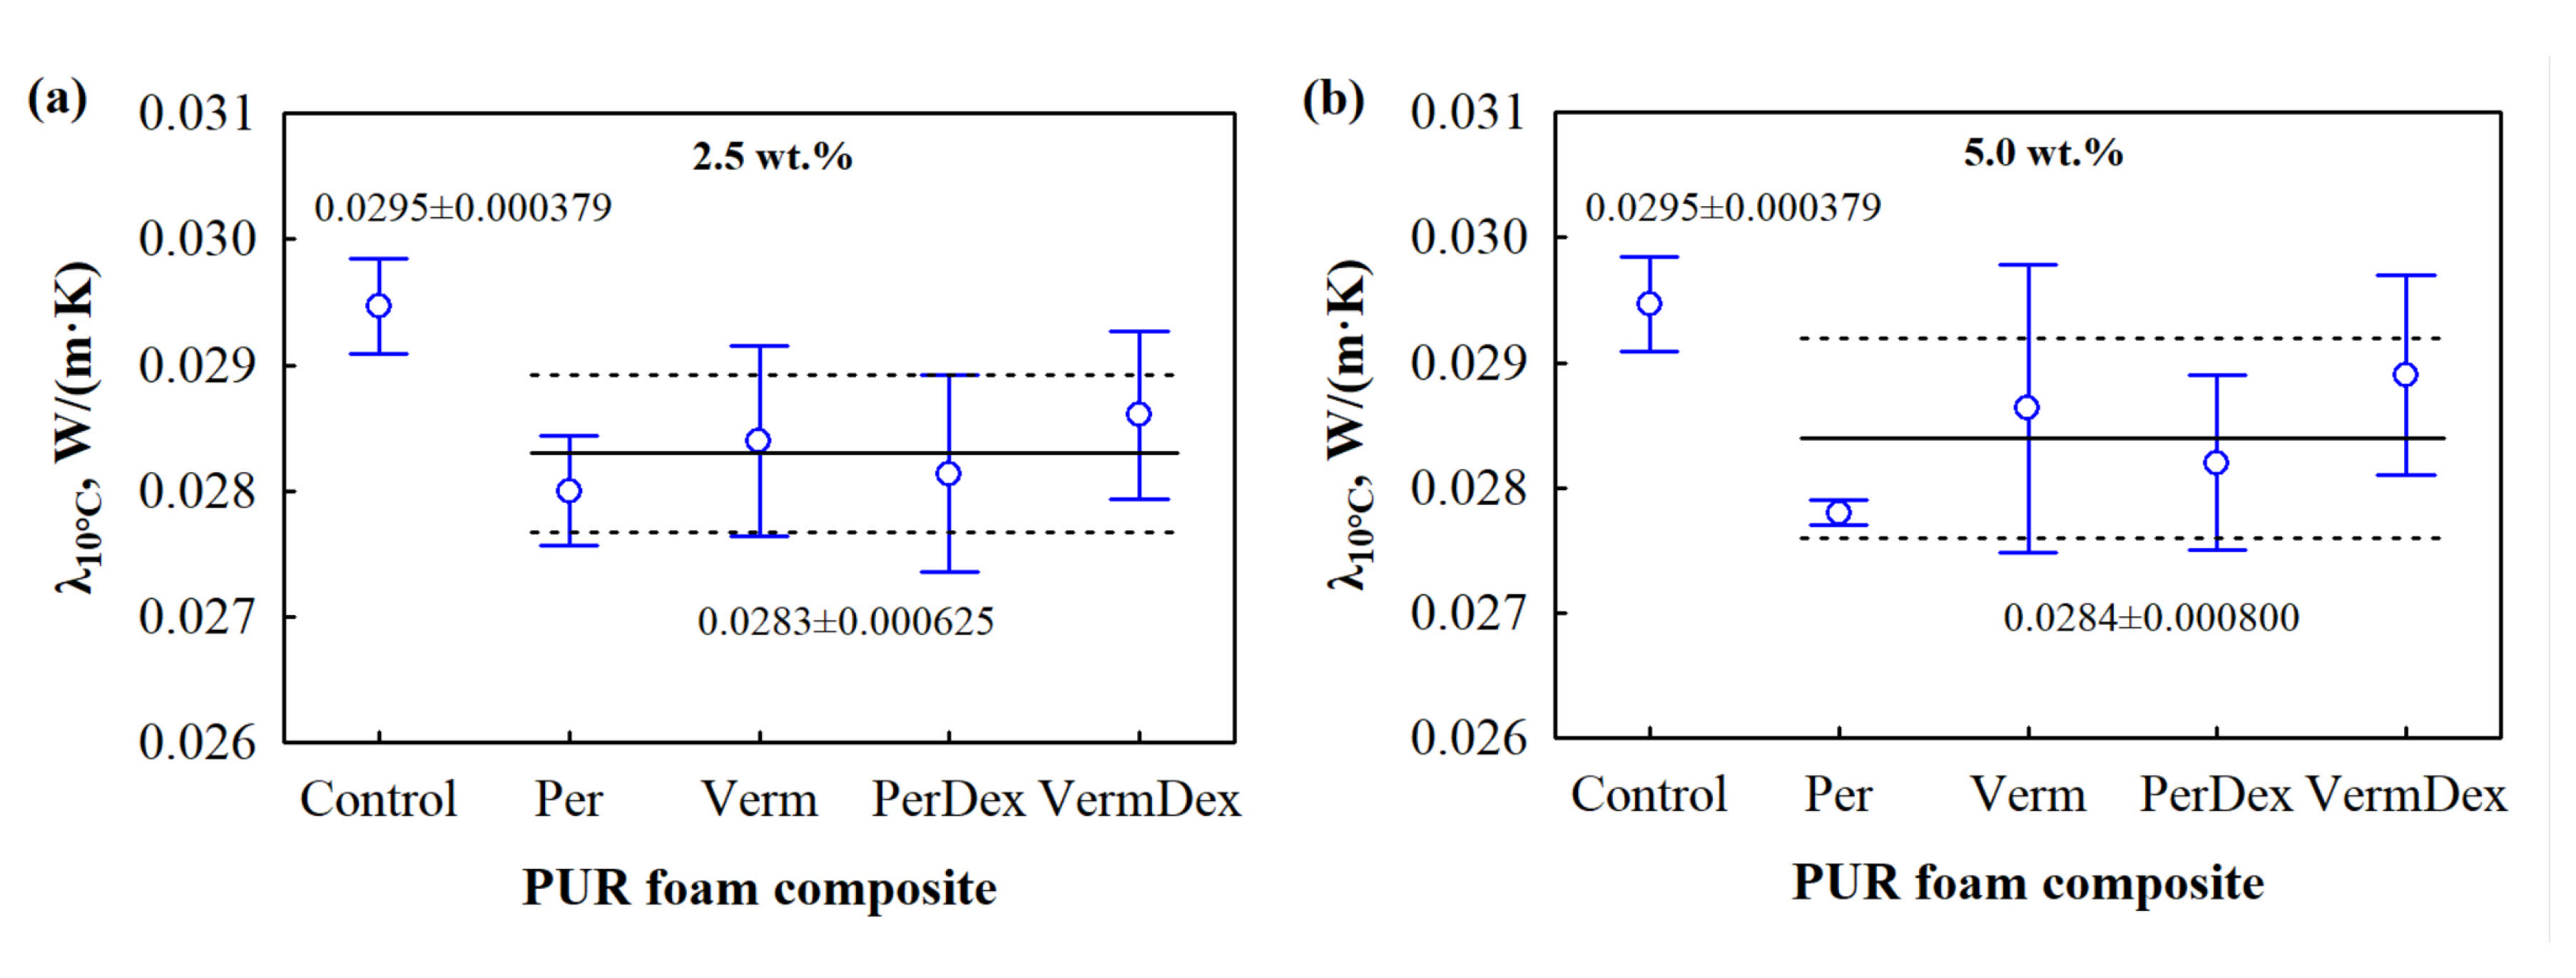
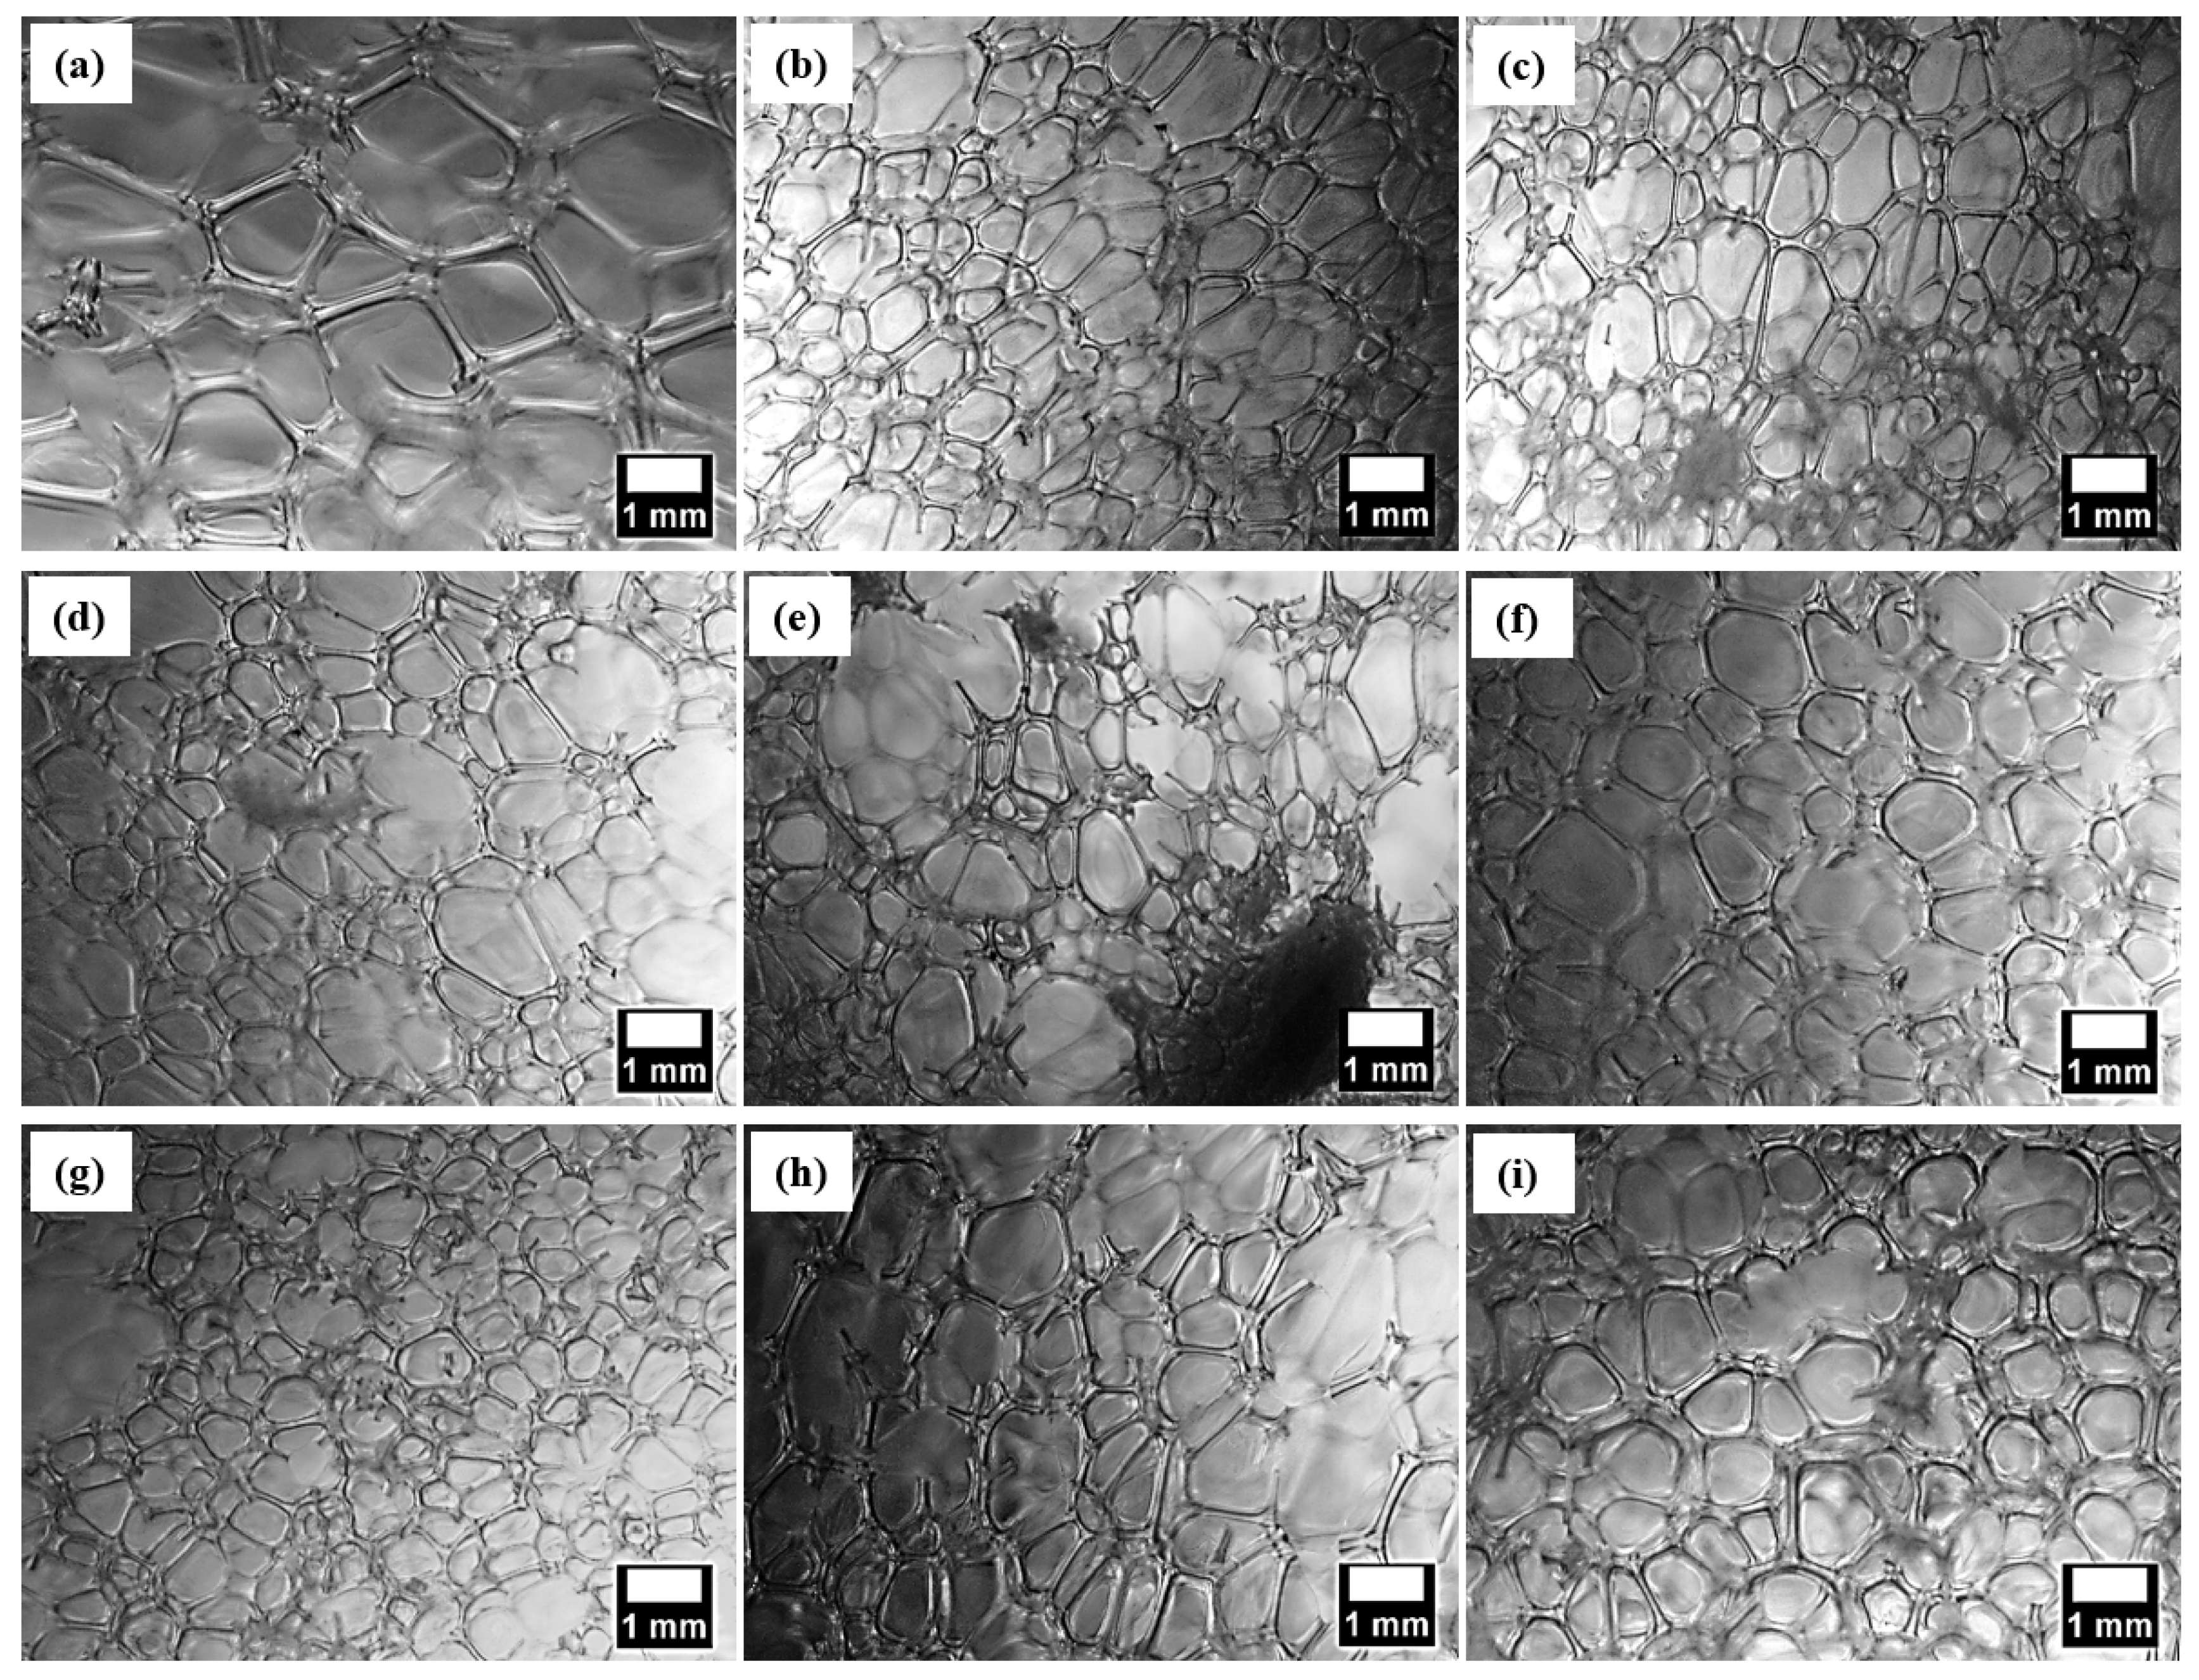
3.3. Microstructure and Thermal Conductivity

It is common to find that incorporating various fillers can affect the density of the foam due to the interference of the solid particles with the polymer and foaming kinetics. The density results are summarized in Table 3.
They confirm that the parameter increase depends on the increase in filler concentration and agree with the results reported in the study by Gama et al. [58]. In this case, the apparent density of PUR/Per foam composites increased by a maximum of 9%, whereas for PUR/Verm foam composites, the parameter reached its highest value at 10 wt.% Verm addition. It is also worth noting that Dex-activated Per and Verm particles caused an even greater increase in the apparent density of PUR foam composites. For instance, the highest increase was 46% for PUR/PerDex foam composites and 37% for PUR/VermDex foam composites. The apparent densities of Dex-activated and non-activated particles-filled PUR foam composites could be attributed to differences in the bulk densities of the fillers.
To evaluate the impact of non-activated and Dex-activated Per and Verm particles on the thermal conductivity of PUR foam composites, graphs were presented based on the concentration of each filler added (Figure 4). It can be seen from Figure 4a–d that the difference in thermal conductivity between the PUR/Per, PUR/Verm, PUR/PerDex, and PUR/VermDex foam composites was insignificant. However, a 3–4% reduction in the parameter can be observed, i.e., from 0.0295 W/(m·K) to 0.0283 W/(m·K) for 2.5 wt.% filler addition (Figure 4a), to 0.0284 W/(m·K) for 5 wt.% willer addition (Figure 4b) and to 0.0285 W/(m·K) for 7.5 wt.% filler addition compared to control PUR foam. The cell size results in Table 2 can explain this.
A closer examination of the results in Table 3 and Figure 5 revealed that all fillers (Per, Verm, PerDex, VermDex) and their concentrations (2.5–10 wt.%) reduced average cell size by a minimum of 15% and by a maximum of 55% compared to control PUR foam indicating that the filler particles act as nucleating agents. Similar observations were made by Lee et al. [59], who investigated PUR foam composites with silica aerogels and silica nanoparticles. Even though the closed cell content (Table 3) of all PUR foam composites is higher than that of a control PUR foam, Soloveva et al. [60] determined that the cell size causes the highest impact on thermal conductivity. They explained that in larger cells, the contribution of radiative heat transfer to the thermal conductivity value increases. Figure 4d shows that the further addition of all fillers, i.e., 10 wt.%, yields a thermal conductivity value almost identical to that of the control PUR foam. The excessive addition of fillers led to even worse results, with the cell size becoming larger and non-uniform.
The microstructure of all PUR foam composites at 10 wt.% filler concentrations (Figure 5c,e,g,i) was also destroyed and exhibited interconnected cells, unlike the control PUR foam, which displayed the typical cellular structure. This could be attributed to the worsened thermal conductivity values of the PUR foam composites. Therefore, the maximum addition of all fillers based on thermal conductivity is 7.5 wt.%, which yields the highest thermal insulation performance in PUR foam composites.
However, the statistical analysis of the thermal conductivity of PUR foam composites with 2.5 wt.% different fillers showed (Figure 4a) that there are no differences between the PUR/Per-2.5, PUR/Verm-2.5, PUR/PerDex-2.5, and PUR/VermDex-2.5 composites. The F-criterion is 0.48, p = 0.70, and R2 = 0.154. Further, the statistical analysis of the thermal conductivity of PUR foam composites with 5 wt.% different fillers showed (Figure 4b) that there are also no differences between the PUR/Per-5, PUR/Verm-5, PUR/PerDex-5, and PUR/VermDex-5 foam composites. The F-criterion is 1.14, p = 0.39, and R2 = 0.299. Moreover, the statistical analysis of the thermal conductivity of PUR foam composites with 7.5 wt.% different fillers showed (Figure 4c) that there are no differences between the PUR/Per-7.5, PUR/Verm-7.5, PUR/PerDex-7.5, and PUR/VermDex-7.5 foam composites. The F-criterion is 0.98, p = 0.45, and R2 = 0.269. In addition, the statistical analysis of the thermal conductivity of PUR foam composites with 10 wt.% different fillers showed (Figure 4d) that there are no differences between the PUR/Per-10, PUR/Verm-10, PUR/PerDex-10, and PUR/VermDex-10 foam composites. The F-criterion is 1.94, p = 0.20, and R2 = 0.421. After repeated comparisons of the PUR/Per, PUR/Verm, PUR/PerDex, and PUR/VermDex foam composites with the control PUR, F-criterion is 0.39, p = 0.81, and R2 = 0.135, indicating a statistically insignificant difference between the mean values.

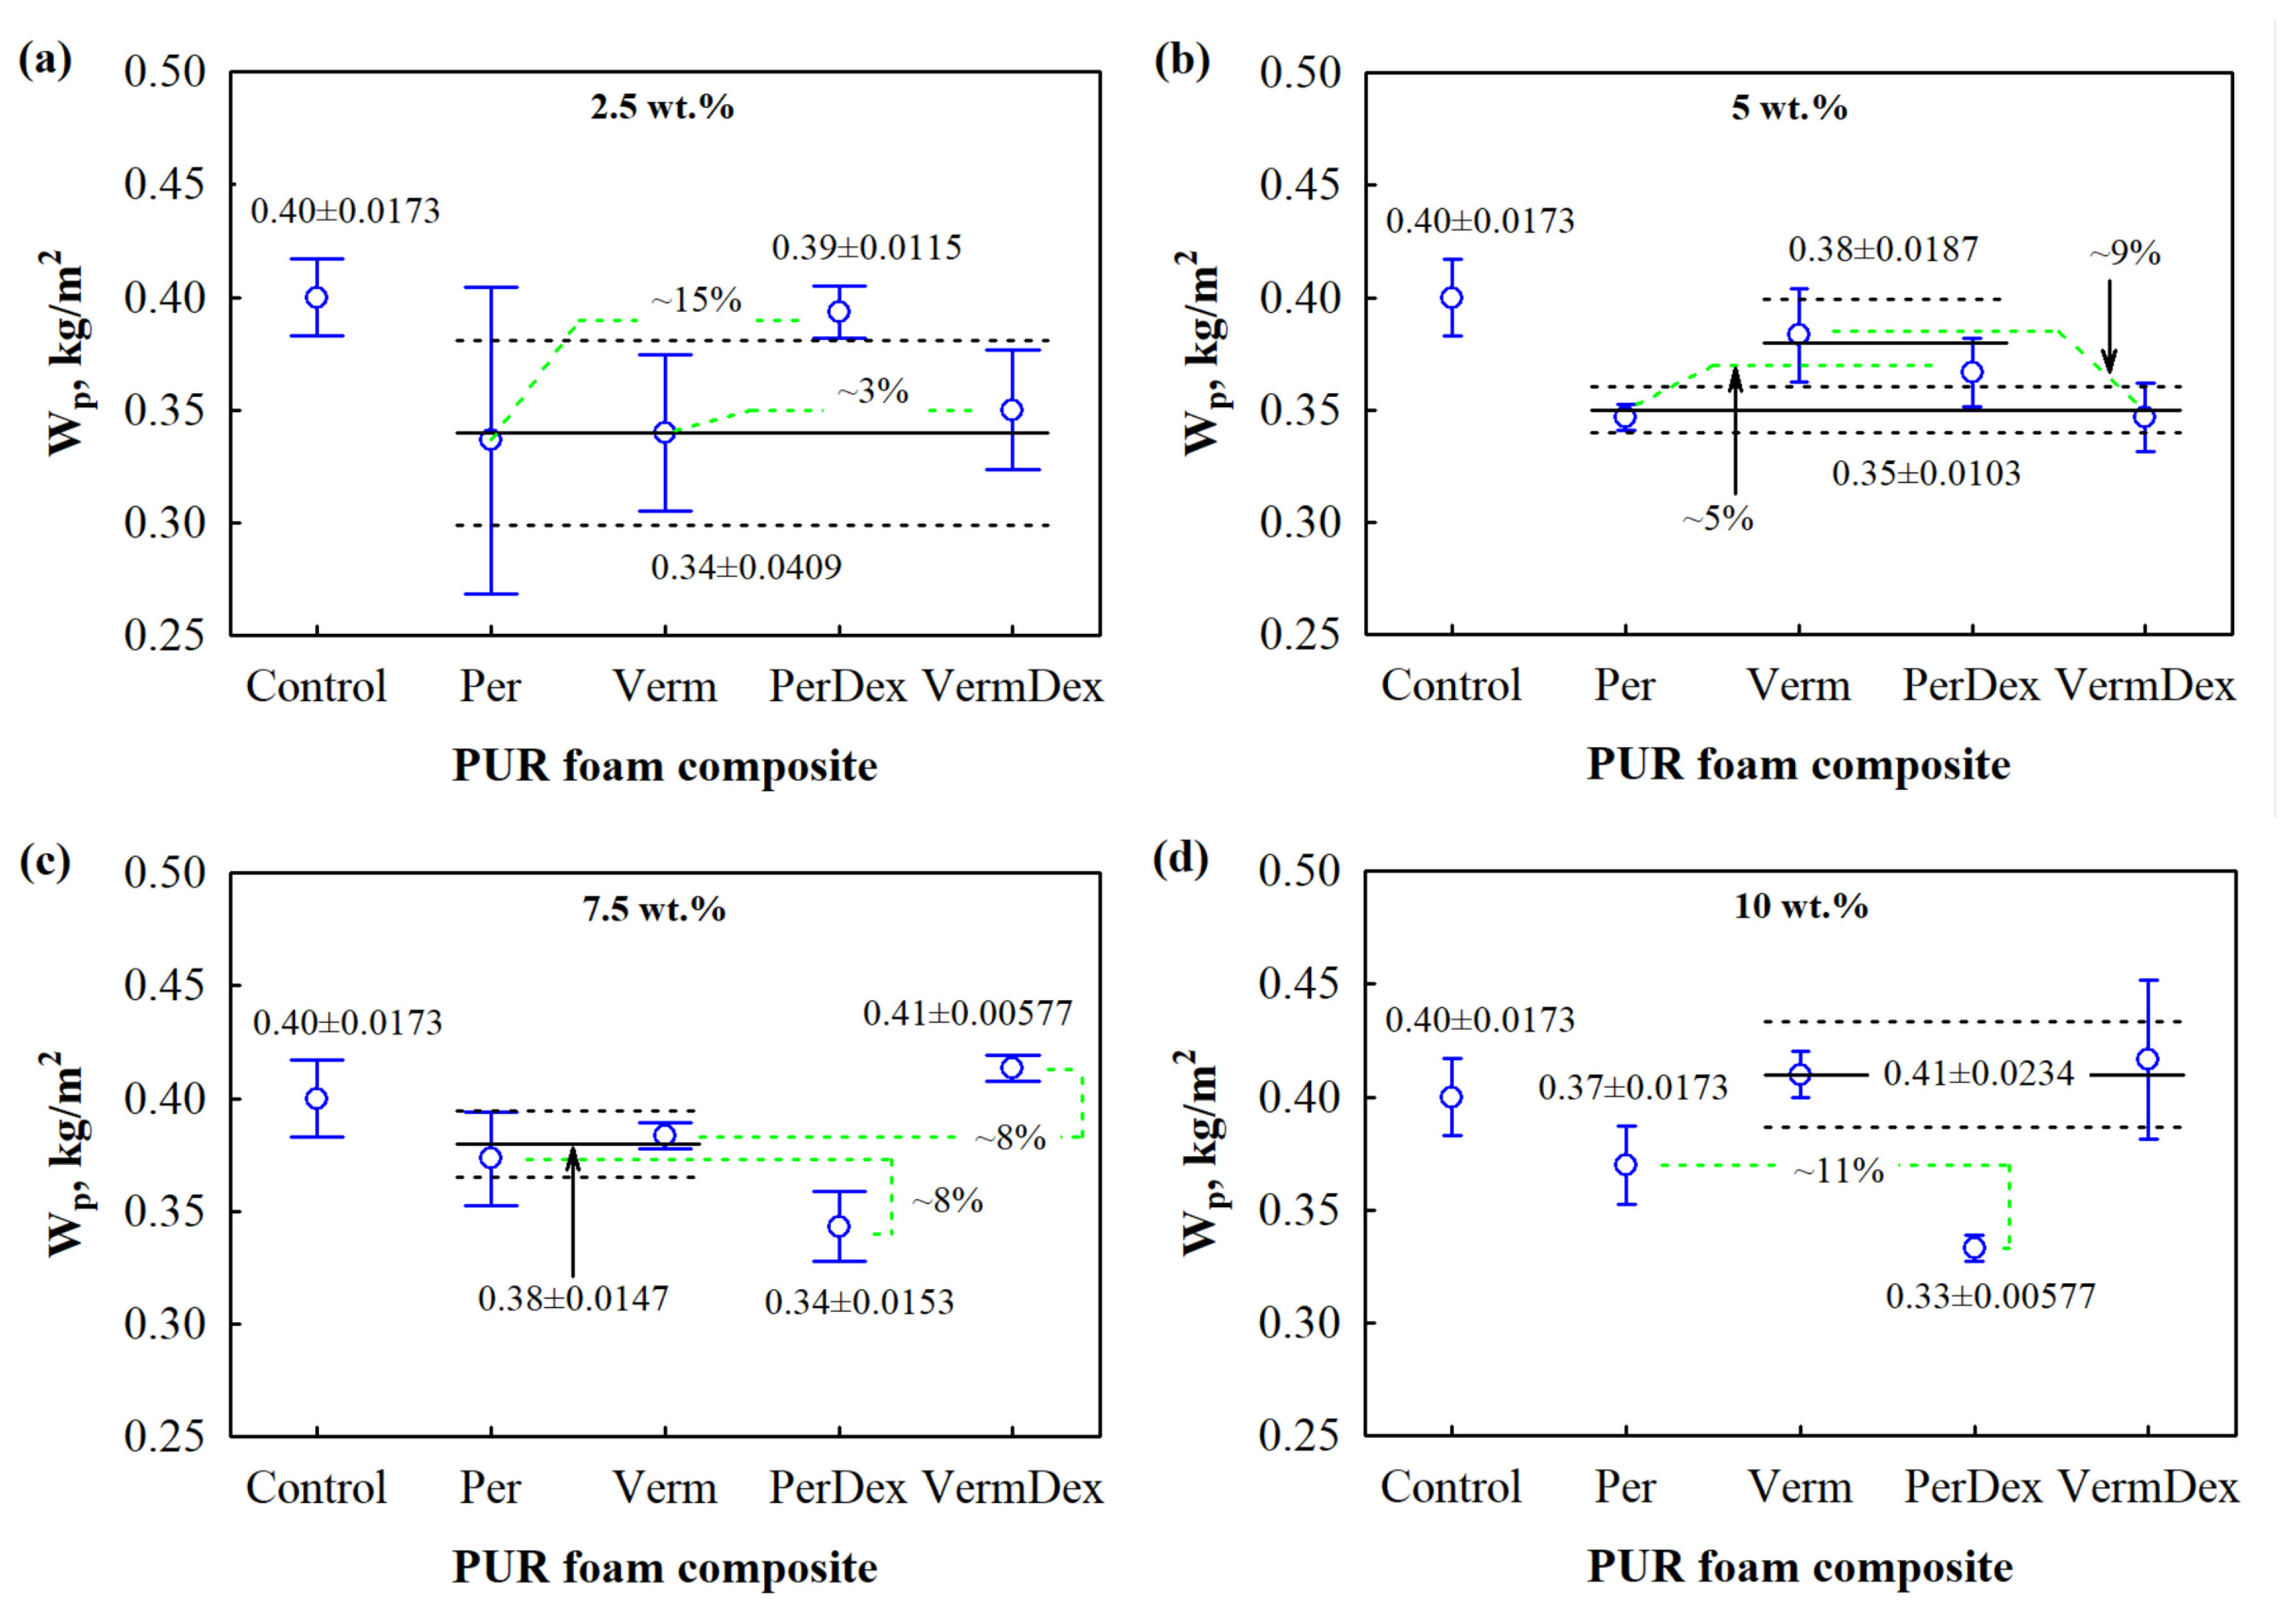
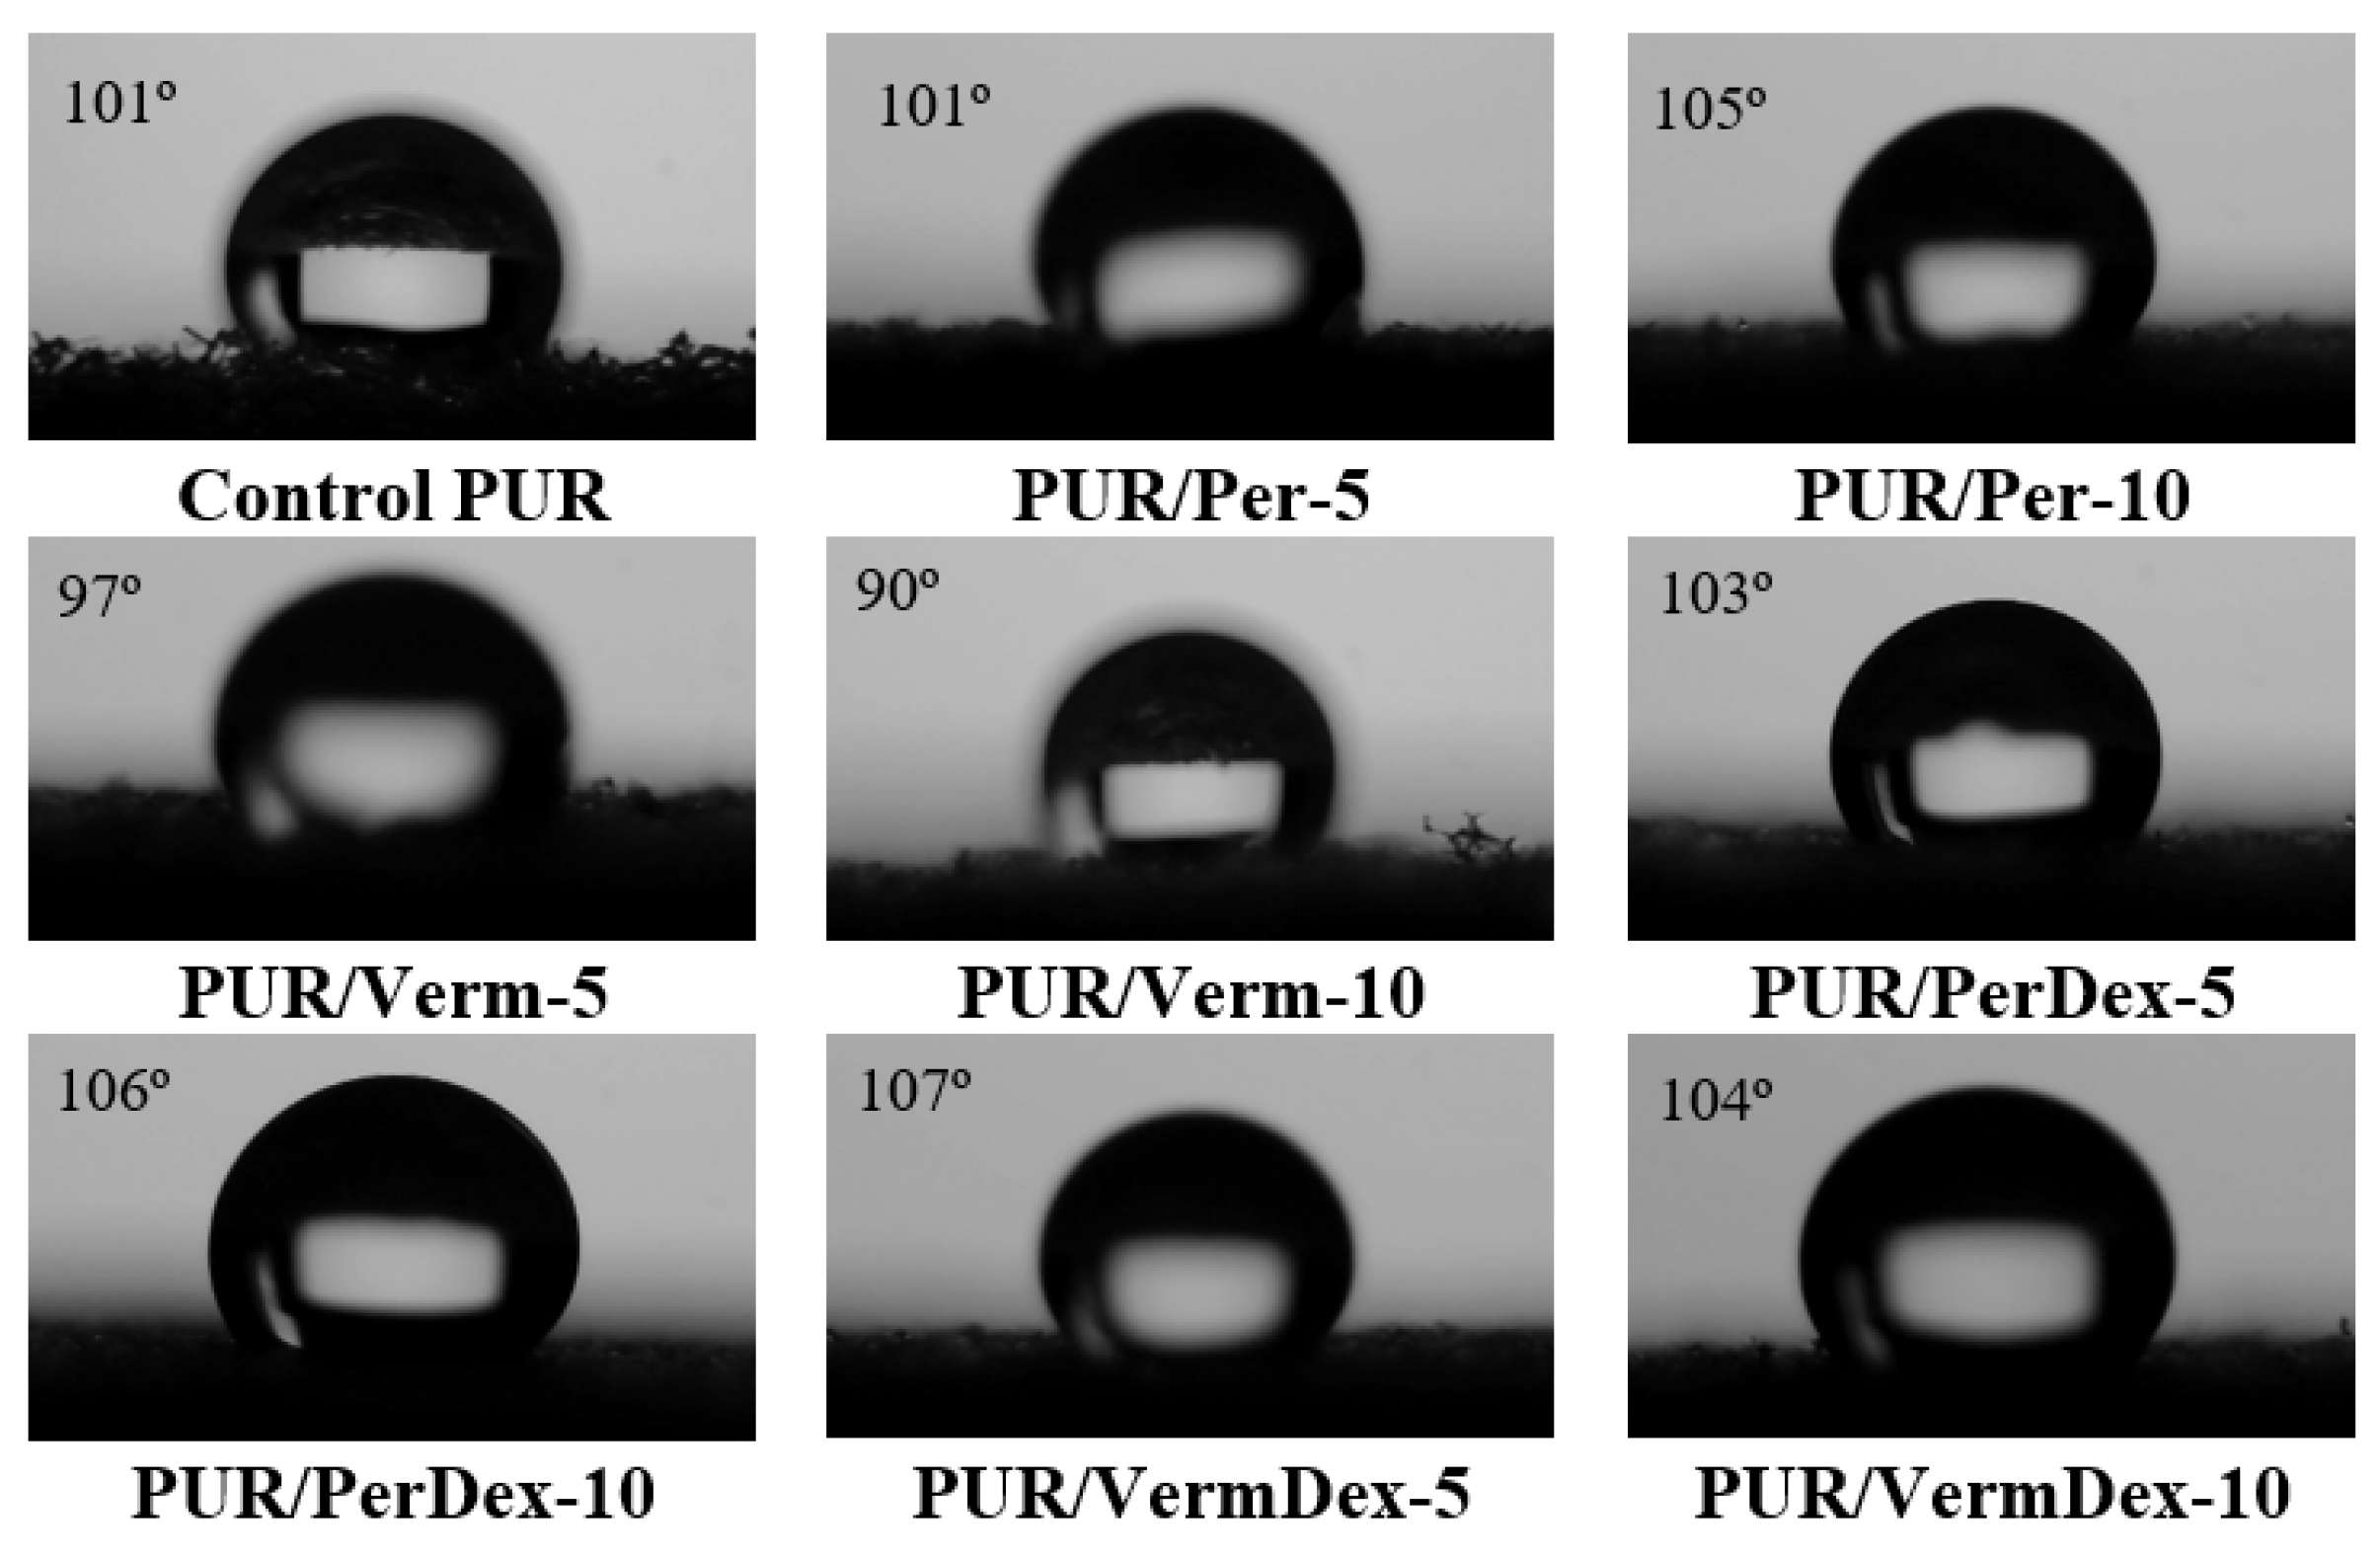
3.4. Water Resistance Performance

Figure 6 presents water absorption behavior for control PUR foam and PUR foam composites with each type of filler at concentrations ranging from 2.5% to 10%. Water absorption at each concentration of filler is presented separately to highlight the impact of each filler type on the parameter more clearly.
Considering the concentration of each filler type, a reduction in water absorption is noted for Per and Verm fillers. The parameter is reduced by 15% at 2.5 wt.% Per filler concentration (Figure 6a). The further addition of Per increases water absorption, but it remains 7.5% lower than control PUR foam (Figure 6b–d). It can be explained by the fact that Per does not absorb much water. On the contrary, it holds water within the tiny crevices that pockmark its surface [61]. Additionally, the obtained water absorption results correlate with the closed-cell content for PUR/Verm composites, as shown in Table 3.
A similar but slightly more intense tendency is observed for Verm filler-modified PUR foam composites. The incorporation of 2.5 wt.%, 5 wt.%, and 7.5 wt.% Verm by 15%, 5%, and 5%, respectively, decreases water absorption compared to the control PUR foam (Figure 6a–c). However, a further 10 wt.% Verm deteriorates the parameter by 2.5% compared to control PUR foam (Figure 6d). It is well known that expanded Verm absorbs water like a sponge whether it is used in polymer composites, cement-based composites, or mortars [62,63]. Its flakes expand when it sops up water. This means that structural damage occurs. For instance, Table 3 shows that incorporating Verm in any concentration reduces the number of closed cells, which may also contribute to the deterioration of moisture-related properties.
Dex-activated Per (PerDex) fillers show a decreasing tendency in water absorption values, even at a maximum addition of 10 wt.% PerDex (Figure 6d), PUR foam composites exhibit ~18% lower water absorption than control PUR foam and ~11% compared to untreated Per filler. However, Dex-activated Verm (VermDex) filler positively impacts the parameter at only up to 5 wt.% addition (Figure 6b,c), i.e., maximum by ~13% compared to control PUR foam and by ~8% compared to unmodified Verm. Further incorporation of this filler up to 10 wt.% deteriorates the resistance to water by a maximum of 5% compared to control PUR foam and by ~3% compared to unmodified Verm (Figure 6c,d). As indicated in FTIR spectra of VermDex (Figure 2), Verm activation with Dex allows the formation of Dex–Si–O–Si–Dex linkages, which inhibit the filler’s participation in further reaction with isocyanate to form a strong interface between filler particles and polymer matrix. On the contrary, PerDex filler has hydroxyl groups, which only partially react with silanols in Per. Therefore, participation in the reaction during PUR foam composites synthesis is not entirely restricted, thus allowing the formation of a more reliable interface between particles and PUR foam composites. Therefore, the FTIR spectra of control PUR foam and PUR foam composites with Dex-activated fillers are presented in Figure 7.
It can be seen that all PUR foam composites have similar patterns. The intensity at 3320 cm−1 is assigned to the stretching band of N-H. In addition, asymmetrical and symmetrical vibrations of C-H take place at wavenumbers of 2922 cm−1 and 2853 cm−1, respectively. Furthermore, unreacted N=C=O groups are observed at 2365 cm−1, indicating the excess of isocyanate used in the synthesis of the control PUR foam and PUR foam composites. However, Figure 7b shows that the addition of VermDex reduced the N=C=O intensity to a minimum, resulting in the formation of complete urethane linkages. The band at 1725 cm−1 indicate the stretching vibrations of C=O, while intensities at 1595 cm−1 and 1514 cm−1 are attributed to C-C and N-H bending, respectively. Interestingly, the FTIR spectra of PUR/VermDex-10 foam composites (Figure 7b) are characterized by an additional band at 1074 cm−1, which is attributed to Si-O-Si.
It is considered that a chemical reaction has occurred between VermDex particles and the PUR matrix. However, no changes in the FTIR spectra of PUR/PerDex-10 (Figure 7a) are visible. The possible reaction of Dex-activated fillers and polyol with isocyanate is graphically presented in Figure 8. The graphical representation shows that Dex-activated fillers have hydroxyl groups incorporated on their surface, which, together with the hydroxyls from polyol, successfully react with an excess of isocyanate, thus forming urethane linkages with the incorporated fillers in PUR chains.
The statistical analysis of short-term water absorption of PUR foam composites with 2.5 wt.% different fillers showed (Figure 6a) that there are no differences between the PUR/Per-2.5, PUR/Verm-2.5, and PUR/VermDex-2.5 foam composites. The F-criterion is 0.066, p = 0.94, and R2 = 0.0216. However, a significant difference occurs between the aforementioned PUR foam composites and control PUR as well as PUR/Perdex-2.5. When comparing the PUR/PerDex-2.5 foam composite with the control PUR, the analysis showed that there is no difference between the average values of short-term water absorption. The F-criterion statistic is 0.31, p = 0.61, and R2 = 0.0714. Further, the statistical analysis of the short-term water absorption of PUR foam composites with 5 wt.% different fillers showed (Figure 6b) that there are no differences between the PUR/Per-5 and PUR/VermDex-5 foam composites. The F-criterion is 0.0, p = 1.0, and R2 = 0. Comparing PUR/Verm-5 and PUR-PerDex-5, the statistical analysis showed a statistically insignificant difference in the results. The F-criterion is 1.25, p = 0.33, and R2 = 0.238. However, significant differences were observed between PUR/Per-5 and PUR/VermDex-5 and PUR/Verm-5 and PUR/PerDex-5 foam composites. In addition, all PUR foam composites with 5 wt.% fillers had significant difference in short-term water absorption compared to control PUR. Moreover, the statistical analysis of the short-term water absorption of PUR foam composites with 7.5 wt.% different fillers showed (Figure 6c) that there are no differences between the PUR/Per-7.5 and PUR/Verm-7.5 foam composites. The F-criterion is 0.64, p = 0.47, and R2 = 0.138. Statistically significant differences were observed between PUR/Per-7.5 and PUR/Verm-7.5 and control PUR, PUR/PerDex-7.5, and PUR/VermDex-7.5. Lastly, the statistical analysis of the short-term water absorption of PUR foam composites with 10 wt.% different fillers showed (Figure 6d) that there were no differences between the PUR/Verm-10 and PUR/VermDex-10 foam composites. The F-criterion statistic is 0.10, p = 0.78, and R2 = 0.0244. When comparing the control PUR and PUR/Verm-10 and PUR/Vermdex-10 foam composites, the analysis showed that there was no difference between the mean values of short-term water absorption. The F-criterion is 0.39, p = 0.69, and R2 = 0.114. However, data processing showed that significant differences were obtained between control PUR, PUR/Verm-10, and PUR/VermDex-10 and PUR/Per-10 and PUR/PerDex-10.
Materials’ surface properties play a crucial role in various processes, including hydrophobicity. To determine the hydrophobic character of the PUR foam composites’ surface, water contact angle measurements were performed by the sessile drop method after 10 s (Figure 9).
According to the results given in Figure 9, as the Per filler concentration in PUR foam composites increased, the hydrophobic character of the composites increased only slightly, i.e., from 101° to 105° compared to the control PUR foam composite. Similarly, regarding water absorption results, the Verm filler-modified PUR foam composites still exhibited a hydrophobic character but with the lowest water contact angle among all fillers analyzed at a 10 wt.% concentration. Cetin et al. [30] demonstrated that Verm exhibits oleophilic behavior in flexible polyurethane foams, and its diesel contact angle decreases significantly with an increase in Verm concentration.
The surface activation of PerDex and VermDex fillers highly improved the hydrophobic character of the resulting surfaces of PUR foam composites. The water contact angle of PerDex filler-modified PUR foam composites increased to 103° and 106° at 5 wt.% and 10 wt.% PerDex, respectively, while for VermDex filler-modified PUR foam composites, it increased to 107° and 104° at 5 wt.% and 10 wt.% VermDex, respectively. The obtained tendency for water contact angle correlates with the water absorption results.

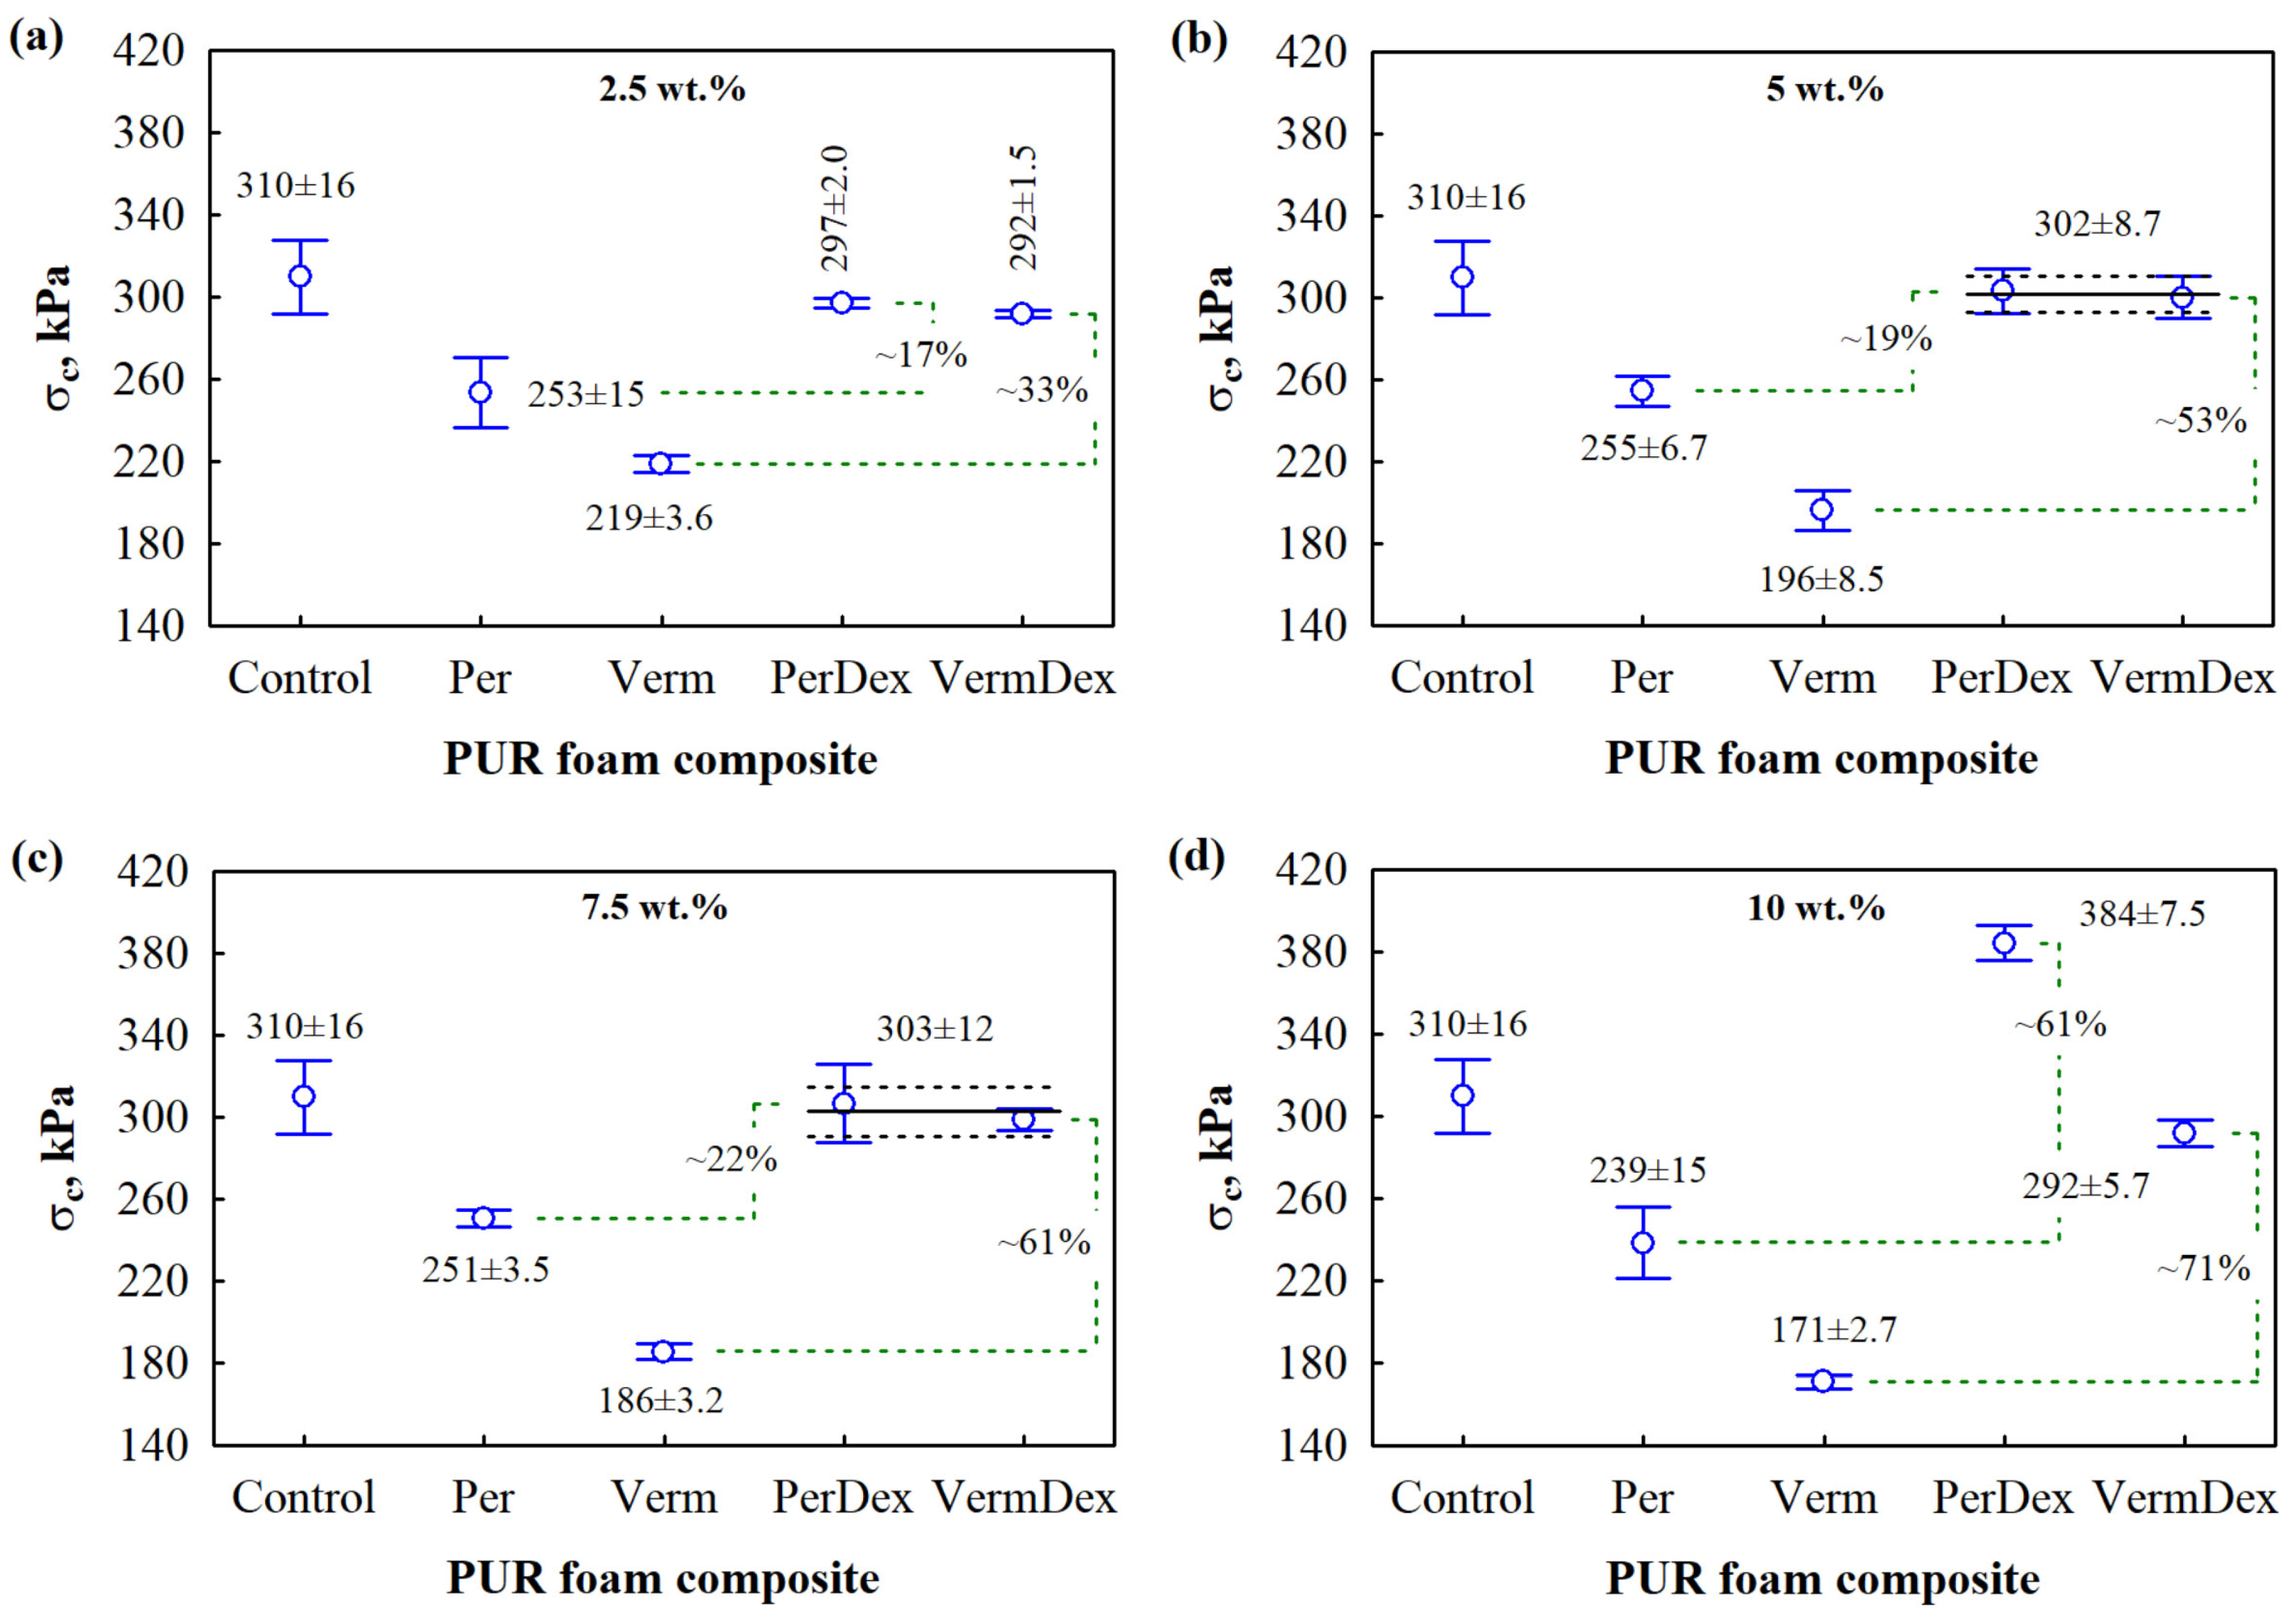
3.5. Mechanical Performance

The mechanical properties of thermal insulating PUR foams are crucial for their performance and longevity in various applications. While their primary function is thermal insulation, their ability to withstand mechanical stresses significantly impacts their effectiveness and suitability for specific uses. Therefore, Figure 10 and Figure 11 present the compressive and tensile strengths of control PUR foam and modified PUR foam composites.
It can be seen that PUR/Per and PUR/Verm foam composites with 2.5–10 wt.% filler exhibit lower compressive strength values compared to control PUR foam. For instance, 2.5 wt.% and 5 wt.% Per filler (Figure 10a,b) reduces the parameter by 18%, while the same concentration of Verm filler—by 30% and 37%, respectively. With the further addition of 7.5 wt.% and 10 wt.% Per filler (Figure 10c,d), the compressive strength also deteriorates by 19% and 23%, respectively. A similar tendency of the same Verm filler concentrations can also be observed; for example, the parameter reduces by 40% and 45%, respectively. However, Xia and Wang [64] determined that the addition of Verm at concentrations up to 10 wt.% increases the compressive strength of PUR/melamine phenol phosphate composite foams, indicating that the positive results are attributed to fillers’ insertion into the cell walls, which then strengthens the cellular matrix. The difference in the results obtained may be due to the size of the fillers used and the varying elasticity of the cellular morphology of PUR foam composites. Thinner cell walls and struts in PUR/Per and PUR/Verm foam composites (Table 3) provide fracture induction. As a result, less energy is absorbed, leading to cell buckling and irreversible damage [65]. Moreover, a decrease in compressive strength was observed in PUR foam composites filled with expandable graphite [66], which causes defects in the analyzed products.
The activation of Per and Verm fillers has a significant impact on the compressive strength of all PUR foam composites. Compared to PUR/Per and PUR/Verm foam composites, the maximum increase of 61% and 71% is shown by PUR/PerDex-10 and PUR/VermDex-10, respectively. However, only PUR/PerDex-10 has 24% greater compressive strength than control PUR foam. The positive interaction between Dex-activated fillers and PUR foam can be explained by the FTIR results, which show that hydroxyl groups from Dex form the linkages with silicates in Verm and Per, leading to a more stable and covalent attachment of Dex and anchoring points for attaching polymeric matrix. Therefore, an enhanced interfacial inorganic–organic interaction is observed. Similar conclusions have been drawn by Miedzińska et al. [38], who demonstrated that significant mechanical performance can be achieved by activating inorganic fillers with potato protein, chitosan, and casein.
The statistical analysis of compressive strength of PUR foam composites with 2.5 wt.% different fillers showed (Figure 10a) that there are differences between the averages of all PUR foam composites compared to the control PUR. The F-criterion is 42.0, p = 0, and R2 = 0.944. Further, the statistical analysis of the compressive strength of PUR foam composites with 5 wt.% different fillers showed (Figure 10b) that there are no differences between the PUR/PerDex-5 and PUR/VermDex-5 foam composites. The F-criterion statistic is 0.15, p = 0.72, and R2 = 0.356. When comparing the PUR/PerDex-5 and PUR/VermDex-5 foam composites with the control PUR, the analysis showed that there is no difference between the average values. The F-criterion statistic is 0.51, p = 0.63, and R2 = 0.145. Moreover, the statistical analysis of compressive strength of PUR foam composites with 7.5 wt.% different fillers showed (Figure 10c) that there were no differences between the PUR/PerDex-7.5 and PUR/VermDex-7.5 foam composites. The F-criterion is 0.57, p = 0.49, and R2 = 0.125. When comparing the PUR/PerDex-7.5 and PUR/VermDex-7.5 foam composites with the control PUR, the analysis showed that there is no difference between the average values. The F-criterion is 0.51, p = 0.63, and R2 = 0.146. However, the significant differences are observed between control PUR, PUR/PerDex-7.5, and PUR/VermDex-7.5 and PUR/Per-7.5 and PUR/Verm-7.5. Lastly, the statistical analysis of the compressive strength of PUR foam composites with 10 wt.% different fillers showed (Figure 10d) that there are significant differences between compressive strength of all PUR foam composites compared to the control PUR. The F-criterion is 164, p = 0, and R2 = 0.985.
Furthermore, Figure 11 presents the tensile strength results of control PUR foam and modified PUR foam composites.
For PUR/Per and PUR/Verm foam composites with filler concentrations of 2.5–5 wt.%, no significant changes in tensile strength are observed, indicating that these fillers do not deteriorate the parameter at lower concentrations. However, PUR/Per-7.5 and PUR/Per-10 foam composites showed a 25% and 22% decrease in tensile strength compared to the control PUR foam, while PUR/Verm-7.5 remained unchanged, and PUR/Verm-10 had a 5% higher tensile strength compared to the control PUR foam. It seems that Per filler has a higher negative impact on tensile properties. Additionally, both fillers were found to be inefficient under compression and tension loads.
However, different tendencies can be seen for PUR foam composites with Dex-activated Per and Verm particles. The highest tensile strength for PUR/PerDex foam composites is observed at a 2.5 wt.% PerDex concentration. The parameter increased by 34% compared to the control PUR foam, although further addition of PerDex filler deteriorated the parameter. However, compared to the control PUR foam, the tensile strength remains higher, up to 7.5 wt.% PerDex concentration. Smaller and more uniform cell sizes and wall thickness (Table 3) enhance tensile strength. A finer cellular structure provides a larger surface area for stress distribution, preventing localized failure. Such an effect is related to improved interfacial adhesion associated with the PerDex surface. Hejna et al. [67] reached a similar conclusion when modifying flexible polyurethane foam with potassium peroxide-oxidized tire rubber. Even though the cells of PUR/Per-10 foam composite are smaller, the destruction of microstructure at higher loading of PerDex filler takes place as indicated, as can be seen in Figure 5g. Therefore, a 22% reduction in tensile strength (Figure 11d) at 10 wt.% PerDex addition can be seen. Moreover, a slightly different conclusion can be made for PUR/VermDex foam composites. The tensile strength of these PUR foam composites at any loading of VermDex filler increased, and the highest parameter was 26% higher than that of the control PUR foam composite. The presence of Dex on the Verm surface might be creating stronger interactions with PUR chains. This enhances interaction and allows for more efficient stress transfer from the PUR matrix to stronger VermDex particles when the foam composite is under tensile stress.
The statistical analysis of the tensile strength of PUR foam composites with 2.5 wt.% different fillers showed (Figure 11a) that there are no differences between the PUR/Per-2.5, PUR/Verm-2.5, and PUR/VermDex-2.5 foam composites. The F-criterion is 0.49, p = 0.64, and R2 = 0.139. When comparing the PUR/Per-2.5, PUR/Verm-2.5, and PUR/VermDex-2.5 foam composites with the control PUR, the analysis showed that there is no difference between the average values of tensile strength. The F-criterion is 0.42, p = 0.74, and R2 = 0.136. Further, the statistical analysis of the tensile strength of PUR foam composites with 5 wt.% different fillers showed (Figure 11b) that there are no differences between the PUR/Per-5, PUR/Verm-5, PUR/PerDex-5, and PUR/VermDex-5 foam composites. The F-criterion statistic is 1.81, p = 0.22, and R2 = 0.404. When comparing the control PUR and PUR/Per-5, PUR/Verm-5, PUR/PerDex-5, and PUR/VermDex-5 foam composites, the statistical analysis showed a statistically insignificant difference in the results. The F-criterion statistic is 1.65, p = 0.24, and R2 = 0.398. Moreover, the statistical analysis of the tensile strength of PUR foam composites with 7.5 wt.% different fillers showed (Figure 11c) that there are no differences between the PUR/Verm-7.5 and PUR/PerDex-7.5 foam composites. The F-criterion is 0.45, p = 0.54, and R2 = 0.102. Comparing the PUR/Verm-7.5 and PUR/PerDex-7.5 foam composites with the control PUR, the analysis showed that there is no difference between the average values of tensile strength. The F-criterion is 0.15, p = 0.86, and R2 = 0.0474. However, a significant difference is observed between PUR/Per-7.5 and PUR/VermDex-7.5 and PUR/Verm-7.5 and PUR/PerDex-7.5. Lastly, the statistical analysis of the tensile strength of PUR foam composites with 10 wt.% different fillers showed (Figure 11d) that there are no differences between PUR/Per-10 and PUR/PerDex-10 foam composites. The F-criterion is 0.69, p = 0.45, and R2 = 0.148. Comparing the control PUR and PUR/Verm-10 foam composite, the analysis showed that there is no difference between the average values of tensile strength. The F-test is 0.73, p = 0.44, and R2 = 0.154. However, a significant difference is obtained between control PUR, PUR/Verm-10, and PUR/VermDex-10 and PUR/Per-10 and PUR/Verm-10.

4. Conclusions

The presented study aimed to research the impact of non-activated and Dex-activated Per and Verm fillers on the processing times, microstructure, thermal conductivity, water absorption, and strength properties of PUR foam composites. Applied activation resulted in the development of Per and Verm fillers’ surfaces containing hydroxyl groups.
Dex-activated Per and Verm fillers were introduced into a PUR matrix. The introduction of non-activated and Dex-activated fillers resulted in an elongation of processing times compared to control PUR foam premixes. Such an effect was primarily due to the increased viscosity of the resulting premixes caused by the introduction of solid particles. However, the surface activation with Dex caused a positive effect due to the availability of hydroxyl groups. Changes in processing times were reflected in the cellular structure of PUR foam composites.
For PUR/PerDex and PUR/VermDex foam composites, a typical increase in apparent density, closed cell content, wall thickness, and reduction in average cell size were observed. At the same time, Dex activation catalyzed the polymerization reaction compared to non-activated Per and Verm fillers. The quality of cellular structure directly affected the compressive and tensile strengths. Therefore, superior compressive strength was observed for PUR/PerDex and tensile strength for PUR/VermDex foam composites at 10 wt.% PerDex and VermDex loadings due to the changed surface interaction abilities of the Dex-activated fillers.
Regarding thermal conductivity, the maximum reduction in the parameter was achieved at 2.5 wt.% non-activated and Dex-activated fillers loadings. Considering water resistance, changes in the surface of Dex-activated Per and Verm fillers were reflected in the water absorption and contact angle properties of the PUR foam composites. Generally, the presented results indicate that the Dex activation of Per and Verm surface results in the formation of Dex–Si–O–Si–Dex linkages, which inhibit the filler’s participation in further reaction with isocyanate to form the strong interface between filler particles and polymer matrix. Such an effect resulted in reduced water absorption and increased water contact angles.

Author Contributions

Conceptualization, A.K.; methodology, A.K.; software, A.L.; validation, A.K. and A.L.; formal analysis, A.K.; investigation, A.K. and A.L.; resources, A.K.; data curation, A.K. and A.L.; writing—original draft preparation, A.K. and A.L.; writing—review and editing, A.K. and A.L.; visualization, A.L.; supervision, A.K.; funding acquisition, A.K. All authors have read and agreed to the published version of the manuscript.

Funding

This research received no external funding.

Institutional Review Board Statement

Not applicable.

Informed Consent Statement

Not applicable.

Data Availability Statement

All the data obtained is presented within the article.

Conflicts of Interest

The authors declare no conflicts of interest.

Abbreviations

The following abbreviations are used in this manuscript:
PURRigid polyurethane foam
DexDextrin
VermExpanded vermiculite
PerExpanded perlite
VermDexDextrin-activated expanded vermiculite
PerDexDextrin-activated expanded perlite

References

  1. Cheng, C.; Zhu, Z.; Wang, M.; Li, J.; Sun, H.; Jiao, R.; Li, A. Enhanced flame retardancy and thermal insulation of flexible polyurethane foam decorated with DMMP-loaded CuO hollow spheres. Colloids Surf. A Physicochem. Eng. Asp. 2025, 718, 136961. [Google Scholar] [CrossRef]
  2. Mendija, L.C.C.; Dingcong, R.G., Jr.; Alfeche, F.L.A.M.; Al-Moameri, H.H.; Dumancas, G.G.; Tan, N.P.B.; Malaluan, R.M.; Alguno, A.C.; Lubguban, A.A. Elucidating the Impact of Polyol Functional Moieties on Exothermic Poly(urethane-urea) Polymerization: A Thermo-Kinetic Simulation Approach. Sustainability 2024, 16, 4587. [Google Scholar] [CrossRef]
  3. Mouren, A.; Avérous, L. Sustainable cycloaliphatic polyurethanes: From synthesis to applications. Chem. Soc. Rev. 2023, 52, 277–317. [Google Scholar] [CrossRef]
  4. Malucelli, G. Flame retardant surface treatments for rigid polyurethane foams used in the building sector: Current state-of-the-art and perspectives. Constr. Build. Mater. 2025, 472, 140947. [Google Scholar] [CrossRef]
  5. Chen, M.; Yuan, Y.; Wang, W.; Xu, L. Recent Advances in Flame-Retardant Flexible Polyurethane Foams. Fire 2025, 8, 90. [Google Scholar] [CrossRef]
  6. Polyurethane Market. Available online: https://www.marketsandmarkets.com (accessed on 21 March 2025).
  7. Zhang, Y.; Li, P.; Sun, S. Biopolyol synthesis via ring-opening of epoxidized soybean oil with glycerol utilizing a novel sulfonic-functionalized ionic liquid as the catalyst at low temperature. Ind. Crops Prod. 2024, 222, 119546. [Google Scholar] [CrossRef]
  8. Li, G.-Z.; Wang, Q.; Zhu, C.; Zhang, S.; Wang, F.; Tao, L.; Jiang, Y.; Zhang, Q.; Wang, W.; Han, R. Synthesis and Performance of Epoxy-Terminated Hyperbranched Polymers Based on Epoxidized Soybean Oil. Molecules 2025, 30, 583. [Google Scholar] [CrossRef]
  9. Gurgel, D.; Bresolin, D.; Sayer, C.; Filho, L.C.; de Araújo, P.H.H. Flexible polyurethane foams produced from industrial residues and castor oil. Ind. Crops Prod. 2021, 164, 113377. [Google Scholar] [CrossRef]
  10. Ciastowicz, Ż.; Pamuła, R.; Bobak, Ł.; Białowiec, A. Characterization of Vegetable Oils for Direct Use in Polyurethane-Based Adhesives: Physicochemical and Compatibility Assessment. Materials 2025, 18, 918. [Google Scholar] [CrossRef]
  11. Mekarat, S.; Suwan, A.; Chaisit, T.; Thongseenuch, S.; Saetung, A.; Saetung, N. Synthesis of palm oil-based bio-polyol by thiol-ene reaction: Preliminary study of its potential as cationic waterborne polyurethane for coating application. Prog. Org. Coat. 2024, 194, 108586. [Google Scholar] [CrossRef]
  12. Palaczek, K.; Kurańska, M.; Auguścik-Królikowska, M.; Prociak, A.; Ryszkowska, J. Open-cell polyurethane foams of very low density modified with various palm oil-based bio-polyols in accordance with cleaner production. J. Clean. Prod. 2021, 290, 125875. [Google Scholar] [CrossRef]
  13. Abolins, A.; Eihe, D.; Pomilovskis, R.; Fridrihsone, A.; Kirpluks, M. Rapeseed oil as feedstock for the polymeric materials via Michael addition reaction. Ind. Crops Prod. 2023, 204, 117367. [Google Scholar] [CrossRef]
  14. Aydoğmuş, E.; Kamişli, F. New commercial polyurethane synthesized with biopolyol obtained from canola oil: Optimization, characterization, and thermophysical properties. J. Mol. Struct. 2022, 1256, 132495. [Google Scholar] [CrossRef]
  15. Czifrák, K.; Lakatos, C.; Cserháti, C.; Vecsei, G.; Zsuga, M.; Kéki, S. Bio-Based Polyurethane Networks Containing Sunflower Oil Based Polyols. Int. J. Mol. Sci. 2024, 25, 7300. [Google Scholar] [CrossRef]
  16. Suthar, V.; Asare, M.A.; de Souza, F.M.; Gupta, R.K. Effect of Graphene Oxide and Reduced Graphene Oxide on the Properties of Sunflower Oil-Based Polyurethane Films. Polymers 2022, 14, 4974. [Google Scholar] [CrossRef]
  17. Polaczek, K.; Kurańska, M.; Prociak, A. Open-cell bio-polyurethane foams based on bio-polyols from used cooking oil. J. Clean. Prod. 2022, 359, 132107. [Google Scholar] [CrossRef]
  18. Olivito, F.; Jagdale, P.; Oza, G. Direct Production of Furfural from Fructose Catalyzed by Iron(III) Sulfate Using a Simple Distillation Apparatus. ACS Sustain. Chem. Eng. 2023, 11, 17595–17599. [Google Scholar] [CrossRef]
  19. Jang, J.Y.; Byun, Y.; You, S.; Kim, S.; Lee, D.-M.; Kim, S.-W.; Son, S.U. Polyurethanes Synthesized Using Biomass-derived Furan Diols as Sustainable Triboelectric Materials. Chem. Commun. 2024, 60, 9741–9744. [Google Scholar] [CrossRef]
  20. Chang, H.; Gilcher, E.B.; Huber, G.W.; Dumesic, J.A. Synthesis of performance-advantaged polyurethanes and polyesters from biomass-derived monomers by aldol-condensation of 5-hydroxymethyl furfural and hydrogenation. Green Chem. 2021, 23, 4355–4364. [Google Scholar] [CrossRef]
  21. Torresi, S.; Calvo-Correas, T.; Basasoro, S.; Guaresti, O.; Alonso-Varona, A.; Gabilondo, N.; Eceiza, A. Furan-containing biobased polyurethane nanofibers: A new versatile and green support clickable via Diels-Alder reaction. React. Funct. Polym. 2022, 178, 105353. [Google Scholar] [CrossRef]
  22. Skoczinski, P.; Cangahuala, M.K.E.; Maniar, D.; Albach, R.W.; Bittner, N.; Loos, K. Biocatalytic Synthesis of Furan-Based Oligomer Diols with Enhanced End-Group Fidelity. ACS Sustain. Chem. Eng. 2020, 8, 1068–1086. [Google Scholar] [CrossRef]
  23. Kurańska, M.; Pinto, J.A.; Salach, K.; Barreiro, M.F.; Prociak, A. Synthesis of thermal insulating polyurethane foams from lignin and rapeseed based polyols: A comparative study. Ind. Crops Prod. 2020, 143, 111882. [Google Scholar] [CrossRef]
  24. Tan, S.; Abraham, T.; Ference, D.; MacOsko, C.W. Rigid polyurethane foams from a soybean oil-based polyol. Polymer 2011, 52, 2840–2846. [Google Scholar] [CrossRef]
  25. Kurańska, M.; Marcovich, N.E.; Prociak, A.; Malewska, E.; Kulpa, K. Open cell semi-rigid polyurethane foams synthesized using palmoil-based bio-polyol. Ind. Crops Prod. 2017, 102, 88–96. [Google Scholar]
  26. Valipour, F.; Dehghan, S.F.; Hajizadeh, R. The effect of nano- and microfillers on thermal properties of Polyurethane foam. Int. J. Environ. Sci. Technol. 2022, 19, 541–552. [Google Scholar] [CrossRef]
  27. Wang, H.; Li, T.-T.; Ren, H.; Peng, H.; Huang, S.-Y.; Lin, Q.; Lin, J.-H.; Lou, C.-W. Expanded Vermiculite-Filled Polyurethane Foam-Core Bionic Composites: Preparation and Thermal, Compression, and Dynamic Cushion Properties. Polymers 2019, 11, 1028. [Google Scholar] [CrossRef]
  28. Ai, M.; Cao, L.; Zhao, X.; Xiang, Z.; Guo, X. Preparation and Characterization of Polyurethane Rigid Foam/Expanded Perlite Thermal Insulation Composites. Adv. Mater. Res. 2010, 96, 141–144. [Google Scholar] [CrossRef]
  29. Barczewski, M.; Kurańska, M.; Sałasińska, K.; Aniśko, J.; Szulc, J.; Szafraniak-Wiza, I.; Prociak, A.; Polaczek, K.; Uram, K.; Surmacz, K.; et al. Comprehensive Analysis of the Influence of Expanded Vermiculite on the Foaming Process and Selected Properties of Composite Rigid Polyurethane Foams. Polymers 2022, 14, 4967. [Google Scholar] [CrossRef]
  30. Cetin, M.S.; Toprakci, O.; Taskin, O.S.; Aksu, A.; Toprakci, H.A.K. Expanded vermiculite-filled flexible polymer composites. J. Elastomers Plast. 2022, 54, 145–168. [Google Scholar] [CrossRef]
  31. Jaworska, B.; Stańczak, D.; Łukowski, P. The Influence of Waste Perlite Powder on Selected Mechanical Properties of Polymer–Cement Composites. Buildings 2024, 14, 181. [Google Scholar] [CrossRef]
  32. Szadkowski, B.; Marzec, A.; Rybiński, P.; Żukowski, W.; Zaborski, M. Characterization of Ethylene–propylene Composites Filled with Perlite and Vermiculite Minerals: Mechanical, Barrier, and Flammability Properties. Materials 2020, 13, 585. [Google Scholar] [CrossRef]
  33. Erdem, R. Uses of Vermiculite and Perlite in FireRetardant Textile Applications. Fash. Technol. 2023, 8, 000691. [Google Scholar]
  34. Lanzón, M.; Castellón, F.J.; Ayala, M. Effect of the expanded perlite dose on the fire performance of gypsum plasters. Constr. Build. Mater. 2022, 346, 128494. [Google Scholar] [CrossRef]
  35. Joseph, E.J.; Akshayraj, V.R.; Panneerselvam, K. Surface modification of tungsten fillers for application in polymer matrix composites. Mater. Today Proc. 2021, 45, 7930–7933. [Google Scholar] [CrossRef]
  36. Hu, Y.; Liu, Y.; Zheng, S.; Kang, W. Progress in Application of Silane Coupling Agent for Clay Modification to Flame Retardant Polymer. Molecules 2024, 29, 4143. [Google Scholar] [CrossRef]
  37. Li, H.; Song, S.-I.; Jang, K.-S. The Role of Surface Treatment and Coupling Agents for Adhesion between Stainless Steel (SUS) and Polyamide (PA) of Heterojunction Bilayer Composites. Polymers 2024, 16, 896. [Google Scholar] [CrossRef]
  38. Miedzińska, K.; Członka, S.; Strąkowska, A.; Strzelec, K. Vermiculite Filler Modified with Casein, Chitosan, and Potato Protein as a Flame Retardant for Polyurethane Foams. Int. J. Mol. Sci. 2021, 22, 10825. [Google Scholar] [CrossRef]
  39. Członka, S.; Kairytė, A.; Miedzińska, K.; Strąkowska, A. Casein/Apricot Filler in the Production of Flame-Retardant Polyurethane Composites. Materials 2021, 14, 3620. [Google Scholar] [CrossRef]
  40. Wang, W.; Wang, D.; Xia, B.; Li, T.; Wang, Y.; Zhang, X.; Bai, H.; Chen, M.; Dong, W. Rigid polyurethane foams based on dextrin and glycerol. Ind. Crops Prod. 2022, 177, 114479. [Google Scholar] [CrossRef]
  41. Ivdre, A.; Abolins, A.; Sevastyanova, I.; Kirpluks, M.; Cabulis, U.; Merijs-Meri, R. Rigid Polyurethane Foams with Various Isocyanate Indices Based on Polyols from Rapeseed Oil and Waste PET. Polymers 2020, 12, 738. [Google Scholar] [CrossRef]
  42. EN 14315-1; Thermal Insulating Products for Buildings—In-Situ Formed Sprayed Rigid Polyurethane (PUR) and Polyisocyanurate (PIR) Foam Products—Part 1: Specification for the Rigid Foam Spray System before Installation. European Standardization Committee: Brussels, Belgium, 2013.
  43. ISO 4590; Rigid Cellular Plastics—Determination of the Volume Percentage of Open Cells and of Closed Cells. International Standardization Organization: Geneva, Switzerland, 2016.
  44. EN 12667; Thermal Performance of Building Materials and Products—Determination of Thermal Resistance by Means of Guarded Hot Plate and Heat Flow Meter Methods—Products of High and Medium Thermal Resistance. European Standardization Committee: Brussels, Belgium, 2001.
  45. ISO 29767; Thermal Insulating Products for Building Applications—Determination of Short-Term Water Absorption by Partial Immersion. International Standardization Organization: Geneva, Switzerland, 2019.
  46. EN 1607; Thermal Insulating Products for Building Applications—Determination of Tensile Strength Perpendicular to Faces. European Standardization Committee: Brussels, Belgium, 2013.
  47. ISO 29469; Thermal Insulating Products for Building Applications—Determination of Compression Behaviour. International Standardization Organization: Geneva, Switzerland, 2022.
  48. Sakr, H.; Ammar, A.; Zaki, H.; Salama, M.A.; Ali, M. Impact of ball milling on physicochemical, structural, and functional properties of Moringa oleifera L. leaf powders. J. Food Meas. Charact. 2023, 18, 320–330. [Google Scholar] [CrossRef]
  49. Saufi, H.; El Alouani, M.; Alehyen, S.; El Achouri, M.; Aride, J.; Taibi, M. Photocatalytic Degradation of Methylene Blue from Aqueous Medium onto Perlite-Based Geopolymer. Int. J. Chem. Eng. 2020, 2020, 9498349. [Google Scholar] [CrossRef]
  50. Lee, W.K.W.; van Deventer, J.S.J. Use of Infrared Spectroscopy to Study Geopolymerization of Heterogeneous Amorphous Aluminosilicates. Langmuir 2003, 19, 8726–8734. [Google Scholar] [CrossRef]
  51. Tran, L.; Wu, P.; Zhu, Y.; Yang, L.; Zhu, N. Highly enhanced adsorption for the removal of Hg(II) from aqueous solution by Mercaptoethylamine/Mercaptopropyltrimethoxysilane functionalized vermiculites. J. Colloid Interface Sci. 2015, 445, 348–356. [Google Scholar] [CrossRef]
  52. Duman, O.; Tunç, S.; Polat, T.G. Determination of adsorptive properties of expanded vermiculite for the removal of C.I. Basic Red 9 from aqueous solution: Kinetic, isotherm and thermodynamic studies. Appl. Clay Sci. 2015, 109, 22–32. [Google Scholar] [CrossRef]
  53. Salih, S.S.; Kadhom, M.; Shihab, M.A.; Ghosh, T.K. Competitive Adsorption of Pb(II) and Phenol Onto Modified Chitosan/Vermiculite Adsorbents. J. Polym. Environ. 2022, 30, 4238–4251. [Google Scholar] [CrossRef]
  54. Mamiński, M.Ł.; Więcław-Midor, A.; Parzuchowski, P.G. The Effect of Silica-Filler on Polyurethane Adhesives Based on Renewable Resource for Wood Bonding. Polymers 2020, 12, 2177. [Google Scholar] [CrossRef]
  55. Sari, Y.; Utama, A.H.; Irawan, A.; Andiana, P.; Faradila, R.; Manab, A.; Radiati, L.E. Optimizing Dextrin Levels for Enhanced Physicochemical Properties and Microstructure of Sumbawa Mare’s Milk Powder. Adv. Anim. Vet. Sci. 2025, 13, 431–439. [Google Scholar] [CrossRef]
  56. Arai, Y.; Tomai, T.; Seong, G.; Ito, R.; Yoko, A.; Adschiri, T. Unified formulation of particle-size-dependent viscosity for Newtonian dispersions of micro- and nanoparticles. J. Mol. Liq. 2024, 411, 125659. [Google Scholar] [CrossRef]
  57. Dorokhov, A.S.; Goncharova, Y.A.; Sviridov, A.S.; Tuzhilin, S.P.; Alekhina, R.A. Measurement of the Dynamic Viscosity of Filled Composites on the Basis of Thermosetting Cast Polyurethane. Theor. Found. Chem. Eng. 2023, 57, 1116–1119. [Google Scholar] [CrossRef]
  58. Gama, N.V.; Amaral, C.; Silva, T.; Vicente, R.; Coutinho, J.A.P.; Barros-Timmons, A.; Ferreira, A. Thermal Energy Storage and Mechanical Performance of Crude Glycerol Polyurethane Composite Foams Containing Phase Change Materials and Expandable Graphite. Materials 2018, 11, 1896. [Google Scholar] [CrossRef]
  59. Lee, D.I.; Ha, Y.H.; Jeon, H.; Kim, S.H. Preparation and Properties of Polyurethane Composite Foams with Silica-Based Fillers. Appl. Sci. 2022, 12, 7418. [Google Scholar] [CrossRef]
  60. Soloveva, O.V.; Solovev, S.A.; Vankov, Y.V.; Shakurova, R.Z. Experimental Studies of the Effective Thermal Conductivity of Polyurethane Foams with Different Morphologies. Processes 2022, 10, 2257. [Google Scholar] [CrossRef]
  61. Vijayaraghavan, K.; Raja, F.D. Experimental characterisation and evaluation of perlite as a sorbent for heavy metal ions in single and quaternary solutions. J. Water Process Eng. 2014, 4, 179–184. [Google Scholar] [CrossRef]
  62. Marcos, C. Effect of Water Immersion on Raw and Expanded Ugandan Vermiculite. Minerals 2022, 12, 23. [Google Scholar] [CrossRef]
  63. Assis Neto, P.C.D.; Sales, L.P.B.; Oliveira, P.K.S.; Silva, I.C.D.; Barros, I.M.D.S.; Nóbrega, A.F.D.; Carneiro, A.M.P. Expanded Vermiculite: A Short Review about Its Production, Characteristics, and Effects on the Properties of Lightweight Mortars. Buildings 2023, 13, 823. [Google Scholar] [CrossRef]
  64. Xia, Z.; Wang, Z. Rigid polyurethane/expanded vermiculite/melamine phenylphosphate composite foams with good flame retardant and mechanical properties. e-Polymers 2019, 19, 563–573. [Google Scholar] [CrossRef]
  65. Członka, S.; Bertino, M.F.; Strzelec, K.; Strąkowska, A.; Masłowski, M. Rigid polyurethane foams reinforced with solid waste generated in leather industry. Polym. Test. 2018, 69, 225–237. [Google Scholar] [CrossRef]
  66. de Souza, F.M.; Choi, J.; Bhoyate, S.; Kahol, P.K.; Gupta, R.K. Expendable Graphite as an Efficient Flame-Retardant for Novel Partial Bio-Based Rigid Polyurethane Foams. J. Carbon Res. 2020, 6, 27. [Google Scholar] [CrossRef]
  67. Hejna, A.; Olszewski, A.; Zedler, Ł.; Kosmela, P.; Formela, K. The Impact of Ground Tire Rubber Oxidation with H2O2 and KMnO4 on the Structure and Performance of Flexible Polyurethane/Ground Tire Rubber Composite Foams. Materials 2021, 14, 499. [Google Scholar] [CrossRef]
Figure 1. Optical images and granulometry of fillers: (a,b) Per; (c,d) Verm; (e,f) PerDex, and (g,h) VermDex.
Applsci 15 06604 g001
Figure 2. FTIR spectra of fillers: (a) Dex, Per, and PerDex (red circle indicate C-H stretching) and (b) Dex, Verm, and VermDex.
Applsci 15 06604 g002
Figure 3. Proposed Verm and Per particles activation with Dex.
Applsci 15 06604 g003
Figure 4. Comparison of thermal conductivity of PUR foam composites with different fillers at (a) 2.5 wt.%; (b) 5 wt.%; (c) 7.5 wt.%, and (d) 10 wt.%.
Applsci 15 06604 g004aApplsci 15 06604 g004b
Figure 5. Optical imaging of PUR foam composites’ microstructure at x80 magnification: (a) control PUR foam; (b) PUR/Per-5; (c) PUR/Per-10; (d) PUR/Verm-5; (e) PUR/Verm-10; (f) PUR/PerDex-5; (g) PUR/PerDex-10; (h) PUR/VermDex-5; and (i) PUR/VermDex-10.
Applsci 15 06604 g005
Figure 6. Comparison of short-term water absorption by partial immersion of PUR foam composites with different fillers at (a) 2.5 wt.%; (b) 5 wt.%; (c) 7.5 wt.%; and (d) 10 wt.%.
Applsci 15 06604 g006
Figure 7. FTIR spectra of PUR foam composites with (a) Per and PerDex and (b) Verm and VermDex.
Applsci 15 06604 g007
Figure 8. Graphical representation of PUR foam composites production.
Applsci 15 06604 g008
Figure 9. The water contact angle of PUR foam composites with different fillers at 5 wt.% and 10 wt.% concentrations.
Applsci 15 06604 g009
Figure 10. Compressive strength of PUR foam composites with different fillers at (a) 2.5 wt.%; (b) 5 wt.%; (c) 7.5 wt.%; and (d) 10 wt.%.
Applsci 15 06604 g010
Figure 11. Tensile strength of PUR foam composites with different fillers at (a) 2.5 wt.%; (b) 5 wt.%; (c) 7.5 wt.%; and (d) 10 wt.%.
Applsci 15 06604 g011
Table 1. Composition of polyurethane foam composites with fillers.
ComponentAmount of Component, pbw
Control PURPUR-VermPUR-PerPUR-VermDexPUR-PerDex
Component A:
BioPolyol RD6060606060
ROKOPOL RF-152 V6060606060
Water33333
Polycat 90.70.70.70.70.7
ST-523.63.63.63.63.6
Filler, wt.%02.5; 5; 7.5; 102.5; 5; 7.5; 102.5; 5; 7.5; 102.5; 5; 7.5; 10
Component B:
IsocyanateIsocyanate index for all compositions—125
Table 2. Reaction kinetics of control and fillers modified premixes.
PremixParameter
Cream Time, sGel Time, sTack-Free Time, sDynamic Viscosity, mPa·s
Control PUR20 ± 276 ± 2102 ± 4521 ± 10
PUR/Per-2.529 ± 2114 ± 4156 ± 31456 ± 15
PUR/Per-522 ± 2110 ± 2159 ± 23875 ± 20
PUR/Per-7.519 ± 3104 ± 2162 ± 328,699 ± 25
PUR/Per-1016 ± 296 ± 3164 ± 350,987 ± 18
PUR/Verm-2.528 ± 1107 ± 2140 ± 22350 ± 14
PUR/Verm-524 ± 2100 ± 3165 ± 27172 ± 10
PUR/Verm-7.521 ± 294 ± 3197 ± 334,569 ± 15
PUR/Verm-1018 ± 2140 ± 3237 ± 359,230 ± 19
PUR/PerDex-2.531 ± 3112 ± 2160 ± 3988 ± 21
PUR/PerDex-526 ± 2110 ± 1174 ± 21798 ± 18
PUR/PerDex-7.520 ± 3110 ± 2181 ± 32230 ± 16
PUR/PerDex-1016 ± 2109 ± 2189 ± 43042 ± 19
PUR/VermDex-2.530 ± 299 ± 2179 ± 3652 ± 5
PUR/VermDex-528 ± 398 ± 3184 ± 21153 ± 15
PUR/VermDex-7.523 ± 295 ± 2189 ± 41690 ± 12
PUR/VermDex-1020 ± 394 ± 2195 ± 22742 ± 20
Table 3. Structural parameters of PUR foam composites.
PUR Foam CompositeParameter
Apparent Density, kg/m3Closed Cell Content, vol.%Cell Size, mmWall Thickness, μm
Control PUR43.7 ± 494.4 ± 0.521.32 ± 0.12177 ± 5
PUR/Per-2.544.5 ± 394.9 ± 0.630.812 ± 0.11100 ± 4
PUR/Per-547.4 ± 595.4 ± 0.550.618 ± 0.1288.6 ± 6
PUR/Per-7.547.6 ± 297.3 ± 0.420.725 ± 0.1074.5 ± 6
PUR/Per-1047.4 ± 394.6 ± 0.440.837 ± 0.1665.5 ± 2
PUR/Verm-2.545.7 ± 594.0 ± 0.220.882 ± 0.1476.7 ± 6
PUR/Verm-544.9 ± 491.4 ± 0.260.703 ± 0.1971.6 ± 4
PUR/Verm-7.546.8 ± 391.6 ± 0.380.754 ± 0.1365.3 ± 3
PUR/Verm-1052.3 ± 291.2 ± 0.440.772 ± 0.1262.7 ± 5
PUR/PerDex-2.549.4 ± 497.6 ± 0.621.12 ± 0.22138 ± 6
PUR/PerDex-552.3 ± 597.3 ± 0.510.780 ± 0.14155 ± 4
PUR/PerDex-7.556.4 ± 597.9 ± 0.380.623 ± 0.16168 ± 3
PUR/PerDex-1063.7 ± 497.0 ± 0.490.592 ± 0.12185 ± 6
PUR/VermDex-2.548.0 ± 396.1 ± 0.291.01 ± 0.23113 ± 4
PUR/VermDex-551.0 ± 298.0 ± 0.490.795 ± 0.14115 ± 3
PUR/VermDex-7.556.4 ± 394.4 ± 0.640.832 ± 0.16119 ± 4
PUR/VermDex-1059.8 ± 294.2 ± 0.580.865 ± 0.17119 ± 3
Disclaimer/Publisher’s Note: The statements, opinions and data contained in all publications are solely those of the individual author(s) and contributor(s) and not of MDPI and/or the editor(s). MDPI and/or the editor(s) disclaim responsibility for any injury to people or property resulting from any ideas, methods, instructions or products referred to in the content.

