Next Article in Journal
Syllable-, Bigram-, and Morphology-Driven Pseudoword Generation in Greek
Previous Article in Journal
Conventional and Innovative Methods for Reducing the Incidence of Listeria monocytogenes in Milk and Dairy Products
 
 
Due to scheduled maintenance work on our database systems, there may be short service disruptions on this website between 10:00 and 11:00 CEST on June 14th.
Article

Physical Model Research on the Impact of Bridge Piers on River Flow in Parallel Bridge Construction Projects

1
School of Water Conservancy, North China University of Water Resources and Electric Power, Zhengzhou 450046, China
2
Shandong Yellow River Survey and Design Research Institute Co., Ltd., Jinan 250013, China
3
Shandong Yellow River Conservancy Commission, Jinan 250013, China
*
Author to whom correspondence should be addressed.
Appl. Sci. 2025, 15(12), 6581; https://doi.org/10.3390/app15126581
Submission received: 21 April 2025 / Revised: 6 June 2025 / Accepted: 7 June 2025 / Published: 11 June 2025

Abstract

:
In response to the growing demand for improved operational efficiency in road and bridge networks, constructing parallel bridges in complex river sections has become a crucial strategy. This study focuses on a parallel bridge construction project in the Jinan section of the lower Yellow River, conducting physical model tests to investigate the unique aspects of the impacts of different pier shapes and spans on the flow characteristics of sediment-laden rivers under real-world engineering scenarios. The experimental results demonstrate that the hydraulic physical model of this river section that was constructed is reliable, with a relative error of <20% in sediment deposition, in the simulation of sediment erosion and deposition, flow velocity patterns, water levels, and riverbed morphological changes during parallel bridge construction in bridge-clustered river sections. The newly constructed bridges have a limited influence on the overall regime of this river section, with their impacts on both banks remaining within controllable limits, and the river flow remains largely stable. In areas with denser pier arrangements, the phenomenon of backwater upstream of the bridges is more pronounced, and under characteristic flood conditions, the newly built bridges amplify the water level differences between the upstream and downstream sections near the bridge sites. The ranges of influence of the water level drop downstream of the bridges increase, particularly in the main flow areas. Flow velocities generally increase in the main channel, while significant fluctuations are observed in the floodplain areas. Flood process experiments reveal that the slope at the junction between the main channel and the floodplain becomes gentler, with noticeable scouring occurring in the main channel. After flood events, the river tends to evolve toward a U-shaped channel, posing certain safety risks to the piers located at the junction of the floodplains and the main channel. This research methodology can serve as a reference for studying flow characteristics in similar parallel bridge construction projects in river sections, and the findings hold significant implications for practical engineering.

1. Introduction

With the expanding scale of urbanization-related construction in China, the construction of groups of bridges across rivers is increasing, and the number of bridges within urban river channels is increasing, resulting in serious pressure on each river’s flooding cross-section, resulting in greater backwater and uneven flow velocity distribution, affecting the two banks of the embankment, the upstream water resource infrastructures, and the surrounding city’s flood control and drainage safety [1]. In these scenarios, multiple bridges are densely arranged in the river. The pier types, sizes, quantities, and layouts are complex and changeable; this especially affects the parallel construction of bridges, as it is prone to produce the superposition effect of waterback. This phenomenon causes higher channel water levels, weakening the river’s flood discharge capacity, and then has an additional impact on the riverbed [2,3,4]. As early as the 19th and 20th centuries, scholars from various regions around the world conducted analyses and research on bridge pier backwaters. In 1922, the German scientist Rehbock and, in 1934, the American scientist Yarnell carried out extensive physical model experiments on bridge backwater, proposing empirical formulas for bridge pier backwater. At present, river simulation research mainly involves river model tests, numerical simulations, and empirical calculations, as well as other methods [5]; the physical model test is one of the important means used to predict the movements of water, sand, and sediment, and the evolution of the riverbed in natural conditions and after building hydraulic structures. Especially in some three-dimensional problems, theoretical calculations can be very difficult, and observations made in the method of a model test can be more effective [6].
Numerous domestic and international studies have been conducted by scholars and engineers on the simulation of river flow characteristics during concurrent bridge construction. These investigations primarily focus on the effects of merging bridges on river flow dynamics, the methodologies and techniques of simulations, and the ecological preservation of river channels, encompassing a wide array of disciplines, including hydrology and hydraulic engineering. In recent years, an increasing number of scholars have utilized numerical simulation methods in order to study river hydrodynamics [7]. The MIKE ZERO 2014 software was employed to simulate flow conditions before and after engineering projects. Wang conducted numerical simulations on the flow field and sediment erosion–deposition characteristics of the bridge cluster section in Yixian County along the Daling River before and after bridge construction, with the research results providing references for flood control in the river section [8]. Wu et al. constructed a two-dimensional comprehensive mathematical model of the water-related effects of a bridge group in the Qinhuai New River and evaluated the superimposed obstruction effect of the bridge group under different horological conditions on the flood discharge capacity of the river [9]. Li et al. used a two-dimensional hydrodynamic model to investigate the transformation of hydrodynamic characteristics such as waterback height and flow velocity during the construction of bridge clusters in a plain river channel and clarified the relationships between these changes and the number and spacing of the bridges [10]. Yu et al. took the special bridge of the Lunan High-Speed Railway that crossed the Yi River as a case study and explored the potential influence of the layout of large-span bridge piers on the flow patterns of the river [11]. In addition to studying the impacts of cross-river bridge projects with relatively small spans, numerical modeling has also been applied to the Yangtze River, Asia’s longest river and the world’s third-largest river by water discharge. Chen et al. conducted a comprehensive study on the unique river segments located in the middle and lower reaches of the Yangtze River. He analyzed the impacts of bridge structures on critical parameters, including flood levels and water velocities within the river channel, taking into account the specific characteristics of these segments. Furthermore, he explored the effects of these influences and their patterns of evolution [12]. Jiang investigated the role of bridges on hydrodynamic characteristics in a curved river environment using physical modeling tests. After analyzing the waterback law caused by a single bridge [13], Lou et al. applied this theory analogously to a side-by-side two-bridge scenario and derived a new law of the backwater effect [14]. Wang et al. and others have systematically compared and verified the existing formulas for calculating the backwater height of bridge abutments with the actual hydraulic model test data [15].
Many foreign scholars have conducted extensive research on the effects of bridge construction on river channels by using diverse methodologies. Bahram et al. performed a comprehensive numerical simulation to analyze the characteristics of water flow around bridge abutments in a composite river environment [16]. Galip et al., in their study on the pier backwater effect, derived a set of general formulas for pier backwater [17]. Richardson and Panchang focused on the dynamics of water flow in the vicinity of bridge abutments caused by scour and performed three-dimensional numerical simulations [18].
Nevertheless, research on the simulating river engineering models to facilitate the parallel bridge construction in river sections remains scarce. Most studies have concentrated on evaluating the impact of water-related constructions for individual bridges or symmetrical parallel pier setups [19,20,21,22]. However, research methodologies for parallel bridge constructions characterized by diverse pier shapes and spans remain inadequately explored. In simulation studies examining parallel bridge construction with diverse pier spans and shapes, numerical simulation potentially presents the benefit of reduced modeling expenses; however, its scientific validity and practical applicability still require verification. This research employs physical modeling tests, which accurately reflect the real-world conditions of engineering construction. This research aims to examine the degree of backwater upstream of the bridge, the intensity of downstream scouring, and the collapse of beach lips in the bridge area post-construction. Additionally, experimental investigations are carried out on hydraulic parameters such as flow field patterns, water level variations, and river regime trends to explore the key factors influencing riverbank evolution around bridge clusters.

2. Materials and Methods
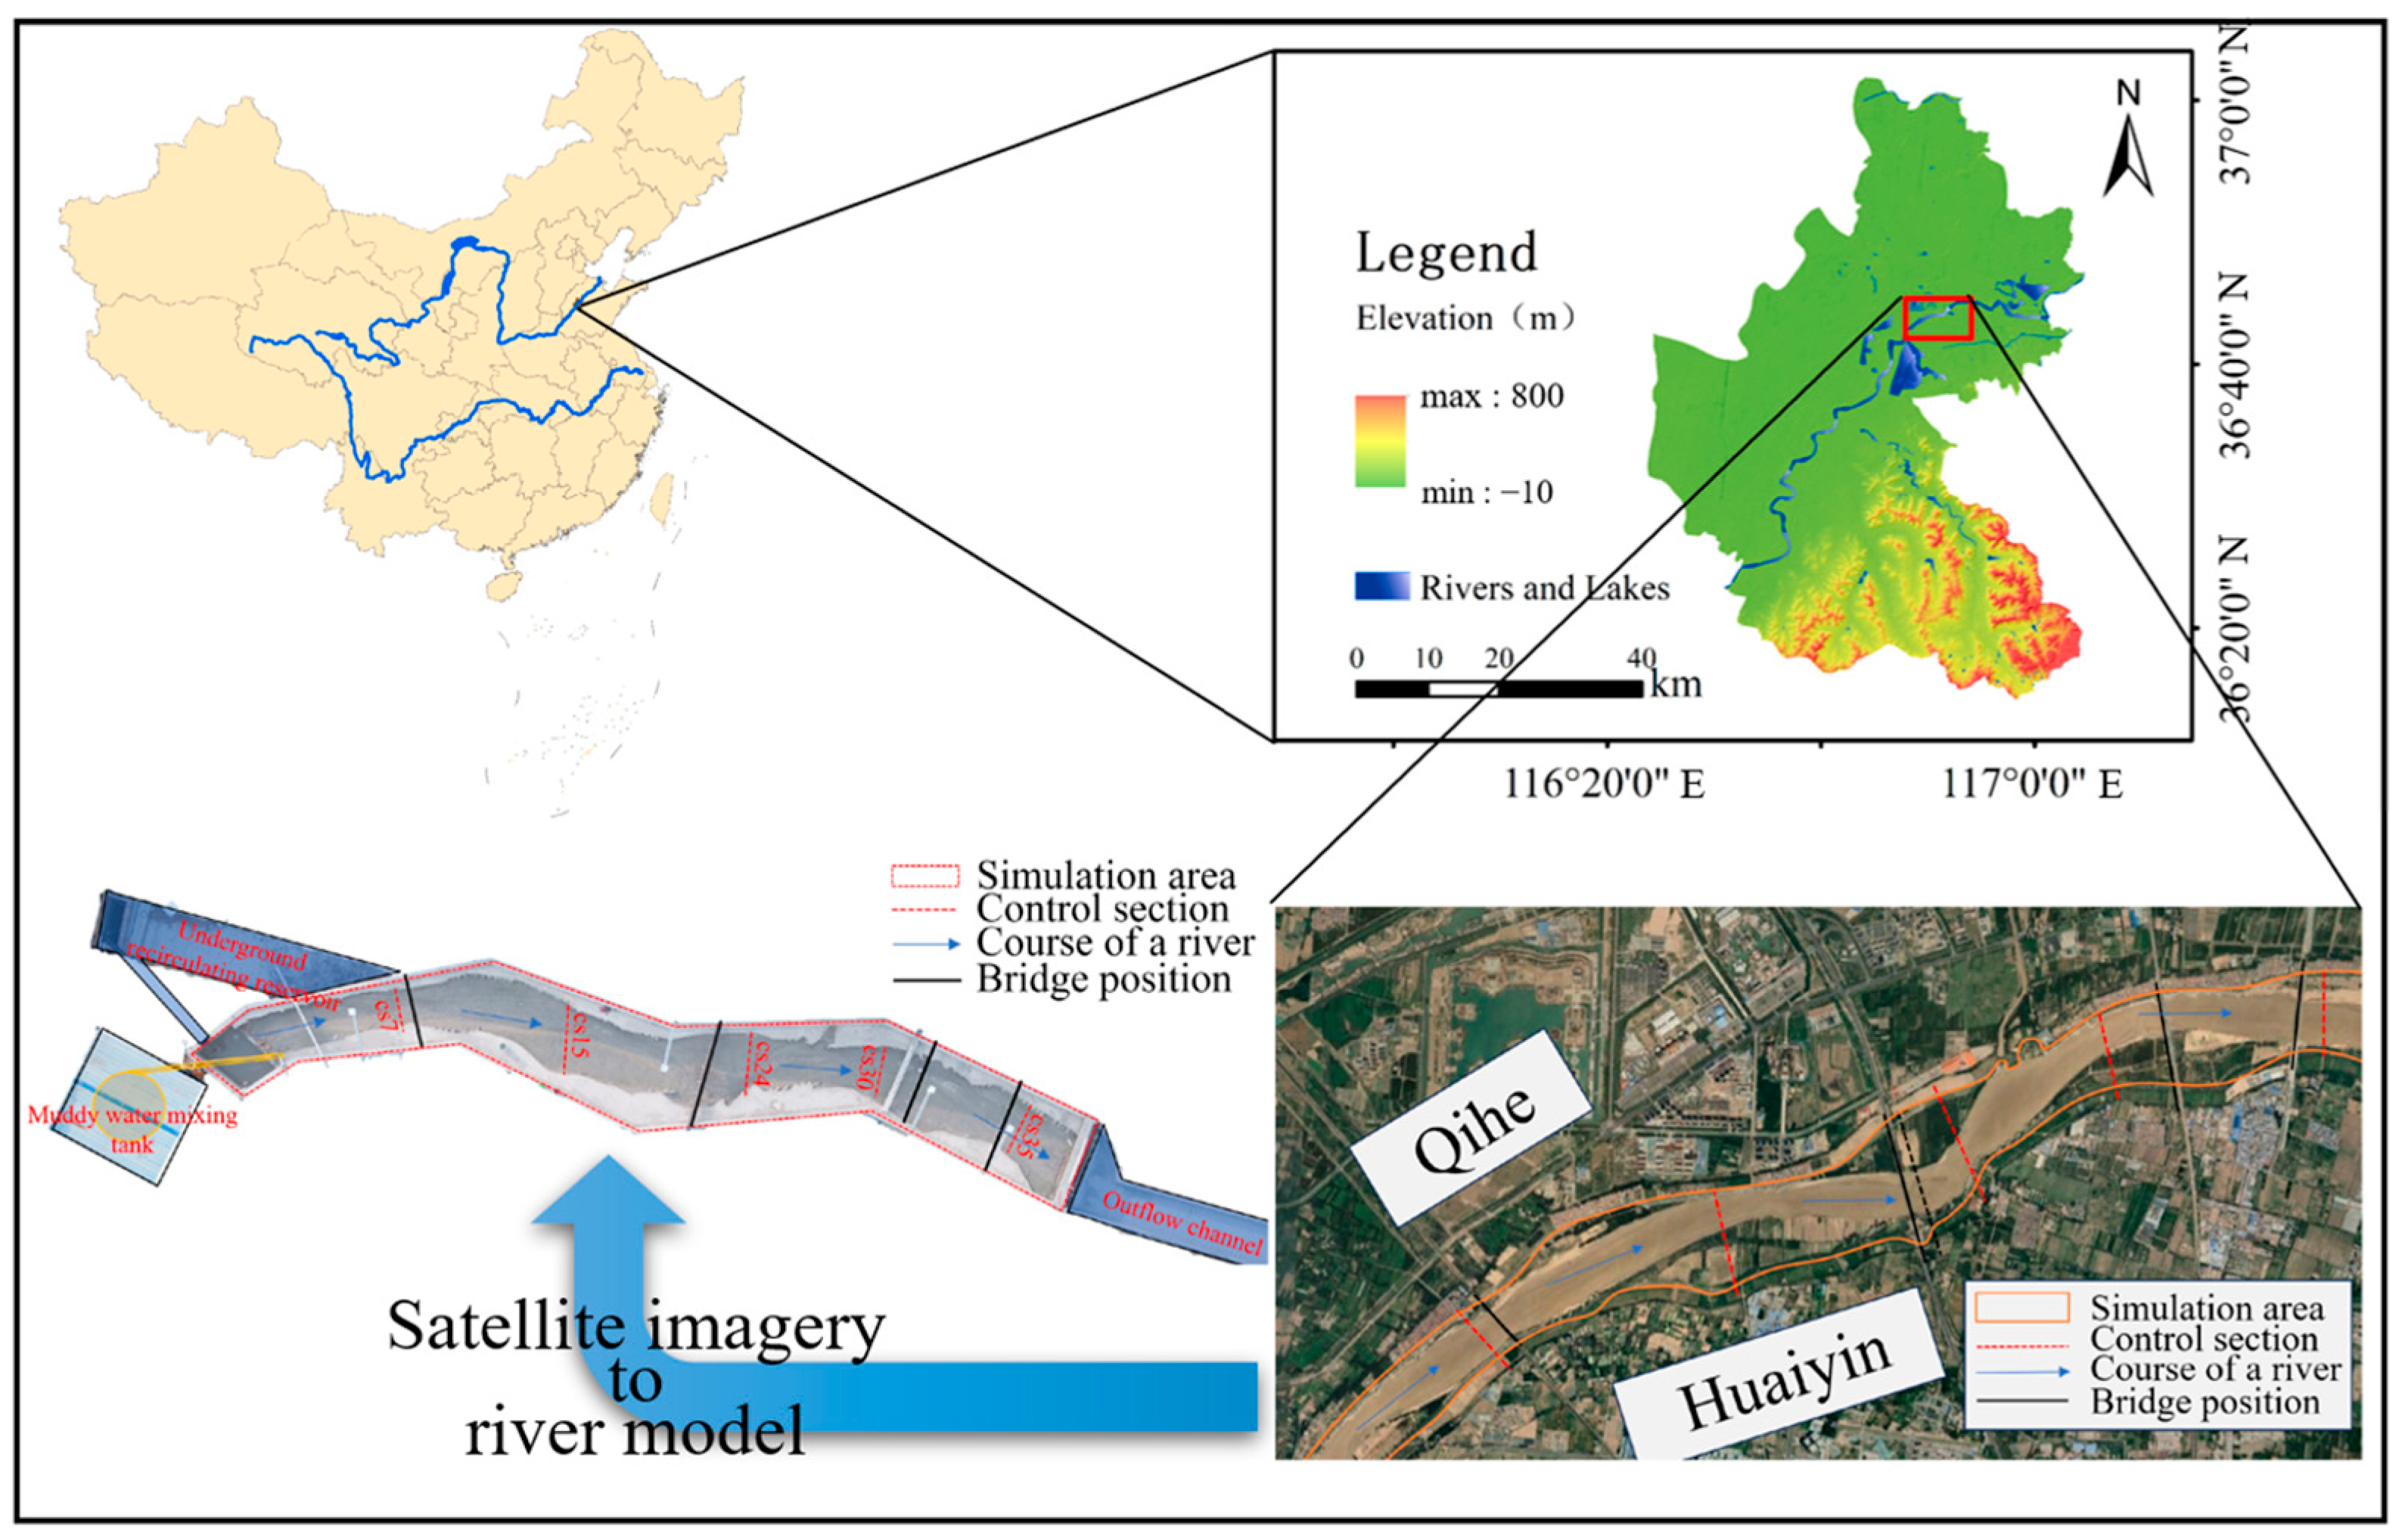
2.1. Study Reaches

The mainstream flow of the Yellow River enters the urban area of Jinan at Qinghemen in Pingyin County. This study focuses on the lower reaches of the Yellow River in Dezhou City and Jinan City, extending from west to east, from Qihe County in the north to Tianqiao District in the east, and Huaiyin District in the south. The study area and physical model layout are shown in Figure 1. By combining the topographic and hydrological data of the study area to establish a physical model, the flow direction of the physical model shown in Figure 1 from left to right represents the upstream to downstream of the river. The water flows into the model reservoir through a tailwater tank, with the yellow area at the left end serving as the sediment-laden flow pipeline, collectively forming the water and sediment supply conditions for the physical model.

2.2. Overview of Typical Projects

This paper concentrates on the Jingtai Expressway Yellow River Bridge, with the Beidianzi water level station located 6.6 km upstream and the Lokou hydrological station 14.2 km downstream. Additionally, the Caojiaquan Railway Bridge is located 4 km upstream, whereas the Jing-Hu High-Speed Railway Yellow River Bridge and the Qilu Avenue Yellow River Bridge are situated 3.1 km and 4.3 km downstream, respectively, creating a relatively dense cluster of bridges. Detailed information regarding these bridges, specifically their once-in-a-century flood frequency, is presented in Table 1.
According to the implementation plan of the renovation project, “Reconstruction and Expansion Project” in the river channel, including a total of 5 piers, the old and new bridge spans are combined with the layout of the program section, as shown in Figure 2. Downstream of the old bridge abutments, 5 new bridge abutments are set up. The old bridge’s 116# and 117# main abutments have no new abutments constructed, while the new bridge abutments are aligned with the old bridges 109#, 111#, 113#, and 115#, as well as the 118# abutment axis alignment (along the direction of the water flow) and the 118# piers axis alignment (along the direction of water flow).

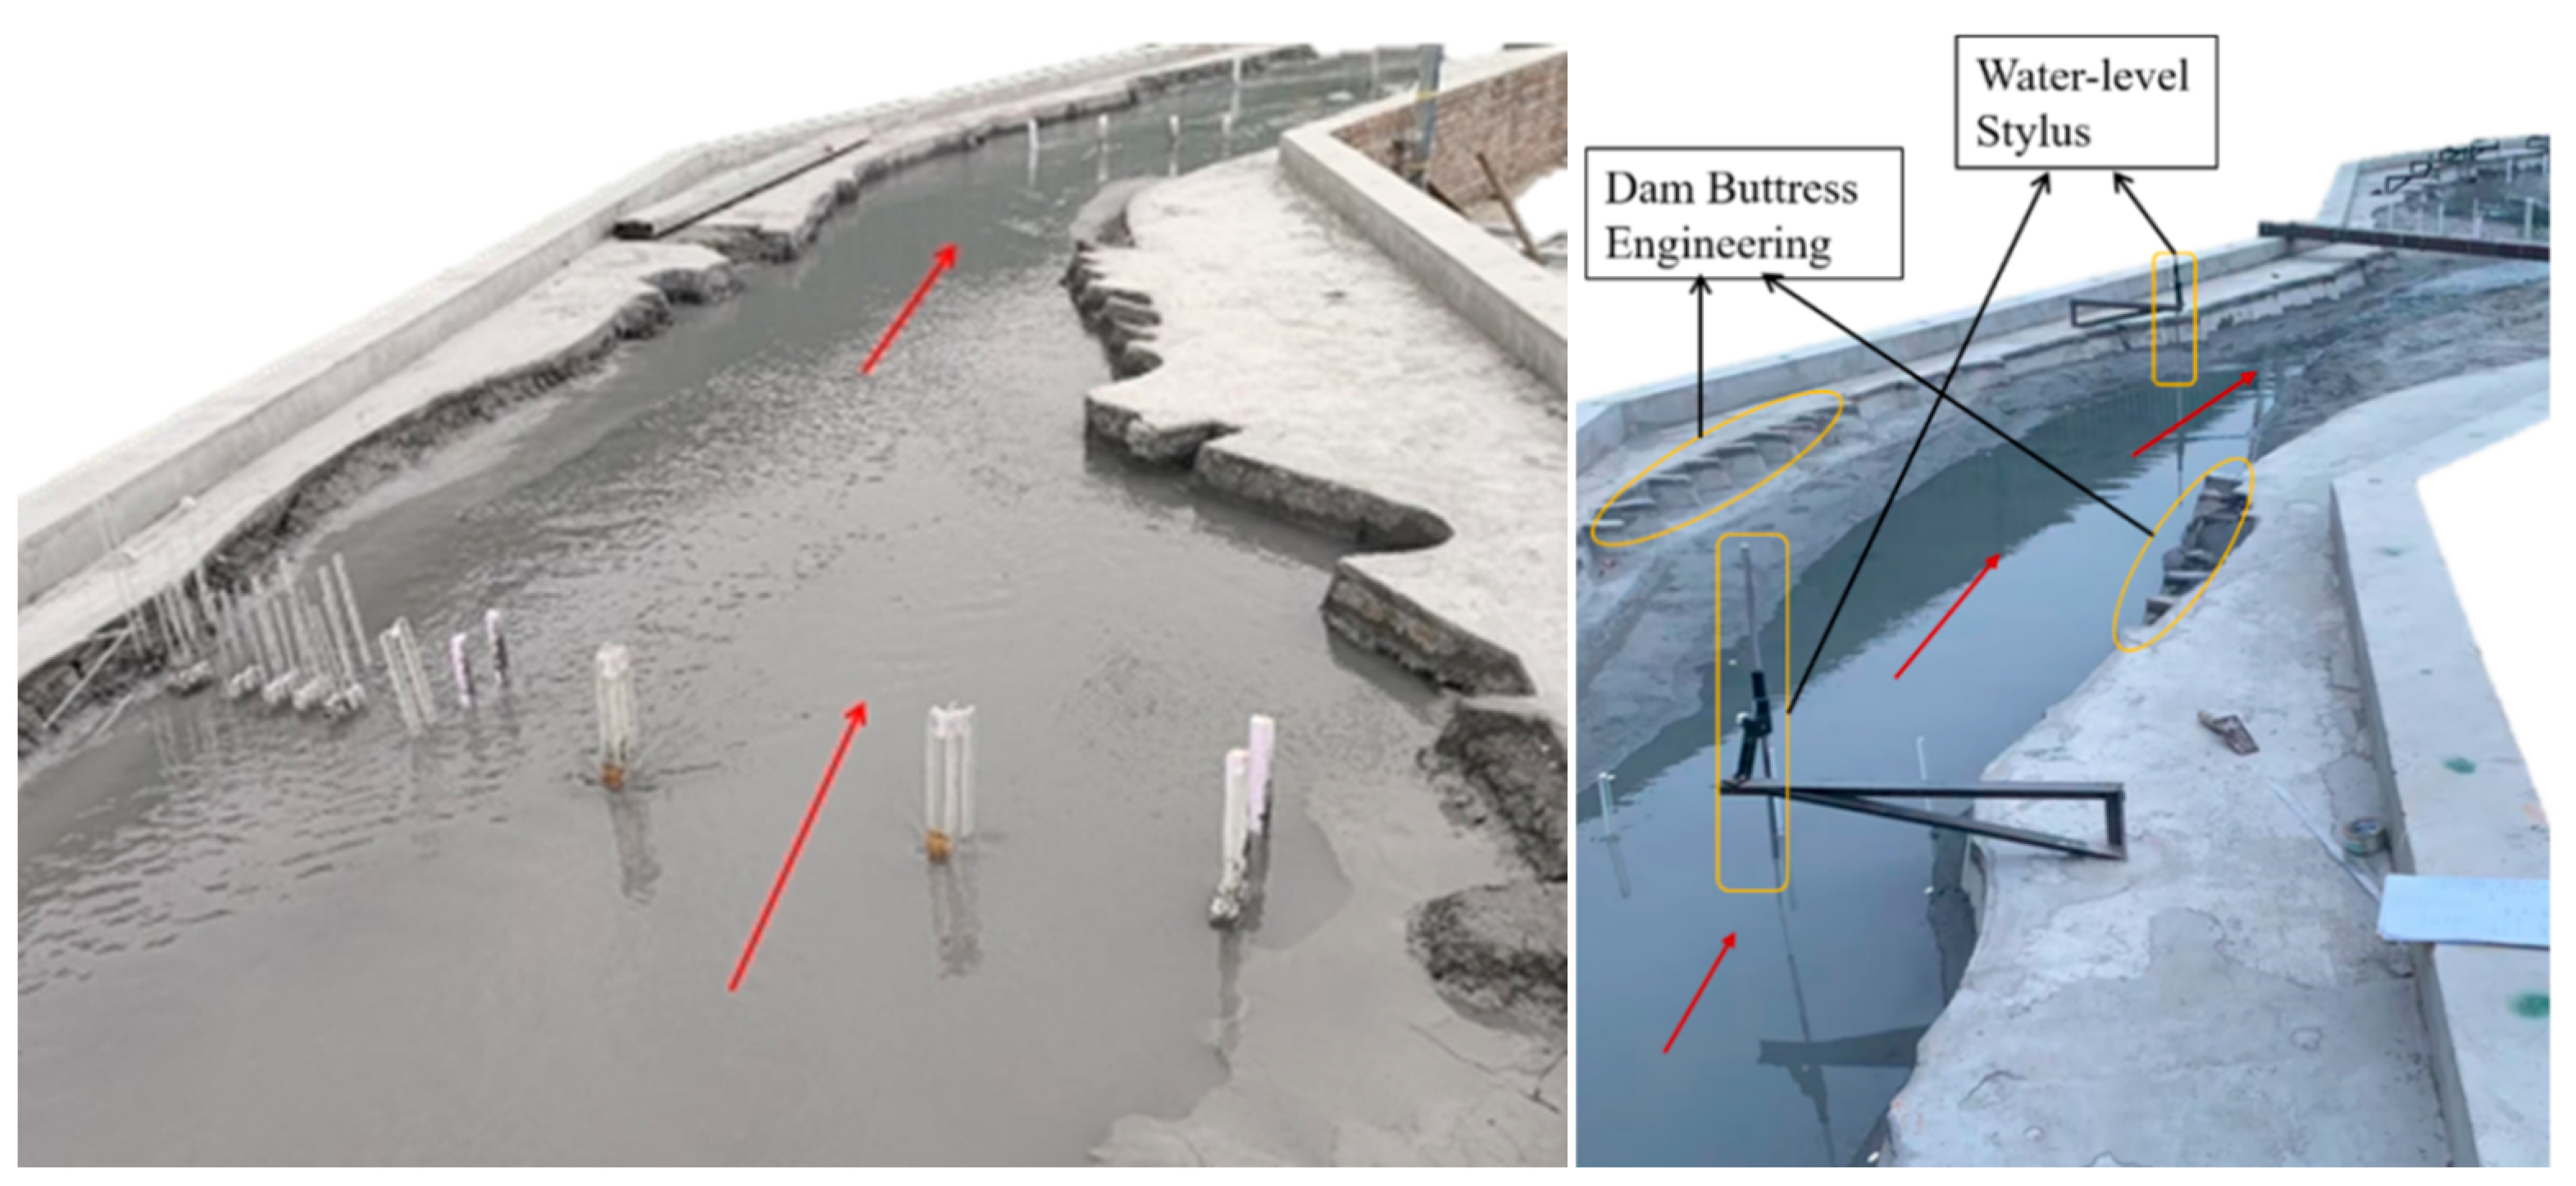
2.3. Research Methodology

This article is based on the 1:10,000 topographic map of the downstream bridge group in Jinan in 2021 to construct a physical model of the river section of the bridge group. The initial riverbed shape and embankment construction of the model are made using the elevation and riverbank engineering layout data from the topographic map. The study employs a moving-bed modeling test to examine these changes before and after the Jingtai Re-expansion Project. Furthermore, this paper examines the distribution of water levels and flow velocities across a typical river channel cross-section under diverse operational scenarios. A comparative analysis is undertaken to evaluate the distribution patterns of water levels and flow velocities under these varied conditions. Based on the insights gained from the modeling tests, this paper offers several practical engineering recommendations that possess both practical application value and academic research relevance.

2.4. Similarity Criterion and Control Scale

The river engineering model tests play an irreplaceable and important role in the practice of Yellow River control. Due to the existence of the special problem of Yellow River sediment, it is necessary to use the moving-bed river engineering model for scientific simulation. The simulation range of the research river section is from 1.8 km upstream of the Caojiaquan Railway Bridge to 1.1 km downstream of the Zhengjiadian Big Section, and the total length of the simulation area is 11.2 km (Figure 3). The test adopts the Distorted River Hydraulic Model, with a horizontal scale of 300 and a vertical scale of 60; it follows the gravity similarity and drag similarity criteria, taking into account the laws of sediment movement to determine the main control scale of the model. In the movable-bed model test, the measured median diameter of bed sediment in the Yellow River in Jinan, Shandong, is 0.123 mm. Additionally, the measured median diameter of prototype sediment in suspension ranges from 0.05 mm to 0.06 mm, with a bulk density of 2.65 t/m3. Through comprehensive consideration and previous experimental studies on the lower reaches of the Yellow River [23], selecting 150-mesh Class F fly ash as the model bed sediment and 400-mesh Class F fly ash as the model suspended sediment basically meets the sediment selection requirements for this experiment. Scouring and silting changes in the Yellow River’s lower reaches are mainly caused by suspended sediment. The grain size scale in the model test mainly controls the similarity of suspended sediment grain size while also taking into account the evolution of the riverbed. The model uses the same material to simulate suspended sediment and bedload. After a comparative analysis of natural sand, fly ash, resin ion material, and plastic sand, it was found that natural sand requires finer particles to simulate suspended sediment, which can easily form flocculation and affect the accuracy of the simulation; resin ion material and plastic sand are difficult to simulate riverbed features, especially steep slopes and collapses; while fly ash is easy to obtain and can accurately simulate topographic shaping and riverbed evolution. Therefore, this paper chose fly ash as the model sand.
In this experimental study, the flow movement in the river reach is dominated by gravity, satisfying the Froude criterion; meanwhile, the similarity of turbulent flow resistance should also be considered. The relevant scale ratios for the model design are determined based on the following similarity conditions:
F l o w   g r a v i t y   s i m i l a r i t y   c o n d i t i o n :   λ V = λ H 1 2
F l o w   r e s i s t a n c e   s i m i l a r i t y   c o n d i t i o n :   λ n = 1 λ V λ H 2 3 λ J 1 2 = λ H 2 3 λ L 1 2
Similarity condition of sediment-laden flow: λ s = λ s *
S e d i m e n t   s u s p e n s i o n   s i m i l a r i t y   c o n d i t i o n :   λ ω = λ V λ H λ L m
S i m i l a r i t y   c o n d i t i o n s   f o r   s e d i m e n t   i n c i p i e n t   m o t i o n :   λ v = λ v c
S i m i l a r i t y   c o n d i t i o n s   f o r   b e d   d e f o r m a t i o n   c a u s e d   b y   a   s u s p e n d e d   l o a d :   λ t 2 = λ γ 0 λ L λ s λ V
In the above equations, λ L is the horizontal scale ratio, λ H represents the vertical scale ratio, λ J denotes the slope scale ratio, λ V indicates the flow velocity scale ratio; λ v C is the sediment incipient velocity scale ratio, λ ω represents the sediment settling velocity scale ratio, λ n denotes the roughness scale ratio, λ s indicates the sediment concentration scale ratio, λ s * represents the sediment carrying capacity scale ratio, λ t 2 denotes the bed deformation time scale ratio, and λ γ 0 indicates the unit weight scale ratio.
According to Zhang Hongwu’s formula for the sediment settling scale and Stokes’ settling formula [24], the grain size scale for suspended sediment was determined as 1.24. The model layout is shown in Figure 4. The specific model test scale is shown in Table 2 below.

3. Results

3.1. Validation of the River Engineering Model

The repeatability of movable-bed sediment-laden river model tests is crucial. To ensure the repeatability and accuracy of the experiments, this study implemented a series of measures. The terrain was created using a longitudinal profile control template with intermittent sections to ensure that the initial riverbed morphology was consistent and accurate for each simulation. Initial riverbed topographic conditions were precisely controlled and recorded, and the sediment concentration was accurately controlled by using two pipes: one for drawing water from a sediment-laden mixing pool and the other for clear water. The inflow of water and sediment was regulated according to a generalized flood sequence table to ensure the accuracy of the sediment concentration at the upstream entrance.
Throughout the experiment, all repeated tests utilized consistent high-precision calibrated measuring instruments, and the model was validated using the measured pre-flood and post-flood data from the river section in 2021.
(1)
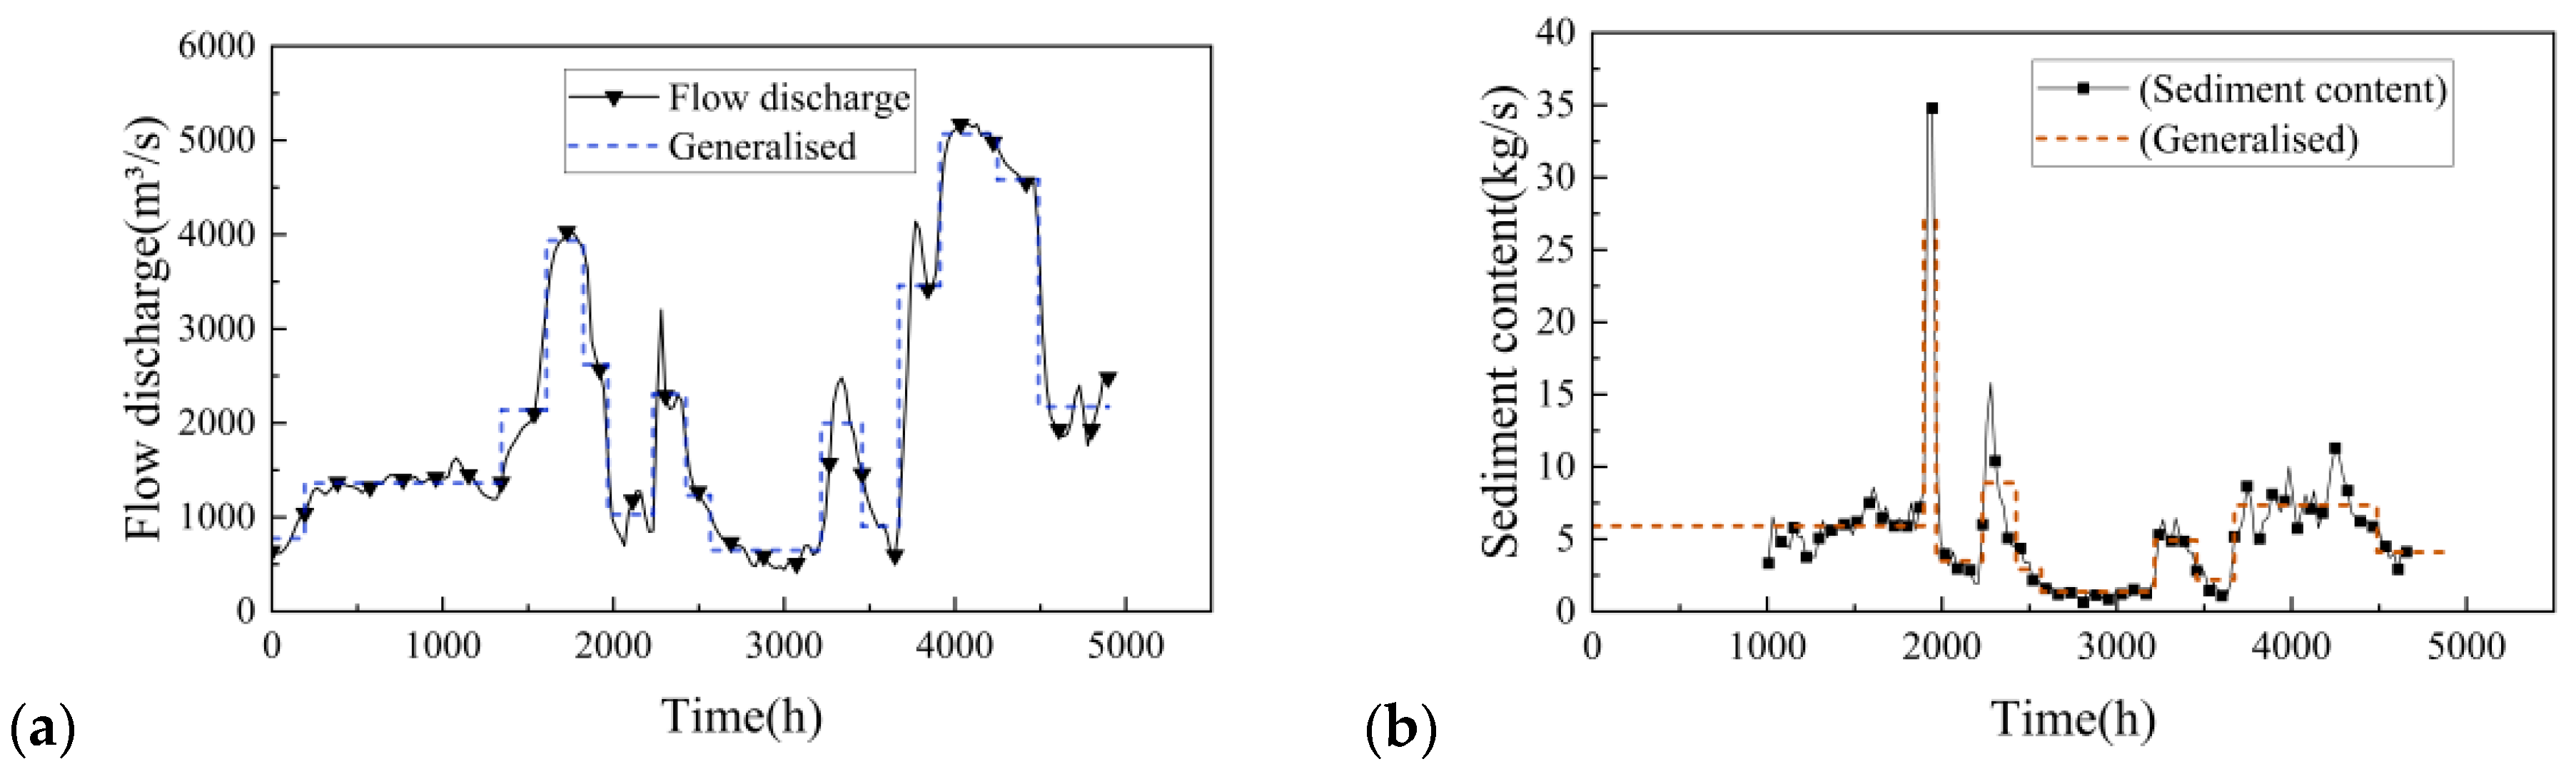
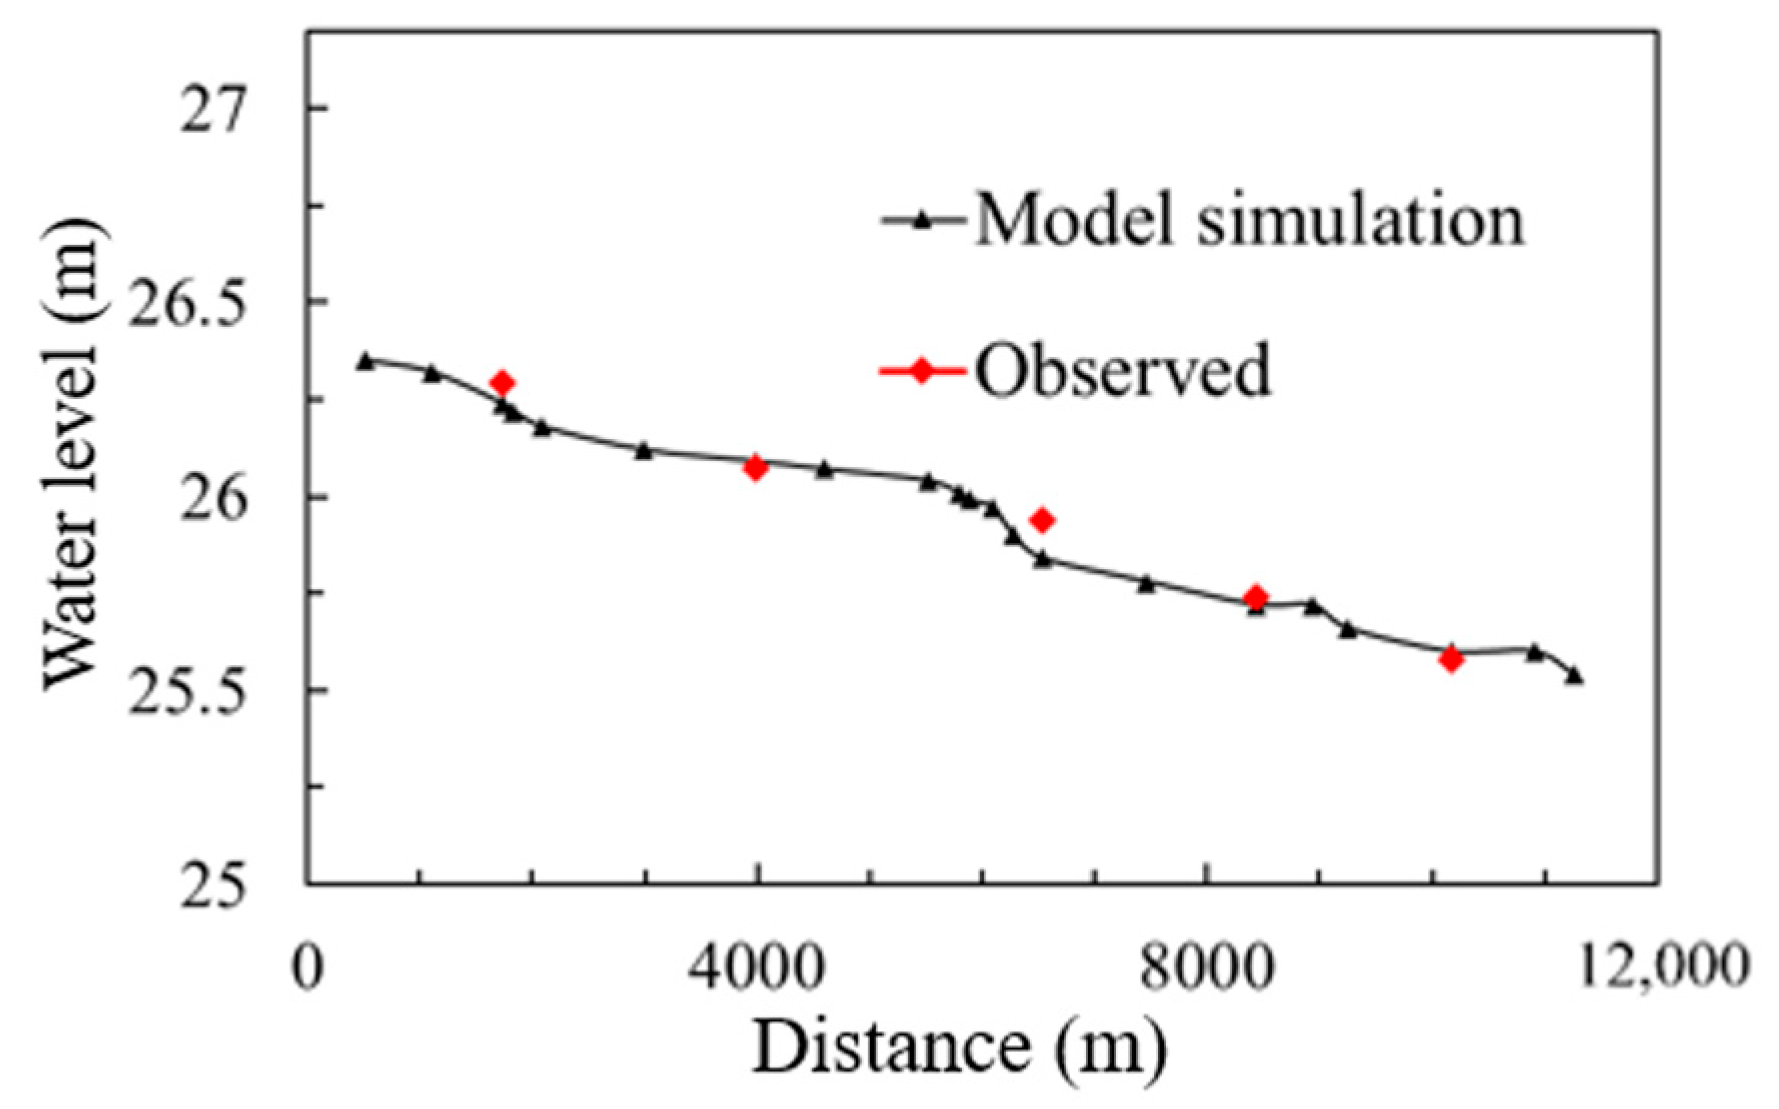
Validation of hydrodynamic drag similarity: The test used the measured pre-flood topography of the test river section in April 2021 as the initial topographic data, the water and sand process from April to October 2021 as the test water and sand process (Figure 3), and the measured water level and flow process of the water level and flow of the test section at the Lokou Hydrological Station as the model export control conditions for the verification test. By comparing the measured water level of the model with the measured water level of the prototype at the flow rate of 600 m3/s across five sections (Caojiaquan, Xidaokou, Lijiaan, Lujiazhuang, and Zhengjiadian; see Figure 5), the maximum error is 0.22 m, and the average error is 0.13 m. The results show that the model water level and the flow pattern are basically consistent with the prototype, reflecting that the model meets the drag similarity and flow regime similarity.
(2)
Verification of riverbed deformation similarity: This is a comparison of a cross-section of 24 topographic data measurements (see Figure 6). Using the cross-section method to calculate the verification of the prototype and model siltation volume of the river section, we achieve a prototype cumulative scour volume of 39.52 × 10⁵ m3, and a model cumulative scour volume of 32.14 × 10⁵ m3. By calculating the ratio of the difference between the sedimentation and erosion volumes in the model test and those in the prototype river reach to the sedimentation and erosion volume in the prototype, the relative error was determined to be −18.68%. The error is in the permissible range, which indicates that the model siltation topography is basically consistent with the prototype [24], reflecting that the model meets the similarity of river bed deformation. The validation of the model shows that the results of the model can simulate the water and sand movement characteristics of the actual river channel.
The results of the verification of flow resistance similarity and riverbed deformation similarity show that the water levels and riverbed scouring effects simulated by this model are within a reasonable error margin relative to the field measurements. This confirms that the model meets the requirements for simulation and prediction of this river’s reach, with the experimental data being reliable to a certain extent.

3.2. Analysis of Changes in River Conditions After Construction of Parallel Bridges

This test was mainly conducted to study the effects of the river water level and flow velocity in the nearby watershed after the construction of the reconstruction and expansion project; the axial location of the new bridge is 60 m downstream from the old bridge. The test simulated one-in-ten-year and one-in-twenty-year floods. By measuring the water level along the model and the water level and flow rate of the selected cross-section to explore the impact of the construction of the bridge on the water level and flow rate of the river, the starting point was set at the left bank of the model; the cross-section of the water in the area of the construction of the bridge is shown in Figure 7. (The direction of the red arrow indicates the flow direction of the river).

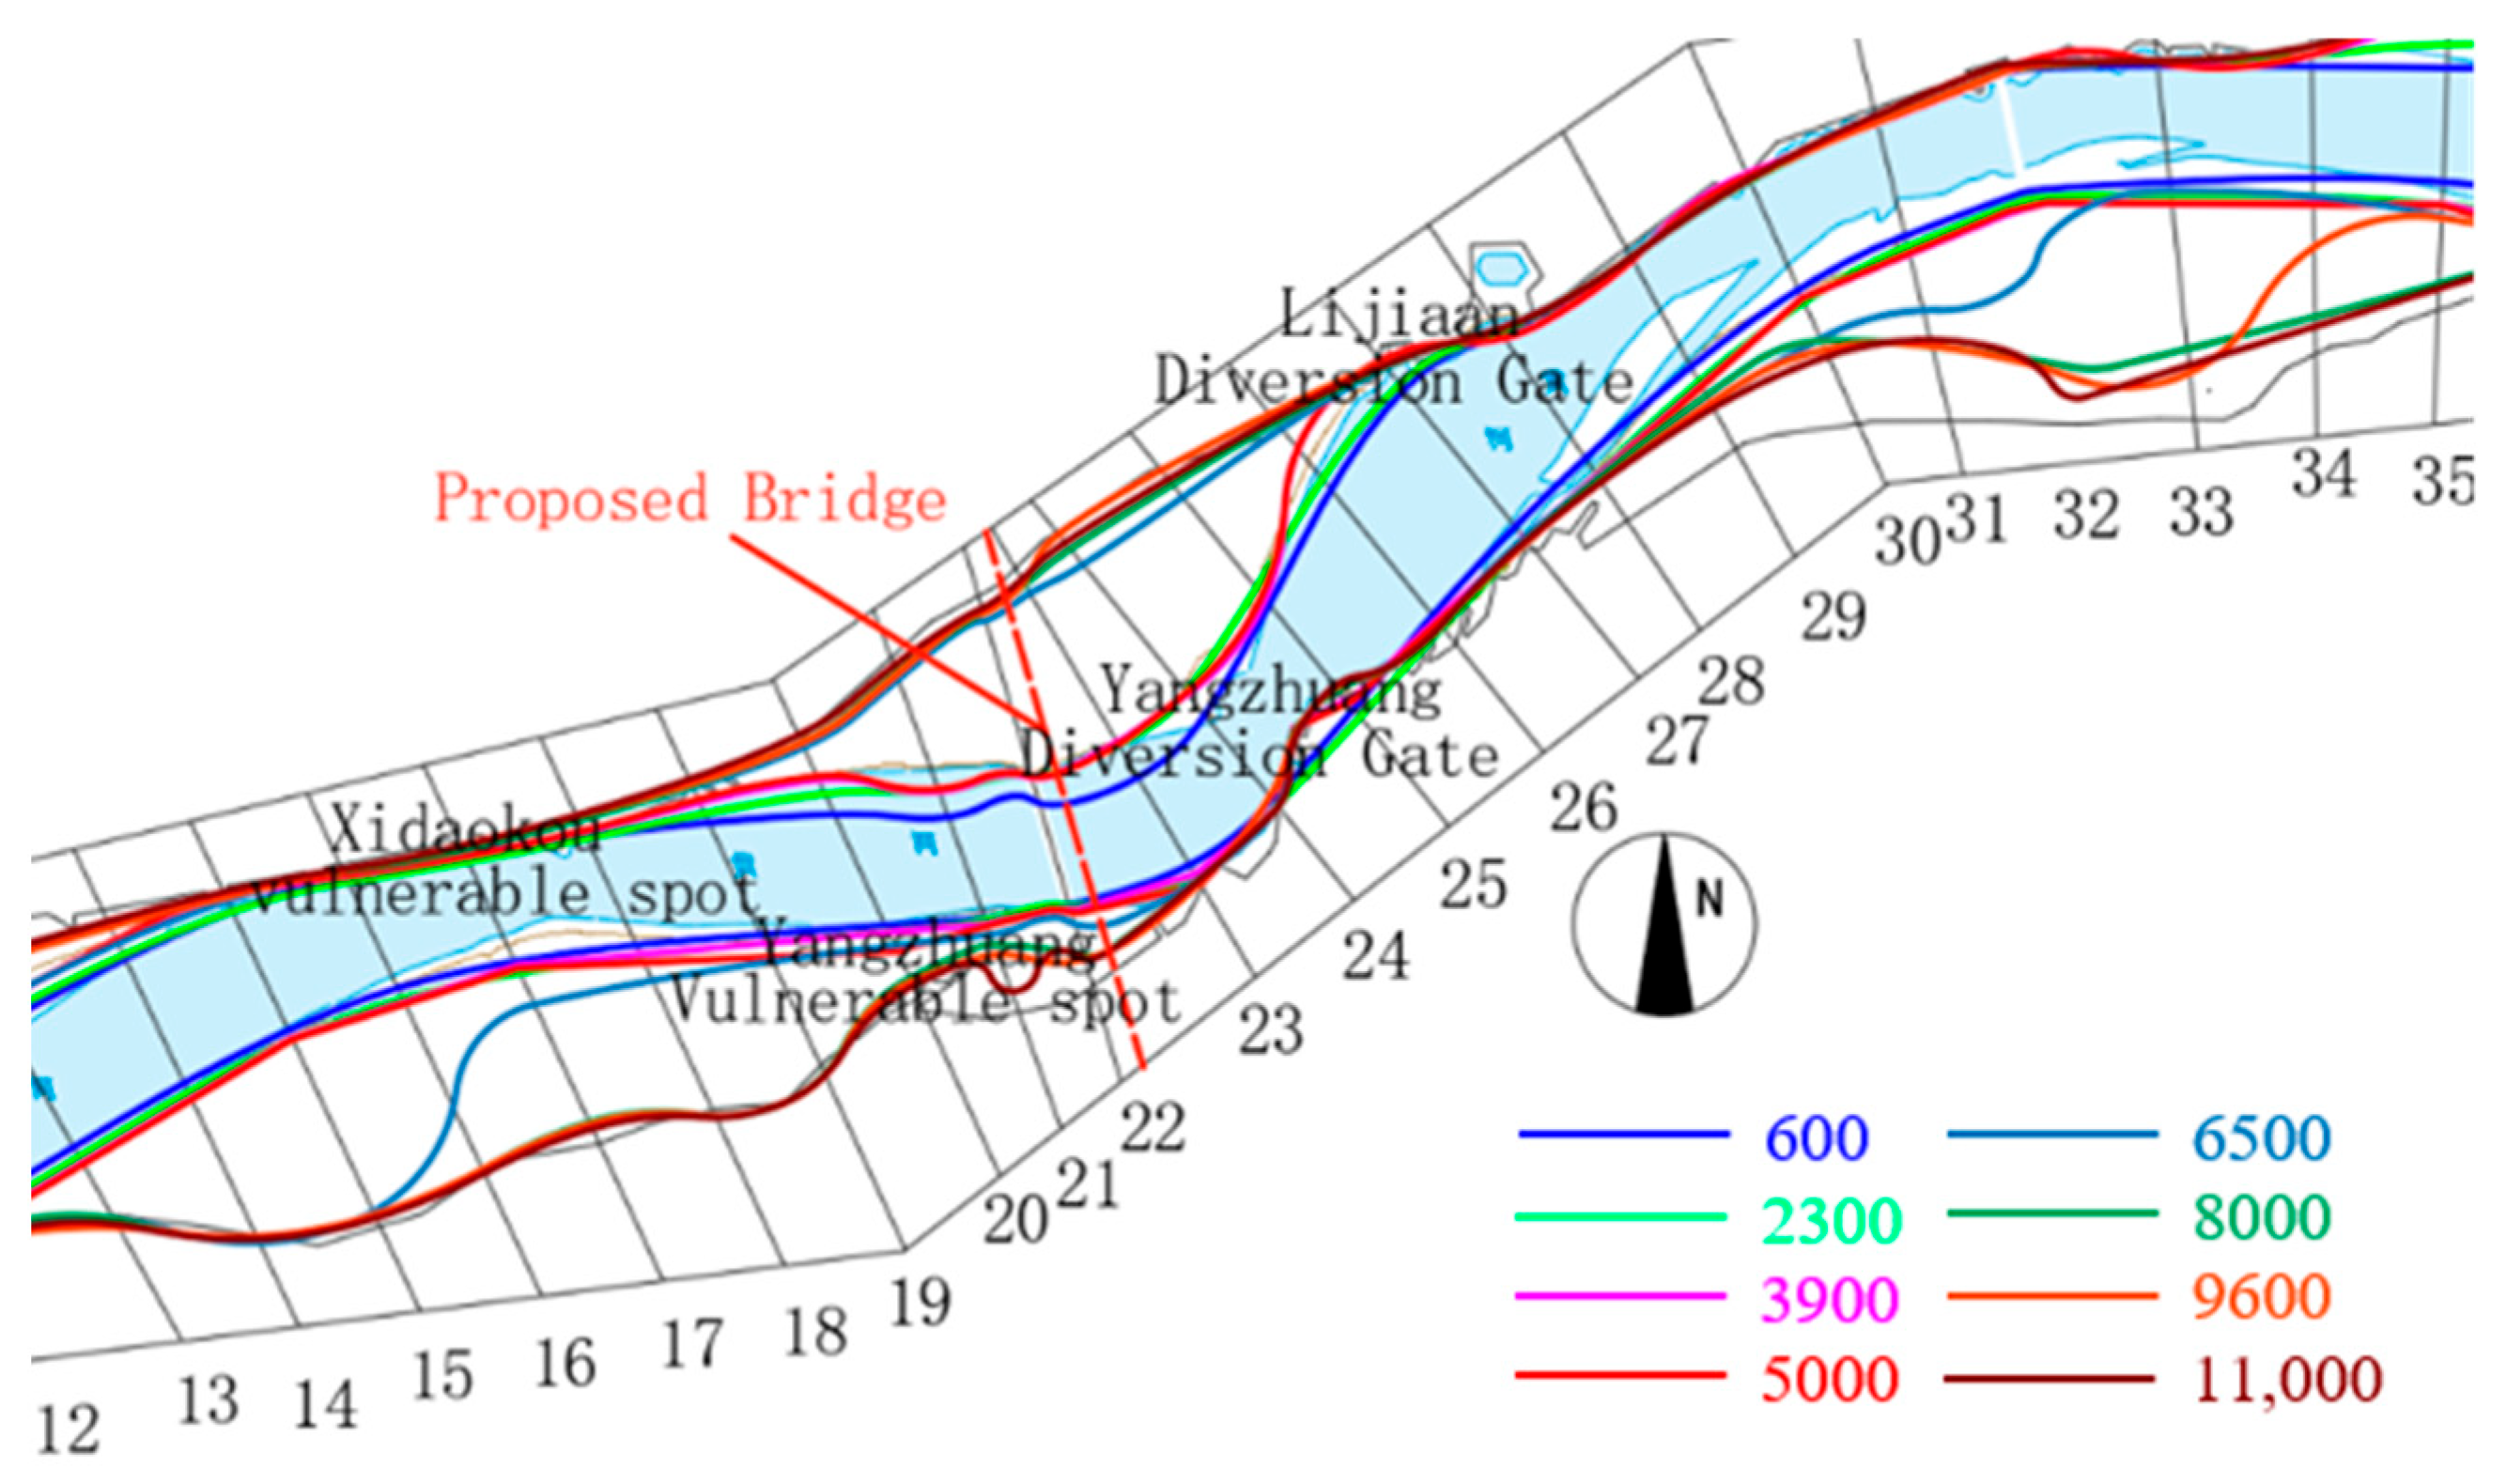
3.2.1. Characterization of River Conditions Prior to Merging Bridges

Because the bridge axis and the flood flow direction are basically perpendicular, and the bridge piers occupy a small proportion of the floodplain area, the occurrence of the design flood flow is 1.9%. Thus, bridge construction has little impact on the change in the flood. The river regulation project of the bridge position of the river section has been relatively perfect; the left bank has Xidaokou and Lijiaan protection works, while the right bank has Yangzhuang bank protection works, and the main stream is basically able to adjust and straighten out.
The river’s reach has been systematically regulated since the 1950s, being one of the earliest sections of the lower Yellow River to undergo channel improvement. Following the principle of controlling the main current and protecting the banks and embankments, the approach of “adapting to the natural conditions has been adopted, using dams to protect bends and guiding the flow with the bends”; thus, regulating the middle water channel.
As shown in Figure 8, the bankline dynamics at different flow levels during the 2021 flood hydrograph are relatively minor, with the maximum swing being less than 150 m and the total range of the water’s edge extending to 600 m. The river flow path predominantly retains the form of Xidaokou→Yangzhuang→Lijiaan. Despite the occurrence of a slip point in the Xidaokou protection work due to varying river flows, the river channel remains essentially stable. When the flow rate exceeds 5000 m3/s, the floodwaters in the river will gradually overflow onto the floodplain. Based on the hydrological data records of the river section, the 10-year flood discharge Q = 9600 m3/s and the 20-year flood discharge Q = 11,000 m3/s were selected as the characteristic flood discharges for the project construction. The flood discharge boundary of the river section is basically attached to the levees on both sides, and the protection works in the bridge location reach near the bridge after the flood bank makes the width of the water increase.

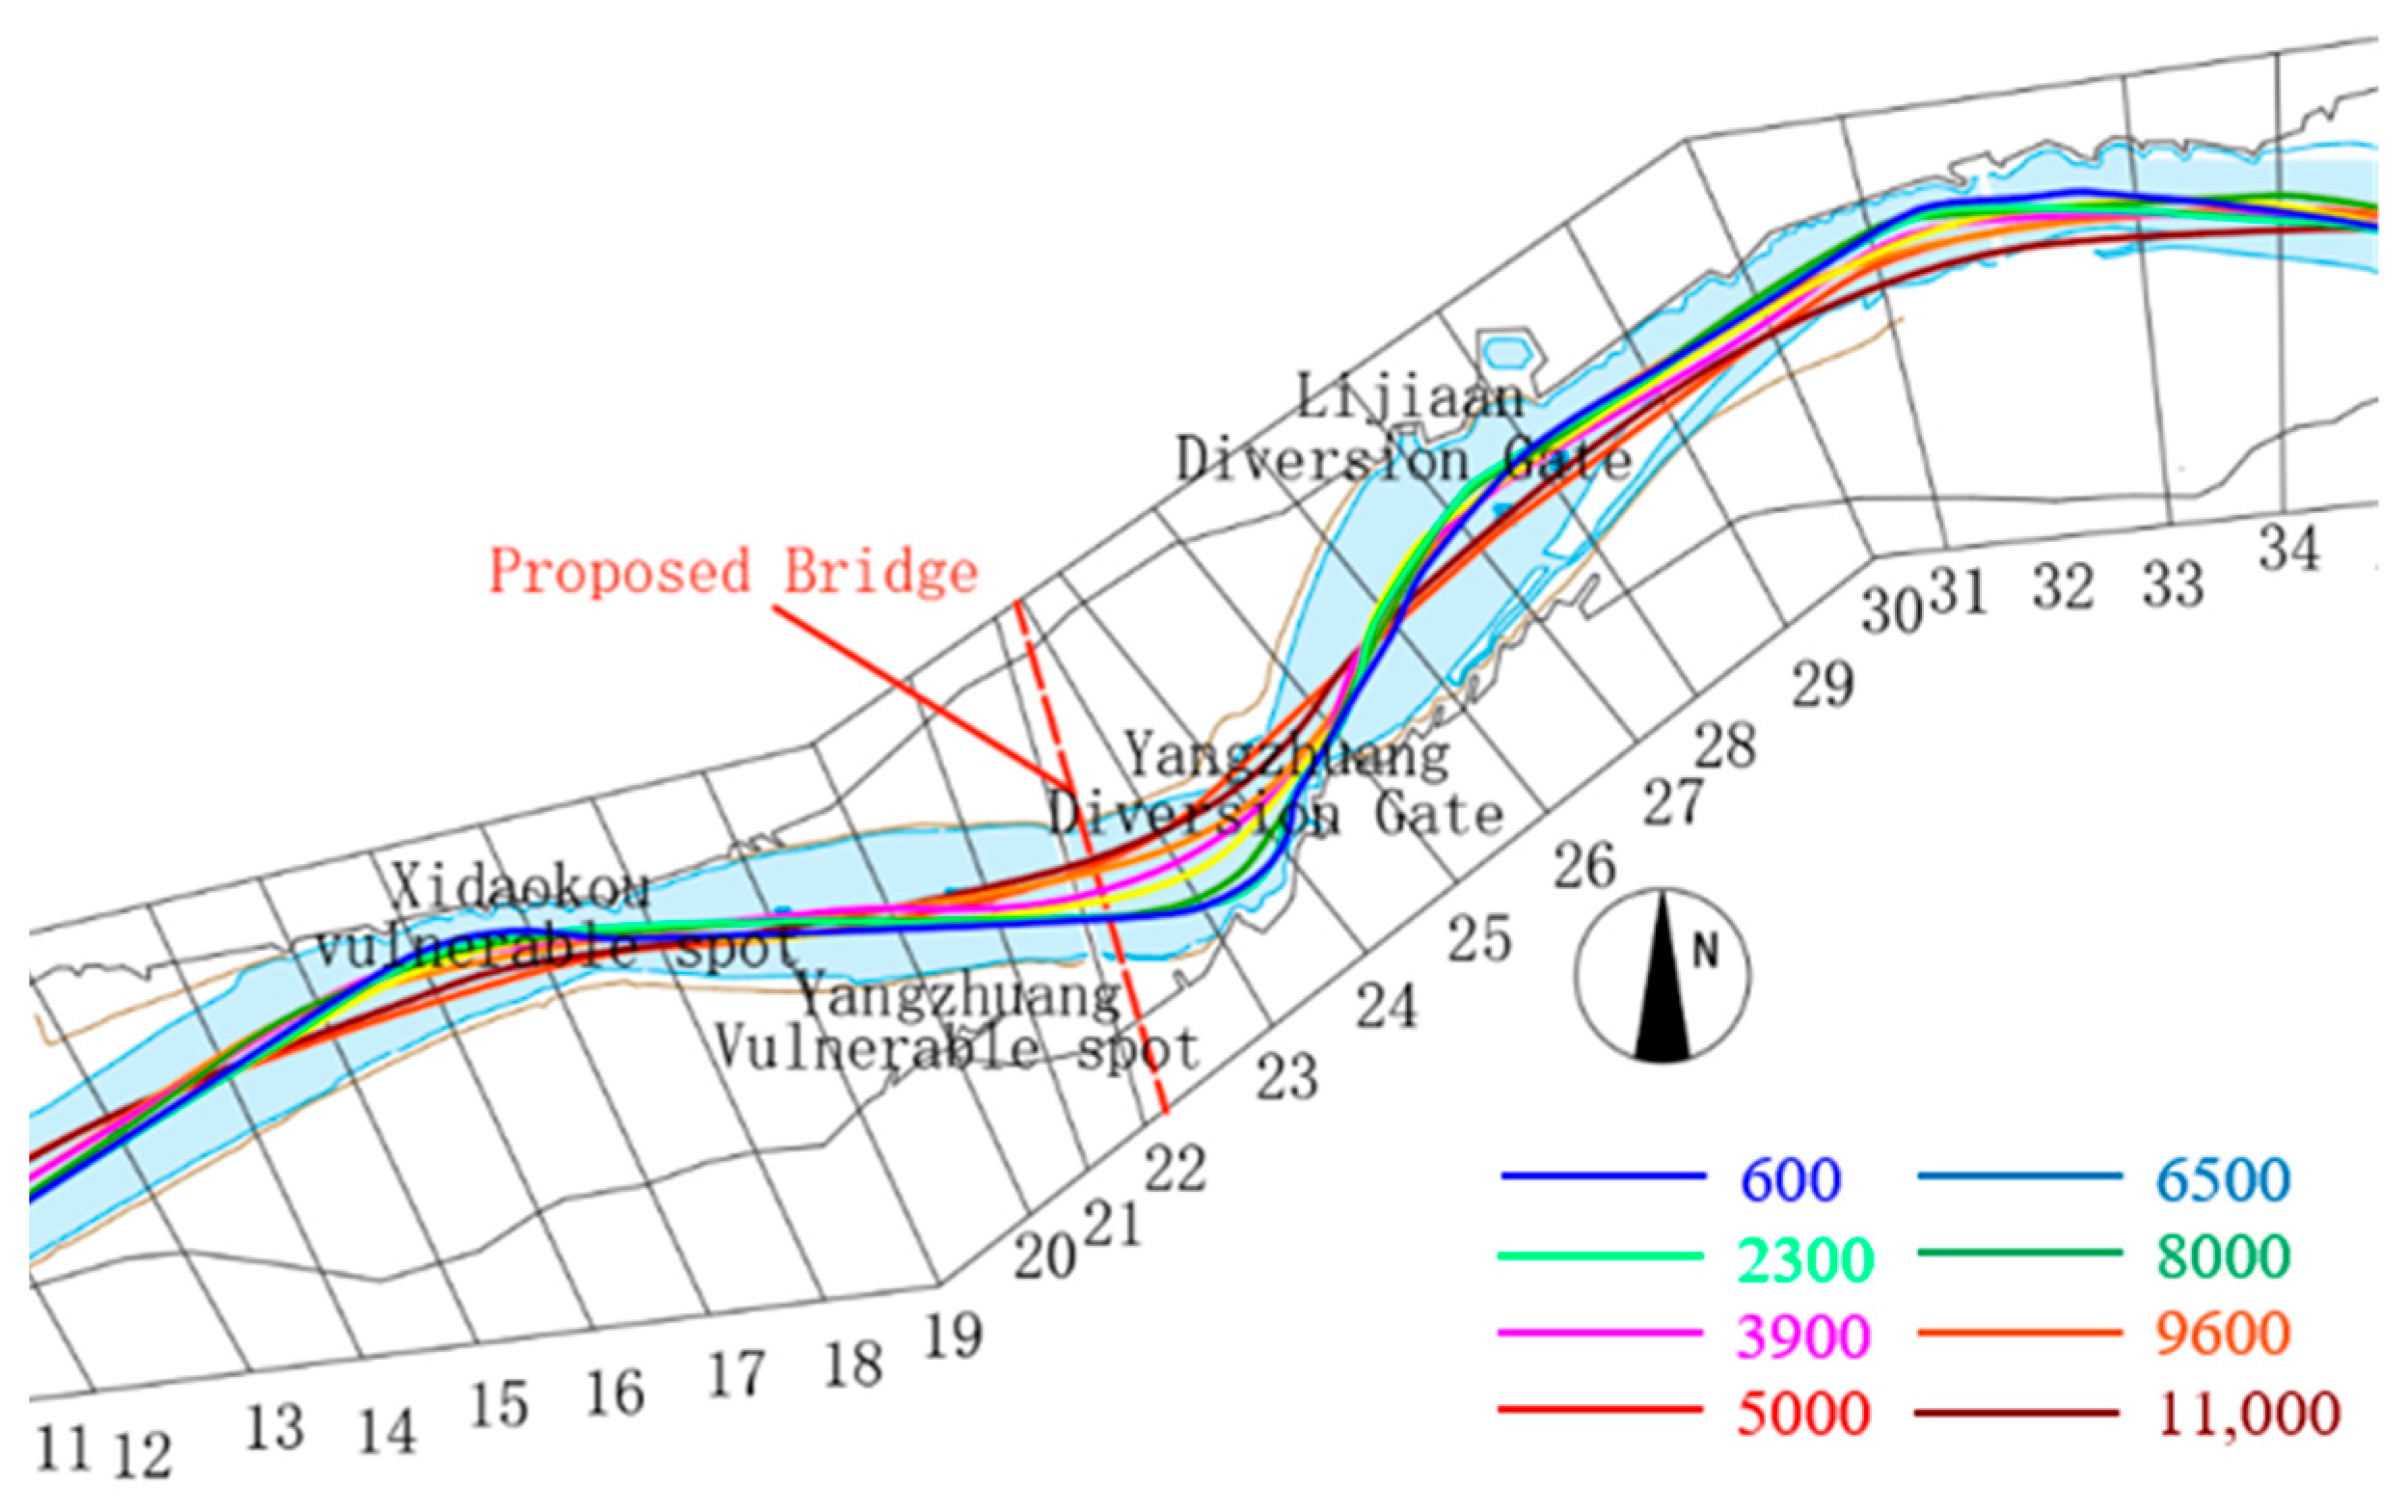
3.2.2. Characteristics of Changes in River Potential After Merging Bridges

The simulation was conducted for five levels of flow, ranging from Q = 600 m3/s to 5000 m3/s, as well as flood profiles for 10-year and 20-year flood events. Figure 9 illustrates the convergence diagram of the river’s expansion project section under various flow conditions of the mainstream. The mainstream’s fluctuation, both upstream and downstream, indicates that the bridge’s lateral maximum swing amplitude is approximately 180 m. The bridge axis forms an angle with the mainstream flow towards the right bank. The overall flow potential on both sides of the project is within the scope of control. Under conditions of low flow rates, the road crossing protection work is evident, and the bridge, along with the Yangzhuang protection work, exhibits greater stability in the mainstream line. With the increase in flow discharge between cross-section 20 and cross-section 26, the main flow line of the river segment shifts toward the middle of the channel, and its curvature decreases. Under the characteristic flood conditions, the maximum swing of the main flow line at the bridge site cross-section reaches approximately 150 m. Additionally, significant deviations of the main flow line also occur between cross-sections 15 to cross-section 17, and cross-sections 31 to cross-section 33. On the whole, the bending and swing of the mainstream line in large flow conditions become smaller.

3.3. The Influence of the Parallel Bridge Construction on the Flood Level of the River Channel

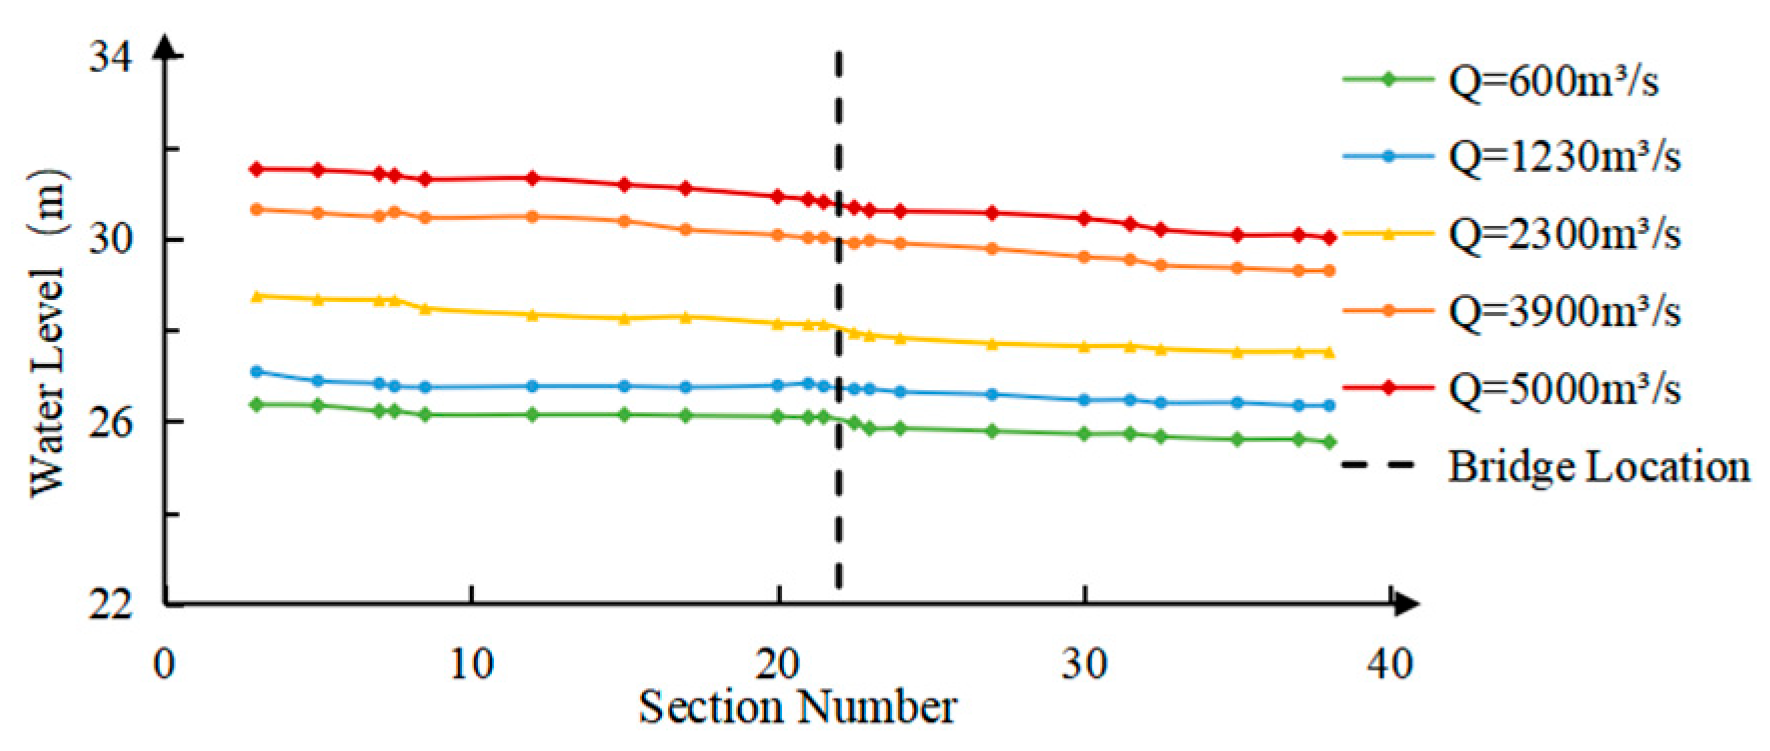
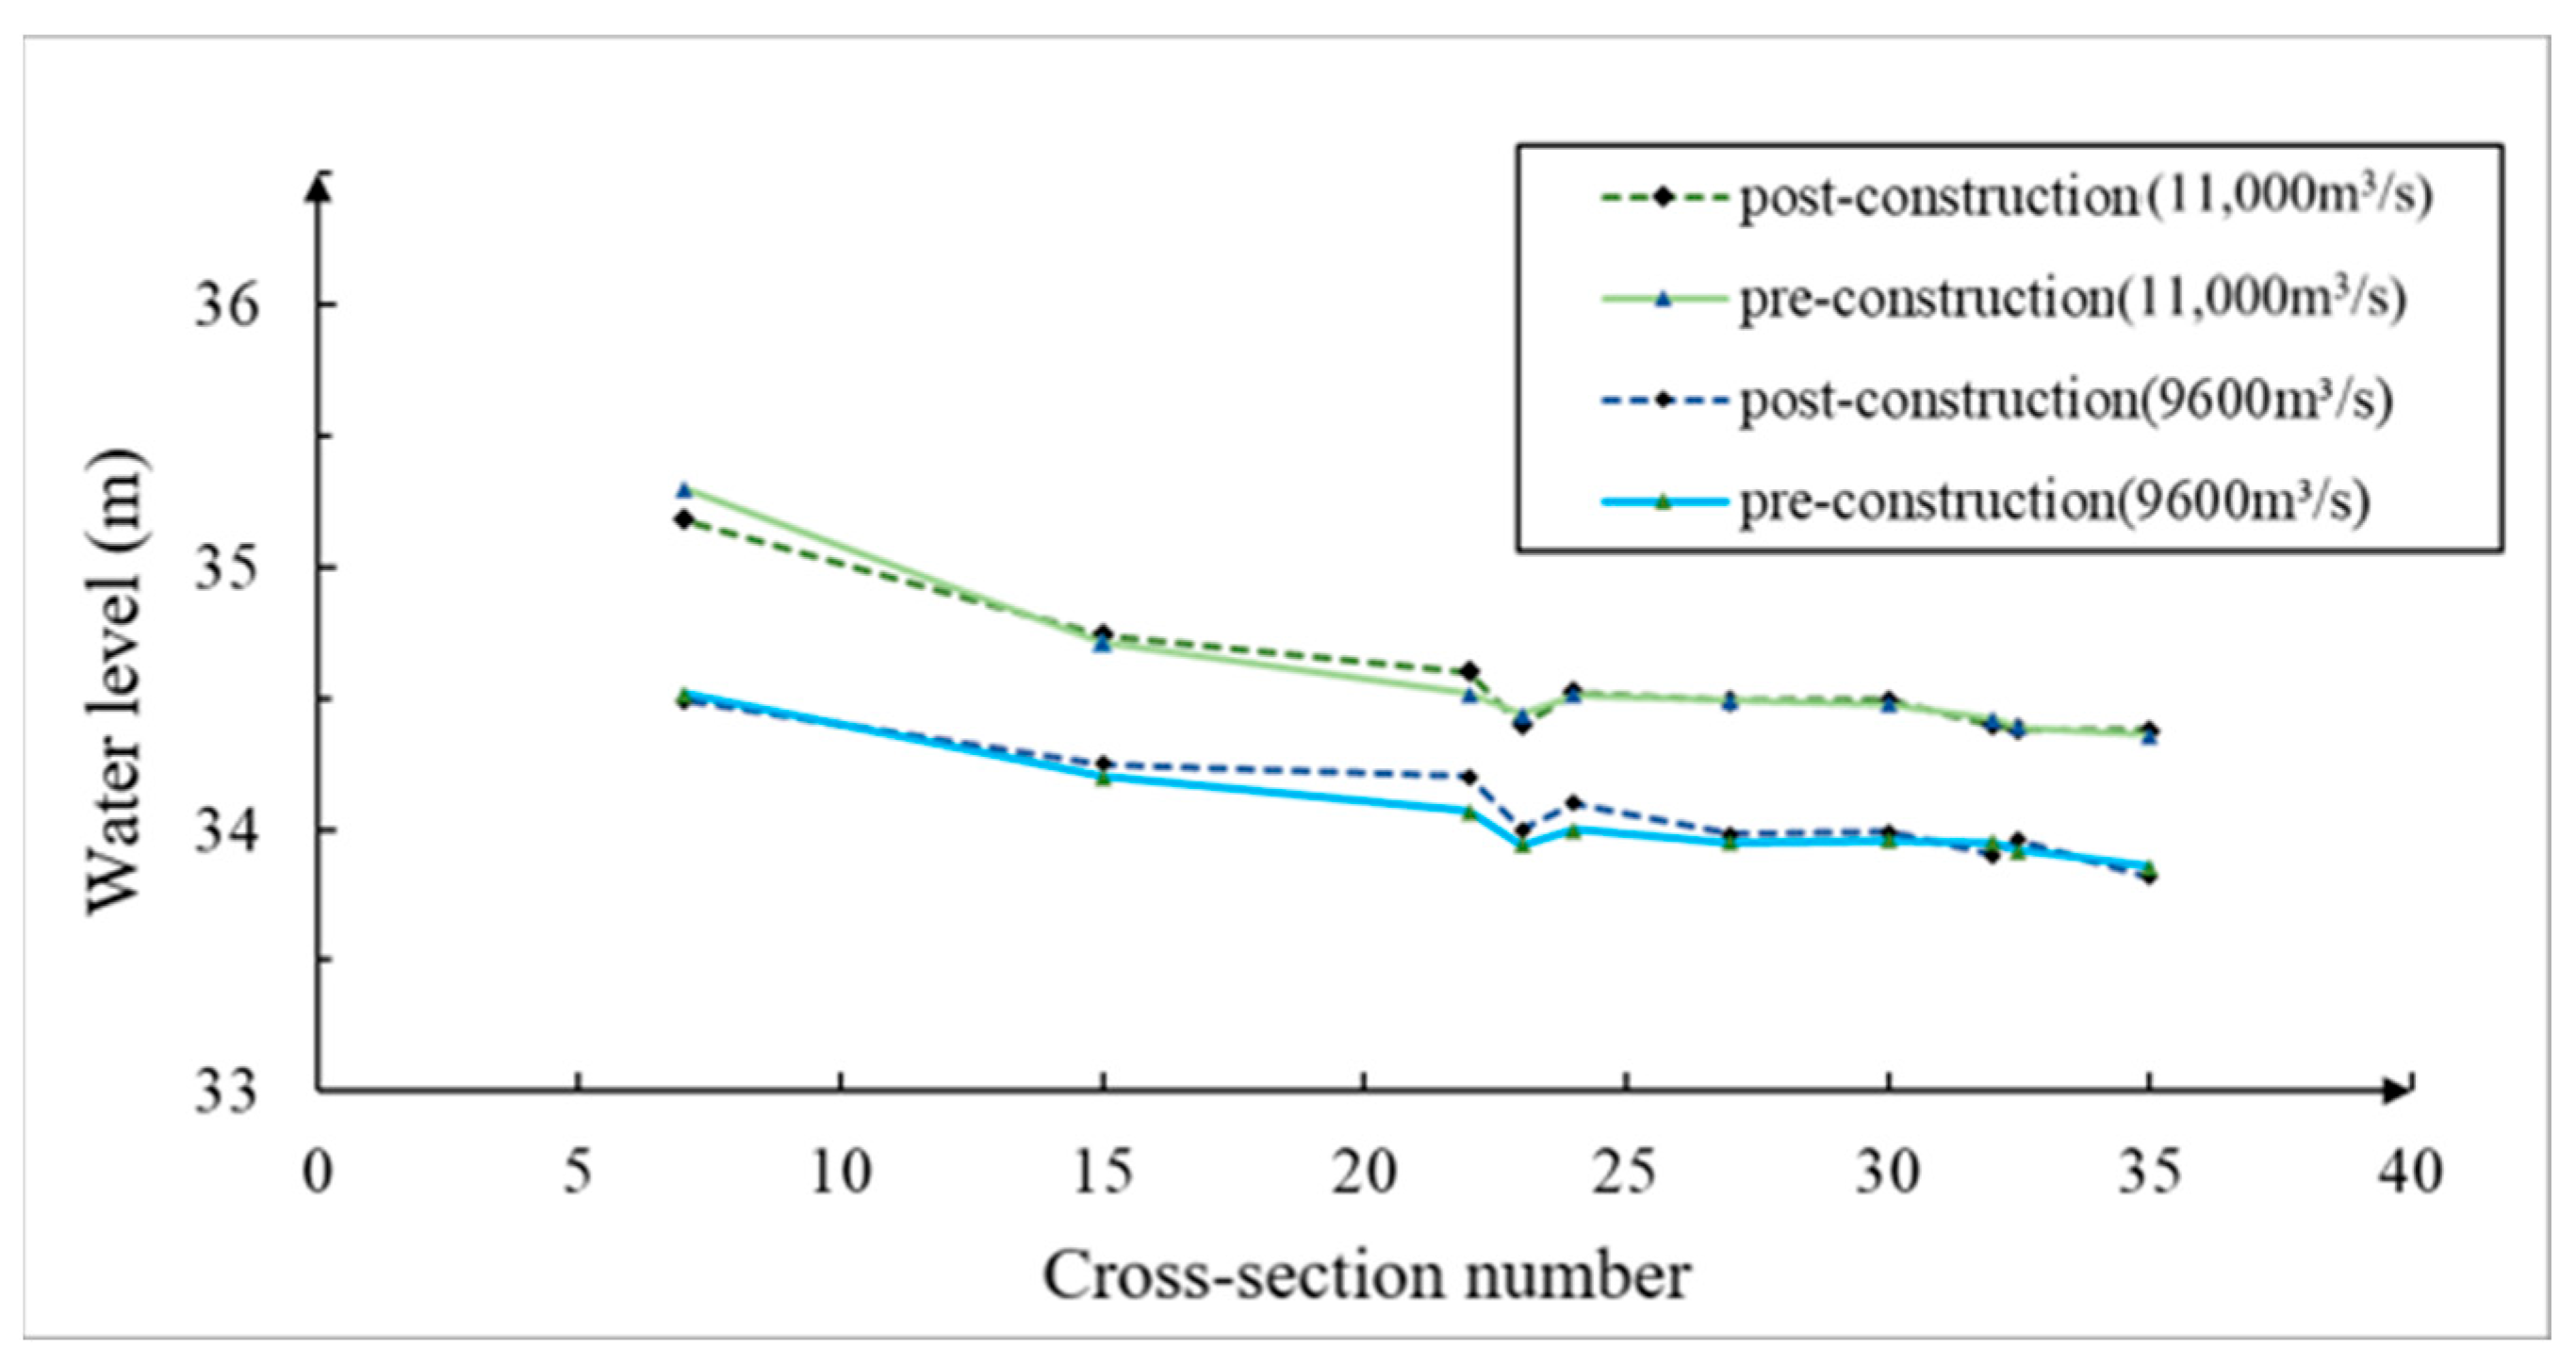
3.3.1. Analysis of Along-Channel Water Levels Under Different Flow Conditions

During the 2021 flood season, a comprehensive study was conducted on the river section to observe the water level changes corresponding to five distinct flow rates (600 m3/s−5000 m3/s). The results of this study are depicted in Figure 10. As illustrated in Figure 8, under low flow conditions, the river section’s water surface line near the bridge group exhibits greater stability and uniformity. However, fluctuations are observed in the vicinity of the bridge, both upstream and downstream, with the phenomenon of water backing up in front of the piers. The bridge reconstruction and expansion project features five piers within the river channel, with one pier located in the main channel and four piers situated on the banks. As the flow rate increases, the water level along the river also rises, resulting in a pronounced backwater effect at the bridge abutment area. The ratio drop along the river fluctuates between 0.9 and 1.36 parts per million, aligning closely with the average ratio drop of approximately one part per million for the river section.
As the flow increases, the water level rises. During the flood, as water flows through the river section with the bridge group, the flood cross-section expands from the main channel to the dike within the beach area. Consequently, the bridge abutments are increasingly submerged, with the water level rising from the main channel abutments to the beach abutments. Following the construction of the bridge and its adjacent river sections, water level records were taken during a one-in-ten-year flood (Q = 9600 m3/s) and a one-in-twenty-year flood (Q = 11,000 m3/s). With the rise in flow levels, the bridge abutment situated within the river channel encroaches upon a portion of the flood cross-section, thereby reducing the area available for a water passage and increasing the resistance to the flow. The water level behind the bridge exhibits backwater in front of the piers and a rapid drawdown behind them. Under the 10-year flood scenario (Q = 9600 m3/s), the water level difference between the two monitoring points increased from 0.05 m before bridge construction to 0.09 m after construction. Under the 20-year flood scenario (Q = 11,000 m3/s), this difference rose from 0.07 m pre-construction to 0.12 m post-construction. This leads to a rise in water levels upstream of the bridge within a certain range, and as the flow intensifies, the distance of waterback extends further upstream. During the design flood with a flow rate of Q = 9600 m3/s, the impact of waterback on the bridge is substantial, with the water level at the bridge serving not only as a good example but also as an excellent case study. At this design flood flow rate, the waterback affects an area extending approximately 3000 m upstream of the bridge. For the design flood with a flow rate of Q = 11,000 m3/s, the impact of waterback extends to about 3500 m upstream of the bridge.

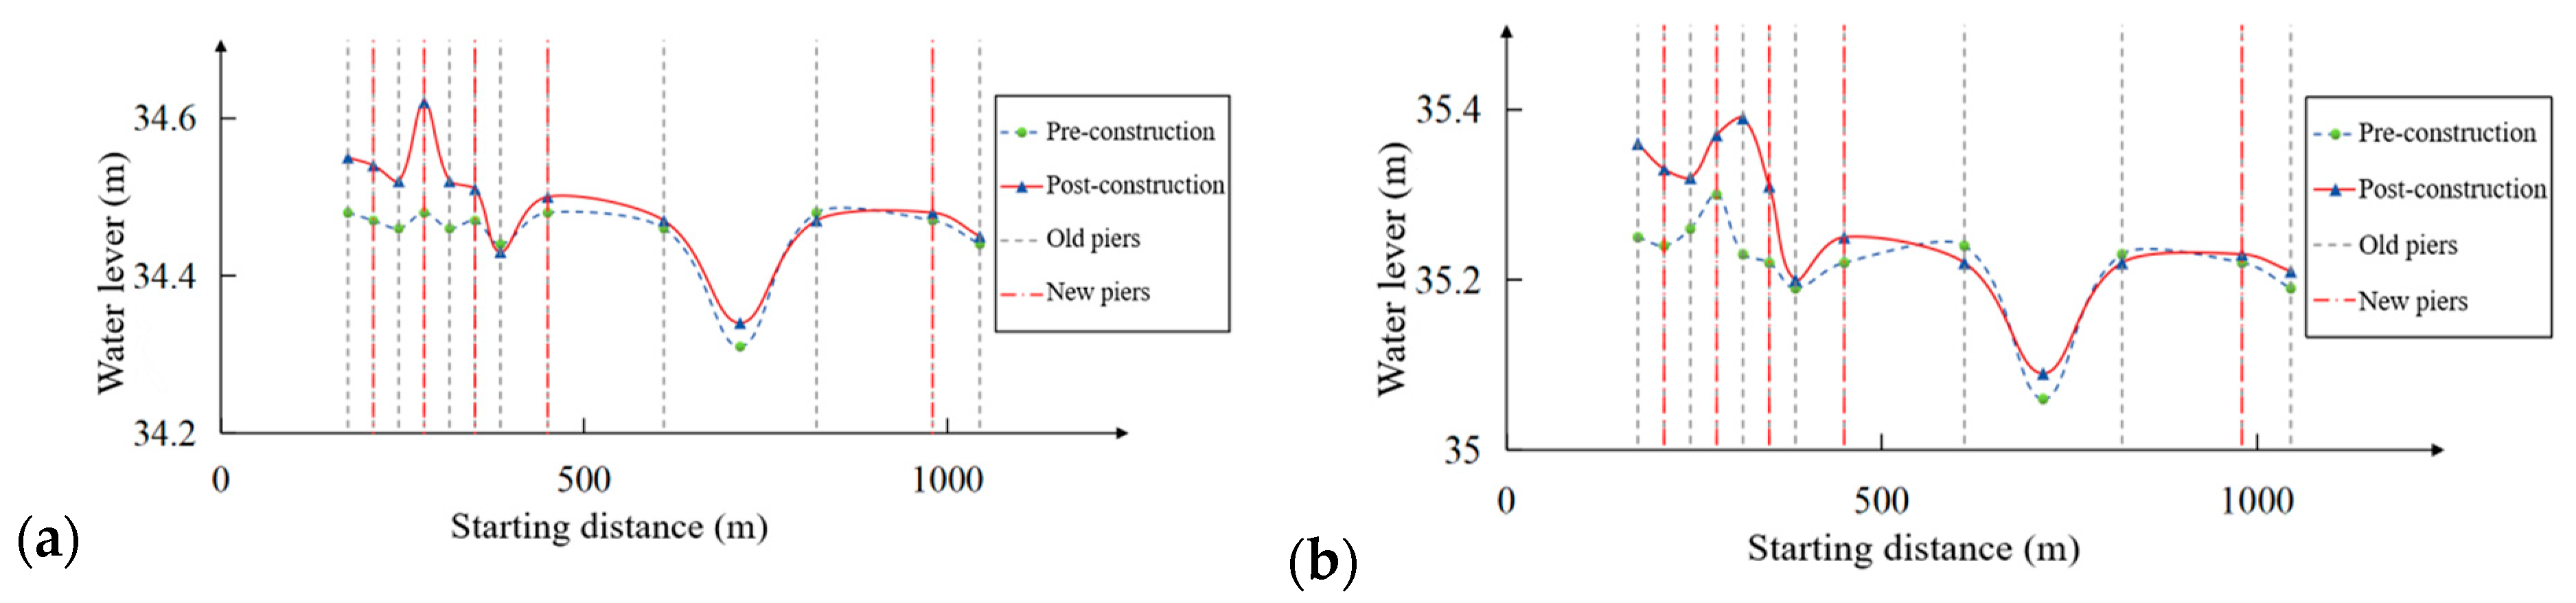
3.3.2. Backwater Analysis of Bridge Upstream Face

Under low flow conditions, the river water does not overflow onto the floodplain areas, and the newly constructed bridge piers will not affect the flood discharge capacity of the river. Figure 11 illustrates the water levels at the bridge piers’ cross-sections before and after the construction of the bridge, as well as under flood conditions. The results indicate that the water levels at the cross-sections of the bridge piles have undergone noticeable changes. By comparing the water levels before and after bridge construction, it is evident that the water level on the left side of the flow surface has increased. This change is particularly pronounced in the area between 210 m and 450 m, where four bridge piers are closely spaced. This arrangement significantly diminishes the effective cross-sectional area available for water flow, leading to a substantial reduction in the flow’s cross-section. This suggests that the presence of the bridge has markedly altered the distribution of water flow. Conversely, in the section starting from 600 to 1000 m from the left bank, the construction of the bridge has had minimal impact on the water level. This region represents the mainstream area, and the extensive expansion of the bridge piers has a relatively minor effect on the water flow’s return.

3.3.3. Analysis of Water Level Variations Along the Path

By analyzing the measured water levels along the river section before and after the construction of the parallel bridge for 10-year (Q = 9600 m3/s) and 20-year (Q = 11,000 m3/s) floods, the additional water-blocking effect of the “reconstruction and expansion” project’s piers combined with the old bridge piers was further examined. Near the proposed bridge site, the water surface line returns to the gradient of the surrounding water surface. Under the once-in-a-decade operating conditions, before the construction of the parallel bridge, the water level difference between the two measuring points upstream and downstream of the bridge site was 0.05 m. After construction, the difference at the measuring points became 0.09 m. Under the once-in-twenty-years operating conditions, the water level difference at the measuring points changed from 0.07 m before construction to 0.12 m after the parallel bridge was built. Overall, as the flow rate increases, the water level rises, and the piers located within the river channel occupy part of the flood discharge section, reducing the flow area and increasing the resistance to the water flow. This causes the water level to rise within a certain range upstream of the bridge site, and the distance of water accumulation increases upstream with the increase in flow rate. Under the design flood flow of Q = 9600 m3/s, the impact of water accumulation extends to about 3000 m upstream of the bridge site; under the design flood flow of Q = 11,000 m3/s, the impact extends to about 3500 m upstream. The water surface line along the river under the design flood conditions is shown in Figure 12. It was found that the construction of the parallel bridge causes the water level in front of the bridge piles to rise, and this effect is more pronounced under high-flow conditions.

3.4. Determination of the Optimal Number of Cloud Droplets

Following the construction of flow-retarding structures in the river channel, flow conditions of the river channel will change and thus cause changes in the flow velocity of the river cross-section. The experimental study examined the impact of bridge construction on the flow velocity of the river under the conditions of 10-year (Q = 9600 m3/s) and 20-year (Q = 11,000 m3/s) design flood conditions. Figure 13 and Figure 14 show that after the construction of the bridge, the flow velocity at the cross-section in front of and behind the bridge has increased to a certain extent compared to the mainstream flow velocity before the bridge construction. In the area of the riverbank pier group, the flow velocities decreased after bridge installation. The flood discharge function of the river channel is still reflected in the main river channel (the distance from the starting point being 600–850 m). The research results show that the bridge’s construction after the bridge has an impact on the river’s flow, and with the increase in overbank flow, the water level on the riverbank rises, the impact of the pier arrangement on the entire river flow velocity distribution decreases, and the mainstream area has widened to some extent. For the 10-year flood condition, the maximum average flow velocity before bridge construction was 1.52 m/s, which changed to 1.77 m/s after the parallel bridge construction, and the maximum fluctuation in flow velocity in the riverbank area was 0.27 m/s. For the 20-year flood, this velocity rose from 2.87 m/s before the new bridge construction to 2.98 m/s after the bridge construction, and the maximum fluctuation in flow velocity in the riverbank area was 0.3 m/s. Preliminary analysis suggests that due to the main bridge pier of the new bridge being located in the area close to the main channel on the riverbank, during overbank floods, it narrows the flood discharge section, causing the water flow to contract towards both sides of the pier columns, thereby increasing the flow velocity in the main channel. In the riverbank flood discharge area, where both the new and old bridge piers are relatively dense, the water-blocking effect is further increased, causing the water level on the riverbank to rise, and the flow velocity exhibits a trend of somewhat smaller fluctuations.

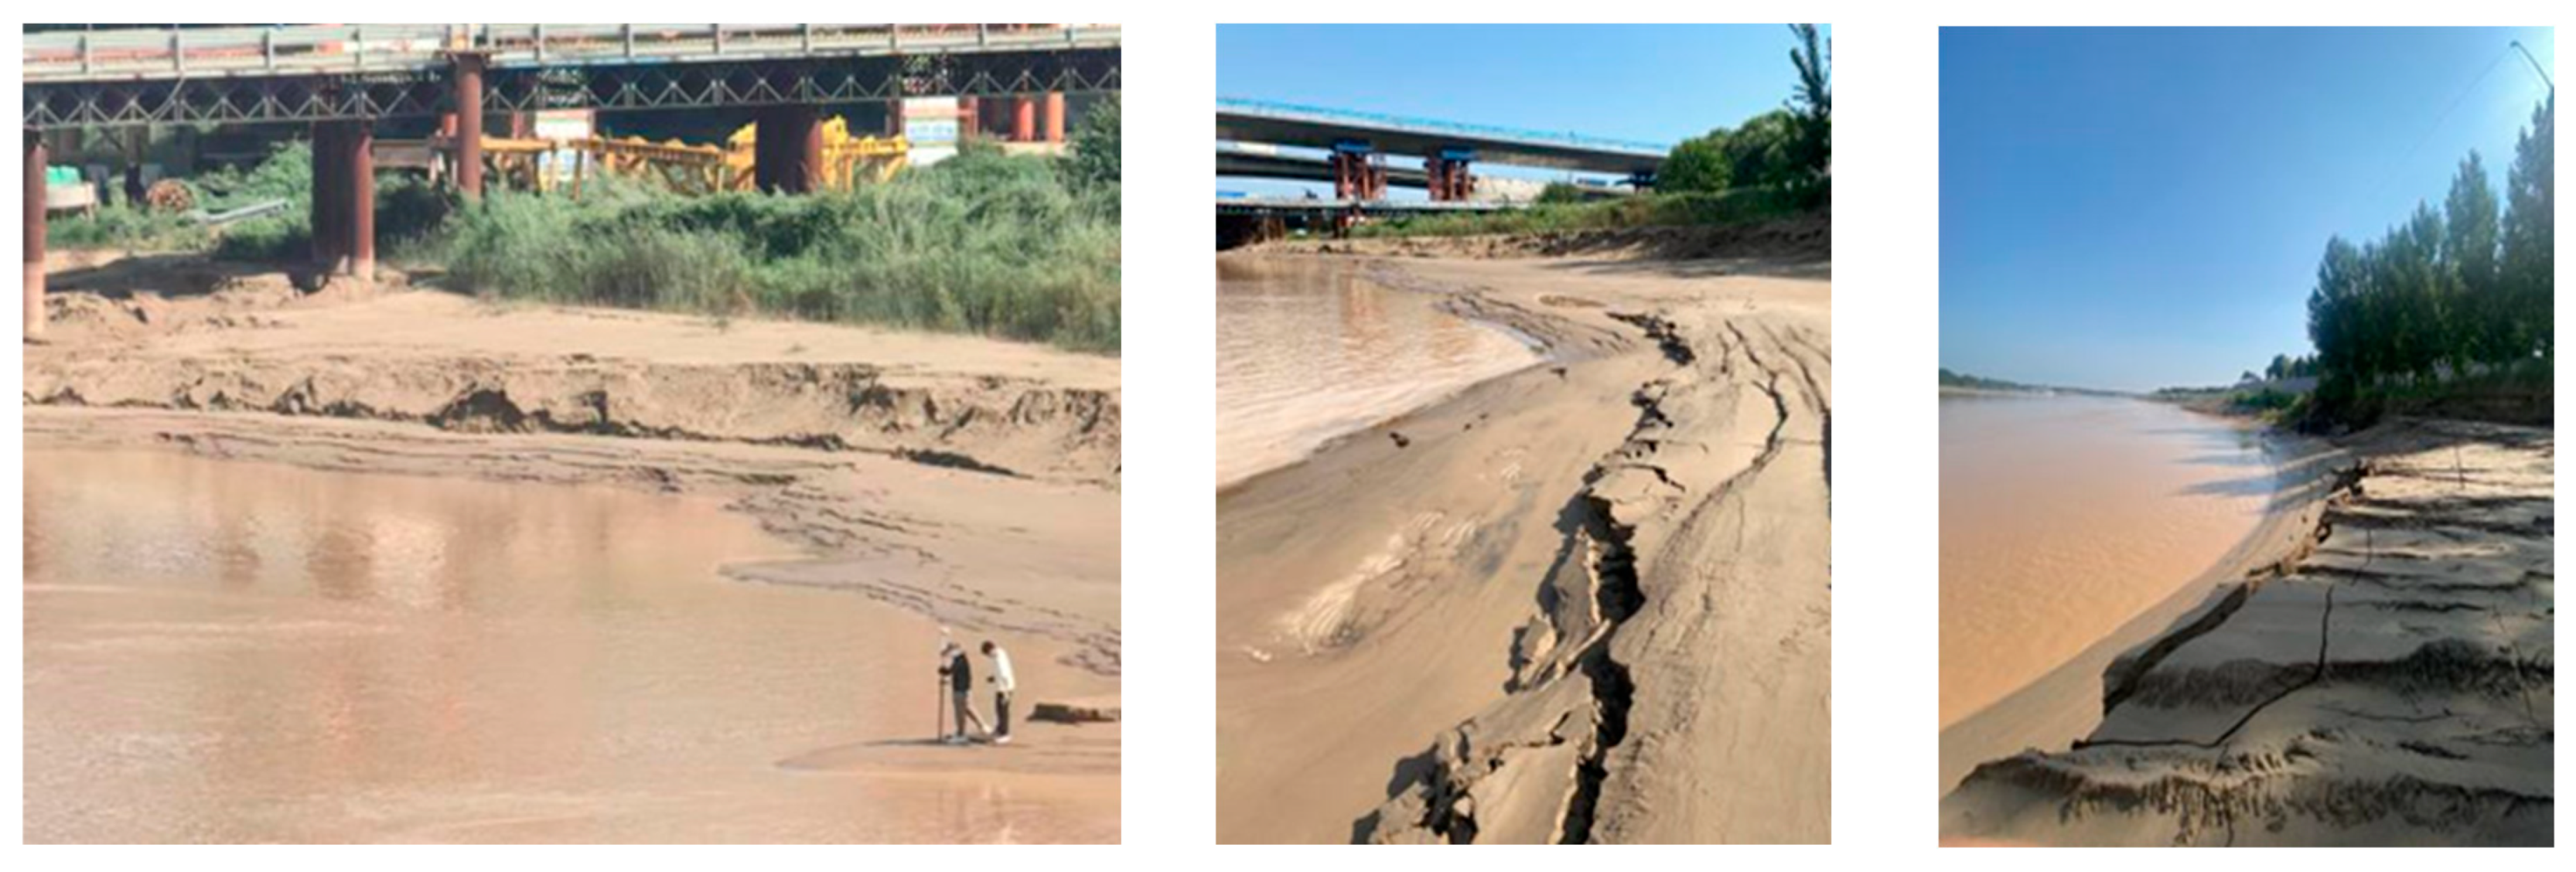
3.5. Study of the Impact of Flood Processes on Riverbanks and Beach Lips

In the lower reaches of the Yellow River, large-scale riverbank erosion occurs frequently, especially within Shandong Province, where the flood control situation of the Yellow River is particularly severe. The flow and sediment downstream are mainly concentrated during the flood season (from July to October), and the Jinan reach of the Yellow River becomes the typical section most prone to danger during the flood season of the lower reaches. The riverbank of the lower Yellow River is the transition zone between the main channel of the river and the floodplain, formed by the sudden decrease in flow velocity due to flood overbanking, which induces sediment deposition and creates a natural levee. Its formation process is influenced by water and sediment conditions, river morphology, and human activities. River training projects, such as spur dikes and bank protection, alter the flow pattern, causing the riverbank position to shift or its shape to be reshaped. The construction of critical works in the Jinan section has led to an average retreat of the riverbank by 20–50 m. The riverbank shoreline near the bridge site is shown in Figure 15.
The proposed bridge site on this river reach is divided into three areas, A, B, and C, as shown in Figure 16. Four control sections were selected for morphological analysis of the flooding process and its impact on the upstream and downstream banklines and the bridge site after the construction of the bridge: cross-section 15 in Area A, cross-section 20 in Areas A–B, cross-section 24 in Area B, and cross-section 30 in Area C. The morphologies of these sections are shown in Figure 17. The post-flood morphological map of the model riverbank is shown in Figure 18. Through the four representative sections, it can be seen that there is a phenomenon of bank retreat in the banklines of each area, with changes in the bankline within 50 m, forming a new slope base, and the slope at the junction of the bank and channel becoming gentler. There is some scouring in the main channel area, but after the flood process, they all tend to evolve into a U-shaped channel. Among the four selected cross-sections, Section 24 was most affected by the flooding process, with the thalweg shifting approximately 200 m toward the left bank and the maximum scour depth in the main channel reaching 6–7 m.

4. Discussion

Overall, bridge construction exhibits minimal and little impact on the river regime. However, due to the changes in the lower reaches of the Yellow River, the influence of the river on the area is relatively small. However, due to the complex change in river potential in the lower reaches of the Yellow River, which changes with the condition of water and sand coming from the upper reaches, the adjustment of river potential has transferability and correlation; if the mainstream flow direction changes in the upper reaches, the bridge location reach will be adjusted accordingly. The existence of piers at this time will have a certain impact on the change in river potential. Following the flood, the river’s trend change aligns largely with the evolutionary law of “Rise for minor floods, fall for major floods”, and the river’s overall direction remains relatively unchanged. The impact of pier construction on the main flow line of the river channel is relatively minor, which is consistent with Liu’s research on the Yellow River’s Heze reach [25]. As the river discharge increases, the river surface widens, the curvature radius enlarges, and the main flow line tends to straighten, aligning with Yao’s findings [26]. Therefore, for river regime control after parallel bridge construction, the primary focus should still be on the bank regulation projects on both sides.
Under design flood discharge conditions, it was observed that the construction of such bridges results in an increase in the water level in front of the bridge piers. This elevation effect was particularly pronounced during periods of high flow. After the construction of parallel bridges, the lateral cross-sectional water level difference between the bridges expanded by more than 0.1 m, a phenomenon detrimental to river flood discharge. The water level difference is primarily caused by the dense clustering of bridge piers in the floodplain area, which increases flow resistance. Xie’s research indicates that the flow resistance effect can be further reduced by altering the arrangement of bridge piers and selecting optimal pier shapes [27]. Additionally, the angle between the water flow and the bridge piers also impacts flow resistance. Installing deflectors on the piers can mitigate disturbances to the flow regime [28]; thus, optimizing bridge design and meeting flood control standards.
Bank erosion is the result of instability at the water–soil interface, influenced by both intrinsic riverbank conditions and external hydrodynamic forces. Under constant water-sediment conditions, the scale of bank collapse is determined by the resistance of the bank slope soil to erosion, which is influenced by both geological structure and soil properties. Soil structure affects the mode of bank collapse, such as slumping, toppling, and falling. The shape of the slope reflects the evolution of the bank and the river channel, with concave bank sections being more stable than convex ones [29]. The degree of river channel curvature affects the collapse, with curvature being positively correlated with the erosion rate, and the position and angle of the main flow line determining the evolution of the bank collapse. Hydrodynamic forces are the primary trigger for bank collapse, with the scouring capacity of longitudinal flows and the influence of spiral currents affecting sediment transport. Secondary flows upstream and downstream of the collapsing soil body generate vortices, accelerating the fragmentation and transport of the soil mass. A portion of the collapsed and accumulated material remains at the base of the slope, while some is transported downstream, leading to increased water levels downstream and intensified riverbed scouring.
Comprehensive analyses of Figure 16, Figure 17, and Figure 18 show that during flooding in the bridge cross-section 22, the flow’s velocity increases, the river surface widens, and the main flow line progressively moves away from the concave bank (right bank) of the bend, shifting toward the middle of the channel. This results in the scouring of the riverbed, as shown in Figure 17c, causing the post-flood thalweg to shift toward the left bank.
For the analysis of erosion–deposition topography before and after the flooding process, the physical river model provides an intuitive three-dimensional simulation effect. Moreover, it allows for more refined simulations across various model scales and model sediment settings. Compared with numerical simulation methods, physical model experiments can integrate the advantages of multiple numerical simulation software in either 3D or 2D simulations. The simulation structure is not limited by theoretical equation constraints, making it more aligned with actual conditions; it reduces the tediousness of conducting comprehensive and systematic simulations of river channels using different numerical simulation software. However, there are certain drawbacks, such as the inability to obtain more comprehensive hydraulic parameters in real time during the simulation of flood processes. This necessitates advanced monitoring technologies and measurement methods to enable real-time dynamic monitoring of river evolution, flow field, and flow patterns through physical model experiments, with plans to conduct more in-depth theoretical analyses using more comprehensive and sufficient data.

5. Conclusions

In this study, the impact of constructing concurrent bridges on river flow dynamics was examined using physical modeling. The subsequent conclusions were drawn by analyzing alterations in water levels and flow rates before and after the construction of these bridges under varying frequencies of flooding conditions:
(1)
The hydraulic physical model constructed in this paper is basically consistent with the measured data in simulating the water level difference between the upstream and downstream of the bridge group river section, the average cross-sectional flow velocity, and the flow pattern of the river section. The relative error in sediment deposition simulations is within 20%, confirming the model’s suitability for such studies.
(2)
Characteristics of river regime changes near the bridge location after parallel construction of bridges: The river course is basically stable, with the overall flow dynamics constrained by existing bank protection projects. The new bridge has a negligible impact on the reach-scale river regime. The main river line of the river course, which is typically meandering, generally follows the evolutionary pattern of “straightening with high water and curving with low water.”
(3)
Characteristics of water level rises in front of the bridge after parallel construction of the bridge: As the flow increases, the flood discharge section gradually expands. When the flow exceeds 5000 m3/s, the flood begins to overflow onto the banks and is affected by the backwater effect of the newly constructed bridge. Under the 10-year design flood, the water level difference between the upstream and downstream observation sections adjacent to the bridge pier changed from 5 cm before the construction of the parallel bridge to 9 cm after construction, representing an 80% increase in the backwater effect. Under the 20-year design flood, the water level difference between the two measurement points changed from 7 cm before the construction of the parallel bridge to 12 cm after construction, indicating a 71% enhancement in the backwater effect.
(4)
Characteristics of the waterback length of water levels in front of the bridge after merging: As the flow increases, the backwater distance extends upstream. At the flow rate of a 10-year design flood, the backwater effect can reach about 3000 m upstream of the bridge site; when it is at the flow rate of a 20-year design flood, the affected area extends to about 3500 m.
(5)
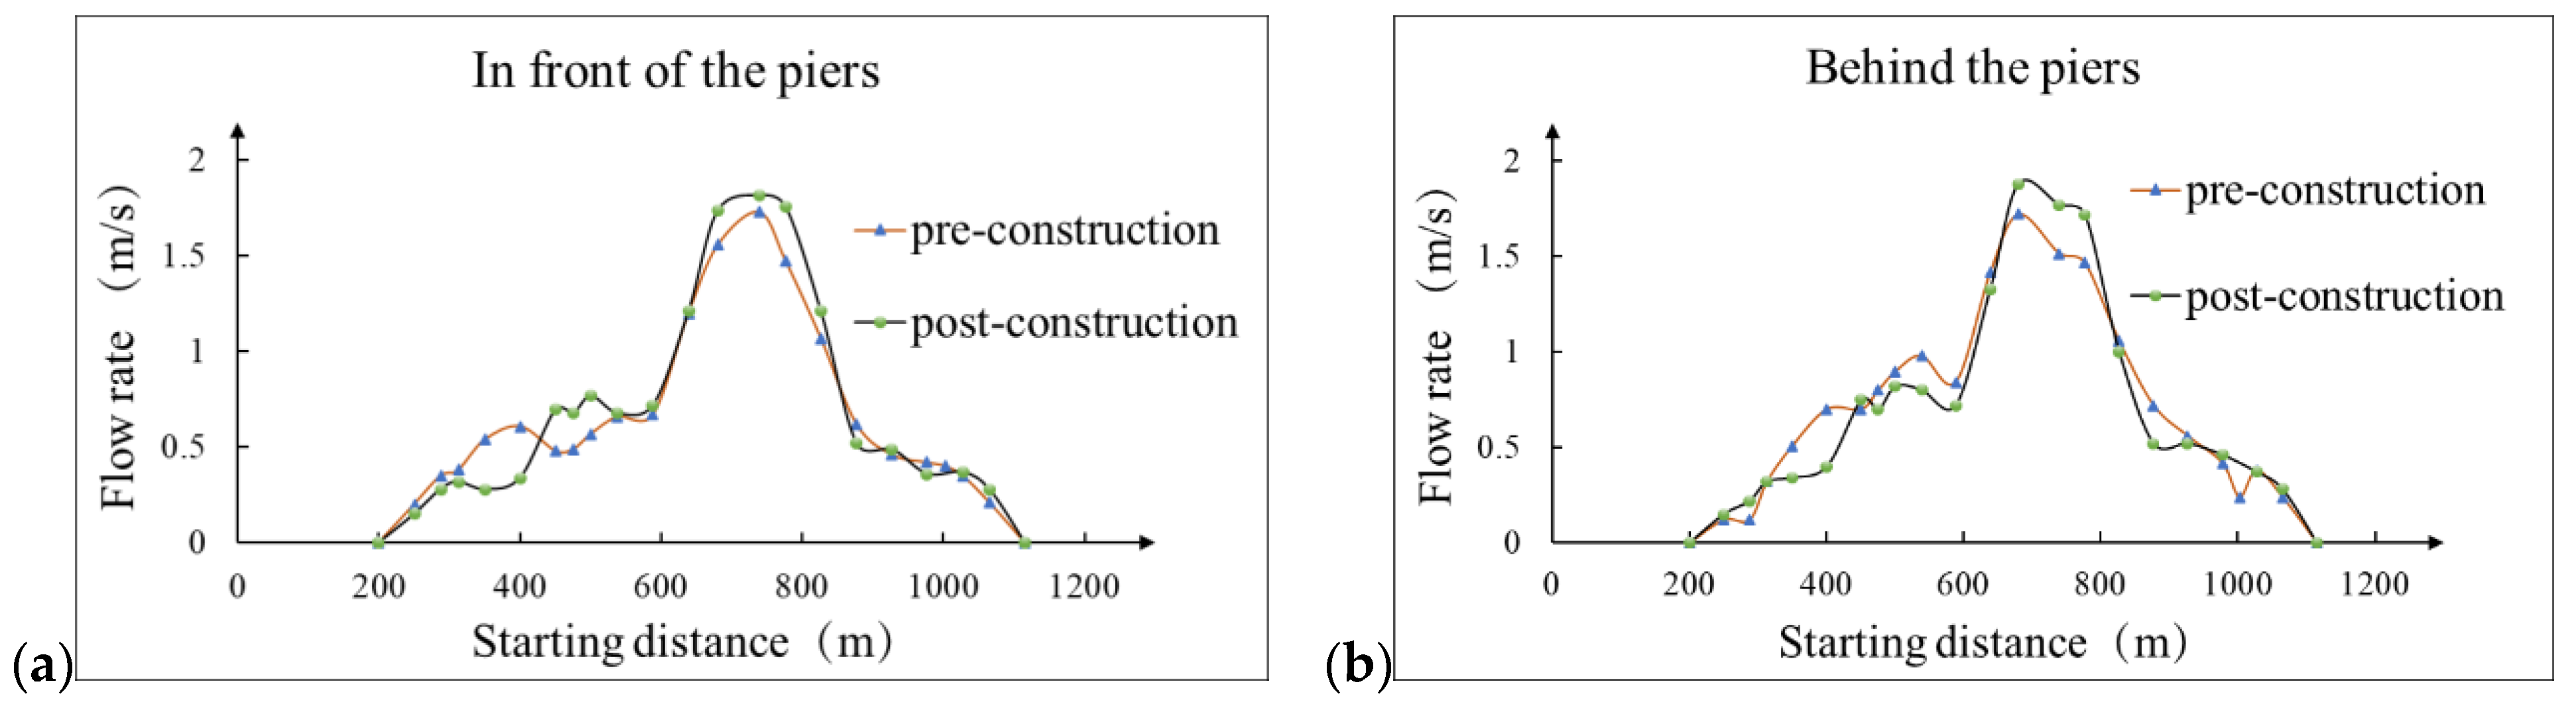
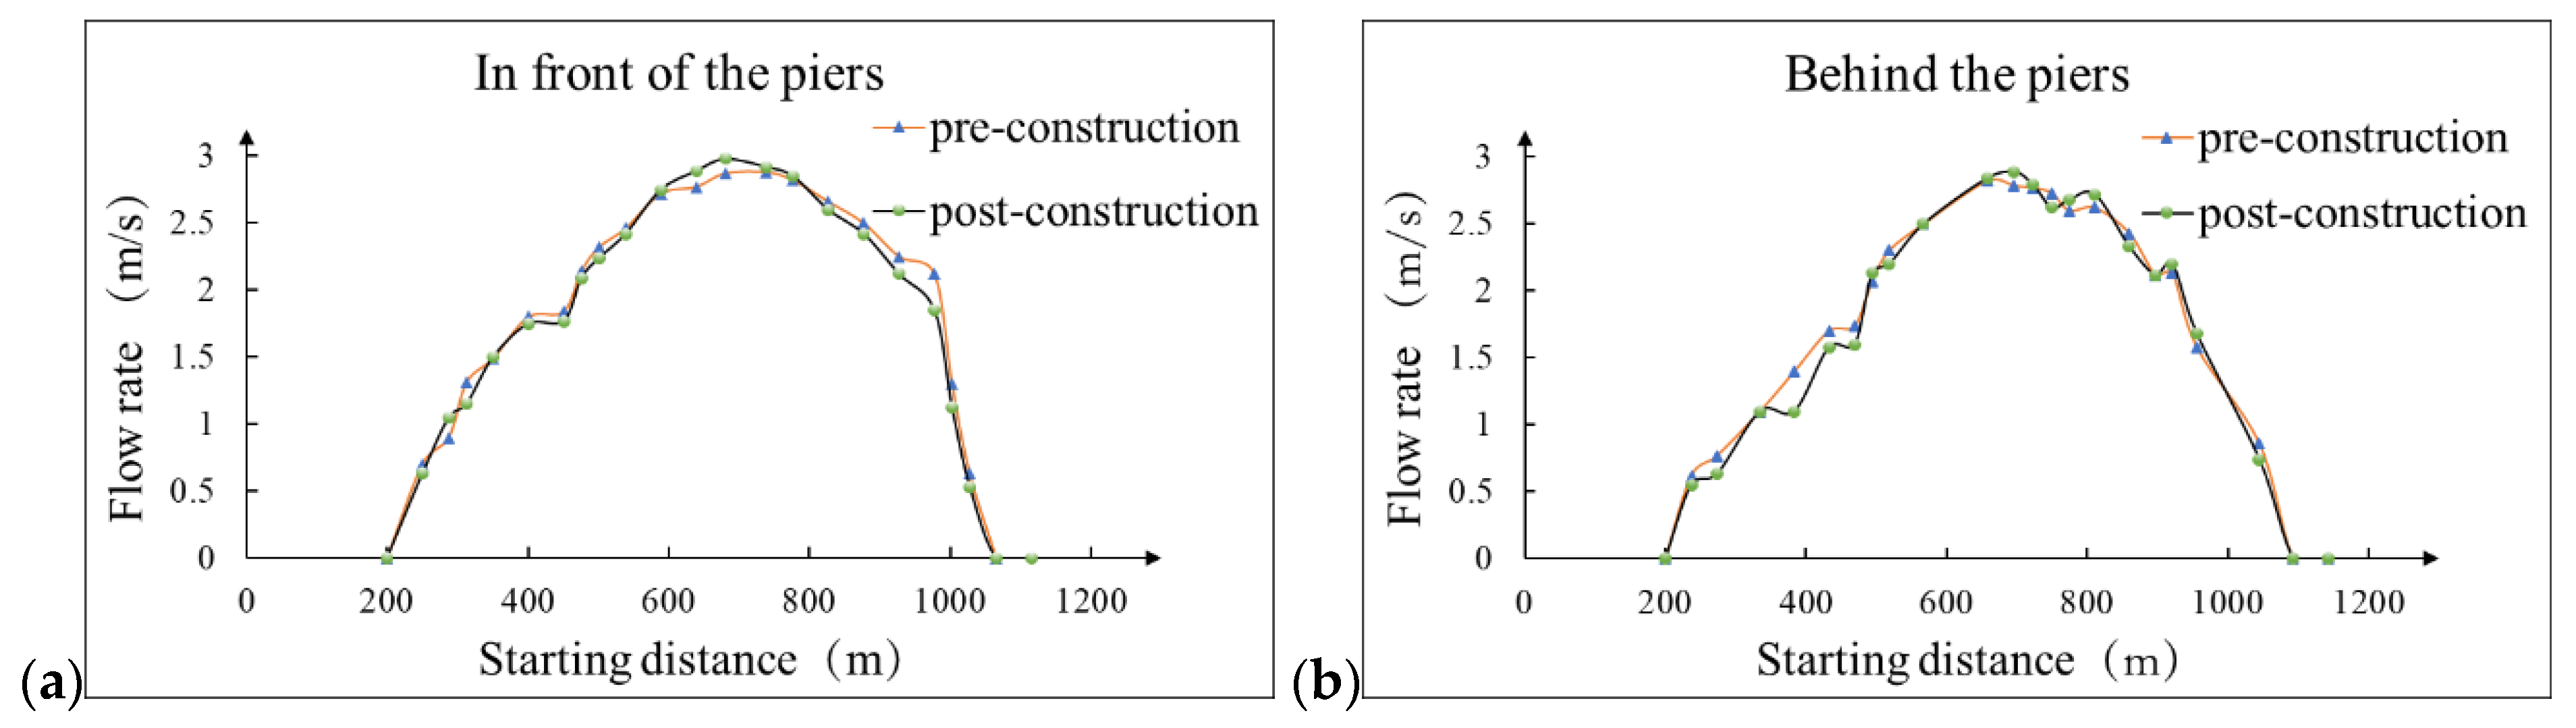
Characteristics of flow velocity changes near the bridge location after a parallel construction of bridges: The flow velocity in the cross-section before and after the bridge decreased to a certain extent compared to before the bridge, and the distribution pattern of flow velocity across the sections is consistent. In the main channel area, the flow velocity generally increases, with the maximum change in flow velocity being 0.25 m/s; in the floodplain area, the flow velocity fluctuates significantly, and under characteristic flood conditions, the change in flow velocity in areas with dense bridge piers is greater than in areas with sparse piers, with the maximum difference in flow velocity in the floodplain area reaching 0.3 m/s.
(6)
Impact characteristics of the flood processes on changes in the riverbank: Significant bank erosion has been observed in the left bank shoal area of the bridge layout, causing the main channel to widen. It is necessary to further strengthen the monitoring of the bank area to protect the resources of the shoal area. After the flooding process, the river channel tends to evolve into a U-shaped channel, and measures should be taken to strengthen the protection of the piers at the junction of the floodplain and the channel.
(7)
Based on the test results, it is advisable to install diversion facilities at the most affected piers (Piers 116 and P5 of the new bridge) to modify local flow dynamics, and thus, safeguard pier safety and mitigate localized backwater effects.

Author Contributions

Writing—original draft, B.C.; Writing—review and editing, Y.Z.; Project administration, S.W.; Funding acquisition, X.Z. All authors have read and agreed to the published version of the manuscript.

Funding

This research received no external funding.

Institutional Review Board Statement

Not applicable.

Informed Consent Statement

Not applicable.

Data Availability Statement

The original contributions presented in this study are included in the article. Further inquiries can be directed to the corresponding author.

Acknowledgments

We would like to thank all authors for their suggestions and assistance in the experimental design, and express our gratitude to the experimental team for their work.

Conflicts of Interest

Author Shuo Wang was employed by the company Shandong Yellow River Survey and Design Research Institute, and Xin Zhang was employed by the company Shandong Yellow River Conservancy Commission. The remaining authors declare that this research was conducted in the absence of any commercial or financial relationships that could be construed as potential conflicts of interest.

References

  1. Ye, D.S.; Zhang, M.; Fan, B.L. Principles and Practice of Bridge Pier Design, 1st ed.; Yellow River Water Resources Press: Zhengzhou, China, 2004; ISBN 9787806217320. [Google Scholar]
  2. Wu, S.Q.; Xue, W.Y.; Wu, X.F.; Zhou, J.; Dai, J.; Pang, C. Quantitative Study on Superposition Effect of Bridge Group Water Resistance in Urban Flood Channels. Yellow River 2019, 41, 96–102. [Google Scholar] [CrossRef]
  3. Xu, D.; Yang, H.T.; Wang, D.; Ji, C.; Bai, Y.; Ji, Z. Numerical Simulation Study on Backwater Characteristics of Oblique Bridge Piers in River Channels. J. Hydroelectr. Eng. 2018, 37, 55–63. [Google Scholar] [CrossRef]
  4. Yan, J.; Cai, X.H.; Lu, P.; Chen, Z.W. Model Test Study on Backwater of River-Crossing Orthogonal Bridge Piers. J. North China Univ. Water Resour. Electr. Power 2021, 42, 60–67. [Google Scholar] [CrossRef]
  5. Xie, J.H. River Simulation; Water Resources and Electric Power Press: Beijing, China, 1990; ISBN 9787120010386. [Google Scholar]
  6. Wang, G.Q. Research Progress on River Sediment. J. Sediment Res. 2007, 2, 64–81. [Google Scholar] [CrossRef]
  7. Luan, W. Numerical Simulation Analysis of the Impact of Bridge Construction on River Flow. Water Conserv. Sci. Technol. Econ. 2022, 10, 63–67. [Google Scholar] [CrossRef]
  8. Wang, Z.J. Numerical Simulation of Flow Field and Erosion-Deposition Characteristics of Bridge Group Section in Yixian Urban Area of Daling River. Master’s Thesis, Shenyang Agricultural University, Shenyang, China, 2016. Available online: https://kns.cnki.net/kcms2/article/abstract?v=upp0mjVwiKUK0Y08wr51Khdsni3o95h3CVBQ-fm0SA5z5R6jEUuz5ZCAAFc1W4TLtMQM_swA9u2wKU0OAsqhQ7vgL1n2LIqnEY_E6nJ9OTatxBYx3oY5kI3l00u9RmAwMQcRQ4XqIiMPvYIO_5q1J8pihOpjVxu6J0K6tadEsJArKjks6WE1AhXgjqFpy7xeQnoNDZ2XoeQ=&uniplatform=NZKPT&language=CHS (accessed on 1 June 2025).
  9. Wu, S.Q.; Guo, N.; Wu, X.F.; Zhou, X.H.; Zhao, Y.; Xue, W.Y. Research on the Impact of the Superimposed Water-Blocking Effect of Bridge Groups on the River Flow Capacity. Jiangsu Water Resour. 2019, 6, 1–6. [Google Scholar] [CrossRef]
  10. Li, Y.F.; Lü, X.Y.; Xu, H.; Wang, X.J.; Du, D.J. Generalized Study on the Cumulative Impact of Water-Crossing Bridge Groups on River Hydrodynamic Forces. J. Waterw. Harb. Eng. 2024, 3, 34–41. [Google Scholar] [CrossRef]
  11. Yu, H.; Shang, H.; Sun, W.M. Numerical Simulation Analysis of the Influence of Long-Span Bridge Piers on River Flow Regime. Shandong Water Resour. 2022, 51–52+55. [Google Scholar] [CrossRef]
  12. Chen, J.; Hou, L.T.; Liang, Y.J.; Zhao, Y.; Yu, M.H. Influence of Bridge Construction on Water Flow Movement in Different Characteristic Reaches of the Middle and Lower Yangtze River. Eng. J. Wuhan Univ. 2012, 45, 340–344+355. Available online: https://kns.cnki.net/kcms2/article/abstract?v=TD_mLQSGK6s312hiVJyuTeGBgyDn32A4hKqY19wuDzg2VXf6vzyhfOJNr977C19xxlb83isGtmaRw3JBF5Uh3GlXfypaCWbFxCjb0FJ3b5rhve5sPhMuyeijH4lZ8arN-QeYgLWiWr1RZLwhBv1-o-KMy_LEhWvxV9Mzmg1rJIqGRyiyL4b8ToSbxRPkE33C&uniplatform=NZKPT&language=CHS (accessed on 1 June 2025).
  13. Jiang, F. Impact of Pier Layout Forms on the Hydraulic Characteristics of Bend Flow. Master’s Thesis, Hebei University of Engineering, Handan, China, 2021. [Google Scholar] [CrossRef]
  14. Luo, W.G.; Lu, J.; Lai, H.; Fan, Y.Z. Research on Backwater in Front of Piers of Multiple Parallel Bridges with Short Distances. J. Sichuan Univ. (Eng. Sci. Ed.) 2015, 47, 6–13. [Google Scholar] [CrossRef]
  15. Wang, K.; Fu, X.D.; Wang, G.Q. Comparison of Calculation Methods for Bridge Pier Backwater. South–North Water Divers. Water Sci. Technol. 2006, 6, 53–55. [Google Scholar] [CrossRef]
  16. Biglari, B.; Sturm, T.W. Numerical Modeling of Flow around Bridge Abutments in Compound Channel. J. Hydraul. Eng. 1998, 124, 156–164. [Google Scholar] [CrossRef]
  17. Seckin, G.; Atabay, S. Experimental Backwater Analysis around Bridge Waterways. Can. J. Civ. Eng. 2005, 32, 1015–1029. [Google Scholar] [CrossRef]
  18. Richardson, J.E.; Panchang, V.G. Three-Dimensional Simulation of Scour-Inducing Flow at Bridge Piers. J. Hydraul. Eng. 1998, 124, 530–540. [Google Scholar] [CrossRef]
  19. Shafieifar, M.; Farzad, M.; Azizinamini, A. New Connection Detail to Connect Precast Column to Cap Beam using Ultra-High-Performance Concrete in Accelerated Bridge Construction Applications. Transp. Res. Rec. 2018, 2672, 207–220. [Google Scholar] [CrossRef]
  20. Biswas, S.S.; Pani, P. Changes in the hydrological regime and channel morphology as the effects of dams and bridges in the Barakar River, India. Environ. Earth Sci. 2021, 80, 1–20. [Google Scholar] [CrossRef]
  21. Biswas, M.; Raha, A.; Roy, S. Impacts of bridge constructions on channel dynamics and sediment aggradation: An integrated discussion, West Bengal, India. Geomatica 2024, 76, 100021. [Google Scholar] [CrossRef]
  22. Zheng, M.; Xue, L.J.; Lu, C.B. Comprehensive Flood Control Evaluation and Management Measures for the Super Large Bridge Project on Dagu River. Shandong Water Resour. 2022, 8, 81–82. [Google Scholar] [CrossRef]
  23. Zhang, Y.; Xing, C.X. Research on Sediment Selection and Verification Test of Movable Bed Model in Xiaolangdi Reservoir Dam Area. J. North China Univ. Water Resour. Electr. Power (Nat. Sci. Ed.) 2016, 37, 40–44. [Google Scholar] [CrossRef]
  24. Liu, X.; Liu, Y.Z. Study on the Applicability of Two Sediment Carrying Capacity Formulas in the Wandering Reach of the Yellow River. Water Resour. Power 2020, 38, 24–27. [Google Scholar] [CrossRef]
  25. Liu, Y.H.; Su, N.H. Analysis of the Influence of Bridge Construction on the River Regime of the Yellow River in Heze. Yellow River 2024, 46, 25–26. [Google Scholar]
  26. Yao, W.Y.; Wang, W.D. Study on the adjustment of river regime at the wandering reach of the lower Yellow River. Adv. Water Sci. 2006, 17, 624–630. [Google Scholar] [CrossRef]
  27. Wang, Y.; Ji, R.C.; Wang, G.H.; Fang, S.H. Relationship between Water Resistance and Backwater Characteristics of Skew Bridge Piers. Water Resour. Power 2025, 43, 80–83+20. [Google Scholar] [CrossRef]
  28. Xie, Z.Z.; He, J.; Han, Y.F. Preliminary Study on Water Resistance Effect of Different Pier Combinations. Jiangsu Water Resour. 2024, 8, 6–11. Available online: https://link.cnki.net/doi/10.16310/j.cnki.jssl.2024.08.009 (accessed on 1 June 2025).
  29. Ran, R.; Liu, Y.F. Analysis of the Influence of Reservoir Bank Slope Morphology on Its Stability Using the BSTEM Model. Ground Water 2011, 33, 162–165. [Google Scholar] [CrossRef]
Figure 1. Map of the Jinan section, showing bridge locations and the 11.2 km model extent.
Applsci 15 06581 g001
Figure 2. Bridge span arrangement for the reconstruction and expansion optio.
Applsci 15 06581 g002
Figure 3. Generalization of incoming water and sand from the model test. (a) Discharge generalization chart and (b) sediment concentration generalization chart.
Applsci 15 06581 g003
Figure 4. Model production process and layout rendering.
Applsci 15 06581 g004
Figure 5. Comparison of model test and prototype measured water level.
Applsci 15 06581 g005
Figure 6. Post-flood topographic overlay map (CS24).
Applsci 15 06581 g006
Figure 7. Modeled and bridge construction area overwater cross-section realities.
Applsci 15 06581 g007
Figure 8. Variations in water edges at different flow levels.
Applsci 15 06581 g008
Figure 9. Mainstream line changes at different flow levels.
Applsci 15 06581 g009
Figure 10. Variations in water level along the course of 600~5000 m3/s flow class conditions.
Applsci 15 06581 g010
Figure 11. Water level changes at the upstream face of bridge piers before and after the confluence of floods of different frequencies: (a) one-in-ten-year flood and (b) one-in-twenty-year flood.
Applsci 15 06581 g011
Figure 12. Water surface profile along the river course.
Applsci 15 06581 g012
Figure 13. Flow charts for the one-in-ten-year flood (Q = 9600 m3/s) (a) in front of the piers and (b) behind the piers.
Applsci 15 06581 g013
Figure 14. Flow charts for the one-in-twenty-year flood (Q = 11,000 m3/s) (a) in front of the piers and (b) behind the piers.
Applsci 15 06581 g014
Figure 15. Morphological map of the floodplain area downstream of the bridge (left bank between CS22 and CS23).
Applsci 15 06581 g015
Figure 16. Bridge site’s beach land zoning and characteristic section selection diagram.
Applsci 15 06581 g016
Figure 17. Cross-section topographic changes in the upstream and downstream floodplain areas of the bridge site: (a) cross-section 15, (b) cross-section 20, (c) cross-section 24, and (d) cross-section 30.
Applsci 15 06581 g017
Figure 18. Morphological map of the beach shoreline in Zone A of Model A.
Applsci 15 06581 g018
Table 1. Bridge-related parameters.
ItemNameConstruction TimeNumber of Spans Within the DikeDesign Standards
Discharge (m3/s)Water Level (m)
1Caojiaquan Yellow River Railway Bridge1981411,00039.64
2Jinan Yellow River Bridge of Jingtai Expressway19991211,60041.30
3Jing-Hu High-Speed Railway Yellow River Bridge2011411,00035.35
4Qilu Avenue north extension across the Yellow River BridgeUnder construction211,00038.66
Table 2. Summary of model design scales.
Scale RatioScale Value
Horizontal scale300
Vertical scale60
Velocity scale7.75
Roughness scale0.88
Discharge scale139,500
Flow motion time scale38.71
Settling velocity scale2.32
Suspended sediment diameter scale1.24
Sediment concentration scale2.47
Riverbed deformation time scale43.55
Disclaimer/Publisher’s Note: The statements, opinions and data contained in all publications are solely those of the individual author(s) and contributor(s) and not of MDPI and/or the editor(s). MDPI and/or the editor(s) disclaim responsibility for any injury to people or property resulting from any ideas, methods, instructions or products referred to in the content.

